Embed Size (px)
Citation preview
Effects of Moisture and Temperatureon the Photooxidation of Ethylene onTitaniaT I M O T H Y N . O B E E * A N D S T E V E O . H A Y
United Technologies Research Center, Silver Lane,East Hartford, Connecticut 06108
The effect of temperature, water vapor concentration, andethylene concentration on the photooxidation of ethyleneon titania was investigated. Ultraviolet radiation from ablack-light lamp together with a glass-plate reactor wereused to develop intrinsic oxidation rates. Ethylene oxida-tion rates decreased significantly as the water vaporconcentration was increased from 1000 ppmv for thethree temperatures (2, 27, and 48 °C) investigated. Theinfluence of water vapor on the reaction rate derived fromthe low adsorption of ethylene due to its low adsorptionaffinity relative to water. Over the range of water vaporconcentration of 1000-25000 ppmv, ethylene oxidationrates increased as the temperature increased. An Arrheniusplot of the measured ethylene oxidation rates indicatedan apparent activation energy of 3.4 kcal/mol. A Langmuir-Hinshelwood expression displaying an explicit temperaturedependence was used to correlate the entire set of ratedata. Based on this correlation, an enthalpy of adsorptionfor ethylene of -2.6 kcal/mol was found.
IntroductionThe purification of air in residential and commercial buildings,commercial aircraft, and transportation vehicles is primarilyconcerned with gaseous, particulate, and microbial con-taminants (1, 2). Ultraviolet (UV)-irradiated titania is well-known to oxidize many of the volatile organic compounds(VOC) found in these enclosures to benign products (3-6).The bulk of published rate data have focused on contaminantconcentration dependencies and have seldom addressed theinfluence of water vapor and catalyst temperature. Thesuccessful adaptation of the titania photocatalytic processfor air purification requires first the development of a basicunderstanding of the interaction of the contaminant con-centration, water vapor concentration, and catalyst temper-ature. This study undertakes to provide the basis for thisunderstanding with ethylene.
Titania-promoted photooxidation of trace levels of gaseouscontaminants has been reported in a few studies (5-10). Thesestudies have shown that the oxidation process is stronglyinfluenced by contaminant (probe reactant) concentration(5-7, 10), water vapor concentration (5-7, 10), and tem-perature (8, 9, 11). A systematic study of the interaction ofcontaminant (probe reactant) concentration, water vaporconcentration, and photocatalyst temperature has not beenreported.
Competitive adsorption between water vapor and a probecontaminant can have a significant influence on the oxidationrate of the contaminant (5-7). This consequence of com-petitive adsorption arises when the oxidation rate is rate-
limited by the low adsorption of the contaminant due to itslow adsorption affinity relative to water (5-7). Water adsorbson a titania surface in a variety of ways (12), including bothphysical and chemical adsorption. It can be reasonablyassumed that it is the physisorbed water that plays animportant role in competitive adsorption. The chemicallyadsorbed water either removes surface sites from contentionfor adsorbed ethylene or creates sites for competitive physicaladsorption between water and ethylene. Water stronglyphysisorbs on the hydroxylated titania surface via hydrogenbonding to surface hydroxyl groups (12, 13). The oxidationof ethylene, which is nonpolar and would therefore weaklyphysisorb on the polar titania surface, should exhibit a strongdependence on water vapor. Ethylene offers a measurableoxidation rate, is safe to handle, is the primary contaminantin the storage and transport of horticultural commodities (2),and is the parent compound of important environmentalcontaminants (e.g., trichloroethylene). For these reasons,ethylene was selected as the probe reactant.
The isothermal rate data generated from the photooxi-dation on titania has, in several studies (5-7), been shownto correlate with a Langmuir-Hinshelwood (L-H) rateexpression. The temperature dependence is usually displayedin an Arrhenius plot, in which a rise, plateau, and fall regionshave been observed (4, 8, 9, 14). To include an explicittemperature dependence in a L-H expression, the enthalpyof adsorption of all important species would be required. Forthe photooxidation of ethylene, two important species areethylene and water. The enthalpy of adsorption of water ontitania is known (13), but it is not known for ethylene.
Fu et al. (11) investigated the effects of water (at concen-trations of 5 and 15000 ppmv) and temperature (30-110 °C)on the oxidation kinetics of ethylene (at 250 ppmv) on titania(sol-gel derived). The carbon balance indicated completemineralization to carbon dioxide. An apparent energy ofactivation of 3.3-3.8 kcal/mol was reported. A cylindricalpacked-bed reactor irradiated externally and axially by fourblack-light-blue UV lamps was used. The reactor was heatedsolely by the UV lamps and control of the temperature waseffected by varying the flow rate of the coolant (air) that passedover the reactor and UV lamps. A possible shortcoming ofthis study was that the effect of the temperature of the coolantgas on the output of the UV lamps was not mentioned andmay not have been taken into account. This effect can beconsiderable (15).
The purpose of this study was to probe the relative reactionrates for the disappearance of ethylene as a function ofethylene concentration, water vapor concentration, andtemperature over the range of these variables of interest inthe designated air-purification applications. The water vaporconcentration was varied steadily from 1000 to 25000 ppmvor near saturation for three temperature levels (2, 27, and 48°C). Intrinsic oxidation rates were determined for thedisappearance of ethylene for initial ethylene concentrationsranging between 6 and 300 ppmv.
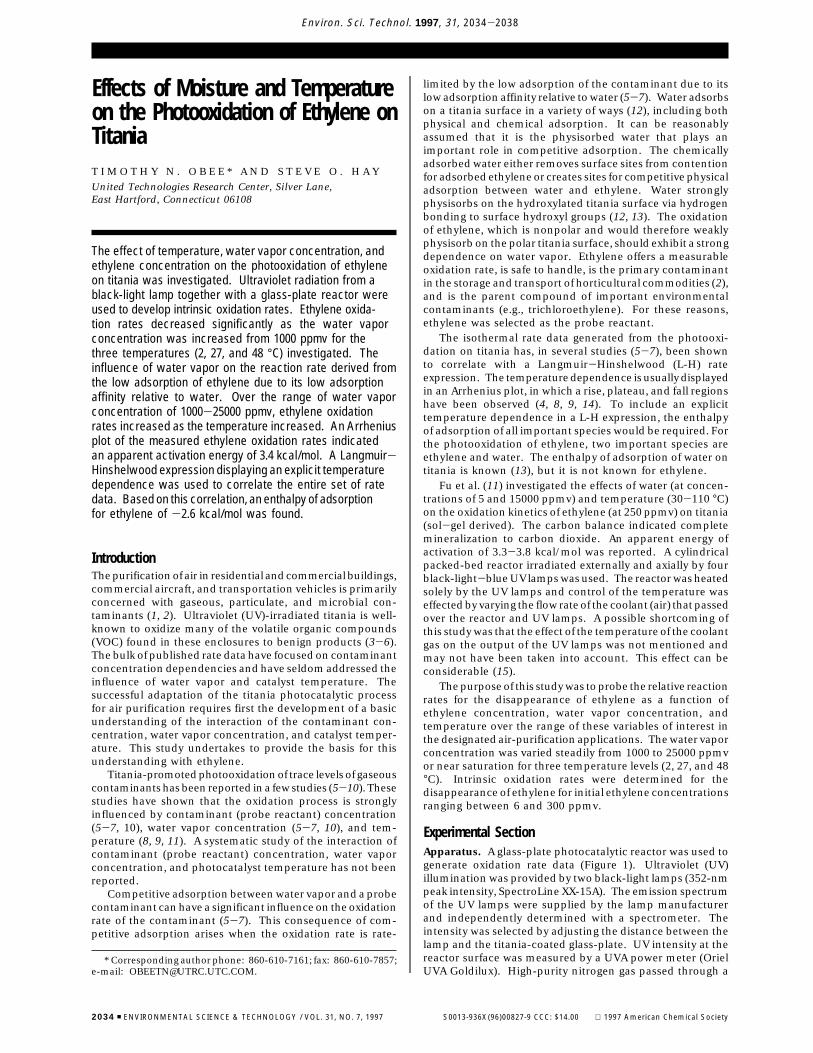
Experimental SectionApparatus. A glass-plate photocatalytic reactor was used togenerate oxidation rate data (Figure 1). Ultraviolet (UV)illumination was provided by two black-light lamps (352-nmpeak intensity, SpectroLine XX-15A). The emission spectrumof the UV lamps were supplied by the lamp manufacturerand independently determined with a spectrometer. Theintensity was selected by adjusting the distance between thelamp and the titania-coated glass-plate. UV intensity at thereactor surface was measured by a UVA power meter (OrielUVA Goldilux). High-purity nitrogen gas passed through a
* Corresponding author phone: 860-610-7161; fax: 860-610-7857;e-mail: [email protected].
Environ. Sci. Technol. 1997, 31, 2034-2038
2034 9 ENVIRONMENTAL SCIENCE & TECHNOLOGY / VOL. 31, NO. 7, 1997 S0013-936X(96)00827-9 CCC: $14.00 1997 American Chemical Society
water bubbler to set the desired water vapor level. Ethylenewas generated from a compressed gas cylinder. An oxygengas flow was combined with the nitrogen and ethylene flowsto produce the desired carrier gas mixture (15% oxygen, 85%nitrogen). Thermocouples were used to measure the tem-perature of the inlet and exit gas streams. The concentrationsof water vapor, carbon dioxide, carbon monoxide, andethylene were measured using a photoacoustic detector (Bruel& Kjær 1302).
To adjust and maintain the temperature of the reactor,the reactor was immersed into a temperature-controlled waterbath. The ethylene-contaminated gas stream was broughtto the temperature of the water bath prior to entering thereactor by passing through a serpentine copper tubular heatexchanger immersed in the water bath.
The titania-coated glass-plates were placed in a well (25mm by 46 cm) milled from an aluminum block and coveredby a quartz window (96% UVA transparent). Gaskets betweenthe quartz window and aluminum block created a flowpassage of 25 mm (width) by 2 mm (height) above the titania-coated glass-plates.
An opaque film of Degussa P-25 titania was deposited onflat 25 mm wide microscope glass slides using a wash-coatprocess. The wash-coat was 5% by weight of titania in distilledwater. A titania film was prepared by dipping the glass slidein the wash-coat several times, air-dried between dipping,and then oven-dried at 70 °C. This process was repeateduntil a 0.74 mg/cm2 film (per side) was achieved.
Ethylene-contaminated gas entered the reactor by firstpassing through a bed of glass mixing beads. Next, the gasflow entered a 25 mm by 2 mm entrance region of sufficientlength (76 mm) to produce a fully developed laminar velocityprofile. The gas flow then passed over the surface of thetitania-coated glass-plates. Finally, the gas passed througha 25 mm by 2 mm exit region (76 mm long) and the secondbed of glass beads before exiting the reactor.
Results and DiscussionFor the data generated by the glass-plate reactor, the oxidationrate is defined as
where r (µ-mol/cm2-h) is the oxidation rate; Xin (ppmv) andXout (ppmv) are the inlet and outlet ethylene concentrations,respectively; Q (L/min) is the volumetric flow rate; and A
(cm2) is the area of the titania-coated glass-plate. Thenumerical coefficient accounts for the units change.
All temperature and water vapor concentration depen-dence tests were performed at a 4 L/min flow rate. To checkfor gas-side mass transfer influence, the flow was doubled to8 L/min. The subsequent oxidation rate remained unchanged(within an uncertainty of 5%), indicating that the oxidationrates obtained at the 4 L/min flow were kinetically controlled(16).
The selection of the desired UV power flux was describedin the Experimental Section. The UV power flux on the titaniasurface was measured with the UVA meter at a fixed distancefrom the lamps. This distance corresponded to the positionof the titania-coated glass-plates. The measured flux wasthen corrected for the spectral response of the detector, thespectral output of the lamps, and the transmittance of thequartz window on the reactor. The corrected flux representedthe true UV power flux at the catalyst surface. The spectralresponse of the detector and the spectral output of the lampswere provided by the manufacturers and, in the case of theUV lamp, was independently confirmed with a spectrometer.The transmittance of the quartz window was constant overthe wavelength region of interest. A resultant true UV powerflux of 5.6 mW/cm2 was thus found and was used in allexperiments. A check of the UV power flux, which was madeat the start and end of the tests series using the method justdescribed, verified the constancy of the UV output.
Preliminary Reactivity Measurements. Under UV il-lumination, no change in ethylene level or evolution of carbondioxide or carbon monoxide was observed with uncoatedreactor elements. Ethylene is not expected to photodissociateunder UVA (17). In the dark, no change in ethylene level wasobserved with titania-coated reactor elements.
In a study of film loading by Jacoby (10), the oxidation rateof trichloroethylene increased with film loading up to a P-25titania loading of 0.5 mg/cm2 and remained constant for allhigher loadings. This finding suggests that the oxidation ratemaximizes at a film loading of 0.5 mg/cm2 and that additionalfilm loading adds nothing to the oxidation rate. Thisconclusion should not depend on the specific contaminantused (trichloroethylene) and, hence, can be applied in thepresent study. The titania film in the present study wasdetermined to be opaque to UVA by placing a coated platebetween the UV black-light lamps and the UVA power meter.This finding coupled with the conclusion drawn from Jacoby’s(10) finding suggests that the UV radiation is being maximallyutilized in the oxidation process.
The oxygen was maintained at a constant level of 15% byvolume for all rate measurements. Jacoby (10) and Dibbleand Raupp (7) have found that for the oxidation of trichlo-roethylene the rate was zero-order for oxygen levels above1%. Since the experiments performed in the present studyused contaminant levels that were comparable or lower thanthe levels used by Jacoby (10) and Dibble and Raupp (7), itis likely that the ethylene oxidation rates herein wereindependent of oxygen level for the oxygen levels above 1%.
In general, a carbon balance was found in all experimentswith carbon dioxide accounting for 100% (with a 5%uncertainty) of the carbon generated from the ethyleneoxidation. Carbon monoxide, which was included in theanalysis, was below the detection limit (0.15 ppmv), and thus,none was observed. These findings implied that no significantother reaction intermediates were desorbed to the gas stream.
Ethylene Oxidation Rates. In all experiments, the fol-lowing procedure was followed: First, the gas flows and watervapor levels were set. After the reactor inlet/outlet watervapor levels reached equilibrium, the ethylene was introduced.When the inlet/outlet ethylene concentrations reached steadystate and were of equal magnitude, the UV lamp wasilluminated. All reported measurements were taken after theconcentrations of all effluent species reached steady state.
FIGURE 1. Glass-plate photocatalytic reactor.
r ) 2.45(Xin - Xout)Q/A (1)
VOL. 31, NO. 7, 1997 / ENVIRONMENTAL SCIENCE & TECHNOLOGY 9 2035
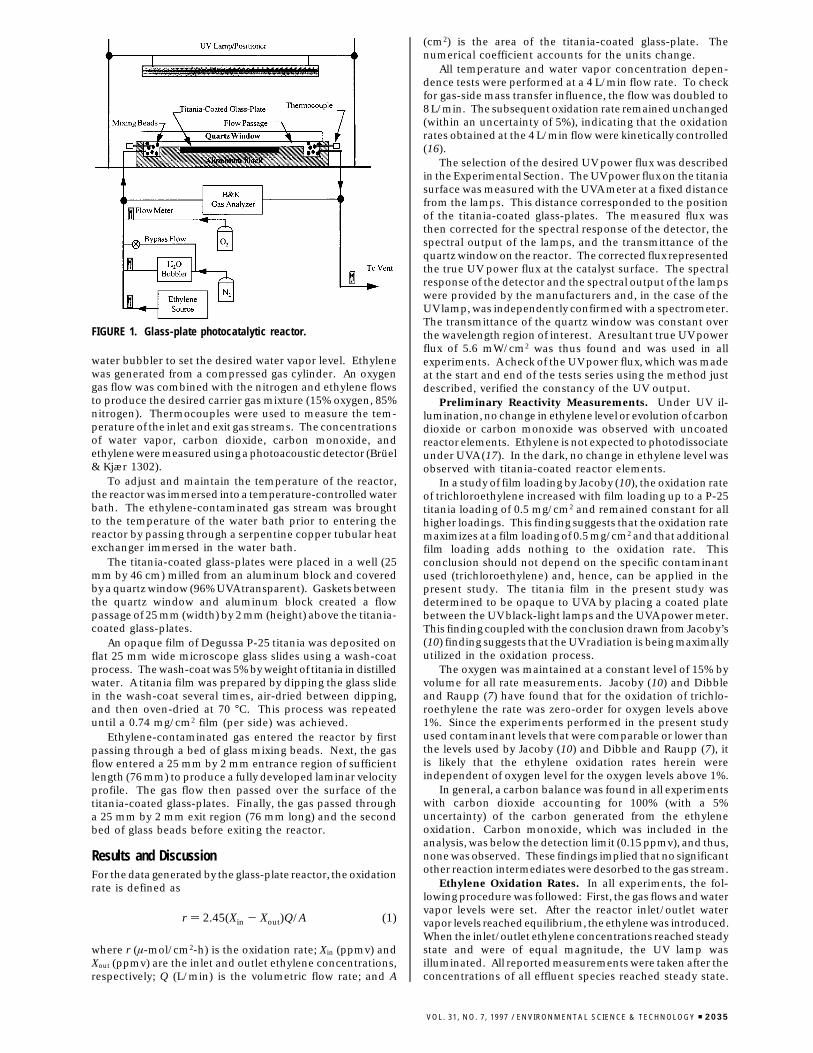
An example of the stability of the oxidation process is shownin Figure 2. Event 1 marked the moment the UV lamp wasilluminated. The outlet ethylene level rapidly decreased toa sustained constant level. Concomitant with decreasedethylene concentration was the appearance of CO2. Twicethe difference between the inlet and outlet ethylene con-centration was equal to the concentration of CO2, indicatinga carbon balance with CO2. After the UV lamp was switchedoff (event 2), the ethylene signal level rapidly rose to its initialdark concentration, while the CO2 signal disappeared. Thedisappearance of ethylene between events 1 and 2 isinterpreted as a photooxidation process.
The relative fractional change in the ethylene concentra-tion through the reactor was about 0.1 for all except three ofthe 36 reported oxidation rate determinations. For these threeinstances, the relative fractional change in the ethyleneconcentration was about 0.15. Thus, the reactor was operatedin a differential mode.
As exemplified in Figure 2, the oxidation rate wasdetermined only after the effluent ethylene concentrationreached a constant and sustained level under constant UVirradiation. A single titania film loading was used for alloxidation rate determinations. The determination of theoxidation rate dependencies on ethylene concentration, watervapor concentration, and reactor temperature involved manyseparate experiments. As a check for possible deactivationduring the generation of the entire set of oxidation ratedeterminations, previous experiments including the initialexperiments were repeated throughout the time framerequired for generation of the entire data set. In each case,within experimental error, the repeated experiment resultedin same oxidation rate previously found. Thus, deactivationof the titania coating was not observed, and the oxidationrate determinations were repeatable.
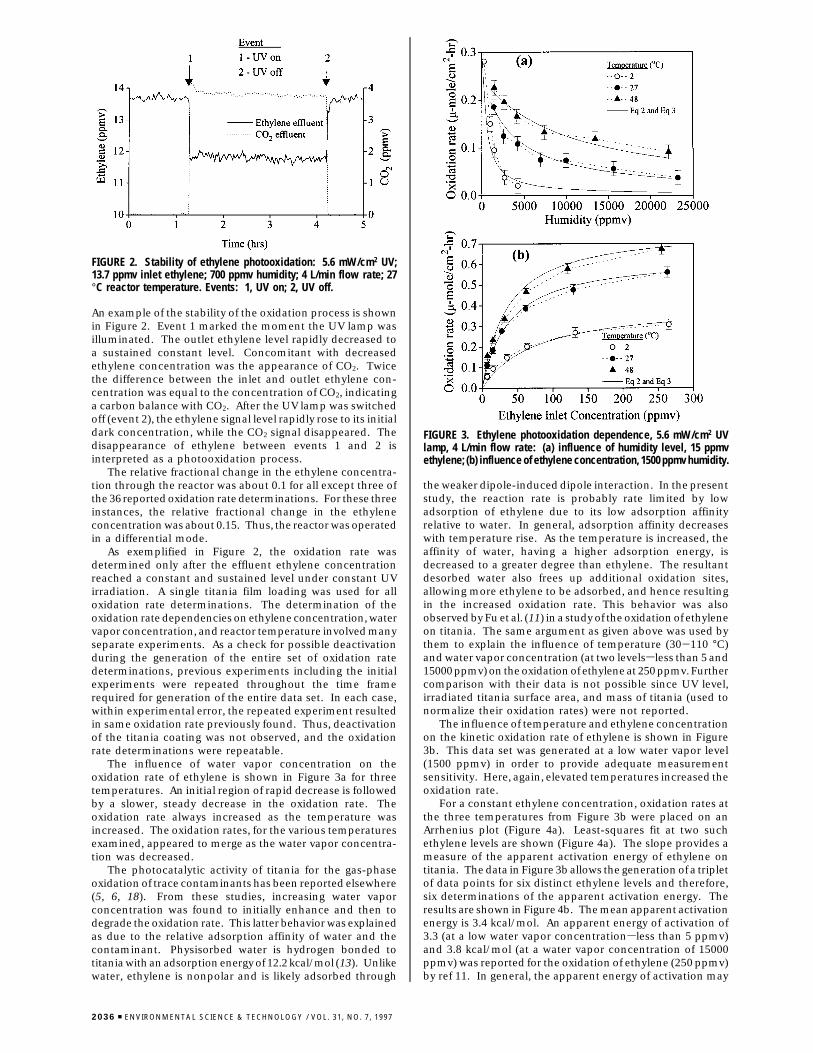
The influence of water vapor concentration on theoxidation rate of ethylene is shown in Figure 3a for threetemperatures. An initial region of rapid decrease is followedby a slower, steady decrease in the oxidation rate. Theoxidation rate always increased as the temperature wasincreased. The oxidation rates, for the various temperaturesexamined, appeared to merge as the water vapor concentra-tion was decreased.
The photocatalytic activity of titania for the gas-phaseoxidation of trace contaminants has been reported elsewhere(5, 6, 18). From these studies, increasing water vaporconcentration was found to initially enhance and then todegrade the oxidation rate. This latter behavior was explainedas due to the relative adsorption affinity of water and thecontaminant. Physisorbed water is hydrogen bonded totitania with an adsorption energy of 12.2 kcal/mol (13). Unlikewater, ethylene is nonpolar and is likely adsorbed through
the weaker dipole-induced dipole interaction. In the presentstudy, the reaction rate is probably rate limited by lowadsorption of ethylene due to its low adsorption affinityrelative to water. In general, adsorption affinity decreaseswith temperature rise. As the temperature is increased, theaffinity of water, having a higher adsorption energy, isdecreased to a greater degree than ethylene. The resultantdesorbed water also frees up additional oxidation sites,allowing more ethylene to be adsorbed, and hence resultingin the increased oxidation rate. This behavior was alsoobserved by Fu et al. (11) in a study of the oxidation of ethyleneon titania. The same argument as given above was used bythem to explain the influence of temperature (30-110 °C)and water vapor concentration (at two levelssless than 5 and15000 ppmv) on the oxidation of ethylene at 250 ppmv. Furthercomparison with their data is not possible since UV level,irradiated titania surface area, and mass of titania (used tonormalize their oxidation rates) were not reported.
The influence of temperature and ethylene concentrationon the kinetic oxidation rate of ethylene is shown in Figure3b. This data set was generated at a low water vapor level(1500 ppmv) in order to provide adequate measurementsensitivity. Here, again, elevated temperatures increased theoxidation rate.
For a constant ethylene concentration, oxidation rates atthe three temperatures from Figure 3b were placed on anArrhenius plot (Figure 4a). Least-squares fit at two suchethylene levels are shown (Figure 4a). The slope provides ameasure of the apparent activation energy of ethylene ontitania. The data in Figure 3b allows the generation of a tripletof data points for six distinct ethylene levels and therefore,six determinations of the apparent activation energy. Theresults are shown in Figure 4b. The mean apparent activationenergy is 3.4 kcal/mol. An apparent energy of activation of3.3 (at a low water vapor concentrationsless than 5 ppmv)and 3.8 kcal/mol (at a water vapor concentration of 15000ppmv) was reported for the oxidation of ethylene (250 ppmv)by ref 11. In general, the apparent energy of activation may
FIGURE 2. Stability of ethylene photooxidation: 5.6 mW/cm2 UV;13.7 ppmv inlet ethylene; 700 ppmv humidity; 4 L/min flow rate; 27°C reactor temperature. Events: 1, UV on; 2, UV off.
FIGURE 3. Ethylene photooxidation dependence, 5.6 mW/cm2 UVlamp, 4 L/min flow rate: (a) influence of humidity level, 15 ppmvethylene; (b) influence of ethylene concentration, 1500 ppmv humidity.
2036 9 ENVIRONMENTAL SCIENCE & TECHNOLOGY / VOL. 31, NO. 7, 1997
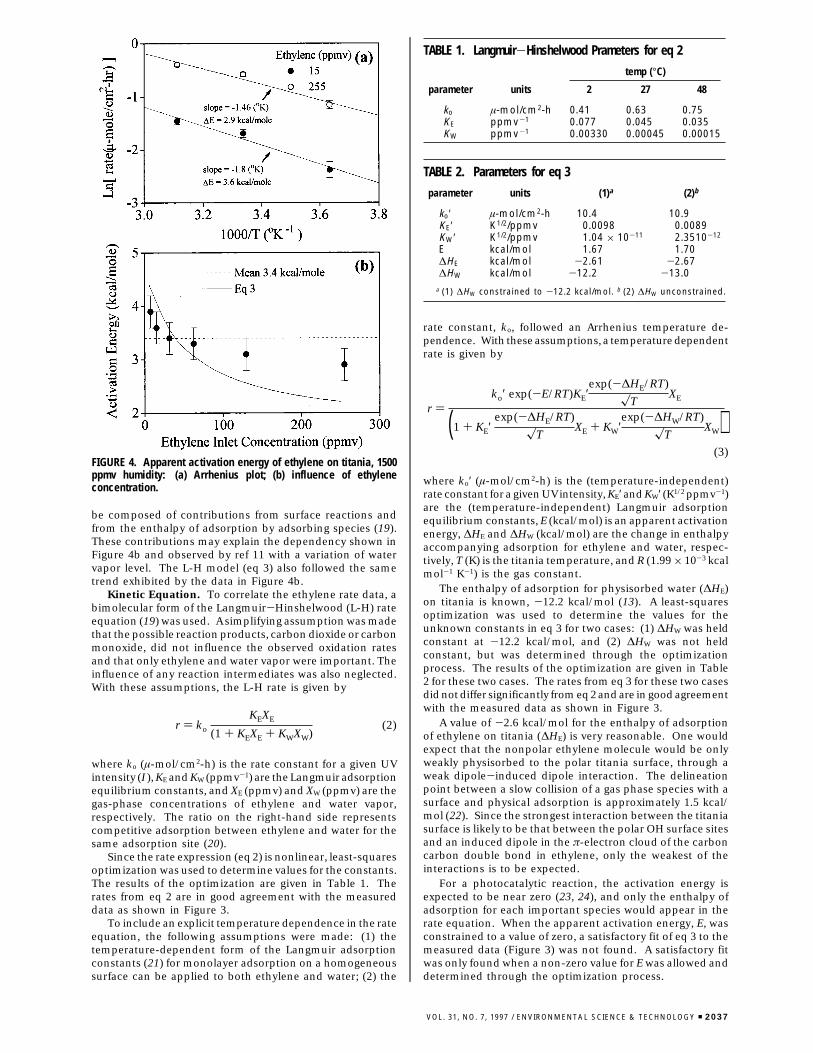
be composed of contributions from surface reactions andfrom the enthalpy of adsorption by adsorbing species (19).These contributions may explain the dependency shown inFigure 4b and observed by ref 11 with a variation of watervapor level. The L-H model (eq 3) also followed the sametrend exhibited by the data in Figure 4b.
Kinetic Equation. To correlate the ethylene rate data, abimolecular form of the Langmuir-Hinshelwood (L-H) rateequation (19) was used. A simplifying assumption was madethat the possible reaction products, carbon dioxide or carbonmonoxide, did not influence the observed oxidation ratesand that only ethylene and water vapor were important. Theinfluence of any reaction intermediates was also neglected.With these assumptions, the L-H rate is given by
where ko (µ-mol/cm2-h) is the rate constant for a given UVintensity (I ), KE and KW (ppmv-1) are the Langmuir adsorptionequilibrium constants, and XE (ppmv) and XW (ppmv) are thegas-phase concentrations of ethylene and water vapor,respectively. The ratio on the right-hand side representscompetitive adsorption between ethylene and water for thesame adsorption site (20).
Since the rate expression (eq 2) is nonlinear, least-squaresoptimization was used to determine values for the constants.The results of the optimization are given in Table 1. Therates from eq 2 are in good agreement with the measureddata as shown in Figure 3.
To include an explicit temperature dependence in the rateequation, the following assumptions were made: (1) thetemperature-dependent form of the Langmuir adsorptionconstants (21) for monolayer adsorption on a homogeneoussurface can be applied to both ethylene and water; (2) the
rate constant, ko, followed an Arrhenius temperature de-pendence. With these assumptions, a temperature dependentrate is given by
where ko′ (µ-mol/cm2-h) is the (temperature-independent)rate constant for a given UV intensity, KE′ and KW′ (K1/2 ppmv-1)are the (temperature-independent) Langmuir adsorptionequilibrium constants, E (kcal/mol) is an apparent activationenergy, ∆HE and ∆HW (kcal/mol) are the change in enthalpyaccompanying adsorption for ethylene and water, respec-tively, T (K) is the titania temperature, and R (1.99× 10⁻³ kcalmol-1 K-1) is the gas constant.
The enthalpy of adsorption for physisorbed water (∆HE)on titania is known, -12.2 kcal/mol (13). A least-squaresoptimization was used to determine the values for theunknown constants in eq 3 for two cases: (1) ∆HW was heldconstant at -12.2 kcal/mol, and (2) ∆HW was not heldconstant, but was determined through the optimizationprocess. The results of the optimization are given in Table2 for these two cases. The rates from eq 3 for these two casesdid not differ significantly from eq 2 and are in good agreementwith the measured data as shown in Figure 3.
A value of -2.6 kcal/mol for the enthalpy of adsorptionof ethylene on titania (∆HE) is very reasonable. One wouldexpect that the nonpolar ethylene molecule would be onlyweakly physisorbed to the polar titania surface, through aweak dipole-induced dipole interaction. The delineationpoint between a slow collision of a gas phase species with asurface and physical adsorption is approximately 1.5 kcal/mol (22). Since the strongest interaction between the titaniasurface is likely to be that between the polar OH surface sitesand an induced dipole in the π-electron cloud of the carboncarbon double bond in ethylene, only the weakest of theinteractions is to be expected.
For a photocatalytic reaction, the activation energy isexpected to be near zero (23, 24), and only the enthalpy ofadsorption for each important species would appear in therate equation. When the apparent activation energy, E, wasconstrained to a value of zero, a satisfactory fit of eq 3 to themeasured data (Figure 3) was not found. A satisfactory fitwas only found when a non-zero value for E was allowed anddetermined through the optimization process.
FIGURE 4. Apparent activation energy of ethylene on titania, 1500ppmv humidity: (a) Arrhenius plot; (b) influence of ethyleneconcentration.
r ) ko
KEXE
(1 + KEXE + KWXW)(2)
TABLE 1. Langmuir-Hinshelwood Prameters for eq 2
temp (°C)
parameter units 2 27 48
ko µ-mol/cm2-h 0.41 0.63 0.75KE ppmv-1 0.077 0.045 0.035KW ppmv-1 0.00330 0.00045 0.00015
TABLE 2. Parameters for eq 3
parameter units (1)a (2)b
ko′ µ-mol/cm2-h 10.4 10.9KE′ K1/2/ppmv 0.0098 0.0089KW′ K1/2/ppmv 1.04 × 10⁻¹¹ 2.3510-12
E kcal/mol 1.67 1.70∆HE kcal/mol -2.61 -2.67∆HW kcal/mol -12.2 -13.0
a (1) ∆HW constrained to -12.2 kcal/mol. b (2) ∆HW unconstrained.
r )ko′ exp(-E/RT)KE′
exp(-∆HE/RT)
xTXE
(1 + KE′exp(-∆HE/RT)
xTXE + KW′
exp(-∆HW/RT)
xTXW)
(3)
VOL. 31, NO. 7, 1997 / ENVIRONMENTAL SCIENCE & TECHNOLOGY 9 2037
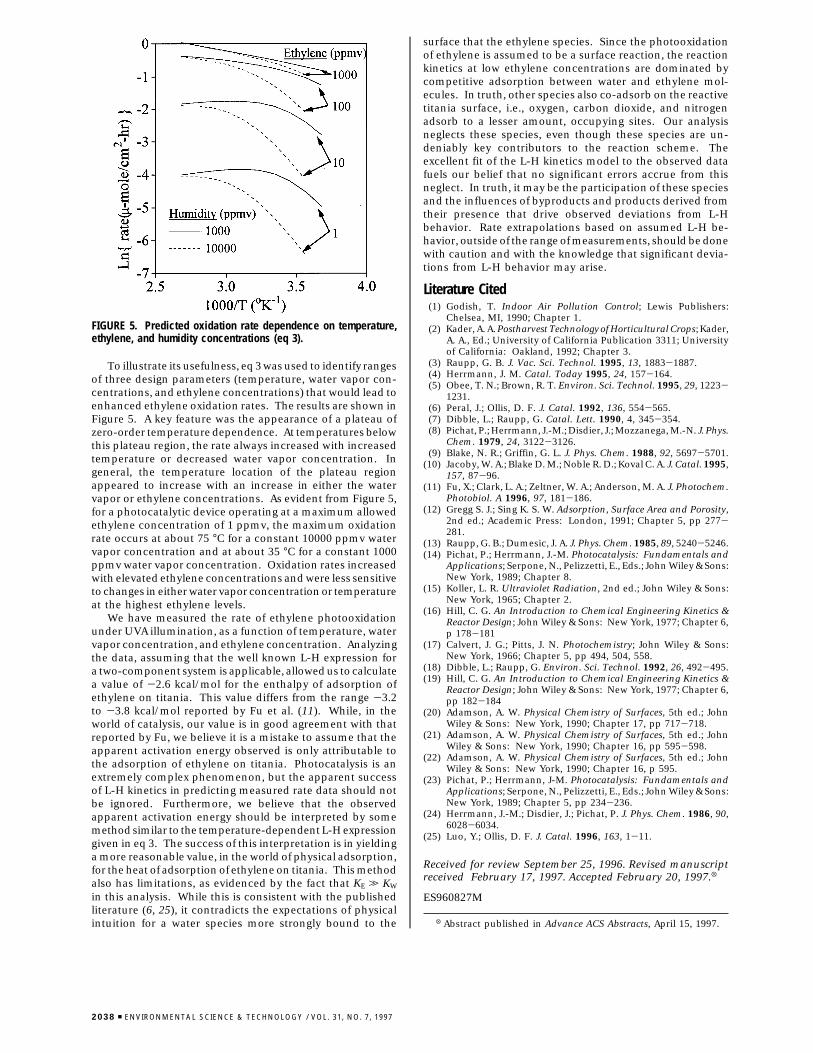
To illustrate its usefulness, eq 3 was used to identify rangesof three design parameters (temperature, water vapor con-centrations, and ethylene concentrations) that would lead toenhanced ethylene oxidation rates. The results are shown inFigure 5. A key feature was the appearance of a plateau ofzero-order temperature dependence. At temperatures belowthis plateau region, the rate always increased with increasedtemperature or decreased water vapor concentration. Ingeneral, the temperature location of the plateau regionappeared to increase with an increase in either the watervapor or ethylene concentrations. As evident from Figure 5,for a photocatalytic device operating at a maximum allowedethylene concentration of 1 ppmv, the maximum oxidationrate occurs at about 75 °C for a constant 10000 ppmv watervapor concentration and at about 35 °C for a constant 1000ppmv water vapor concentration. Oxidation rates increasedwith elevated ethylene concentrations and were less sensitiveto changes in either water vapor concentration or temperatureat the highest ethylene levels.
We have measured the rate of ethylene photooxidationunder UVA illumination, as a function of temperature, watervapor concentration, and ethylene concentration. Analyzingthe data, assuming that the well known L-H expression fora two-component system is applicable, allowed us to calculatea value of -2.6 kcal/mol for the enthalpy of adsorption ofethylene on titania. This value differs from the range -3.2to -3.8 kcal/mol reported by Fu et al. (11). While, in theworld of catalysis, our value is in good agreement with thatreported by Fu, we believe it is a mistake to assume that theapparent activation energy observed is only attributable tothe adsorption of ethylene on titania. Photocatalysis is anextremely complex phenomenon, but the apparent successof L-H kinetics in predicting measured rate data should notbe ignored. Furthermore, we believe that the observedapparent activation energy should be interpreted by somemethod similar to the temperature-dependent L-H expressiongiven in eq 3. The success of this interpretation is in yieldinga more reasonable value, in the world of physical adsorption,for the heat of adsorption of ethylene on titania. This methodalso has limitations, as evidenced by the fact that KE . KW
in this analysis. While this is consistent with the publishedliterature (6, 25), it contradicts the expectations of physicalintuition for a water species more strongly bound to the
surface that the ethylene species. Since the photooxidationof ethylene is assumed to be a surface reaction, the reactionkinetics at low ethylene concentrations are dominated bycompetitive adsorption between water and ethylene mol-ecules. In truth, other species also co-adsorb on the reactivetitania surface, i.e., oxygen, carbon dioxide, and nitrogenadsorb to a lesser amount, occupying sites. Our analysisneglects these species, even though these species are un-deniably key contributors to the reaction scheme. Theexcellent fit of the L-H kinetics model to the observed datafuels our belief that no significant errors accrue from thisneglect. In truth, it may be the participation of these speciesand the influences of byproducts and products derived fromtheir presence that drive observed deviations from L-Hbehavior. Rate extrapolations based on assumed L-H be-havior, outside of the range of measurements, should be donewith caution and with the knowledge that significant devia-tions from L-H behavior may arise.
Literature Cited(1) Godish, T. Indoor Air Pollution Control; Lewis Publishers:
Chelsea, MI, 1990; Chapter 1.(2) Kader, A. A. Postharvest Technology of Horticultural Crops; Kader,
A. A., Ed.; University of California Publication 3311; Universityof California: Oakland, 1992; Chapter 3.
(3) Raupp, G. B. J. Vac. Sci. Technol. 1995, 13, 1883-1887.(4) Herrmann, J. M. Catal. Today 1995, 24, 157-164.(5) Obee, T. N.; Brown, R. T. Environ. Sci. Technol. 1995, 29, 1223-
1231.(6) Peral, J.; Ollis, D. F. J. Catal. 1992, 136, 554-565.(7) Dibble, L.; Raupp, G. Catal. Lett. 1990, 4, 345-354.(8) Pichat, P.; Herrmann, J.-M.; Disdier, J.; Mozzanega, M.-N. J. Phys.
Chem. 1979, 24, 3122-3126.(9) Blake, N. R.; Griffin, G. L. J. Phys. Chem. 1988, 92, 5697-5701.
(10) Jacoby, W. A.; Blake D. M.; Noble R. D.; Koval C. A. J. Catal. 1995,157, 87-96.
(11) Fu, X.; Clark, L. A.; Zeltner, W. A.; Anderson, M. A. J. Photochem.Photobiol. A 1996, 97, 181-186.
(12) Gregg S. J.; Sing K. S. W. Adsorption, Surface Area and Porosity,2nd ed.; Academic Press: London, 1991; Chapter 5, pp 277-281.
(13) Raupp, G. B.; Dumesic, J. A. J. Phys. Chem. 1985, 89, 5240-5246.(14) Pichat, P.; Herrmann, J.-M. Photocatalysis: Fundamentals and
Applications; Serpone, N., Pelizzetti, E., Eds.; John Wiley & Sons:New York, 1989; Chapter 8.
(15) Koller, L. R. Ultraviolet Radiation, 2nd ed.; John Wiley & Sons:New York, 1965; Chapter 2.
(16) Hill, C. G. An Introduction to Chemical Engineering Kinetics &Reactor Design; John Wiley & Sons: New York, 1977; Chapter 6,p 178-181
(17) Calvert, J. G.; Pitts, J. N. Photochemistry; John Wiley & Sons:New York, 1966; Chapter 5, pp 494, 504, 558.
(18) Dibble, L.; Raupp, G. Environ. Sci. Technol. 1992, 26, 492-495.(19) Hill, C. G. An Introduction to Chemical Engineering Kinetics &
Reactor Design; John Wiley & Sons: New York, 1977; Chapter 6,pp 182-184
(20) Adamson, A. W. Physical Chemistry of Surfaces, 5th ed.; JohnWiley & Sons: New York, 1990; Chapter 17, pp 717-718.
(21) Adamson, A. W. Physical Chemistry of Surfaces, 5th ed.; JohnWiley & Sons: New York, 1990; Chapter 16, pp 595-598.
(22) Adamson, A. W. Physical Chemistry of Surfaces, 5th ed.; JohnWiley & Sons: New York, 1990; Chapter 16, p 595.
(23) Pichat, P.; Herrmann, J-M. Photocatalysis: Fundamentals andApplications; Serpone, N., Pelizzetti, E., Eds.; John Wiley & Sons:New York, 1989; Chapter 5, pp 234-236.
(24) Herrmann, J.-M.; Disdier, J.; Pichat, P. J. Phys. Chem. 1986, 90,6028-6034.
(25) Luo, Y.; Ollis, D. F. J. Catal. 1996, 163, 1-11.
Received for review September 25, 1996. Revised manuscriptreceived February 17, 1997. Accepted February 20, 1997.X
ES960827M
X Abstract published in Advance ACS Abstracts, April 15, 1997.
FIGURE 5. Predicted oxidation rate dependence on temperature,ethylene, and humidity concentrations (eq 3).
2038 9 ENVIRONMENTAL SCIENCE & TECHNOLOGY / VOL. 31, NO. 7, 1997