Embed Size (px)
Citation preview

EFFECTS OF MARKETING MIX ON SALES PERFORMANCE: A
CASE OF UNGA FEEDS LIMITED
BY
MICHAEL MWENDA GITUMA
UNITED STATES INTERNATIONAL UNIVERSITY AFRICA
FALL 2017

EFFECTS OF MARKETING MIX ON SALES PERFORMANCE: A
CASE OF UNGA GROUP LIMITED
BY
MICHAEL MWENDA GITUMA
A Research Project Submitted to the Chandaria School of Business in
Partial Fulfillment of the Requirements for the Degree of Masters in
Business Administration (MBA)
UNITED STATES INTERNATIONAL UNIVERSITY –AFRICA
FALL 2017

ii
STUDENTS DECLARATION
I, the undersigned, declare that this is my original work and has not been submitted to any
other college, institution or university other than the United States International
University in Nairobi for academic credit.
Signed: ________________________ Date: _____________________
Michael Mwenda Gituma (645829)
This project has been presented for examination with my approval as the appointed
supervisor.
Signed: ________________________ Date: _____________________
Dr. Peter Kiriri
Signed: _______________________ Date: ____________________
Dean, Chandaria School of Business

iii
COPYRIGHT
No part of this project may be produced or transmitted in any form or by any means,
electronic, magnetic tape or mechanical including photocopying, recording of any
information, storage and retrieval systems without prior written permission from the
author.
©2017

iv
ABSTRACT
The purpose of the study was to determine the effects of marketing mix on sales
performance. The research was guided by the following objectives: To evaluate the
relationship between product and sales performance at Unga group, to evaluate the
relationship between price and sales performance Unga group Ltd, to evaluate the
relationship between place and sales performance at Unga group Ltd, and to evaluate the
relationship between promotion and sales performance at Unga group Ltd.
Descriptive research was used in the study. Target population was 127 middle level staff
at Unga Group Limited. Stratified random sampling was used to select a sample size of
96. Structured questionnaires were used to collect data. Descriptive and inferential
statistics was used to analyze data. Tables and figures were used to present data.
Statistical Package for Social Sciences (SPSS) software was used to analyze the data.
The first objective sought to evaluate the relationship between product and sales
performance. It was also established that majority of the respondents agreed that product
quality has a positive impact on sales performance, brand awareness influences
organizational performance, packaging influence consumer-perceived product quality,
packaging is used to describe the product and its use, company’s brand image, and loyalty
has an influence on profitability However, respondent strongly disagreed that product
perceived quality does not influence purchase intention
The second objective aimed to evaluate the relationship between price and sales
performance. It was also established that majority of the respondents agreed that use of
pricing strategy has increased sales volume, price promotion has a significant impact on
perceived product quality, use of penetration pricing influences customer purchase and
value based pricing has a positive impact on profitability. However respondents disagreed
that that price promotion strategies does not affect sales performance and use of price
discount influences to a significant reduction in sales performance.
The third objective was set to evaluate relationship between place and sales performance.
It was established that majority of respondents agreed that distribution channels located in
urban areas generate more returns than those in rural areas, use of distribution channels
influences product availability, store design has a positive effect on consumer purchase
and sales volume, use of distribution channels influences sales and profit. Findings also

v
revealed that respondents disagreed that physical surrounding does not have any effect on
sales.
The fourth objective intended to evaluate relationship between promotion and sales
performance. Findings revealed that majority of the respondents agreed that advertising is
used to present product and ideas, sales promotions influences sales volume, e-marking
has a positive influence on performance, direct marketing increase profit. Findings also
revealed that respondents disagreed that Unga Ltd does not use personal selling and
publicity to promote products and does not offer price discounts and coupons.
The study concluded that product quality has a positive impact on sales performance,
brand awareness influences organizational performance, packaging is used to describe the
product, brand image, and loyalty influences company’s profitability and pricing strategy
increases sales volume. In addition, store design and use of attractive stimuli such as
music has an influence has a positive effect on consumer purchase and sales volume, and
geographic location has a significant influence on profitability, advertising, direct
marketing and increases sales volume.
The study recommended that the Unga Group should improve on their packaging design
hence increase product visibility and recognition. Improve on their branding strategy. Use
price promotion strategy such as uses price discounts, free samples, bonus packs to
increase customer’s intention to purchase their products hence increase in sales volume.
Unga Group should also use attractive stimuli’s in their work environment and also
during promotion hence influences customer’s perception and increase sales.

vi
ACKNOWLEDGEMENT
I take this opportunity to thank my supervisor professor Peter Kiriri for his invaluable
assistance while undertaking this project.
I do appreciate Lucy Gitau for her guidance in executing this research. It would not be the
same without her advice.
Finally, I do acknowledge my friends and family in supporting me and especially in
funding for the research.

vii
DEDICATION
I dedicate my project to my family for their invaluable assistance during the time when I
was conducting my research.

viii
TABLE OF CONTENTS
STUDENTS DECLARATION .............................................................................................. ii
COPYRIGHT ......................................................................................................................... iii
ABSTRACT ............................................................................................................................ iv
ACKNOWLEDGEMENT ..................................................................................................... vi
DEDICATION....................................................................................................................... vii
LIST OF TABLES .................................................................................................................. x
LIST OF FIGURES ............................................................................................................... xi
CHAPTER ONE ..................................................................................................................... 1
1.0 INTRODUCTION............................................................................................................. 1
1.1 Background of the Study .................................................................................................... 1
1.2 Statement of the Problem .................................................................................................... 4
1.3 General Objective ............................................................................................................... 6
1.4 Specific Objective ............................................................................................................... 6
1.5 Importance of the Study ...................................................................................................... 6
1.6 Scope of the Study .............................................................................................................. 7
1.7 Definition of Terms............................................................................................................. 7
1.8 Chapter Summary ............................................................................................................... 8
CHAPTER TWO .................................................................................................................... 9
2.0 LITERATURE REVIEW ................................................................................................ 9
2.1 INTRODUCTION............................................................................................................. 9
2.2 Relationship between Product and Sales Promotion .......................................................... 9
2.3 Relationship between Price and Sales Promotion ............................................................. 13
2.4 Relationship between Place and Sales Performance ......................................................... 18
2.5 Relationship between Promotion and Sales Performance ................................................ 22
2.6 Chapter Summary ............................................................................................................. 28
CHAPTER THREE ............................................................................................................. 29
3.0 RESEARCH METHODOLOGY ................................................................................. 29
3.1 INTRODUCTION........................................................................................................... 29
3.2 Research Design................................................................................................................ 29
3.3 Population and Sampling Design ...................................................................................... 29

ix
3.4 Data Collection Methods .................................................................................................. 31
3.5 Research Procedures ......................................................................................................... 32
3.6 Data Analysis Methods ..................................................................................................... 32
3.7 Chapter Summary ............................................................................................................. 32
CHAPTER FOUR ................................................................................................................. 34
4.0 RESULTS AND FINDINGS .......................................................................................... 34
4.1 INTRODUCTION........................................................................................................... 34
4.2 Demographic Information ................................................................................................. 34
4.3 Relationship between Product and Sales Performance ..................................................... 38
4.4 Relationship between Price and Sales Performance ......................................................... 39
4.5 Relationship between Place and Sales Performance ......................................................... 40
4.6 Relationship between Promotion and Sales Performance ................................................ 42
4.7 Effects of Sales Performance ............................................................................................ 43
4.8 Regression Analysis .......................................................................................................... 44
4.9 Chapter Summary ............................................................................................................. 46
CHAPTER FIVE .................................................................................................................. 47
5.0 DISCUSSION, CONCLUSION AND RECOMMENDATION .................................. 47
5.1 INTRODUCTION........................................................................................................... 47
5.2 Summary ........................................................................................................................... 47
5.3 Discussion ......................................................................................................................... 48
5.4 Conclusion ........................................................................................................................ 54
5.5 Recommendation .............................................................................................................. 55
REFERENCES ....................................................................................................................... 56
APPENDIX I: QUESTIONNAIRE ..................................................................................... 77

x
LIST OF TABLES
Table 3.1: Population Distribution ..................................................................................... 30
Table 3.2: Sample Size ...................................................................................................... 31
Table 4.1: Response Rate………………………………………………………………...31
Table 4.2: Relationship between Product and Sales Performance……………………….36
Table 4.3: Relationship between Price and Sales Performance ......................................... 40
Table 4.4: Relationship between Place and Sales Performance ........................................ 42
Table 4.5: Relationship between Promotion and Sales Performance ................................ 43
Table 4.6: Descriptive of Sales Perfromance ..................................................................... 44
Table 4.7:Model Summary ................................................................................................ 44
Table 4.8: ANOVAa ........................................................................................................... 45
Table 4.9: Coefficients of Strategy Implementation and Co-Factors ................................ 46

xi
LIST OF FIGURES
Figure 2.1: Servicescapes Model ....................................................................................... 21
Figure 4.1: Age of Respondents……………………………………………………….....35
Figure 4.2: Gender of Respondents ................................................................................... 35
Figure 4.3: Marital Status .................................................................................................. 36
Figure 4.4: Years in the Organization ................................................................................ 36
Figure 4.5: Level of Education .......................................................................................... 37
Figure 4.6: Department in the Organization ...................................................................... 37
.

1
CHAPTER ONE
1.0 INTRODUCTION
1.1 Background of the Study
The duty of marketers is to create marketing activity and gather all marketing program
which are integrated to create communication and convey value to customers. According
to Kotler and Armstrong (2012), marketing mix is the set of tactical marketing tools -
product, price, place, and promotion - that the firm blends to produce the response it
wants in the target market. Marketing tools or the marketing mix or often referred to as
the four P's (The Four Ps of the Marketing Mix).
Marketing is one of the key ways in which companies try to create awareness of
their products or services (Fuerderer, Herrmann and Wuebker, 2013). Marketing is
undertaken through the five key elements known of the marketing mix. With the ever-
rising significance of the financial sector, there has been a rise in pressure for efficient
marketing management and regulation of company’s financial services. According to
Green, Whitten and Inman (2014), it is vital to point out that marketing strategies are very
important in the long run performance of an organization. The marketing targets should
be specific, measurable, attainable, relevant and timely (SMART).
According to Mullins, Walker and Boyd (2012), the benefits of setting a clear marketing
target are as follows. First, it aims at giving the staff a clear sense of direction in terms of
where the business is going and what is expected of them. Secondly, it’s useful when
evaluating the success of the business. The third benefit is that it will ensure that all the
efforts and actions are focused on obtaining the set objectives and lastly, it will help
motivate the staff both leaders and their team and also help reward them when the project
is completed (Fuerderer et al, 2013).
Organizations are therefore required to set aside a significant portion of their budgets on
marketing to ensure that the company experiences an exponential growth in the sales.
However, it is important to note that most companies have failed to record an increase in
their sales revenue due to poor marketing strategies (Rodriguez, Peterson and
Vijaykumar, 2012). According to Palmer (2011), organizations use marketing
mix as part of their marketing strategy. According to Gronroos (2010), upgraded
the early version of marketing mix from the 4Ps to 7Ps. This included people, physical
appearance and process. Marketing mix is a mix of strategies or variables that managers

2
are able to control. Marketing mix consists of 4Ps which helps a manager come up with
strategies thus define the direction in which their marketing strategy will use in order to
achieve and create a competitive advantage (American Marketing Association, 2008).
Saguti (2015) asserts that marketing mix is a model used by organizations to create and
improve their marketing efforts. It is used to blend different factors in such a way that the
organization is able to achieve their objectives and meet customers need. According to
Palmer (2010), marketing mix is a conceptual framework that marketing managers use to
come up with strategies that can use to target their market and meet consumer’s needs.
Marketing mix can also be used to develop long term and short term goals. According to
Kiprotich (2012), marketing mix is a set of marketing tools that organizations blend to get
the response it wants from its target market. Marketing mix is grouped into four variables
known as the 4Ps. Product, price, place, and promotion.
According to Kotler (2015), marketing strategies; product, price, place and promotion are
strategies that organizations use to react to market and internal forces that will enable an
organization achieve their objective. Ghouri, Khan, Malik and Razzaq (2011) asserts that
organizations that have implemented effective marketing strategies are able to increase
their sales performance, market share and achieve a competitive advantage.
According to Owomoyela, Oyeniy and Ola (2013), marketing strategy is a strategy that
organizations use to provide their target customer with quality products, at affordable
price, offer effective promotional strategy and interact with their distribution outlets
hence creating demand for their products and increasing performance. Marketing mix is a
business tool that is used by organizations to achieve a competitive advantage. Marketing
mix refers to 4P’s that organizations use in their marketing process to achieve
organizational goals and meet customers’ needs and wants. It is a set of tactical marketing
tools that includes product, price, place and promotion that marketing managers are able
to control to achieve the required objective (Shankar and Chin, 2011).
Amirhosein and Zohre (2013) researched on the effect of marketing strategy on sales
performance: the moderating effects of internal and external environment. It was revealed
that marketing strategy has a positive and meaningful relationship on sales performance.
Haghighinasab, Sattari, Ebrahim and Roghanian (2013) conducted a research on
identification of innovative marketing strategies to increase the performance of SMEs in
Iran. It was established that innovative marketing strategies; product, price, place and

3
promotion influences sales performance. Ahmad, Al-Qarni, Alsharqi, Qalai and Kadi
(2013) conducted a research the impact of marketing mix strategy on hospitals
performance measured by patient satisfaction: an empirical investigation on Jeddah
private sector hospital senior manager’s perspective. It was revealed that promotion,
physical evidence, process has a significant influence on performance whereas pricing
and distribution strategies have an insignificant influence on performance.
Bintu (2017) researched on effect of marketing mix strategy on performance of small
scale businesses in Maiduguri Metroplitan, Boron State Nigeria. It was revealed that
marketing strategy; product, price, promotion and place have a significant influence on
business performance. Ebitu (2016) researched on marketing strategies and the
performance of small and medium enterprise in AkwaIbom State Nigeria. It was
established that product quality strategy and relationship marketing strategy has a positive
and significant influence on profitability and increase in market shares. The study
recommended that SME’s in Nigeria should invest more in product quality rather than
advertisement.
Adewale, Adesola and Oyewale (2013) conducted a research on impact of marketing
strategy on business performance in small and medium enterprises in Oluyle local
government, Ibadan, Nigeria. It was established that product, price place, packaging and
after sales services affects business performance. Owomoyela, Oyeniy and Ola (2013)
conducted a research on the impact of marketing mix elements on consumer loyalty: An
empirical study of Nigeria Breweries Plc. It was recommended that Nigeria Breweries
should produce superior products, charge competitive price, position appropriately,
promote widely and provide other distinctive functional benefits to consumers.
Ardjouman and Asma (2015) researched on marketing strategies affecting performance of
small and medium enterprise (SME’s) in Cote d’ivoire. It was established that marketing
management strategies has a significant influence on performance of SME’s. Dzis and
Ofosu (2014) conducted a research on marketing strategies and performance of SME’s in
Ghana. It was revealed that strategic marketing enables an organization position itself in
the industry, enhance and develop new products and increase performance. Langat (2016)
conducted a research on influence of product, price, promotion and place on enterprise
project performance: A case of Safaricom enterprise project, UasinGishu County, Kenya.

4
Findings revealed that of product, price, promotion and place influences enterprise project
performance.
Kariithi (2015) researched on the influence of marketing strategies on growth of small
and medium business in air travel agencies in Nairobi County in Kenya. It was
established that marketing strategies influenced growth and performance of SME’s who
operate air travel agencies. Obonyo (2013) researched on marketing strategies adopted by
supermarkets for a competitive edge in Kisii town Supermarkets Kenya. It was revealed
that marketing strategies influences organizational performance. Wawira (2016)
researched on marketing strategies and performance of large hotels in Nairobi County. It
was established that marketing strategies has a positively and significant influence on
performance of large hotels in Nairobi.
Magunga (2010) researched on effects of marketing strategies on the performance of
insurance companies in Kenya. It was revealed that marketing strategy has a positive
influence on performance of insurance companies. Aila (2013) researched on application
of the marketing concept and performance of supermarkets in Kisumu City, Kenya. It was
established that use of marketing concept influence performance of supermarkets in
Kisumu City. Ames (2016) researched on effect of marketing strategies on performance
of Small and Medium Enterprises in Kitengela Township, Kajiado County. It was
established that place, promotion and product have a positive and significant relationship
with business performance whereas, price marketing strategy have a positive but
insignificant relationship with business performance of SMEs.
1.2 Statement of the Problem
Marketing strategy has been an important aspect in objectives achievement in most
organizations. Organization’s decision making process on selection and implementation
of appropriate marketing strategy makes it possible for them to adhere to the objectives
easily; however most of them do not meet their objectives while others venture into
different strategies due to the competition in the market (Renart, 2007).Companies are
therefore evaluating their retail services with an aim of coming up with more focused
strategies that help them meet their unit and companywide objectives. They are working
towards developing coherent strategies on how to differentiate and add value to the
customers.

5
Keramati, Ardalan and Ashtiani (2012) investigated the relationship between marketing
mix and sales performance in the context of the Iranian Steel private firms. The study
revealed that there was a link between marketing mix and sales performance. Bintu
(2017) researched on effects of Marketing Mix Strategy on Performance of Small Scale
Businesses in Maiduguri Metropolitan, Borno State Nigeria. Oktaviyanti, Masyhuri and
Mulyo (2015) researched on analysis of marketing mix and sales performance of
“industrihilirtehwalini” product. Saguti (2015) researched on the effect of marketing mix
(4Ps) on sales performance of Tigo Telecommunication Company. Findings reveled that
marketing mix affects sales promotion.
Kiprotich (2012) conducted a research on effects of 4ps marketing mix on sales
performance of automotive fuels of selected service stations in Nakuru Town. Muthengi
(2015) carried out a research on the effects of marketing strategies on sales performance
of commercial banks in Kenya and found out that marketing mix enhances sales
performance. Kiprotich (2012) carried out a research on effects of marketing mix on sales
performance of automotive fuels of selected services stations in Nakuru Town and found
out that marketing mix enhances sales performance. Munyole (2015) carried out a
research on marketing strategies adopted by veterinary pharmaceutical firms in Kenya to
enhance performance and he found out that marketing strategies improve performance.
Muthengi (2015) conducted a research on the effects of marketing strategies on sales of
Commercial Banks in Kenya. Muchiri (2016) conducted a study on the effectiveness of
marketing mix strategies on performance of Kenol Kobil Limited. The study recommends
that Kenol Kobil should put more emphasis on the marketing mix strategies they use
hence influencing sales performance.
Muchohi (2015) conducted a study on marketing mix strategies adopted by tennis
affiliated organizations to enhance competiveness. The results revealed that there is a
strong positive relationship between marketing mix strategies and competiveness.
However, it is evident that the study did not focus on marketing strategies adopted by
petroleum companies in Kenya. Obonyo (2013) evaluated marketing mix strategies
adopted for competitiveness by supermarkets in Kisii Town. The study established that
price management rarely attracts customers. However, the study fails to determine the
proportional level each strategy needs to be employed to maximize the performance. A lot
of studies have been done in other industries to find out the effects of marketing mix on
sales performance but none have been done on Feeds manufacturing companies.

6
Therefore the study seeks to address this knowledge gap by focusing on effects of
marketing mix on sales performance at Unga feeds.
1.3 General Objective
The general objective of the study was to investigate the relationship between marketing
mix and sales performance.
1.4 Specific Objective
1.4.1 To evaluate the relationship between product and sales performance at Unga group.
1.4.2 To evaluate the relationship between price and sales performance at Unga group.
1.4.3 To evaluate the relationship between place and sales performance at Unga group.
1.4.4 To evaluate the relationship between promotion and sales performance at Unga
group.
1.5 Importance of the Study
1.51. Organizations
Since this research is conclusive, organizations can use the findings to draw important
inferences and information which the marketing team can use to improve sales
performance. The inferences drawn from the research can be used to conduct the overall
analysis of the company’s strengths, how to improve them against their competitors and
as well improve on their weaknesses. Through this research the company will be able to
identify the best marketing strategies to use.
1.5.2 Researchers
Future researchers who will be researching on a similar or related topic will benefit from
the findings by borrowing a leaf in form of related literatures. The study will also help
build on the researcher’s knowledge and understanding of the variables and gain more
skills of conducting research.
1.5.3 Public
The study will be of importance for people who might become future managers, leaders
and entrepreneurs. This research will enable marketing managers and entrepreneurs to
gain knowledge on marketing strategies and identify the most appropriate one for their
businesses and how to use the strategies to gain competitive edge.

7
1.6 Scope of the Study
The study was carried out at Unga Feeds Group Ltd in Nairobi. Target population was
127 middle level staff. The limitation of the study was time spent to distribute
questionnaires and employees unwillingness to respond and return the questionnaires.
Respondents were encouraged to ask questions they were not able to understand this
motivated a lot of respondents to answer and return the questionnaires. The study was
carried out from September to December 2017.
1.7 Definition of Terms
1.7.1 Marketing Mix
According to Kotler and Amstrong (2010) marketing mix is the set of marketing tools
used by an enterprise to achieve the objectives of the adapted marketing in the particular
marketing segment.
1.7.2 Sales Promotion
Sales performance is a direct inducement that offers an extra value or incentive for the
product to the sales force distributors or consumer with the primary objective of creating
an immediate sale (Zhang and Tang, 2010).
1.7.3 Product
Product is anything that can be offered to a market for attention, acquisition, use, or
consumption hence satisfying customers want or need (Kotler and Armstrong, 2013).
1.7.4 Price
According to Kotler and Armstrong (2008) price is the sum of all the values that
customers give up to gain to the benefits of a product or service.
1.7.5 Place
Place is the process where organizations decide where to locate their store and how many
stores to have at the convenience of the shoppers (Kanoga, 2016)

8
1.7.6 Promotion
According to Armstrong (2008), promotion is all activities undertaken to communicate
and promote products or services to the target market.
1.8 Chapter Summary
This chapter gives the background of information, statement of problem, general and
specific objectives, importance of the study to management and the researcher, the scope
of the study and definition of terms. Chapter two discussed literature review based on
research objectives. Chapter four discussed results and findings while chapter five
covered discussion conclusion and recommendation.

9
CHAPTER TWO
2.0 LITERATURE REVIEW
2.1 INTRODUCTION
This chapter presents literature review in line with the research objectives. The first
section discusses the relationship between product and sales performance. The second
section discussed relationship between price and sales performance whereas the third
section covers the relationship between place and sales performance and the fourth
section discusses the relationship between promotion and sales performance.
2.2 Relationship between Product and Sales Promotion
Kotler and Armstrong (2013) noted that product is anything that can be offered to a
market for attention, acquisition, use, or consumption hence satisfying customers want or
need. Ferrell (2005) assert that product is a marketing mix strategy in which organizations
offers consumers symbolic and experiential attributes to differentiate products from
competitors. Gbolagade, Adesol and Oyewale (2013) researched on impact of marketing
strategy on business performance a study of selected small and medium enterprises
(SME’s) in Oluyole local government, ibadan, Nigeria. It was established that there was a
significant influence between product and business performance. Owomoyela, Oyeniyi
and Ola, (2013) researched on the impact of marketing mix elements on consumer loyalty
findings revealed that product has an influence on customer loyalty hence increase in
performance.
2.2.1 Perceived Product Quality
Perceived product quality is defined as an assessment that customers have about the
product excellence (Poh, Ghazali, and Mohayidin, 2011). Flynn, Schroeder and
Sakakibara (1994) noted that quality is an important element in the design and
manufacture of products which are considered superior to those of competitors.
According to Hitt and Hoskisson (1997), customers increasingly expect products to be of
high quality. Hence, product quality is often considered to contribute to the development
of a firm’s competitive advantage. Product quality is extent to which a product succeeds
to meet the needs of its customer (Lemmink and Kasper, 1994). Perceived quality is “the
consumer’s judgment about the superiority or excellence of a product” (Zeithaml, 1988,
p.4). Thuy and Chi (2015) state that perceived quality refers to customer’s evaluation of a

10
product or a brand that meet an individual’s expectation”. Research has shown that
product perceived quality directly influences purchase intention (Rust and Oliver, 1994).
According to Feng, Terziovski and Samson (2007), product quality, efficiency and
business results affects firm performance measures. Mahmood and Fatimah Hajjat (2014)
researched on the effect of product quality on business performance in some Arab
Companies. A model was developed to illustrate the product development stages from
conception to distribution. The research analyzed data using structural equation modeling
techniques. Findings revealed that product extrinsic value influences external
performance and product intrinsic value influences internal performance. Nirusa (2017)
conducted a research on the mediating role of perceived product quality. Survey was used
to 105 firms. It was revealed that was a relationship between organizational capability and
perceived product quality.
2.2.2 Product Packaging
According to Ampuero and Vila (2006), product package contains visual and sensual
attributes which communicate to consume. A product package is a container that has a
direct contact with the product, protects, preserves and identifies the product. Good
package design requires knowledge of materials, their properties, manufacturing methods
and conversion process (Sehrawet and Kundu, 2007). Package design not only increases
the visibility of the product it also helps in easy recognition of the product. It also
improvements in product packaging revitalize brands leading to increase in sales
(Immonen 2010 and Leong, 1998). Package designs has an effect on consumer belief
about the products and consumption beliefs leading to higher purchase decision and
increase in sales volume (Horsky and Honea, 2012).
According to Kotler (2000), product packaging is used to attract attention, describe the
product and clutter on retailer shelves hence motivate customers to purchase a product.
Silayoi and Speece (2007) suggested that packages should be exciting and safe and of
high quality. In addition, colors used on the package is perceived and associated with
quality attributes. Edward (2013) conducted a research on the influence of visual
packaging design on perceived food product quality, value, and brand preference. It was
established that attitudes toward visual packaging directly influence consumer-perceived
food product quality and brand preference.

11
Holmes and Paswan (2012) conducted a research on consumer reaction to new package
design. Based on previous research, it is suggested that a combination of product quality
and price influences customers purchase intention. Packaged goods that are priced low
receive less attention than products that are high priced. In addition, studies have also
suggested that customer attitude towards product package and quality influences their
purchase decision to buy products that have low prices (Holmes and Paswan, 2012).
Kamotho (2011) conducted a research on influence of packaging and labeling on
consumer perception of hair care products quality. The study used descriptive research
design. 60 hair dressers and 60 salon customers were sampled. It was concluded that icon,
symbols, font size and patterns, usage instructions, country of origin and information are
example of package label attributes that customers look for when buying a product. It was
recommended that hair care companies should put more emphasis on the product,
package appearance and colors they use on their package. Through this hair care
companies will be able to attract customer’s attention and influence purchase intention.
Rizwan, Vishnu, Raheem and Muhammad (2014) researched on impact of product
packaging on consumer’s buying behavior. Findings revealed that product packaging
influences consumer purchase decision. It was concluded that packaging elements such
as color, design of wrapper, packaging material are factors consumers consider before
purchasing a product. Saeed, Lodhi, Mukhtar, Hussain, Mahmood and Ahm (2013),
conducted a research on impact of labeling on customer buying behavior in Sahiwal,
Pakistan. Quantitative research was used. Data was collected through survey. The study
sampled 100 customers. It was established that product labeling influences consumer
buying behavior.
2.2.3 Branding
According to American Marketing Association’s (2010), brand is a name, term, sign,
symbol or design, or a combination of name, term, sign, symbol or design to differentiate
goods and services from competitors. Green et al (2014) state that organizations use
brands to tell who they are, how they want people or market to perceive them and how the
organization wants to be. Fransisca, Tan and Ruth (2012) noted that brand is a name, a
word, letter or a combination of all of these terms that are used to differentiate
organizational products from its competitors. According to Yi Zhang (2015), brand
identity influences band equity thus creating customer appeal and visual image about a

12
particular brand. Adeleye (2003) state that a brand is a name attached to a product or
service.
Deborah (2016) conducted a research on the effect of branding on organizational
performance in the retailing of pharmaceutical products, on the mediating role of
customers. It was revealed that findings, branding had a positive significant effect on
organizational performance. Kim, Kim and Jeong (2003) conducted a research on the
effect of consumer-based brand equity on firm’s financial performance. It was established
that brand loyalty, awareness and image has a significant positive effect on profitability
whereas brand quality has a negative effect on financial performance.
Musibau, Choi and Oluyinka (2014) researched on the impact of sales promotion and
product branding on company performance. The study sampled 60 employees. Data was
collected using survey questionnaires. Data was analyzed using chi-square (x2). It was
revealed that product branding and sales promotion affect organizational growth. Kalemb
(2015) researched on Contribution of branding in enhancing performance of tourism
sector in Rwanda. Findings revealed that there was a relationship between branding and
tourism performance in Rwanda. Wed (2016) conducted a research on the impact of
brand identity on customer loyalty and sales performance in local companies it was
revealed that brand identity has an influence on the customers’ loyalty and the sales
performance.
Njawa (2015) researched on the effects of advertising on organizational performance of
TIGO Telecommunication Network Junior. Population of the study was employees who
work at Tigo employees. Questionnaires, interviews, and documentary review were used
to collected data. It was established that brand awareness, brand loyalty, and brand equity
has a significance influence on organizational performance. Omotayo and Adegbuyi
(2015) conducted a research on strategic roles of branding on organization sales
performance. The study used a survey method. Structured questionnaires were used to
collect data from150 respondents. Findings revealed that branding has a significant
influence on sales performance.
Christian, Martin and Jens (2010) conducted a research on brand awareness in business
markets: When is it related to firm performance. Findings revealed that brand awareness
significantly influences market performance. Wang, Lee and Wu and Chang, (2012)
researched on the influence of knowledge management and brand equity on marketing

13
performance. Convenience sampling was used to select sample of 291 respondents.
Findings revealed that brand equity has a positive and significant influence eon marketing
performance.
Koh, Lee and Boo (2009) conducted a research on impact of brand recognition and brand
reputation on firm performance at U.S. based multinational restaurant companies. It was
established that brand reputation had a positive influence on a firm’s value performance.
However, it was also revealed that brand reputation had no significant influence on the
firm’s performance. Park, Pol and Eisingerich (2012) conducted a research on the role of
brand logos in firm performance. It was revealed that brand logo significant influence
firm’s performance.
Tsai, Cheung and Lo, (2010) conducted a research on an exploratory study of the
relationship between customer-based casino brand equity and firm performance. It was
revealed that customer-based casino brand equity has an impact on firm performance.
However, a study done by Mei (2013) on brand identity, brand equity, and Performance
revealed that brand equity; brand loyalty, perceived quality, and brand awareness does not
have a significantly effect on firm’s performance.
2.3 Relationship between Price and Sales Promotion
According to Kotler (2007), price is a cost of producing, delivering and promoting the
product charged. According to Jain (2004), pricing is the process where an organization
determines what it will receive in exchange for its product after factoring in
manufacturing costs, market place, competition, market condition and quality of product.
According to Kotler (2004), companies use pricing strategies such as; premium pricing,
value pricing, penetration pricing, cost plus pricing, competitive pricing, price skimming,
going rate pricing, geographical pricing, segmented pricing, product mix pricing,
psychological pricing and discriminatory pricing. Odhiambo (2013) researched on effect
of pricing as a competitive strategy on sales performance of selected pharmaceutical
companies. It was established that pricing strategy and decision has a significant effect on
sales performance. Louter, Ouwerkerk, and Bakker (1991) in his research it was revealed
that there was a positive relationship between pricing strategy and firm performance.

14
2.3.1 Value based pricing
Value-based pricing is the process of setting price based on customer perceived value of a
product or service (Nagle and Singlton, 2011). According to research done by Hünerberg
and Hüttmann (2003); Piercy, Cravens and Lane (2010), findings indicated that value
based pricing is the most profitable pricing strategy. Nagle and Holden (2002) state that
value pricing is the price of a customer’s next best alternative plus the value of
differentiating features. Value based pricing is product driven and price is based on
perceived product value (Schäder, 2006). Value based pricing is set by considering the
value of a product or service has on its target customers (Hinterhuber, 2008). Value based
pricing is setting a price in relation to an offering’s value (Anderson and Narus, 2004)
According to Deonir, Gabriel, Evandro and Fabia (2017), corporate profitability
conducted a research on pricing strategies and levels and their impact on corporate
profitability. It was revealed that value-based pricing has a positive effect on profitability
of an organization. Liozu (2013) conducted a research on pricing orientation, pricing
capabilities, and firm performance. The study surveyed 1,812 professionals who are
involved in pricing to measure the influence of pricing approach on firm performance. It
was established that there was a positive relationship between value-based pricing and
firm performance. Andreas (2008) conducted a research on customer value-based pricing
strategies and why companies resist it by adopting a two-stage empirical approach. It was
revealed that deficits in value assessment; deficits in value communication; lack of
effective market segmentation; deficits in sales force management; and lack of support
from senior management are obstacles that hinder implementation of value-based pricing
strategy.
Ingenbleek, Debruyne, Frambach and Verhallen (2003) conducted a research on
successful new product pricing practices The study conducted an empirical survey of 77
marketing managers in two business‐to‐business industries (electronics and engineering)
in Belgium. It was revealed that value‐based pricing is positively correlated with new
product success. Nagle and Singleton (2011) surveyed 200 corporations on the impact of
pricing strategies on the corporations’ profitability. They found that companies, which
implemented sophisticated value-based pricing strategies, earn 31% higher operating
income than competitors basing pricing strategies on market share goals or target
margins.

15
Füreder, Maier, and Yaramova (2014) conducted a research on Value-based pricing in
Austrian medium-sized companies. It was revealed that use of value based pricing
enables a rim generate more returns and create a competitive advantage.
2.3.2 Penetration Pricing
According to Nagle (2006), penetration strategy is the process of charging a low price to
product or services hence penetrate the market. Vikas (2011) state that penetration pricing
is the process of setting a price at a lower price for new products or service hence
breaking even the technique can also be used by organizations to look for new market for
an existing product. Jim (2012) noted that penetration pricing is used to support the
launch of a new product, and when a product enters a market with relatively little
product differentiation and where demand is price elastic.
According Lamb, Hair and McDaniel (2004), penetration pricing is a technique of setting
a low price on a new product hence attracting customers to try company’s products and
services. Penetration price is setting low price for new products hence reaching a wider
mass market and acquiring more market share. Penetration pricing is used when price of
demanded product is at a level that will enable an organization increase sales volume
(Szymanski and Henard, 2001). According to Mukhweso (2003), in his research on
factors influencing tea pricing at the Mombasa tea auction. It was revealed that higher
sales volume leads to low unit costs and higher profits in the long run. Organizations
price their products at a lower price assuming that the market is price sensitive and that
many companies price their products higher to “skim” the market.
Sije and Oloko (2013) conducted a research on penetration pricing strategy and
performance of small and medium enterprises in Kenya. Stratified random sampling was
used to select employees from various SMEs. Questionnaires were used to collect
primary data. Descriptive and inferential statistics was used to analyze data. It was
established that there was a strong positive correlation between penetration pricing and
performance. Perminus and Wilson (2017) researched on effect of penetration pricing
strategy on the profitability of insurance firms in Kenya. Target population was 45
insurance companies. The study used data from 2008-2012. A sample of 900 employees
was used. Purposively sampling was used to sample 2 employees form each insurance
companies. Questionnaires were used to collect data. Descriptive and inferential statistics

16
was used to analyze data. It was established that there was a positive relationship between
penetration pricing and firm profitability.
Penetration pricing is used by firms to increase their market share or sales volume. Firms
also use penetration pricing to speed up product adoption (Schnabl and Mckinnon, 2006;
Oliver 2001). According to Harmon and Raffo (2007), organizations can use penetration
pricing as a competitive pricing strategy to increase sales and reach a wider market share.
Njomo and Margaret (2016) conducted a research on market penetration strategies and
organizational growth: a case of soft drink. Stratified random sampling was used. Simple
random sampling was used to select a sample of 160 respondents. Correlation was done
to determine the relationship between variables. It was established that penetration pricing
has a negative impact on organizational growth. Use of penetration pricing may lead to
increase in sales volume and market share. In addition, Penetration pricing strategy is also
used by organizations to promote complementary products (Njomo, 2016).
According to Matan (2016), organizations use penetration pricing strategy to price their
products or services lower than its normal price. Through this, an organization is able to
gain market acceptance, increase its market shares or discourage new competitors from
entering the market. Marn, Roegner and Zawada (2003), postulated that use of very low
price will make companies forego the potential revenues and give customers a perception
that the product is of low quality hence making it difficult for companies to increase price
of a product. In addition, products or services charged very low makes it difficult for
products to takeoff in the market (Golder and Tellis, 2004).
2.3.3 Price Discount
According to Mullin and Cummins (2008), price promotions include money-off coupons,
pence-off flashes, buy one get one free and extra fill packs. In addition, nowadays, price
sensitive customers are more aware of promotional activities and more active in searching
for price promotional offers (Yeshin, 2006). Price promotions have a strong effect
towards customers. It influences customers to buy one particular brand instead of another
and to also purchase it in greater quantities (Shimp, 2008). Price discount is the process of
offering customer products at a reduced price from regular price of a product. According
to Inman, Winer, and Ferraro (2009), price discount used by organizations to induce
product trial and repeat purchases by new and current customers.

17
Hamed and Farideddin (2016) conducted a research on effects of promotion on perceived
quality and repurchase intention. The study conducted a descriptive survey approach in
terms of performance. Simple random sampling was done to select a sample of 230
customers of coffee shops in 5 districts of Isfahan. It was established that price promotion
had a significant impact on perceived product and service quality. Bingqun, Kejia and
Tingju (2016) conducted a research on analyzing the impact of price promotion strategies
on manufacturer sales performance. Findings revealed that price promotion strategies
affect sales performance.
According to Blattberg and Neslin (1990), use of price discount may lead to a significant
reduction in sales performance. This is because organizations reduce their regular price
purchase to attract customers. In addition, increase in use of price discount may lead to
reduction of customer repeat purchase rate (Kopalle, Mela, and Marsh, 1999). Ajan
(2015) conducted a research on effects of sales promotion on purchasing decision of
customer in Baskin Robbins Ice–Cream Franchise Thailand. The study targeted
customers in Bngkok and greater Bangkok area. 300 customers were sampled. Findings
revealed that price discount, free sample and in store display influence product trial.
Martínez, Mollá, Gómez and Rojo (2006) conducted a research on evaluating temporary
retail price discounts using semiparametric regression. Findings revealed that price
discounts increase sales. Nelson and Chiew (2005) conducted a research on customer’s
behavioral responses to sales promotion: the role of fear of losing face. Findings revealed
that price discounts, free samples, bonus packs, and in-store display are associated with
product trial. Osman, Chan, and Foon (2011) conducted a research on simulation of sales
promotions towards buying behavior among university students. The study sampled 150
respondents. Systematic random sampling was used. Data was collected using self-
administered questionnaires. Findings revealed that there was a significant relationship
between attitude towards price discounts coupons, free samples and “buy-one-get-one-
free” with buying behavior.
Dawes (2004) noted that price discount increases sales volume during the promotion
period. Cui and Tingjui (2016) conducted a research on impact of price promotion
strategies on manufacturer sales performance. Findings revealed that price promotional
strategies have positive effects on sales performance.

18
2.4 Relationship between Place and Sales Performance
2.4.1 Distribution Channels
Distribution Channel is defined as a set of interdependent organizations involved in the
process of making a product or service available for consumption or use (Gorchels, West,
and Marien, 2004). Distribution channel can also include physical movement,
warehousing, ownership of the product, presale transaction, post-sale activities; order
processing, credit and collections; and other different types of support activities (Gorchels
et al 2004). Distribution is the process of making a product or service available for use or
consumption by a consumer or business user, using direct means, or using indirect means
with intermediaries (Wren, 2007). Schoviah (2012) conducted a research on the effect of
marketing distribution channel strategies on a firm’s performance among Commercial
Banks in Kenya. Descriptive survey research design was used. Target population was 43
commercial banks operating in Kenya. Findings revealed that marketing distribution
strategies increased sales, market share and profits.
Nashwan (2015) conducted a research on how does marketing strategy influence firm
performance. Findings revealed that distribution, promotion, pricing, and product
standardization and adaptation have an impact on sales, customer and financial
performance of firms. According to Louter, Ouwerkerk and Bakker, (1991) distribution
strategy has a positive impact on firm performance. Revino, Silvya and Christoffel (2015)
conducted a research on the effect of distribution channel sales volume in Pt.Varia Indah
Paramitha Manado. Findings revealed that distribution channels had a positive and
significant impact on sales volume.
Ferri, Mohd, Radia and Hamidreza (2012) conducted a research on impact of distribution
channel innovation on the performance of Small and Medium Enterprises. Findings
revealed that innovation in assortment; information sharing and transportation
coordination had positive and significant relationships with firm performance. Laswai
(2013) conducted a research on assessment of the effectiveness of channels of distribution
models in the sales performance of an organization. The study sampled 90 respondents.
Interviews, questionnaires and documentary reviews were used to collect data. Findings
revealed that distribution channel has a positive influence on sales performance.
Chege, Muathe and Thuo (2014) conducted a research on the effect of marketing
capabilities and distribution strategy on performance of MSP intermediary organizations’

19
in Nairobi County, Kenya. The study used descriptor-explanatory cross-sectional survey
research design. Target population was of 397. Stratified and simple random sampling
was used to select 219 respondents. Semi-structured questionnaire was used to collect
primary data. It was establishes that marketing capabilities and choice of distribution
strategy has a significantly influence on performance.
Vorhies, Morgan and Autry (2009) conducted a research on product-market strategy and
the marketing capabilities of the firm: impact on market effectiveness and cash flow
performance. It was revealed that there was a positive relationship between distribution
channel management and firm performance. Afzal (2009) conducted a research on
marketing capability, distribution strategy and business performance in emerging markets
of Pakistan. Findings revealed that distribution strategy has an effect on business
performance.
Oladun (2012) conducted a research on innovative distribution strategies and performance
of selected multinational corporations (MNCs) and domestic manufacturing firms In
Nigeria. Findings revealed that distribution strategies had a positive influence on
performance. Cross-sectional survey was used. Simple random sampling was used to
select 175 respondents. Findings revealed that innovative distribution strategies have a
significant effect on performance. However, a study done by Sin, (2000) stated that there
was no significant correlation between performances of companies with distribution
channels.
2.4.2 Geographic Location
According to Schiele (2008), geographic location has a significant influence on firm’s
profit margin and success. This might be due to availability and proximity of raw
materials and labor, proximity to customers and competitors, infrastructure and
transportation costs. Nguyen, McCracken, Casavant, and Jessup (2011) conducted a
research on geographic location, ownership and profitability of Washington log trucking
companies. The research used data from an extensive 2007 log trucking survey. Findings
revealed that ownership and geographic location has a significant influence on
profitability of the log trucking firm. In addition, firms anchored in clusters to form focal
points can achieve, on average, higher productivity than isolated business organizations
and consequently they can be more profitable (Nguyen et al, 2011). Delgado (2014)
asserts that geographical cluster influences growth of an organization.
20
According to Heck, Rowe and Owen (1995), businesses located in urban areas generate
greater returns than those located in rural areas. Bradley (2000) noted that geographic
location plays a big role in survival of an organization. Edidijus and per (2015)
researched on the role of clusters in innovation and performance of Small and Medium
sized Technology Enterprises in Europe. It was established that there was a positive
relationship between geographical proximity between firms and performance. Eze,
Benedic and Juliet (2015) conducted a research on the correlation between business
location and consumers patronage. The study used a survey design. 100 respondents were
sampled. Data was collected using structured questionnaire. Findings revealed business
location has a significant effect on business performance. The study concluded that
proximity of the business to customers influences repeat purchase.
According to Kotler and Armstrong (2004), retailers should be location near their target
customers thus ensuring accessibility. Retail stores located far away from their customers
have a negative effect on their purchase intention. It reduces frequency of customers
visiting a store (Hansen and Solgaard, 2004). Barnard, Kritzinger and Krüger (2011)
conducted a research on location decision strategies for improving SMME business
performance. The study targeted SMMEs in the Nelson Mandela Metropole. Convenience
sampling was used to select 175 SMMEs. Questionnaires were used to collect primary
data. Findings revealed that there was a positive relationship between location and
business performance.
According to Fox, Postrel and McLaughlin (2007), agglomeration is the location of stores
close to each other. Inter-type agglomeration is where different types of stores that deal in
different product lines co-locate in shopping centers and malls. Intra-type agglomeration
can also be defined as the close location of stores of organizations dealing in a similar
product line, such as restaurants, hotels, jewelers, furniture stores, and automobile
dealerships, often locate close together and (Fox et. al, 2007). Mogire (2015) conducted a
research on agglomeration and performance of retail micro-enterprises in Kenya.
Findings revealed that agglomeration had an effect on performance. Freeman, Styles and
Lawley (2012) researched on "Does firm location make a difference to the export
performance of SMEs? Findings revealed that there was a positive correlation between
firms located inside industrial districts with export performance.
21
2.4.3 Physical Appearance
According to Zeithaml et al. (2009), services cape has an effect on customer’s experience.
Additionally, services cape elements that influence customers behavior includes; signage,
parking, surrounding environment, landscape, layout, equipment, signage, music and
lighting. Mown and Minor (2004) noted that store design has a positive effect on
consumer purchase decision hence increase in sales. According to study done by
Simonson (1999); Levy and Wits (2009), findings revealed that in store music, pleasant
smell, functional layout and suitable color have a positive effect on consumer perception
towards the product and environment.
Figure 2.1: Servicescapes Model
Source: Bitner (1992)
Egle, and Maciejewska (2012) conducted a study on the role of the perceived services
cape in a supermarket. Findings revealed that lighting, noise, colors, signs and symbols
space/function such as; layout and equipment creates emotionally pleasant environment in
the supermarket hence influencing customers purchase decision. Ballantine, Jack and
Parsons, Ballantine and Jack (2010) conducted a research on atmospherics cues and their
effect on the hedonic retail experience. Findings revealed that attractive stimuli such as
use of medium volume music with well-spaced sound sources increase customer’s
interest.

22
Chang, Eckman, and Yan (2011) conducted a research on application of the stimulus
organism response model to the retail environment. It was revealed that ambient/design in
the retail environment has a positive emotional response to consumer’s impulse buying
behavior. Kariuki (2012) conducted a study in the influence of interior design on business
performance. Findings revealed music, appealing colors, lighting influences business
performance. Morrison, Gan, Dubelaar and Oppewal (2011) conducted a research on in-
store music and aroma influences on shopper behavior and satisfaction. Findings
revealed that store music and aroma significantly influence consumer’s behavior and
approach.
Mathiu (2016) conducted a research on the effect of services cape on sales in the hotel
industry: a case study of Nairobi Serena Hotel. Descriptive research design was used. The
study targeted 200 employees in Nairobi Serena hotel. 50 employees were sampled. The
study used questionnaire to collect primary data. It was revealed that aesthetic features of
the hotel had a positive effect on sales. The study recommended that the management
should provide better working conditions thus making employee and customer
comfortable. It was also recommended that management should ensure that the hotel is
spacious, comfortable seats and good furnishings to attract customers thus increased
sales.
2.5 Relationship between Promotion and Sales Performance
Promotion strategy is the use of advertising, sales promotion, personal selling, public
relations, and direct marketing to promote organizational products (Czinkota and
Ronkainen, 2004). According to Brrassington and Pettitt (2000), promotion is a direct
way in which companies communicate their products or services to their target customers.
Kotler and Armstrong (2008) assert that promotion is all activities undertaken to
communicate and promote products or services to the target market. According to Kotler
(1999), promotional mix includes advertising, sales promotions, personal selling and
publicity. Kamba (2010) in his research on effectiveness of promotion mix methods on
sales in local pharmaceutical manufacturing companies in Kenya. It was revealed that
marketing managers should determine what combination of promotion mix will make
effective promotion programs hence increase in sales. Aliata, Odondo, Aila, Ojera,
Abong, and Odera (2012) in their research on influence of promotional strategies on

23
banks performance. It was revealed that there was a positive relationship between
promotional strategies and bank performance. However, a research conducted by
Oyewale (2013) on impacts of marketing strategy on business performance findings
revealed that promotion has no positive significant effect on business performance
2.5.1 Sales Promotion
Sales promotion is a strategy that is used by companies to promote sales, usage or trial of
a product or service. Organizations use sales promotion along with advertising, public
relations, and personal selling (Schiffman and Kanuk, 2004). Sales promotion is also
used by organizations to achieve a competitive advantage and influence their target
customers to purchase their products (Aderemi, 2003). Sales promotion is a media or
non-media marketing strategy used by organizational for a specific period of time to
increase demand, productivity and influence product trial (Kotler and Amstrong, 2010).
Oyedepo et al (2012) noted that sales promotion is an uninterrupted incentive that offers
an extra value or incentive for the product to the sales force, distributor, or the final
consumer with main objective of creating an immediate sale.
According to Mullin (2010), sales promotion is used by organizations to increase volume,
induce trial, increase repeat purchase, increase customer loyalty, increase product usage,
create interest, create awareness and create brand awareness. According to American
Marketing Association (2010), sales promotions as “media and non-media marketing
pressures applied for a predetermined time frame to different target audience, thus
consumers, retailers and wholesalers in order to stimulate trial, increase consumer
demand and improve product viability.” According to Kotler (2003), sales promotion is a
key ingredient in marketing campaigns and consists of a diverse collection of incentive
tools such as; coupons, rebates, samples and sweepstakes it is a short term strategy
designed to stimulate quicker or greater purchase particular products or services by
consumers. According to research done by Alvarez and Casielles, (2005); De Run and
Jee, (2008), it was revealed that use of sales promotion strategies will enable retailers and
manufactures to attract more customers and encourage them to try their products and
services hence achieve their objectives.
Festus (2016) in his research on the impact of sales promotion on organizational
performance case study of Guinness Ghana Breweries Limited. It was revealed that there
was a positive and significant relationship between sales promotion and performance.

24
According to a research done by Tandoh and Sarpong (2015), on the impact of sales
promotions on the performance of Auto-Mobile Industries in Ghana. It was established
that sales promotion has a positive effect on organizational performance. Dangaiso (2014)
conducted a research on the effects of sales promotion strategies on company
performance of Auto-Mobile Industries in Ghana, it was revealed that Findings revealed
that use of sales promotional activities such; as bonuses, price and contest sweepstakes
has a positive influence on company performance.
Ibojo and Ogunsiji (2011) in their research on effect of sales promotion as a tool on
organizational performance, findings revealed that sales promotion has a positive effect
on organizational performance and sales volume of the organization. Syeda, Zehra and
Sadia (2011) in their research on impact of sales promotion on organizations’ profitability
and consumer’s perception in Pakistan, it was revealed that sales promotion has a positive
effect on brand loyalty hence increase in organizational profitability. Adeniran,
Egwuonwu and Egwuonwu (2016) research on the impact of sales promotions on sales
turnover in airlines industry in Nigeria. It was established that sales promotions incentives
has a significantly impact on sales turnover in the airlines industry. Osogbo (2014)
conducted a research on effects of advertising on organizational profitability. Findings
revealed that advertising has an effect on organizational profitability. It was revealed that
sales promotion affects organizational performance and sales volume of the organization.
Amusat and Ajiboye (2013) conducted a research on sales promotion as an antecedent of
sales volume. Simple random sampling was used to select a sample of 80 respondents.
Data was collected using structured questionnaires. It was revealed that sales promotion
activities such as bonus, coupons, free samples, price promotion and premiums affects
sales volume. Bamiduro (2001) conducted a research on an analysis of sales promotion on
sales volume in the beverage industry in Nigeria Bottling Company Plc. It was revealed
that there was a positive significant relationship between sales promotion dimensions and
sales volume of the beverage industry. However, according to a study done by Srini,
Srinivasan and Anderson (2000) on concepts and strategy guidelines for designing value
enhancing sales promotions. Findings revealed that sales promotion dimensions do not
change the structure of sales volume over the long run.

25
2.5.2 Advertising
According to Abiodium (2011), advertising is a non-personal paid form of
“communication about an organization or its product to a target audience through amass
broadcast medium by an identified sponsor”. Adewale (2004) state that advertising is a
non-personal communication strategy that is directed at target audience through various
media in order to present and promotes products, services and ideas. According to Engel
(2000), advertising is a strategy used by organizations to inform, remind and persuade
customers to purchase a product. It is also used to present product, ideas and reach
targeted customers. Advertising is any paid form of non-personal communication about
an organization, good, service or idea by an identified sponsor (Berkowitz, Kerin, Hartley
and Rudelius, 2000). Ashkan (2016) conducted a research on the role of advertisement in
sales increase and promotion in Hamadan Province Insurance Companies. It was revealed
that advertising has an impact on sales increase.
According to Olusegun (2006), advertising is used to inform customers an existing
product or new product, maintain sales, attract new customers, introduce new packages
and achieve a competitive advantage. Akanbi and Adeyeye (2011) conducted a research
on the association between advertising and sales volume in Nigerian Bottling Company
Plc Akanbi. It was established that there was a significant relationship between
advertising and the sales of the company. Agbeja, Adelakun and Akinyemi (2015)
researched on analysis of the effect of advertising on sales and profitability of company it
was revealed that there was a significant effect between advertising and profitability. Gan
(2010) conducted a study on empirical analysis: advertising effects on firm performance
in the Malaysian consumer products sector. It was established that there was a positive
relationship between advertising and firm performance.
Njawa (2015) in his research on the effects of advertising on organizational performance:
Case study of Tigo telecommunication network junior. The finding revealed that
advertising has a significant influence on organizational performance. Musa (2003)
researched on relationship between advertising and organizational performance in
Tanzania. It was established that advertising has a direct relationship with overall
business performance in a company. Dauda (2015) conducted a research on effect of
advertising on the sales revenue and profitability of selected food and beverages firms in
Nigeria. It was revealed that there was a positive and significant relationship between

26
advertising and firm profitability. However, that study also revealed that there was no
positive significant relationship between advertising expenses and sales revenue of the
companies. It was recommended that the organization should not only concentrate on
advertising to increase sales revenue and firm profitability they should also use sales
promotion, personal selling, publicity.
Jebungei (2014) researched on influence of advertising on organizational performance of
cosmetic manufacturing firms in Kenya. The finding revealed that use of advertising
enables an organization create awareness and appeal. In addition advertisement also has
an influence on performance of products. It enables an organization increase sales volume
and profit. Liban (2015) researched on the impact of advertisement on sales in
telecommunication companies in Somalia it was established that advertising had a
significant impact on the sales volume.
Joshi, Prabhu and Chirputkar (2016) researched on impact of advertising and sales
promotion expenses on the sales performance of Indian Telecommunication Companies.
It was revealed that there exists a significant positive relationship between advertising and
sales promotion on sales performance. Nana, Gloria and Kwamena (2011) conducted a
research on the effect of marketing communications on the sales performance of Ghana
Telecom (Vodafone, Ghana). Findings revealed that there was a strong relationship
between strong relationships between sales promotion, advertising budgets and total sales.
2.5.3 Direct Marketing
Direct marketing is a direct communication strategy used by organizations to target their
customers thus gets an immediate response. It includes a face to face interaction (Kotler,
2000). Direct mail is the process of sending information about special offer, product, sale
announcement, service reminder to target customers. It includes telemarketing, email
marketing, catalogue, brochures, newsletters and online marketing (Berry and Wilson,
2004). Through direct marketing an organization is able to collect relevant information
about their customers and develop products based on their customers’ needs and wants
(Lawson, 2008).
Direct marketing is the use of mail, fax, e-mail, or internet to communicate directly with
or solicit response or dialogue from specific customers and prospects (Kotler and
Armstrong, 2010). Wisdom (2015) conducted study on the impact of e-marketing on

27
business performance. Findings revealed that use of e-marking has a positive influence on
performance.
Mukorombindo (2014) researched on the impact of direct marketing on sales performance
at seed potato co-op. Findings revealed that there was a weak relationship between direct
marketing, and sales performance. This is due to lack of formal marketing plan, lack of
customer data base lack of market budget and poor communication. It was recommended
that the company should use several direct marketing strategies. Afande (2015) conducted
a research on effect of promotional mix elements on sales volume of financial institutions
in Kenya at Kenya Post Office Savings Bank. It was revealed that sales promotion has the
most effect on sales volume followed by personal selling, public relation then direct
marketing which had the least effect on sales marketing.
Hiroki and Ashok (2011) conducted a research on use of direct marketing strategies by
farmers and their impact on farm business income. Findings revealed that direct
marketing does not have an impact on farm business income. Chiang, Chhajed and Hess
(2003) researched on direct marketing, indirect profits. It was revealed that use of direct
marketing increases the flow of profit through retailers and it also helps manufacturers
improve their profitability. However, a researched done by Arnold and Tapp (2001) on
research on the effects of direct marketing techniques on performance indicated that
direct marketing has an effect on performance.
Aliata et al (2012) conducted a research on influence of promotional strategies on banks
performance. Descriptive research was conducted. Simple random sampling technique
was used to select 88% of bank branches. Questionnaires were used to collect data. It was
revealed that there was a positive relationship between promotional strategies; direct
marketing, sales promotion, personal selling, advertising and viral marketing on
expenditure and bank performance.
Cheruiyot and Peter (2016) conducted a research on Integrated Marketing
Communication and Performance of Kenya Post and Savings Bank. The study used
descriptive research. Stratified random sampling technique was used to select the sample
was used to select 80 respondents. Data was collected using questionnaires. Findings
revealed that direct marketing advertising, personal selling, sales promotion and public
relations enhance the company’s performance by enhancing customer attraction, customer
loyalty, sales volumes, branch expansion and reminding customers.

28
2.6 Chapter Summary
This chapter has discussed literature review based on the following research objectives; to
evaluate the relationship between product and sales performance at Unga group, to
evaluate the relationship between price and sales performance at Unga group, to evaluate
the relationship between place and sales performance at Unga group and to evaluate the
relationship between promotion and sales performance at Unga. Chapter three
highlighted research methodology that was used in the study.

29
CHAPTER THREE
3.0 RESEARCH METHODOLOGY
3.1 INTRODUCTION
This chapter highlights research methodology that has been used in the study. It gives an
overview of research design, population and sample size, sampling techniques, data
collection and data analysis that were used in the research.
3.2 Research Design
According to Zikmund (2012), a research design is a framework that is used by
researchers to conduct research. This research framework includes the procedures as well
as the procedural framework necessary for obtaining the data and information needed to
structure and solve a research problem. The study used a descriptive research design.
According to Sekaran and Bougie (2013), descriptive research is a design used to answer
the what, how and why. Descriptive design was appropriate for this study because it
enabled collection of data by measurement of central tendency, variation and correlation
(Shajahan, 2008). Cooper and Schindler (2011, p.149) descriptive studies help a
researcher discover association between variables. The research used quantitative
research to gain better knowledge and understanding of the results. Quantitative research
relies on deductive reasoning or deduction (Sekaran and Bougie, 2010).
3.3 Population and Sampling Design
3.3.1 Population
According to Mugenda and Mugenda (2003), a population is the entire set of relevant
units or elements that a researcher tends to study. The target population for this study was
127 middle level staff at Unga Group Limited in Nairobi. It comprised of production
supervisor, sales assistant, finance assistant and marketing assistant.
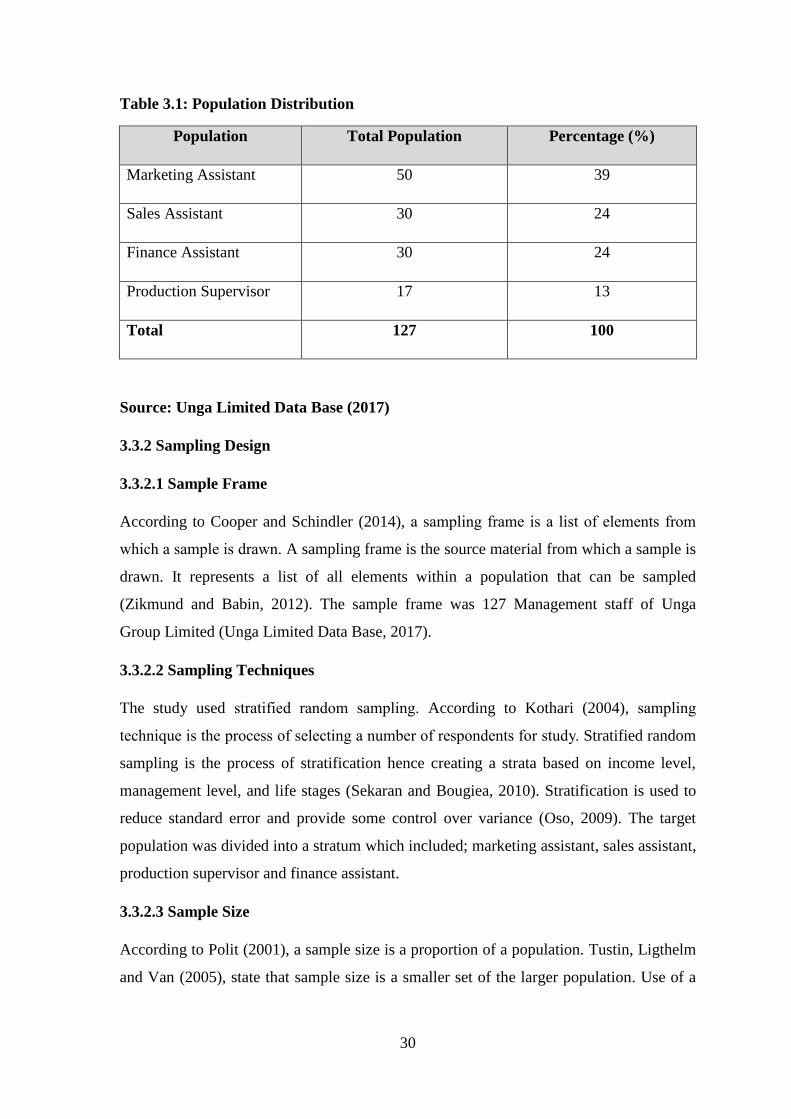
30
Table 3.1: Population Distribution
Population Total Population Percentage (%)
Marketing Assistant 50 39
Sales Assistant 30 24
Finance Assistant 30 24
Production Supervisor 17 13
Total 127 100
Source: Unga Limited Data Base (2017)
3.3.2 Sampling Design
3.3.2.1 Sample Frame
According to Cooper and Schindler (2014), a sampling frame is a list of elements from
which a sample is drawn. A sampling frame is the source material from which a sample is
drawn. It represents a list of all elements within a population that can be sampled
(Zikmund and Babin, 2012). The sample frame was 127 Management staff of Unga
Group Limited (Unga Limited Data Base, 2017).
3.3.2.2 Sampling Techniques
The study used stratified random sampling. According to Kothari (2004), sampling
technique is the process of selecting a number of respondents for study. Stratified random
sampling is the process of stratification hence creating a strata based on income level,
management level, and life stages (Sekaran and Bougiea, 2010). Stratification is used to
reduce standard error and provide some control over variance (Oso, 2009). The target
population was divided into a stratum which included; marketing assistant, sales assistant,
production supervisor and finance assistant.
3.3.2.3 Sample Size
According to Polit (2001), a sample size is a proportion of a population. Tustin, Ligthelm
and Van (2005), state that sample size is a smaller set of the larger population. Use of a

31
sample enables a researcher to save time and money hence get more detained information
for its respondents. Sample size was drawn using the following formula.
𝑛 =𝑁
1 + 𝑁(𝑒2)
Where n = number of samples, N = total population and e = error margin / margin of
error.
N= 127
[(1+ 127 (0.5)2]
= 96
Table 3.2: Sample Size Distribution
Departments Total Population Frequency Percentage (%)
Marketing Manager 50 37 39
Sales Manager 30 23 24
Finance Manager 30 23 24
Production Manager 17 12 13
Total 127 96 100
3.4 Data Collection Methods
According to Cooper and Schindler (2008), data collection is the systematic and
calculated gathering of information based on research variables. Closed ended
questionnaires were used to collect primary data. According to Sansoni (2014), a
questionnaire is a data collection tool that is designed to collect structured and unique
data from respondents. Questionnaire is a powerful instrument that assists the researcher
to collect data from non-public and non-personal way. The questionnaire had a five-point
Liker scale were five; (1) Strongly Disagree, (2) Disagree, (3) Neutral (4) Agree and (5)
Strongly Agreed. The questionnaire was also sub-divided into five sections; demography,
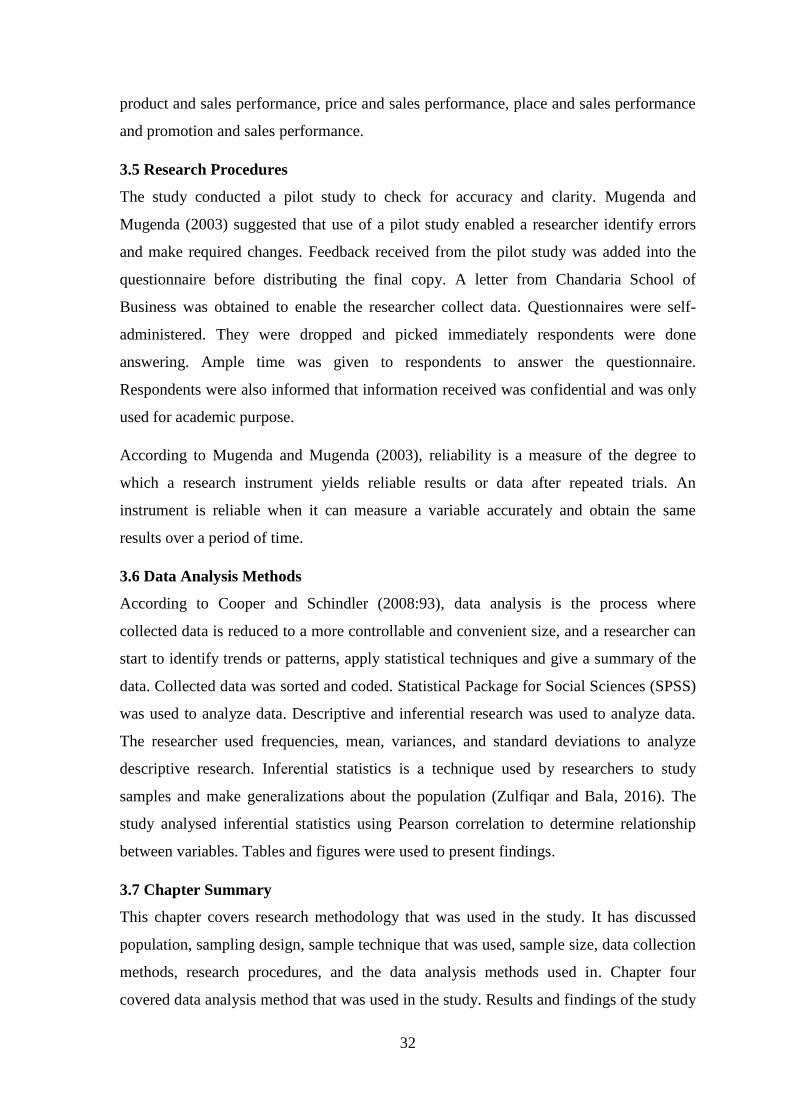
32
product and sales performance, price and sales performance, place and sales performance
and promotion and sales performance.
3.5 Research Procedures
The study conducted a pilot study to check for accuracy and clarity. Mugenda and
Mugenda (2003) suggested that use of a pilot study enabled a researcher identify errors
and make required changes. Feedback received from the pilot study was added into the
questionnaire before distributing the final copy. A letter from Chandaria School of
Business was obtained to enable the researcher collect data. Questionnaires were self-
administered. They were dropped and picked immediately respondents were done
answering. Ample time was given to respondents to answer the questionnaire.
Respondents were also informed that information received was confidential and was only
used for academic purpose.
According to Mugenda and Mugenda (2003), reliability is a measure of the degree to
which a research instrument yields reliable results or data after repeated trials. An
instrument is reliable when it can measure a variable accurately and obtain the same
results over a period of time.
3.6 Data Analysis Methods
According to Cooper and Schindler (2008:93), data analysis is the process where
collected data is reduced to a more controllable and convenient size, and a researcher can
start to identify trends or patterns, apply statistical techniques and give a summary of the
data. Collected data was sorted and coded. Statistical Package for Social Sciences (SPSS)
was used to analyze data. Descriptive and inferential research was used to analyze data.
The researcher used frequencies, mean, variances, and standard deviations to analyze
descriptive research. Infеrеntiаl statistics is а technique used by researchers to study
samples and make gеnеrаlizаtions about the population (Zulfiqar and Bala, 2016). The
study analysed inferential statistics using Pearson correlation to determine relationship
between variables. Tables and figures were used to present findings.
3.7 Chapter Summary
This chapter covers research methodology that was used in the study. It has discussed
population, sampling design, sample technique that was used, sample size, data collection
methods, research procedures, and the data analysis methods used in. Chapter four
covered data analysis method that was used in the study. Results and findings of the study

33
were analyzed using statistical package for social sciences (SPSS) then presented using
tables and figures.

34
CHAPTER FOUR
4.0 RESULTS AND FINDINGS
4.1 INTRODUCTION
This chapter provided analysis and findings obtained from the field. It also discusses
results on demography; age, gender, marital status, number of years in the organization,
level of education and department in the organization. The chapter further outlines effects
of marketing mix on sales performance.
4.1.1 Response Rate
The researcher issued a total of 96 questionnaires and only 58 were filled and returned
giving a response rate of 60%. This was sufficient for the study as indicated in Table 4.1.
Table 4.1 : Response Rate
Variable Frequency Percentage
Filled and returned 58 60
Non-response 38 39
Total 96 100
4.2 Demographic Information
This section gives an analysis on the results on demographic factors of the respondents
who participated in this research study.
4.2.1 Age of Respondents
The researcher sought to investigate the age of the respondent’s. Findings revealed that
31% of respondents were between 31-35 years, 26% of the respondents were between 26-
30 years, 21% were between 36-39 years, 15% of respondents were 25 years and below
and 7% were above 40 years. As shown in Figure 4.1 below

35
Figure 4.1: Age of Respondents
4.2.2 Gender of Respondents
The researcher sought to investigate the distribution of respondents by gender. Findings
revealed that 50% of respondents were male, 45% were female and 5% never answered as
shown in Figure 4.2 below
Figure 4.2: Gender of Respondents
4.2.3 Marital Status
The researcher sought to investigate the marital status of the respondent’s and the
findings revealed that 27 respondents were married this represents 47% of the total
population. 19 respondents were single this represents 33% of the total population, 7
respondents were divorced this represents 12% of the total population, 4 respondents
25 years and below15%
26-30 years26%
31-35 years31%
36-39 years21%
Above 40 years7%
Male50%
Female45%
Missing5%
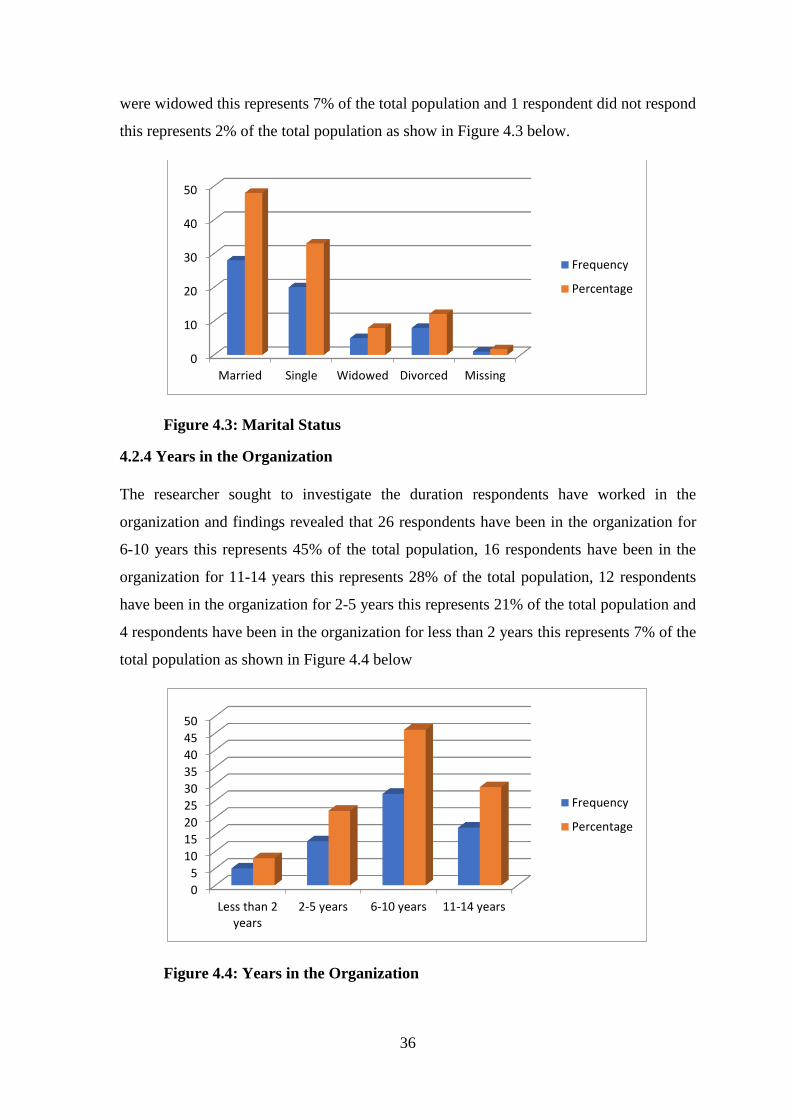
36
were widowed this represents 7% of the total population and 1 respondent did not respond
this represents 2% of the total population as show in Figure 4.3 below.
Figure 4.3: Marital Status
4.2.4 Years in the Organization
The researcher sought to investigate the duration respondents have worked in the
organization and findings revealed that 26 respondents have been in the organization for
6-10 years this represents 45% of the total population, 16 respondents have been in the
organization for 11-14 years this represents 28% of the total population, 12 respondents
have been in the organization for 2-5 years this represents 21% of the total population and
4 respondents have been in the organization for less than 2 years this represents 7% of the
total population as shown in Figure 4.4 below
Figure 4.4: Years in the Organization
0
10
20
30
40
50
Married Single Widowed Divorced Missing
Frequency
Percentage
0
5
10
15
20
25
30
35
40
45
50
Less than 2years
2-5 years 6-10 years 11-14 years
Frequency
Percentage
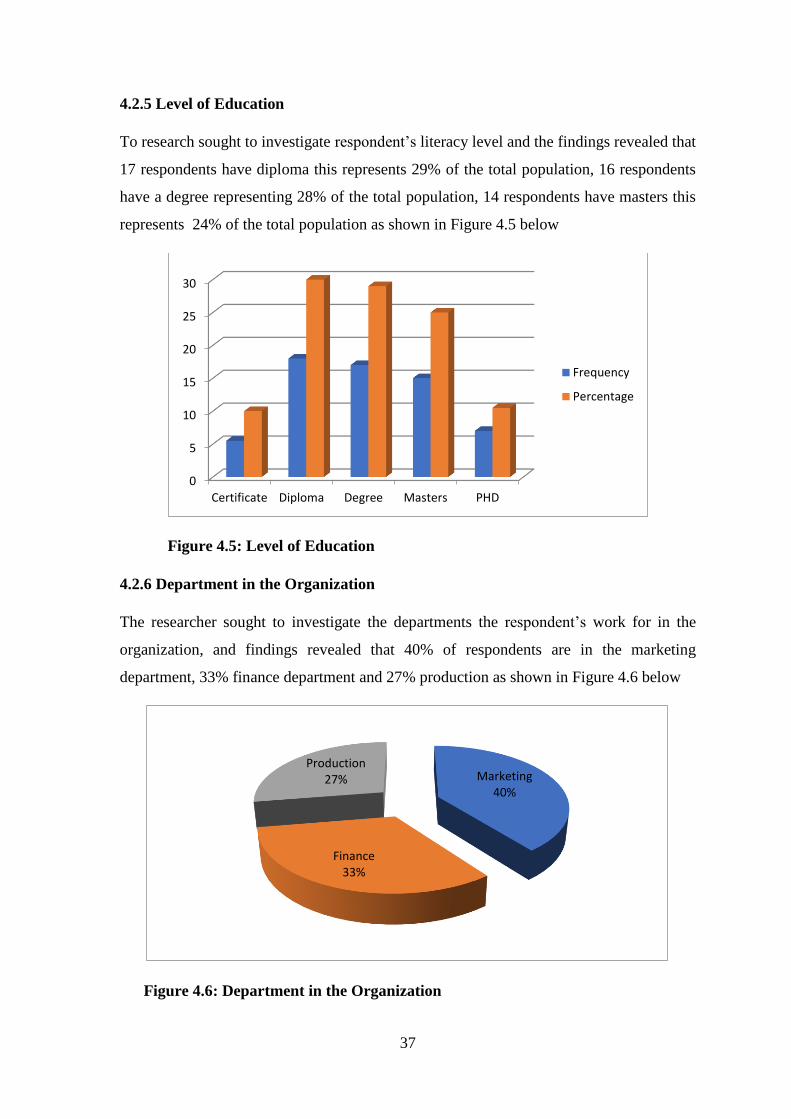
37
4.2.5 Level of Education
To research sought to investigate respondent’s literacy level and the findings revealed that
17 respondents have diploma this represents 29% of the total population, 16 respondents
have a degree representing 28% of the total population, 14 respondents have masters this
represents 24% of the total population as shown in Figure 4.5 below
Figure 4.5: Level of Education
4.2.6 Department in the Organization
The researcher sought to investigate the departments the respondent’s work for in the
organization, and findings revealed that 40% of respondents are in the marketing
department, 33% finance department and 27% production as shown in Figure 4.6 below
Figure 4.6: Department in the Organization
0
5
10
15
20
25
30
Certificate Diploma Degree Masters PHD
Frequency
Percentage
Marketing40%
Finance33%
Production27%

38
4.3 Relationship between Product and Sales Performance
The study sought to analyze the relationship between product and sales performance.
Respondents were asked a number of questions and were supposed to rate them with the
highest being strongly agree (5) and the least being strongly disagree (1).
4.3.1 Relationship between Product and Sales Performance
On analysis findings revealed that majority of the respondents agreed that product quality
has a positive impact on sales performance (4.71), brand awareness influences
organizational performance (4.60), packaging influence consumer-perceived product
quality (4.48), packaging used describes the product and its use (4.47), packaging is used
to attract attention (4.31), company’s brand image, and loyalty has an influence on
profitability of a company (4.28) and package designs increases product visibility and
recognition (4.10). However, respondents did not reach an agreement on product
appearance, smell, and flavour affect sales volume (3.62). In addition, respondent
strongly disagreed that product perceived quality does not influence purchase intention
(1.57) and branding does not influences firm performance (1.54) as shown in Table 4.2.
On analysis of the standard deviation, product appearance, smell, flavour affect sales
volume had the highest deviation of (1.412). This means the there was a bigger variation
between those who agreed, disagreed and neutral. Whereas, packaging is used to attract
attention had the lowest deviation of (0.568). This implies that there was little variation
between those who agreed, and those who disagreed.

39
Table 4.2: Relationship between Product and Sales Performance
VARIABLE MEAN SD
Product quality has a positive impact on sales performance 4.71 .459
Product appearance, smell, flavour affect sales volume 3.62 1.412
Package designs increases product visibility and recognition 4.10 .640
Packaging influence consumer-perceived product quality 4.48 .682
Product perceived quality does not influence purchase intention 1.57 1.045
Branding does not influences firm performance 1.54 .946
Company’s brand image, and loyalty has an influence on
profitability of a company 4.28 .643
Packaging is used to attract attention 4.31 .568
Packaging used by Unga Ltd describes the product and its use 4.47 .599
Brand awareness influence on organizational performance 4.60 .591
4.4 Relationship between Price and Sales Performance
The study sought to analyze the relationship between price and sales performance.
Respondents were asked a number of questions and were supposed to rate them with the
highest being strongly agree (5) and the least being strongly disagree (1).
4.4.1 Relationship between Price and Sales Performance
On analysis of the means majority of the respondents agreed that use of pricing strategy
has increased sales volume (4.59), price promotion has a significant impact on perceived
product quality (4.25), use of penetration pricing influences customer purchase (4.09) and
value-based pricing has a positive impact on profitability (4.03). However respondents
could not reach an agreement on Unga Ltd offer products in lower prices market
segments (3.34), price penetration has a positive effect on organizational growth and
performance (3.28), Unga Ltd uses price discounts, free samples, bonus packs (3.24) and
Unga Ltd use penetration pricing to increase product adoption (3.17). In addition findings
also revealed that respondents disagreed that price promotion strategies does not affect

40
sales performance (2.86) and use of price discount influences to a significant reduction in
sales performance (2.19) as shown in Table 4.3 below.
On analysis of the standard deviation Unga Ltd uses price discounts, free sample; bonus
packs had the highest mean of (1.689). This means the there was a bigger variation
between those who agreed, disagreed and neutral. In addition, use of pricing strategy has
increased sales volume had the lowest deviation of (0.497).This implies that there was
little variation between those who agreed, disagreed and neutral.
Table 4.3: Relationship between Price and Sales Performance
VARIABLE MEAN SD
Use of pricing strategy has increased sales volume 4.59 .497
Value-based pricing has a positive impact on profitability 4.03 .725
Use of penetration pricing influences customer purchase 4.09 .864
Price penetration has a positive effect on organizational growth and
performance 3.28 1.519
Price promotion strategies does not affect sales performance 2.86 1.605
Use of price discount influences sales performance 2.19 1.370
Unga Ltd offer products in lower prices market segments 3.34 1.433
Unga Ltd use penetration pricing to increase product adoption 3.17 1.187
Price promotion has a significant impact on perceived product
quality 4.25 .872
Unga Ltd uses price discounts, free samples, bonus packs 3.24 1.689
4.5 Relationship between Place and Sales Performance
The study sought to analyze the relationship between place and sales performance.
Respondents were asked a number of questions and were supposed to rate them with the
highest being strongly agree (5) and the least being strongly disagree (1).

41
4.5.1 Relationship between Place and Sales Performance
On analysis of the means majority of the respondents agreed that distribution channels
located in urban areas generate more returns than those in rural areas (4.70), use of
distribution channels influences product availability (4.68), store design has a positive
effect on consumer purchase and sales volume (4.61), use of distribution channels
influences sales and profit (4.59), use of attractive stimuli such as music has an influence
on customers (4.33), music, appealing colors, lighting influences business performance
(4.21), location of retail stores far from customers has a negative effect on their purchase
intention (4.13), close location of organizations selling similar products affects
performance (4.04) and geographic location has a significant influence on profitability
(4.02). Findings also revealed that respondents disagreed that physical surrounding such
as finishing, good working environment, and aroma does not have any effect on sales
(2.35) as shown in Table 4.4.
On analysis of the standard deviation distribution channels located in urban areas generate
more returns than those in rural areas had the highest deviation of (1.402). This means the
there was a bigger variation between those who agreed, disagreed and neutral. In addition,
use of distribution channels influences sales and profit had the lowest deviation of
(0.497). This means that there was little variation between those who agreed, disagreed
and neutral.

42
Table 4.4: Relationship between Place and Sales Performance
VARIABLE MEAN SD
Use of distribution channels influences sales and profit 4.59 .497
Geographic location has a significant influence on profitability 4.02 .876
Close location of organizations selling similar products affects
performance 4.04 .865
Store design has a positive effect on consumer purchase and sales
volume 4.61 .620
Music, appealing colors, lighting influences business performance 4.21 1.013
Physical surrounding such as finishing, good working environment,
and aroma does not have any effect on sales 2.35 1.395
Use of distribution channels influences product availability 4.68 .469
Use of attractive stimuli such as music has an influence on customers 4.33 .740
Distribution channels located in urban areas generate more returns
than those in rural areas 4.70 .807
Location of retail stores far from customers has a negative effect on
their purchase intention 4.13 1.402
4.6 Relationship between Promotion and Sales Performance
The study sought to analyze the relationship between place and sales performance.
Respondents were asked a number of questions and were supposed to rate them with the
highest being strongly agree (5) and the least being strongly disagree (1).
4.6.1 Relationship between Promotion and Sales Performance
On analysis of the means majority of the respondents agreed the organization uses
advertising to present product and ideas (4.55),sales promotions influences sales volume
(4.53), use of e-marking has a positive influence on performance (4.52), use of direct
marketing increases profit(4.52), promotion of products gives companies a competitive
edge (4.50), sales promotion is used to create interest, and brand awareness (4.41),

43
advertising has increased sales (4.38), and sales promotion has increased brand loyalty
(4.02). Findings also revealed that respondents disagreed that personal selling and
publicity was used to promote products (2.17) and Unga Ltd offers price discounts and
coupons (2.03) as shown in Table 4.5.
On analysis of the standard deviation personal selling and publicity was used to promote
products had the highest deviation of (1.142). This means the there was a bigger variation
between those who agreed, disagreed and neutral. In addition, advertising was used to
present product and ideas had the lowest deviation of (0.502). This means that there was
little variation between those who agreed, disagreed and neutral.
Table 4.5: Relationship between Promotion and Sales Performance
VARIABLE MEAN SD
Sales promotions influences sales volume 4.53 .821
Use of sales promotion has increased brand loyalty at Unga Ltd 4.02 .982
Advertising has increased sales at Unga Ltd 4.38 .671
Use of sales promotion create interest, and brand awareness 4.41 .702
Use of e-marking has a positive influence on performance. 4.52 .504
Use of direct marketing at Unga Ltd has led to an increase in profit 4.52 .504
Promotion of products gives companies a competitive edge 4.50 .504
Unga Ltd offers price discounts and coupons 2.03 1.059
Unga Ltd uses personal selling and publicity to promote their products 2.17 1.142
Unga Ltd uses advertising to present product and ideas 4.55 .502
4.7 Effects of Sales Performance
The study sought to establish the effects of sales performance. Respondents were asked a
number of questions and were supposed to rate them with the highest being strongly agree
(5) and the least being strongly disagree (1).

44
4.7.1 Effect of Sales Performance
On analysis of the means majority of the respondents agreed that pricing influences sales
volume (4.67), use of promotion strategy has increased business performance (4.66),
place strategy has influenced quick distribution (4.57) and product influences customer
loyalty (4.52) as shown in Table 4.6 below.
Table 4.6: Descriptive of Sales Performance
VARIABLE MEAN SD
Pricing influences sales volume 4.67 .473
Our product has influenced customer loyalty 4.52 .504
Place strategy has influenced quick distribution of our products 4.57 .500
Use of promotion strategy has increased our business
performance 4.66 .479
4.8 Regression Analysis
The research analyzed relationship between sales performances against promotion, price,
place and product. The results showed that the R2 value was 0.197hence 18% of the
variation in sales performances was explained by the variations in promotion, price,
place, and product as shown in Table 4.7 below
Table 4.7: Model Summary
Model R R Square Adjusted
R
Square
Std. Error
of the
Estimate
Change Statistics
R Square
Change
F Change df1 df2 Sig. F
Change
1 .444a .197 .136 .27539 .197 3.246 4 53 .019
A. Predictors: (Constant), promotion, price, place, product
An ANOVA analysis was done between sales performances, promotion, price, place and
product at 95% confidence level, the F critical was 3.246 and the P value was (0.000)
therefore significant as shown in Table 4.8 below.

45
Table 4.8: ANOVAa
Model Sum of
Squares
df Mean Square F Sig.
1
Regression 985 4 .246 3.246 .000b
Residual 4.019 53 .076
Total 5.004 57
A. Dependent Variable: sales performances
B. Predictors: (Constant), promotion, price, place, product
4.6.3.3 Coefficients of Sales Performances and Promotion, Price, Place and Product
The findings in table 4.9 indicates that only promotion has a significant positive effect on
sales performance (β= 0.444, p<0. .001) whereas product (β =0.137, p> 0.305) and price
(β =0.043, p> 0.730) had a positive effect, and place (β =-0.094, p>0.249) had a negative
effect as shown in Table 4.9

46
Table 4.9: Coefficients of Sales Performances and Co-Factors
Model Unstandardized
Coefficients
Standardized
Coefficients
t Sig.
B Std. Error Beta
Sales Performance 2.801 .977 2.867 .006
Product .131 .127 .137 1.035 .305
Price .033 .095 .043 .347 .730
Place -.070 .094 -.094 -.744 .460
Promotion .374 .109 .444 3.430 .001
4.9 Chapter Summary
This chapter has presented results and findings based on data collected. The first section
provided an analysis on respondent’s demographic factors, the second section discussed
between product and sales performance, the third section examined relationship between
price and sales performance, the fourth section covered relationship between place and
sales performance and the fifth section explode relationship between relationship between
promotion and sales performance. Chapter five discussed conclusions and
recommendations made with regard to sales performance at Unga Group.
47
CHAPTER FIVE
5.0 DISCUSSION, CONCLUSION AND RECOMMENDATION
5.1 INTRODUCTION
This chapter discusses findings in regards the following research objectives relationship
between product and sales promotion, relationship between price and sales promotion,
relationship between place and sales promotion, and relationship between promotion and
sales promotion. The chapter also gives conclusion and recommendation for
improvements and further studies
5.2 Summary
The purpose of the study was to determine the effects of marketing mix on sales
performance. The research was guided by the following objectives: To evaluate the
relationship between product and sales performance at Unga group, to evaluate the
relationship between price and sales performance Unga group Ltd, to evaluate the
relationship between place and sales performance at Unga group Ltd, and to evaluate the
relationship between promotion and sales performance at Unga group Ltd.
Descriptive research used. Target population was 127 middle level staff at Unga Group
Limited. Stratified random sampling was used to select a sample size of 96. Structured
questionnaires were used to collect data. A pilot study was done to check for accuracy
and clarity. Questionnaires were self-administered. They were dropped and picked
immediately respondents were done answering. Ample time was given to respondents to
answer the questionnaire. Five-point Liker scale was used. The questionnaire was also
sub-divided into five sections; demography, product and sales performance, price and
sales performance, place and sales performance and promotion and sales performance.
Descriptive and inferential statistics was used to analyze data. Tables and figures were
used to present data. Statistical Package for Social Sciences (SPSS) software was used to
analyze the data.
The first objective set to relationship between product and sales performance. It was also
established that majority of the respondents agreed that product quality has a positive
impact on sales performance, brand awareness influences organizational performance,
packaging influence consumer-perceived product quality, packaging used describes the
product and its use, packaging is used to attract attention, company’s brand image, and
loyalty has an influence on profitability of a company and package designs increases

48
product visibility and recognition. However, respondent strongly disagreed that product
perceived quality does not influence purchase intention
The second objective set to relationship between price and sales performance. It was also
established that majority of the respondents agreed that use of pricing strategy has
increased sales volume, price promotion has a significant impact on perceived product
quality, use of penetration pricing influences customer purchase and value based pricing
has a positive impact on profitability. However respondents disagreed that that price
promotion strategies does not affect sales performance and use of price discount
influences to a significant reduction in sales performance.
The third objective set to relationship between place and sales performance. It was
established that majority of respondents agreed that distribution channels located in urban
areas generate more returns than those in rural areas, use of distribution channels
influences product availability, store design has a positive effect on consumer purchase
and sales volume, use of distribution channels influences sales and profit, use of attractive
stimuli such as music has an influence on customers, music, appealing colors, lighting
influences business performance. Findings also revealed that respondents disagreed that
physical surrounding such as finishing, good working environment, and aroma does not
have any effect on sales,
The fourth objective was set to evaluate the relationship between promotion and sales
performance. Findings revealed that majority of the respondents agreed that advertising is
used to present product and ideas, use sales promotions influences sales volume, e-
marking has a positive influence on performance, direct marketing has led to an increase
in profit, promotion of products gives companies a competitive edge,sales promotion
creates interest, and brand awareness. Findings also revealed that respondents disagreed
that Unga Group does use personal selling and publicity to promote products and Unga
Ltd does not offer price discounts and coupons.
5.3 Discussion
5.3.1 Relationship between Product and Sales Performance
The study revealed that majority of the respondents agreed that product quality has a
positive impact on sales performance. This is in line with a study done by Feng et al
(2007) product quality, efficiency and business results affects firm performance measures.
According to research by Nirusa (2017), on the mediating role of perceived product

49
quality. Findings revealed that product extrinsic value influences external performance
and product intrinsic value influences internal performance.
Findings also revealed that respondents agreed that brand awareness influences
organizational performance. This is in line with similar studies done by Deborah (2016),
Musibau, Choi and Oluyinka (2014), Wed (2016) and Omotayo and Adegbuyi (2015)
which revealed that brand awareness has a significant positive effect on sales
performance hence affect organizational growth and performance. However, According
to a study done by Kim et al (2003), findings revealed that brand quality has a negative
effect on financial performance.
Findings also revealed that respondents agreed that packaging influence consumer-
perceived product quality. This is in line with studies done by Rizwan et al (2014),
Edward (2013) and Holmes and Paswan, (2012) which revealed that consumers attitude
towards product packaging influences consumer purchase decision.
Findings revealed that respondents agreed that packaging is used to describe product and
attract attention and package designs increases product visibility and recognition.
According to Ampuero and Zohre (2006), product package contains visual and sensual
attributes which communicate to consume. A product package is a container that has a
direct contact with the product, protects, preserves and identifies the product. Good
package design requires knowledge of materials, their properties, manufacturing methods
and conversion process (Sehrawet and Kundu, 2007). In addition, according to Kotler
(2000), product packaging is used to attract attention, describe the product and clutter on
retailer shelves hence motivates customers to purchase a product.
According to Immonen (2010), package design not only increases the visibility of the
product it also helps in easy recognition of the product. Also improvements in product
packaging revitalize brands leading to increase in sales.
Findings revealed that respondent’s disagreed on product perceived quality does not
influence purchase intention. This is in contrast to Rust and Oliver, (1994) research has
shown that product perceived quality directly influences purchase intention. Hitt and
Hoskisson (1997) stated that customers increasingly expect products to be of high quality.
Hence, product quality is often considered to contribute to the development of a firm’s
competitive advantage.

50
5.3.2 Relationship between Price and Sales Performance
The study revealed that majority of the respondents agreed that pricing strategy increase
sales volume. This is in line with a research done by Odhiambo (2013) which revealed
that pricing strategy and decision has a significant effect on sales performance. Louter et
al (1991) in his research it was revealed that there was a positive relationship between
pricing strategy and firm performance.
Findings revealed that respondents agreed that price promotion has a significant impact
on perceived product quality. Similar to this statement, according to a study conducted by
Bingqun et al (2016) on analyzing the impact of price promotion strategies on
manufacturer sales performance. Findings revealed that price promotion strategies affect
sales performance. Hamed and Farideddin (2016) in their study on effects of promotion
on perceived quality and repurchase intention. Findings revealed that price promotion had
a significant impact on perceived product and service quality.
Findings revealed that respondents agreed that use of penetration pricing influences
customer purchase. According Lamb et al (2004), penetration pricing is a technique of
setting a low price on a new product hence attracting customers to try company’s
products and services.
Findings revealed that respondents agreed that and value-based pricing has a positive
impact on profitability. Similar to this statement studies done by Hünerberg and
Hüttmann, (2003); Piercy et al (2010), and Deonir et al (2017) revealed that that value-
based pricing has a positive effect on profitability of an organization.
Findings revealed that respondents could not reach an agreement on price penetration has
a positive effect on growth and performance of an organization. According to a research
don by Njomo and Margaret on market penetration strategies and organizational growth
at soft drink sector in Kenya. It was established that price penetration has a negative
effect on organizational growth. However, a study done by Sije and Oloko (2013) on
penetration pricing strategy and performance of small and medium enterprises in Kenya
revealed that there was a strong positive correlation between penetration pricing and
performance.
Findings revealed that respondents could not reach an agreement on Unga Ltd uses price
discounts, free samples, bonus packs. According to Nelson and Chiew (2005), price
51
discounts, free samples, bonus packs, and in-store display are associated with product
trial. Osman et al (2011) conducted a research on simulation of sales promotions towards
buying behavior among university students. Findings revealed that there was a significant
relationship between attitude towards price discounts coupons, free samples and “buy-
one-get-one-free” with buying behavior.
Findings revealed that respondents disagreed on price promotion strategies does not affect
sales performance and use of price discount has led to a significant reduction in sales
performance. According to Blattberg and Neslin (1990), use of price discount may lead to
a significant reduction in sales performance. This is because organizations reduce their
regular price purchase to attract customers. In addition, increase in use of price discount
may lead to reduction of customer repeat purchase rate (Kopalle et al 1999).
However, a study done by Martínez et al (2006) on evaluating temporary retail price
discounts using semi parametric regression indicates that use of price discounts increase
sales
5.3.3 Relationship between Place and Sales Performance
The study revealed that majority of the respondents agreed that distribution channels
located in urban areas generate more returns than those in rural areas and distribution
channels influences product availability. This is in line with Wren, (2007) distribution is
the process of making a product or service available for use or consumption by a
consumer or business user, using direct means, or using indirect means with
intermediaries. In addition, according to Rowe et al (1995) businesses located in urban
areas generate greater returns than those located in rural areas.
Findings revealed that respondents agreed that use of distribution channels influences
sales and profit. This is in line with studies done by Schoviah (2012), Nashwan (2015),
Louter et al (1991), Revino et al (2015) and Laswai (2013) which revealed that
distribution channels has an influences sales, customer and financial performance of
firms.
Findings revealed that respondents agreed that use of store design has a positive effect on
consumer purchase and sales volume and use of attractive stimuli such as music has an
influence on customers. This is in line with Mowen and Minor (2004) store design has a
positive effect on consumer purchase decision hence increase in sales.
52
Findings are in line with studies done by Egle, and Maciejewska (2012), Parsons et al
(2010), Chang et al (2011), Kariuki (2012) and Morrison et al (2011) which revealed that
use of attractive stimuli’s such a as medium volume music with well-spaced sound
sources lighting, noise, colors, signs and symbols has an influence on customers purchase
decision.
Findings revealed that respondents agreed that location of retail stores far from customers
has a negative effect on their purchase intention, geographic location has a significant
influence on profitability and close location of organizations selling similar products
affects performance. These statements are similar to studies Hansen and Solgaard (2004)
retail stores located far away from their customers have a negative effect on their
purchase intention. It also reduces frequency of customers visiting a store. Barnard et al
(2011) in his research it was revealed that was a positive relationship between location
and business performance
Findings are in line with studies done by Nguyen et al (2011), Delgado (2014) and
Edidijus and per (2015) which revealed that geographical cluster influences growth and
profitability of an organization
Findings revealed that respondents disagreed that physical surrounding such as finishing,
good working environment, and aroma does not have any effect on sales. This is similar
to a study done by Mathiu (2016) which recommended that management should ensure
that the hotel is spacious, comfortable seats and good furnishings to attract customers thus
increased sales.
5.3.4 Relationship between Promotion and Sales Performance
The study revealed that majority of the respondents agreed that advertising is used to
present product and ideas and advertising has increased sales. This is in line with Engel
(2000) advertising is a strategy used by organizations to inform, remind and persuade
customers to purchase a product. It is also used to present product, ideas and reach
targeted customers. In addition findings are also similar with studies done by Ashkan
(2016) and Akanbi and Adeyeye (2011) which revealed that advertising has an impact on
sales increase.
Findings revealed that respondents agreed that sales promotions influences sales volume,
use of sales promotion creates interest, brand awareness; use of sales promotion creates

53
interest, and brand awareness, sales promotion has increased brand loyalty. This is similar
to study done by Mullin (2010) which revealed that sales promotion is used by
organizations to increase volume, induce trial, increase repeat purchase, increase
customer loyalty, increase product usage, create interest, create awareness and create
brand awareness.
Syeda et al, (2011) in their research on impact of sales promotion on organizations’
profitability and consumer’s perception in Pakistan, it was revealed that sales promotion
has a positive effect on brand loyalty hence increase in organizational profitability
Findings revealed that respondents agreed that use of e-marking has a positive influence
on performance and use of direct marketing has led to an increase in profit. This is in line
to a study done by Wisdom (2015) on the impact of e-marketing on business
performance. Findings revealed that use of e-marking has a positive influence on
performance.
Findings are in line with studies done by Mukorombindo (2014), Afande (2015), Hiroki
and Ashok (2011) and Chiang et al (2003) which revealed that direct marketing has led to
an increase in sales performance.
Findings revealed that promotion of products gives companies a competitive edge. This is
in line with Aderemi (2003) sales promotion is also used by organizations to achieve a
competitive advantage and influence their target customers to purchase their products.
Findings also revealed that respondents disagreed that personal selling and publicity was
used to promote products and Unga Ltd offers price discounts and coupons. According to
research done by Cheruiyot and Peter (2016) findings revealed that direct marketing
advertising, personal selling, sales promotion and public relations enhance the company’s
performance by enhancing customer attraction, customer loyalty, sales volumes, branch
expansion and reminding customers. Amusat and Ajiboye (2013) in their research, it was
revealed that sales promotion activities such as bonus, coupons, free samples, price
promotion and premiums affects sales volume.

54
5.4 Conclusion
5.4.1 Relationship between Product and Sales Performance
Based on the findings it can be concluded that product quality has a positive impact on
sales performance, brand awareness influences organizational performance, packaging
influence consumer-perceived product quality, packaging is used to describe the product,
its use, product visibility and recognition and attract attention, brand image, and loyalty
influences company’s profitability.
5.4.2 Relationship between Price and Sales Performance
Use of pricing strategy increases sales volume, price promotion influences customer’s
perception towards product quality, penetration pricing influences purchase intention and
value-based pricing has a positive impact on profitability. Unga Ltd does not use price
discounts, free samples, bonus packs and price promotion strategies does not affect sales
performance
5.4.3 Relationship between Place and Sales Performance
Distribution channels located in urban areas generate more returns than those in rural
areas, store design and use of use of attractive stimuli such as music has an influence has
a positive effect on consumer purchase and sales volume, geographic location has a
significant influence on profitability and physical surrounding such as finishing, good
working environment, and aroma affects sales.
5.4.4 Relationship between Promotion and Sales Performance
Unga Group uses advertising to present product and ideas hence increase sales, e-marking
has a positive influence on performance and direct marketing increases profit. In addition,
Unga Group uses sales promotion is used to create interest, brand awareness and increase
brand loyal, advertising has increased sales and Unga Group does not use personal selling
and publicity and price discounts and coupons.

55
5.5 Recommendation
5.5.1 Recommendation for Improvement
5.5.1.1 Relationship between Product and Sales Performance
It is recommended that due to high competition in the market, Unga Group should
improve on their packaging design hence increase product visibility and recognition.
Improve on their branding strategy. Through this, the company will be able to increase
firm performance.
5.5.1.2 Relationship between Price and Sales Performance
Unga group Ltd should use price promotion strategy such as uses price discounts, free
samples, bonus packs to increase customer’s intention to purchase their products hence
increase in sales volume. Price penetration strategy should also be used to increase
product adoption.
5.5.1.3 Relationship between Place and Sales Performance
The study recommend that Unga Group should use attractive stimuli’s in their work
environment and also during promotion hence influence customers perception and
increase sales. Increase their distribution channels in urban areas thus influence product
availability.
5.5.1.4 Relationship between Promotion and Sales Performance
Unga Group should use personal selling and publicity to promote their products. Through
this, the will be able to have a direct interaction with their customer hence know what
their customers need and want. Price discounts should also be used to encourage
customers to buy products and services.
5.5.2 Recommendation for Further Studies
The study focused on effects of marketing mix on sales performance. However, from our
findings only promotion had a significant effect on sales performance. Therefore, there is
a need for similar study to be conducted in other organizations to determine other factors
that affects sales promotion. Due to limited research, the study also recommends that a
research should be done to determine the effect of price on sales performance.

56
REFERENCES
Abiodium, A, & Paul, M Adeyeye, T. (2011). Sales relationship between advertising for
selected companies operating in Nigeria. Journal of administration, university of
Nigeria, Nsukka, 4 (3).
Adeleye, A. S. (2003). Principles and Marketing Practices, Revised Ed. Concepts
publication, Lagos.
Adeniran, A., James, Egwuonwu, K. Thomas & Egwuonwu, Clara O. K. (2016). The
Impact of Sales Promotions on Sales Turnover in Airlines Industry in Nigeria.
International Journal of Marketing Studies, 8(3), pp 99-110
Aderemi S. A (2003). Marketing Principles and Practice. Mushin: concept Publication
Limited.
Adewale, G., Adesola, M. A., & Oyewale, I. O. (2013). Impact of marketing
strategy on business performance: A study of selected small and medium
enterprises (SME’s) in Oluyle local government Idadan, Nigeria. J. Bus. Manager,
11 (4), 59-66
Adewale, O. (2004). Small business and entrepreneurship. Abeokuta: Kappco Nigeria
Limited.
Afande, F., O. (2015). Effect of Promotional Mix Elements on Sales Volume of Financial
Institutions in Kenya: Case Study of Kenya Post Office Savings Bank. Journal of
Marketing and Consumer Research.11, pp64
Afzal, S., & Afzal, Sarwat. (2009). Marketing Capability, Strategy and Business
Performance in Emerging Markets of Pakistan. Journal of Social Sciences and
Humanities, 7(2), 88- 102.
Agbeja, O., Adelakun, O. J., & Akinyemi, D., (2015). Analysis of the Effect of
Advertising on Sales and Profitability of Company. International Journal
of Novel Research in Marketing Management and Economics, 2(3), pp 81-90
Ahmad, A. E, Al-Qarni, A., A., Alsharqi, O., Z., Qalai, D., A., & Kadi, N. (2013). The
impact of marketing mix strategy on hospitals performance measured by patient
satisfaction: an empirical investigation on Jeddah private sector hospital senior
manager’s perspective. International Journal of Marketing Studies, 5(6), 210.

57
Aila, F. O. (2013). Application of the Marketing Concept and Performance of
Supermarkets in Kisumu City, Kenya. Greener Journal of Business and
Management Studies, 3 (7), pp. 309-320.
Ajan, S, (2015). Effects of Sales Promotion on Purchasing Decision of Customer: A Case
Study of Baskin Robbins Ice–Cream Franchise Thailand. Unpublished Thesis
Submitted to Bangkok University.
Akanbi, P., A. & Adeyeye, T., C. (2011). The Association between Advertising and Sales
Volume: A Case Study of Nigerian Bottling Company PlcAkanbi. Journal of
Emerging Trends in Economics and Management Sciences, 2(2), pp.117-123.
Aliata, V., L., Odondo, A., J., Aila, F., O., Ojera, P., B., Abongo, B., E., & Odera, O.
(2012). Influence of Promotional Strategies on Banks Performance.
International Journal of Business, Humanities and Technology, 2 (5), 169 -
178.
Alvarez. B. A., & Casielles, R. V. (2005). Consumer evaluations of sales promotion: The
effect on brand choice. European Journal of Marketing, 39(1), 54-70.
American Marketing Association (2010). Brand. Retrieved on 13th September 2017 from
http://www.marketingpower.com/_layout/dictiomary.aspx?dlema
American Marketing Organization (2008). Marketing mix. Retrieved on 9th February
from www.marketingpower.com.
Ames T. S., (2016). Effect of marketing strategies on performance of Small and
Medium Enterprises in Kitengela Township, Kajiado County. Unpublished
Thesis Submitted To KCA University School of Business and Public
Management
Amirhosein, P., & Zohre, D., (2013). The Effect of Marketing Strategy on Sales
Performance: The Moderating Effects of Internal and External Environment.
World Applied Sciences Journal, 26 (1): 28-33.
Ampuero, O, & Vila, N. (2006). "Consumer Perceptions of Product Packaging". Journal
of Consumer Marketing, 23 (2), pp 100-112.
Amusat, W., A., Adejumo, D., A., & Ajiboye, F., A. (2013). Sales promotion as an
antecedent of sales volume: A study of selected manufacturing industry In Ibadan,

58
South Western, Nigeria. Institute of Interdisciplinary Business Research, 4,
(11)
Anderson, J. C., & Narus, J. A. (2004). Business market management: Understanding,
creating, and delivering value. Upper Saddle River, New Jersey: Pearson
Education, Inc.
Andreas, H. (2008). Customer value-based pricing strategies: why companies resist.
Journal of Business Strategy, 29(4), 41-50.
Ardjouman, D., & Asma, B. (2015). Marketing Management Strategies Affecting
Performance of Enterprises (SMEs) in Cote d'Ivoire. International Journal of
Business and Social Science, 6(4), pp. 141-150
Armstrong, M. (2008). Strategic Human Resource Management. 4th Ed. Pennsylvania,
USA: Kogan Page
Arnold, M. J. & Tapp, S. R., (2001). The effects of direct marketing techniques on
performance: An application to arts organizations. Journal of Interactive
Marketing, 15(3), pp. 41-52.
Ashkan, Y., (2016). The Role of Advertisement in Sales Increase and Promotion: A
Case Study of Hamadan Province Insurance Companies. International Journal
of Innovative Research in Science, Engineering and Technology, 5, (4), pp 6319-
6326.
Ballantine, P., W., Jack, R., & Parsons, A., G. (2010). Atmospherics cues and their
effect on the hedonic retail experience. International Journal of Retail &
Distribution Management, 38, (8), p. 641-653.
Bamiduro, J., A. (2001). “An analysis of sales promotion on sales volume in the beverage
industry: The case study Nigeria Bottling Company Plc.” J. Intellect. Scient and
Cult. Interest. 10 (1):11-19.
Barnard, S., Kritzinger, B., & Krüger, J. (2011). Location decision strategies for
improving SMME business performance. ActaCommercii.
Berkowitz, E., N., Kerin, R., A., Hartley, S., W., & Rudelius, W. (2000). Marketing. 6th
Ed. Boston, USA: Irwin.

59
Berry, T. & Wilson, D. (2004). US SBA and Palo Alto Software. On Target: The Book on
Marketing Plans. 2nd Ed. USA, USA: Palo Alto Software Inc
Bingqun, C., Kejia, Y., & Tingjui, C. (2016). Analyzing the impact of price promotion
strategies on manufacturer sales performance. Journal of Service Science and
Management, 9, 182-187.
Bintu, M., (2017). Effects of Marketing Mix Strategy on Performance of Small Scale
Businesses in Maiduguri Metropolitan, Borno State Nigeria. Journal of
Marketing and Consumer Research.31.
Bitner., M., J. (1992). Sercivescapes: The impact of physical surroundings on customers
and employees. Journal of marketing, 56, 57-71.
Blattberg, R., C., & Neslin, S. (1990). Sales Promotion: Concepts, Methods, and
Strategies, Prentice‐Hall, Englewood Cliffs, NJ.
Bradley, D. (2000). "Lack of Financial and Location Planning Causes Small Business
Bankniptcy". University of Central Arkansas.
Brassington, F., & Pettitt, S. (2000). Principles of Marketing. 2nd Ed. Harlow Pearson
Education Limited
Chang, H., J., Eckman, M., & Yan, R - N. (2011). Application of the Stimulus
Organism Response model to the retail environment: the role of hedonic
motivation in impulse buying behavior. The International Review of Retia, 21
(3), pp 233-249
Chege, S., K., Muathe S., M., A, & Thuo. J., K. (2014). The effect of marketing
capabilities and distribution strategy on performance of MSP intermediary
organizations’ in Nairobi County, Kenya.
Cheruiyot, R., J., & Peter P., W. (2016). Integrated Marketing Communication and
Performance of Kenya Post and Savings Bank. Social Sciences; 5(3): 37-49
Chiang, K. W., Chhajed, D. & Hess, J. D., (2003). Direct marketing, Indirect Profits: A
Strategic Analysis of Dual-Chanel Supply-Chain Design. Management Science,
49(1), pp. 1- 20

60
Christian, H., Martin, K., Jens, S. (2010). Brand awareness in business markets: When is
it related to firm performance? Intern. J. of Research in Marketing, 27, pp.201-
212
Cooper, D. R., & Schindler, P. S. (2011). Business Research Methods.10thEd.New York,
NY: McGraw-Hill education
Cooper, D. R., & Schindler, P. S. (2014). Business Research Methods.12th Ed. New York,
NY: McGraw-Hill education.
Cooper, D., & Schindler, P. (2008). Business Research Methods.10th Ed . NewYork, NY
: Mcgraw-Hill.
Cui, K., Y., Tingjui C. (2016). Analyzing the Impact of Price Promotion Strategies on
Manufacturer Sales Performance. Journal of Service Science and Management, 9
(2), 182-187
Czinkota, M., R., & Ronkainen, I., A. (2004). International Marketing. 7th Edi, Ohio:
Harcourt. Inc.
Dangaiso, P., T. (2014). The effects of sales promotion strategies on company
performance: a case of Telone Zimbabwe. Unpublished Thesis Submitted to
Midland State University.
Dauda, A. (2015). Effect of advertising on the sales revenue and profitability of
selected food and beverages firms in Nigeria. Unpublished Thesis Submitted to
Ahmadu Bello University, Zaria
Dawes, J. (2004). Price changes and defection levels in a subscription-type market: can
an estimation model really predict defection levels? Journal of Services
Marketing, 18 (1), 35-44
De Run, E., C., & Jee, T., W. (2008). “Sales promotion preferences: techniques by
product type”, paper presented at the 3rd International Borneo Business
Conference, University of Malaysia Sabah (UMS), Malaysia.
Deborah, I., L. (2016). The effect of branding on organizational performance in the
retailing of pharmaceutical products, the mediating role of customer Service.
Kwame Nkrumah University.
61
Delgado, R., Bryden. R. & Zyontz., S. (2014). The detailed process and motivation are
explained in the “Methodology and Findings Report for a Cluster Mapping of
Related Sectors”. Retrieved on 10th September 2017 from
http://ec.europa.eu/enterprise/initiatives/cluster/observatory/index_en.htm
Deonir D., Gabriel. S., M., Evandro, B., S., & Fabia, L., (2017). Pricing strategies and
levels and their impact on corporate profitability. Revisit deAdministração, 52, pp,
120-133.
Dzisi, S., & Ofosu, D. (2014). Marketing strategies and the performance of
SMEs in Ghana. Marketing, 6(5), pp.102-111
Ebitu, E., T. (2016). Marketing strategies and the performance of small and medium
enterprises In AkwaIbom State, Nigeria. British Journal of Marketing Studies4
(5), pp.51-62
Edidijus, S., & Per Von E., C. (2015). The role of clusters in innovation and performance
of Small and Medium sized Technology Enterprises in Europe. Unpublished
thesis Submitted to Blekinge Institute of Technology.
Edward, S., T., W. (2013). “The influence of visual packaging design on perceived food
product quality, value, and brand preference”, International Journal of Retail
& Distribution Management, 41 (10), pp. 805-816.
Egle, C., & Maciejewska, M. (2012). The role of the perceived services cape in a
supermarket. The case of ICA MAXI. Unpublished Thesis Submitted to
Jönköping.
Engel, A., F. (2000). Promotional strategy. Homewood, McGraw Hill.
Eze, F., J., Odigo, Benedict E., & Ufot, J., A. (2015). The correlation between business
location and consumers patronage: Implications for business policy decisions.
British Journal of Economics, Management and Trade, 8(4): 294-304.
Feng, M. T., M. & Samson, D. (2007). Relationship of ISO: 2000 quality system
certification with operational and business performance: Survey in Australia
and New Zealand-based manufacturing and service firms. Journal of
Manufacturing Technology Management, 19 (1), pp. 22-3.

62
Ferrell. O., C. (2005). Marketing strategy. 3rd Ed. Mason, Ohio: South-Western
Thomson
Ferri, K., Mohd, R., Radiah, A., & Hamidreza, G., (2012). Impact of distribution channel
innovation on the performance of Small and Medium Enterprises. International
Business and Management, 5 (1), pp. 52-61.
Festus, W., (2016). The impact of sales promotion on organizational performance case
study of Guinness Ghana Breweries Limited. Unpublished Thesis Submitted To
Kwame Nkrumah University of Science
Flynn, B. B., Schroeder, R., G. & Sakakibara, S. (1994). ”A framework for quality
management research and an associated measurement instrument”, Journal of
Operations Management”, 54 (8), pp. 339-366.
Fox, E., J. Postre., S., & McLaughlin. A. (2007). The Impact of Retail Location on
Retailer Revenues: An Empirical Investigation. Unpublished Thesis Submitted to
Dallas: Southern Methodist University.
Fransisca, A., Tan, L., T., & Ruth, N., M., P., (2012). “The Impact of Brand Image,
Customer Loyalty with Customer Satisfaction as a Mediatorin Mcdonald’s”.
Petra Christian University.
Freeman, J., Styles, C., & Lawley, M. (2012). "Does firm location make a difference to
the export performance of SMEs?” International Marketing Review, 29 (1),
pp.88-113,
Fuerderer, R., Herrmann, A., & Wuebker, G. (2013). Optimal bundling: marketing
strategies for improving economic performance. Springer Science & Business
Media.
Füreder, R., Maier, Y., & Yaramova, A. (2014). Value-based pricing in Austrian
médium-sized companies. Strategic Management, 19(10), 13-19.
Gan, K., S. (2010). An Empirical Analysis: Advertising effects on firm performance in
the Malaysian consumer products sector. Unpunished Thesis Submitted to
University of Malaysia Sarawak
Gbolagade, A., Adesol, M., A., & Oyewale, I., O. (2013). Impact of Marketing Strategy
on Business Performance. A Study of Selected Small and Medium Enterprises

63
(SME’s) In OluyoleLocal Government, Ibadan, Nigeria. Journal of Business and
Management, 11(9), pp.59-66.
Ghouri, A. M., Khan, N. R., Malik, M. A. & Razzaq, A. (2011). Marketing practices
and their effects on firm’s performance: Findings from small and medium sized
catering and restaurants in Karachi. International Journal of Business and
Management, 6(5), 251-259.
Golder, P., N. & Tellis G., J. T., (2004). “Pioneer Advantage: Marketing Logic or
Marketing Legend?” Journal of Marketing Research, 30 (May), 158-170.
Gorchels, L., Marien, E., & West, C. (2004). The Manager's Guide to Distribution
Channels. USA, USA: McGraw-Hill.
Green, K., W., Inman, R.A., Birou, L.M. & Whitten, D. (2014). “Total JIT (T-JIT) and
its impact on supply chain competency and organizational performance”,
International Journal of Production Economics, 147 (1), pp. 125-135.
Gronroos, C. (2010). "From Marketing Mix to Relationship Marketing: Towards a
Paradigm Shift in Marketing", Management Decision, 32 (2), pp. 4-20.
Haghighinasab, M., Sattari, B., Ebrahimi, M., & Roghanian, P. (2013).Identification of
Innovative Marketing Strategies to Increase the Performance of SMEs in Iran.
International Journal of Fundamental Psychology & Social Sciences, 3(2), 26-30.
Hamed, M., & Farideddin, A., H. (2016). Effects of Promotion on Perceived Quality and
Repurchase Intention. International Journal of Scientific Management and
Development, 4 (12), pp 457-461.
Hansen, T, & Solgaard, H., S. (2004). New perspectives on retailing and store patronage
behavior: A study of the interface between retailers and consumers. Boston:
Kluwer Academic Publishers.
Harmon, R. & Raffo, D. (2007). Value-Based pricing for new software products:
strategy insights for developers.
Heck, R., K., Owen. A., J., & Rowe., B. (1995). Home based employment and family life.
1sted. USA, USA: Greenwood Publishing group.

64
Hinterhuber, A. (2008). “Customer value-based pricing strategies: why companies resist”.
Journal of Business Strategy, 29 (4), pp. 41-50.
Hiroki, U., & Ashok, K., M. (2011). Use of Direct Marketing Strategies by
Farmers and Their Impact on Farm Business Income. Agricultural and
Resource Economics Review 40/1, pp.1–19.
Hitt, M., A., & Hoskisson., R., E. (1997). International Diversification: Effects of
Innovation and Firm Performance in Product-Diversified Firms. Academy of
Management Journal, 767-798.
Holmes, G., R., & Paswan, A. (2012). “Consumer reaction to new package design”,
Journal of Product & Brand Management, 41 (10), pp. 1-22.
Horsky, S. & Honea, H., (2012). "The power of plain: intensifying product experience
with neutral aesthetic context", Marketing Letters, 23 (1), pp. 223-235.
Hünerberg, R., & Hüttmann, A. (2003). “Performance as a Basis for Price-setting in the
Capital Goods Industry: Concepts and Empirical Evidence”. European
Management Journal, 21 (6), pp.717-730.
Ibojo., B., O., & Ogunsiji, A., (2011). Effect of Sales Promotion as a Tool on
Organizational Performance: A case Study of Sunshine Plastic Company. Journal
of Emerging Trends in Economics and Management Sciences, 2(1), pp.9-13.
Immonen, L., (2010). Package Cues and Their Influence on the Perception of
Premium Quality of Premium Private Label Products. Unpublished Thesis
Submitted to Aalto University.
Ingenbleek, P., Debruyne, M., Frambach, R. & Verhallen, T. (2003). “Successful new
product pricing practices: a contingency approach”, Marketing Letters, 14 (4),
pp. 289‐305.
Inman, J. J., Winer, R. S., & Ferraro, R. (2009). ‘The interplay among category
characteristics, customer characteristics, and customer activities on in-store
decision making’, Journal of Marketing, 73, pp.19–29.
Jain, S., C. (2004). Marketing Strategy: Planning: Implementation and Control. 7th Ed.
Mason, Ohio: Thomson Custom Publishing.

65
Jebungei, Y., J., (2014). Influence of Advertising on Organizational Performance of
Cosmetic Manufacturing Firms in Kenya. Unpunished thesis Submitted to
University of Nairobi.
Jim. R. (2012). Pricing strategies-penetration pricing. Retrieved on 14th October 2017
form http://www.tutor2u.net/business/marketing/pricing_strategy_penetration.asp.
Joshi, S., Prabhu, S., & Chirputkar, A., (2016). Impact of Advertising and Sales
Promotion Expenses on the Sales Performance of Indian Telecommunication
Companies. Indian Journal of Science and Technology, 9(46).
Kalemb. A. (2015). Contribution of branding in enhancing performance of tourism
sector in Rwanda. Unpublished Thesis Submitted to Jomo Kenyatta University
of Agriculture and Technology.
Kamba. A., K. (2010). Effectiveness of promotion mix methods on sales in local
pharmaceutical manufacturing companies in Kenya. Unpublished Thesis
Submitted to University of Nairobi.
Kamotho, J., W. (2011). Influence of packaging and labeling on consumer perception of
hair care products quality. Unpublished Thesis Submitted to University of
Nairobi.
Kanoga, S., (2016). Influence of marketing mix dimensions on performance of
shopping malls in Nairobi City County Kenya. Unpublished Thesis Submitted to
Kenyatta University.
Kariithi, R., (2015). The Influence of marketing strategies on growth of small and
medium business in Air Travel Agencies in Nairobi County in Kenya.
Unpublished Thesis Submitted to University of Nairobi.
Kariuki, B., K. (2012). The influence of interior design on business performance: The
case of selected restaurants in Nairobi Central Business District, Kenya.
Unpublished Thesis Submitted to University of Nairobi.
Keramati, A., Ardalan, A., & Ashtiani, P. G. (2012). Relationship between marketing
mix and sales performance In the context of the Iranian Steel private firms.
International Journal of Arts and Commerce, 1(6), 195-199.

66
Kim, H. B., Kim, W., G., & Jeong, A. (2003). The Effect of consumer-based brand
equity on firm’s financial performance. Journal of Consumer Marketing, 20(4),
335-351.
Kiprotich. L., K. (2012). Effects of 4ps Marketing Mix on Sales Performance of
Automotive Fuels of Selected Service Stations in Nakuru Town.
Koh, Y, Lee, S, & Boo, S (2009). ‘Impact of brand recognition and brand
reputation on firm performance: U.S. based multinational restaurant
companies’ perspective’, International Journal of Hospitality Management,
28, pp. 620-63.
Kopalle, P., Mela, F., Carl. & Marsh., L. (1999). The dynamic effect of discounting on
sales: Empirical Analysis and Normative Pricing Implications. Marketing
Science, 18 (3), pp 333-351.
Kothari, C. R. (2004). Research Methodology: Methods and Techniques. 2nd Ed. USA,
USA. New Age International Publishers.
Kotler, P, & Armstrong, G. (2004). Principles of marketing.10th Ed. Upper Saddle
River, New Jersey, New Jersey: Pearson Education.
Kotler, P. (2003). Marketing Management. Principles of Marketing. 11th Ed. Chicago,
USA Pearson/Prentice Hall.
Kotler, P. (2015). Marketing Management.15th ed. NJ, PH: Pearson Education
Kotler, P., & Armstrong, G (1999). Principles of Marketing. 8th Ed. Chicago, USA
Pearson/Prentice Hall.
Kotler, P., & Armstrong, G (2010). Principle of Marketing. 13th Ed. Pennsylvania,
USA: Prentice Hall.
Kotler, P., (2000). Marketing Management. Millennium Edition.. New Jersey, New
Jersey: Prentice Hall.
Kotler. P., & Armstrong., G (2012). Principles of Marketing.14thEd.USA, USA: Pearson
Hall.
Kotler. P., & Armstrong., G (2008). Principles of Marketing. International Edition. New
York, USA: Pearson Hall.

67
Kotler. P & Lee N., (2007). Marketing in the Public Sector: A Roadmap for
Improved Performance. Upper saddle; New Jersey: Pearson/Prentice Hall.
Kotler. P., & Armstrong., G (2013). Principles of Marketing.15thEd.USA, USA: Pearson
Hall.
Kotler. P., Armstrong., G., Wong, V., & Saunders J. (2008). Principles of Marketing.
5th Ed. Prentice Hall.
Lamb, C., W., Hair, J., F., & Mcdaniel, C. (2004). Marketing; 7th Ed, Mason, OH:
Cengage.
Langat, N., (2016). Influence of product, price, promotion and place on enterprise project
performance: A case of Safaricom enterprise project, UasinGishu County, Kenya.
Unpublished Thesis Submitted to University on Nairobi.
Laswai, M., E. (2013). Assessment of the effectiveness of channels of distribution models
in the sales performance of an organization: The Case of Coca-Cola Morogoro
Region. Unpublished Thesis Submitted to Mzumbe University.
Lawson, J. (2008), “The search for the SCV”, Database Marketing, pp. 13‐14.
Lemmink, J., & Kasper, H. (1994). "Competitive Reactions to Product Quality
Improvements in Industrial Markets". European Journal of Marketing, 28 (12) pp.
50 –68.
Leong, S. P. (1998). The impact of product packaging on consumer attitude and
moderating the effect of involvement. Unpublished Thesis Submitted to
University of Putra, Malaysia.
Levy, M., & Weitz, B., A. (2009). Retailing Management. 7th ed., Boston, USA: Irwin.
Liban. O., S. (2015). The Impact of Advertisement on Sales: Case Study in Some
Selected Telecommunication Companies in Somalia. European Journal of
Business and Management, 7, (36), pp.49-55.
Liozu, S., M., & Hinterhuber, A. (2013). “Pricing orientation, pricing capabilities, and
firm performance”. Management Decision, .51 (3). pp. 594-614.
Louter, P., J., Ouwerkerk, C., & Bakker, B., A. (1991). “An inquiry into successful
exporting”. European Journal of Marketing, .25 (6), pp. 7‐23.

68
Magunga. A., K. (2010). Effects of marketing strategies on the performance of insurance
companies in Kenya. Unpublished Thesis Submitted to University of Nairobi.
Mahmood, M., H., & Fatimah, H., (2014). The Effect of Product Quality on Business
Performance in Some Arab Companies. Journal of Emerging Trends in
Economics and Management Sciences 5(5):498-508.
Marn, M., V., Eric V. R., & Craig C. Z. (2003). “Pricing New Products,” The McKinsey
Quarterly, 3 (July), 40-49.
Martínez, R., P., Mollá, D., Gómez, B., A., & Rojo, Á. L. (2006). Evaluating
temporary retail price discounts using semi parametric regression. Journal of
Product & Brand Management, 15 (1), 73 -80.
Matan F., A. (2016). Strategic Planning in the Banking Sector: A Case of Co-Operative
Bank. Unpublished Thesis Submitted to United States International University.
Mathiu, J., M. (2016). The effect of services cape on sales in the hotel industry: A case
study of Nairobi Serena Hotel. International Journal of Entrepreneurship and
Project Management. 1, (2), pp 160-177.
Mei, T., G. (2013). Brand Identity, Brand Equity and Performance. World Review of
Business Research, 3 (4), pp.53 –60.
Mogire, O., A. (2015). Agglomeration and performance of Retail Micro-Enterprises in
Kenya. Unpublished Thesis Submitted to University of Nairobi.
Morrison, M., G., Dubelaar, C., & Oppewal, H. (2011). In-store music and aroma
influences on shopper behavior and satisfaction. Journal of Business Research,
64, p.558-564.
Mowen, J, C., & Minor. M, S (2004). Consumer Behavior: A framework; Pearson
Education Asia Limited and Tsingnua University Press Belging.
Muchiri, M., N. (2016). The Effectiveness of Marketing Mix Strategies on performance
of Kenol Kobil Limited. Unpublished Thesis Submitted to University of Nairobi.
Muchohi, J. (2015). Marketing mix strategies adopted by tennis affiliated organizations to
enhance competitiveness. A study of Nairobi county, Kenya. Unpublished Thesis
Submitted to University of Nairobi.

69
Mugenda, O., & Mugenda, G. (2003). Research Methods: Qualitative and Quantitative
Approaches. Nairobi: Acts Press.
Mukorombindo, B. R. (2014). The impact of direct marketing on sales performance: The
case of seed potato co-op. Unpublished Thesis Submitted to University of
Zimbabwe.
Mullin, R. (2010). ‘Sales promotion’. 5th Ed. Britain, Britain, Britain: KoganPage.
Mullin, R., & Cummins, J. (2008). Sales Promotion: How to Create, Implement &
Integrate Campaigns That Really Work, 4th Edition, , London, , London: Kogan
Page Ltd.
Mullins, J., Walker, O., C., & Boyd, H., W (2012). Marketing Management: A Strategic
Decision-Making Approach. 6th Ed. New York, New York: McGraw-Hill.
Munyole, P., N (2015). Marketing strategies adopted by veterinary pharmaceutical firms
in Kenya to enhance performance. Unpublished Thesis Submitted to University of
Nairobi.
Musa, W. (2003). Fool-Proof Marketing, Canada: John Wiley & Sons, Inc.
Musibau, A., Choi, S., L., & Oluyinka, S., (2014). The impact of sales promotion and
product branding on company performance: A case study of AIICO Insurance
Nigerian PLC. International Conference on Innovation, Management and
Technology Research, 129, pp.164-171.
Muthengi (2015). The effects of marketing strategies on sales of Commercial Banks in
Kenya. Unpublished Thesis Submitted to Nairobi University.
Nagel, S & Singlton., J., Kenneth (2011). Estimation and Evaluation of Conditional
Asset Pricing Models. Journal of Finance, 66 (3), pp. 873-909.
Nagle, T. T., & Holden, R. K. (2002).The Strategy and Tactics of Pricing. 4th Ed. Upper
Saddle River, NJ: Pearson Education Inc.
Nagle, T., & John E. H., (2006).The Strategy and Tactics of Pricing: A Guide to
Growing More Profitably.5th Ed. Upper Saddle River, New Jersey: Prentice Hall.

70
Nana. Y., Dufie O., Gloria K., Q, Kwamena, M., N. (2011). The Effect of Marketing
Communications on the Sales Performance of Ghana Telecom (Vodafone,
Ghana).International Journal of Marketing Studies 3 (4).
Nashwan, M., A., S. (2015). How does Marketing Strategy Influence Firm
Performance? Implementation of Marketing Strategy for Firm Success.
International Journal of Innovation and Economic Development, 1, (3), pp 7-
15.
Nelson, O., N., & Chiew, T., M, (2005)."Customers behavioral responses to sales
promotion: the role of fear of losing face", Asia Pacific Journal of Marketing and
Logistics, 17 (1), pp.32-49.
Nguyen, D., McCracken, V., Casavant, K. & Jessup, E. (2011). Geographic
location, ownership and profitability of Washington log trucking companies.
Regional Science Policy & Practice, 3 (2) 115–125.
Nirusa, S. (2017). The mediating role of perceived product quality: The analysis of
relationship between organizational capability and customer value. International
Journal of Management and Applied Science, 3, (1), pp. 131-134.
Njawa, J. (2015). The effects of advertising on organizational performance: A case
Study of TIGO Telecommunication Network Junior. Unpublished Thesis
Submitted to Mzumbe University.
Njomo G., W., & Margaret O. (2016). Market Penetration Strategies and Organizational
Growth: A Case of Soft Drink. International Journal of Management and
Commerce Innovations 3 (2), pp 219-227.
Obonyo, G., O. (2013). Evaluating marketing strategies adopted by supermarkets for
competitive edge: A case of Kisii town supermarkets. Interdisciplinary Journal of
Contemporary Research in Business, 4 (12), pp.15-40.
Odhiambo, M. (2013). Effect of pricing as a Competitive Strategy on Sales
Performance of Selected Pharmaceutical Companies. Unpublished Thesis
Submitted to University of Nairobi.

71
Oktaviyanti, D., Masyhuri, M., & Mulyo, J. H. (2015). Analysis of marketing mix and
sales performance of “IndustriHilirTehWalini” Product. Agro Ekonomi, 26(2),
168-178.
Oladun, M., M. (2012). Innovative distribution strategies and performance of selected
multinational corporations (MNCs) and domestic manufacturingfirms In
Nigeria. Unpublished Thesis Submitted to Covenant University, Ota, and Ogun
State, Nigeria.
Oliver, W., Falk, V., Westarp, W., & Gang, K., (2001). Pricing in network effort
markets. Goethe University MertonsrtGermang.
Olusegun, O. A. (2006). Branding and Advertising. Journal of Public Relations and
Marketing, 8 (2), pg.37.
Omotayo, A., & Adegbuyi, A., (2015). Strategic roles of branding on organization sales
performance. International Journal of Current Research, 7 (12), pp.23835-23841.
Osman, S., Chan, Y. F., & Foon, Y. S. (2011). Simulation of Sales Promotions
towards Buying Behavior among University students. International Journal
of Marketing Studies 3 (3), 78-83.
Oso, B. (2009). The Survey Research Handbook, 2nd Ed. US, Chicago: Irwin.
Osogbo, R. (2014). “Effects of Advertising on Organizational Profitability”, Journal
of Management and Social Sciences, 3(1), pp. 67-7
Owomoyela S., K, Oyeniyi K., O., & Ola, O., S., (2013). Investigating the impact
of marketing mix elements on consumer loyalty: An empirical study on
Nigerian Breweries Plc. Interdisciplinary Journal of Contemporary Research in
Business. 4 (11), pp.485 –496.
Oyedepo, T. Okorie, N., & Akhidenor, G. (2012). The dysfunctional and functional
effect of celebrity endorsement on brand patronage. Online Journal of
Communication and Media Technologies 2 (2).
Oyewale, V. (2013). Impacts of marketing strategy on business performance, a
study of selected small and medium enterprises (SMES) in Oluyede local
government, Ibadan, Kenya. Journal of Business and Management, 11 (4), pp.
59-66.
72
Palmer, A. (2010). Introduction to Marketing. 3rd Ed. UK, UK: Oxford University
Press.
Palmer, A. (2011). Principles of Services Marketing (3rd Ed.). UK: McGraw-Hill
Publishing Company.
Park, C., W, Eisingerich, A.,B, Pol, G, & Park, J.,W (2012).‘ The role of brand
logos in firm performance’. Journal of Business Research, pp.1-23.
Parsons, A., G., Ballantine, P., W., & Jack, R., (2010). "Atmospheric cues and their effect
on the hedonic retail experience". International Journal of Retail & Distribution
Management, 38 (8,) pp.641-653.
Perminus, K., N., & Wilson. M., (2017). Effect of penetration pricing strategy on the
profitability of insurance firms in Kenya. International Journal of Finance and
Accounting, 2, (6), pp 93 – 106.
Piercy, N., F., Cravens, D., W., & Lane, N. (2010). Thinking strategically about pricing
decisions. Journal of Business Strategy, 31 (5). pp. 38-48.
Poh, L., S., Ghazali, M., & Mohayidin, B. (2011). Dimension of Price Satisfaction:
A Study in the Low Cost Airlines Industry. Second International
Conference on Business and Economic Research.pp:1806-1812.
Polit, D., F., Beck, C., T., & Hungler, B., P. (2001). Essentials of Nursing Research:
Methods, Appraisal and Utilization. 5th Ed. New York, New York: Lippincott.
Renart, I., A. (2007). Marketing strategy: Taxonomy and frameworks‟, European
Business Review, 18, pp. 266–293.
Revino E. W., Silvya, L., M., & Christoffel, K, (2015). The effect of distribution
channel sales volume in Pt.Varia Indah Paramitha Manado. Retrieved on
15the Octoberfromhttps://media.neliti.com/media/publications/2610-ID-the-effect-of-
distributiochannel-sales-volume-in-ptvaria-indah-paramitha-manad.pdf.
Rizwan, R., A., Vishnu. P., & Muhammad, A., A. (2014). Impact of Product Packaging
on Consumer’s Buying Behavior. European Journal of Scientific Research 120
(2): 145-157.

73
Rodriguez, M, Peterson, P, & Vijaykumar, K. (2012). Social Media’s Influence on
Business-to-Business Sales Performance, Journal of Personal Selling & Sales
Management, 32:3, pp.365-378.
Rust, R., T., & Oliver, R., L. (1994).Service Quality: Insights and Managerial
Implications from the Frontier. Service Quality: New Directions in Theory and
Practice. 1st Ed. Thousand Oaks, CA: Sage Publishers.
Saeed, R., Lodhi, R., N., Rauf, A., Rana, M., I., Mahmood, Z., & Ahmed, N.,
(2013). Impact of Labeling on Customer Buying Behavior in Sahiwal, Pakistan.
World Applied Sciences Journal, 24 (9): 1250-1254.
Saguti. J., F. (2015). The effects of marketing mix on sales performance of Tigo
Telecommunication Company in Tanzania. Unpublished Thesis Submitted to
Muzumbe University Dar-es-salaam.
Sansoni, J, Duncan C, Grootemaat, P, Samsa, P, Capell, J, & Westera A. (2014). Younger
onset dementia: a literature review Woollongong, Australia: Australian Health
Service Research Institute.
Schäder, G. (2006). Prissättning. BonnierUtbildning, Halmstad
Schiele, H. (2008). Location, location: The geography of industry clusters. Journal of
Business Strategy 29: 29–36.
Schiffman, L., G., & Kanuk, L., L (2004). Consumer Behavior. 8th Ed. New Delhi,
India: Pearson Education.
Schnabl., G., Mckinnon, R. (2006). China’s exchange rate and international adjustment in
wages, prices, And Interest rates: Japan Déjà Vu? Cesifo Working Paper No. 1720
Schoviah, A. (2012). The effect of marketing distribution channel strategies on a firm’s
performance among Commercial Banks in Kenya. Unpublished Thesis
Submitted to University of Nairobi.
Sehrawet, M. & Kundu, S.C. (2007). “Buying behavior of rural and urban consumers in
India: the impact of packaging”, International Journal of Consumer Studies, 31
(6), pp. 630- 638.

74
Sekaran, U., & Bougie, R. (2010). Research Methods for Business: A Skill-Building
Approach. 5thEd. London, UK: John Wiley and Sons.
Sekaran, U., & Bougie, R. (2013). Research Methods for Business: A Skill-Building
Approach. 6thEd. London, UK: John Wiley and Sons.
Shajahan, S. (2008). Marketing Reasearch Concepts & Practices in India, Macmillan.
Shankar, C., & Chin, K., K. (2011). A study of the relationship between marketing mix
and customer retention for herbal coffee in Malaysia 2nd International Conference
on Business and Economic Research (2011) Proceeding.
Shimp, A., T. (2008). Advertising, Promotion, and Other Aspects of Integrated
Marketing Communications, 7th Ed, South-Western College Pub, pp 444-479
Sije, A., & Oloko. M., (2013). penetration pricing strategy and performance of
small and medium enterprises in Kenya. European Journal of Business and
Social Sciences, 2, (9), pp 114-123.
Silayoi, P. & Speece, M. (2007). “The importance of packaging attributes: a
conjoint analysis approach”, European Journal of Marketing, 41 (11/12), pp.
1495-1517.
Simonson, I. & Winer, R. S. (1999). “The influence of purchase quantity and display
format on consumer preference for variety”, Journal of Consumer Research, 19
(1), pp.133-138.
Srini S., Srinivasan, S. S., and Anderson, R. E. (2000). Concepts and strategy
guidelines for designing value enhancing sales promotions. Journal of
Product & Brand Management, 7, 5, 410-420.
Syeda, N., Zehra, R., & Sadia, M. (2011). Impact of Sales Promotion on Organizations’
Profitability and Consumer’s Perception in Pakistan. Interdisciplinary Journal of
Contemporary Research in Business 3, (5), pp. 296-310.
Szymanski, M., & David H., (2001). "Customer Satisfaction: A Meta-Analysis of the
Empirical Evidence," Journal of the Academy of Marketing Science, 29 (1), 16-
35.

75
Tandoh. I., & Sarpong, L. (2015). The Impact of Sales Promotions on the Performance
of Auto-Mobile Industries in Ghana: A Case Study of PHC Motors (Accra-
Ghana).European Journal of Business and Management, 7, (11), pp170-194.
Thuy, T., N., & Chi. T., K. (2015). Factors influencing customer perceived quality
and purchase intention toward private labels in the Vietnam Market: The
Moderating Effects of Store Image. International Journal of Marketing
Studies; 7 (4), pp51-63.
Tsai, H, Cheung, C & Lo, A (2010). ‘An exploratory study of the relationship between
customer-based casino brand equity and firm performance’. International Journal
of Hospitality Management, 29, pp. 754-757.
Tustin, D., H., Ligthelm, A. A., Martins, J. H., & Van Week, H. D. J. (2005).
Marketing research in practice. Pretoria, South Africa: Unisa Press.
Vikas, V. (2011).Pros and Cons of Penetration Pricing Strategies.
Vorhies, D. W., Morgan, R. E., & Autry, C. W. (2009). Product-market strategy and the
marketing capabilities of the firm: impact on market effectiveness and cash flow
performance. Strategic Management Journal, 30(12), 1310-1334.
Wang, G., L., Yu-Je., W., M., & Chang, L., Y. (2012). ‘The influence of knowledge
management and brand equity on marketing performance: A case study of a
Japanese automaker’s branch in Taiwan’. Journal of Business Research, 4 (2), pp.
30-51.
Wawira, P., L. (2016). Marketing strategies and performance of large hotels in Nairobi
County. Unpublished Thesis Submitted to University of Nairobi.
Wed., S., (2016). The Impact of Brand Identity on Customer Loyalty and Sales
Performance in Local Companies. Unpublished Thesis Submitted to Effat
University.
Wisdom, E., (2015). The impact of e-marketing on business performance: A case study of
the Midlands Meander Association members. Unpublished Thesis Submitted to
Durban University of Technology.
Wren, B. M (2007). “Channel Structure and Strategic Choice in Distribution
Channels”, Journal of Management Research, 7 (2), pp.78-86.

76
Yeshin, T. (2006). Sales Promotion, P71, Thompson.
Yi, Z. (2015). “The Impact of Brand Image on Consumer Behavior: A Literature
Review” Open Journal of Business and Management, Jinan University, China.
Zeithaml, V. A. (1988). Consumer perceptions of price, quality and value: A means- end
model and synthesis of evidence. Journal of Marketing, 52(3), 2-22.
Zeithaml, V., A., Bitner, M., J., & Gremler, D., D. (2009). Services Marketing:
Integrating Customer Focus across the Firm. 6th Ed. Boston, MA:
McGrawHill/Irwin,
Zhang, L., & Tang S., (2010). An Empirical Study on Impact of Sales Promotion on
Brand Loyalty of Service Enterprise. Management and Service Science (MASS),
International Conference on24-26 Aug.
Zikmund, W., & Babin, B. (2012). Business Research Methods: London, UK: Cengage
Learning.
Zulfiqar, A., & Bala, B. (2016). Basic statistical tools in research and data analysis.
Indian Journal of Anaesthesia, 60(9): 662–669.

77
APPENDIX I: QUESTIONNAIRE
EFFECTS OF MARKETING MIX ON SALES PERFORMANCE: A CASE OF
UNGA FEEDS LIMITED
This questionnaire assists in data collection for academic purpose. The research intends to
give an analysis of the effect of product, price, place and promotion on sales performance.
All information obtained will be handled with high level of confidentiality. Please do not
incorporate identification or names in this questionnaire.
Please answer every question by using either a cross(x) or tick (√) in the option that
applies.
SECTION A: RESPONDENT´S PROFILE
Please tick the most appropriate answer (√/x)
Age 25 and below
26-30yrs
31-35yrs
36-39yrs
Above 40yrs
Gender: Male Female
Marital status: Married Single Widowed Divorced
Number of years worked in the organization
Less than one year 2-5 years 6-10 years above 11 years
Which is your highest education level?
Certificate Diploma Degree Masters PhD
Which department of the organization do you work in?

78
Marketing Finance Production
SECTION B: Relationship between Product and Sales Performance
Please indicate your opinion as per the level of disagreement or agreement with the
outline statement using 1 to 5 scale guideline. 5= Strongly Agree 2- Agree, 3= Neutral, 4
=Disagree, 1= Strongly Disagree
PRODUCT
Str
ongly
Agre
eaA
a
Dis
agre
e D
isag
ree
Neu
tral
Agre
e
Str
ongly
Agre
e
1 Product quality has a positive impact on sales performance
2 Product appearance, smell, flavour does not affect sales
volume
3 Package designs increases product visibility and
recognition
4 Packaging influence consumer-perceived product quality
5 Product perceived quality does not influence purchase
intention
6 Branding does not influences firm performance
7 Company’s brand image, and loyalty has an influence on
profitability of a company
8 Packaging is used to attract attention
9 Packaging used by Unga Ltd describes the product and its
use
10 Brand awareness influence on organizational performance

79
SECTION C: Relationship between Price and Sales Performance
Please indicate your opinion as per the level of disagreement or agreement with the
outline statement using 1 to 5 scale guideline. 5= Strongly Agree 2- Agree, 3= Neutral, 4
=Disagree, 1= Strongly Disagree
PRICE
Str
ongly
Dis
agre
e
Dis
agre
e
Neu
tral
Agre
e
Str
ongly
Agre
e
1 Use of pricing strategy has increased sales volume
2 Value-based pricing has a positive impact on
profitability
3 Use of penetration pricing influences customer
purchase
4 Price penetration has a positive effect on growth and
performance of organization
5 Price promotion strategies does not affect sales
performance
6 Use of price discount influences sales performance
7 Unga Ltd offer products in lower prices market
segments
8 Unga Ltd use penetration pricing to increase product
adoption
9 Price promotion has a significant impact on
perceived product quality
10 Unga Ltd uses price discounts, free samples, bonus
packs

80
SECTION D: Relationship between Place and Sales Performance
Please indicate your opinion as per the level of disagreement or agreement with the
outline statement using 1 to 5 scale guideline. 5= Strongly Agree 2- Agree, 3= Neutral, 4
=Disagree, 1= Strongly Disagree
PLACE
Str
ongly
Dis
agre
e D
isag
ree
Neu
tral
Agre
e
Str
ongly
Agre
e
1 Use of distribution channels influences sales and profit
2 Geographic location has a significant influence on
profitability
3 Close location of organizations selling similar products
affects performance
4 Store design has a positive effect on consumer purchase
and sales volume
5 Music, appealing colors, lighting influences business
performance
6 Physical surrounding such as finishing, good working
environment, and aroma does not have any effect on sales
7 use of distribution channels influences product availability
8 Use of attractive stimuli such as music has an influence on
customers
9 Distribution channels located in urban areas generate more
returns than those in rural areas
10 Location of retail stores far from customers has a negative
effect on their purchase intention
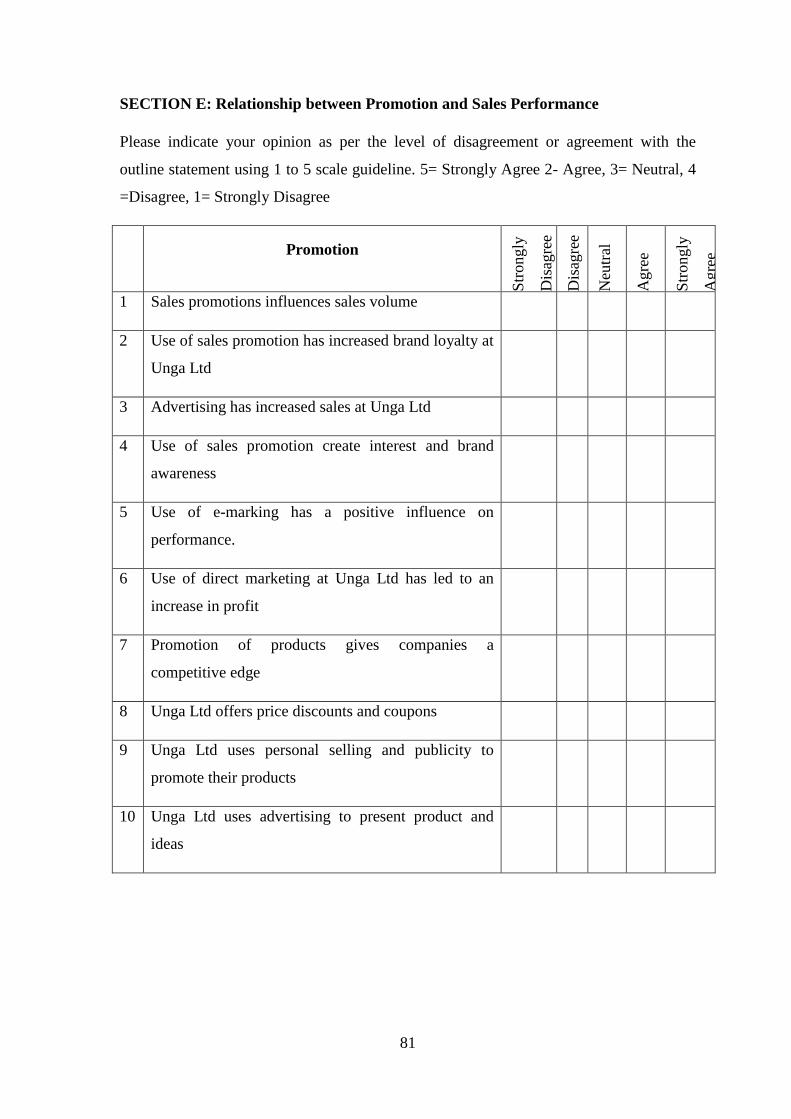
81
SECTION E: Relationship between Promotion and Sales Performance
Please indicate your opinion as per the level of disagreement or agreement with the
outline statement using 1 to 5 scale guideline. 5= Strongly Agree 2- Agree, 3= Neutral, 4
=Disagree, 1= Strongly Disagree
Promotion
Str
ongly
Dis
agre
e
Dis
agre
e
Neu
tral
Agre
e
Str
ongly
Agre
e
1 Sales promotions influences sales volume
2 Use of sales promotion has increased brand loyalty at
Unga Ltd
3 Advertising has increased sales at Unga Ltd
4 Use of sales promotion create interest and brand
awareness
5 Use of e-marking has a positive influence on
performance.
6 Use of direct marketing at Unga Ltd has led to an
increase in profit
7 Promotion of products gives companies a
competitive edge
8 Unga Ltd offers price discounts and coupons
9 Unga Ltd uses personal selling and publicity to
promote their products
10 Unga Ltd uses advertising to present product and
ideas

82
SECTION F: Sales Performance
Please indicate your opinion as per the level of disagreement or agreement with the
outline statement using 1 to 5 scale guideline. 5= Strongly Agree 2- Agree, 3= Neutral, 4
=Disagree, 1= Strongly Disagree
Sales Performance
Str
ongly
Dis
agre
e
Dis
agre
e
Neu
tral
Agre
e
Str
ongly
Agre
e
1
.
Pricing influences sales volume
2
.
Our product has influenced customer loyalty
3 Our Place strategy has influenced quick distribution of
our products
4 Use of promotion strategy has increased our business
performance