Embed Size (px)
Citation preview

1
Compensation and Peer Effects in Competing Sales Teams Tat Y. Chan, Jia Li, and Lamar Pierce1
Olin Business School Washington University in St. Louis
Campus Box 1133, One Brookings Drive Saint Louis, MO 63130
February 9, 2009
Abstract. The personnel economics literature has established that co-located workers significantly impact one another’s productivity. Recent work empirically demonstrates peer effects in single-firm work settings under one compensation structure, but these studies leave important questions unanswered. First, the direction and magnitude of peer effects may depend on incentives from the firm’s compensation system. Second, peer effects may extend beyond firm boundaries to inter-firm competition, with individual productivity also influenced by peers outside the firm. Third, under these pressures workers may employ various strategies at their discretion to compete with co-located peers. We address these questions using a three-year dataset of Chinese cosmetic sales transactions, examining how compensation and firm boundaries influence worker productivity spillovers and competition strategies. We use a nested non-linear least squares algorithm to simultaneously estimate permanent worker productivity and the same-day peer effect on concurrently-scheduled salespeople’s revenue, unit sales, discounting, and customer and product mix. We demonstrate three important new sets of findings. First, we find that under the individual-based compensation system the direction and magnitude of peer effects significantly differ from those under the team-based compensation system. Second, we find that peer effects exist across firm boundaries, with high-ability peers at competing counters hurting productivity more heavily for workers at individual compensation counters. Third, we find that workers at individual compensation counters respond to high-ability peers within and across counters by discounting prices and focusing on high-valued customers and products. This paper provides a unique contribution to the personnel economics and marketing literature by being the first to simultaneously estimate peer productivity spillovers both within and across firms under multiple compensation systems. It also first identifies peer effects under discretionary pricing, and provides important implications for managerial decisions on staffing, compensation, location, and pricing discretion. Finally, the paper implements improved methodology that generates more efficient estimators than those in previous productivity spillover studies.
1 Tat Y. Chan is Associate Professor of Marketing, Jia Li is a doctoral student in Marketing, and Lamar Pierce is
Assistant Professor of Strategy, all at Olin Business School, Washington University in St. Louis. Authors can be
reached at [email protected], [email protected], or [email protected].
2
1. Introduction
Co-located workers can significantly impact one another’s productivity. These
productivity spillovers may be positive, as coordination improves each worker’s production
through knowledge transfer (Marshall 1890; Lucas 1988) and complementarities in skills and
abilities (Gant, Ichniowski, and Shaw 2002; 2003; Hamilton, Nickerson, and Owan 2003).
Alternatively, workers may negatively impact their peers, either through the reduced effort of
free-riding (Holmstrom 1979) or by imposing production externalities on their coworkers
(Holmstrom 1982). Co-located workers have even more significant impact on their peers when
they directly compete with one another under the high-powered incentives of pay-for-
performance or tournament-based compensation. Workers may use social pressure or norms to
reduce negative peer effects (Kandel and Lazear 1992; Mas and Moretti 2009), but these are
unlikely to countervail the high-powered incentives of competition. The many ways in which
workers can affect peer productivity provide a simple yet powerful implication – whom you
work with matters.
While recent work has empirically demonstrated peer effects in work settings (Falk and
Ichino 2006; Bandiera, Barankay, and Rasule 2007; Mas and Moretti 2009), it has done so
exclusively within firms or groups and under singular compensation structure. While this
research shows that the quality of peers influences worker behavior, these findings leave several
important questions unanswered. First, the direction and magnitude of peer effects may be
critically linked to the compensation system used by the firm and the incentives it provides to
workers. Second, the importance of peer effects may extend beyond the boundaries of the firm
to competition with other organizations. Where workers from different firms are co-located,
individual productivity may be influenced not only by workers from within the firm, but also by

3
peers from the outside. Finally, under these peer pressures workers may actively employ various
strategies at their discretion to compete with other co-located workers.
In this paper we examine an empirical setting where peer effects extend across the
boundaries of the firms with different compensation systems – cosmetic sales in a Chinese
department store. In this setting, which is similar to sales environments in many industries,
multiple manufacturers employ salespeople to work at co-located counters on the retail floor.
These brand-based counters compete for customers inside the department store, with some
employing team-based compensation (TC) and others individual commissions (IC). Therefore,
while some salespeople work as a team to compete against “outside” peers from other counters,
others must also compete with the “inside” peers at their own counter. In this sales setting, each
peer, whether within or outside the firm boundary, has a potential impact on a given agent’s
productivity. Salespeople use inherent skill, effort, and discretionary pricing to compete with
competitors inside and outside the firm.
We use a detailed three-year dataset of individual sales transactions to identify how
compensation structure and firm boundaries influence productivity spillovers across workers.
These data identify individual salesperson, prices, products, and time for each transaction of this
period, allowing us to observe real-time productivity and pricing strategies for 61 workers in 11
brand-based counters. This level of detail allows us to build a simultaneous equation system to
study in each period how any worker’s temporal productivity is influenced by the set of peers
within and outside counters working at that time. Our model allows these peer effects to depend
on the compensation systems adopted by own counter and competing counters. We use a nested
non-linear least squares algorithm to simultaneously estimate permanent worker productivity and
the same-day peer effect on concurrently-scheduled salespeople’s revenue, unit sales,

4
discounting, and customer and product mix. This method allows us to study the complicated
within-counter and cross-counter peer effects that depend on the compensation systems of both
the focal worker and her peers, and generate estimators that are more efficient than the two-step
estimators adopted in previous studies.
While our results confirm previous studies showing productivity spillovers to co-workers,
we demonstrate three important new sets of findings. First, we find that the direction and
magnitude of peer effects depend on compensation system. We find strong evidence that IC
counters produce negative peer effects among employees, as salespeople compete against one
another for customers. In contrast, we identify positive though small peer effects within TC
counters, suggesting high-productivity peers may improve worker productivity through
coordination. Second, we find that peer effects exist across firm boundaries in sales competition.
High-ability peers at competing counters hurt worker productivity, as those peers outcompete for
customers and sales. We also find this effect to greatly depend on compensation system. High-
ability workers at IC counters have much less effect on outside peers, since they focus much of
their effort on inside peers. In contrast, high-ability workers at TC counters have dramatic
effects on their outside peers, as they can exert the entirety of their effort toward cross-counter
competition. Third, we demonstrate that workers adjust their selling strategies in response to
high-ability peers. They respond by lowering prices in response to high-ability competing peers
within individual-compensation counters and high-ability peers at competing counters. Workers
also respond to high-ability peers by focusing on high-value customers who may be loyal to
them and therefore difficult for peers to steal.
Our results suggest that peer effects are important both within and across firm
boundaries, and that their magnitude and direction is dependent on the compensation system of
5
both the focal firm and its competitors. While individual compensation may motivate workers, it
also transfers much of their competitive effort to within the firm. This may reduce the firm’s
ability to effectively compete with rivals, and when combined with discretionary pricing, lead to
lower profit margins as well. While we cannot show that one compensation system dominates
another, our results suggest that TC improves a firm’s responsiveness to high productivity
workers at competing firms. The coordination benefits of team-based compensation appear to
reduce the impact of star salespeople in competing brands.
This paper provides a unique contribution to the personnel economics literature. It is the
first to simultaneously estimate peer productivity spillovers both within and across firms, and
does so under multiple compensation systems. It is also the first to study peer effects under
discretionary pricing, contributing to the literature on the employee gaming of compensation
systems (Baker 1992; Courty and Marschke 2004). Our results have important implications for
managers of sales groups as well as those providing the marketplaces in which they compete.
This study shows that the optimal staffing of workers may critically depend on the compensation
system and the staffing choices of competing firms. Worker diversity of skills may indeed
improve team productivity (Leonard and Levine 2006; Mas and Moretti 2009), but only under
team-based or low-powered incentives. Under individual incentives, low-productivity workers
may be unable to compete with peers, and may instead engage in strategic gaming detrimental to
the firm. Under these high-powered incentives, pricing discretion may produce within-firm price
wars that ultimately low profit margins.
2. Theoretical Background
Sources of Productivity Spillovers
6
A worker may influence the productivity of her peers in a number of ways. First, she
may transfer knowledge or ability to the peer. This knowledge transfer may be voluntary, where
the worker actively teaches or helps the peer, or involuntary, where the peer learns from
observing the coworker. Empirical work by Berg et al. (1996) supports this claim, finding teams
in garment facilities commonly enjoy informal training among peers. This knowledge-transfer
process implies that high-ability workers will have positive productivity spillovers onto peers,
while low-ability workers will provide few spillover benefits. Several theoretical models of
team-based pay suggest productivity spillovers may also occur from coordination and
specialization in teamwork (Milgrom and Roberts, 1990; Kandel and Lazear, 1992). Boning,
Ichniowski, and Shaw (2001) and Gant, Ichniowski, and Shaw (2002, 2003) show team
production in the steel industry produces some type of coordination benefits, particularly in more
complicated production processes. Hamilton, Nickerson, and Owan (2003) also show apparent
gains from the coordination of teamwork, and further demonstrate that skill diversity increases
these gains. Assuming that high individual productivity is associated with better coordination,
high-ability workers should provide greater coordination spillovers to their peers.
Productivity spillovers may also result through negative externalities from free-riding.
Workers in team production may choose to reduce effort when that effort is not directly
observable, and this shirking can spill over to the productivity of peers. Since workers will tend
to have different intrinsic costs and benefits from effort, some will on average shirk more than
others. Any worker scheduled with a low-effort peer will suffer higher externalities and carry
more of the workload. Workers will therefore tend to be more productive when working with
high-effort peers than with low-effort peers.
7
Scholars have argued that social forces, such as peer pressure or shame, might mitigate
the tendency of team members to free-ride. Kandel and Lazear (1992), for example, show that
peer pressure can reduce free-riding in partnerships. They argue that shame and harassment can
result from deviations from social norms, and these peer pressures can limit anti-social behavior.
Ichino and Maggi (2000) empirically show that social norms can also determine levels of
misconduct and absenteeism by examining Italian banks, while Pierce and Snyder (2008) show
the same effect for leniency in vehicle emissions testing. Recent empirical work has also
demonstrated that social pressure can produce peer effects in productivity, with highly-
productive workers motivating their less productive peers to work harder. Experimental work by
Falk and Ichino (2006) showed that while these peer effects worked both ways, the resulting
increased productivity of the worst workers more than made up for the decrease in the best
workers’ productivity. Mas and Moretti (2009) found a similar result in a retail setting, where
supermarket checkers exerted more effort when observed by high-productivity peers. They
argue that these workers suffer disutility from formal or informal sanctions and shame, and
respond with increased effort to counter this social pressure.
While several studies have demonstrated the existence of peer effects and the
mechanisms behind them, they have done so under a single compensation system. Furthermore,
these studies have identified peer effects within single firms without accounting for cross-firm
competition. In Mas and Moretti (2009), for example, workers are paid an hourly wage for a
relatively simple task that has no interaction with other firms. While these settings, and the peer
effects embedded in them, are common and important, they do not address two additional factors
that may determine productivity spillovers: compensation system and inter-firm competition.
8
Compensation Systems and Peer Effects
There is considerable evidence in the personnel economics literature that compensation
systems have dramatic effects on worker behavior. Because firms often cannot directly observe
worker effort, workers choose to shirk rather than exert costly effort. When firms provide
guaranteed compensation such as hourly wages, they risk workers engaging in moral hazard that
reduces their costs from effort without hurting their financial gains. Firms can engage in costly
monitoring of employee effort, but the marginal productivity gains from reducing moral hazard
may not compensate for the marginal cost of this oversight.
If effort is not directly observable, firms can make compensation completely contingent
on some measure of employee output. A piece-rate system, where workers are paid for the work
they accomplish, can make monitoring unnecessary. Empirical work has demonstrated that pay
for performance increases productivity. Lazear (2000) showed that the replacement of hourly
wages with output-based incentives for automobile windshield installation mechanics increased
productivity by 35%, while wages rose only 12%. Similar results have been shown in tree
planting (Paarsch and Shearer, 1996), retail sales (Banker et al, 1996), agricultural output
(Groves et al, 1994), and many other industries.
While performance-based compensation may provide strong incentives for effort, it can
produce several other problems. With contingent compensation, employees who work hard may
get “unlucky” and face decreased pay from exogenous economic or financial shocks. Similarly,
employees who shirk may get “lucky” and face a positive random shock. Therefore, the risk that
observable output is hurt by exogenous factors rests squarely on the shoulders of the employee.
Similarly, this shock may be firm-specific, where poor products or marketing may hurt
individual employee or team sales. Furthermore, employees under high-powered incentives may
9
attempt to “game” the compensation system, particularly when commissions are non-linear. Oyer
(1998) first demonstrated that non-linear incentives appear to affect sales flow and margins, and
that this relationship holds across many industries. Larkin (2007) similarly shows that a kinked
commission curve for enterprise software salespeople leads them to game the timing and pricing
of sales, costing the company 6-8% of revenue.
If firms wish to implement a high-powered incentive system to reduce shirking, they can
do so at two levels: the individual worker and the team. In individual-based compensation, every
worker is responsible for her own productivity, and is compensated on that output. While this
may considerably reduce the incentive to free-ride, it makes the employee vulnerable to
productivity spillovers from other workers. It also provides strong incentives for employees to
compete with one another, which may be beneficial or detrimental to firm profitability.
Individual workers may focus on stealing business or work from one another rather than from
competing firms. Firms may implement an alternative compensation system, team-based
commissions, in order to reduce these problems. If individual production is not easily divisible,
and instead enjoys benefits from cooperation and coordination, rewarding individual effort may
be difficult. Firms cannot directly observe effort or productivity at the individual level, and
therefore may be unable to provide high-powered individual-based commissions. Under team-
based compensation systems, teammates have strong incentives to improve not only their own
productivity but also the productivity of their peers. This compensation system encourages
workers to internalize their production externalities. Firms must still worry about individual
workers free-riding on their team members, but the ability of these teammates to locally observe
effort and enforce compliance through social pressure may be possible.
10
Individual and team-based compensation systems therefore have different implications
for productivity spillovers. In an individual-based system, high-ability workers will have no
incentive to help other workers or to produce positive production externalities. Furthermore,
under conditions of scarce resources or customers, individually-compensated workers may
compete with one another to secure higher compensation, and due to their high ability, will likely
succeed. While some learning or motivational effects may still occur, productivity spillovers are
likely to be small or even negative. In a team-based system, high-ability workers have strong
incentives to help other workers through teaching, coordination, and motivation. Furthermore,
they have no incentive to compete with other workers, since the total of all team members’
productivity becomes the relevant metric for compensation.
Compensation system may also have a considerable effect on spillovers across firm
boundaries, as it will determine the amount of effort that workers will devote to competition with
outside competitors. In individual-based systems, workers must allocate effort to compete with
peers both inside and outside the firm. This within-firm competition limits the effort that can be
focused on cross-firm competition. Consequently, high-ability workers in individual-based firms
are likely to have less impact on their outside peers than would high-ability workers at team-
based firms, who are free to devote all their effort on external competition. Similarly, workers in
individual-based firms are more vulnerable to high-ability peers in competing firms than those in
team-based systems, since they can devote less effort to this competition.
3. Cosmetic Sales in a Chinese Department Store
We study peer effects in the context of team cosmetic sales in a department store in a
large metropolitan area in Eastern China. This department store is one of the largest in China in
11
both sales and profit, and sells a wide range of products including apparel, jewelry, watches,
home furnishings, appliances, electronics, toys, and food. One of its largest categories is
cosmetics, the fifth largest consumer market in China with annual sales of $85 billion in 2004.2
The department store has 15 major brands in the cosmetics department, with each occupying a
counter in the same floor area. These brands hire their own workers to promote and sell their
products, while paying the department store a share of their revenues. The cosmetics floor
effectively becomes an open market, with multiple firms competing for customers in a shared
space. The department store manages the arrangement of the counters as well as the staffing of
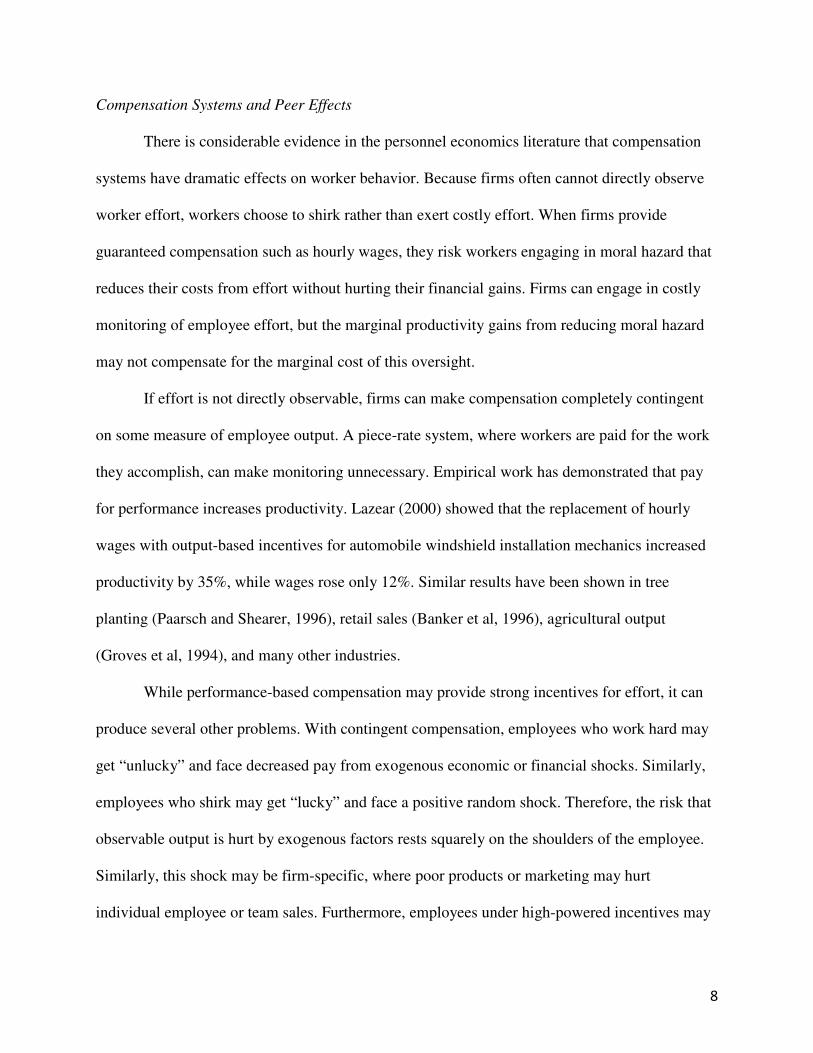
the manufacturers’ employees. We observe each individual cosmetic sale for 11 of the 15
counters over the 2004-2006 period. The floor plan and location of these counters is presented in
Figure 1.
Figure 1: Cosmetics Floor Layout in a Chinese Department Store
2 Data from the Victorian Government Business Office.

12
Sixty-one female salespeople, hired by the individual brands, work in one of three
overlapping shifts during the seven days per week the department store is open. First shift is
from 9am to 3pm, second shift is 12pm to 6pm, and third shift is 3pm to 9pm. While workers
work an average of six hours per day, they often exceed this amount on peak weekends and
holidays. Since shifts are overlapping, workers need not work the same shift in a given day to
share the counter. Salespeople typically rotate shifts that are assigned by the department store
manager. For example, if a salesperson works the first shift on Monday, she will typically work
second or third shift on Tuesday. This scheduling process, while not completely random,
ensures that each salesperson will rotate workdays and times, and thereby share their shifts with
a variety of their peers. In interviews with the department store manager, we observed no
strategic scheduling of workers with either certain peers or during specific shifts or days of the
week.
One of the interesting aspects of this store is that the individual brands use two different
compensation systems: team-based commissions (TC) and individual-based commissions (IC).
The four brands using TC pay each worker monthly based on a tiered percentage of the monthly
sales. As sales increase, the percentage commission grows. If team pay were calculated daily,
then workers might decide how much to free-ride each day based on the expected productivity of
their concurrently-scheduled workers. But since pay is calculated monthly and worker staffing
over the month is equally distributed, each worker’s compensation is based approximately
equally on each peer working that month. This means that on any day, the decision to free-ride
on coworkers should remain independent of concurrently scheduled peers. In essence, the
common problem of free-riding in team-based compensation is independent of scheduling, and
therefore unrelated with temporal peer effects. But in TC counters, whom you work with may
13
still be important for your own productivity. Coordination, specialization, and learning may
make skilled coworkers a boon for your own individual sales.
The other seven brands that we observe use individual-based commissions.3 In these
counters, workers are compensated based on an increasing tiered percentage of personal sales.
Highly productive workers earn higher incomes than do low productivity workers. IC counters
do not suffer from problems of free-riding, but may suffer instead from two afflictions. First,
coworkers are incentivized to directly compete with one another for customers, despite
representing the same brand. They may therefore focus on stealing business from one another
rather than from competing brands. Second, workers have little incentive to coordinate with
peers, or to work to reduce negative production externalities within the counter. Thus, while IC
reduces free-riding, it creates within-counter competition potentially detrimental to the firm. In
IC counters, whom you work with also matters, because they represent your competition and the
source of production externalities.
The nature of sales competition, whether within or across counters, is further nuanced by
another interesting feature of the department store. Individual sales people in all counters have
discretion to discount products from their retail prices. On average, discounting averages about
2.5% of the daily sales revenues across all counters, but this percentage is highly heterogeneous
for each counter. This pricing policy is used for several reasons. First, haggling over prices is a
culturally standard practice in China important in traditional market settings. Second,
discretionary discounting allows skilled salespeople to use local knowledge to price discriminate
and build long-term relationships with customers. It also allows them to better respond to the
actions of coworkers and temporal adjustments in the market. While discretionary discounting
may serve several valuable purposes, it also produces potentially problematic incentives in IC
3 The four counters for which do not have sales data also use individual-based compensation.
14
counters. Under individual-based compensation, workers compete against coworkers, and may
do so by discounting prices. Workers within IC counters may therefore end up in an internecine
price war that approximates undifferentiated Bertrand competition. This contrasts with TC
counters, where workers can price based on cross-counter competition. While price competition
may still occur across counters, this will be less severe due to the differentiated nature of brand-
based cosmetics.
Given this discretionary pricing, workers can use two important levers to increase their
sales. First, they can increase their effort, which will lead to increased sales. Second, they can
discount prices, which also will increase sales. In an IC counter, workers must allocate a limited
amount of effort between competing with peers within their own brand and those at competing
counters. In contrast, TC workers can focus all of their effort toward competing with peers at
other counters. Similarly, IC workers must compete on prices both with peers at other counters
and peers selling their own brand. TC workers will price only in competition with other brands.
Given the differentiated nature of branded cosmetics, price competition across counters will
likely be less severe than within counters.
Salespeople can also alter their behavior in several other ways to account for the
changing quality of peers. First, they can alter which types of products they focus on. If a high-
ability peer is likely to focus on high-value products because of their superior revenue potential,
the worker may choose to differentiate by focusing on selling lower-value products. Similarly,
workers may focus on high-value repeat customers, since these customers may have some
loyalty specifically to that salesperson.

15
Cosmetic Sales Data
When an individual salesperson sells products to a customer, the cashier records the
identity of that salesperson. The product types, quantities, prices, and the discount given in that
sale, as well as time of transaction are also recorded in the sales database. This careful sales
tracking provides the store with detailed information about every cosmetic sale in each of its
brands, and also details the sales productivity of each worker in a given shift. That sales
productivity will depend on a number of time-varying factors, such as the time of day, day of the
week, time of the year, weather, and other exogenous factors. Sales productivity will also
depend on worker specific factors. Salesperson skill or ability will influence average
productivity levels, while time-specific factors such as mental and physical health, effort, and
customer type may also affect specific workers. Since salespeople on average work in teams, the
skills and effort of coworkers will also alter a worker’s sales productivity. As explained above,
this peer effect will likely depend on the compensation system of the counter. Furthermore,
since workers compete with peers at other counters, productivity will also likely depend on the
skills and effort of those “outside” peers.
Details of the department store’s cosmetic sales are presented in Table 1 and Table 2. Of
the 11 counters in our data, four use team-based commissions and 7 use individual-based
commissions. There is considerable heterogeneity in counter size. The largest brand has ten
salespeople, while the smallest has three. Annual sales revenue ranges from $43,763 (US) to
$631,073, with product prices from $0.11 to $165.71. Team-based counters generally have
larger total sales but lower average prices.
Salespeople work alone roughly 30% percent of the time. For the smaller counters we
occasionally observe all workers staffed simultaneously. This is likely due to workers staffing

16
multiple shifts on high volume days. We observe sales for 791 days between November 1, 2004
and December 31, 2006. During this period, no counters change compensation system, and there
is 18% turnover among the workers. We cannot directly observe worker scheduling, but instead
identify it by observing sales times. Although 52% of all hours involve no sales, shifts are
constant and hence we assume that if we observe worker sales during a given shift, then that
worker was also present during the hours without sales.
Since brands did not change compensation system during our sample period, we are
unable to observe any treatment effect from compensation. Consequently, we cannot analyze
whether or not a brand’s choice of compensation system is indeed optimal for them. Instead, we
focus on how a salesperson’s productivity is affected by those peers who work concurrently,
conditional on compensation system. Similarly, we are unable to observe the selection of
workers into employment with any given brand. It is doubtful that this selection is entirely
random, with certain workers attracted to specific brands and vice versa. We must instead focus
on how worker productivity is influenced by concurrently working peers, conditional on the pool
of peers hired in the store.
Table 1: Descriptive Statistics of Cosmetic Counters
Commission
Contract
Annual Sales Revenue
(US$)
Product Price (US$) Average
Transaction Size (Units)
Average Price
Discount Min Max Mean
Brand 1 IC 631,073 .142 114.285 19.178 1.961 1.22%
Brand 2 TC 626,303 .12 99.714 15.861 1.618 0.62%
Brand 3 TC 553,640 .108 68.571 12.862 1.650 0.26%
Brand 4 TC 229,232 .285 107.142 16.208 1.787 0.57%
Brand 5 TC 108,693 .13 22.857 7.124 1.537 0.80%
Brand 6 IC 142,427 .114 145.714 15.067 1.638 4.90%
Brand 7 IC 285,459 .142 128.571 23.422 1.455 1.11%
Brand 8 IC 43,763 .142 110.714 17.733 1.672 11.68%
Brand 9 IC 195,769 .190 95.285 18.134 2.340 1.32%
Brand 10 IC 133,861 .238 165.714 20.076 1.813 2.59%
Brand 11 IC 128,167 .142 72.648 16.724 1.574 3.66%
Total 3,078,387 2.61%
17
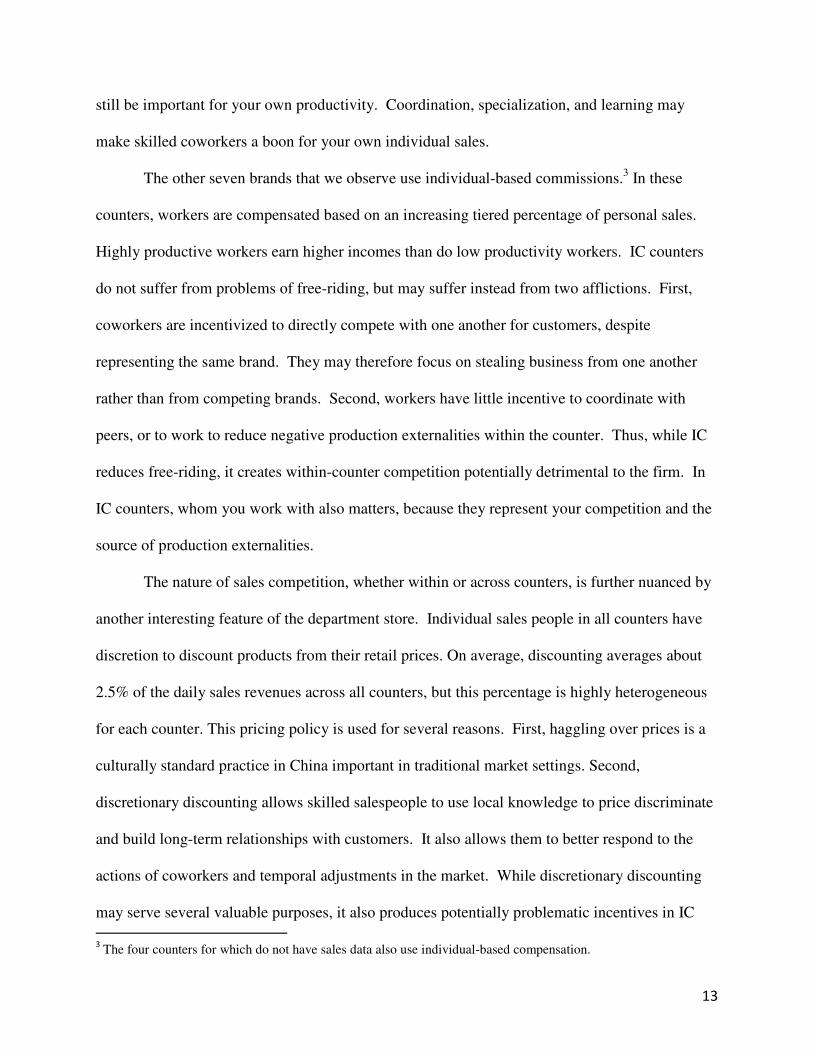
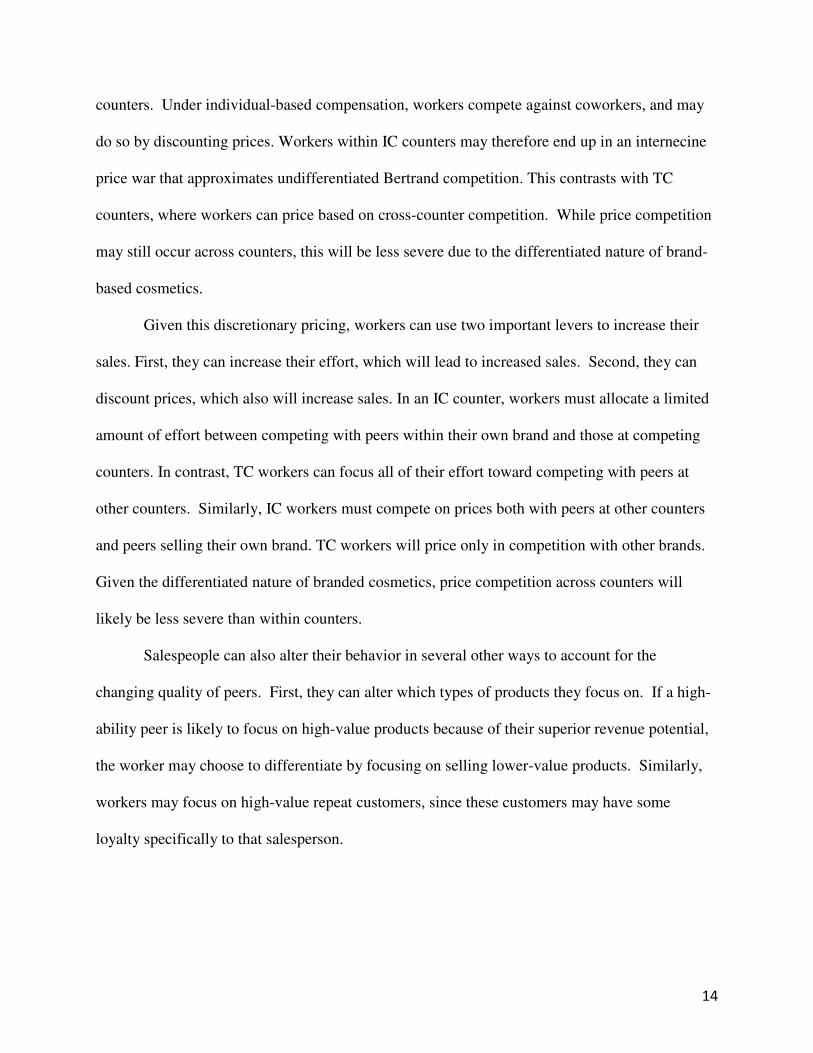
Table 2: Team Size
# of
Salesperson
Team Size
Min Max Mean
Brand 1 9 1 5 2.037
Brand 2 10 1 4 1.786
Brand 3 5 1 4 1.846
Brand 4 4 1 4 1.629
Brand 5 5 1 5 1.753
Brand 6 4 1 3 1.615
Brand 7 6 1 3 1.391
Brand 8 4 1 3 1.195
Brand 9 7 1 4 1.352
Brand 10 3 1 3 1.581
Brand 11 4 1 4 1.783
4. Modeling Peer Effects Within and Across Counters
The goal of our empirical analysis is to identify how the ability of concurrently working
salespeople at the same and competing counters influences the temporal productivity of the
worker. Similar to Mas and Moretti (2009), we define ability in terms of permanent
productivity, or the average productivity of a given worker across time while controlling for
time- and firm-specific factors. Our model differs from prior models of peer effects in three
ways. First, we identify how the peer’s ability relative to the focal worker influences their
temporal productivity. In other words, our approach assumes that a high-ability worker
influences a peer only if that peer is not of equally high ability. We believe that looking at
relative, instead of absolute, productivity from peers is more reasonable especially when
considering competition across counters. Suppose the peer worker has average productivity. Her
impact on a highly productive worker is the same as on a non-productive worker if we only look
at absolute productivity; however, our relative model allows that impact to be different on the

18
two co-workers.4 Second, given our interest in the role of compensation systems on the peer
effects, we estimate two separate within-counter peer effects for IC and TC counters. Lastly, our
model also considers four additional across-counter effects from competing IC counters on IC
counters, competing TC counters on IC counters, competing IC counters on TC counters, and
finally competing TC counters on TC counters.
4.1 Econometric Specification
As we have discussed, salespeople in our data work in overlapping shifts, such that a
worker could work with different co-workers during different hours of her day. Taking this co-
worker variation into account, we begin by specifying how a salesperson’s productivity is
affected by her co-workers at the hour level. We assume that in any given hour, an individual’s
productivity is a function of the average productivity of all coworkers within and across counters
relative to her. For a salesperson j working for brand i, her hourly productivity in hour h of a day,
y���, is specified as:
y��� = y�� + γ� ∙ 1�i ∈ IC� + γ� ∙ 1�i ∈ TC�� ∙ �∑ y���� − y����∈���;� �N�� − 1 "+ γ# ∙ 1�i ∈ IC� + γ$ ∙ 1�i ∈ TC�� ∙ �∑ y�%���� − y����%∈��%�N�%� "+ γ& ∙ 1�i ∈ IC� + γ' ∙ 1�i ∈ TC�� ∙ �∑ y�%%����� − y����%%∈��%%�N�%%� " + Z�β + ε��� 1�
In the specification, y��� is measured by salesperson’s dollar sales in each hour. This is
consistent with the fact that in our empirical setting, a salesperson is compensated based on
either her revenue sales (in IC counters) or the total revenue sales of her team (in TC counters). 5
4 We also estimate a model using absolute productivity of peers within and across counters and find that results are qualitatively very similar. 5 Alternatively we may use unit sales or number of customers served as measurement for “productivity”; however, given that price of cosmetic products and total value of transaction across customers have large variations such
19
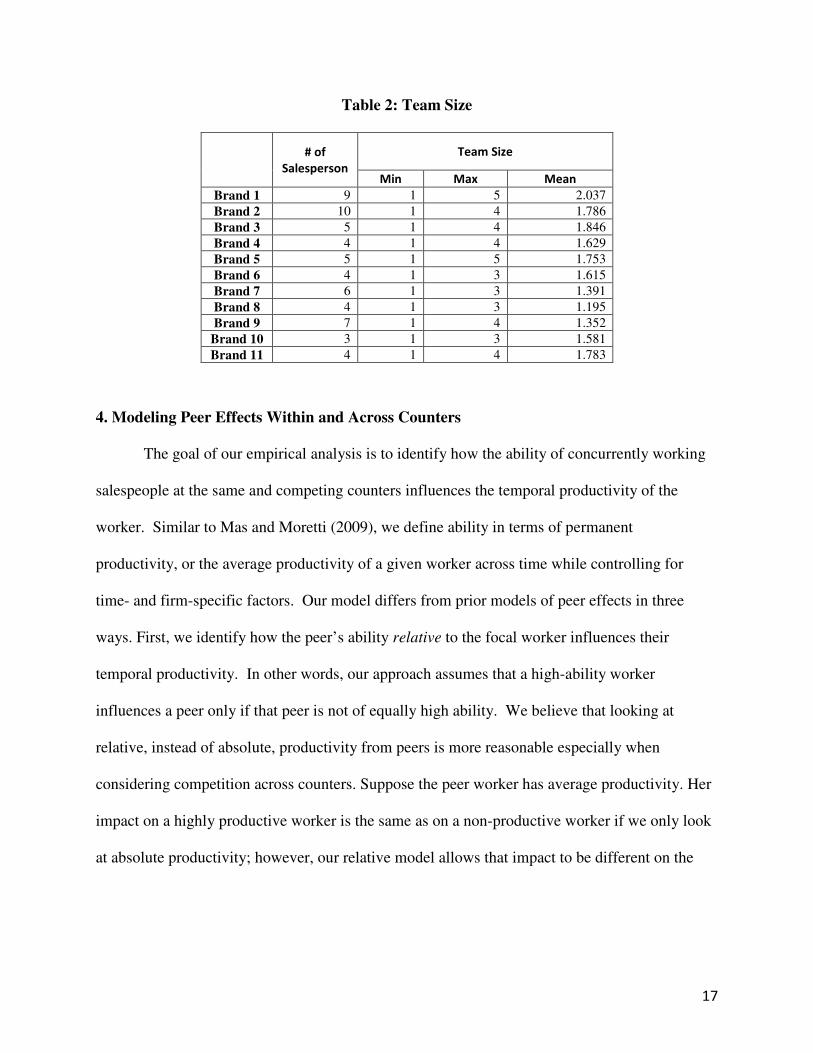
The worker’s fixed effect y�� is a parameter to be estimated. It captures the worker’s ability or
skill-based permanent productivity, which in our setting can be interpreted as her time-invariant
hourly dollar sales. The variables 1�i ∈ IC� and 1�i ∈ TC� are indicators that brand i is an IC
counter or a TC counter, and N��, N�%�, and N�%%� denote the total number of workers working in
i’s own counter, in competing IC counters, and in competing TC counters at hour h, respectively.
A counter is defined as “competing” if it is adjacent to the counter of worker j in any direction.
For example, counter 1 in Figure 1 would have three competing counters: 2, 3, and 8. Thus,
,∑ -.����/-0� �.∈1��;.23���/� 4 represents the average of the relative permanent productivities of all other
active salespeople at worker j’s counter in hour h, 5∑ -.%�����/-0� �.%∈1�%���%� 6 the average relative
permanent productivity of all active peers of IC-based competing counters, and
5∑ -.%%������/-0� �.%%∈1�%%���%%� 6 the average relative permanent productivity of all peers working for TC-based
competing counters, in hour h. Zh is a vector of control variables that may affect sales. Finally,
�� is an error term.
Equation (1) describes productivity determinants in an environment where peer effects
may operate both within and across counters and may also be linked to the compensation system
used by each counter. These potential peer effects are captured by the γ parameters. Parameters
γ1 and γ2 represent the within-counter peer effects for IC and TC counters, respectively. γ3 and γ4
measure the peer effects from workers at IC-based competing counters on salespeople at IC and
TC counters, respectively. γ5 and γ6 measure the peer effects from peers who work at TC-based
competing counters on salespeople at IC and TC counters, respectively.
measurements may be very misleading. For example, a high-productivity worker may focus on serving high-value customers or selling high-priced products. Using such measurements may erroneously identify her as having low-productivity.
20
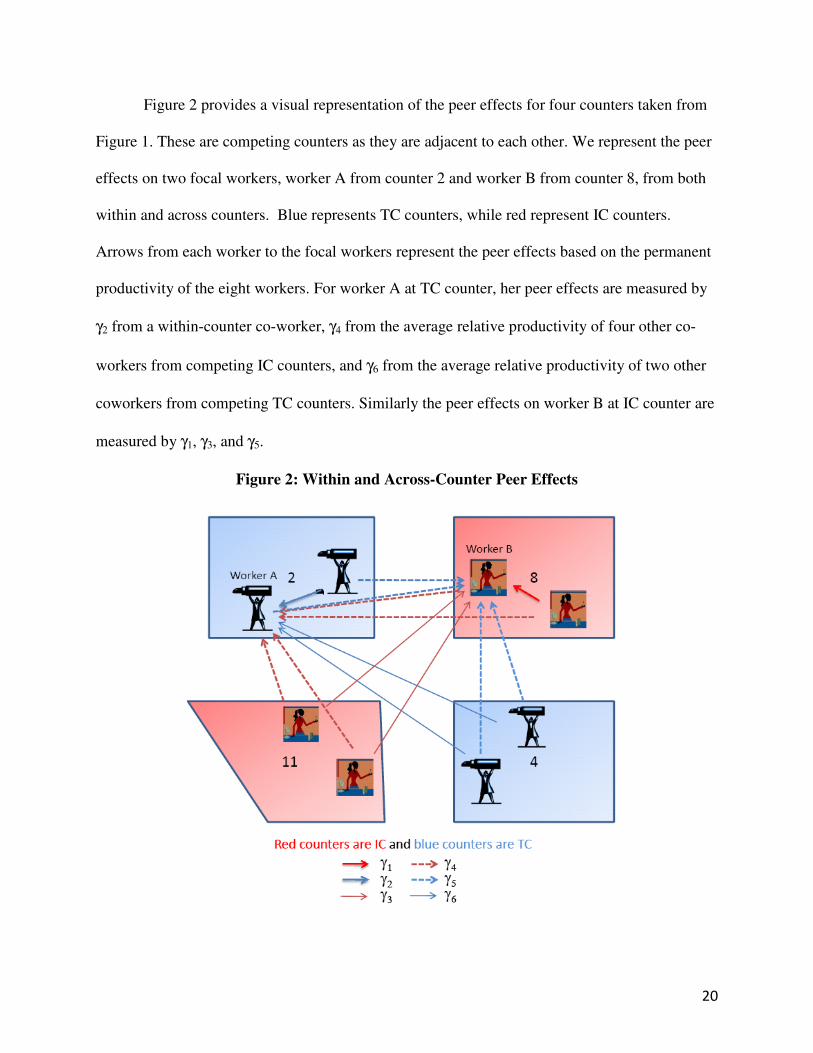
Figure 2 provides a visual representation of the peer effects for four counters taken from
Figure 1. These are competing counters as they are adjacent to each other. We represent the peer
effects on two focal workers, worker A from counter 2 and worker B from counter 8, from both
within and across counters. Blue represents TC counters, while red represent IC counters.
Arrows from each worker to the focal workers represent the peer effects based on the permanent
productivity of the eight workers. For worker A at TC counter, her peer effects are measured by
γ2 from a within-counter co-worker, γ4 from the average relative productivity of four other co-
workers from competing IC counters, and γ6 from the average relative productivity of two other
coworkers from competing TC counters. Similarly the peer effects on worker B at IC counter are
measured by γ1, γ3, and γ5.
Figure 2: Within and Across-Counter Peer Effects
21
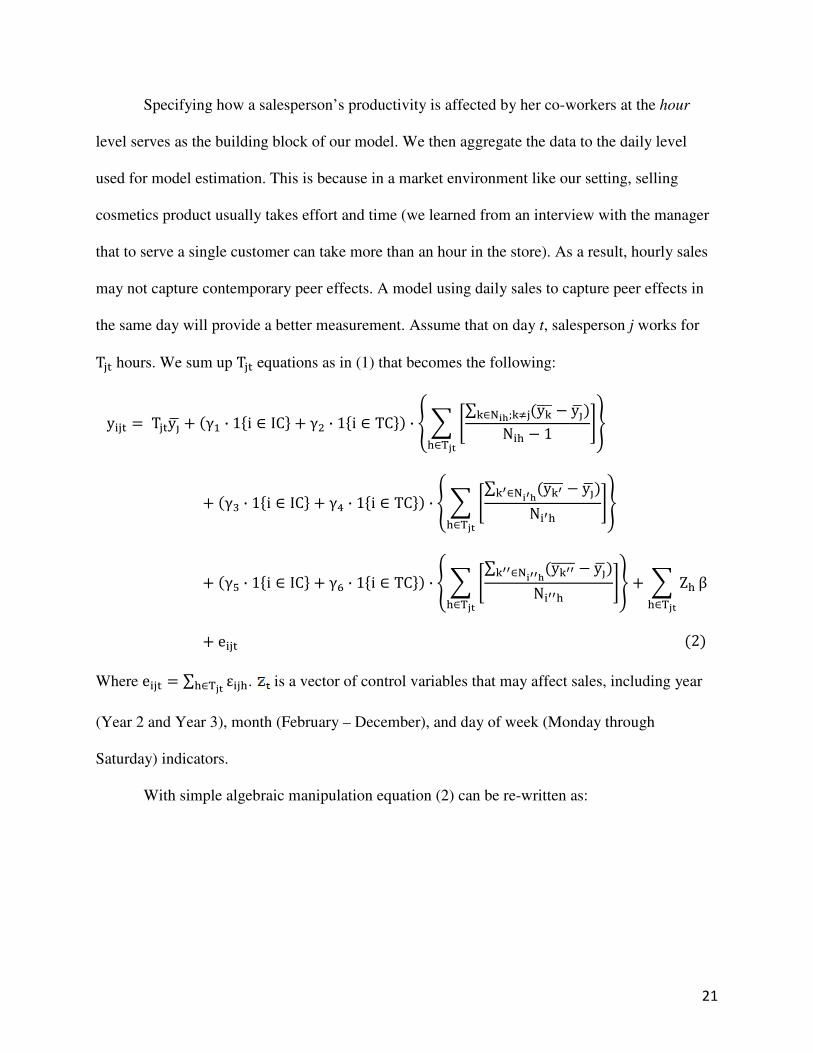
Specifying how a salesperson’s productivity is affected by her co-workers at the hour
level serves as the building block of our model. We then aggregate the data to the daily level
used for model estimation. This is because in a market environment like our setting, selling
cosmetics product usually takes effort and time (we learned from an interview with the manager
that to serve a single customer can take more than an hour in the store). As a result, hourly sales
may not capture contemporary peer effects. A model using daily sales to capture peer effects in
the same day will provide a better measurement. Assume that on day t, salesperson j works for
T�7 hours. We sum up T�7 equations as in (1) that becomes the following: y��7 = T�7y�� + γ� ∙ 1�i ∈ IC� + γ� ∙ 1�i ∈ TC�� ∙ 8 9 �∑ y���� − y����∈���;� �N�� − 1 "�∈:3;
<
+ γ# ∙ 1�i ∈ IC� + γ$ ∙ 1�i ∈ TC�� ∙ 8 9 �∑ y�%���� − y����%∈��%�N�%� "�∈:3;<
+ γ& ∙ 1�i ∈ IC� + γ' ∙ 1�i ∈ TC�� ∙ 8 9 �∑ y�%%����� − y����%%∈��%%�N�%%� "�∈:3;< + 9 Z��∈:3;
β+ e��7 2�
Where e��7 = ∑ ε����∈:3; . is a vector of control variables that may affect sales, including year
(Year 2 and Year 3), month (February – December), and day of week (Monday through
Saturday) indicators.
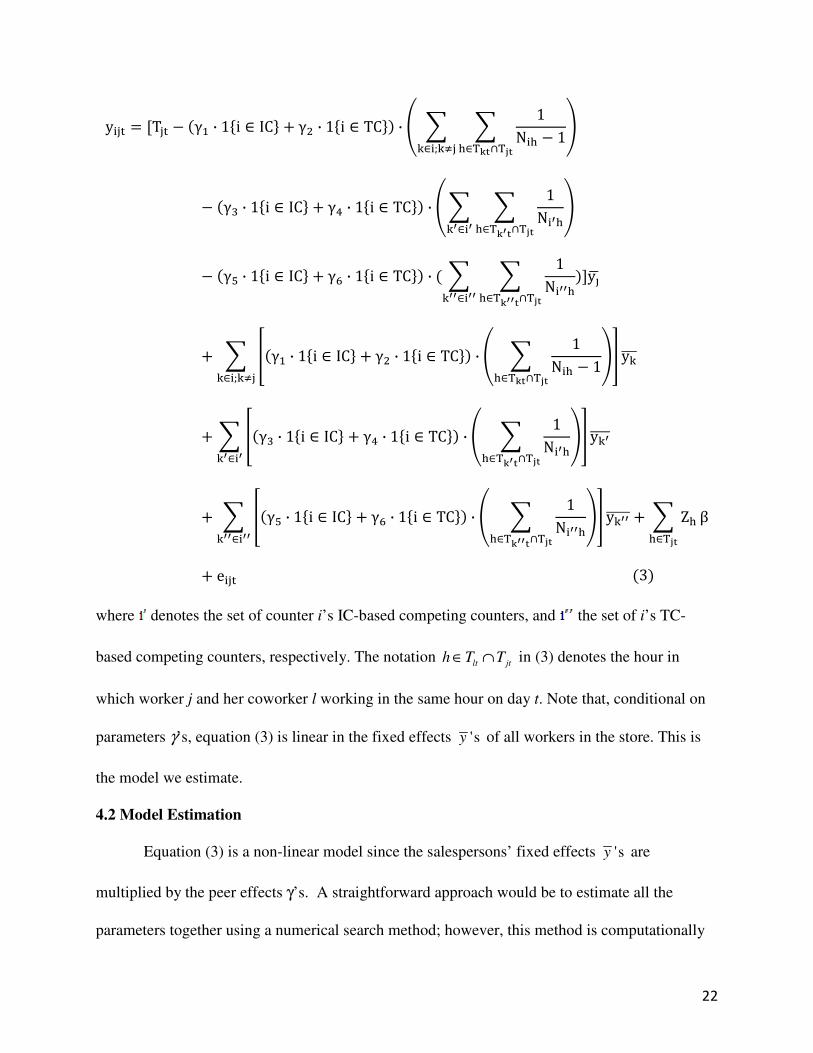
With simple algebraic manipulation equation (2) can be re-written as:
22
y��7 = [T�7 − γ� ∙ 1�i ∈ IC� + γ� ∙ 1�i ∈ TC�� ∙ @ 9 9 1N�� − 1�∈:.;∩:3;�∈�;� � B
− γ# ∙ 1�i ∈ IC� + γ$ ∙ 1�i ∈ TC�� ∙ @ 9 9 1N�%��∈:.%;∩:3;�%∈�%B
− γ& ∙ 1�i ∈ IC� + γ' ∙ 1�i ∈ TC�� ∙ 9 9 1N�%%��∈:.%%;∩:3;�%%∈�%%�]y��
+ 9 Dγ� ∙ 1�i ∈ IC� + γ� ∙ 1�i ∈ TC�� ∙ @ 9 1N�� − 1�∈:.;∩:3;BE y�����∈�;� �
+ 9 Dγ# ∙ 1�i ∈ IC� + γ$ ∙ 1�i ∈ TC�� ∙ @ 9 1N�%��∈:.%;∩:3;BE y�%�����%∈�%
+ 9 Dγ& ∙ 1�i ∈ IC� + γ' ∙ 1�i ∈ TC�� ∙ @ 9 1N�%%��∈:.%%;∩:3;BE y�%%������%%∈�%%
+ 9 Z��∈:3;β
+ e��7 3�
where denotes the set of counter i’s IC-based competing counters, and the set of i’s TC-
based competing counters, respectively. The notation lt jth T T∈ ∩ in (3) denotes the hour in
which worker j and her coworker l working in the same hour on day t. Note that, conditional on
parameters γ’s, equation (3) is linear in the fixed effects 'sy of all workers in the store. This is
the model we estimate.
4.2 Model Estimation
Equation (3) is a non-linear model since the salespersons’ fixed effects 'sy are
multiplied by the peer effects γ’s. A straightforward approach would be to estimate all the
parameters together using a numerical search method; however, this method is computationally
23
burdensome due to the number of parameters (61 worker fixed effects, γ’s and β’s) that must be
estimated. Even if this were computationally feasible, the existence of local minima in the
search process could still produce spurious results.
An alternative estimation strategy is to separately estimate worker fixed effects 'sy and
other parameters (γ’s and β’s) in two stages. This is the methodology adopted by some previous
productivity spillover studies (Pierce and Snyder 2008; Mas and Moretti 2009). This approach
first estimates all the fixed effects accounting for potential peer effects that are a linear function
of the indicators of all possible pairs of coworkers; in the second stage the estimated fixed effects
are plugged into a counterpart of equation (3) in our model to estimate other parameters. While it
may reduce the computational burden, applying this method in our context raises an efficiency
issue. The data requirement is very high to estimate the fixed effects in the first stage. The
method estimates each worker’s fixed effect by including the pairing with all other coworkers
using a non-parametric approach, which requires large number of observations for each possible
pairing of workers both within and across counters. Many coworker pairs occur only a few times
in our data; that may lead to large standard errors for our fixed effects estimates if we directly
apply this method.
In this paper we propose a nested optimization procedure to simultaneously estimate all
parameters in equation (3) that is easy to implement and generates more efficient estimators than
the two-stage estimation approach. The idea comes from the observation that, conditional on γ’s,
equation (3) is linear in 'sy . Specifically, let Γ=(γ1,…,γ6)’, and let
24
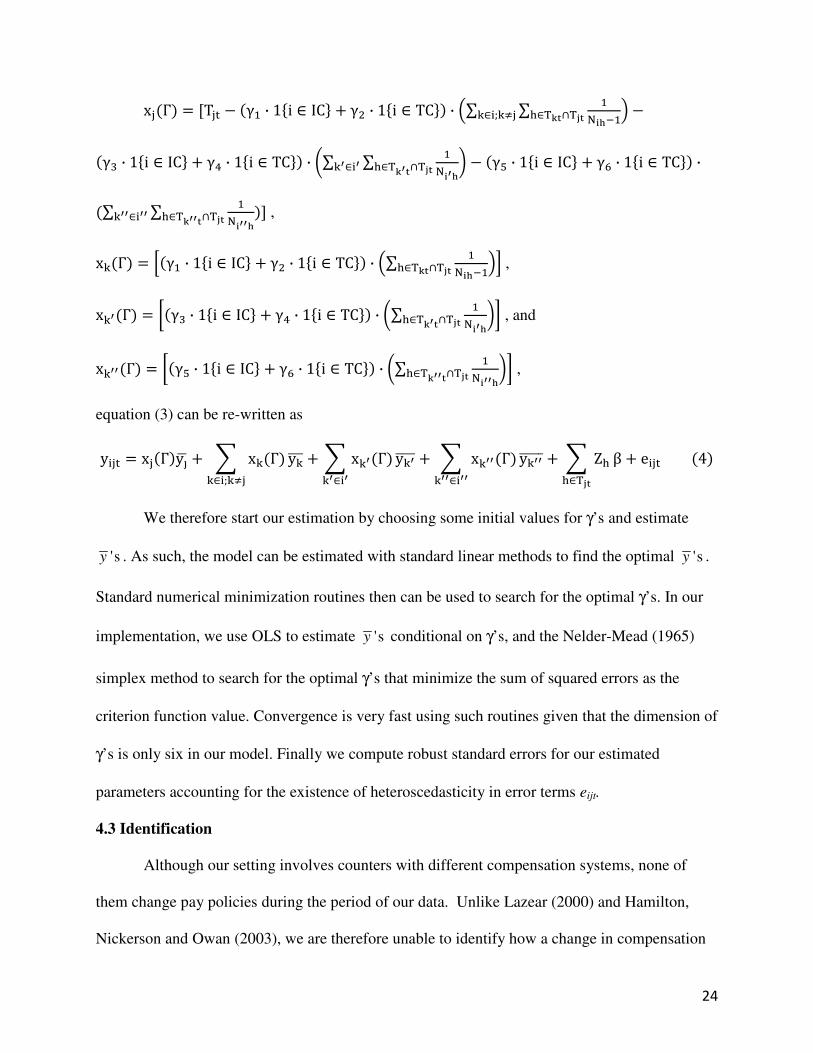
x�Γ� = [T�7 − γ� ∙ 1�i ∈ IC� + γ� ∙ 1�i ∈ TC�� ∙ I∑ ∑ ����/��∈:.;∩:3;�∈�;� � J −γ# ∙ 1�i ∈ IC� + γ$ ∙ 1�i ∈ TC�� ∙ K∑ ∑ ���%��∈:.%;∩:3;�%∈�% L − γ& ∙ 1�i ∈ IC� + γ' ∙ 1�i ∈ TC�� ∙∑ ∑ ���%%��∈:.%%;∩:3;�%%∈�%% �] , x�Γ� = ,γ� ∙ 1�i ∈ IC� + γ� ∙ 1�i ∈ TC�� ∙ I∑ ����/��∈:.;∩:3; J4 , x�%Γ� = 5γ# ∙ 1�i ∈ IC� + γ$ ∙ 1�i ∈ TC�� ∙ K∑ ���%��∈:.%;∩:3; L6 , and
x�%%Γ� = 5γ& ∙ 1�i ∈ IC� + γ' ∙ 1�i ∈ TC�� ∙ K∑ ���%%��∈:.%%;∩:3; L6 ,
equation (3) can be re-written as
y��7 = x�Γ�y�� + 9 x�Γ��∈�;� � y���� + 9 x�%Γ��%∈�%y�%���� + 9 x�%%Γ��%%∈�%%
y�%%����� + 9 Z��∈:3;β + e��7 4�
We therefore start our estimation by choosing some initial values for γ’s and estimate
'sy . As such, the model can be estimated with standard linear methods to find the optimal 'sy .
Standard numerical minimization routines then can be used to search for the optimal γ’s. In our
implementation, we use OLS to estimate 'sy conditional on γ’s, and the Nelder-Mead (1965)
simplex method to search for the optimal γ’s that minimize the sum of squared errors as the
criterion function value. Convergence is very fast using such routines given that the dimension of
γ’s is only six in our model. Finally we compute robust standard errors for our estimated
parameters accounting for the existence of heteroscedasticity in error terms eijt.
4.3 Identification
Although our setting involves counters with different compensation systems, none of
them change pay policies during the period of our data. Unlike Lazear (2000) and Hamilton,
Nickerson and Owan (2003), we are therefore unable to identify how a change in compensation

25
system can alter worker behavior. In contrast, our setting is able to identify how changes in the
mix of co-scheduled workers can impact individual and team productivity across multiple
compensation systems in the presence of firm competition. Since workers at each counter are
constantly changing with each shift, the combination of workers at any given time varies.
Sometimes we will observe high-ability workers with other high-ability workers, and sometimes
they will be with low-ability peers.
This identification strategy relies on the assumption that workers are distributed
approximately randomly with their peers, that is, that high-ability workers are not more
commonly scheduled with low-ability peers than high-ability peers, and vice versa. While
interviews with management suggest that worker assignment is independent of ability, we verify
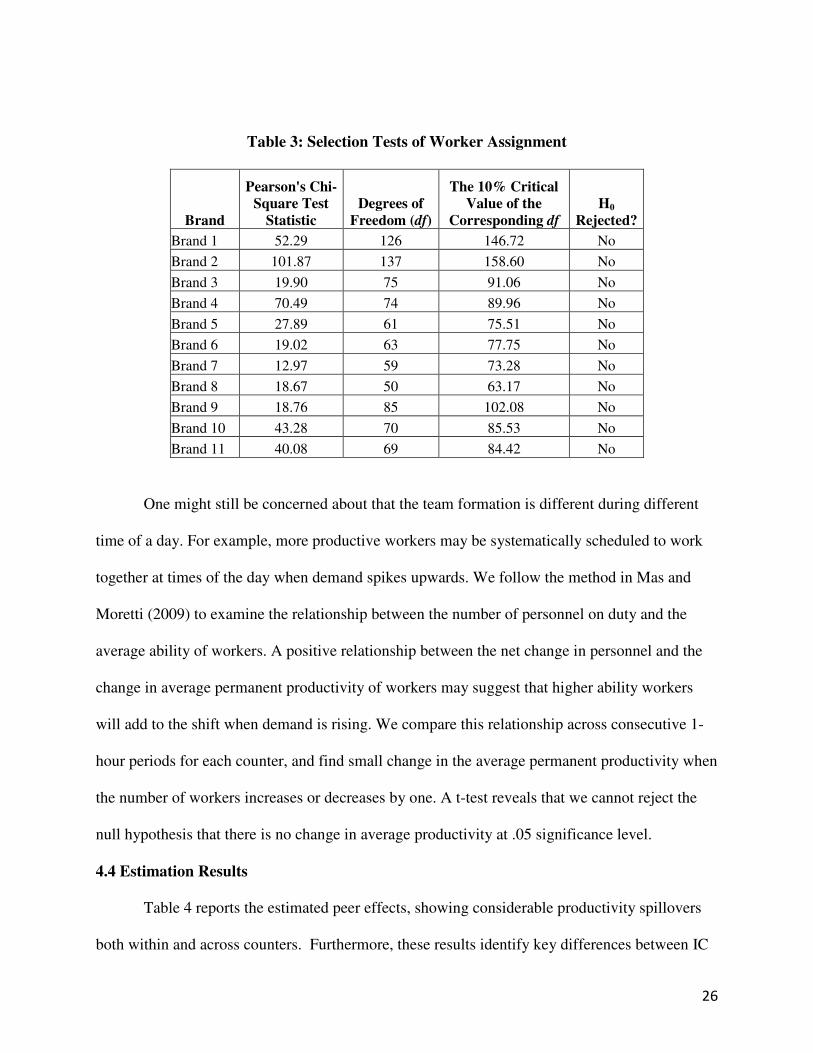
this by looking at the frequency of any two workers being concurrently scheduled. Table 3
presents the results of a brand-based chi-squared test of the null hypothesis that all worker
pairings are equally frequent. Because salesperson turnover exists in our data, we separately
identify coworker pairings for each brand every month. We count the number of observations for
every possible pairing of salespeople (i.e., the number of times each pair of worker working
together), and compare with the expected number of parings under the null hypothesis of random
shift assignments. We are unable to reject this null hypothesis at the 10% level for any brand,
supporting our assertion that workers are not systematically scheduled based on ability.
26
Table 3: Selection Tests of Worker Assignment
Brand
Pearson's Chi-Square Test
Statistic Degrees of
Freedom (df)
The 10% Critical Value of the
Corresponding df H0
Rejected?
Brand 1 52.29 126 146.72 No
Brand 2 101.87 137 158.60 No
Brand 3 19.90 75 91.06 No
Brand 4 70.49 74 89.96 No
Brand 5 27.89 61 75.51 No
Brand 6 19.02 63 77.75 No
Brand 7 12.97 59 73.28 No
Brand 8 18.67 50 63.17 No
Brand 9 18.76 85 102.08 No
Brand 10 43.28 70 85.53 No
Brand 11 40.08 69 84.42 No
One might still be concerned about that the team formation is different during different
time of a day. For example, more productive workers may be systematically scheduled to work
together at times of the day when demand spikes upwards. We follow the method in Mas and
Moretti (2009) to examine the relationship between the number of personnel on duty and the
average ability of workers. A positive relationship between the net change in personnel and the
change in average permanent productivity of workers may suggest that higher ability workers
will add to the shift when demand is rising. We compare this relationship across consecutive 1-
hour periods for each counter, and find small change in the average permanent productivity when
the number of workers increases or decreases by one. A t-test reveals that we cannot reject the
null hypothesis that there is no change in average productivity at .05 significance level.
4.4 Estimation Results
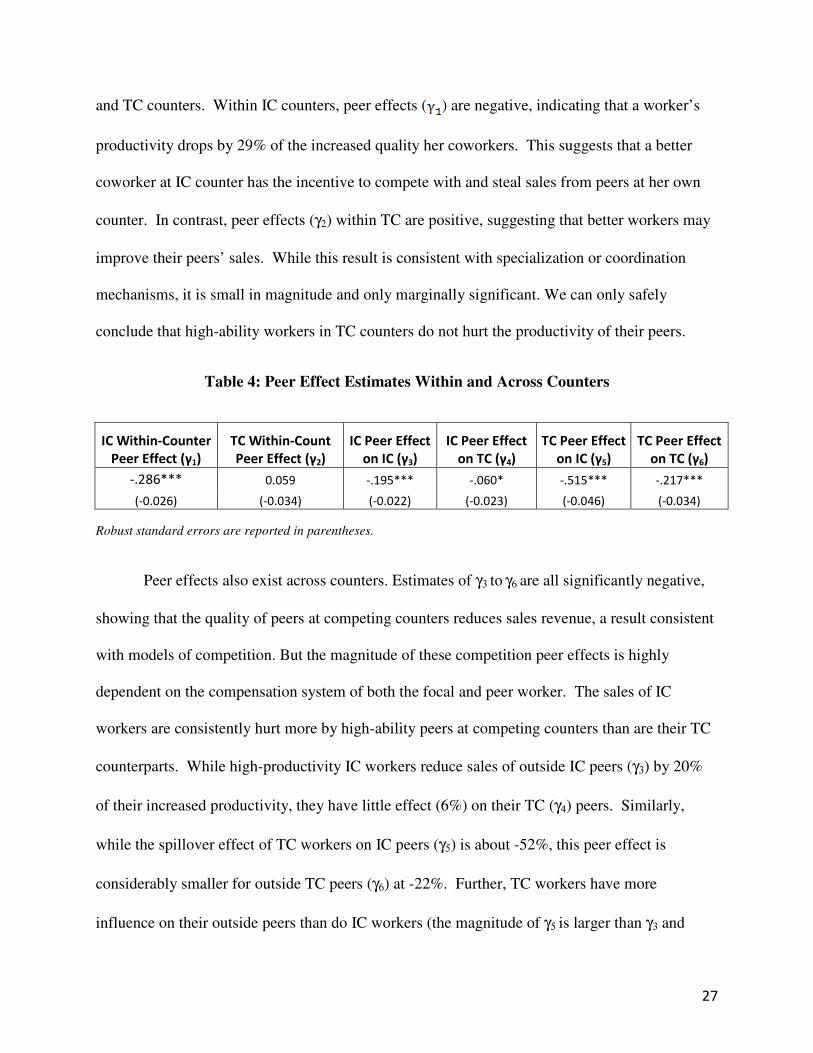
Table 4 reports the estimated peer effects, showing considerable productivity spillovers
both within and across counters. Furthermore, these results identify key differences between IC
27
and TC counters. Within IC counters, peer effects ( ) are negative, indicating that a worker’s
productivity drops by 29% of the increased quality her coworkers. This suggests that a better
coworker at IC counter has the incentive to compete with and steal sales from peers at her own
counter. In contrast, peer effects (γ2) within TC are positive, suggesting that better workers may
improve their peers’ sales. While this result is consistent with specialization or coordination
mechanisms, it is small in magnitude and only marginally significant. We can only safely
conclude that high-ability workers in TC counters do not hurt the productivity of their peers.
Table 4: Peer Effect Estimates Within and Across Counters
IC Within-Counter
Peer Effect (γ1)
TC Within-Count
Peer Effect (γ2)
IC Peer Effect
on IC (γ3)
IC Peer Effect
on TC (γ4)
TC Peer Effect
on IC (γ5)
TC Peer Effect
on TC (γ6)
-.286*** 0.059 -.195*** -.060* -.515*** -.217***
(-0.026) (-0.034) (-0.022) (-0.023) (-0.046) (-0.034)
Robust standard errors are reported in parentheses.
Peer effects also exist across counters. Estimates of γ3 to γ6 are all significantly negative,
showing that the quality of peers at competing counters reduces sales revenue, a result consistent
with models of competition. But the magnitude of these competition peer effects is highly
dependent on the compensation system of both the focal and peer worker. The sales of IC
workers are consistently hurt more by high-ability peers at competing counters than are their TC
counterparts. While high-productivity IC workers reduce sales of outside IC peers (γ3) by 20%
of their increased productivity, they have little effect (6%) on their TC (γ4) peers. Similarly,
while the spillover effect of TC workers on IC peers (γ5) is about -52%, this peer effect is
considerably smaller for outside TC peers (γ6) at -22%. Further, TC workers have more
influence on their outside peers than do IC workers (the magnitude of γ5 is larger than γ3 and

28
γ6 larger than γ4). The sum of these results suggests that TC counters are much better at
competing with high-ability peers at other counters than are IC counters. This is consistent with
the explanation that workers at IC counters focus much of their effort on within-brand
competition, leaving little effort for cross-brand competition. TC workers, having no incentive
to compete within the brand, can focus more effort on competing with other counters.
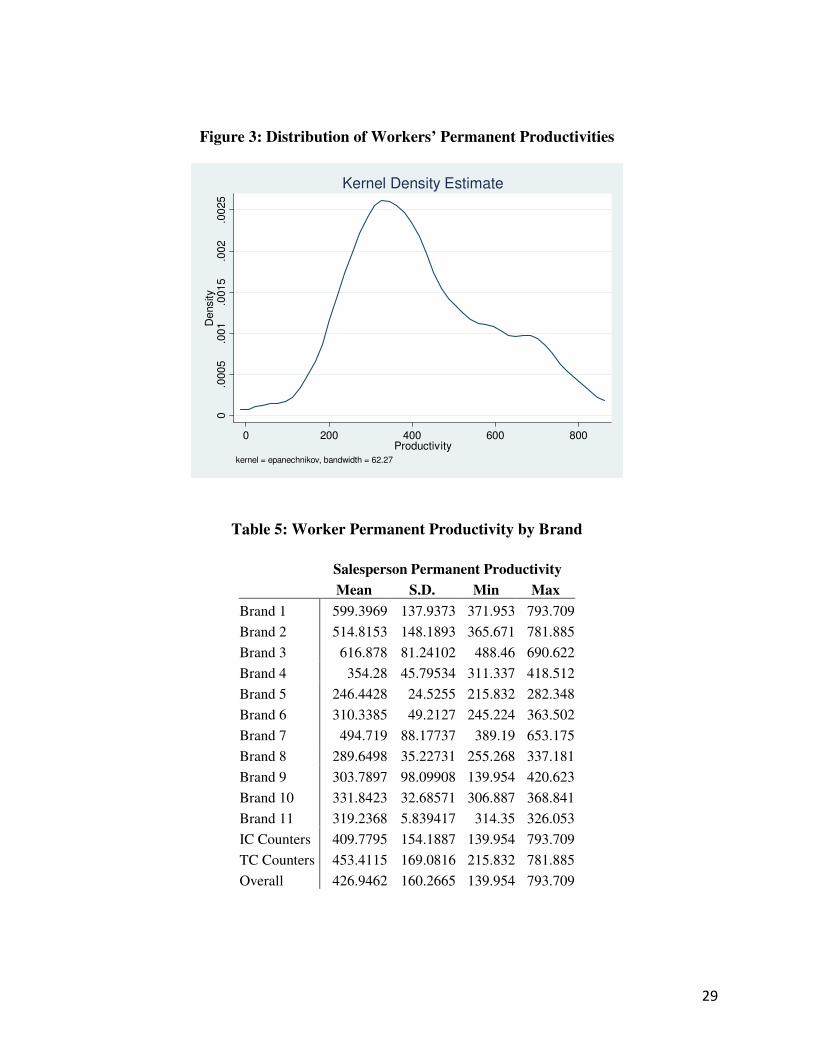
Figure 3 shows the distribution of estimated worker fixed effects, and Table 5 presents
summary statistics of the average fixed effects for each brand, and compares the average fixed
effects under the two compensation systems. There is considerable variation in permanent
worker productivity, and although the variation is much greater in some brands than others, this
does not appear to be correlated with compensation system. It is important to note that we cannot
directly observe one of the key costs of TC: free-riding. The reported fixed effects are a mix of
workers’ own productivity, brand fixed effects and the overall effect on workers’ incentive of
investing sales effort from individual- and team-based compensations. We cannot separately
identify these three factors since brands do not change compensation system during our sample
period. We must therefore be careful not to interpret our findings above as suggesting that TC
counters are more productive than IC counters.
29
Figure 3: Distribution of Workers’ Permanent Productivities
0.0
005
.001
.0015
.002
.0025
Density
0 200 400 600 800Productivity
kernel = epanechnikov, bandwidth = 62.27
Kernel Density Estimate
Table 5: Worker Permanent Productivity by Brand
Salesperson Permanent Productivity
Mean S.D. Min Max
Brand 1 599.3969 137.9373 371.953 793.709
Brand 2 514.8153 148.1893 365.671 781.885
Brand 3 616.878 81.24102 488.46 690.622
Brand 4 354.28 45.79534 311.337 418.512
Brand 5 246.4428 24.5255 215.832 282.348
Brand 6 310.3385 49.2127 245.224 363.502
Brand 7 494.719 88.17737 389.19 653.175
Brand 8 289.6498 35.22731 255.268 337.181
Brand 9 303.7897 98.09908 139.954 420.623
Brand 10 331.8423 32.68571 306.887 368.841
Brand 11 319.2368 5.839417 314.35 326.053
IC Counters 409.7795 154.1887 139.954 793.709
TC Counters 453.4115 169.0816 215.832 781.885
Overall 426.9462 160.2665 139.954 793.709
30
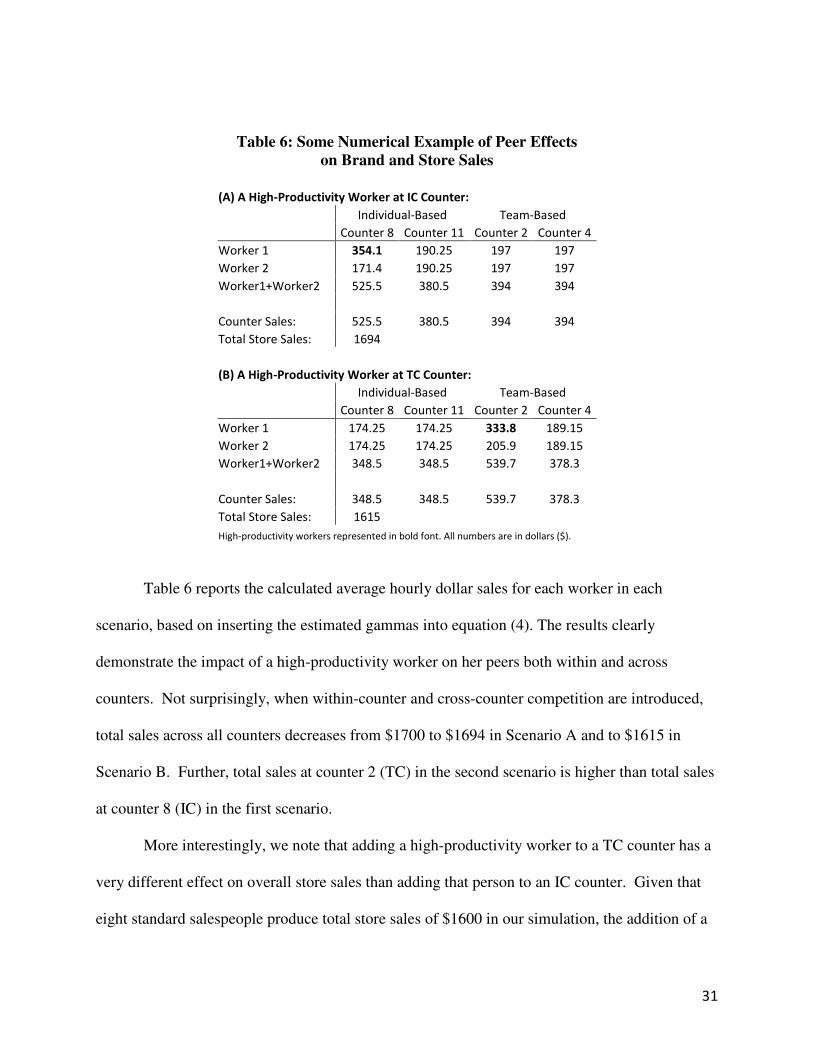
4.5 Competitive Implications
To better illustrate the meaning of the peer effects estimates in Table 4, we conducted a
numerical exercise based on the four-counter context illustrated in Figure 2. That is, we consider
a situation where two IC counters and two TC counters are co-located, each with two
salespeople. All of the salespeople except one have the same permanent productivity of 200. The
remaining worker is a high-ability worker with the permanent productivity of 300. These
measures are within the range of actual data represented in Table 5. The purpose of this exercise
is to understand the implications of the placement of a high-productivity worker on total store
sales. We consider two scenarios. In the first scenario, worker A of team-based Counter 2 is the
high-productivity worker. In the second scenario, worker B of individual-based Counter 8 is the
high productive worker. Within each scenario, we further look at two cases: with cross-counter
competition and without cross-counter competition. Our benchmark is the case when there are no
peer effects hence the total store revenue is at the level of $1,700.
31
Table 6: Some Numerical Example of Peer Effects on Brand and Store Sales
(A) A High-Productivity Worker at IC Counter:
Individual-Based Team-Based
Counter 8 Counter 11 Counter 2 Counter 4
Worker 1 354.1 190.25 197 197
Worker 2 171.4 190.25 197 197
Worker1+Worker2 525.5 380.5 394 394
Counter Sales: 525.5 380.5 394 394
Total Store Sales: 1694
(B) A High-Productivity Worker at TC Counter:
Individual-Based Team-Based
Counter 8 Counter 11 Counter 2 Counter 4
Worker 1 174.25 174.25 333.8 189.15
Worker 2 174.25 174.25 205.9 189.15
Worker1+Worker2 348.5 348.5 539.7 378.3
Counter Sales: 348.5 348.5 539.7 378.3
Total Store Sales: 1615
High-productivity workers represented in bold font. All numbers are in dollars ($).
Table 6 reports the calculated average hourly dollar sales for each worker in each
scenario, based on inserting the estimated gammas into equation (4). The results clearly
demonstrate the impact of a high-productivity worker on her peers both within and across
counters. Not surprisingly, when within-counter and cross-counter competition are introduced,
total sales across all counters decreases from $1700 to $1694 in Scenario A and to $1615 in
Scenario B. Further, total sales at counter 2 (TC) in the second scenario is higher than total sales
at counter 8 (IC) in the first scenario.
More interestingly, we note that adding a high-productivity worker to a TC counter has a
very different effect on overall store sales than adding that person to an IC counter. Given that
eight standard salespeople produce total store sales of $1600 in our simulation, the addition of a
32
high-productivity worker to team-based Counter 2 added only $15 to the store revenue. 85% of
the high-ability worker’s productivity improvement was lost to competition. This compares with
a gain of $94 by adding the high-productivity worker to the IC counter, suggesting that the store
can gain significantly more from locating the high-ability worker there. To better understand the
dynamics of competition driving this result, we next look at how salespeople strategically
respond to the increased competition of high-productivity peers.
5 Sales Strategies under Peer Effects
We have modeled how a worker’s daily productivity, measured in revenue, can be
effected by her co-workers’ permanent productivity. While the results demonstrate the
competitive and cooperative effects of peers, it shows little about the strategies salespersons use
under these peer effects. In order to better understand these mechanisms, we examine how
coworker permanent productivity can influence a salesperson’s strategies along several
dimensions: unit sales, discounting, and customer and product mix. To do so, we run the
following regression for salesperson j working for brand i on day t: d��7 = d�� + Oγ�P ∙ 1�i ∈ IC� + γ�P ∙ 1�i ∈ TC�Q ∙ R∑ ,I∑ ����/��∈:.; J ∙ y���� − y���4�∈�;� � S +Oγ#P ∙ 1�i ∈ IC� + γ$P ∙ 1�i ∈ TC�Q ∙ T∑ 5K∑ ���%��∈:.%; L ∙ y�%���� − y���6�%∈�% U + Oγ&P ∙ 1�i ∈ IC� + γ'P ∙1�i ∈ TC�� ∙ T∑ 5K∑ ���%%��∈:.%%; L ∙ y�%%����� − y���6�%%∈�%% U + ∑ Z��∈:3; β + τ��7 5�
where the dependent variable d��7 represents either (i) the total daily unit sales, (ii) the daily
discounting percentage or, (iii) the total number of customers served in that day. The discounting
percentage is defined as the ratio of the total amount of discounts offered to customers over the
total dollar sales in a day. d�� is the fixed effect capturing individual’s time-invariant unit sales,
33
discounting, or customers served, due to her ability or intrinsic preferences. y ’s are the
permanent productivity of salespeople that we estimated from model (4). We use γP ’s to
represent peer effects on a worker’s selling strategies here to distinguish from the peer effects on
revenue sales in the previous model.
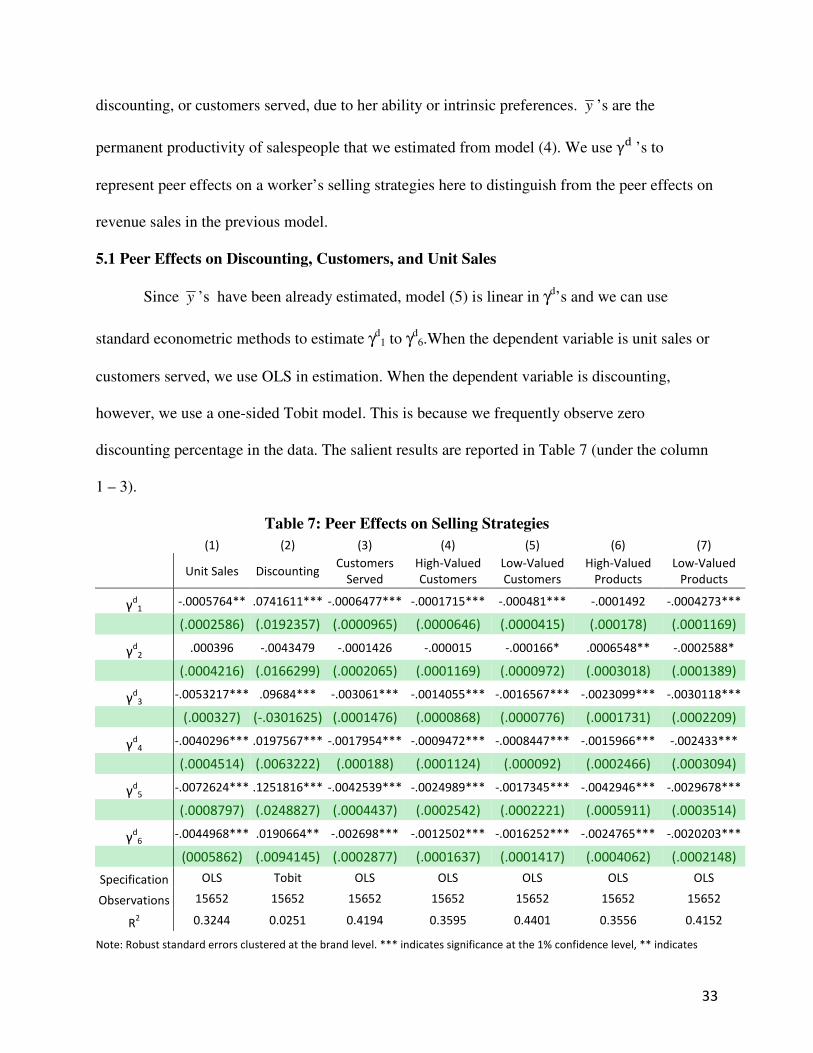
5.1 Peer Effects on Discounting, Customers, and Unit Sales
Since y ’s have been already estimated, model (5) is linear in γd’s and we can use
standard econometric methods to estimate γd1 to γd
6.When the dependent variable is unit sales or
customers served, we use OLS in estimation. When the dependent variable is discounting,
however, we use a one-sided Tobit model. This is because we frequently observe zero
discounting percentage in the data. The salient results are reported in Table 7 (under the column
1 – 3).
Table 7: Peer Effects on Selling Strategies
(1) (2) (3) (4) (5) (6) (7)
Unit Sales Discounting
Customers
Served
High-Valued
Customers
Low-Valued
Customers
High-Valued
Products
Low-Valued
Products
γd1 -.0005764** .0741611*** -.0006477*** -.0001715*** -.000481*** -.0001492 -.0004273***
(.0002586) (.0192357) (.0000965) (.0000646) (.0000415) (.000178) (.0001169)
γd2
.000396 -.0043479 -.0001426 -.000015 -.000166* .0006548** -.0002588*
(.0004216) (.0166299) (.0002065) (.0001169) (.0000972) (.0003018) (.0001389)
γd3
-.0053217*** .09684*** -.003061*** -.0014055*** -.0016567*** -.0023099*** -.0030118***
(.000327) (-.0301625) (.0001476) (.0000868) (.0000776) (.0001731) (.0002209)
γd4
-.0040296*** .0197567*** -.0017954*** -.0009472*** -.0008447*** -.0015966*** -.002433***
(.0004514) (.0063222) (.000188) (.0001124) (.000092) (.0002466) (.0003094)
γd5
-.0072624*** .1251816*** -.0042539*** -.0024989*** -.0017345*** -.0042946*** -.0029678***
(.0008797) (.0248827) (.0004437) (.0002542) (.0002221) (.0005911) (.0003514)
γd6 -.0044968*** .0190664** -.002698*** -.0012502*** -.0016252*** -.0024765*** -.0020203***
(0005862) (.0094145) (.0002877) (.0001637) (.0001417) (.0004062) (.0002148)
Specification OLS Tobit OLS OLS OLS OLS OLS
Observations 15652 15652 15652 15652 15652 15652 15652
R2 0.3244 0.0251 0.4194 0.3595 0.4401 0.3556 0.4152
Note: Robust standard errors clustered at the brand level. *** indicates significance at the 1% confidence level, ** indicates
34
signficance at the 5% confidence level, * indicates significance at the 10% confidence level.
The results for γd1 shows that the relative productivity of peers within IC counters
decreases unit sales. Furthermore, the negative within-brand spillover for IC counters appears to
also be due to increased price discounting. The parameter γd1 in columns (1) and (2) shows that
while workers in IC counters respond to high-ability peers by lowering their prices, they still lose
unit sales to within-counter business stealing. γd1 in column (3) shows that high-ability peers also
reduce a worker’s customers at IC counters. Apparently, high-ability peers steal customers from
workers, who compensate by lowering prices to sell products to their remaining customers. In
contrast to IC workers , TC workers were uninfluenced by high-ability peers in their unit sales,
customers, and pricing. This is consistent with team-based compensation providing no
incentives for competition within counter. One of the key benefits of team-based compensation
in our setting is in maintaining margins, as individual-based compensation leads workers to
lower prices in response to high-ability peers.
As with our revenue spillover results, increased competition from improved outside peer
quality lowers unit sales and customers, and increases discounting. More importantly, the
magnitude of these estimated parameters depends strongly on the compensation system of both
the focal worker and her outside peer. The unit sales, customers, and prices of IC workers are
consistently hurt more by high-ability peers at competing counters than are their TC
counterparts. The peer effects of IC workers on outside IC peers (γd3) are larger than those of IC
workers on their TC (γd4) peers. Similarly, the peer effect of TC workers on IC peers (γd
5) is
considerably larger than the effect of TC workers for outside TC peers (γd6). These results also
show that TC workers have more influence on their outside peers than do IC workers (γd5 > γd
3).
35
The results on number of customers in column (3) are nearly identical. Again, TC workers are
hurt less by high-ability outside peers than IC workers. Similarly, high-ability TC workers have
a much greater impact on outside peers than do high-ability IC workers. The sum of these results
supports the previous findings that suggest TC counters are better at competing with high-ability
outside peers than are IC counters.
5.2 Peer Effects on Customer and Product Mix
The model described in equation (5) assumes that all customers served by a given
salesperson are homogenous, and equally contributed to the spillover effect. However, it is
possible, for example, that a salesperson puts different effort, or applies different strategies, to
serve different types of customers. To investigate this possibility, we separate all the customers
into two groups, using the median dollars spent as the separating criterion. We label the two
groups high-valued (HV) customers and low-valued (LV) customers. Columns (4) and (5) show
the results when we estimate model (5) using these two groups as dependent variables. Based on
the same idea, we also classify all the products into two groups, HV and LV products, using the
median price of all products of the brand as the separating criterion. Columns (6) and (7) of
Table 7 show the results when we estimate model (5) using these two groups as dependent
variables.
Columns (4) and (5) again demonstrate negative peer effects within IC counters (γd1 in
columns 4 and 5), but the level of this business stealing appears to be higher with low-value
customers. This may be due to the fact that high-value customers, who are likely to be repeat
buyers, have more loyalty to specific salespersons, thus making them hard to steal. High-ability
peers in IC counters therefore focus primarily on stealing LV customers. We observe no
statistically-significant customer peer effects within TC counters (γd2 in columns 4 and 5).
36
Again, we observe negative cross-counter peer effects for γd3 -- γ
d6, consistent with our model of
sales competition. The magnitude of these spillovers is again much larger on IC counters,
consistent with our argument that such workers focus less effort on cross-counter competition.
Similar to with customers, we divide all products into high-value (HV) and low-value
(LV) products and estimate daily sales of each type using equation (5). The results, presented in
columns (6) and (7) of Table 7, are consistent with our previous results. High-ability workers
within IC counters hurt peer sales, and this effect again is only identified for LV products. This is
consistent with our results on LV customers – LV customers perhaps are also more likely to
purchase LV products. Finally, high-ability workers at competing counters consistently hurt their
peers’ sales of all products. The effect of this is again most pronounced on workers at IC
counters.
To summarize, our results on selling strategies suggest that, as a response to pressure
from peers within and across counters, a salesperson at an IC counter will offer larger discounts
to customers. Salespersons at TC counters do not compete in discounting with peers at the same
counter. A high-ability salesperson is more likely to steal low-valued customers from her peers at
the same counter, but less so for high-valued customers who are likely to have stronger
relationships with specific salespersons. Our results consistently show that, compared with IC
counters, TC counters are less likely to discount prices but still able to prevent their customers
from being stolen by high-ability salespersons from competing counters.
6. Discussion and Conclusion
In this paper we find evidence of peer effects among retail cosmetic salespeople. These
peer effects exist within brand-based counters, with their direction and magnitude depending on
the compensation system used by the brand. Within counters using individual-based

37
compensation system, high-ability workers have a negative effect on the sales productivity of
their peers as they out-compete them for low-revenue customers. Unable to compete with high-
ability peers on selling techniques, low-ability workers respond by lowering the prices they offer
to customers, resulted in lost revenue due to decreased number of units sold and prices. In
contrast, we find small positive peer effects within those counters using team-based
compensation. High-ability workers improve the sales productivity of their peers, with low-
ability workers finding it unnecessary to reduce prices in response to peers with aligned
incentives.
We find strong evidence that peer effects extend across firm boundaries. High-ability
workers at competing counters hurt all peers’ sales revenue, reducing both the prices and
quantities sold for competing brands. We find, however, that the competitive effect of outside
peers is not universal – the compensation system of both the competing and focal counters
influences the magnitude of these peer effects. Workers at team-based counters, finding it
unnecessary to exert effort toward within-counter competition, can focus all effort toward
outside competitors. Consequently, these workers are hurt less by high-ability outside peers,
requiring less discounting and suffering less revenue loss. Workers at individual-based counters
can only devote limited effort to cross-counter competition, and therefore are more greatly
impacted by high-ability outside peers. Compensation system also influences the impact of the
counter on its competitors. High-ability workers at team-based counters have much larger
negative effects on outside peers than do their individual-based counter peers. These high-ability
workers at individual-based counters may instead find higher rewards from stealing business
from within-counter peers than by competing across counters.
38
The peer effects we observe are not simply productivity spillovers. We also identify
likely strategic responses by workers to the ability of their peers. When faced with high-ability
competitors within the counter, workers under individual-based compensation employ two
strategic responses. First, they discount their prices offered to customers. Second, they focus on
retaining high-value repeat customers, who likely are more loyal to specific salespeople. Given
that the best workers will easily win casual low-value customers, this response seems to be an
important differentiation strategy. We do not find such strategic responses for workers under
team-based compensation. Facing high-ability workers from competing counters, a worker under
individual-based compensation is also likely to offer larger price discounts than usual. Still, she
will lose more customers and sell fewer products than her peers under team-based compensation
do. Both price discounts and customer loss lead to the result that a worker under individual-based
compensation will suffer more revenue loss when she works with high-ability peers within and
across counters.
This paper is the first empirical study that simultaneously estimate peer productivity
spillovers both within and across firms under multiple compensation systems. It also first
identifies peer effects under discretionary pricing, and provides important implications for
managerial decisions on staffing, compensation, location, and pricing discretion. To conclude,
we note that there are several issues in our analysis that await future studies to address. First, we
are unable to compare workers’ overall productivity under individual-based and team-based
compensation system. To achieve such purpose would require that at least some counters change
their compensation systems in data. Second, while we have identified the contemporary peer
effects within and across counters, our model abstracts away from long-term peer effects that
may be resulted from peer learning through team coordination or competition. A dynamic model

39
allowing for peer learning can help to investigate this long-term effect. With these two issues
addressed we can finally study under what conditions it will be optimal for firms to adopt
individual-based vs. team-based compensation system.
40
References
Baker, George P., Robert Gibbons, and Kevin J. Murphy, 1994. “Subjective Performance
Measures in Optimal Incentive Contracts,” Quarterly Journal of Economics, 109, 1125-1156.
Baker, George, 1992. “Incentive Measures and Performance Measurement,” Journal of Political
Economy, 100, 598-614.
Bandiera, Oriana, Iwan Barankay, and Imran Rasul, 2006, “Social Connections and Incentives in the Workplace: Evidence from Personnel Data,” working paper, London School of Economics.
Berg, Peter; Appelbaum, Eileen; Bailey, Thomas; and Kalleberg, Arne L. “The Performance Effects of Modular Production in the Apparel Industry.” Indus. Relations 35 (July 1996): 3563–73.
Boning, Brent, Casey Ichniowski, and Kathryn Shaw, 2007. “Opportunity Counts: Teams and the Effectiveness of Production Incentives,” Journal of Labor Economics, 25(4), 613-650.
Courty, Pascal; and Gerald Marschke, 2004. ”An Empirical Investigation of Gaming Responses to Explicit Performance Incentives,” Journal of Labor Economics, 22(1), 23-56.
Falk, Armin and Andrea Ichino, 2006, “Clean Evidence on Peer Effects,” Journal of Labor
Economics, 24(1), 39-57.
Gant, Jon, Casey Ichniowski and Kathryn Shaw, 2002. “Social Capital and Organizational Change in High-Involvement and Traditional Work Organizations,” Journal of Economics
&Management Strategy, 11(2), 289-328.
Gant, Jon, Casey Ichniowski and Kathryn Shaw, 2003. "Working Smarter by Working Together: Connective Capital in the Workplace," Working Paper.
Groves, Theodore, Yongmiao Hong, John McMillan and Barry Naughton, 1994. "Autonomy and Incentives in Chinese State Enterprises," Quarterly Journal of Economics, 109, 183-209.
Hamilton, Barton H., Jack A. Nickerson, and Hideo Owan, 2003. “Team Incentives and Worker Heterogeneity: An Empirical Analysis of the Impact of Teams on Productivity and Participation,” Journal of Political Economy, 111(3), 465-497.
Holmstrom, Bengt, 1979. “Moral Hazard and Observability.” Bell Journal of Economics, 10, 74-91.
Holmstrom, Bengt, 1982. “Moral Hazard in Teams,” Bell Journal of Economics, 13(2), 324-340.
41
Ichino, Andrea and Giovanni Maggi, “Work Environment And Individual Background: Explaining Regional Shirking Differentials In A Large Italian Firm,” Quarterly Journal of
Economics 115 (2000): 1057-1090
Kandel, Eugene and Edward P. Lazear, 1992. “Peer Pressure and Partnerships,” Journal of
Political Economy, 100(4), 801-817.
Larkin, Ian, 2007. “The Cost of High-Powered Incentives: Employee Gaming in Enterprise Software Sales,” working paper, University of California at Berkeley.
Lazear, Edward, “Performance Pay and Productivity,” American Economic Review 90(5) (2000): 1346-1361.
Leonard, Jonathan and David Levine, “The Effect of Diversity on Turnover: Evidence from a Very Large Case Study,” Industrial Relations and Labor Review (2006).
Lucas, R.E., On the mechanics of economic development. Journal of Monetary Economics
(1988) 22, 3–42.
Marshall, Alfred, The Principles of Economics, London: MacMillan, 1890.
Mas, Alexandre and Enrico Moretti, 2009, “Peers at Work,” NBER Working Paper #12,508.
Milgrom, Paul and John Roberts, 1990. “The Economics of Modern Manufacturing: Technology, Strategy, and Organization,” American Economic Review, 80(3), 511-528.
Oyer, Paul, 1998. “Fiscal Year Ends and Non-Linear Incentive Contracts: The Effect on Business Seasonality,” Quarterly Journal of Economics, 113, 149-185.
Paarsch, Harry, and Bruce Shearer. “The Response of Worker Effort to Piece Rates: Evidence from the British Columbia Tree-Planting Industry,” Journal of Human Resources, 34 (1999): 643-667.
Pierce, Lamar and Snyder, Jason, 2008, “Ethical Spillovers in Firms: Evidence from Vehicle Emissions Testing,” Management Science, 54(11): 1891-1903