Embed Size (px)
Citation preview

EFFECTS OF MANUAL AND MECHANICAL AMMOPHILA ARENARIA REMOVAL
TECHNIQUES ON COASTAL DUNE PLANT COMMUNITIES AND DUNE
MORPHOLOGY
By
Monique Rose Silva Crossman
A Thesis Presented to
The Faculty of Humboldt State University
In Partial Fulfillment of the Requirements for the Degree
Master of Science in Natural Resources: Environmental and Natural Resource Sciences
Committee Membership
Dr. Alison O’Dowd, Committee Chair
Dr. David Gwenzi, Committee Member
Dr. Erik S. Jules, Committee Member
Dr. Alison O’Dowd, Graduate Coordinator
July 2018

ii
ABSTRACT
EFFECTS OF MANUAL AND MECHANICAL AMMOPHILA ARENARIA REMOVAL TECHNIQUES ON COASTAL DUNE PLANT COMMUNITIES AND
DUNE MORPHOLOGY
Monique Rose Silva Crossman
The removal of invasive species as part of the restoration process can allow
natives organisms to rebound. An ecosystem that incurs damages from invasive species
is coastal sand dunes, which are dynamic systems. Some coastal sand dunes on the west
coast of the United States have been invaded by Ammophila arenaria. The invasive
grass, A. arenaria, is thought to alter and stabilize foredune morphology and reduce
populations of native species. The objectives of my research are to examine the effects
that manual and mechanical A. arenaria removal techniques have on coastal sand dune
morphology and vegetative cover over time. The California State Parks Redwood
District manages three coastal sand dune ecosystems where A. arenaria removal efforts
have been conducted: Little River State Beach, Gold Bluffs Beach in Prairie Creek
Redwoods State Park, and Tolowa Dunes State Park. I surveyed the vegetative cover at
each of the three locations in each treatment method, manual and mechanical, and in
untreated control plots during the summer and early fall of 2017. In order to measure
dune morphology at restored and unrestored sites, I used an Unmanned Aerial Vehicle
(UAV) that was flown over the mechanical removal and control areas. I then created a

iii
Digital Elevation Model (DEM) from photos taken during the UAV flights using
Structure from Motion software. Overall, both mechanical and manual treatments
lowered A. arenaria cover. Mechanical removal lowered the foredune elevation
compared to control areas and changed the dune morphology in treatment areas into
hummocks at Little River. Although mechanical removal was effective at lowering A.
arenaria cover, it also lowered native plant diversity compared to manual removal, but
was higher than control diversity. With endemic species of concern on coastal sand
dunes, manual removal of A. arenaria will afford greater native plant diversity and
cover compared to mechanical removal.

iv
ACKNOWLEDGEMENTS
There are many groups and individuals that have helped me finish this thesis. I
would like to first acknowledge CSU Council on Ocean Affairs, Science & Technology
(COAST) for awarding me their graduate student research grant. Also thank you to my
advisor, Dr. Alison O’Dowd for her guidance and encouragement. Thank you to my
committee members, Dr. Erik Jules and Dr. David Gwenzi, for their profound wisdom
and depth of knowledge. I need to acknowledge Dr. Jim Graham for his time and
expertise on UAV research. As well to Jordan Adair for taking the time to pilot the
UAV for my study. Thank you to The Institute for Spatial Analysis, (ISA) for lab space
and the use of the UAV. I need to also recognize Robin Bencice for plant ID assistance.
I also must thank Michele Forys, Amber Transou, Patrick Vaughan and the
California State Parks. I want to acknowledge Ayla Mills whose field data were shared
with me and on which my thesis is built upon. A very special thank you goes out to my
field volunteers: Michael Rada, Marcel Safford, Jacob Smith, Wendy Martinez Murillo,
Alex Magliano and Mark McCuen.
Finally, to my family. Thank you for your love and support over the years.
Especially to all the strong independent matriarchs in my family for setting an example
for me. Thank you again to Mark McCuen for being a great partner over the years. I
want to express my deepest gratitude to Sugarboy Cannon, for teaching me to look at
the world in scientific wonder. Your high expectations of me have always pushed me to
reach my fullest potential.

v
TABLE OF CONTENTS
ABSTRACT ..................................................................................................................... ii
ACKNOWLEDGEMENTS ............................................................................................. iv
TABLE OF CONTENTS ................................................................................................. v
LIST OF TABLES .......................................................................................................... vii
LIST OF FIGURES ....................................................................................................... viii
LIST OF APPENDICES .................................................................................................. xi
INTRODUCTION ............................................................................................................ 1
Research Objectives ..................................................................................................... 7
MATERIALS AND METHODS ..................................................................................... 8
Study Sites .................................................................................................................... 8
Vegetation Monitoring ............................................................................................... 11
Dune Morphology Survey .......................................................................................... 16
RESULTS ....................................................................................................................... 18
Vegetation Analysis .................................................................................................... 18
Dune morphology ....................................................................................................... 30
DISCUSSION ................................................................................................................. 35
Vegetation Analysis .................................................................................................... 35
Dune Morphology ....................................................................................................... 41
Management Recommendations ................................................................................. 42
LITERATURE CITED ................................................................................................... 46
Appendix A ..................................................................................................................... 51

vi
Appendix B ..................................................................................................................... 57
Appendix C ..................................................................................................................... 59
Appendix D ..................................................................................................................... 60
Appendix E ..................................................................................................................... 62
Appendix F ..................................................................................................................... 64
Appendix G ..................................................................................................................... 65
Appendix H ..................................................................................................................... 66
Appendix I ...................................................................................................................... 67
Appendix J ...................................................................................................................... 68
Appendix K ..................................................................................................................... 69
vii
LIST OF TABLES
Table 1. The start date of initial treatment to remove Ammophila arenaria, treatment method, and acreage treated at each of my research sites: Little River State Beach, Tolowa Dunes State Park, and Gold Bluffs Beach in Prairie Creek Redwoods State Park. Follow-up manual treatment occurred approximately 3 times the first year, and once to twice a year the following years for all treatment types (Forys et al. 2009, Transou 2012, Wisehart 2012, and Mills 2015). .............................................................. 9
Table 2. Modified Braun-Blanquet cover classes used for vegetation and cover measurements in 1m2 quadrats (Braun-Blanquet et al. 1932, Mills 2015). .................... 15
viii
LIST OF FIGURES
Figure 1. Study site locations in three California State Parks: Tolowa Dunes State Park, Gold Bluffs Beach in Prairie Creek State Park and Little River State Beach, within Humboldt and Del Norte counties in northern California (Esri 2009, TIGER 2016). ... 10
Figure 2. Location of vegetation monitoring plots and treatment area at: (A) Gold Bluffs Beach, (B) Little River State Park, and (C) Tolowa Dunes State Park along the north coast of California (see Figure 1). Gray circles are control vegetation monitoring plots in which Ammophila arenaria was not treated. White circles are vegetation monitoring plots where manual removal of Ammophila arenaria occurred. Black circles are vegetation monitoring plots where mechanical removal of Ammophila arenaria occurred. Total treatment area is covered in either diagonal lines for manual removal, or horizontal lines for mechanical removal (Mills 2015, Esri 2009). ................................. 12
Figure 3. Plot layout for plant vegetation cover measurements. I established 25 m2 plots with three transects at 6.25 m, 12.5 m and 18.7 5m on the eastern edge of the 25 m2 plot. Along each transect, I placed a 1 m2 plant vegetation cover plot at 4.6 m, 9.1 m, 13.7 m, 18.3 m and 22.9 m away from the western boundary of the 25 m2 plot (methods adapted from Mills 2015). .............................................................................................. 14
Figure 4. Mean cover class of Ammophila arenaria with one standard deviation error bars (in a modified Braun-Blanquet cover class (Table 2)) at Gold Bluffs Beach before removal (July 2012-January 2013), one year post-treatment (February 2014), and 4 years post-treatment (May and September 2017) in manual, mechanical and control plots. Letters correspond to Dunn’s test groups with α<0.05 (Appendix B). ................. 19
Figure 5. Mean cover class of Ammophila arenaria with standard error bars (in a modified Braun-Blanquet cover class (Table 2)) at Tolowa Dunes seven years post-treatment (May and September 2017) in mechanical and control plots. Letters correspond to Dunn’s test groups α< 0.05 (Appendix C). .............................................. 20
Figure 6. Mean cover class of Ammophila arenaria with standard error bars (in a modified Braun-Blanquet cover class (Table 2)) at Little River State Park before treatment (2009), and one year (2010), 2 years (2011) and 8 years (May and September 2017) post-treatment in manual and control plots. Letters correspond to Dunn’s test groups α<0.05 (Appendix D). ......................................................................................... 21
Figure 7. Shannon’s diversity index for vegetation in all three plots types (control, manual and mechanical removal) at Gold Bluffs Beach before removal (July 2012-January 2013) in circles and 4 years after removal (September 2017) in squares. Native

ix
diversity is black and non-native is white. Letters correspond to Dunn’s test groups at α<0.05 (Appendix E). ..................................................................................................... 23
Figure 8. Shannon’s diversity index for vegetation in control and mechanical treatment plots at Little River before (2009) in circles and 8 years after removal (September 2017) in squares. Native diversity is black and non-native is white. Native diversity was not significantly different over time for all treatments (Kruskal-Wallis chi-squared = 4.6752, df = 3, p-value = 0.1972). Letters correspond to Dunn’s test groups at α<0.05 (Appendix E). ................................................................................................................. 24
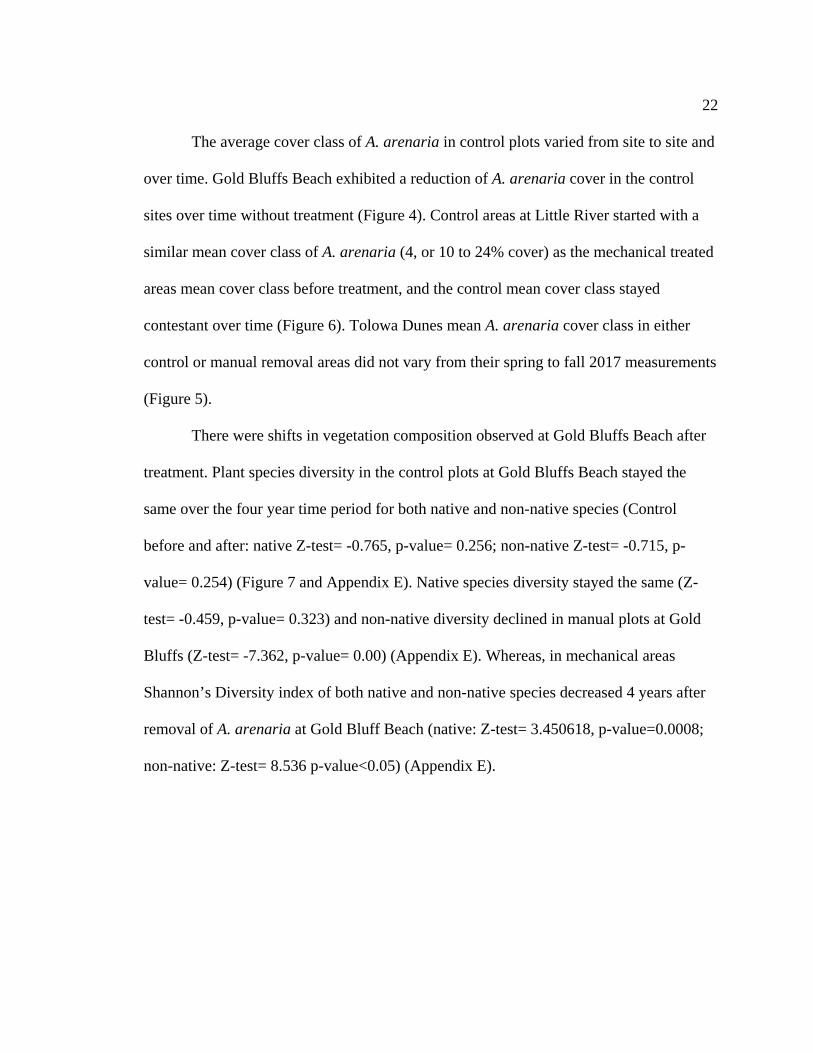
Figure 9. Shannon’s diversity index for vegetation in control and manual treatment plots at Tolowa Dunes 8 years after removal (September 2017). Native diversity is black and non-native is white. Native diversity was significantly different over time for all treatments (Kruskal-Wallis chi-squared = 21.551, df = 1, p-value <0.05). Non-native diversity did not differ between treatments (Kruskal-Wallis chi-squared = 0.19377, df = 1, p-value = 0.6598). ....................................................................................................... 25
Figure 10. Gold Bluffs Beach NMDS ordination, with 2 dimensions, of treatment groups with control (black circles), manual (gray pluses), and mechanical (open black squares) vegetation cover plots (with sand cover included). The stress was 0.138. Vectors are non-vegetation cover recorded in plots: litter: R2 =0.3382, p-value= 0.001, cobble: R2 =0.0111, p-value= 0.092. .............................................................................. 27
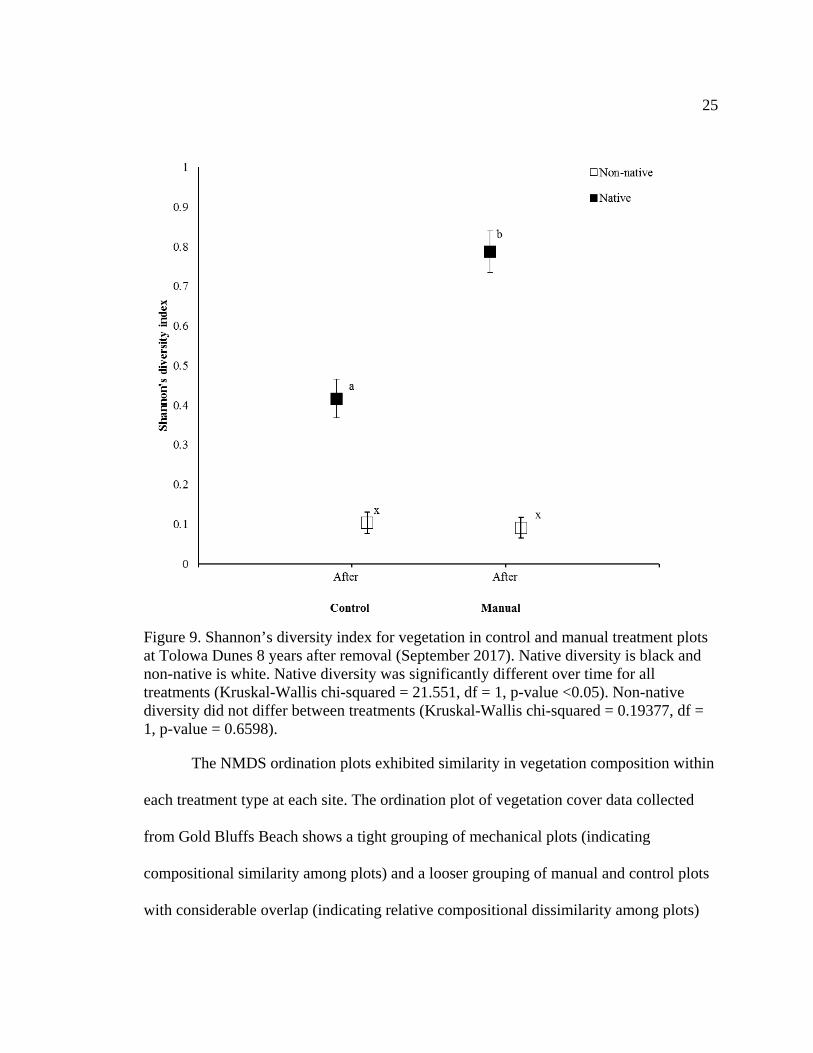
Figure 11. Little River NMDS ordination, with 2 dimensions, of treatment groups with control (black circles), and mechanical (open black squares) vegetation cover plots (with sand cover included). The stress was 0.115. Vectors are non-vegetation cover recorded in plots: litter: R2 =0.1955, p-value= 0.001, shell: R2 =0.0705, p-value= 0.014. ........................................................................................................................................ 28
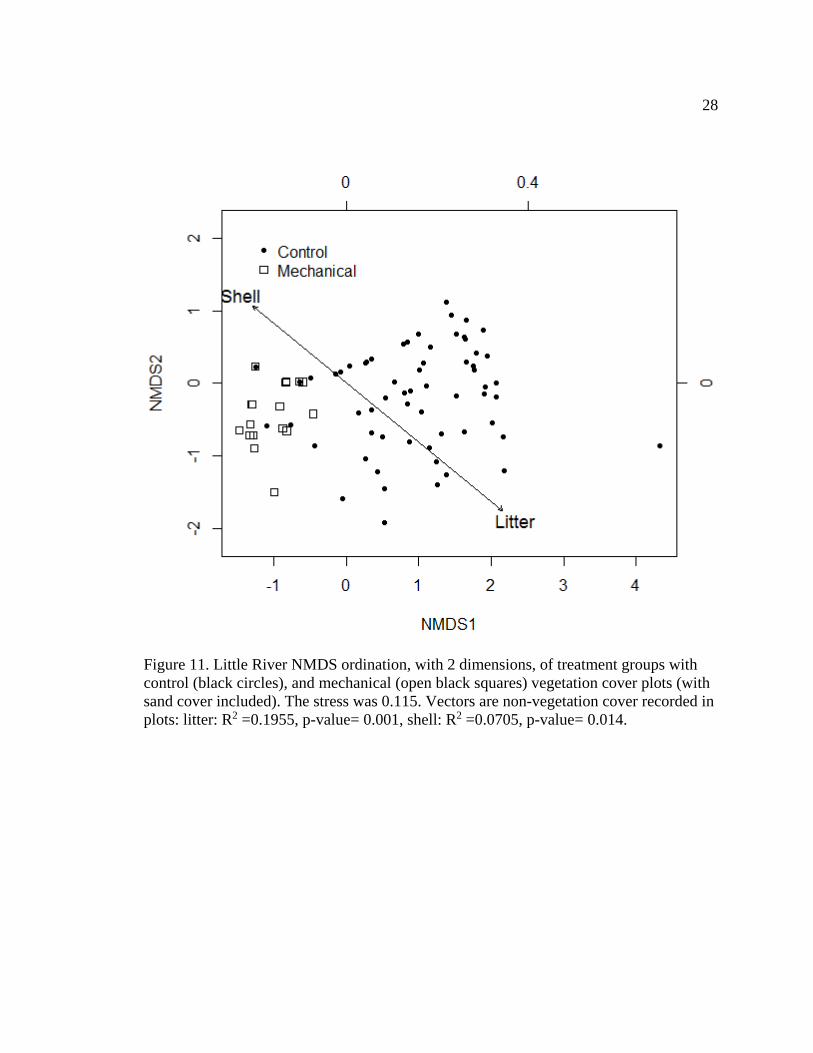
Figure 12. Tolowa Dunes NMDS ordination, with 2 dimensions, of treatment groups with control (black circles), and manual (gray pluses) vegetation cover plots (with sand cover included). The final stress was 0.139. Vectors are non-vegetation cover recorded in plots: cobble: R2 = 0.0940, p-value= 0.001, shell: R2 = 0.0649, p- value= 0.004, litter: R2 = 0.0843, p-value= 0.002, crust: R2 = 0.0305, p-value= 0.075. ................................. 29
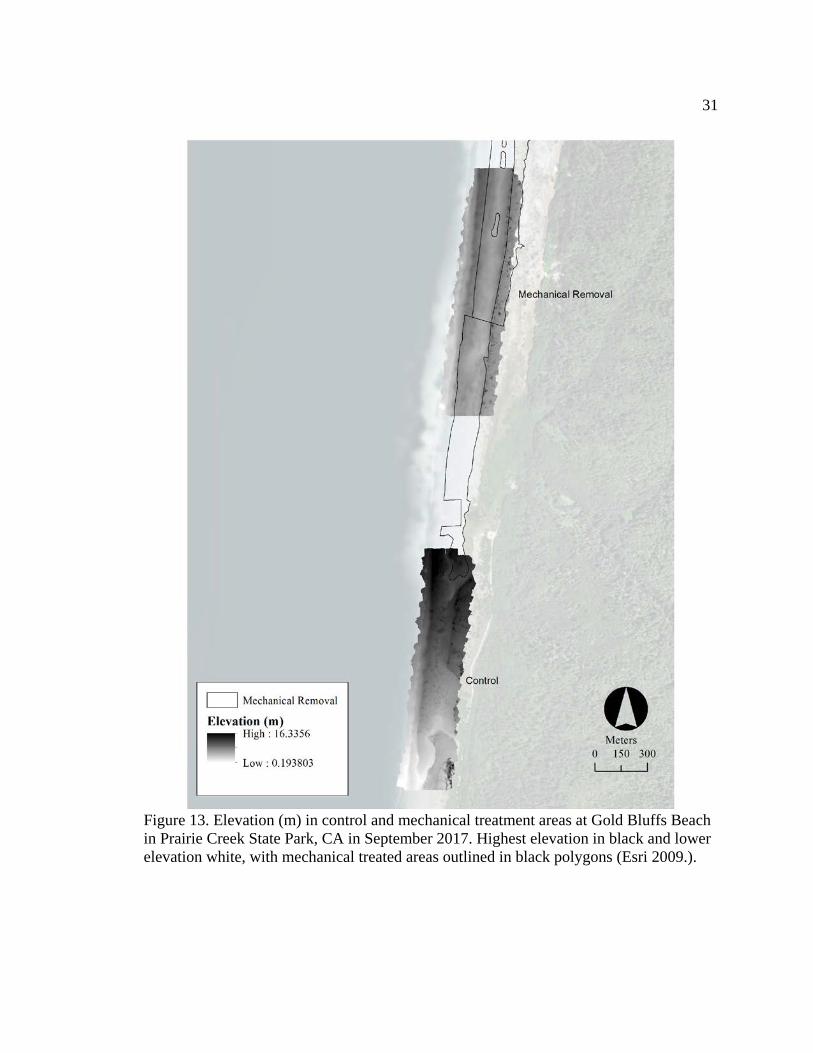
Figure 13. Elevation (m) in control and mechanical treatment areas at Gold Bluffs Beach in Prairie Creek State Park, CA in September 2017. Highest elevation in black and lower elevation white, with mechanical treated areas outlined in black polygons (Esri 2009.). .................................................................................................................... 31
Figure 14. Foredune elevation (m) for control and mechanical treatment areas at Gold Bluffs Beach in September 2017. Dots are outliers. ....................................................... 32

x
Figure 15. Elevation (m) in control and mechanical treatment areas at Little River State Park in March 2018. Highest elevation in black and lower elevation white, with mechanical treated areas outlined in black polygons (Esri 2009.). ................................ 33
Figure 16. Foredune elevation (m) for control and mechanical treatment areas at Little River in March 2018. Dots are outliers. ......................................................................... 34

xi
LIST OF APPENDICES
Appendix A: Plant species found during vegetation surveys, native status (Y for yes, and N for no), family, CNPS rare plant status and Cal IPC rating. ................................ 51
Appendix B: Gold Bluffs Beach’s Dunn’s test after Kruskal Wallis between each treatments, manual, mechanical and control, Ammophila arenaria cover for before removal (July 2012-January 2013), one year after removal (February 2014), and 4 years after removal (May and September 2017)(Bolded p-values are less than 0.05). ........... 57
Appendix C: Tolowa Dune’s Dunn’s test after Kruskal Wallis between each treatments, manual and control, Ammophila arenaria cover for 7 year after treatment (in May and September) (bold p-values are less than 0.05). ............................................................... 59
Appendix D: Little River’s Dunn’s test after Kruskal Wallis between each treatments, control and mechanical, Ammophila arenaria cover for before treatment (2009), and one year (2010), 2 years (2011) and 8 years (May and September 2017) after removal year after treatment (in May and September)(bolded p-values are less than 0.05). ....... 60
Appendix E: Dunn’s table for before and after comparisons of native and non-native diversity .......................................................................................................................... 62
Appendix F: Gold Bluffs Beach Shannon diversity index before treatment and 4 years after treatment on native and non-native plant species. .................................................. 64
Appendix G: Little Rivers Shannon diversity index before treatment and 4 years after treatment on native and non-native plant species ........................................................... 65
Appendix H: Tolowa Dunes Shannon diversity index 7 years after treatment on native and non-native plant species ........................................................................................... 66
Appendix I: Gold Bluffs Beach mean Ammophila arenaria cover ................................ 67
Appendix J: Little River mean Ammophila arenaria cover ........................................... 68
Appendix K: Tolowa Dunes mean Ammophila arenaria cover ..................................... 69

1
INTRODUCTION
The invasion of non-native species causes large scale habitat alteration, and
ecological restoration is one tool to reduce their impact. Invasive species are credited as
one of the largest threats to endangered species and loss of biodiversity, second only to
habitat loss (Wilcove et al. 1998). There are 50,000 non-native species in the United
States, and $137 billion are spent annually in the U.S. in response to the damages
incurred by non-native invasive species (Pimentel et al. 2000). The removal of invasive
species as part of the restoration process can allow native organisms to rebound and
return ecosystems to a less altered state (Hobbs and Harris 2001, Zavaleta et al. 2001).
However, in order to restore an ecosystem’s structure and function, control of invasive
species should include the management of ecosystem function and non-target species
recovery (SER 2004, Zarnetske et al. 2010).
Coastal sand dunes are dynamic systems subject to a variety of natural and
anthropogenic stresses, including impacts from invasive species. Coastal sand dunes
make up 42% of the coastline of the Pacific Northwest region of the United States or
about 1,000 km of shoreline (Wiedemann 1984, Wiedemann and Pickart 1996). Coastal
sand dunes are an ever-changing environment, subject to high variability in wind speed,
temperature, salinity, and spatial arrangement (Wiedemann 1984). The Pacific Northwest
coastal sand dunes are subject to wet, rainy winters and warm, dry summers in addition to
other extreme weather (Wiedemann 1984). High winds shift the sand and create a natural
foredune, the ridge adjacent to the shore (Pickart and Sawyer 1998, McDonald 2015).
2
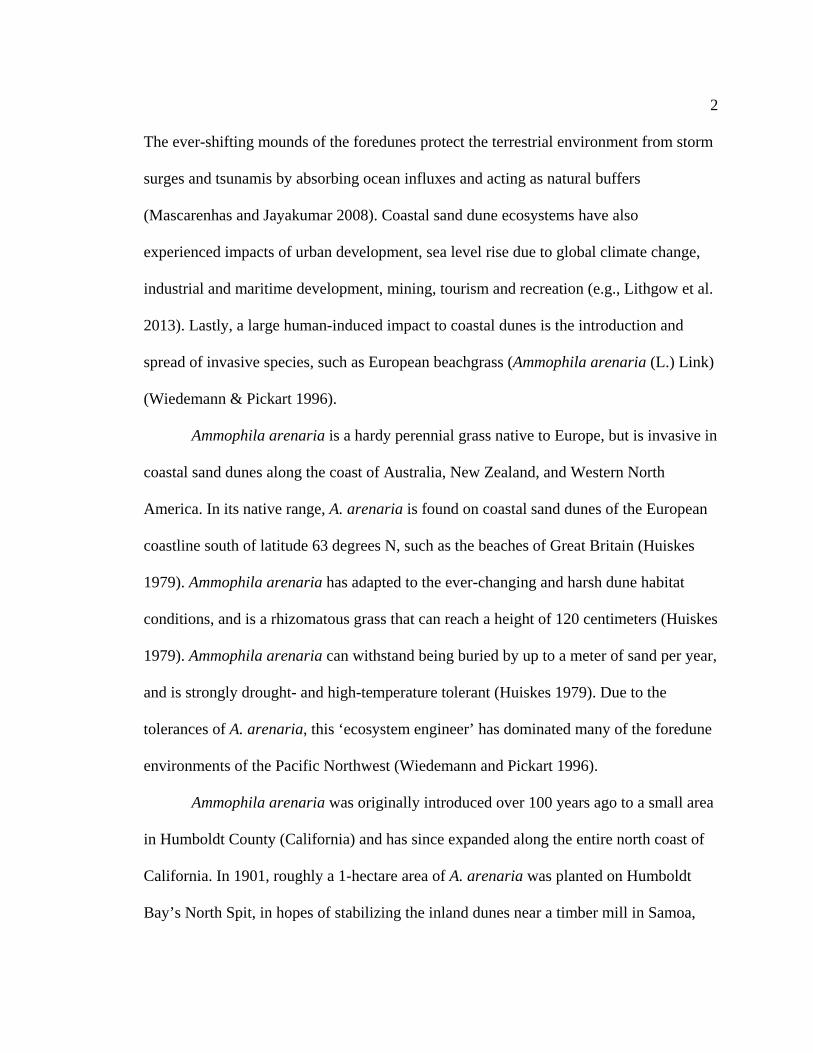
The ever-shifting mounds of the foredunes protect the terrestrial environment from storm
surges and tsunamis by absorbing ocean influxes and acting as natural buffers
(Mascarenhas and Jayakumar 2008). Coastal sand dune ecosystems have also
experienced impacts of urban development, sea level rise due to global climate change,
industrial and maritime development, mining, tourism and recreation (e.g., Lithgow et al.
2013). Lastly, a large human-induced impact to coastal dunes is the introduction and
spread of invasive species, such as European beachgrass (Ammophila arenaria (L.) Link)
(Wiedemann & Pickart 1996).
Ammophila arenaria is a hardy perennial grass native to Europe, but is invasive in
coastal sand dunes along the coast of Australia, New Zealand, and Western North
America. In its native range, A. arenaria is found on coastal sand dunes of the European
coastline south of latitude 63 degrees N, such as the beaches of Great Britain (Huiskes
1979). Ammophila arenaria has adapted to the ever-changing and harsh dune habitat
conditions, and is a rhizomatous grass that can reach a height of 120 centimeters (Huiskes
1979). Ammophila arenaria can withstand being buried by up to a meter of sand per year,
and is strongly drought- and high-temperature tolerant (Huiskes 1979). Due to the
tolerances of A. arenaria, this ‘ecosystem engineer’ has dominated many of the foredune
environments of the Pacific Northwest (Wiedemann and Pickart 1996).
Ammophila arenaria was originally introduced over 100 years ago to a small area
in Humboldt County (California) and has since expanded along the entire north coast of
California. In 1901, roughly a 1-hectare area of A. arenaria was planted on Humboldt
Bay’s North Spit, in hopes of stabilizing the inland dunes near a timber mill in Samoa,

3
California (Buell et al. 1995). Other plantings of A. arenaria occurred near buildings and
railroads in the Humboldt Bay Area to stabilize the sand in the early 1900’s (Buell et al.
1995, Pickart and Sawyer 1998). Control and removal of A. arenaria in the Humboldt
Bay Area began in the 1980’s (Buell et al. 1995). In a study of aerial photographs, Buell
et al. (1995) found a 574% increase in A. arenaria cover from 1939/1942 to 1989 on the
North Spit dunes of Humboldt Bay. In comparison, aerial photographs of the Oregon
coast from the 1930s shows little to no vegetation on the foredunes, an indication that A.
arenaria had not invaded at that time (Wiedemann and Pickart 1996).
Ammophila arenaria alters dune morphology by stabilizing the foredunes and
hampering dune migration. Wind, sand, water and vegetative cover are the most common
influences to dune morphology (Wiedemann 1984). Prior to the A. arenaria invasion, the
native foredune vegetative composition was dominated by Elymus mollis (American dune
grass) and the morphology consisted of lower elevation dune hummocks (i.e., mounds)
spaced close together (Wiedemann 1984). Researchers speculate that A. arenaria has
increased the height of the foredunes up to an elevation of 10 meters above sea level
(asl), which may be unnatural for the Pacific Northwest dunes system (Wiedemann and
Pickart 1996). The stabilization of a foredune ridge can prevent sand from building up on
the back dunes, which can “starve” the back dunes of windblown sand, altering the
habitat and killing off native dune plant species (Wiedemann and Pickart 1996, Hart et al.
2012).
In addition to foredune stabilization, A. arenaria can cause declines in native
populations of flora and fauna. The Western Snowy Plover (Charadrius nivosus nivosus)

4
is listed as a threatened species by the U.S. federal government, and as a species of
concern by the State of California (California State Park North Coast Redwoods District
2015). Snowy Plovers nest and breed on coastal sand dunes, and are the focus of
restoration efforts in Pacific Northwest coastal sand dunes (Zarnetske et al. 2010, Hardy
and Colwell 2012). Snowy Plovers prefer nesting sites where A. arenaria has been
removed, either by mechanical, manual, chemical, burning or a combination of removal
treatments has occurred (Muir and Colwell 2010, Zarnetske et al. 2010). Native dune mat
is a community of annual and perennial flora that inhabit the foredunes and nearshore
dune ridges (Pickart and Barbour 2007). Ammophila arenaria prevents the mobilization
of sand to the back dunes, thus impacting native dune mat species (Wiedemann and
Pickart 1996) such as the rare and endangered pink sand verbena (Abronia umbellate var.
breviflora), beach pea (Lathyrus japonicas), Menzies’ wallflower (Erysimum menziesii),
and beach layia (Layia carnosa) (Mills 2015).
Many A. arenaria removal treatments have been employed along the western
coast of the United States including using fire, mowing, pesticides, and mechanical and
manual removal (Pickart and Sawyer 1998, Forys et al. 2009). Each treatment method
provides some decline in A. arenaria vegetation cover. However, the two treatments most
commonly used on the dunes of the California State Parks North Coast Redwood District
beaches are manual and mechanical removal (Pickart and Sawyer 1998, Forys et al. 2009,
Transou 2012, Wisehart 2012). Mechanical removal involves using bulldozers to bury A.
arenaria up to 2 meters under the sand and regrade the foredune (Forys et al. 2009). In
contrast, hand removal utilizes shovels to excavate the plant up to a depth of 0.6 meters

5
(2 feet); then the pulled A. arenaria vegetation is piled and burned to prevent the spread
of its seeds (Forys et al. 2009). Manual removal is estimated to cost between $36,600 to
$54,590/hectare depending on depth of burial and distance to site (Pickart 1997, Pickart
and Sawyer 1998, Peterson 2004). In contrast, cost estimates for the mechanical
treatment of A. arenaria range from $13,256 to $38,769/hectare, which may include
equipment rental, operator salary, and fuel (Peterson 2004, Hyland and Holloran 2005).
However, the lower mechanical removal cost estimate does not take into account
retreatments after the initial burial, which may underestimate the total cost of removal.
Mechanical removal, although it does not discern between native and invasive plants,
may bury the rhizomes of A. arenaria far enough to allow natives a slight edge in
recolonizing the dunes at first (Pickart and Sawyer 1998). This one-time advantage for
native plants may allow them to outcompete A. arenaria for space.
Currently there are conflicting studies that have been conducted on the removal of
A. arenaria and its effect on native plant communities. The California State Parks found
that native species recover after A. arenaria removal in both mechanical and manual
restoration sites (Forys 2015). However, a study by Zarnetske et al. (2010), of
Washington and Oregon coastal sand dunes, found that native and endemic plant
abundance declined in association with both mechanical and manual restoration
techniques. Zarnetske et al. (2010) cited the high disturbance level of mechanical removal
for hindering native plant re-establishment. In addition, Mills (2015) found that one year
after treatment at Golds Bluffs Beach in northern California, there was no difference in
native plant cover between mechanical and manual restored sites, and control plots had a

6
higher abundance of native plants. Without clear information on the effectiveness of
restoration treatments it can be difficult to make appropriate land management decisions.
Furthermore, removal of A. arenaria, can influence the morphology of the dunes,
but more measurements to determine the extent of change are needed. Part of the goal of
removing A. arenaria is to return the dunes to pre-invasion height and the ecosystem to
its proper functioning state of flux (Zarnetske et al. 2010). Vaughan (2015) and
McDonald (2015) found no difference between invaded sites and restored sites’ elevation
on northern California beaches. In contrast, Zarnetske et al. (2010) found that in the
Pacific Northwest, the repetitive and intensive use of bulldozers to remove A. arenaria
may have flattened the foredune, which was exhibited by the wider and shorter foredune
than those observed in control (invaded unrestored) areas. The conflicting reports could
be due to the equipment used to measure the dune morphology. Currently, the California
State Parks use a Real Time Kinematic (RTK) global positioning system (GPS), which is
accurate to within a centimeter for elevation. (Vaughan 2015). However, it is not a
continuous data set as only one elevation point can be taken at a time (Vaughan 2015).
Other techniques include 30-meter digital elevation models (DEM), and Light Detection
and Ranging (LiDAR) data, which may not be at an appropriate scale or time interval to
measure any difference among treatments and control sites (Vaughan 2015, McDonald
2015). Unmanned Aerial Vehicles (UAV), used with Structure from Motion (SfM), can
produce a cloud of data points (location with elevation data) that can measure the dune
topography with quality, and vertical accuracy comparable with RTK and LiDAR
surveys (Mancini et al. 2013).

7
Research Objectives
The objectives of my graduate thesis research were to examine the effects that
manual and mechanical removal techniques of A. arenaria have on coastal sand dune
morphology and vegetative cover and species abundance over time. The quantification of
native dune vegetation cover at sites where removal of A. arenaria has occurred can
assess the recovery of the plant community over time. By examining different treatment
types of A. arenaria removal at different times since treatment, I observed time-
dependent effects of removal on the non-target parameters, native dune plants and dune
elevation changes in comparison to unrestored sites. Overall, my objectives were: 1) to
determine if one removal treatment (manual or mechanical) is more effective at lowering
the A. arenaria population and increasing the native dune plant population over the long
term; and 2) to compare the dune morphology and elevation of treated and untreated sites
to assess which treatment lowered the foredune and restored the morphology to pre-
invasion conditions.
The results of my research have the potential to help land managers select the
most effective removal techniques for A. arenaria in the future. The long-term effects of
A. arenaria removal could have a profound effect on dune vegetation diversity,
morphology and the dunes’ ability to mitigate storm surges and coastal changes. My
Masters research has allowed for a refinement in removal and monitoring methods that
can improve habitats for threatened species such as Snowy Plover and endangered dune
mat flowers such as beach layia, and Menzies' wallflower.

8
MATERIALS AND METHODS
Study Sites
The California State Parks Redwood District manages three coastal sand dune
ecosystems in which they have conducted A. arenaria removal efforts: (1) Gold Bluffs
Beach in Prairie Creek Redwoods State Park; (2) Little River State Beach; and (3)
Tolowa Dunes State Park (Table 1 and Figure 1). In 2009, mechanical removal of A.
arenaria began at Little River State Beach. Mechanical removal utilized bulldozers to
bury A. arenaria up to 2 meters under the sand and regrade the foredune to a 2% to 5%
slope (Forys et al. 2009, Forys 2015). After the initial treatment at Little River State
Beach, manual removal was performed approximately three times for the first year and
one to two times per year after the first year, to treat resprouts of A. arenaria. Hired
crews used shovels to excavate the plant up to a depth of 0.6 meters during manual
retreatment (Forys et al. 2009, Mills 2015). Seeding of beach morning glory (Calystegia
soldanella), beach bursage (Ambrosia chamissonis), yellow sand verbena (Abronia
latifolia), beach pea (Lathyrus littoralis), beach buckwheat (Eriogonum latifolium),
yarrow (Achillea millefolium), dune goldenrod (Solidago spathulata), seaside daisy
(Erigeron glaucus), and glehnia (Glehnia llittoralis subsp.leiocarpa) occurred at Little
River after initial mechanical removal of A. arenaria (Forys 2015). Gold Bluffs Beach
underwent the same mechanical treatment as Little River State Beach using bulldozers in
2013, with some areas receiving only manual removal (Transou 2012). Some seeding of

9
yellow sand verbena (Abronia latifolia), pink sand verbena (Abronia umbellata var.
breviflora), and American glehnia (Glehnia littoralis subsp. leiocarpa.) took place after
intimal mechanical treatment at Gold Bluff Beach (Transou 2012). In addition, beach
strawberry (Fragaria chiloensis) and beach evening primrose (Camissoniopsis
cheiranthifolia) were transplanted into the treatment area at Gold Bluffs Beach (Transou
2012). Tolowa Dunes, due to its cultural significance, has undergone only manual
removal of A. arenaria since 2010 (Wisehart 2012).
Table 1. The start date of initial treatment to remove Ammophila arenaria, treatment method, and acreage treated at each of my research sites: Little River State Beach, Tolowa Dunes State Park, and Gold Bluffs Beach in Prairie Creek Redwoods State Park. Follow-up manual treatment occurred approximately 3 times the first year, and once to twice a year the following years for all treatment types (Forys et al. 2009, Transou 2012, Wisehart 2012, and Mills 2015). Site Start of
Restoration Treatment Method Acres Treated
Little River 2009 Mechanical (seeding occurred) 42 Tolowa Dunes 2010 Manual 27 Gold Bluffs 2013 Mechanical and manual
(seeding occurred) 73 (mechanical) and 11(manual)

10
Figure 1. Study site locations in three California State Parks: Tolowa Dunes State Park, Gold Bluffs Beach in Prairie Creek State Park and Little River State Beach, within Humboldt and Del Norte counties in northern California (Esri 2009, TIGER 2016).

11
Vegetation Monitoring
In order to measure the cover of foredune vegetation in areas of mechanical and
manual A. arenaria removal, I re-surveyed vegetation in established plots of manual and
mechanical removal and adjacent unrestored sites at Gold Bluffs Beach and Little River
State Beach (Mills 2015, Forys et al. 2009), as well as in new vegetation monitoring plots
at Tolowa Dunes (Figure 2). I conducted vegetation surveys once in May and again in
September 2017 at all three sites. I located pre-established plots using a Garmin GPSmap
60CSx unit, with an accuracy of less than 10 m. I measured a total of 37 previously
surveyed 5m × 5m (25m2) plots (i.e., 28 within Gold Bluffs Beach, and nine within Little
River State Beach; there were no pre-established plots at Tolowa Dunes). I did not re-
survey two pre-established plots at Gold Bluffs Beach, one in a manual removal area and
the other in a mechanical removal area, due to erosion of the foredune leaving the plots in
the waveslope, the area below the high tide line, where vegetation does not typically
grow. Mills (2015) measured vegetation cover at Gold Bluffs Beach in 2012, before
removal of A. arenaria and again one year after treatment. Forys et al. (2009) monitored
vegetation at Little River State Beach before removal in 2009, as well as once every year
after the initial mechanical treatment until 2016. I also used ArcMap (version 10.4.1) to
randomly select twelve new 25 m2 plots at Tolowa Dunes, six within manual removal
areas and six within unrestored control areas.

12
Figure 2. Location of vegetation monitoring plots and treatment area at: (A) Gold Bluffs Beach, (B) Little River State Park, and (C) Tolowa Dunes State Park along the north coast of California (see Figure 1). Gray circles are control vegetation monitoring plots in which Ammophila arenaria was not treated. White circles are vegetation monitoring plots where manual removal of Ammophila arenaria occurred. Black circles are vegetation monitoring plots where mechanical removal of Ammophila arenaria occurred. Total treatment area is covered in either diagonal lines for manual removal, or horizontal lines for mechanical removal (Mills 2015, Esri 2009).

13
Within the A. arenaria survey plots, I measured the vegetation cover in fifteen 1
m2 quadrats. In a previous study (Mills 2015), each plot was marked with rebar at the
northwest corner. In the event that I was unable to find a rebar marker for a plot, I used
a Garmin GPS to reestablish the plot and marked the plot with new rebar. Along the
eastern edge of each 25 m2 plot, I placed three equally-spaced transects perpendicular to
the shoreline at intervals of 6.25 m, 12.50 m, and 18.75 m. I placed 1 m2 quadrats to
measure plant vegetation cover along each transect at 4.6 m, 9.1 m, 13.7 m, 18.3 m and
22.9 m (Figure 3). In each 1 m2 quadrat, I measured the percentage cover for each
species of dune vegetation and non-vegetation cover (cobble, crust, litter, sand and
wood) then transformed the percentages into a modified Braun-Blanquet et al. (1932)
cover scale to match previous data collected (Table 2). Cobble was defined by the
Wentworth scale as sediment with a grain diameter between 65 to 250 mm (Wentworth
1922). Crust was biogenic soil crust, which is made up of cyanobacteria, lichen, mosses
and other organisms (Belnap and Lange 2001). Litter was considered any organic cover
not rooted, that was not woody and usually dead (Michelle Forys, personal comm.
2017). Wood cover was defined as any cover material not rooted and made of woody
material, such as logs and twigs (Michelle Forys, personal comm. 2017). Sand was
defined as any sediment with a grain diameter between 1-0.125 mm (Wentworth 1922).

14
Figure 3. Plot layout for plant vegetation cover measurements. I established 25 m2 plots with three transects at 6.25 m, 12.5 m and 18.7 5m on the eastern edge of the 25 m2 plot. Along each transect, I placed a 1 m2 plant vegetation cover plot at 4.6 m, 9.1 m, 13.7 m, 18.3 m and 22.9 m away from the western boundary of the 25 m2 plot (methods adapted from Mills 2015).

15
Table 2. Modified Braun-Blanquet cover classes used for vegetation and cover measurements in 1m2 quadrats (Braun-Blanquet et al. 1932, Mills 2015).
Cover Class Range of Cover (%) 0 0 1 >0 to <1 2 1 - <5 3 5 - <10 4 10 - <25 5 25 - <50 6 50 - <75 7 75 - <100
Statistical analysis included a comparison of A. arenaria percentage cover, and
diversity for each treatment type at each site. I analyzed the modified Braun-Blanquet
cover scale of A. arenaria at each treatment and site by using a Kruskal-Wallis test
(α=0.05) and a Dunn's Test of Multiple Comparisons Using Rank Sums to assess
differences among groups, with a Benjamini-Hochberg adjustment to p-values in R
package dunn.test (2017) (Dunn 1964). I calculated Shannon’s diversity index for each
site and treatment type before and after treatment. I used a Kruskal-Wallis test to assess
differences between treatment type’s Shannon’s diversity indexes. A post-hoc Dunn’s
test was done to the Shannon diversity differences to groups with a Kruskal-Wallis test
(α=0.05).
I performed a non-metric multidimensional scaling (NMDS) ordination using
the Jaccard index of dissimilarity of the vegetation cover, in percentage cover, at the
three sites for the three categories of treatment: mechanical, manual and untreated
controls. NMDS was used to avoid assumptions of a linear relationship among variables

16
and because it uses ranked distances from the distance matrix (McCune and Grace
2002). I deleted rare taxa that occurred in less than 1% of the quadrats, a modified
approach of deleting rare species from McCune and Grace (2002). The NMDS
generates a set of orthogonal synthetic axes to plot the differences in species
composition for each plot spatially (McCune and Grace 2002, Rogers et al. 2008).
Using the R package vegan (2018), I ran the ordination for 1,000 maximum iterations
and 1,000 real runs. McCune and Grace (2002) suggest using NMDS results with stress
less than 0.2. I performed a permutational multivariate analysis of variance
(PerMANOVA) on the Jaccard distances for the sites to assess differences in the group
means of vegetation composition for the most recent vegetation cover measured
(September 2017) (Anderson 2001, McCune and Grace 2002). In a perMANOVA, the
sum of squared distances is calculated from the average interpoint distance of each
group to assess difference between the treatment types composition of cover.
Dune Morphology Survey
In order to measure dune morphology at restored and unrestored sites, I used a
DJI Phantom 4 Unmanned Aerial Vehicle (UAV) with a 12.4M camera and ground
control points with a Trimble Juno 5, with an accuracy between 1 to 4m. The UAV was
flown by a licensed UAV operator over the three treatment types at an altitude of 75 m.
Data collection occurred in September 2017 at Gold Bluffs Beach, and March 2018 at
Little River State Park. The UAV operator set the camera mounted on the UAV gimbal

17
to take one shot per second, for 70% overlap, with waypoints turned on to record GPS
points for the photographs. I processed the photographs in SfM software, Agisoft
PhotoScan 1.3.5, in order to create a redundant set of overlapping images with which to
reconstruct the 3-dimensional geometry of the dunes. In order to line up the images, I
first found the overlapping points of in the photographs using SfM. Next, I created a
pixel-based stereoscope with the waypoint data and photographs to create a digital
elevation model (DEM) of the dunes (Mancini et al. 2013). I used BlueSpray beta 24 to
extract the highest elevations along the nearshore dunes in each treatment area. A
Kruskal-Wallis test was used to assess any differences among the foredune heights in
each treatment and control area.

18
RESULTS
Vegetation Analysis
The comparison of both mechanical and manual treatments lowered A. arenaria
cover in restoration areas. A comparison of A. arenaria resprouts at Gold Bluffs Beach
found that mechanical removal was slightly more effective at reducing cover of A.
arenaria compared to manual removal at all time intervals compared (manual and
mechanical: 1 year Z test= 8.55, p-value< 0.05; 4 years (May) Z-test= 2.65, p-value=
0.005; 4 years (September) Z-test= 2.19, p-value=0.0171) (Figure 4 and Appendix B).
This advantage is greater directly after removal and levels out over time (manual and
mechanical 1 year Z test= 8.55, p-value< 0.05). Tolowa Dunes had the lowest A.
arenaria cover measured in manual removal plots, with a mean cover class and standard
error of 1.02±0.15 (which is less than 1% cover of A. arenaria) for September 2017
monitoring (Figure 5 and Appendix C). Gold Bluffs Beach, Little River (Figure 6), and
Tolowa Dunes had significantly different percentage cover of A. arenaria among their
treated areas and the adjacent controls for all time steps (Gold Bluffs Beach: control and
manual (Appendix B, Appendix C, Appendix D).

19
Figure 4. Mean cover class of Ammophila arenaria with one standard deviation error bars (in a modified Braun-Blanquet cover class (Table 2)) at Gold Bluffs Beach before removal (July 2012-January 2013), one year post-treatment (February 2014), and 4 years post-treatment (May and September 2017) in manual, mechanical and control plots. Letters correspond to Dunn’s test groups with α<0.05 (Appendix B).

20
Figure 5. Mean cover class of Ammophila arenaria with standard error bars (in a modified Braun-Blanquet cover class (Table 2)) at Tolowa Dunes seven years post-treatment (May and September 2017) in mechanical and control plots. Letters correspond to Dunn’s test groups α< 0.05 (Appendix C).

21
Figure 6. Mean cover class of Ammophila arenaria with standard error bars (in a modified Braun-Blanquet cover class (Table 2)) at Little River State Park before treatment (2009), and one year (2010), 2 years (2011) and 8 years (May and September 2017) post-treatment in manual and control plots. Letters correspond to Dunn’s test groups α<0.05 (Appendix D).
22
The average cover class of A. arenaria in control plots varied from site to site and
over time. Gold Bluffs Beach exhibited a reduction of A. arenaria cover in the control
sites over time without treatment (Figure 4). Control areas at Little River started with a
similar mean cover class of A. arenaria (4, or 10 to 24% cover) as the mechanical treated
areas mean cover class before treatment, and the control mean cover class stayed
contestant over time (Figure 6). Tolowa Dunes mean A. arenaria cover class in either
control or manual removal areas did not vary from their spring to fall 2017 measurements
(Figure 5).
There were shifts in vegetation composition observed at Gold Bluffs Beach after
treatment. Plant species diversity in the control plots at Gold Bluffs Beach stayed the
same over the four year time period for both native and non-native species (Control
before and after: native Z-test= -0.765, p-value= 0.256; non-native Z-test= -0.715, p-
value= 0.254) (Figure 7 and Appendix E). Native species diversity stayed the same (Z-
test= -0.459, p-value= 0.323) and non-native diversity declined in manual plots at Gold
Bluffs (Z-test= -7.362, p-value= 0.00) (Appendix E). Whereas, in mechanical areas
Shannon’s Diversity index of both native and non-native species decreased 4 years after
removal of A. arenaria at Gold Bluff Beach (native: Z-test= 3.450618, p-value=0.0008;
non-native: Z-test= 8.536 p-value<0.05) (Appendix E).

23
Figure 7. Shannon’s diversity index for vegetation in all three plots types (control, manual and mechanical removal) at Gold Bluffs Beach before removal (July 2012-January 2013) in circles and 4 years after removal (September 2017) in squares. Native diversity is black and non-native is white. Letters correspond to Dunn’s test groups at α<0.05 (Appendix E).
At Little River, diversity of non-native plants declined over the 8 years since
treatment. Mechanical non-native diversity decreased after treatment (Z-test= 5.54, p-
value<0.05 (Figure 8 and Appendix E). Within control areas, non-native diversity
decreased, but not as low as mechanical (Z-test= 2.65, p-value= 0.008) (Figure 8 and
Appendix E). Native diversity stayed constant over time in both control and mechanical
treatment areas (Kruskal-Wallis chi-squared = 4.6752, df = 3, p-value = 0.197) (Figure
8).

24
Figure 8. Shannon’s diversity index for vegetation in control and mechanical treatment plots at Little River before (2009) in circles and 8 years after removal (September 2017) in squares. Native diversity is black and non-native is white. Native diversity was not significantly different over time for all treatments (Kruskal-Wallis chi-squared = 4.6752, df = 3, p-value = 0.1972). Letters correspond to Dunn’s test groups at α<0.05 (Appendix E).
At Tolowa Dunes, some differences in diversity between manual removal and
control areas were observed. Non-native diversity was the same between control and
manual treatment areas (Kruskal-Wallis chi-squared = 0.19377, df = 1, p-value = 0.6598)
(Figure 9), whereas native diversity differed between manual and control areas, with
higher native diversity in manual areas (Kruskal-Wallis chi-squared = 21.551, df = 1, p-
value <0.05) (Figure 9).
25
Figure 9. Shannon’s diversity index for vegetation in control and manual treatment plots at Tolowa Dunes 8 years after removal (September 2017). Native diversity is black and non-native is white. Native diversity was significantly different over time for all treatments (Kruskal-Wallis chi-squared = 21.551, df = 1, p-value <0.05). Non-native diversity did not differ between treatments (Kruskal-Wallis chi-squared = 0.19377, df = 1, p-value = 0.6598).
The NMDS ordination plots exhibited similarity in vegetation composition within
each treatment type at each site. The ordination plot of vegetation cover data collected
from Gold Bluffs Beach shows a tight grouping of mechanical plots (indicating
compositional similarity among plots) and a looser grouping of manual and control plots
with considerable overlap (indicating relative compositional dissimilarity among plots)

26
(Figure 10). Control plots were more associated with litter (R2 =0.3382, p-value= 0.001),
whereas manual and mechanical plots were associated with cobble (R2 =0.0111, p-
value= 0.092). A perMANOVA for the treatments at Gold Bluffs Beach found significant
differences among treatments with a low R2 (F=31.88, df= 2, R2= 0.1326, p-
value=0.005). Little River’s NMDS ordination plot showed a tighter grouping of
mechanically treated plots compared to control plots, which indicates that control plots at
Little River had more variation in cover than mechanical plots (Figure 11). Litter was
more associated with control plots (R2 =0.1955, p-value= 0.001) and shell with
mechanical plots (R2 =0.0705, p-value= 0.014). A perMANOVA between Little River’s
mechanical and control Jaccard distances was significant with a higher R2 (F= 104.56,
df=1, R2 = 0.440, p-value= 0.005). Tolowa Dune’s NMDS ordination plot showed
minimal overlap between control plots and manual plots, suggesting the vegetation cover
differed among most of plots (Figure 12). Litter and crust where more associated with
control plots (litter: R2 = 0.0843, p-value= 0.002, crust: R2 = 0.0305, p-value= 0.075)
whereas cobble and shell where more associated with manual plots (cobble: R2 = 0.0940,
p-value= 0.001, shell: R2 = 0.0649, p- value= 0.004). A perMANOVA between Tolowa
Dunes manual and control Jaccard distances was significant with a low R2 (F= 84.126,
df=1, R2 = 0.321, p-value= 0.005).

27
Figure 10. Gold Bluffs Beach NMDS ordination, with 2 dimensions, of treatment groups with control (black circles), manual (gray pluses), and mechanical (open black squares) vegetation cover plots (with sand cover included). The stress was 0.138. Vectors are non-vegetation cover recorded in plots: litter: R2 =0.3382, p-value= 0.001, cobble: R2 =0.0111, p-value= 0.092.
28
Figure 11. Little River NMDS ordination, with 2 dimensions, of treatment groups with control (black circles), and mechanical (open black squares) vegetation cover plots (with sand cover included). The stress was 0.115. Vectors are non-vegetation cover recorded in plots: litter: R2 =0.1955, p-value= 0.001, shell: R2 =0.0705, p-value= 0.014.
29
Figure 12. Tolowa Dunes NMDS ordination, with 2 dimensions, of treatment groups with control (black circles), and manual (gray pluses) vegetation cover plots (with sand cover included). The final stress was 0.139. Vectors are non-vegetation cover recorded in plots: cobble: R2 = 0.0940, p-value= 0.001, shell: R2 = 0.0649, p- value= 0.004, litter: R2 = 0.0843, p-value= 0.002, crust: R2 = 0.0305, p-value= 0.075.

30
Dune morphology
Dune morphology captured with UAV imagery showed differences between
foredune height and formation between control and mechanical treatment areas at the
sites surveyed. At Gold Bluff’s Beach the overall shape of the foredune in 2017 was
raised linear mounds perpendicular to the shoreline (Figure 13). In control areas, the
foredune was higher at one end and lower at the other but also had the same shape as the
mechanically treated area. The foredune height was higher in control areas, with a mean
and standard deviation of 10.49 ± 2.07 m, than mechanical treated areas with a mean and
standard deviation of 8.32 ± 0.79m (Kruskal-Wallis chi-squared = 126810, df = 1, p-
value<0.05) (Figure 14).
31
Figure 13. Elevation (m) in control and mechanical treatment areas at Gold Bluffs Beach in Prairie Creek State Park, CA in September 2017. Highest elevation in black and lower elevation white, with mechanical treated areas outlined in black polygons (Esri 2009.).

32
Figure 14. Foredune elevation (m) for control and mechanical treatment areas at Gold Bluffs Beach in September 2017. Dots are outliers.
At Little River, there was also a difference in dune morphology and foredune
height between mechanical and control treatment areas. In the mechanical removal areas,
the foredune was in the shape small dune hammocks, small “U” shaped mounds
perpendicular to the ocean. In the control areas, the foredune was a tall ridge
perpendicular to the ocean. The foredune height was significantly lower in the
mechanical treated areas with a mean and standard deviation of 6.04 ± 0.23 m, than the
control areas with a mean and standard deviation of 6.44 ± 0.32 m (Kruskal-Wallis chi-
squared = 506.51, df = 1, p-value <0.005) (Figure 16). This difference in height was not

33
as large as Gold Bluffs Beach, but mechanical treated areas were still lower than the
control areas.
Figure 15. Elevation (m) in control and mechanical treatment areas at Little River State Park in March 2018. Highest elevation in black and lower elevation white, with mechanical treated areas outlined in black polygons (Esri 2009.).

34
Figure 16. Foredune elevation (m) for control and mechanical treatment areas at Little River in March 2018. Dots are outliers.

35
DISCUSSION
Vegetation Analysis
My study demonstrated that the treatment of A. arenaria by either manual or
mechanical removal was effective at lowering the cover of the targeted invasive species.
The overall decrease in A. arenaria cover was similar between the treatments over time,
with a larger decline from mechanical removal immediately following treatment.
Ammophila arenaria cover was lower in mechanical removal areas compared to manual
removal treatment areas at Gold Bluffs Beach, the only site where both removal
techniques were used. However, the lowest cover of A. arenaria post-treatment was
observed at Tolowa Dunes, which could be due to different pre-restoration conditions at
the removal areas. Since I do not have pre-treatment data for the Tolowa Dunes site it is
hard to compare to the levels of decreased A. arenaria at Gold Bluffs Beach. However, if
the Tolowa Dunes’ control area’s average mean of A. arenaria cover is used as a
substitution for pre-treatment conditions, then the estimated mean pre-treatment cover of
A. arenaria would be similar to the other two sites, a cover class of 4 (10% - <25%
cover). The decline in A. arenaria cover at Tolowa Dunes would then be greater than the
decline in cover after removal at Little River and Gold Bluffs Beach for either removal
treatment. Little River’s cover class of A. arenaria in mechanical treatment areas
decreased from the pre-removal of cover class of 4 to a post-treatment cover class of 1
(>0-<1% of overall cover). This suggests that both treatments have a similar effectiveness

36
in lowering its target species cover to a cover class of 1. Since this before and after A.
arenaria cover analysis relies on categorical cover class data, the results could be over-
simplifying the nuanced changes in A. arenaria cover.
There were changes in A. arenaria cover in untreated areas at Gold Bluffs Beach
during the study period. It is of note that A. arenaria cover decreased in control areas at
Gold Bluffs Beach, and this decrease could be a factor that contributed to lower A.
arenaria cover in the treatment areas. This decrease in A. arenaria in untreated control
areas may be due to sand movement at the beach, as I recorded higher open sand in all
treatment types in 2017 than was record in 2012 to 2014. There are a number of
mechanisms that may be responsible for the loss of A. arenaria cover and increased sand
at Gold Bluffs Beach. Gold Bluffs Beach has the highest acreage treated compared to the
other sites (Forys et al. 2009, Transou 2012, Wisehart 2012, Mills 2015). With more
opportunity for sand movement without A. arenaria to stabilize the dunes, there is a
potential for more open sand, even further down the beach in the southern control areas.
The beach may have seen more sediment loads from its many creeks that feed into the
beach. In contrast, Tolowa Dunes has the opening of Lake Tolowa nearby and Littler
River sediment is feed by the Little River and Mad River (Pickart and Sawyer 1998,
Vaughan 2015). Gold Bluffs Beach has six small creeks that flow through the beach and
into the Pacific Ocean (Mills 2015). If either the higher availability of open sand within a
larger treatment area or more sediment outflow from creeks are responsible for lowering
the A. arenaria cover in the control area, it would call into question mechanical being the

37
most effective removal method to lower A. arenaria cover, due to these confounding
factors at my study sites.
Changes in diversity of non-native plants over time differed among the three sites.
Both treatments at Gold Bluff Beach lowered non-native diversity. The post-treatment
non-native Shannon’s diversity index was not statistically different between the two
treatments at Gold Bluffs Beach. However, the pre-treatment Shannon’s diversity index
for non-natives in mechanical plots was higher than in the manual plots. This shows that
mechanical removal can have a greater effect in decreasing of diversity of non-natives
compared to manual removal. At Little River, the non-native Shannon’s diversity index
in the control plots decreased, indicating that other factors may be at play in lowering the
diversity of non-natives over time. However, mechanical removal still decreased the
Shannon’s diversity index of non-natives to a greater degree than the control area’s
diversity was lowered. At Tolowa Dunes, non-native Shannon’s diversity index was not
significantly different between control and manual plots. This suggests that manual
treatment is not targeting other non-native species, whereas mechanical can treat multiple
species at once. Moreover, all three sites’ removal treatment areas had lower or the same
diversity of non-natives compared to pre-treatment measurements, indicating that
restoration efforts are not increasing non-natives by increasing disturbance which non-
natives thrive on (Pickart and Sawyer 1998, D'Antonio, and Meyerson 2002). In the
control areas at Gold Bluffs Beach, non-native diversity did not increase and at Little
River non-native diversity decreased, which could indicate that the removal treatments
38
may play a more limited role in lowering the diversity of non-native species, if non-
natives diversity is decreasing on its own.
Native diversity did not generally increase over time following removal of A.
arenaria. Native diversity decreased significantly in mechanical removal areas at Gold
Bluffs Beach, whereas both manual removal and control areas show no change in native’s
Shannon’s diversity index post-treatment. This indicates a larger negative impact on
natives from mechanical removal at Gold Bluffs Beach. At Little River, native diversity
stayed the same in mechanical removal and control areas over time, which was fairly low
at both time steps and in both areas. At Tolowa Dunes, manual removal appears to have
increased native diversity compared to adjacent untreated areas. However, without pre-
treatment data at Tolowa Dunes it is difficult to determine if there was a change in native
plant diversity following the restoration. If the adjacent control site’s native diversity
levels are used as a proxy for pre-treatment diversity of the manual removal area, then
Tolowa Dunes is the only site with increased native diversity after the removal of A.
arenaria. With different environmental conditions at each beach, and varying changes to
the control area’s diversity, it is difficult to discern how large of an effect the removal
methods are having on native diversity. Although there is evidence that mechanical
removal is lowering the plant diversity at Gold Bluffs Beach and not increasing native
diversity at Littler River. Manual removal can better serve restoration goals by not
causing a similar decline to native plants (Pickart and Sawyer 1998). However, without
suitable comparisons for uninvaded sites along the North Coast, it is hard to know what

39
amount of native plant cover and diversity there was prior to the invasion of A. arenaria
(Pickart 2016, personal communication).
This study found some degree of difference in plant taxonomic composition and
cover between control and treatment plot cover for all three sites (Figure 10, Figure 11,
and Figure 12). At Gold Bluffs Beach, the perMANOVA showed manual and mechanical
plots differed in their community composition from the control plots. However, treatment
did not explain all the variation between the groups’ differences. This could be due to
many plots with high open sand cover and little vegetation cover of any kind found in
mechanical, manual and control areas. Control cover at Little River was different from
mechanical cover and this difference explains a larger amount of the data than at Gold
Bluffs Beach. This difference may be a representation of the lack of diversity in the
mechanical plots measured by the Shannon’s diversity index (Figure 8, Figure 11). The
difference could also be due to high open sand cover in mechanical plots compared to
control. Manual and control cover at Tolowa Dunes were different from each other as
shown in the perMANOVA (Figure 12). The difference between the groups doesn’t
explain a lot of the variance. The difference measured could be accounted for by the
higher diversity of natives, and more open sand in the manual areas than the control areas
(Figure 9). Control plots’ cover varied from treatment cover at all the sites surveyed.
Non-vegetation cover had associations with different treatment areas in the
NMDS plots for all sites. Litter at all sites was higher in control areas. This could mean
that sand is not moving as readily so it cannot bury litter as would be expected in a
dynamic system. Biogenic soil crust, which is comprised of cyanobacteria, lichens,
40
mosses and other organisms, had an association with control areas at Tolowas Dunes.
This could indicate that the more stabilized invaded sites without disturbance from
treatment was able to support more crust. Increased crust could help native bees that nest
in the crust (Gordon 2000). However, the crust could also be a symptom of invasion and
lack of disturbance on the dunes, as Tolowa is considered to be a highly invaded site
(Pickart and Sawyer 1998). Cobble had a very low percentage cover in the plots surveyed
and was associated with both mechanical and manual removal types at Gold Bluffs Beach
and Tolowa Dunes. The presence of cobble or stones can play an important role in
camouflage for plover chicks during brooding, and for the eggs during nesting (Hardy
and Colwell 2012). Shell was more associated with treated areas than control areas at
Little River and Tolowa dunes, which again plays an important role in camouflage for
plovers (Zarnetske et al. 2010). The combination of increased shell and rocks cover could
increase the chances of plover survival to fledging (Zarnetske et al. 2010, Hardy and
Colwell 2012). However, it is of note that the plover population at Golds Bluffs Beach
and Tolowa Dunes is small, with less than 6% of the breeding population at those two
sites combined in the last 5 years (CSPNCRD 2017, Feucht et al. 2017). Only one plover
nest was established at each of those beaches in 2017, and they both failed (CSPNCRD
2017, Feucht et al. 2017). Little River has a larger plover population with 4 males and 4
females inhabiting the beach, with 6 nests established in 2017 between them (CSPNCRD
2017). In 2017 at Little River, two of the three plover chicks that hatched were able to
successfully fledge (CSPNCRD 2017). Past reproductive success of plovers in these areas
is traditionally low (Feucht et al. 2017). When the adjacent North Clam Beach area is

41
included with Little River statistics, the site has a total breeding efficiency (i.e., the total
number of fledged chicks by total number of eggs laid) of 0.05 since 2001 (CSPNCRD
2017, Feucht et al. 2017). Overall, the restoration areas have yet to be highly utilized by
the plovers, and has thus far not afforded them a relief from population decline.
Dune Morphology
At Gold Bluffs Beach, the difference in highest foredune elevation between
control and treated areas was greater than at Little River. Overall, however, the trend at
both sites was the same: in mechanical treated areas, the foredune was lower in elevation
than adjacent control areas (Figure 14 and Figure 16). The DEM does include the height
of the plants photographed, which means that A. arenraia at a height of 0.5 to 1.2 m,
which could account for the added elevation in control areas (Baldwin et al. 2012). Of
note, the shape of the foredune differed at Little River between control and mechanical
areas, which have low dune hummocks rather than the linear tall foredunes in control
areas that is common in A. arenaria invasion (Hilton et al. 2005). The different areas
surveyed were not controlled for geographical location differences. At Gold Bluffs
Beach, a creek flows through the control area, which may have skewed the elevation
results, by adding and shifting sediment to create the higher foredune and lowering the
southern end of the foredune at the mouth of the creek. Since the restoration work
examined in this study focused primarily on the nearshore dunes area, to allow for a
gradual change to the back dunes which protects roads and other areas from sand
movement, it is less clear what the removal of A. arenaria is doing to the back dune areas

42
(Forys, et al. 2009). The back dune is still invaded with A. arenaria, and other invasive
non-native species such as Lupinus arboreus (yellow bush lupine). Native trees such as
Picea sitchensis (Sitka spruce) have also encroached onto the back dune area, which
would not be historically found in dune hollow ecosystem (Pickart and Sawyer 1998,
Forys 2015).
Management Recommendations
This study examined impacts of A. arenaria removal over several increments of
time. Additional long-term studies to determine the movement and shape of the dunes
over time can provide valuable data on how the dunes are responding not only to
restoration work, but also to El Niño, sea level rise, and human development (Lithgow et
al. 2013, FD 2015). Future study with the use of UAV images of dunes could inform
decisions for the best long-term dune management for coastal community’s protection by
giving up-to-date and easily available elevation data. As well, UAV images could be an
alternative to waiting for USDA or NOAA LIDAR fly overs (Vaughan 2015).
Overall, there are pros and cons to manual and mechanical treatment of A.
arenaria. Mechanical removal decreased the cover of A. arenaria the greatest, and can
decrease all other non-native cover and diversity as well. Mechanical removal is a
quicker and more cost-effective removal method compared to manual removal (Peterson,
B. 2004, Parsons and Minnick 2015). Mechanical removal has been shown to lower the
foredune elevation, which is a desired result for coastal sand dune ecosystem recovery

43
(Pickart and Sawyer 1998, Pickart 2008). However, mechanical removal can cause a
decrease in biodiversity of both natives and non-natives. Other studies have found that it
may be harder for natives to grow back after mechanical removal is used with other
removal methods, such as pesticide, and manual mowing, because it may compact and
affect the free movement of sand (Zarnetske et al. 2010). In contrast, manual removal
causes less disturbance on the dune habitat and leads to a higher native plant cover than
mechanical removal. However, manual removal also leads to higher non-native plant
diversity and cover. If other non-native species are targeted during manual removal, with
crews that are trained and equipped to remove other non-natives, then other non-native
cover could be reduced more effectively. Mean A. arenaria cover class following manual
treatment was comparable to mechanical post-removal cover class over time. Manual
removal also has disadvantages such as a higher price tag and a longer time until A.
arenaria cover is low enough to stop retreatment (Pickart and Sawyer 1998, Peterson
2004.). However, a switch to using more volunteer labor for manual removal may cut
costs significantly, but can slow down the restoration timeline (Pickart and Sawyer 1998).
Further study could expand land mangers’ knowledge of the long term-effects of
removal treatments. A study comparing other treatment methods to remove A. arenaria,
such as fire, pesticides, mowing, and salt water inundation could compare cost and
effectiveness of these methods (Pickart and Sawyer 1989, Moore and Davis 2004,
Peterson 2004, Hyland and Holloran 2005). In addition, studying combined methods
effectiveness for a long period of time could improve restoration work. Setting up study
areas with treatments of equal size for the different treatments would also help eliminate

44
bias in the experiment. Also, the effect of planting or seeding natives in conjunction with
removal should be studied in the long term as well. However, these landscapes are not
experiments, they are working landscapes used by the public for recreation, and
California State Parks have set goals to preserve them as well as allow public use (CSP
2018). Any restoration efforts and experiments done on them need to consider these
goals.
Which A. arenaria removal method is more effective will depend on the
management goals for the land. If the target species is the only concern of the restoration
project, then mechanical will be the best fit to lower A. arenaria cover. Also, if funds are
limited for the restoration, mechanical is more cost-effective for removal. However, if
one is concerned with the loss of native biodiversity, then the results of this study indicate
that manual removal will afford better results in the long run. In a time when global
biodiversity is being lost, and is only projected to continue to decline, manual removal
has the distinct advantage of helping restore native coastal sand dune species (Pereira et
al. 2010, Barnosky et al. 2011). Coastal sand dunes in California contain sensitive and
endemic species (Pickart and Sawyer 1989). This study was conducted within the
California Floristic Province, one of the global diversity hot spots in the world, where
preserving species diversity is particularly important in this unique habitat (Myers et al.
2000). Unfortunately, invasive species such as A. arenaria may not be easily eradicated
within a decade or more of restoration work, or may never be fully eradicated from a site
due to recruitment from nearby invaded areas (Pickart and Sawyer 1989, D’Amtonio and
Meyerson 2002, Norton 2009). With this in mind, manual removal of A. arenaria will

45
help preserve native biodiversity and continue to lower the invasive target species cover
over the long term.

46
LITERATURE CITED
Anderson, M. 2001. A new method for non-parametric multivariate analysis of variance. Austral Ecology, 26(1): 32-46.
Baldwin, B., Goldman, D., Keil, D., Patterson, R., Rosatti, T., Wilken, D., Greenhouse, J., Markos, S., Moe, R.L., Simono, S., Wetherwax, M., and Vorobik, L.A. 2012. The Jepson manual: Vascular plants of California (2nd ed.). Berkeley, Calif.: University of California Press.
Barnosky, A. D., Matzke, N., Tomiya, S., Wogan, G. O. U., Swartz, B., Quental, T. B., Marshall, C., McGuire, J.L., Lindsey, E.L., Maguire, K.C., Mersey, B., & Ferrer, E. A. (2011). Has the earth's sixth mass extinction already arrived? Nature, 471(7336): 51-57.
Belnap, J., & Lange, O. 2001. Biological soil crusts: Structure, function, and management. Ecological studies, 150. New York: Springer.
Braun-Blanquet, J., Fuller, G.D. & Conard, H.S. 1932. Plant Sociology: The Study of Plant Communities (1st ed). New York, London: McGraw-Hill Book Co.
Buell, A. C., Pickart, A. J., & Stuart, J. D. 1995. Introduction History and Invasion Patterns of Ammophila arenaria on the North Coast of California. Conservation Biology, 9 (6): 1587-1593.
[CSP] California State Parks. c2018. About Us. Sacramento, CA: State of California; [accessed 2018 May 2]. https://www.parks.ca.gov/?page_id=91
[CSPNCRD] California State Parks North Coast Redwoods District. 2015. North Coast Redwoods District Western Snowy Plover Annual Report 2013/2014. California State Parks, North Coast Redwoods District. Eureka, CA: California State Parks.
[CSPNCRD] California State Parks North Coast Redwoods District. 2017. North Coast Redwoods District Western Snowy Plover Annual Report 2016/2017. California State Parks, North Coast Redwoods District. Eureka, CA: California State Parks.
D'Antonio, C., & Meyerson, L. 2002. Exotic plant species as problems and solutions in ecological restoration: A synthesis. Restoration Ecology, 10(4): 703-713.
Dinno, A. 2017. dunn.test: Dunn's Test of Multiple Comparisons Using Rank Sums. R package version 1.3.5. https://CRAN.R-project.org/package=dunn.test
Dunn, O. 1964. Multiple Comparisons Using Rank Sums. Technometrics, 6(3): 241-252.

47
Esri. 2009. World Imagery [basemap]. Scale Not Given. Source for base layer: Esri, DigitalGlobe, GeoEye, Earthstar Geographics, CNES/Airbus DS, USDA, USGS, AEX, Getmapping, Aerogrid, IGN, IGP, swisstopo, and the GIS User Community.https://services.arcgisonline.com/ArcGIS/rest/services/World_Imagery/MapServer
Feucht, E.J., Colwell1, M.A., Orluck, D.J., Papian, N.C., Raby, K.M. & McAllister S.E. 2017. Final Report: 2017 Snowy Plover Breeding in Coastal Northern California, Recovery Unit 2. Submitted to U.S. Fish and Wildlife Service, Arcata, California, USA.
[FD] Friends of the Dunes. 2015. Dunes Climate Ready Study. Arcata, CA: Friends of the Dunes [accessed 2018 May 2]. http://www.friendsofthedunes.org/science/climate-ready/
Forys, M. 2015. Little River State Beach Nearshore Dunes Restoration Project Summary Report. California State Parks, North Coast Redwoods District. Eureka, CA: California State Parks.
Forys, M., Transou, A., Beers, D., & Vaughan, P. 2009. Little River State Beach Restoration and Enhancement Plan. California State Parks, North Coast Redwood District. Eureka, CA: California State Parks.
Gordon, D.M. 2000. Plants as indicators of leafcutter bee (Hymenoptera: Megachilidae) nest habitat in coastal dunes. Pan-Pacific Entomologist 76:219-233.
Hardy, M. A., & Colwell, M. A. 2012. Factors Influencing Snowy Plover Nest Survival on Ocean- Fronting Beaches in Coastal Northern California. Waterbirds, 35(4): 503-656.
Hart, A. T., Hilton, M. J., Wakes, S. J., & Dickinson, K. J. 2012. The Impact of Ammophila arenaria Foredune Development on Downwind Aerodynamics and Parabolic Dune Development. Journal of Coastal Research, 28(1): 112-122.
Hilton, M., Duncan, M., & Jul, A. 2005. Processes of Ammophila arenaria (Marram Grass) invasion and indigenous species displacement, Stewart Island, New Zealand. Journal of Coastal Research, 21(1): 175-185.
Hobbs, R. J., & Harris, J. A. 2001. Restoration Ecology: Repairing the Earth’s Ecosystems in the New Millennium. Restoration Ecology, 9(2): 239–246.
Huiskes, A.H. 1979. Biological Flora of the British Isles. Journal of Ecology, 67(1): 363-382.

48
Hyland, T., & Holloran, P. 2005. Controlling European beachgrass (Ammophila arenaria) using prescribed burns and herbicide. Chico, CA: Cal-IPC (California Invasive Plant Council).
Lithgow, D., Martínez, M. L., Gallego-Fernández, J. B., Hesp, P. A., Flores, P., Gachuz, S., Rodríguez-Revelo, N., Jiménez-Orocio, O., Mendoza-González, G., Álvarez-Molina, L. L. 2013. Linking Restoration Ecology with Coastal Dune Restoration. Geomorphology, 199: 214-224.
Mancini, F., Dubbini, M., Gatt, M., Stecchi, F., Fabbri, S., & Gabbianelli, G. 2013. Using Unmanned Aerial Vehicles (UAV) for High-Resolution Reconstruction of Topography: The Structure from Motion Approach on Coastal Environments. Remote Sensing, 5: 6880-6898.
Mascarenhas, A., & Jayakumar, S. 2008. An Environmental Perspective of Post-Tsunami Scenario Along the Coast of Tamil Nadu, India: Role of Sand Dunes and Forests. Journal of Environmental Management, 89(1): 24-34.
McDonald, K. 2015. Differences in the Morphology of Restored and Invaded Foredunes. U.S. Fish and Wildlife Service. Arcata, CA: U.S. Fish and Wildlife Service.
Mills, A. 2015. Evaluating the Effects of Mechanical and Manual Removal of Ammophila arenaria within Coastal Dunes of Humboldt County. Thesis, California State University Chico, Chico, CA, USA.
Moore, P., & Davis, A. 2004. Marram grass Ammophila arenaria removal and dune restoration to enhance nesting habitat of Chatham Island oystercatcher Haematopus chathamensis, Chatham Islands, New Zealand. Conservation Evidence, 1: 8-9.
Muir, J. J., & Colwell, M. A. 2010. Snowy Plovers Select Open Habitats for Courtship Scrapes and Nests. The Condor, 112(3): 507-510.
Myers, N., Mittermeier, R., Mittermeier, C., & Kent, J. 2000. Biodiversity hotspots for conservation priorities. Nature, 403(6772): 853-8.
Oksanen, J., Guillaume Blanchet, F., Friendly, M., Kindt, R., Legendre, P., McGlinn, D., Minchin, P.R., O'Hara, R. B., Simpson, G.L., Solymos, P., Henry, M., Stevens, H., Szoecs E., &Wagner, H. 2018. vegan: Community Ecology Package. R package version 2.5-1. https://CRAN.R-project.org/package=vegan
Parsons, L. & Minnick, S. 2015. Coastal Dune Restoration Environmental Assessment. National Park Service, Point Reyes National Seashore. Point Reyes, CA: National Park Service.

49
Pereira, H.M., Leadley, P.W., Proença, V., Alkemade, R., Scharlemann, J.P., Fernandez-Manjarrés, J.F., Araújo, M.B., Balvanera, P., Biggs, R., Cheung, W.W. and Chini, L. 2010. Scenarios for global biodiversity in the 21st century. Science, 330(6010): 1496-1501.
Peterson, B. 2004. The Use of Heavy Machinery (Excavators) to Remove Ammophila arenaria (European beachgrass) from Native Sand Dunes at Point Reyes National Seashore. In, C. Pirosko, (ed.). 2004 Symposium Proceedings California Invasive Plant Council Symposium, 8: 59-61.
Pickart, A. 1997. Control of European Beachgrass (Ammophila arenaria) on the West Coast of the United States. 1997 Symposium Proceedings, California Exotic Pest Plant Council.
Pickart, A. 2008. Restoring the Grasslands of Northern California’s Coastal Dunes. Grasslands, 18(1): 1-9.
Pickart, A. J., & Barbour, M. G. 2007. Beach and Dune. In M. Barbour, T. Keeler-Wolf, & A. A. Schoenherr, Terrestrial Vegetation of California (3rd ed.). Berkeley Los Angeles London: University of California Press. p. 155-173.
Pickart, A.J. & Sawyer, J.O. 1998. Ecology and Restoration of Northern California Coastal Dunes. Sacramento, CA: California Native Plant Society.
Pimentel, D., Lach, L., Zuniga, R., & Morrison, D. 2000. Environmental and Economic Costs of Nonindigenous Species in the United States. BioScience, 50(1): 53-65.
[SER] Society of Ecological Restoration Science and Policy Working Group. 2004. The SER International Primer on Ecological Restoration Ver. 2. Tucson Arizona: Society for Ecological Restoration International.
[TIGER] Topologically Integrated Geographic Encoding and Referencing. 2016. California County boundaries. https://data.ca.gov/dataset/ca-geographic-boundaries/resource/091ff50d-bb24-4537-a974-2ce89c6e8663
Transou, A. 2012. North Gold Bluff Beach Coastal Dune Redwood Plan Prairie Creek Redwood State Park. California State Parks, North Coast Redwood District. Eureka, CA: California State Parks.
Vaughan, P. R. 2015. Geological Monitoring Report 2005-20015 Little River State Beach Exotic Vegetation Removal. California State Parks, North Coast Redwoods District. Eureka, CA: California State Parks.

50
Wentworth, C. 1922. A Scale of Grade and Class Terms for Clastic Sediments. The Journal of Geology, 30(5): 377-392.
Wiedemann, A. M. 1984. The Ecology of Pacific Northwest Coastal Sand Dunes: A Community Profile. U.S. Department of the Interior and U.S. Department of the Army, US Fish and Wildlife and Army Corps of Engineers. Olympia, WA: fish and Wildlife Service U.S, Department of the Interior.
Wiedemann, A. M., & Pickart, A. 1996. The Ammophila Problem on the Northwest Coast of North America. Landscape and Urban Planning, 34: 287-299.
Wilcove, D. S., Rothstein, D., Dubow, J., Phillips, A., & Losos, E. 1998. Quantifying Threats to Imperiled Species in the United States. BioScience, 48 (8): 607-615.
Wisehart, L. 2012. European Beachgrass Removal at Tolowa Dunes State Parks. California State Parks, North Coast Redwoods District. Eureka, CA: California State Parks.
Zarnetske, P. L., Seabloom, E. W., & Hacker, S. D. 2010. Non-target Effects of Invasive Species Management: Beachgrass, Birds, and Bulldozers in Coastal Dunes. Ecosphere, 1(5): 1-20.
Zavaleta, E. S., Hobbs, R. J., & Mooney, H. A. 2001. Viewing Invasive Species Removal in a Whole-Ecosystem Context. TRENDS in Ecology & Evolution, 16(8): 454-459.

51
APPENDIX A
Appendix A: Plant species found during vegetation surveys, native status (Y for yes, and N for no), family, CNPS rare plant status and Cal IPC rating.
Scientific Name Common Name
Native Family CNPS Cal IPC rating
Abronia latifolia yellow sand verbena
Y Nyctaginaceae
Abronia umbellata var. breviflora
pink sand verbena
Y Nyctaginaceae 1B.1
Achillea millefolium yarrow Y Asteraceae
Acmispon glaber deerweed Y Fabaceae
Aira caryophyllea silver hair grass N Poaceae
Aira praecox Yellow hairgrass
N Poaceae
Alnus rubra red alder Y Betulaceae
Ambrosia chamissonis beach bur Y Asteraceae
Ammophila arenaria European beachgrass
Y Poaceae
High
Anaphalis margaritacea
pearly everlasting
Y Asteraceae
Angelica hendersonii coast angelica Y Apiaceae
Anthoxanthum odoratum
sweet vernal grass
N Poaceae
Limited
Anthoxanthum odoratum
sweet vernal grass
N Poaceae
Limited
Armeria maritima Thrift seapink Y Plumbaginaceae
Artemisia pycnocephala
Coastal sagewort
Y Asteraceae
Baccharis pilularis coyote bush Y Asteraceae
Bellis perennis English daisy N Asteraceae
Brassica nigra black mustard N Brassicaceae
Moderate Briza maxima rattlesnake
grass N Poaceae
Limited
Bromus carinatus California Brome
Y Poaceae
Cakile maritima sea rocket N Brassicaceae
Limited Calystegia soldanella beach morning-
glory Y Convolvulaceae
Camissoniopsis cheiranthifolia
beach evening-primrose
Y Onagraceae

52
Scientific Name Common Name
Native Family CNPS Cal IPC rating
Cardamine hirsuta bitter-cress N Brassicaceae
Cardionema ramosissimum
sand mat Y Caryophyllaceae
Carex obnupta slough sedge Y Cyperaceae
Carex pansa sand-dune sedge
Y Cyperaceae
Carex sps. sedge
Cyperaceae
Cerastium sp. mouseear chickweed
Caryophyllaceae
Cirsium vulgare bull thistle N Asteraceae
Moderate Claytonia sp. minors lettuce
Montiaceae
Cortaderia jubata/selloana
jubata/pampass grass
N Poaceae
High
Cotula coronopifolia brass buttons N Asteraceae
Limited Cynosurus echinatus dogtail grass N Poaceae
Moderate
Cytisus scoparius scotch broom N Fabaceae
High Dipsacus fullonum wild teasel N Dipsacaceae
Moderate
Distichlis spicata salt grass Y Poaceae
Dudleya farinosa bluff lettuce Y Crassulaceae
Dysphania ambrosioides
Mexican Tea N Chenopodiaceae
Elymus mollis subsp. mollis
American dune grass
Y Poaceae
Erechtites sp. burnweed N Asteraceae
Erigeron canadensis horseweed Y Asteraceae
Erigeron glaucus seaside daisy Y Asteraceae
Eriogonum latifolium Coast buckwheat
Y Polygonaceae
Festuca bromoides Brome fescue N Poaceae
Festuca microstachys annual fescue Y Poaceae
Festuca myuros rattail fescue N Poaceae
Moderate Fragaria chiloensis beach
strawberry Y Rosaceae
Galium aparine goose grass Y Rubiaceae
Gamochaeta ustulata purple cudweed Y Asteraceae
Glehnia littoralis subsp. leiocarpa
glehnia Y Apiaceae
Grindelia stricta Coastal gumweed
Y Asteraceae
Holcus lanatus velvet grass N Poaceae
Moderate

53
Scientific Name Common Name
Native Family CNPS Cal IPC rating
Hypericum perforatum subsp. perforatum
klamathweed N Clusiaceae
Limited
Hypochaeris glabra smooth cat's car
N Asteraceae
Limited
Hypochaeris radicata rough cat's ear N Asteraceae
Moderate Isatis tinctoria woad N Brassicaceae
Moderate
Juncus breweri Brewer's rush Y Juncaceae
Juncus bufonius toad rush Y Juncaceae
Juncus falcatus sickleleaved rush
Y Juncaceae
Juncus sp. rush
Juncaceae
Kickxia elatine sharpleaf cancerwort
N Plantaginaceae
Lathyrus japonicus seaside pea Y Fabaceae 2B.1
Lathyrus littoralis beach pea Y Fabaceae
Linaria dalmatica subsp. dalmatica
Dalmatian toadflax
N Plantaginaceae
Moderate
Linum bienne flax N Linaceae
Lotus corniculatus bird foot treefoil
N Fabaceae
Lupinus arboreus bush lupine Y/N Fabaceae
Limited Lysimachia arvensis scarlet
pimpernel N Myrsinaceae
Lythrum hyssopifolia loosestrife N Lythraceae
Melilotus albus white sweetclover
N Fabaceae
Mentha pulegium pennyroyal N Lamiaceae
Moderate Morella californica wax myrtle Y Myricaceae
Phacelia argentea sanddune phacelia
Hydrophyllaceae 1B.1
Picea sitchensis Sitka spruce Y Pinaceae
Pinus contorta beach pine Y Pinaceae
Plantago lanceolata English plantain
N Plantaginaceae
Limited
Plantago major common plantain
N Plantaginaceae
Poa annua annual blue grass
N Poaceae
Poa confinis beach blue grass
Y Poaceae

54
Scientific Name Common Name
Native Family CNPS Cal IPC rating
Poa douglasii sand dune blue grass
Y Poaceae
Poa macrantha seashore blue grass
Y Poaceae
Poa trivialis rough blue grass
N Poaceae
Polycarpon tetraphyllum
Four-leaved polycarp
N Caryophyllaceae
Polygonum aviculare common knotweed
N Polygonaceae
Polygonum paronychia dune knotweed Y Polygonaceae
Polypodium scouleri leather-leaf fern
Y Polypodiaceae
Polypodium sps. fern
Polypodiaceae
Polypogon monspeliensis
Rabbitsfoot grass
N Poaceae
Limited
Potentilla anserina ssp. pacifica
silverweed cinquefoil
Y Rosaceae
Pseudognaphalium californicum
ladies tobacco Y Asteraceae
Pseudognaphalium stramineum
cottonbatting plant
Y Asteraceae
Pseudotsuga menziesii Douglas-fir Y Pinaceae
Rumex acetosella sheep sorrel N Polygonaceae
Moderate Rumex conglomeratus clustered dock N Polygonaceae
Rumex crispus curly dock N Polygonaceae
Limited Rumex salicifolius willow dock Y Polygonaceae
Rumex sp. dock
Polygonaceae
Salix sp. willow
Salicaceae
Sanicula sp. sanicle Y Apiaceae
Senecio glomeratus cutleaf burnweed
N Asteraceae
Moderate
Senecio minimus coastal burnweed
N Asteraceae
Silene gallica wind-mill pink N Caryophyllaceae
Sonchus oleraceus common sow thistle
N Asteraceae
Symphyotrichum chilense
aster Y Asteraceae
Tanacetum bipinnatum
dune tansy Y Asteraceae

55
Scientific Name Common Name
Native Family CNPS Cal IPC rating
Trifolium sp. clover
Fabaceae
Trifolium wormskioldii cow clover Y Fabaceae
Vaccinium ovatum California huckleberry
Y Ericacae
Vicia gigantea giant vetch Y Fabaceae
Vicia sativa vetch N Fabaceae
Definitions for California Native Plant Society Rare Plant Ranks and Threat Ranks California Native Plant Society Rare Plant Rank Plants rare, threatened, or endangered in California and elsewhere 1B-Plants rare, threatened, or endangered in California and elsewhere Plants with a California Rare Plant Rank of 1B are rare throughout their range with the majority of them endemic to California. Most of the plants that are ranked 1B have declined significantly over the last century. California Rare Plant Rank 1B plants constitute the majority of taxa in the CNPS Inventory, with more than 1,000 plants assigned to this category of rarity All of the plants constituting California Rare Plant Rank 1B meet the definitions of the California Endangered Species Act of the California Fish and Game Code, and are eligible for state listing. Impacts to these species or their habitat must be analyzed during preparation of environmental documents relating to CEQA, or those considered to be functionally equivalent to CEQA, as they meet the definition of Rare or Endangered under CEQA Guidelines §15125; (c) and/or §15380. . 2B- Plants rare, threatened, or endangered in California but more common elsewhere Except for being common beyond the boundaries of California, plants with a California Rare Plant Rank of 2B would have been ranked 1B. From the federal perspective, plants common in other states or countries are not eligible for consideration under the provisions of the Federal Endangered Species Act. With California Rare Plant Rank 2B, we recognize the importance of protecting the geographic range of widespread species. In this way we protect the diversity of our own state’s flora and help maintain evolutionary processes and genetic diversity within species. All of the plants constituting California Rare Plant Rank 2B meet the definitions of the California Endangered Species Act of the California Fish and Game Code, and are eligible for state listing. Impacts to these species or their habitat must be analyzed during preparation of environmental documents relating to CEQA, or those considered to be functionally equivalent to CEQA, as they meet the definition of Rare or Endangered under CEQA Guidelines §15125 (c) and/or §15380. Threat Ranks

56
Ranks at each level also include a threat rank (e.g., CRPB 4.3) and are determined as follows:
• 0.1-Seriously threatened in California (over 80% of occurrences threatened / high degree and immediacy of threat)
• 0.2-Moderately threatened in California (20-80% occurrences threatened / moderate degree and immediacy of threat)
• 0.3-Not very threatened in California (less than 20% of occurrences threatened / low degree and immediacy of threat or no current threats known)
Definitions for California Invasive Plant Council Weed Rating Categories California Invasive Plant Council Weed Categories Each plant on the list received an overall rating of High, Moderate or Limited based on evaluation using the criteria system. High – These species have severe ecological impacts on physical processes, plant and animal communities, and vegetation structure. Their reproductive biology and other attributes are conducive to moderate to high rates of dispersal and establishment. Most are widely distributed ecologically. Moderate – These species have substantial and apparent—but generally not severe—ecological impacts on physical processes, plant and animal communities, and vegetation structure. Their reproductive biology and other attributes are conducive to moderate to high rates of dispersal, though establishment is generally dependent upon ecological disturbance. Ecological amplitude and distribution may range from limited to widespread. Limited – These species are invasive but their ecological impacts are minor on a statewide level or there was not enough information to justify a higher score. Their reproductive biology and other attributes result in low to moderate rates of invasiveness. Ecological amplitude and distribution are generally limited, but these species may be locally persistent and problematic.

57
APPENDIX B
Appendix B: Gold Bluffs Beach’s Dunn’s test after Kruskal Wallis between each treatments, manual, mechanical and control, Ammophila arenaria cover for before removal (July 2012-January 2013), one year after removal (February 2014), and 4 years after removal (May and September 2017)(Bolded p-values are less than 0.05).
Con
trol
Bef
ore
Con
trol
1 Y
ear
Con
trol
4 y
ears
(May
)
Con
trol
4 y
ears
(Sep
t.)
Man
ual B
efor
e
Man
ual 1
Yea
r
Man
ual 4
Yea
rs (M
ay)
Man
ual 4
Yea
rs (S
ept.)
Mec
hani
cal B
efor
e
Mec
hani
cal 1
Yea
r
Mec
hani
cal 4
Yea
rs (S
ept.)
Control 1 Year Z score -1.08 p-value 0.15 Control 4 years (May)
Z score 9.33 10.46
p-value 0 0 Control 4 years (Sept.)
Z score 7.99 9.15 -1.66
p-value 0 0 0.06 Manual Before Z score 0.84 1.91 -8.31 -6.97
p-value 0.21 0.03 0 0 Manual 1 Year Z score 4.74 5.8 -4.23 -2.79 3.84
p-value 0 0 0 0.0034 0.0001

58
Con
trol
Bef
ore
Con
trol
1 Y
ear
Con
trol
4 y
ears
(May
)
Con
trol
4 y
ears
(Sep
t.)
Man
ual B
efor
e
Man
ual 1
Yea
r
Man
ual 4
Yea
rs (M
ay)
Man
ual 4
Yea
rs (S
ept.)
Mec
hani
cal B
efor
e
Mec
hani
cal 1
Yea
r
Mec
hani
cal 4
Yea
rs (S
ept.)
Manual 4 years (May Z score 11.97 13.08 3.01 4.7 10.94 6.95
p-value 0 0 0.0017 0 0 0 Manual 4 years (Sept.)
Z score 13.36 14.47 4.34 6.09 12.29 8.24 1.24
p-value 0 0 0 0 0 0 0.12 Mechanical Before Z score -3.36 -2.31 -12.53 -11.31 -4.14 -7.91 -15.03 -16.4
p-value 0.0005 0.0127 0 0 0 0 0 0 Mechanical 1 Year Z score 13.34 14.39 4.9 6.53 12.36 8.55 2 0.84 16.23
p-value 0 0 0 0 0 0 0.03 0.21 0 Mechanical 4 years (May)
Z score 14.55 15.65 5.73 7.48 13.49 9.5 2.65 1.45 17.52 0.52
p-value 0 0 0 0 0 0 0.005 0.08 0 0.3 Mechanical 4 Years (Sept.)
Z score 15.45 16.57 6.55 8.36 14.36 10.31 3.4 2.19 18.42 1.2 0.71
p-value 0 0 0 0 0 0 0.0005 0.0171 0 0.12 0.24

59
APPENDIX C
Appendix C: Tolowa Dune’s Dunn’s test after Kruskal Wallis between each treatments, manual and control, Ammophila arenaria cover for 7 year after treatment (in May and September) (bold p-values are less than 0.05). Treatment Time Statistic Control Control Manual
7 Years (May)
7 Years (Sept.)
7 Years (May)
Control 7 Years (Sept.)
Z test -1.16
p-value 0.15
Manual
7 Years (May)
Z test 8.03 9.18
p-value 0.00 0.00
7 Years (Sept.)
Z test 8.01 9.17 0.01
p-value 0.00 0.00 0.50

60
APPENDIX D
Appendix D: Little River’s Dunn’s test after Kruskal Wallis between each treatments, control and mechanical, Ammophila arenaria cover for before treatment (2009), and one year (2010), 2 years (2011) and 8 years (May and September 2017) after removal year after treatment (in May and September)(bolded p-values are less than 0.05). Control Mechanical Before 1 Year 2 Years 8
Years (May)
8 years (Sept.)
Before 1 Year 2 Years 8 Years (May)
Control 1 Year Z score -1.01 p-value 0.18 2
Years Z score -0.41 0.65
p-value 0.38 0.29 4
Years (May)
Z score -1.99 -1.31 -1.75
p-value 0.03 0.12 0.06 4
years (Sept.)
Z score -1.73 -1.04 -1.49 0.24
p-value 0.06 0.18 0.09 0.43 Mechanical
Before Z score 2.74 3.98 3.33 4.02 3.8
p-value 0.0048 0.0001 0.0007 0.0001 0.0001 1 Year Z score 14.22 16.16 15.51 12.29 12.24 12.18
p-value 0 0 0 0 0 0

61
Control Mechanical Before 1 Year 2 Years 8
Years (May)
8 years (Sept.)
Before 1 Year 2 Years 8 Years (May)
2 Years
Z score 16.15 18.21 17.56 13.68 13.66 14.23 2.05
p-value 0 0 0 0 0 0 0.03 4
Years (May)
Z score 6.74 7.33 7.03 7.35 7.22 5.48 -0.16 -1.1
p-value 0 0 0 0 0 0 0.46 0.16 4
years (Sept.)
Z score 9.28 10.2 9.79 9.42 9.3 7.66 -0.11 -1.42 0.06
p-value 0 0 0 0 0 0 0.47 0.1 0.47

62
APPENDIX E
Appendix E: Dunn’s table for before and after comparisons of native and non-native diversity. Gold Bluffs Beach’s Dunn’s test after Kruskal Wallis between each treatments, manual, mechanical and control, for native species Shannon diversity index before removal (July 2012-January 2013), and 4 years after removal (September 2017)(bolded p-values are less than 0.05)
Control Before
Control After
Manual Before
Manual After
Mechanical Before
Control After Z test -0.76537
p-value 0.2562
Manual Before Z test -3.92383 -3.04006
p-value 0.0002 0.0025
Manual After Z test -4.2429 -3.37222 -0.45862
p-value 0.0001 0.0009 0.3233
Mechanical Before Z test -4.71226 -3.82849 -0.96562 -0.48578
p-value 0.0000 0.0002 0.2279 0.336
Mechanical After Z test -1.80439 -0.93371 2.506221 2.902415 3.450618 p-value 0.0534 0.219 0.0102 0.0035 0.0008
. Gold Bluffs Beach’s Dunn’s test after Kruskal Wallis between each treatments, manual, mechanical and control, for non-native species Shannon diversity index before removal (July 2012-January 2013), and 4 years after removal (September 2017)(bolded p-values are less than 0.05).
Control Before
Control After
Manual Before
Manual After
Mechanical Before
Control After Z test -0.715
p-value 0.254
Manual Before Z test -1.308 -0.482
p-value 0.119 0.315
Manual After Z test 1.438 2.252 3.316
p-value 0.103 0.0182 0.0010
Mechanical Before Z test -4.687 -3.860 -4.138 -7.362
p-value 0.00 0.0001 0.0001 0.00
Mechanical After Z test 2.404 3.218 4.490 1.149 8.536 p-value 0.0135 0.0012 0.00 0.144 0.00

63
Little River’s Dunn’s test after Kruskal Wallis between each treatments, manual, mechanical and control, for non-native species Shannon diversity index before removal (2009), and 8 years after removal (September 2017)(Bolded p-values are less than 0.05).
Control Before
Control After
Mechanical Before
Control After Z test 2.33
p-value 0.0120
Mechanical Before Z test -0.27 -2.59
p-value 0.39 0.0072
Mechanical After Z test 5.24 2.65 5.54 p-value 0.00 0.0080 0.00

64
APPENDIX F
Appendix F: Gold Bluffs Beach Shannon diversity index before treatment and 4 years after treatment on native and non-native plant species.
Time Before Before Before After After After Treatment Plant
type Mean Standard Deviation
Dunn's Group Mean Standard
Deviation Dunn's Group
Control Native 0.021 0.117 a 0.053 0.184 a
Non-native
0.071 0.205 wx 0.108 0.273 w
Manual Native 0.185 0.356 b 0.195 0.360 b Non-native
0.154 0.377 w 0.032 0.154 xy
Mechanical Native 0.246 0.446 b 0.091 0.242 a Non-native
0.258 0.413 x 0.030 0.050 y

65
APPENDIX G
Appendix G: Little Rivers Shannon diversity index before treatment and 4 years after treatment on native and non-native plant species
Before
After
Treatment Plant type
Mean Standard Deviation
Dunn's Group
Mean
Standard Deviation
Dunn's Group
Control Native 0.050 0.184 x 0.074 0.214 x Non-native
0.542 0.539 a 0.240 0.407 b
Mechanical Native 0.049 0.200 x 0.010 0.078 x Non-native
0.576 0.602 a 0.034 0.148 c

66
APPENDIX H
Appendix H: Tolowa Dunes Shannon diversity index 7 years after treatment on native and non-native plant species
After
Treatment Plant type Mean Standard Deviation
Dunn's Group
Control Native 0.4167913 0.466931 a Non-native 0.1037884 0.2525012 x
Manual Native 0.7872416 0.4951898 b Non-native 0.09063261 0.2498491 x

67
APPENDIX I
Appendix I: Gold Bluffs Beach mean Ammophila arenaria cover Treatment Time Mean Cover
Class Standard Deviation
Control Before 4.098039216 2.009073844 Control 1 Year Post-treatment 4.405228758 1.961598128 Control 4 Years (May) Post-treatment 2.064865 1.596909 Control 4 Years (September) Post-
treatment 2.294686 1.719427
Manual Before 3.896551724 2.087409805 Manual 1 Year Post-treatment 2.513888889 1.404219969 Manual 4 Years (May) Post-treatment 1.355422 0.6325998 Manual 4 Years (September) Post-
treatment 1.232955 0.5315684
Mechanical Before 5.154411765 1.703498259 Mechanical 1 Year Post-treatment 1.132352941 0.361249345 Mechanical 4 Years (May) Post-treatment 1.078788 0.2702275 Mechanical 4 Years (September) Post-
treatment 1.017143 0.1301761

68
APPENDIX J
Appendix J: Little River mean Ammophila arenaria cover Treatment Time Mean
Cover Class
Standard Deviation
Control Before 4.245 1.895505 Control 1 Year Post-treatment 4.448 1.888269 Control 2 Years Post-treatment 4.388 1.485356 Control 8 Years (May) Post-treatment 4.9733 1.294201 Control 8 Years (September) Post-
treatment 4.7721 2.111928
Mechanical Before 4.052 2.9 Mechanical 1 Year Post-treatment 1.228 1.171968 Mechanical 2 Years Post-treatment 0.788 1.15429 Mechanical 8 Years (May) Post-treatment 1.2 0.406838102 Mechanical 8 Years (September) Post-
treatment 1.156 0.4070315

69
APPENDIX K
Appendix K: Tolowa Dunes mean Ammophila arenaria cover Treatment Time Mean
Cover Class Standard Deviation
Control 7 Years (May) Post-treatment 3.744444444 2.5596748 Control 7 Years (September) Post-
treatment 4.111111 2.658226
Manual 7 Years (May) Post-treatment 1.043956044 0.330389935 Manual 7 Years (September) Post-
treatment 1.022222 0.1482314