Embed Size (px)
Citation preview
Effects of Low Reynolds Number on Loss Characteristics
in Transonic Axial Compressor
By Minsuk CHOI,1Þ Je Hyun BAEK,2Þ Jun Young PARK,3Þ Seong Hwan OH4Þ and Han Young KO4Þ
1ÞMyongji University, Yongin, Korea2ÞPohang University of Science and Technology, Pohang, Korea
3ÞKorea Institute of Machinery & Materials, Daejeon, Korea4ÞAgency for Defense Development, Daejeon, Korea
(Received June 11th, 2009)
A three-dimensional computation was conducted to understand effects of low Reynolds numbers on loss character-
istics in a transonic axial compressor, Rotor 67. As a gas turbine becomes smaller and it operates at high altitude, the
engine frequently operates under low Reynolds number conditions. This study found that large viscosity significantly
affects the location and intensity of the passage shock, which moves toward the leading edge and has decreased intensity
at low Reynolds number. This change greatly affects performance as well as internal flows, such as pressure distribution
on the blade surface, tip leakage flow and separation. The total pressure ratio and adiabatic efficiency both decreased by
about 3% with decreasing Reynolds number. At detailed analysis, the total pressure loss was subdivided into four loss
categories such as profile loss, tip leakage loss, endwall loss and shock loss.
Key Words: Low Reynolds Number, Loss, Transonic Axial Compressor, Rotor 67
Nomenclature
Aw: endwall area
C: chord length
Cc: contraction coefficient
Cd: dissipation coefficient
Cv: specific heat capacity
Cx: axial chord length
h: blade height
M: Mach number
m: mass flow rate
mj: mass flow rate across tip clearance
p: static pressure
pt: total pressure
s: pitch
S: entropy generation
Sew: entropy generated on endwall
t: blade thickness
T : static temperature
V : absolute velocity on inertial coordinate
V�: surface velocity relative to endwall
W: relative velocity
W�: surface velocity on blade surface
W�p: surface velocity on pressure surface
W�s: surface velocity on suction surface
Greek
�: angle between tip leakage flow and main flow
�: flow angle
�: specific heat ratio
�: increment or decrement
��: displacement thickness
�: air density
�bl: boundary layer loss coefficient
�el: endwall loss coefficient
�tl: tip leakage loss coefficient
�tr: trailing edge loss coefficient
�: height of tip clearance
Subscripts
1: inlet in computational domain
2: outlet in computational domain
1. Introduction
The Reynolds number based on operating conditions of
gas turbines has been decreasing recently, because aero-
engine designers are trying to reduce gas turbine size and
the need to operate gas turbines at high altitudes is increas-
ing for high-altitude UAVs (Unmanned Air Vehicles),
mainly used in military surveillance and reconnaissance. It
is known that wall boundary layer thickens and separation
occurs frequently on blade surfaces with decreasing Rey-
nolds number. Because these degraded internal flows have
a negative effect on axial turbomachinery performance,
many researchers are investigating the effects of low Rey-
nolds number.
From the design viewpoint, a low Reynolds number con-
dition is often attributed to low air densities at high altitudes.
Weinberg and Wyzykowski1) investigated the effects of low
Reynolds number on a gas turbine with NASA. The PW545
jet engine, designed to operate at 13,700m altitude, was
tested above 18,300m. They reported that the engine effi-
ciency and performance were reduced by the low air density� 2010 The Japan Society for Aeronautical and Space Sciences
Trans. Japan Soc. Aero. Space Sci.
Vol. 53, No. 181, pp. 162–170, 2010
at high altitude. Castner et al.2) compared their numerical
results with the experimental data of Weinberg and
Wyzykowski.1) There was a good agreement between the
test data and the calculated efficiency and performance within
Reynolds numbers from 30,000 to 295,000. Schreiber et al.3)
researched transition phenomena on the blade surface in a
compressor cascade by changing the Reynolds number
and turbulence intensity, finding a laminar separation bub-
ble with reattachment on the suction surface at relatively
low Reynolds number. Van Treuren et al.4) ran wind tunnel
tests at Reynolds numbers from 25,000 to 50,000 and found
that a large separation near the trailing edge of a turbine
cascade degraded total pressure loss. After wind tunnel tests
on a turbine cascade with tip clearance, Matsunuma5) ana-
lyzed the relationship between tip leakage flow, Reynolds
number and turbulence intensity, reporting that the Rey-
nolds number and free-stream turbulence intensity don’t
affect tip clearance loss although they change the distribu-
tion of the internal flow. Using experiments on total pressure
loss change caused by low Reynolds numbers from 32,000
to 128,000 in a small one-stage axial turbine, Matsunuma
and Tsutsui6) showed that the region with high turbulence
intensity due to the wake and the flow fluctuation due to
the stator-rotor interaction increase with decreasing Rey-
nolds number.
Although there are some studies on the effect of low
Reynolds numbers on the internal flow in turbomachinery,
most of them have focused on flow phenomena but not on
loss characteristics. After extensive numerical simulations,
Choi et al.7) analyzed the effects of Reynolds number on
profile loss, tip leakage loss and endwall loss in a subsonic
axial compressor, reporting that the tip leakage loss drops
with low Reynolds number due to weaker mixing of the
tip leakage and mainstream flows. However, the internal
flow in a transonic compressor is more complex due to
the presence of shocks.8–13) This study investigated the
effects of low Reynolds numbers on loss characteristics
in a transonic compressor using numerical simulations.
A comprehensive analysis of the loss mechanism was
attempted by applying Denton’s loss model14) to the com-
putational result.
2. Test Configuration
2.1. Geometric specifications
We conducted a numerical study on the effect of low
Reynolds number on internal flows and loss characteristics
using a transonic axial compressor, Rotor 67, which has
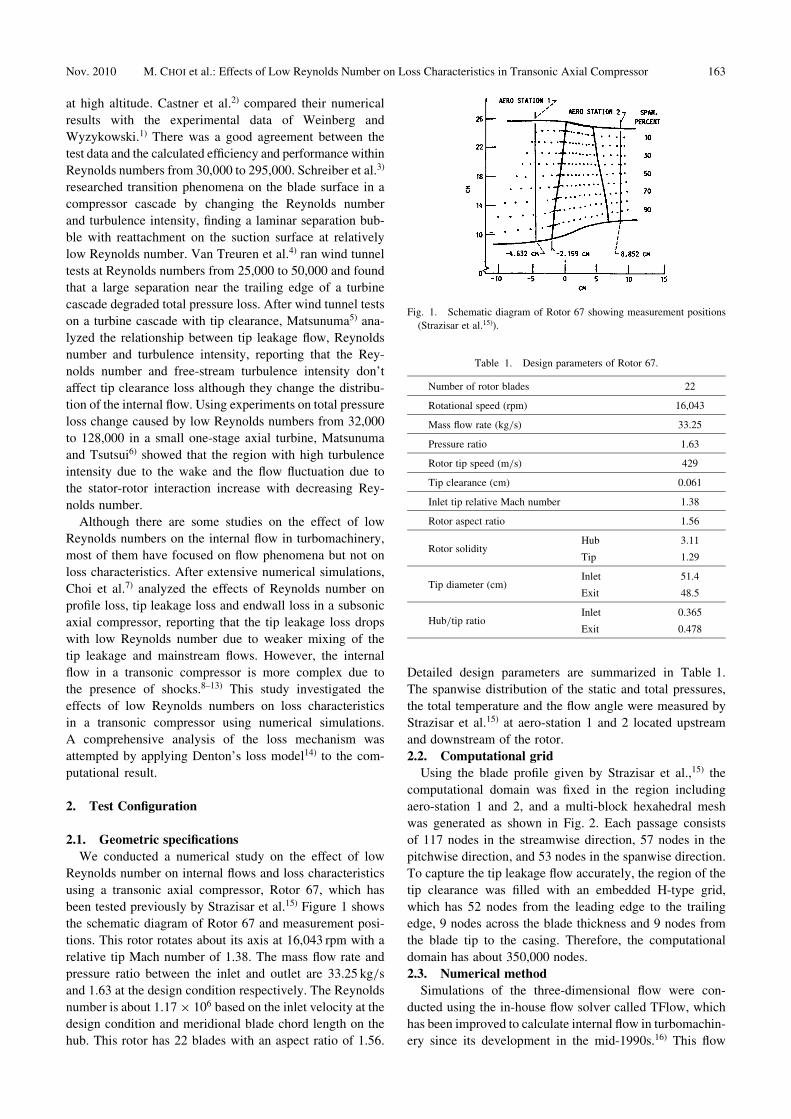
been tested previously by Strazisar et al.15) Figure 1 shows
the schematic diagram of Rotor 67 and measurement posi-
tions. This rotor rotates about its axis at 16,043 rpm with a
relative tip Mach number of 1.38. The mass flow rate and
pressure ratio between the inlet and outlet are 33.25 kg/s
and 1.63 at the design condition respectively. The Reynolds
number is about 1:17� 106 based on the inlet velocity at the
design condition and meridional blade chord length on the
hub. This rotor has 22 blades with an aspect ratio of 1.56.
Detailed design parameters are summarized in Table 1.
The spanwise distribution of the static and total pressures,
the total temperature and the flow angle were measured by
Strazisar et al.15) at aero-station 1 and 2 located upstream
and downstream of the rotor.
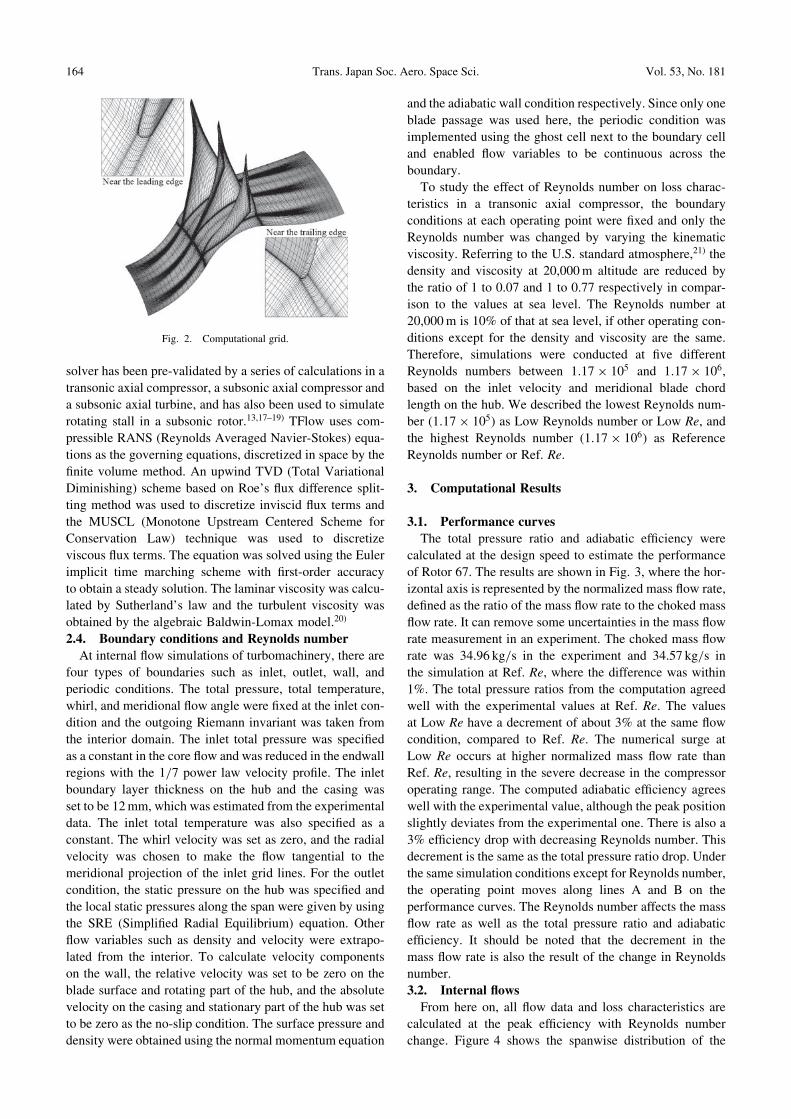
2.2. Computational grid
Using the blade profile given by Strazisar et al.,15) the
computational domain was fixed in the region including
aero-station 1 and 2, and a multi-block hexahedral mesh
was generated as shown in Fig. 2. Each passage consists
of 117 nodes in the streamwise direction, 57 nodes in the
pitchwise direction, and 53 nodes in the spanwise direction.
To capture the tip leakage flow accurately, the region of the
tip clearance was filled with an embedded H-type grid,
which has 52 nodes from the leading edge to the trailing
edge, 9 nodes across the blade thickness and 9 nodes from
the blade tip to the casing. Therefore, the computational
domain has about 350,000 nodes.
2.3. Numerical method
Simulations of the three-dimensional flow were con-
ducted using the in-house flow solver called TFlow, which
has been improved to calculate internal flow in turbomachin-
ery since its development in the mid-1990s.16) This flow
Fig. 1. Schematic diagram of Rotor 67 showing measurement positions
(Strazisar et al.15)).
Table 1. Design parameters of Rotor 67.
Number of rotor blades 22
Rotational speed (rpm) 16,043
Mass flow rate (kg/s) 33.25
Pressure ratio 1.63
Rotor tip speed (m/s) 429
Tip clearance (cm) 0.061
Inlet tip relative Mach number 1.38
Rotor aspect ratio 1.56
Rotor solidityHub 3.11
Tip 1.29
Tip diameter (cm)Inlet 51.4
Exit 48.5
Hub/tip ratioInlet 0.365
Exit 0.478
Nov. 2010 M. CHOI et al.: Effects of Low Reynolds Number on Loss Characteristics in Transonic Axial Compressor 163
solver has been pre-validated by a series of calculations in a
transonic axial compressor, a subsonic axial compressor and
a subsonic axial turbine, and has also been used to simulate
rotating stall in a subsonic rotor.13,17–19) TFlow uses com-
pressible RANS (Reynolds Averaged Navier-Stokes) equa-
tions as the governing equations, discretized in space by the
finite volume method. An upwind TVD (Total Variational
Diminishing) scheme based on Roe’s flux difference split-
ting method was used to discretize inviscid flux terms and
the MUSCL (Monotone Upstream Centered Scheme for
Conservation Law) technique was used to discretize
viscous flux terms. The equation was solved using the Euler
implicit time marching scheme with first-order accuracy
to obtain a steady solution. The laminar viscosity was calcu-
lated by Sutherland’s law and the turbulent viscosity was
obtained by the algebraic Baldwin-Lomax model.20)
2.4. Boundary conditions and Reynolds number
At internal flow simulations of turbomachinery, there are
four types of boundaries such as inlet, outlet, wall, and
periodic conditions. The total pressure, total temperature,
whirl, and meridional flow angle were fixed at the inlet con-
dition and the outgoing Riemann invariant was taken from
the interior domain. The inlet total pressure was specified
as a constant in the core flow and was reduced in the endwall
regions with the 1/7 power law velocity profile. The inlet
boundary layer thickness on the hub and the casing was
set to be 12mm, which was estimated from the experimental
data. The inlet total temperature was also specified as a
constant. The whirl velocity was set as zero, and the radial
velocity was chosen to make the flow tangential to the
meridional projection of the inlet grid lines. For the outlet
condition, the static pressure on the hub was specified and
the local static pressures along the span were given by using
the SRE (Simplified Radial Equilibrium) equation. Other
flow variables such as density and velocity were extrapo-
lated from the interior. To calculate velocity components
on the wall, the relative velocity was set to be zero on the
blade surface and rotating part of the hub, and the absolute
velocity on the casing and stationary part of the hub was set
to be zero as the no-slip condition. The surface pressure and
density were obtained using the normal momentum equation
and the adiabatic wall condition respectively. Since only one
blade passage was used here, the periodic condition was
implemented using the ghost cell next to the boundary cell
and enabled flow variables to be continuous across the
boundary.
To study the effect of Reynolds number on loss charac-
teristics in a transonic axial compressor, the boundary
conditions at each operating point were fixed and only the
Reynolds number was changed by varying the kinematic
viscosity. Referring to the U.S. standard atmosphere,21) the
density and viscosity at 20,000m altitude are reduced by
the ratio of 1 to 0.07 and 1 to 0.77 respectively in compar-
ison to the values at sea level. The Reynolds number at
20,000m is 10% of that at sea level, if other operating con-
ditions except for the density and viscosity are the same.
Therefore, simulations were conducted at five different
Reynolds numbers between 1:17� 105 and 1:17� 106,
based on the inlet velocity and meridional blade chord
length on the hub. We described the lowest Reynolds num-
ber (1:17� 105) as Low Reynolds number or Low Re, and
the highest Reynolds number (1:17� 106) as Reference
Reynolds number or Ref. Re.
3. Computational Results
3.1. Performance curves
The total pressure ratio and adiabatic efficiency were
calculated at the design speed to estimate the performance
of Rotor 67. The results are shown in Fig. 3, where the hor-
izontal axis is represented by the normalized mass flow rate,
defined as the ratio of the mass flow rate to the choked mass
flow rate. It can remove some uncertainties in the mass flow
rate measurement in an experiment. The choked mass flow
rate was 34.96 kg/s in the experiment and 34.57 kg/s in
the simulation at Ref. Re, where the difference was within
1%. The total pressure ratios from the computation agreed
well with the experimental values at Ref. Re. The values
at Low Re have a decrement of about 3% at the same flow
condition, compared to Ref. Re. The numerical surge at
Low Re occurs at higher normalized mass flow rate than
Ref. Re, resulting in the severe decrease in the compressor
operating range. The computed adiabatic efficiency agrees
well with the experimental value, although the peak position
slightly deviates from the experimental one. There is also a
3% efficiency drop with decreasing Reynolds number. This
decrement is the same as the total pressure ratio drop. Under
the same simulation conditions except for Reynolds number,
the operating point moves along lines A and B on the
performance curves. The Reynolds number affects the mass
flow rate as well as the total pressure ratio and adiabatic
efficiency. It should be noted that the decrement in the
mass flow rate is also the result of the change in Reynolds
number.
3.2. Internal flows
From here on, all flow data and loss characteristics are
calculated at the peak efficiency with Reynolds number
change. Figure 4 shows the spanwise distribution of the
Fig. 2. Computational grid.
164 Trans. Japan Soc. Aero. Space Sci. Vol. 53, No. 181
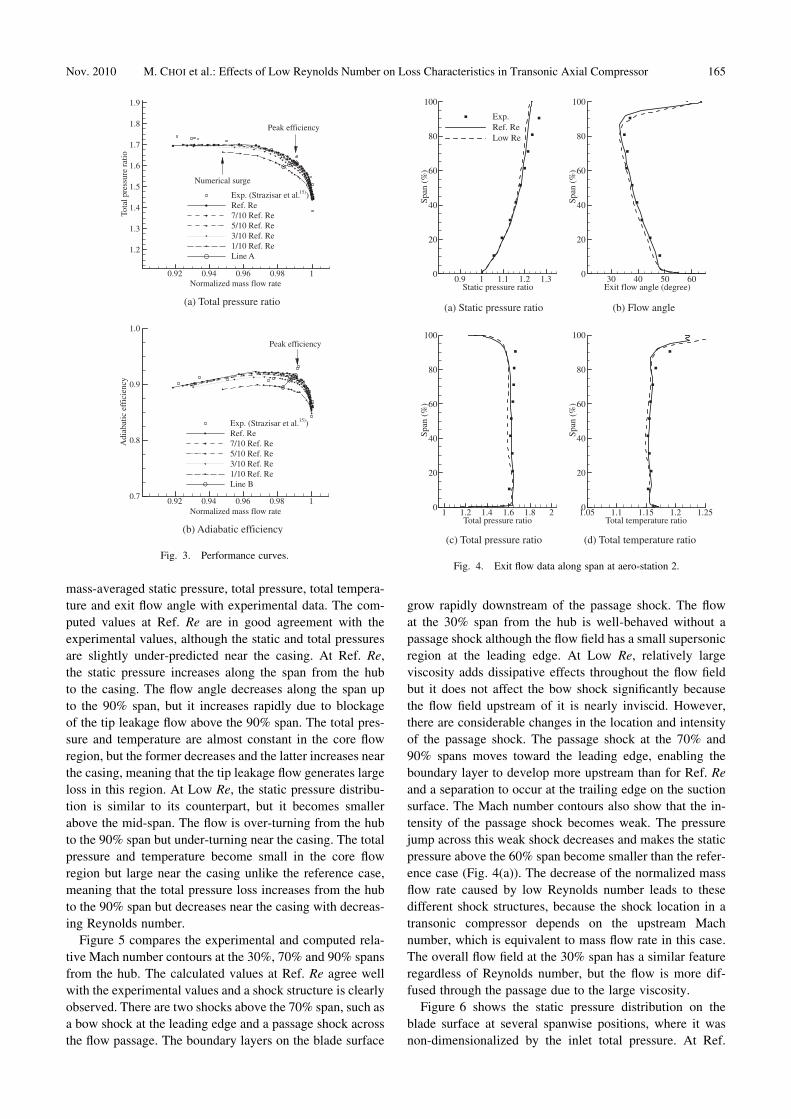
mass-averaged static pressure, total pressure, total tempera-
ture and exit flow angle with experimental data. The com-
puted values at Ref. Re are in good agreement with the
experimental values, although the static and total pressures
are slightly under-predicted near the casing. At Ref. Re,
the static pressure increases along the span from the hub
to the casing. The flow angle decreases along the span up
to the 90% span, but it increases rapidly due to blockage
of the tip leakage flow above the 90% span. The total pres-
sure and temperature are almost constant in the core flow
region, but the former decreases and the latter increases near
the casing, meaning that the tip leakage flow generates large
loss in this region. At Low Re, the static pressure distribu-
tion is similar to its counterpart, but it becomes smaller
above the mid-span. The flow is over-turning from the hub
to the 90% span but under-turning near the casing. The total
pressure and temperature become small in the core flow
region but large near the casing unlike the reference case,
meaning that the total pressure loss increases from the hub
to the 90% span but decreases near the casing with decreas-
ing Reynolds number.
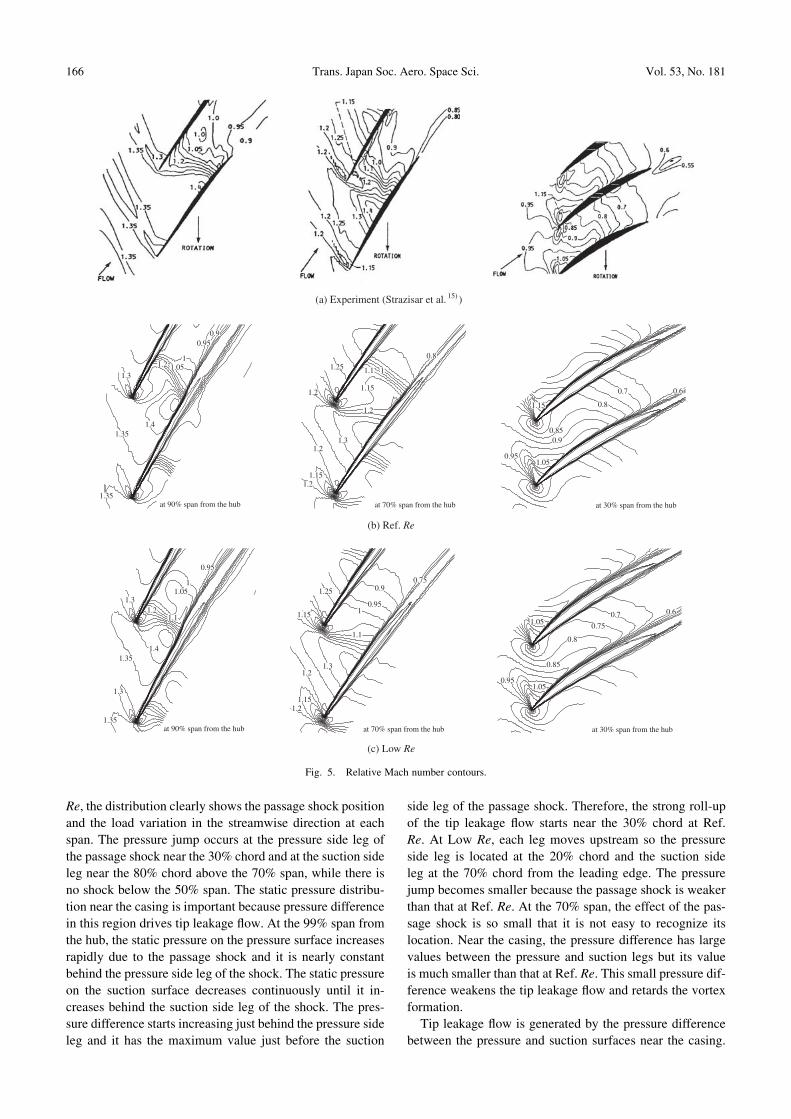
Figure 5 compares the experimental and computed rela-
tive Mach number contours at the 30%, 70% and 90% spans
from the hub. The calculated values at Ref. Re agree well
with the experimental values and a shock structure is clearly
observed. There are two shocks above the 70% span, such as
a bow shock at the leading edge and a passage shock across
the flow passage. The boundary layers on the blade surface
grow rapidly downstream of the passage shock. The flow
at the 30% span from the hub is well-behaved without a
passage shock although the flow field has a small supersonic
region at the leading edge. At Low Re, relatively large
viscosity adds dissipative effects throughout the flow field
but it does not affect the bow shock significantly because
the flow field upstream of it is nearly inviscid. However,
there are considerable changes in the location and intensity
of the passage shock. The passage shock at the 70% and
90% spans moves toward the leading edge, enabling the
boundary layer to develop more upstream than for Ref. Re
and a separation to occur at the trailing edge on the suction
surface. The Mach number contours also show that the in-
tensity of the passage shock becomes weak. The pressure
jump across this weak shock decreases and makes the static
pressure above the 60% span become smaller than the refer-
ence case (Fig. 4(a)). The decrease of the normalized mass
flow rate caused by low Reynolds number leads to these
different shock structures, because the shock location in a
transonic compressor depends on the upstream Mach
number, which is equivalent to mass flow rate in this case.
The overall flow field at the 30% span has a similar feature
regardless of Reynolds number, but the flow is more dif-
fused through the passage due to the large viscosity.
Figure 6 shows the static pressure distribution on the
blade surface at several spanwise positions, where it was
non-dimensionalized by the inlet total pressure. At Ref.
Static pressure ratio
Span
(%
)
0.9 1 1.1 1.2 1.30
20
40
60
80
100
Exp.Ref. ReLow Re
Exit flow angle (degree)
Span
(%
)
30 40 50 600
20
40
60
80
100
(a) Static pressure ratio (b) Flow angle
Total pressure ratio
Span
(%
)
1 1.2 1.4 1.6 1.8 20
20
40
60
80
100
Total temperature ratio
Span
(%
)
1.05 1.1 1.15 1.2 1.250
20
40
60
80
100
(c) Total pressure ratio (d) Total temperature ratio
Fig. 4. Exit flow data along span at aero-station 2.
0.92 0.94 0.96 0.98 1
1.2
1.3
1.4
1.5
1.6
1.7
1.8
1.9
15))Ref. Re7/10 Ref. Re5/10 Ref. Re3/10 Ref. Re1/10 Ref. ReLine A
Numerical surge
(a) Total pressure ratio
Normalized mass flow rate0.92 0.94 0.96 0.98 1
0.7
0.8
0.9
1.0
Exp. (Strazisar et al.15))Ref. Re7/10 Ref. Re5/10 Ref. Re3/10 Ref. Re1/10 Ref. ReLine B
Peak efficiency
(b) Adiabatic efficiency
Normalized mass flow rate
Tota
l pre
ssur
e ra
tioPeak efficiency
Exp. (Strazisar et al.
Adi
abat
ic e
ffic
ienc
y
Fig. 3. Performance curves.
Nov. 2010 M. CHOI et al.: Effects of Low Reynolds Number on Loss Characteristics in Transonic Axial Compressor 165
Re, the distribution clearly shows the passage shock position
and the load variation in the streamwise direction at each
span. The pressure jump occurs at the pressure side leg of
the passage shock near the 30% chord and at the suction side
leg near the 80% chord above the 70% span, while there is
no shock below the 50% span. The static pressure distribu-
tion near the casing is important because pressure difference
in this region drives tip leakage flow. At the 99% span from
the hub, the static pressure on the pressure surface increases
rapidly due to the passage shock and it is nearly constant
behind the pressure side leg of the shock. The static pressure
on the suction surface decreases continuously until it in-
creases behind the suction side leg of the shock. The pres-
sure difference starts increasing just behind the pressure side
leg and it has the maximum value just before the suction
side leg of the passage shock. Therefore, the strong roll-up
of the tip leakage flow starts near the 30% chord at Ref.
Re. At Low Re, each leg moves upstream so the pressure
side leg is located at the 20% chord and the suction side
leg at the 70% chord from the leading edge. The pressure
jump becomes smaller because the passage shock is weaker
than that at Ref. Re. At the 70% span, the effect of the pas-
sage shock is so small that it is not easy to recognize its
location. Near the casing, the pressure difference has large
values between the pressure and suction legs but its value
is much smaller than that at Ref. Re. This small pressure dif-
ference weakens the tip leakage flow and retards the vortex
formation.
Tip leakage flow is generated by the pressure difference
between the pressure and suction surfaces near the casing.
(a) Experiment (Strazisar et al. 15) )
0.95
1.41.35
1.051
0.9
1.3
1.35
1.2
at 90% span from the hub
1.2
1.2
1.15
1.3
1.15
1.1 1
0.8
1.2
1.2
1.25
at 70% span from the hub
0.951.05
0.90.85
0.8
0.7 0.6
1.15
at 30% span from the hub
(b) Ref. Re
0.95
1.41.35
1.051
1.3
1.35
1.21.1
1.3
at 90% span from the hub
1.2
1.2
1.15
0.75
1.1
1.25
1
1.3
0.95
0.9
1.15
at 70% span from the hub
0.951.05
0.85
0.75
0.7
0.8
1.050.6
at 30% span from the hub
(c) Low Re
Fig. 5. Relative Mach number contours.
166 Trans. Japan Soc. Aero. Space Sci. Vol. 53, No. 181
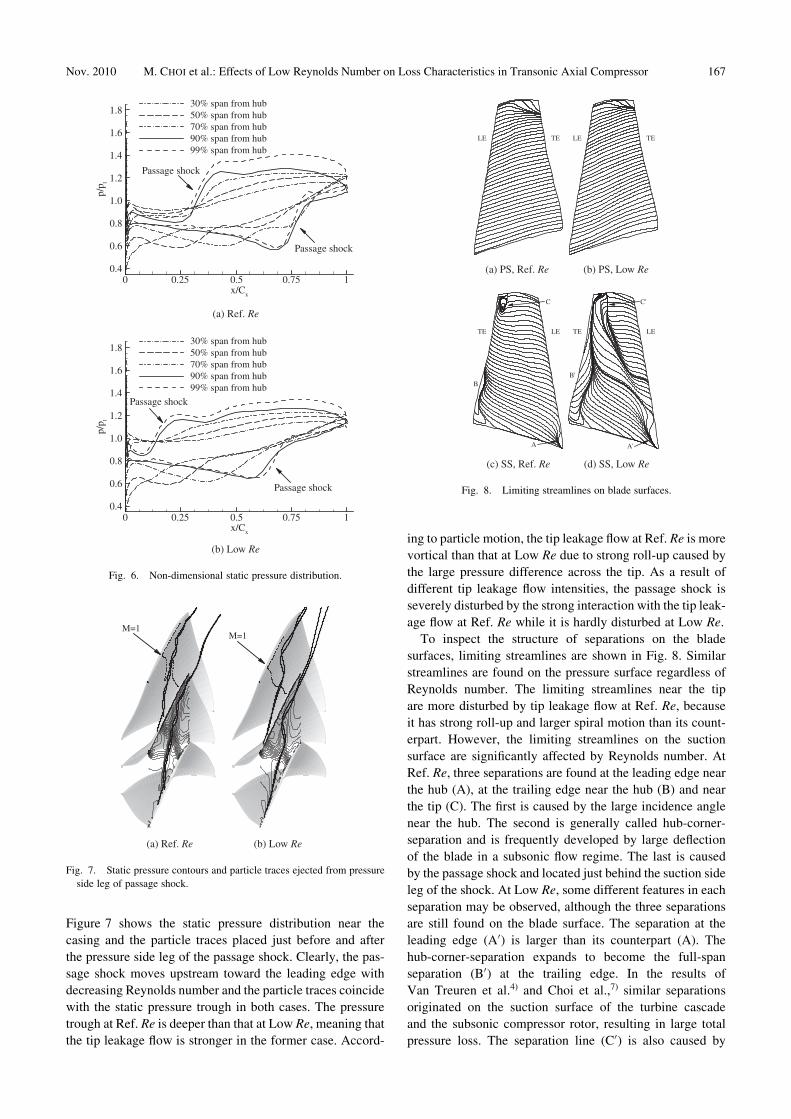
Figure 7 shows the static pressure distribution near the
casing and the particle traces placed just before and after
the pressure side leg of the passage shock. Clearly, the pas-
sage shock moves upstream toward the leading edge with
decreasing Reynolds number and the particle traces coincide
with the static pressure trough in both cases. The pressure
trough at Ref. Re is deeper than that at Low Re, meaning that
the tip leakage flow is stronger in the former case. Accord-
ing to particle motion, the tip leakage flow at Ref. Re is more
vortical than that at Low Re due to strong roll-up caused by
the large pressure difference across the tip. As a result of
different tip leakage flow intensities, the passage shock is
severely disturbed by the strong interaction with the tip leak-
age flow at Ref. Re while it is hardly disturbed at Low Re.
To inspect the structure of separations on the blade
surfaces, limiting streamlines are shown in Fig. 8. Similar
streamlines are found on the pressure surface regardless of
Reynolds number. The limiting streamlines near the tip
are more disturbed by tip leakage flow at Ref. Re, because
it has strong roll-up and larger spiral motion than its count-
erpart. However, the limiting streamlines on the suction
surface are significantly affected by Reynolds number. At
Ref. Re, three separations are found at the leading edge near
the hub (A), at the trailing edge near the hub (B) and near
the tip (C). The first is caused by the large incidence angle
near the hub. The second is generally called hub-corner-
separation and is frequently developed by large deflection
of the blade in a subsonic flow regime. The last is caused
by the passage shock and located just behind the suction side
leg of the shock. At Low Re, some different features in each
separation may be observed, although the three separations
are still found on the blade surface. The separation at the
leading edge (A0) is larger than its counterpart (A). The
hub-corner-separation expands to become the full-span
separation (B0) at the trailing edge. In the results of
Van Treuren et al.4) and Choi et al.,7) similar separations
originated on the suction surface of the turbine cascade
and the subsonic compressor rotor, resulting in large total
pressure loss. The separation line (C0) is also caused by
x/Cx
p/p t
0.4
0.6
0.8
1.0
1.2
1.4
1.6
1.830% span from hub50% span from hub70% span from hub90% span from hub99% span from hub
Passage shock
Passage shock
(a) Ref. Re
x/Cx
p/p t
0 0.25 0.5 0.75 10.4
0.6
0.8
1.0
1.2
1.4
1.6
1.830% span from hub50% span from hub70% span from hub90% span from hub99% span from hub
Passage shock
Passage shock
(b) Low Re
0 0.25 0.5 0.75 1
Fig. 6. Non-dimensional static pressure distribution.
M=1M=1
(a) Ref. Re (b) Low Re
Fig. 7. Static pressure contours and particle traces ejected from pressure
side leg of passage shock.
TELE TELE
(a) PS, Ref. Re (b) PS, Low Re
LETE
B
A
C
LETE
B'
A'
C'
(c) SS, Ref. Re (d) SS, Low Re
Fig. 8. Limiting streamlines on blade surfaces.
Nov. 2010 M. CHOI et al.: Effects of Low Reynolds Number on Loss Characteristics in Transonic Axial Compressor 167
the passage shock and is located further upstream because
the shock moves upstream with decreasing Reynolds
number.
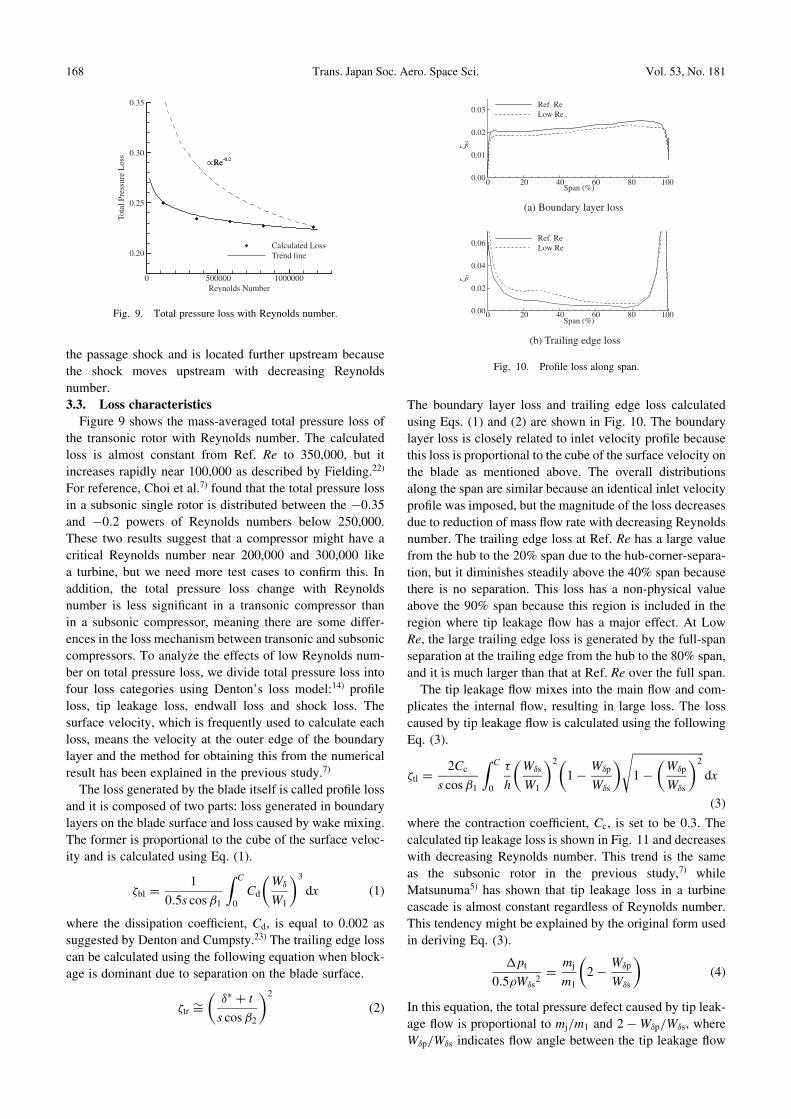
3.3. Loss characteristics
Figure 9 shows the mass-averaged total pressure loss of
the transonic rotor with Reynolds number. The calculated
loss is almost constant from Ref. Re to 350,000, but it
increases rapidly near 100,000 as described by Fielding.22)
For reference, Choi et al.7) found that the total pressure loss
in a subsonic single rotor is distributed between the �0:35
and �0:2 powers of Reynolds numbers below 250,000.
These two results suggest that a compressor might have a
critical Reynolds number near 200,000 and 300,000 like
a turbine, but we need more test cases to confirm this. In
addition, the total pressure loss change with Reynolds
number is less significant in a transonic compressor than
in a subsonic compressor, meaning there are some differ-
ences in the loss mechanism between transonic and subsonic
compressors. To analyze the effects of low Reynolds num-
ber on total pressure loss, we divide total pressure loss into
four loss categories using Denton’s loss model:14) profile
loss, tip leakage loss, endwall loss and shock loss. The
surface velocity, which is frequently used to calculate each
loss, means the velocity at the outer edge of the boundary
layer and the method for obtaining this from the numerical
result has been explained in the previous study.7)
The loss generated by the blade itself is called profile loss
and it is composed of two parts: loss generated in boundary
layers on the blade surface and loss caused by wake mixing.
The former is proportional to the cube of the surface veloc-
ity and is calculated using Eq. (1).
�bl ¼1
0:5s cos �1
Z C
0
Cd
W�
W1
� �3
dx ð1Þ
where the dissipation coefficient, Cd, is equal to 0.002 as
suggested by Denton and Cumpsty.23) The trailing edge loss
can be calculated using the following equation when block-
age is dominant due to separation on the blade surface.
�tr ¼��� þ t
s cos �2
� �2
ð2Þ
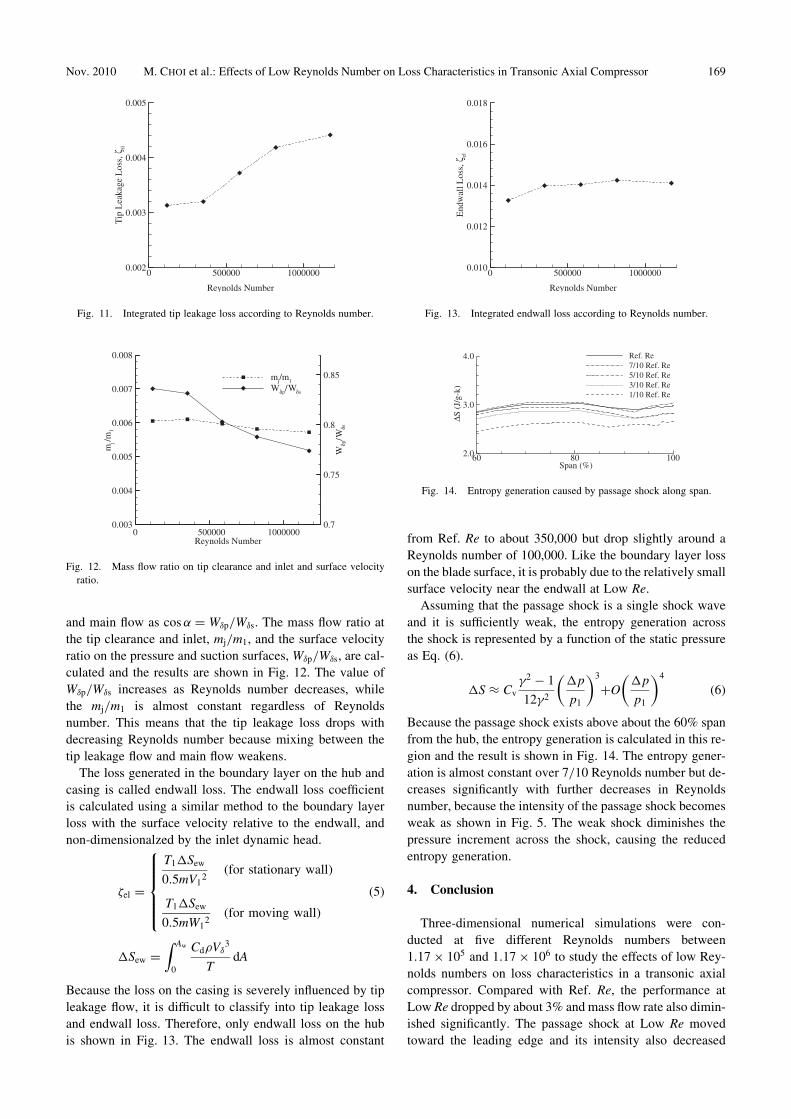
The boundary layer loss and trailing edge loss calculated
using Eqs. (1) and (2) are shown in Fig. 10. The boundary
layer loss is closely related to inlet velocity profile because
this loss is proportional to the cube of the surface velocity on
the blade as mentioned above. The overall distributions
along the span are similar because an identical inlet velocity
profile was imposed, but the magnitude of the loss decreases
due to reduction of mass flow rate with decreasing Reynolds
number. The trailing edge loss at Ref. Re has a large value
from the hub to the 20% span due to the hub-corner-separa-
tion, but it diminishes steadily above the 40% span because
there is no separation. This loss has a non-physical value
above the 90% span because this region is included in the
region where tip leakage flow has a major effect. At Low
Re, the large trailing edge loss is generated by the full-span
separation at the trailing edge from the hub to the 80% span,
and it is much larger than that at Ref. Re over the full span.
The tip leakage flow mixes into the main flow and com-
plicates the internal flow, resulting in large loss. The loss
caused by tip leakage flow is calculated using the following
Eq. (3).
�tl ¼2Cc
s cos �1
Z C
0
�
h
W�s
W1
� �2
1�W�p
W�s
� � ffiffiffiffiffiffiffiffiffiffiffiffiffiffiffiffiffiffiffiffiffiffiffiffiffiffi1�
W�p
W�s
� �2s
dx
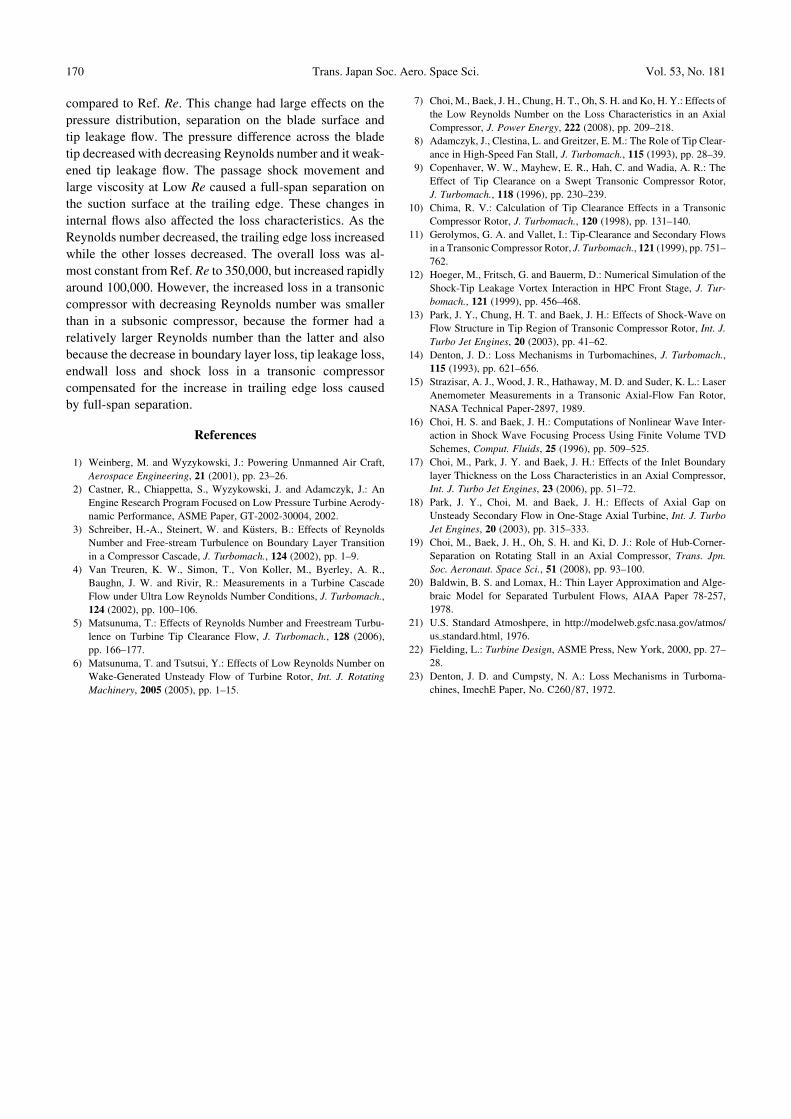
ð3Þwhere the contraction coefficient, Cc, is set to be 0.3. The
calculated tip leakage loss is shown in Fig. 11 and decreases
with decreasing Reynolds number. This trend is the same
as the subsonic rotor in the previous study,7) while
Matsunuma5) has shown that tip leakage loss in a turbine
cascade is almost constant regardless of Reynolds number.
This tendency might be explained by the original form used
in deriving Eq. (3).
�pt
0:5�W�s2¼
mj
m1
2�W�p
W�s
� �ð4Þ
In this equation, the total pressure defect caused by tip leak-
age flow is proportional to mj=m1 and 2�W�p=W�s, where
W�p=W�s indicates flow angle between the tip leakage flow
Span (%)
ζ bl
0.00
0.01
0.02
0.03Ref. ReLow Re
(a) Boundary layer loss
Span (%)
ζ tr
0 20 40 60 80 1000.00
0.02
0.04
0.06Ref. ReLow Re
(b) Trailing edge loss
0 20 40 60 80 100
Fig. 10. Profile loss along span.
Reynolds Number0 500000 1000000
0.20
0.25
0.30
0.35
Re-0.2
Calculated LossTrend line
Re-0.2
Tota
l Pre
ssur
e L
oss
Fig. 9. Total pressure loss with Reynolds number.
168 Trans. Japan Soc. Aero. Space Sci. Vol. 53, No. 181
and main flow as cos� ¼ W�p=W�s. The mass flow ratio at
the tip clearance and inlet, mj=m1, and the surface velocity
ratio on the pressure and suction surfaces, W�p=W�s, are cal-
culated and the results are shown in Fig. 12. The value of
W�p=W�s increases as Reynolds number decreases, while
the mj=m1 is almost constant regardless of Reynolds
number. This means that the tip leakage loss drops with
decreasing Reynolds number because mixing between the
tip leakage flow and main flow weakens.
The loss generated in the boundary layer on the hub and
casing is called endwall loss. The endwall loss coefficient
is calculated using a similar method to the boundary layer
loss with the surface velocity relative to the endwall, and
non-dimensionalzed by the inlet dynamic head.
�el ¼
T1�Sew
0:5mV12
(for stationary wall)
T1�Sew
0:5mW12
(for moving wall)
8>>>><>>>>:
ð5Þ
�Sew ¼Z Aw
0
Cd�V�3
TdA
Because the loss on the casing is severely influenced by tip
leakage flow, it is difficult to classify into tip leakage loss
and endwall loss. Therefore, only endwall loss on the hub
is shown in Fig. 13. The endwall loss is almost constant
from Ref. Re to about 350,000 but drop slightly around a
Reynolds number of 100,000. Like the boundary layer loss
on the blade surface, it is probably due to the relatively small
surface velocity near the endwall at Low Re.
Assuming that the passage shock is a single shock wave
and it is sufficiently weak, the entropy generation across
the shock is represented by a function of the static pressure
as Eq. (6).
�S � Cv
�2 � 1
12�2
�p
p1
� �3
þO�p
p1
� �4
ð6Þ
Because the passage shock exists above about the 60% span
from the hub, the entropy generation is calculated in this re-
gion and the result is shown in Fig. 14. The entropy gener-
ation is almost constant over 7/10 Reynolds number but de-
creases significantly with further decreases in Reynolds
number, because the intensity of the passage shock becomes
weak as shown in Fig. 5. The weak shock diminishes the
pressure increment across the shock, causing the reduced
entropy generation.
4. Conclusion
Three-dimensional numerical simulations were con-
ducted at five different Reynolds numbers between
1:17� 105 and 1:17� 106 to study the effects of low Rey-
nolds numbers on loss characteristics in a transonic axial
compressor. Compared with Ref. Re, the performance at
Low Re dropped by about 3% and mass flow rate also dimin-
ished significantly. The passage shock at Low Re moved
toward the leading edge and its intensity also decreased
Reynolds Number
End
wal
l Los
s,ζ el
0 500000 10000000.010
0.012
0.014
0.016
0.018
Fig. 13. Integrated endwall loss according to Reynolds number.
Span (%)∆S
(J/
g-k)
10080602.0
3.0
4.0 Ref. Re7/10 Ref. Re5/10 Ref. Re3/10 Ref. Re1/10 Ref. Re
Fig. 14. Entropy generation caused by passage shock along span.
Reynolds Number
Tip
Lea
kage
Los
s,ζ tl
0 500000 10000000.002
0.003
0.004
0.005
Fig. 11. Integrated tip leakage loss according to Reynolds number.
Reynolds Number
mj/m
1
Wδp
/ Wδs
0 500000 10000000.003
0.004
0.005
0.006
0.007
0.008
0.7
0.75
0.8
0.85mj/m1
Wδp/ Wδs
Fig. 12. Mass flow ratio on tip clearance and inlet and surface velocity
ratio.
Nov. 2010 M. CHOI et al.: Effects of Low Reynolds Number on Loss Characteristics in Transonic Axial Compressor 169
compared to Ref. Re. This change had large effects on the
pressure distribution, separation on the blade surface and
tip leakage flow. The pressure difference across the blade
tip decreased with decreasing Reynolds number and it weak-
ened tip leakage flow. The passage shock movement and
large viscosity at Low Re caused a full-span separation on
the suction surface at the trailing edge. These changes in
internal flows also affected the loss characteristics. As the
Reynolds number decreased, the trailing edge loss increased
while the other losses decreased. The overall loss was al-
most constant from Ref. Re to 350,000, but increased rapidly
around 100,000. However, the increased loss in a transonic
compressor with decreasing Reynolds number was smaller
than in a subsonic compressor, because the former had a
relatively larger Reynolds number than the latter and also
because the decrease in boundary layer loss, tip leakage loss,
endwall loss and shock loss in a transonic compressor
compensated for the increase in trailing edge loss caused
by full-span separation.
References
1) Weinberg, M. and Wyzykowski, J.: Powering Unmanned Air Craft,
Aerospace Engineering, 21 (2001), pp. 23–26.
2) Castner, R., Chiappetta, S., Wyzykowski, J. and Adamczyk, J.: An
Engine Research Program Focused on Low Pressure Turbine Aerody-
namic Performance, ASME Paper, GT-2002-30004, 2002.
3) Schreiber, H.-A., Steinert, W. and Kusters, B.: Effects of Reynolds
Number and Free-stream Turbulence on Boundary Layer Transition
in a Compressor Cascade, J. Turbomach., 124 (2002), pp. 1–9.
4) Van Treuren, K. W., Simon, T., Von Koller, M., Byerley, A. R.,
Baughn, J. W. and Rivir, R.: Measurements in a Turbine Cascade
Flow under Ultra Low Reynolds Number Conditions, J. Turbomach.,
124 (2002), pp. 100–106.
5) Matsunuma, T.: Effects of Reynolds Number and Freestream Turbu-
lence on Turbine Tip Clearance Flow, J. Turbomach., 128 (2006),
pp. 166–177.
6) Matsunuma, T. and Tsutsui, Y.: Effects of Low Reynolds Number on
Wake-Generated Unsteady Flow of Turbine Rotor, Int. J. Rotating
Machinery, 2005 (2005), pp. 1–15.
7) Choi, M., Baek, J. H., Chung, H. T., Oh, S. H. and Ko, H. Y.: Effects of
the Low Reynolds Number on the Loss Characteristics in an Axial
Compressor, J. Power Energy, 222 (2008), pp. 209–218.
8) Adamczyk, J., Clestina, L. and Greitzer, E. M.: The Role of Tip Clear-
ance in High-Speed Fan Stall, J. Turbomach., 115 (1993), pp. 28–39.
9) Copenhaver, W. W., Mayhew, E. R., Hah, C. and Wadia, A. R.: The
Effect of Tip Clearance on a Swept Transonic Compressor Rotor,
J. Turbomach., 118 (1996), pp. 230–239.
10) Chima, R. V.: Calculation of Tip Clearance Effects in a Transonic
Compressor Rotor, J. Turbomach., 120 (1998), pp. 131–140.
11) Gerolymos, G. A. and Vallet, I.: Tip-Clearance and Secondary Flows
in a Transonic Compressor Rotor, J. Turbomach., 121 (1999), pp. 751–
762.
12) Hoeger, M., Fritsch, G. and Bauerm, D.: Numerical Simulation of the
Shock-Tip Leakage Vortex Interaction in HPC Front Stage, J. Tur-
bomach., 121 (1999), pp. 456–468.
13) Park, J. Y., Chung, H. T. and Baek, J. H.: Effects of Shock-Wave on
Flow Structure in Tip Region of Transonic Compressor Rotor, Int. J.
Turbo Jet Engines, 20 (2003), pp. 41–62.
14) Denton, J. D.: Loss Mechanisms in Turbomachines, J. Turbomach.,
115 (1993), pp. 621–656.
15) Strazisar, A. J., Wood, J. R., Hathaway, M. D. and Suder, K. L.: Laser
Anemometer Measurements in a Transonic Axial-Flow Fan Rotor,
NASA Technical Paper-2897, 1989.
16) Choi, H. S. and Baek, J. H.: Computations of Nonlinear Wave Inter-
action in Shock Wave Focusing Process Using Finite Volume TVD
Schemes, Comput. Fluids, 25 (1996), pp. 509–525.
17) Choi, M., Park, J. Y. and Baek, J. H.: Effects of the Inlet Boundary
layer Thickness on the Loss Characteristics in an Axial Compressor,
Int. J. Turbo Jet Engines, 23 (2006), pp. 51–72.
18) Park, J. Y., Choi, M. and Baek, J. H.: Effects of Axial Gap on
Unsteady Secondary Flow in One-Stage Axial Turbine, Int. J. Turbo
Jet Engines, 20 (2003), pp. 315–333.
19) Choi, M., Baek, J. H., Oh, S. H. and Ki, D. J.: Role of Hub-Corner-
Separation on Rotating Stall in an Axial Compressor, Trans. Jpn.
Soc. Aeronaut. Space Sci., 51 (2008), pp. 93–100.
20) Baldwin, B. S. and Lomax, H.: Thin Layer Approximation and Alge-
braic Model for Separated Turbulent Flows, AIAA Paper 78-257,
1978.
21) U.S. Standard Atmoshpere, in http://modelweb.gsfc.nasa.gov/atmos/
us standard.html, 1976.
22) Fielding, L.: Turbine Design, ASME Press, New York, 2000, pp. 27–
28.
23) Denton, J. D. and Cumpsty, N. A.: Loss Mechanisms in Turboma-
chines, ImechE Paper, No. C260/87, 1972.
170 Trans. Japan Soc. Aero. Space Sci. Vol. 53, No. 181