Embed Size (px)
Citation preview
Purdue UniversityPurdue e-PubsInternational High Performance BuildingsConference School of Mechanical Engineering
2016
Study of Performance Characteristics of a TripleDuty Valve using CFDSagar Dilip JadhavKirloskar Brothers Limited, India, [email protected]
Shyam Narayan ShuklaKirloskar Brothers Limited, India, [email protected]
Ravindra Sharanappa BirajdarKirloskar Brothers Limited, India, [email protected]
Follow this and additional works at: http://docs.lib.purdue.edu/ihpbc
This document has been made available through Purdue e-Pubs, a service of the Purdue University Libraries. Please contact [email protected] foradditional information.Complete proceedings may be acquired in print and on CD-ROM directly from the Ray W. Herrick Laboratories at https://engineering.purdue.edu/Herrick/Events/orderlit.html
Jadhav, Sagar Dilip; Shukla, Shyam Narayan; and Birajdar, Ravindra Sharanappa, "Study of Performance Characteristics of a TripleDuty Valve using CFD" (2016). International High Performance Buildings Conference. Paper 207.http://docs.lib.purdue.edu/ihpbc/207
3504, Page 1
4th
International High Performance Buildings Conference at Purdue, July 11-14, 2016
Study of Performance Characteristics of a Triple Duty Valve using CFD
Sagar Dilip Jadhav
1, Shyam Narayan Shukla
2, Ravindra Sharanappa Birajadar
3,
1Kirloskar Brothers Limited, Corporate Research and Engineering Development,
Pune, Maharashtra, India
(+91-9422373771, +91-20-27211060, [email protected])
2Kirloskar Brothers Limited, Corporate Research and Engineering Development,
Pune, Maharashtra, India
(+91-9922934629, +91-20-27211060, [email protected])
3Kirloskar Brothers Limited, Corporate Research and Engineering Development,
Pune, Maharashtra, India
(+91-9850965670, +91-20-27211060, [email protected])
ABSTRACT
A triple duty valve is used to control the functions such as on-off, throttling and non-return on the discharge side of
hydronic pump systems. In this paper, computational fluid dynamic techniques are used to simulate the 2 inch triple
duty valve performance characteristics for various stroke lengths with uniform outgoing velocity. The performance
characteristics such as flow coefficient and pressure loss coefficient for triple duty valve are calculated for different
stroke lengths (8 mm, 12 mm and 20 mm) through simulation. Numerical simulation is conducted to study effect of
various Reynolds number and valve openings on the performance characteristics of triple duty valve. The permanent
pressure loss coefficient and its dependence on Reynolds number is computed and analyzed respectively so that the
recovery of pressure after passage through valve could be quantitatively understood. The comparison of flow pattern
at different stroke length is investigated. Pressure drop across the triple duty valve and formation of vortex flow after
the valve section have been discussed. Magnitude of flow coefficient, pressure loss coefficient and permanent
pressure loss coefficient calculated through numerical analysis are compared with the experimental results.
Furthermore, this study can be used for the evaluation of performance characteristics of triple duty valve at different
sizes.
1. INTRODUCTION
1.1 Overview
A valve plays a vital role in process industries. When valve is used for flow control, the dynamics of the valve has to
match the dynamics of the flow system. The relationship between valve position and the pipe system would create
the pressure drop and flow becomes highly turbulent. This implies difficulties in predicting the flow properties.
While designing a new kind of valve, simple structures along with optimum energy consumption is common
concern. It is very important to understand fluid flow inside the valve to improve the performance at different
operating conditions. Therefore, it is important to involve other techniques, such as numerical methods, to
compliment experimental studies and provide additional information regarding valve flow patterns. In hydronic
systems, three different types of valve being used to control the functions normally required on the discharge side
such as throttling, on-off and non-return. Triple Duty Valve (TDV) is a combination of all these valves used on the
discharge side of the hydronic pump systems. TDV features are design to balance system accurately and throttle
excess flow. It includes a spring loaded non-slam check valve. This helps to prevent damage of pump and unwanted
heat transfer through the system. It also provides positive shut-off allowing a person to isolate the pump from the
rest of the system. It features a disc style design with a soft seat which provides complete shut-off and prevents
valve chatter. The soft seat design of the disc prevents noise and potential damage that can be associated with valve
chatter. TDV have stopper mechanism which allows returning the disc to its set position after shut-off. While
designing the TDV, the main governing parameter which is responsible for throttling is stroke length. Manual
operation through hand wheel is used to adjust the stroke length for required flow and complete shut-off.
3504, Page 2
4th
International High Performance Buildings Conference at Purdue, July 11-14, 2016
1.2 Literature Survey The behavior of valve in flow field has been studied by several researchers. Some of them are discussed here.
Henderson A. D. et.al (2007), showed the hydrodynamic torque versus opening angle characteristics during constant
head test. It was observed that flow separation increases with angle of closing i.e. from opening to closing travel of
the disc. The strong vortical flow implies lift force and cause fluctuations in pressure. Yang Qin et.al (2011),
observed flow patterns through stop valve with numerical simulation. They observed valve flow coefficient and
fluctuation at different flow with uniform incoming velocity. Shirazi Tavakoli Nima et.al (2012), showed
comparison of flow pattern with various opening angle. It was observed that for larger recirculation length, more
pressure drop occurred. Tamizharasi G. and Kathiresan S., (2012), observed flow characteristics of butterfly valve
under various operating conditions with different disc shape. It was observed that pressure-drop in case of 40º and
60º opening increases significantly. Azad et.al (2014), determined valve characteristics such as flow coefficient and
head loss coefficient using CFX 12 for different valve opening angle for incompressible fluid. They observed that
the downstream stream line flow seems to be uniform with increase in opening angle which indicates the
disturbances are reduced for higher valve opening angle. C Kumar et.al (2015), observed the effect of Reynolds
number and the various valve openings on pressure loss coefficient of traditional butterfly valve. The value of
pressure loss coefficient rapidly increases with increase in valve opening. Reynolds number has a significant effect
on the value of pressure loss coefficient. Jadhav S. D. et.al (2015), showed the flow behavior across the triple duty
valve. It was observed that at initial openings (close to open) recirculation is more which leads to energy loss in
valve. At higher openings reduction of recirculation was observed which consequently improves more uniform
pressure and velocity field.
Several studies had been done and reported in the literature by researcher using CFD to analyze performance
characteristics of different type of valves. However, for a triple duty valve these studies have not been covered for
different stroke length. Hence the present study is aimed at understanding some of these aspects. In this paper in
continuation to prior work of Jadhav S. D. et.al (2015), study has been carried out to calculate the performance
characteristics of TDV at different stroke lengths. Here, more emphasis is given on the effect of various Reynolds
number and valve openings on characteristics of triple duty valve. While studying these aspects at different
Reynolds number, numerically choking is simulated to identify limiting velocity below which it is eradicated.
1.3 Flow Performance Calculations It is important for fluid system designer to understand performance characteristics of the valve, which helps to
achieving desired act without physical damage. Performance characteristics include the pressure drop, flow
coefficient, pressure loss coefficient and permanent pressure loss coefficient. They are defined below,
1.3.1 Flow Coefficient (Cv): Cv is defined as one U.S. gallon (3.8 liters) of 60ºF (16ºC) water that flows through an
opening, such as a valve, during 1 min with a 1 psi (0.07 bar) pressure drop. As specified by Society of America
(ANSI/ISA Standard S 75.01), the simplified equation for Cv is,
√
(1)
1.3.2 Pressure Loss Coefficient (k) and Permanent Pressure Loss Coefficient (kperm): The value of pressure loss
coefficient (k) is calculated by considering the difference in pressure between two locations, one at upstream and
other at downstream of the pipeline. Thus, k is defined as,
(2)
The valve disc introduces certain permanent pressure loss in the duct. In order to evaluate its magnitude, the
pressure loss in the duct with and without valve is computed at identical flow condition. Pressure drops namely, ∆p1
and ∆p2 are calculated between the inlet and outlet of the valve and obviously,
3504, Page 3
4th
International High Performance Buildings Conference at Purdue, July 11-14, 2016
Thus, permanent pressure loss is defined as,
Permanent pressure loss coefficient is defined as,
(3)
The parameter represents the extent of the energy loss in the duct due to the introduction of the valve. It has been
evaluated for three case studies.
2. NUMERICAL MODELLING
CFD provides numerical approximation to the equation that governs fluid motion. Application of the CFD to
analyze a fluid problem requires the following steps.
2.1 Model Description for CFD In the present case, experimental investigation is followed by numerical simulation on three-dimensional geometry
using commercially available CFD software to understand the fluid flow physics and validation of software.
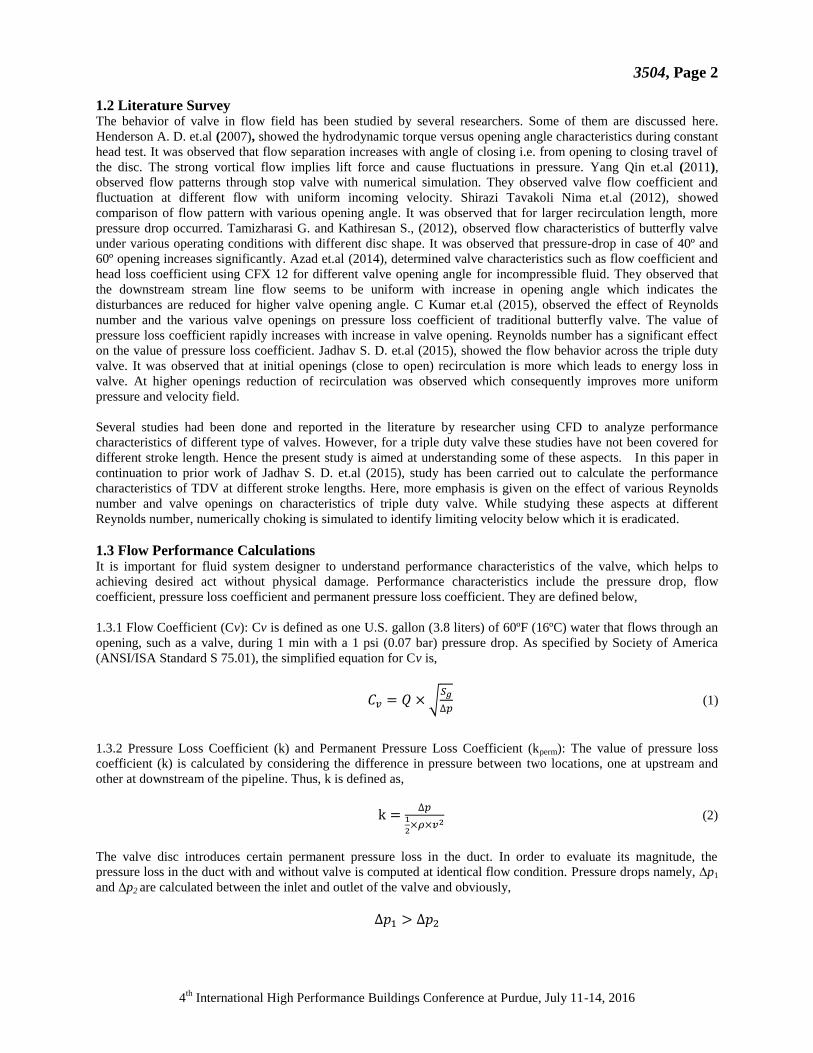
Figure 1: Sectional view of Triple Duty Valve assembly
Fig. 1 shows the cross sectional view of 2” TDV model developed using Creo Parametric 2.0. It mainly consists of
inlet body, outlet body, disc, spring, shaft and hand wheel. Subsequent to experimental work, the same geometry is
taken for numerical simulation. The CFD analysis is carried out at three different stroke lengths. The geometry of
TDV includes inlet pipe, inlet body, disc, shaft, outlet body and outlet pipe as shown in Fig. 2.
Precise geometry of 3D models is prepared using Creo Parametric 2.0. ANSYS ICEM CFD 16.1 is used for
extraction of 3D fluid domain (Fig. 2) and for creation of good quality meshing of TDV. The solution and post-
processing is done in ANSYS CFX-Solver and ANSYS CFX-Post respectively. The computational mesh is
generated using mostly tetrahedral elements in the fluid volume and generating prismatic elements near walls
region. The purpose of creating a hybrid prismatic mesh is to substantially increase mesh resolution in boundary
layers, where high Reynolds number flows exhibit large gradients in the wall-normal direction. The grid distribution
is optimized keeping a good balance between computational time and better computational results. Number of
generated elements and nodes in the passage are 1.94 million and 0.44 million respectively. Three prismatic layers
are generated at the wall boundaries of the TDV. Grid independence test is performed for the geometry to check
whether the results are independent of the mesh sizes. The deviations in results are within 0.05%. The final grid
points are considered to be 0.44 million.
3504, Page 4
4th
International High Performance Buildings Conference at Purdue, July 11-14, 2016
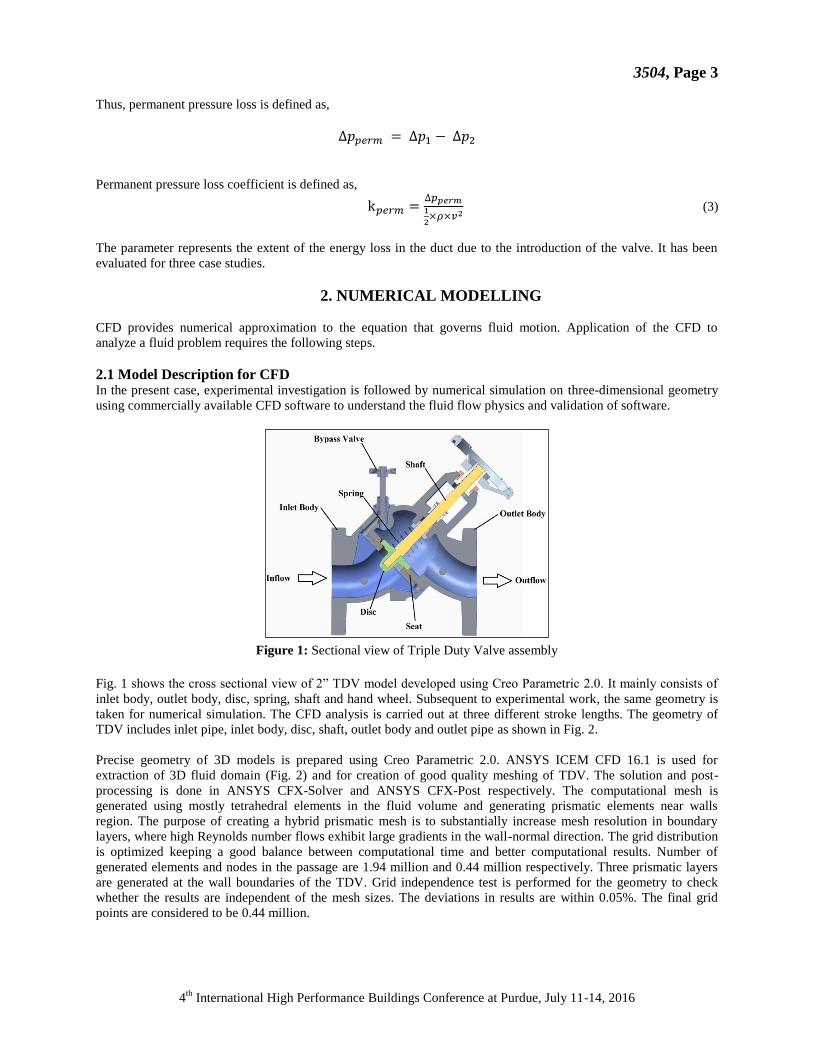
Figure 2: 3D fluid domain
2.2 Boundary Conditions In CFD analysis, solution depends upon the appropriate boundary conditions. The problem is solved considering
steady state simulation. Appropriate boundary conditions are given at the inlet and outlet of the TDV geometry.
Numerically chocking is considered to identify the limiting flow at each opening. The domain type is fluid domain
with water as the working fluid. The standard SST turbulence model is used for analysis. The advection scheme
used is high resolution. This scheme is a higher order scheme and gives good results especially in the case of
recirculation of flows. The physical properties of water are considered at 25°C. The turbulent kinetic energy and
turbulence eddy dissipation are assigned as automatic. As the experimental study was conducted on cast iron valve,
the value of surface roughness on walls is considered as 0.26 x10⁻³
m.
3. RESULTS AND DISCUSSION
The simulation is carried out for different openings and with different Reynolds number. The values of performance
characteristics for 8 mm, 12 mm and 20 mm stroke lengths are calculated through experimentation and CFD
simulation. These values are discussed here.
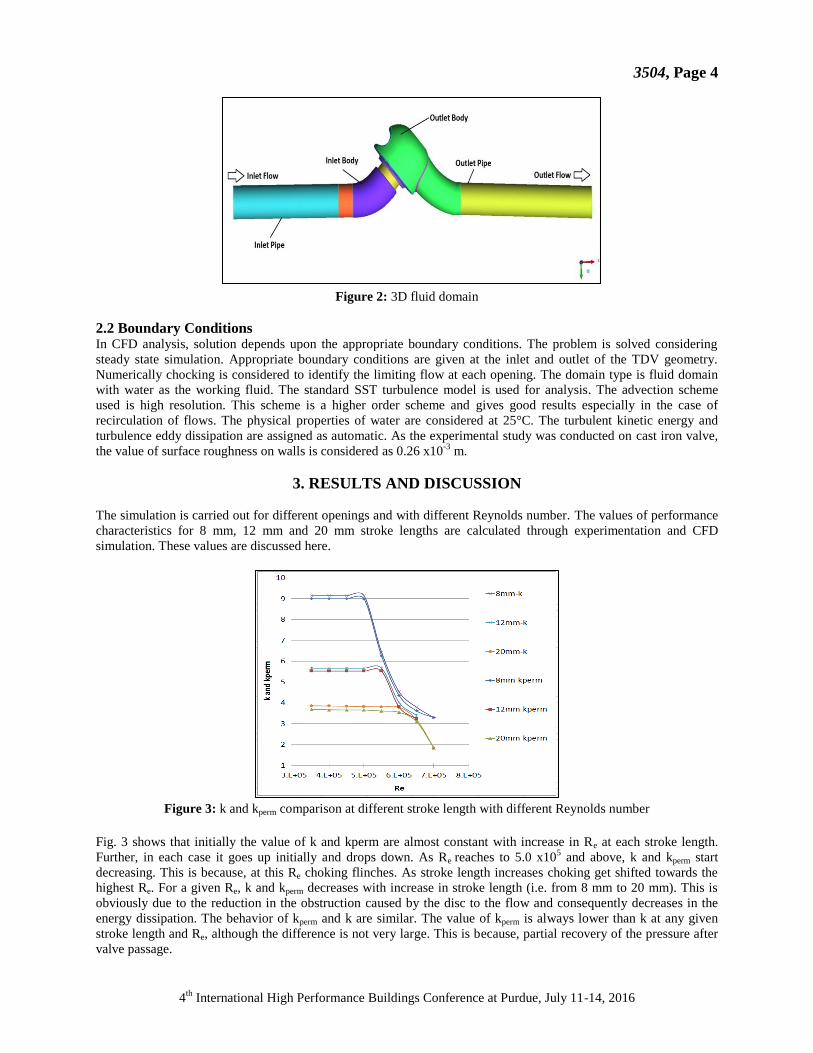
Figure 3: k and kperm comparison at different stroke length with different Reynolds number
Fig. 3 shows that initially the value of k and kperm are almost constant with increase in Re at each stroke length.
Further, in each case it goes up initially and drops down. As Re reaches to 5.0 x10⁵ and above, k and kperm start
decreasing. This is because, at this Re choking flinches. As stroke length increases choking get shifted towards the
highest Re. For a given Re, k and kperm decreases with increase in stroke length (i.e. from 8 mm to 20 mm). This is
obviously due to the reduction in the obstruction caused by the disc to the flow and consequently decreases in the
energy dissipation. The behavior of kperm and k are similar. The value of kperm is always lower than k at any given
stroke length and Re, although the difference is not very large. This is because, partial recovery of the pressure after
valve passage.
3504, Page 5
4th
International High Performance Buildings Conference at Purdue, July 11-14, 2016
(a) (b)
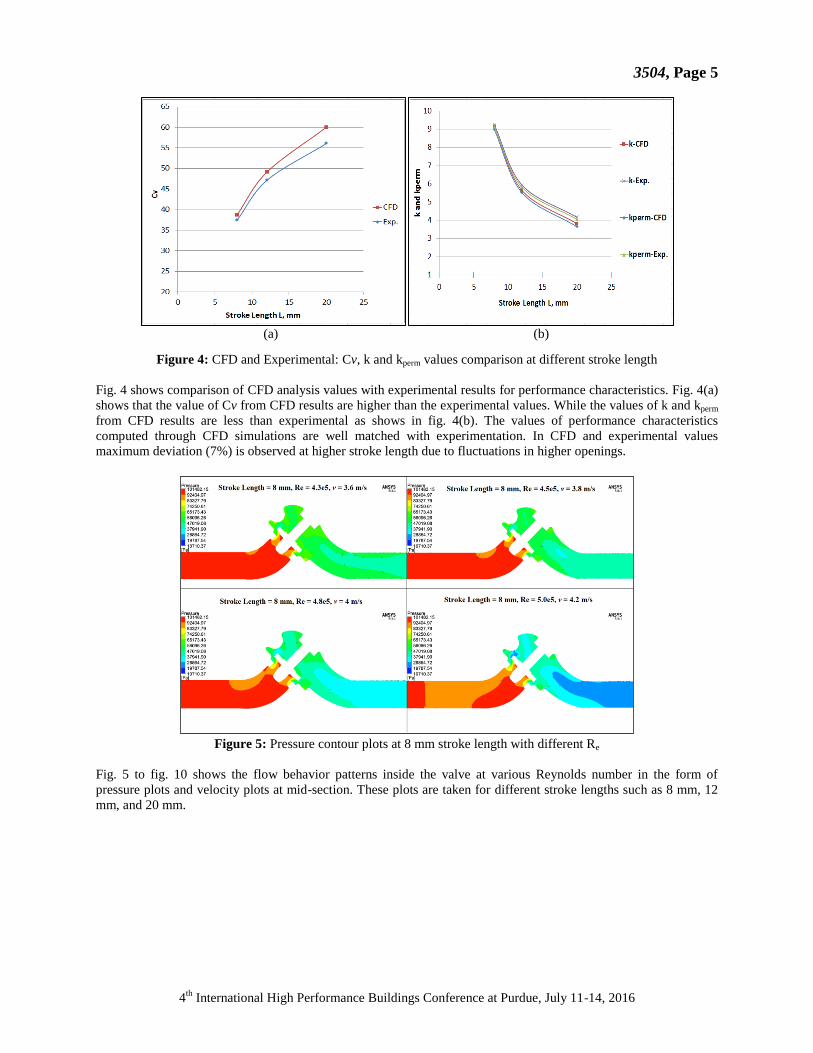
Figure 4: CFD and Experimental: Cv, k and kperm values comparison at different stroke length
Fig. 4 shows comparison of CFD analysis values with experimental results for performance characteristics. Fig. 4(a)
shows that the value of Cv from CFD results are higher than the experimental values. While the values of k and kperm
from CFD results are less than experimental as shows in fig. 4(b). The values of performance characteristics
computed through CFD simulations are well matched with experimentation. In CFD and experimental values
maximum deviation (7%) is observed at higher stroke length due to fluctuations in higher openings.
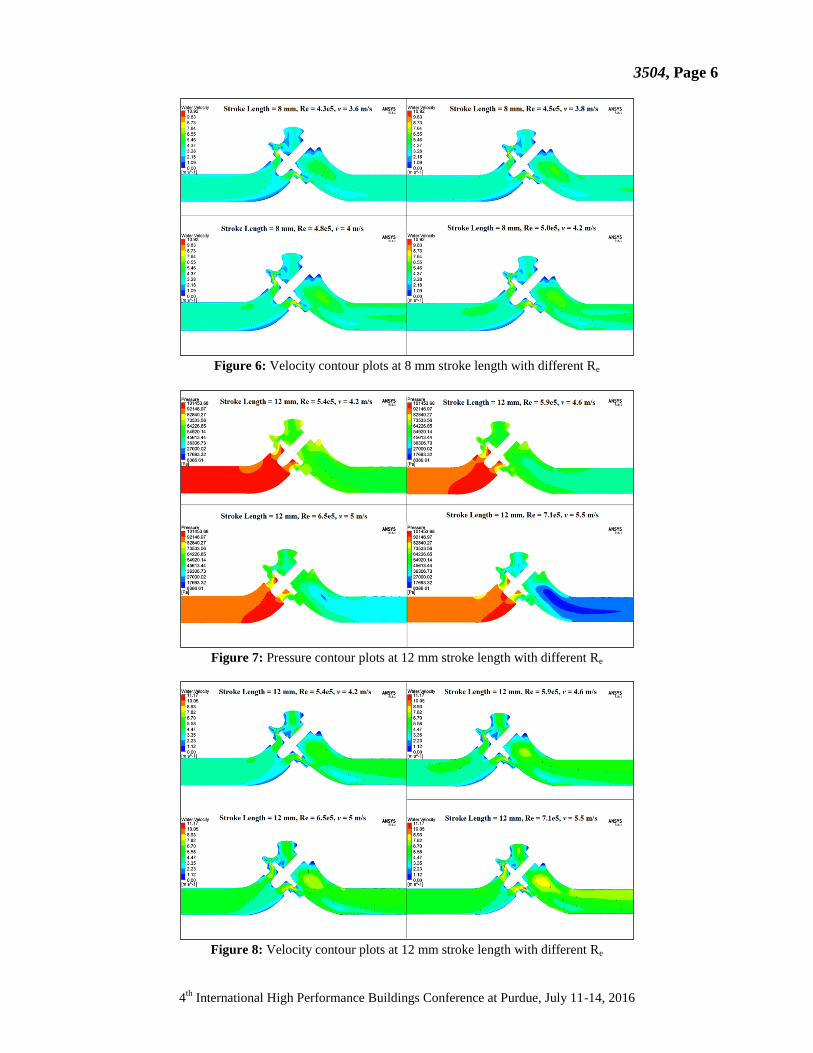
Figure 5: Pressure contour plots at 8 mm stroke length with different Re
Fig. 5 to fig. 10 shows the flow behavior patterns inside the valve at various Reynolds number in the form of
pressure plots and velocity plots at mid-section. These plots are taken for different stroke lengths such as 8 mm, 12
mm, and 20 mm.
3504, Page 6
4th
International High Performance Buildings Conference at Purdue, July 11-14, 2016
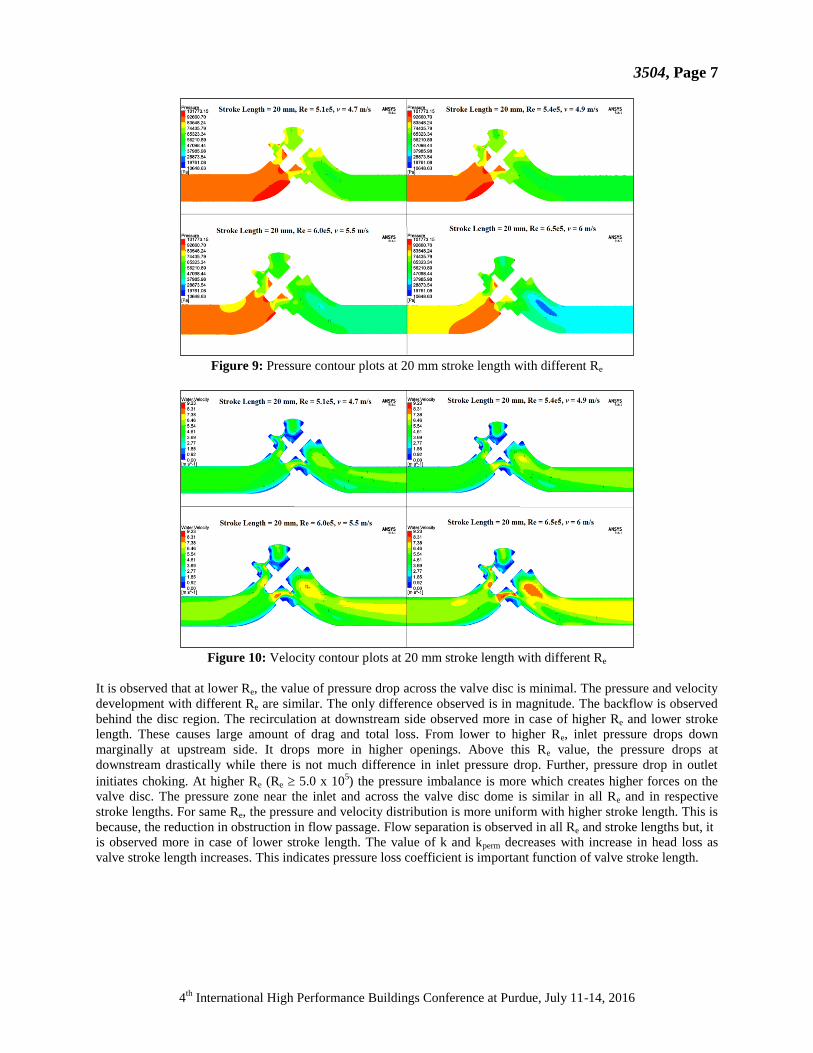
Figure 6: Velocity contour plots at 8 mm stroke length with different Re
Figure 7: Pressure contour plots at 12 mm stroke length with different Re
Figure 8: Velocity contour plots at 12 mm stroke length with different Re
3504, Page 7
4th
International High Performance Buildings Conference at Purdue, July 11-14, 2016
Figure 9: Pressure contour plots at 20 mm stroke length with different Re
Figure 10: Velocity contour plots at 20 mm stroke length with different Re
It is observed that at lower Re, the value of pressure drop across the valve disc is minimal. The pressure and velocity
development with different Re are similar. The only difference observed is in magnitude. The backflow is observed
behind the disc region. The recirculation at downstream side observed more in case of higher Re and lower stroke
length. These causes large amount of drag and total loss. From lower to higher Re, inlet pressure drops down
marginally at upstream side. It drops more in higher openings. Above this Re value, the pressure drops at
downstream drastically while there is not much difference in inlet pressure drop. Further, pressure drop in outlet
initiates choking. At higher Re (Re 5.0 x 10⁵) the pressure imbalance is more which creates higher forces on the
valve disc. The pressure zone near the inlet and across the valve disc dome is similar in all Re and in respective
stroke lengths. For same Re, the pressure and velocity distribution is more uniform with higher stroke length. This is
because, the reduction in obstruction in flow passage. Flow separation is observed in all Re and stroke lengths but, it
is observed more in case of lower stroke length. The value of k and kperm decreases with increase in head loss as
valve stroke length increases. This indicates pressure loss coefficient is important function of valve stroke length.
3504, Page 8
4th
International High Performance Buildings Conference at Purdue, July 11-14, 2016
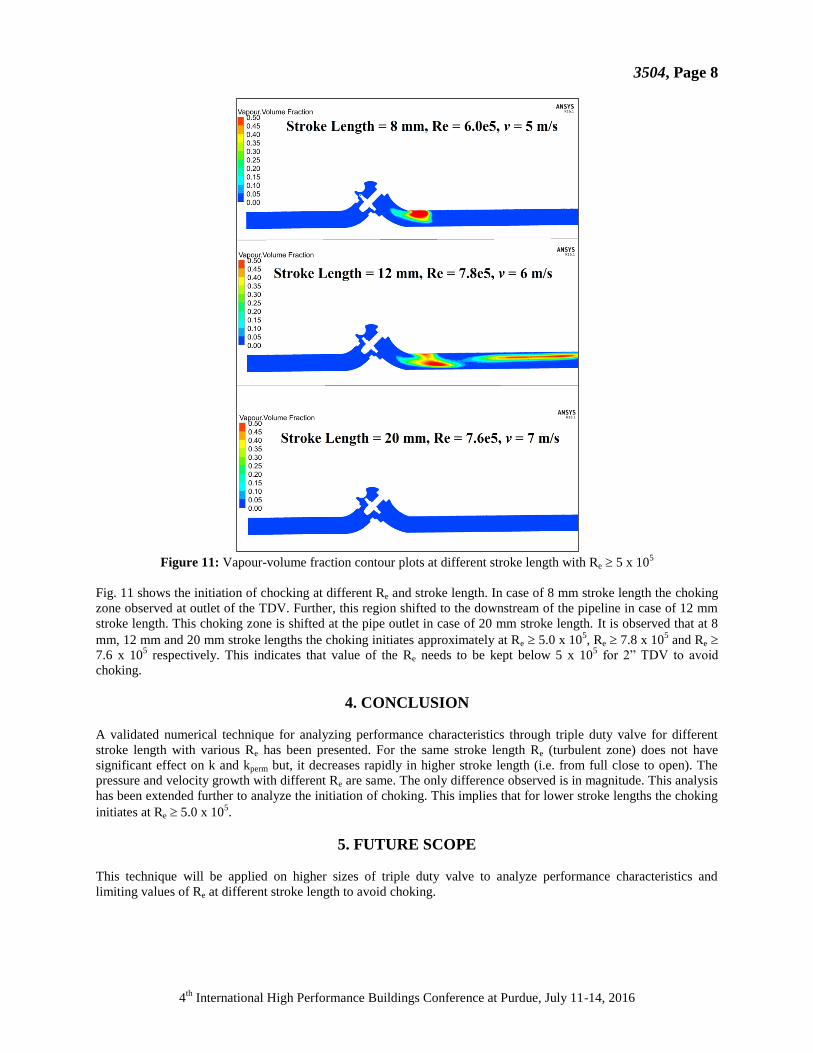
Figure 11: Vapour-volume fraction contour plots at different stroke length with Re 5 x 10
5
Fig. 11 shows the initiation of chocking at different Re and stroke length. In case of 8 mm stroke length the choking
zone observed at outlet of the TDV. Further, this region shifted to the downstream of the pipeline in case of 12 mm
stroke length. This choking zone is shifted at the pipe outlet in case of 20 mm stroke length. It is observed that at 8
mm, 12 mm and 20 mm stroke lengths the choking initiates approximately at Re 5.0 x 10⁵, Re 7.8 x 10
5 and Re
7.6 x 10⁵ respectively. This indicates that value of the Re needs to be kept below 5 x 10
5 for 2” TDV to avoid
choking.
4. CONCLUSION
A validated numerical technique for analyzing performance characteristics through triple duty valve for different
stroke length with various Re has been presented. For the same stroke length Re (turbulent zone) does not have
significant effect on k and kperm but, it decreases rapidly in higher stroke length (i.e. from full close to open). The
pressure and velocity growth with different Re are same. The only difference observed is in magnitude. This analysis
has been extended further to analyze the initiation of choking. This implies that for lower stroke lengths the choking
initiates at Re 5.0 x 10⁵.
5. FUTURE SCOPE
This technique will be applied on higher sizes of triple duty valve to analyze performance characteristics and
limiting values of Re at different stroke length to avoid choking.
3504, Page 9
4th
International High Performance Buildings Conference at Purdue, July 11-14, 2016
NOMENCLATURE
Cv Flow coefficient or flow capacity rating of valve (–)
k Pressure loss coefficient (–)
kperm Permanent pressure loss coefficient (–)
Q Flow rate (USGPM)
Re Reynolds Number (–)
Sg Specific gravity of fluid (–)
v Velocity (m/s)
ρ Density of fluid (kg/m3)
∆p Pressure drop across the valve (psi)
∆pperm Permanent pressure drop across the valve (Pa)
∆p1 Pressure drop between inlet and outlet of the pipe with valve (Pa)
∆p2 Pressure drop between inlet and outlet of the pipe without the valve (Pa)
REFERENCES
1-Paper published in conference proceedings
Azad Arun, Baranwal Deepak, Arya Rajeev, Diwakar Nilesh (2014), Flow Analysis of Butterfly Valve Using CFD,
IJMER, ISSN 2249-6645 ( pp.50), Vol.4, Iss.6, TIEIT-Bhopal, India.
C Kumar Naveen, Seshadri V, K Kumar Yogesh (2015), Parametric Study of Flow Characteristics of Butterfly
Valve Using CFD, IJETE, ISSN (2250-2459), Volume 5,Iss. 11, MIT-Mysore, India.
Henderson A. D., Sargison J. E., Walker G. J. and Haynes J. (2007), A Numerical Study of the Flow Through a
Safety Butterfly Valve in a Hydro-Electric Power Scheme, 16th
Australasian Fluid Mechanic Conference,
(pp.1116-1122), Australia.
Jadhav S. D., Shukla S. N., Birajdar R.S. (2015), Numerical Analysis of Triple Duty Valve, ISBN-978-1-910643-
24-2, NAFEMS World Congress, San Diego, California, USA.
Shirazi Tavakoli Nima, Azizyan Reza Gholam, Akbari Hossein Gholam (2012), CFD Analysis of the Ball Valve
Performance in Presence of Cavitation, Life Sci. J, ISSN: 1097-8135 ( pp.1460-1467), Chabahar, Iran.
Tamizharasi G., Kathiresan S. (2012), CFD Analysis of a Butterfly Valve in a Compressible Fluid, International
Journal of Engineering Trends and Technology, Volume 3 Iss. 2 No3, Bharat University-Chennai, India.
Yang Qin, Zhang Zhiguo, Liu Mingyue, Hu Jing (2011), Numerical Simulation of Fluid Flow Inside the Valve,
ELSEVIER, Procedia Engineering 23 (pp.543-550), Wuhan, China.
2-Book
Skousen P.L.(2014), Valve handbook, Second Edition, McGraw-Hill.
3-Book chapter
White F M, “Fluid Mechanics”, McGraw-Hill, 2012, Seventh Edition, Chapter 6.
ACKNOWLEDGEMENT
The authors would like to thank the Management of Kirloskar Brothers Ltd. Pune, India for the encouraging attitude
towards Research & Engineering development activities, which led to this paper. We are also very thankful to our
colleagues for their invaluable suggestions in research work.