Embed Size (px)
Citation preview
Effects of Land Use on Ground Water Quality, 1999 Annual Report; Minnesota Pollution Control Agency
Ground Water Monitoring and Assessment Program 1
Effects of Land Use on Ground Water Quality, St. Cloud Area, Minnesota – Short Report
June, 2001
Published by
Minnesota Pollution Control Agency
Prepared by
Ground Water Monitoring and Assessment Program
Effects of Land Use on Ground Water Quality, 1999 Annual Report; Minnesota Pollution Control Agency
Ground Water Monitoring and Assessment Program 1
Table of Contents List of Figures List of Tables Executive Summary 1. Materials and Methods 2. Results and Discussion
2.1. Hydrology 2.2. Water Quality
2.2.1. Nitrate 2.2.2. Chloride 2.2.3. Volatile Organic Compounds 2.2.4. Pesticides 2.2.5. Polynuclear Aromatic Hydrocarbons
3. Future of the Project References
Effects of Land Use on Ground Water Quality, 1999 Annual Report; Minnesota Pollution Control Agency
Ground Water Monitoring and Assessment Program 2
List of Figures 1. Location of study area. 2. Location of monitoring points, including wells, surface water sampling points, and
continuous recorders. 3. 1997 Precipitation and water elevations (inches) in wells containing continuous
recorders. Water levels are referenced to the lowest observed elevation during 1997. 4. 1998 Precipitation and water elevations (inches) in wells containing continuous
recorders. Water levels are referenced to the lowest observed elevation during 1997. 5. 1999 Precipitation and water elevations (inches) in wells containing continuous
recorders. Water levels are referenced to the lowest observed elevation during 1997. 6. Tritium concentrations as a function of depth in domestic wells. 7. Nitrate concentrations in private wells as a function of well depth.
Effects of Land Use on Ground Water Quality, 1999 Annual Report; Minnesota Pollution Control Agency
Ground Water Monitoring and Assessment Program 3
List of Tables 1. Sampling parameters for the monitoring network. 2. Mean recharge (inches) in monitoring wells, by land use. 3. Comparison of recharge calculated using continuous recorder with recharge
calculated using water elevations. 4. Median chemical concentrations for different land uses. Concentrations are in ug/L,
except specific conductance (umhos/cm), temperature (oC), pH, and Eh (mV). Different letters within a row indicate concentrations that differ at a 0.05 significance level.
5. Ratios of median chemical concentration to drinking water criteria for six land uses. 6. Median chloride concentrations, by land use, in monitoring wells and surface water.
Different letters within a column indicate concentrations that differed at a significance level of 0.05.
7. Summary of VOC detections, by chemical. 8. Summary of VOC detections, by land use. 9. Number of detections and cumulative mass detected for different chemicals between
1998 and 2000.
Effects of Land Use on Ground Water Quality, 1999 Annual Report; Minnesota Pollution Control Agency
Ground Water Monitoring and Assessment Program 4
Executive Summary
A ground water study began in fall of 1996 to assess impacts of land use on
ground water quality. The study area, located near St. Cloud, Minnesota, is experiencing
rapid urbanization. A shallow sand and gravel aquifer underlies the area. The aquifer is
sensitive to changes in land use. A sampling network across an approximately 30 square-
mile area included 23 monitoring wells screened at the water table, 17 to 21 domestic
wells screened at various depths in the aquifer, 2 surface water sampling locations, 4
continuous water level recorders in monitoring wells, 3 well nests, 2 surface water
gauging stations, and a weather station. Quarterly sampling, conducted between 1997
and 2000, included major cations and anions, trace inorganics, volatile organic
compounds (VOCs), herbicides, field parameters, total and dissolved organic carbon,
total dissolved and suspended solids, ammonia, organic nitrogen, and water level
measurements. Additionally, samples for tritium, polynuclear aromatic hydrocarbons
(PAHs), total coliform bacteria, fecal coliform bacteria, and perchlorate were collected
on one occasion during the study.
Recharge (measured with water levels in monitoring wells) averaged 3.42 inches
between 1997 and 2000. Recharge ranged from 7.86 inches in 1998 to 0.88 inches in
1999. The strongest correlation for recharge was with cumulative precipitation between
December and March. Water levels in continuous recorders illustrated the importance of
wet periods prior to occurrence of recharge. These wet periods led to soil wetting and
allowed subsequent precipitation to percolate to ground water. Recharge measured with
water level recorders was greater than recharge measured with water levels in monitoring
wells, because small recharge events and summer recharge were accounted for by the
recorders. Recharge was greatest in undeveloped and agricultural areas and least in
urban areas. Tritium data indicated the presence of age stratification in the aquifer.
Water at about 100 feet appeared to originate around 1960.
Water quality differences were evident between different land uses.
Concentrations of most trace elements and major ions were highest under urban land use
compared to agricultural and undeveloped land use. The primary exception was nitrate,
which was highest under irrigated agricultural land use. VOCs were commonly found
under commercial/industrial areas, with chloroform, trichloroethylene, and
Effects of Land Use on Ground Water Quality, 1999 Annual Report; Minnesota Pollution Control Agency
Ground Water Monitoring and Assessment Program 5
tetrachloroethylene being the most commonly detected VOCs. Degradates of the
herbicides atrazine, alachlor, metolochlor, and acetochlor, were commonly found under
agricultural land use. PAHs were detected in only one monitoring well. Perchlorate was
not detected in any sample. Coliform bacteria were detected in 8 of 17 monitoring wells
and 2 of 21 domestic wells, with the highest concentrations occurring under nonsewered
residential land use. E. coli bacteria were not detected.
There were significant differences in water quality with depth. These were
largely related to decreasing Eh with depth in the aquifer. Consequently, concentrations
of iron, arsenic, ammonia, and manganese increased with depth, while concentrations of
dissolved oxygen and nitrate decreased with depth.
The primary chemicals of concern, from a human health or environmental
perspective, were nitrate, chloride, VOCs, and herbicides. Nitrate concentrations
exceeded the drinking water criteria of 10000 ug/L in 38 of 41 samples under irrigated
agriculture (median = 16010 ug/L). The median nitrate concentration was 6740 ug/L
under nonsewered residential land use, with 9 of 37 samples exceeding the drinking
water criteria. The median concentration was 4190 ug/L under nonirrigated agriculture,
with 10 of 39 samples exceeding the drinking water criteria. There were no exceedances
under undeveloped (median = 500 ug/L) or sewered residential (median = 2350 ug/L)
land use, while 3 of 55 samples exceeded the criteria under commercial/industrial
(median = 2000 ug/L) land use and 6 of 45 samples exceeded the criteria under
transitional (median = 4190 ug/L) land use.
Chloride concentrations were higher under all land uses compared to undeveloped
land use (median = 3015 ug/L). Median concentrations under other land uses were
82695 ug/L for nonsewered residential, 78775 ug/L for sewered residential, 59020 ug/L
for commercial/industrial, 40920 for irrigated agricultural, 16525 ug/L for nonirrigated
agricultural, and 13900 ug/L for transitional land use. Thus, chloride concentrations
were highest in urban land use settings.
There were a total of 63 VOCs detected in commercial/industrial wells from 1997
to 2000, compared to 40 detections in transitional areas, 32 detections in sewered
residential areas, and less than 5 detections in each of the remaining land uses.
Chloroform was detected on 42 occasions, tetrachloroethylene on 36 occasions,
Effects of Land Use on Ground Water Quality, 1999 Annual Report; Minnesota Pollution Control Agency
Ground Water Monitoring and Assessment Program 6
trichloroethylene on 23 occasions, toluene on 11 occasions, and numerous other
chemicals, primarily chlorinated hydrocarbons, on less than 10 occasions each. Drinking
water criteria were exceeded on five occasions.
Agricultural herbicides were widely detected in monitoring wells in agricultural
areas, domestic wells in agricultural areas, and in surface water. Herbicide degradates
accounted for over 90 percent of the detections and total herbicide mass detected in water
samples. The primary chemicals of concern were degradates of alachlor, metolochlor,
atrazine, and acetochlor. These chemicals do not have established drinking water
criteria, so we cannot estimate potential health effects for humans. Prometon was
detected on nine occasions, primarily in areas where this chemical was likely to be
applied for weed control in road right-of-ways.
Domestic wells, in general, appeared protected from contamination at
concentrations exceeding drinking water criteria. Only one well had nitrate
concentrations exceeding the drinking water criteria. VOCs were detected on 8
occasions in domestic wells, but never at concentrations exceeding drinking water
criteria. Nine of 20 domestic wells had a detectable concentration of a herbicide
degradate. Concentrations were lower than concentrations detected in monitoring wells.
With just four years of data, it is difficult to evaluate trends in chemical
concentrations. Seven wells showed decreasing trends in nitrate concentration, compared
to 4 wells with an increasing trend and 33 wells with no trend. Increasing trends in
chloride concentration were observed in five wells, with a decreasing trend in one well
and no trend in 38 wells. No trends were observed in concentrations of VOCs or
herbicides.
The future of the land use study is uncertain. Many of the original objectives,
such as predictive modeling for different land use scenarios, expansion of the transitional
well network, and sampling for new chemicals, are unlikely to be accomplished. If
monitoring continues, it will include annual sampling in spring (following recharge) for
the major ions, some trace elements, VOCs, and some general chemicals.
Effects of Land Use on Ground Water Quality, 1999 Annual Report; Minnesota Pollution Control Agency
Ground Water Monitoring and Assessment Program 7
The Minnesota Pollution Control Agency (MPCA) Ground Water Monitoring and
Assessment Program (GWMAP) began a study in 1996 to determine the effects of land
use on ground water quality. The study area is located on the Anoka Sand Plain, near St.
Cloud. The objectives of the study were to:
1. determine if water quality differs beneath different land uses;
2. evaluate overall water quality and risk to ground water receptors in a variable
and changing land use setting;
3. evaluate seasonal and annual variability in water quality beneath several land
uses; and
4. determine trends in water quality in areas where land use changes.
Information gained from this study may help predict and manage land use impacts on
ground water quality in similar hydrologic settings. Results for 1997, 1998, and 1999 are
found in MPCA (1998a), MPCA (1999), and MPCA (2000).
This report summarizes results of field activities for the first four years of this
study (1997 through 2000). MPCA (2001) presents a detailed discussion of results,
methods, materials, data analysis methods, and quality assurance analysis, as well as a
detailed description of the study area.
1. Materials and Methods
Specific details for establishment of the monitoring network are described in
MPCA (1998a). Field sampling protocol used by GWMAP are described in MPCA
(1996). Data analysis protocol utilized by GWMAP are described in MPCA (1998b).
This section describes the monitoring network, sample design, sample collection, and
data analysis.
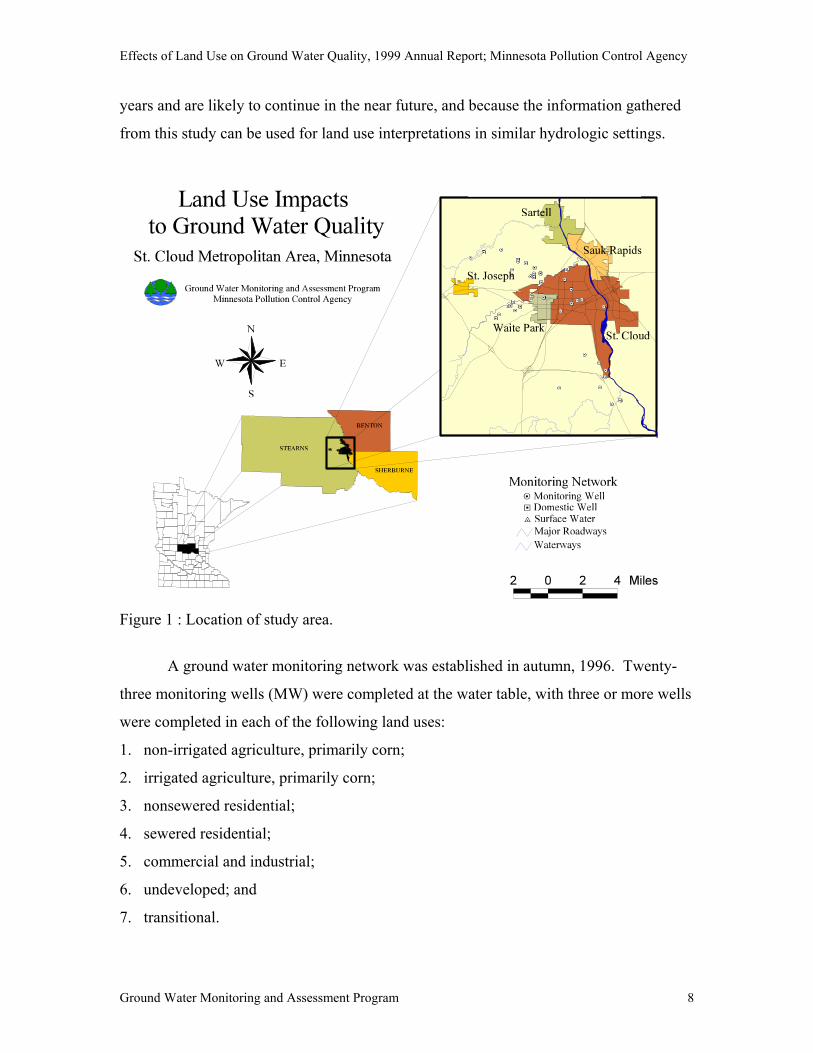
The study area, illustrated in Figure 1, is located near St. Cloud, Minnesota, and
lies on the west side of the Mississippi River. The St. Cloud area has a population of
approximately 100000 and is undergoing rapid urbanization. St. Cloud is located in
southeastern Stearns County. The study area, which encompasses approximately 30
square miles, was chosen because the area has shallow sand aquifers that are sensitive to
contamination, a large quantity of data has been gathered for this area, a variety of land
uses exist near St. Cloud, significant land use changes have occurred over the past several
Effects of Land Use on Ground Water Quality, 1999 Annual Report; Minnesota Pollution Control Agency
Ground Water Monitoring and Assessment Program 8
years and are likely to continue in the near future, and because the information gathered
from this study can be used for land use interpretations in similar hydrologic settings.
Figure 1 : Location of study area.
A ground water monitoring network was established in autumn, 1996. Twenty-
three monitoring wells (MW) were completed at the water table, with three or more wells
were completed in each of the following land uses:
1. non-irrigated agriculture, primarily corn;
2. irrigated agriculture, primarily corn;
3. nonsewered residential;
4. sewered residential;
5. commercial and industrial;
6. undeveloped; and
7. transitional.
Effects of Land Use on Ground Water Quality, 1999 Annual Report; Minnesota Pollution Control Agency
Ground Water Monitoring and Assessment Program 9
At the time of drilling, land use was uniform 500 or more feet in the assumed up-gradient
flow direction. Monitoring wells completed in transitional land uses were areas where
land use changed between 1996 and 2000.
The initial monitoring network included 21 domestic wells completed deeper in
the aquifer or in the buried aquifer. Five of these wells were considered shallow water-
table wells less than fifty feet deep. Three of these five wells comprise well nests with a
monitoring well. Seven of the 21 deeper wells were water table wells which are greater
than 50 feet deep. The remaining nine wells were completed in the buried, confined
portion of the aquifer. Two surface water-sampling points were located on the Sauk
River. One of these was at the up-gradient edge of the monitoring network and the
second was located at a point where the Sauk River enters the Mississippi River. At the
end of the 2000 sampling year, 17 domestic wells remained in the network.
Continuous water level recorders were installed in four of the monitoring wells
screened at the water table. Recorders were operated between 1997 and 1999. One
United States Geological Survey (USGS) continuous recording station is maintained on
the Sauk River. Two additional gauging stations are maintained within the study area on
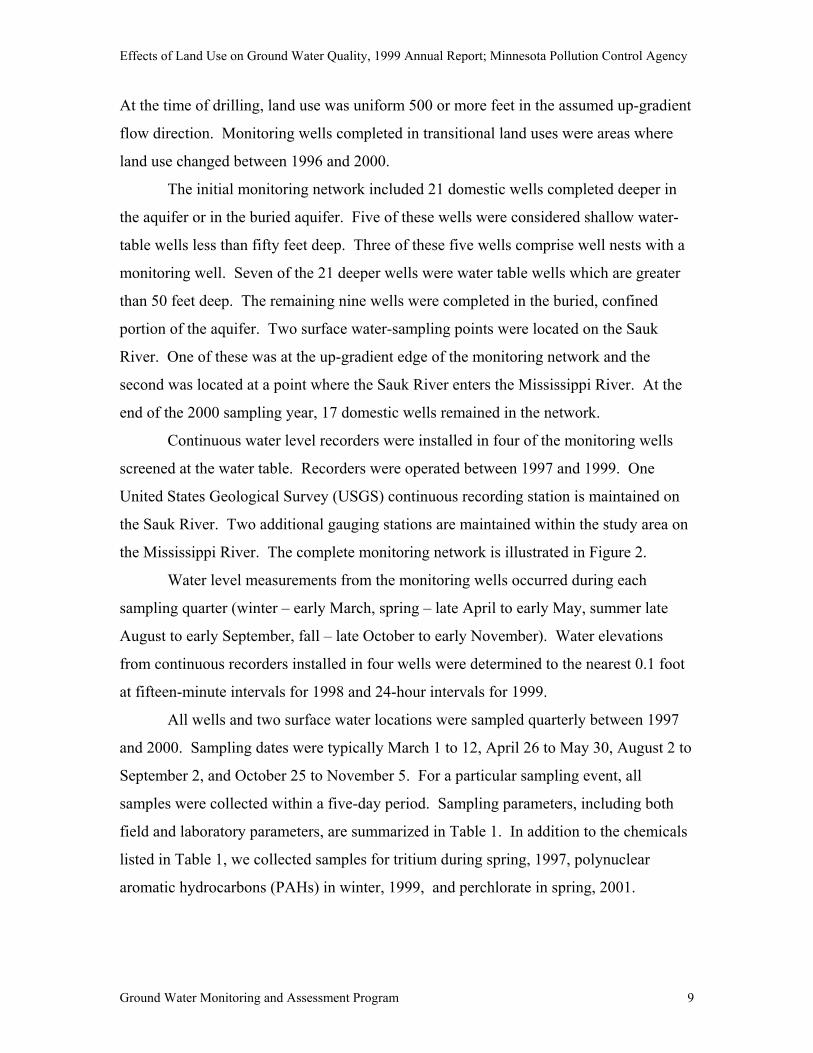
the Mississippi River. The complete monitoring network is illustrated in Figure 2.
Water level measurements from the monitoring wells occurred during each
sampling quarter (winter – early March, spring – late April to early May, summer late
August to early September, fall – late October to early November). Water elevations
from continuous recorders installed in four wells were determined to the nearest 0.1 foot
at fifteen-minute intervals for 1998 and 24-hour intervals for 1999.
All wells and two surface water locations were sampled quarterly between 1997
and 2000. Sampling dates were typically March 1 to 12, April 26 to May 30, August 2 to
September 2, and October 25 to November 5. For a particular sampling event, all
samples were collected within a five-day period. Sampling parameters, including both
field and laboratory parameters, are summarized in Table 1. In addition to the chemicals
listed in Table 1, we collected samples for tritium during spring, 1997, polynuclear
aromatic hydrocarbons (PAHs) in winter, 1999, and perchlorate in spring, 2001.
Effects of Land Use on Ground Water Quality, 1999 Annual Report; Minnesota Pollution Control Agency
Ground Water Monitoring and Assessment Program 10
Figure 2 : Location of monitoring points, including wells, surface water sampling points, and continuous recorders.
Field
Effects of Land Use on Ground Water Quality, 1999 Annual Report; Minnesota Pollution Control Agency
Ground Water Monitoring and Assessment Program 11
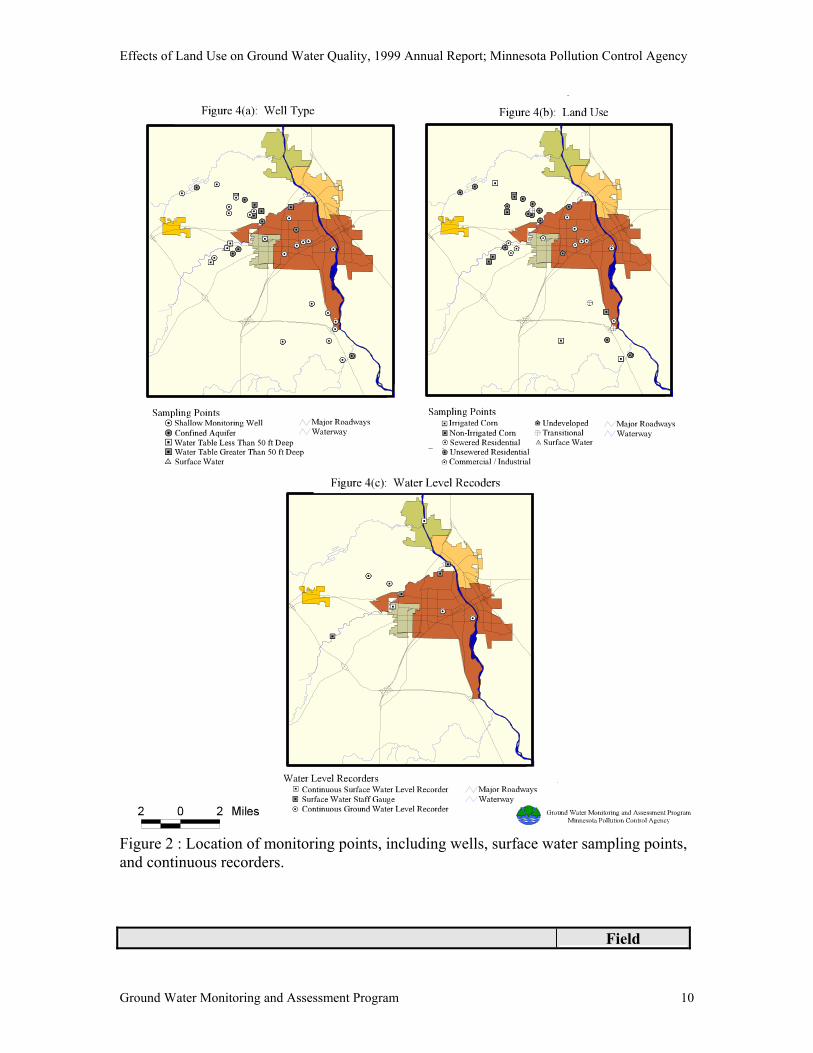
Laboratory Analysis Measurements NO3, total organic carbon, Br, F, Cl, SO4, Ca1, Mg, Na, K, Fe, Al, Mn, Si, Sr, Zn, Cu, Ni, Cd, Ba, Be, Cd, Co, Li, Rb, V, As, B, Pb, Ti, Mo, Ag, Crtotal, NH4, total Kjeldahl nitrogen, total phosphorus,
total sulfur, total suspended solids, total dissolved solids, alkalinity, conductivity, volatile organic compounds, and herbicides2
Dissolved oxygen, pH, oxidation-
reduction potential, alkalinity, electrical
conductivity 1 For monitoring wells, cation samples are filtered with a 0.45 um filter 2 Herbicides include atrazine, cyanazine, alachlor, acetochlor, metolochlor, and degradates for agricultural settings and Minnesota Department of Agriculture List 2 for urban settings Table 1 : Sampling parameters for the monitoring network.
We generated water table elevation maps for each sampling quarter using Surfer.
We calculated annual recharge (inches) for each monitoring well by subtracting the water
elevation measured in March from the post-recharge (after May 1) maximum water
elevation and multiplying by 0.25 (assumed to be the porosity of the aquifer material).
Procedures for conducting analysis of water quality data are described in MPCA (1998b).
We used the Kruskal-Wallis test for conducting group tests and the Spearman rho method
for conducting correlation analysis.
2. Results and Discussion
2.1. Hydrology
Table 2 summarizes recharge from water level measurements in monitoring wells.
Recharge was very small in 1999 and 2000. The mean recharge of 3.42 inches over the
four sampling years is less than the long-term average of 5.61 inches calculated from
observation wells in Stearns County (DNR Observation Well Network). Recharge
appeared to be larger in agricultural and undeveloped areas compared to urban
landscapes.
Recharge was strongly correlated with total precipitation for the months of
December through March (R2 = 0.927). We observed that recharge in 1997 occurred in
summer only after significant precipitation lead to soil wetting. The same phenomenon
appears to apply to spring recharge. Snowmelt plays an important role in wetting the
soil. April and May precipitation then recharges ground water because the soil is
saturated.
Effects of Land Use on Ground Water Quality, 1999 Annual Report; Minnesota Pollution Control Agency
Ground Water Monitoring and Assessment Program 12
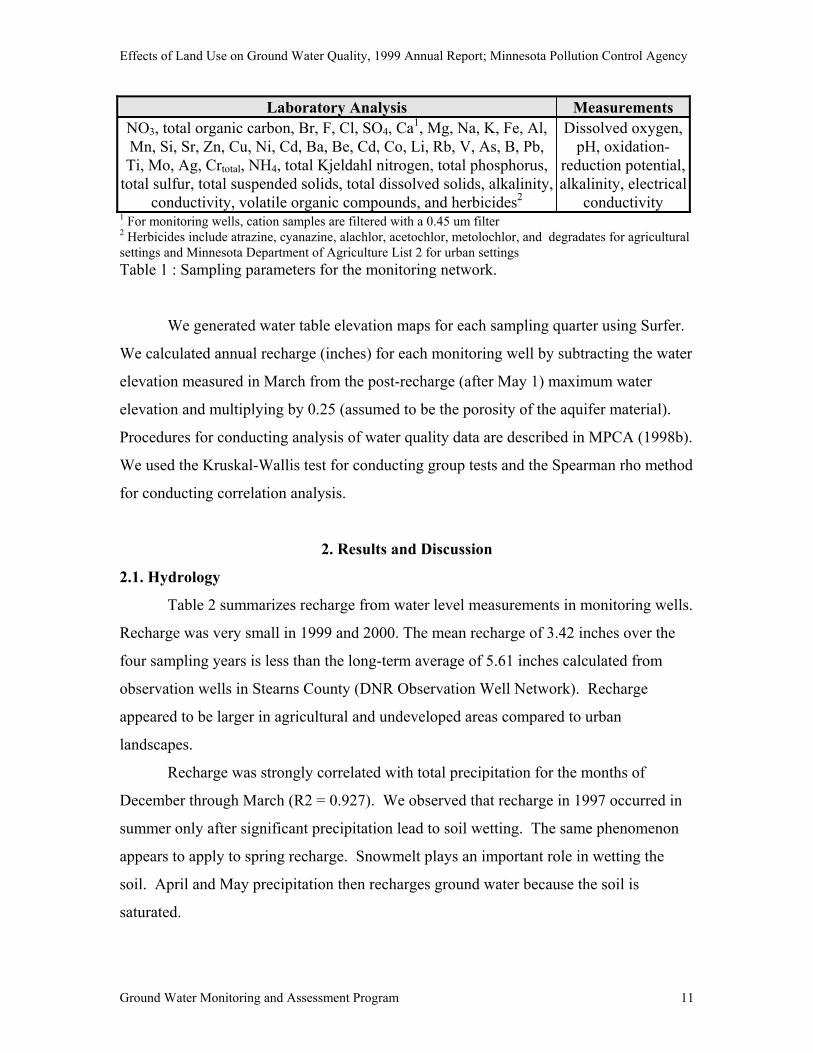
Land Use 1997 1998 1999 2000 Overall Nonirrigated 7.20 9.04 1.49 1.20 4.73
Irrigated 5.40 9.55 1.21 0.56 4.18 Sewered 2.50 10.43 0.54 0.75 3.56
Nonsewered 4.50 6.25 0.99 0.00 2.94 Commercial 4.20 9.80 1.20 1.40 4.15 Undeveloped 4.80 10.6 1.60 1.00 4.50 Transitional 3.30 7.20 0.00 2.68 3.30
Overall 3.99 7.86 0.88 0.95 3.42 Table 2: Mean recharge (inches) in monitoring wells, by land use.
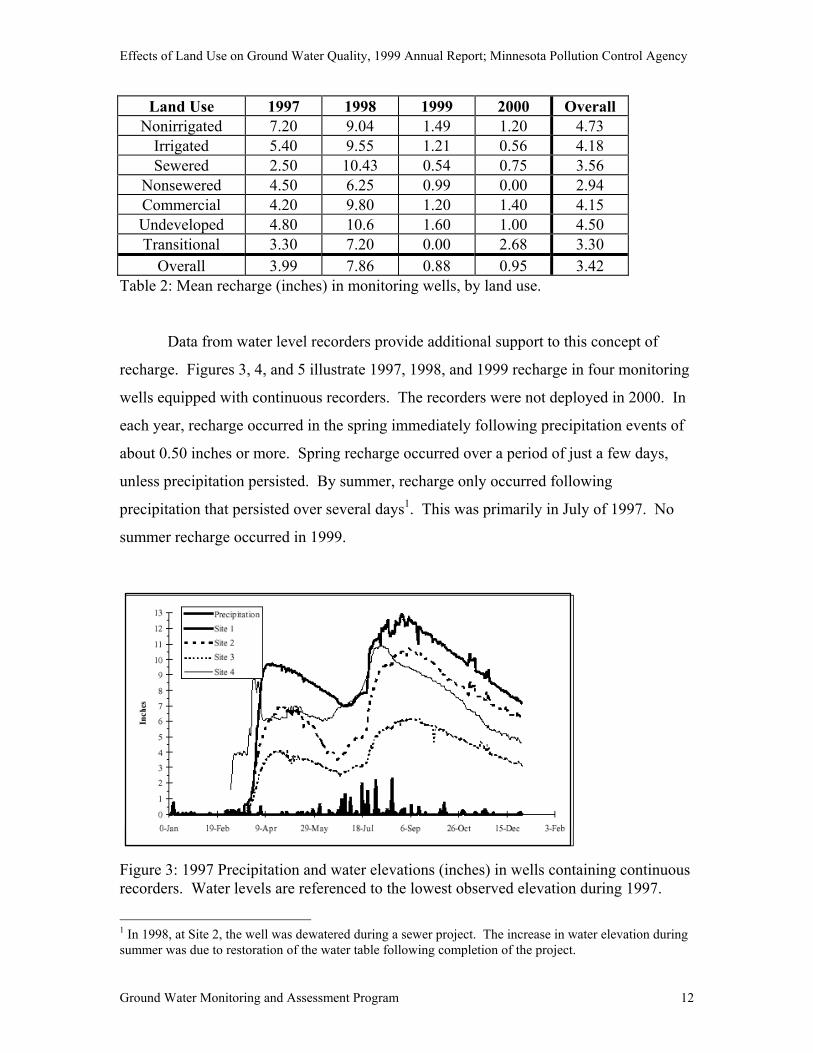
Data from water level recorders provide additional support to this concept of
recharge. Figures 3, 4, and 5 illustrate 1997, 1998, and 1999 recharge in four monitoring
wells equipped with continuous recorders. The recorders were not deployed in 2000. In
each year, recharge occurred in the spring immediately following precipitation events of
about 0.50 inches or more. Spring recharge occurred over a period of just a few days,
unless precipitation persisted. By summer, recharge only occurred following
precipitation that persisted over several days1. This was primarily in July of 1997. No
summer recharge occurred in 1999.
Figure 3: 1997 Precipitation and water elevations (inches) in wells containing continuous recorders. Water levels are referenced to the lowest observed elevation during 1997.
1 In 1998, at Site 2, the well was dewatered during a sewer project. The increase in water elevation during summer was due to restoration of the water table following completion of the project.
Effects of Land Use on Ground Water Quality, 1999 Annual Report; Minnesota Pollution Control Agency
Ground Water Monitoring and Assessment Program 13
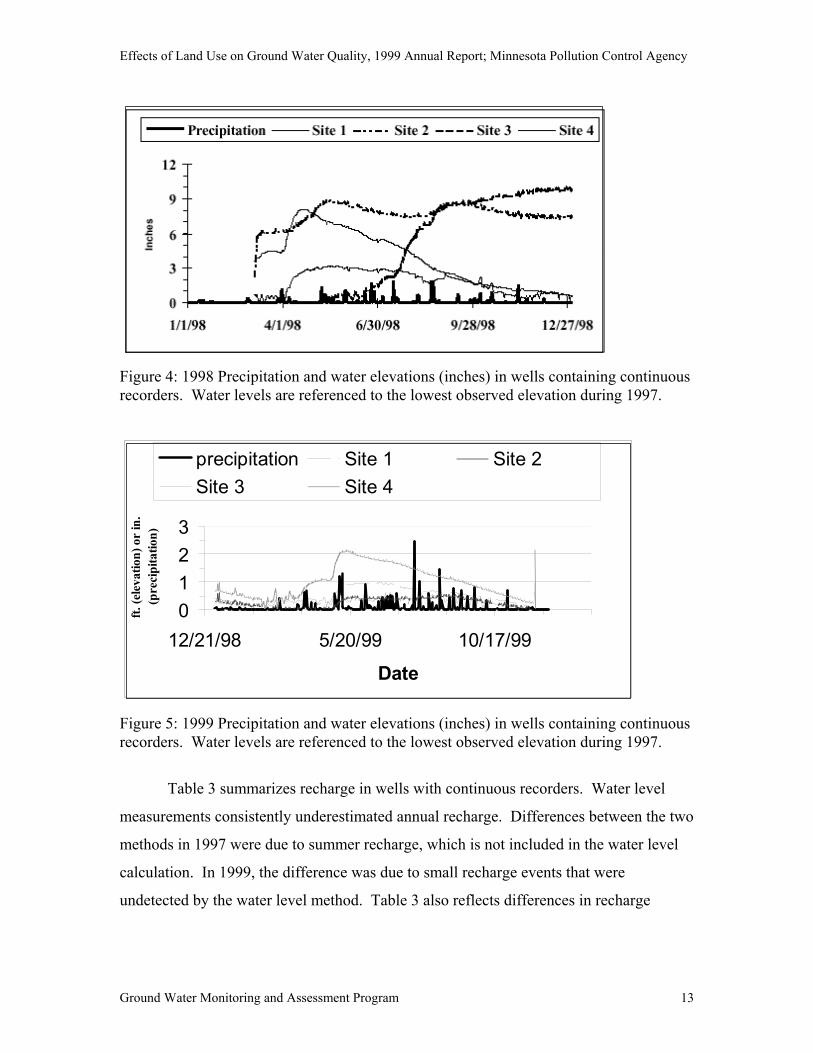
Figure 4: 1998 Precipitation and water elevations (inches) in wells containing continuous recorders. Water levels are referenced to the lowest observed elevation during 1997.
0123
12/21/98 5/20/99 10/17/99
Date
ft. (e
leva
tion)
or
in.
(pre
cipi
tatio
n)
precipitation Site 1 Site 2Site 3 Site 4
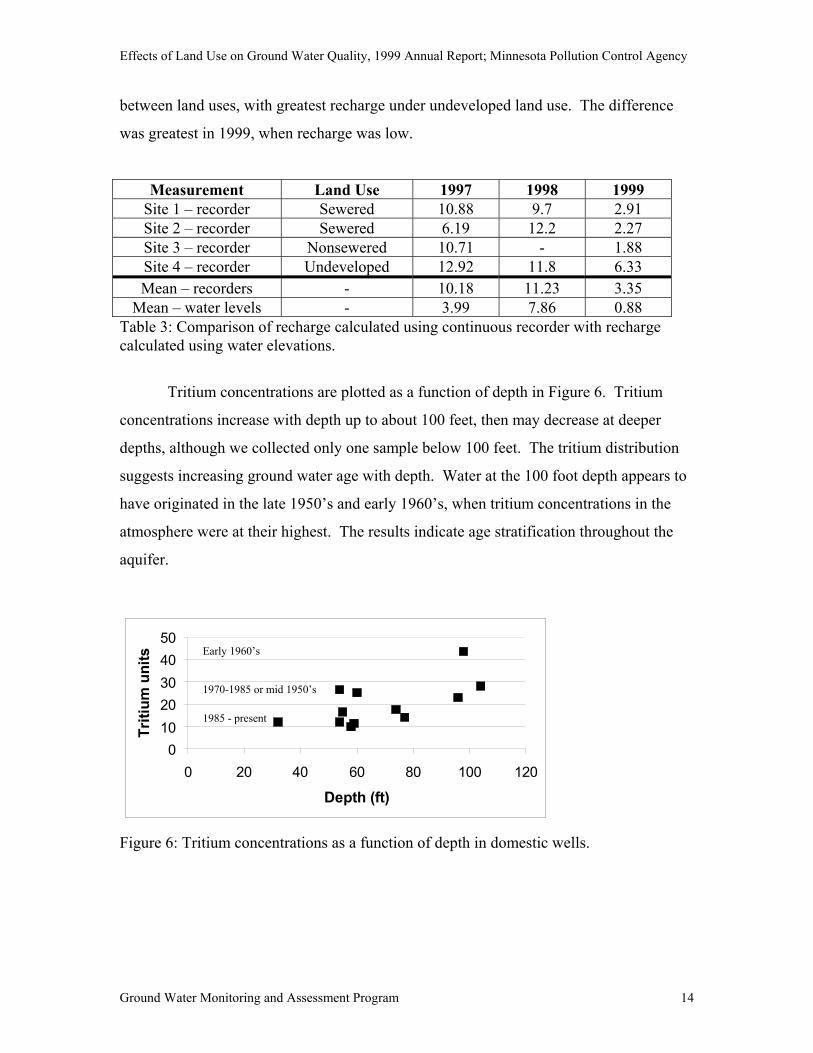
Figure 5: 1999 Precipitation and water elevations (inches) in wells containing continuous recorders. Water levels are referenced to the lowest observed elevation during 1997.
Table 3 summarizes recharge in wells with continuous recorders. Water level
measurements consistently underestimated annual recharge. Differences between the two
methods in 1997 were due to summer recharge, which is not included in the water level
calculation. In 1999, the difference was due to small recharge events that were
undetected by the water level method. Table 3 also reflects differences in recharge
Effects of Land Use on Ground Water Quality, 1999 Annual Report; Minnesota Pollution Control Agency
Ground Water Monitoring and Assessment Program 14
between land uses, with greatest recharge under undeveloped land use. The difference
was greatest in 1999, when recharge was low.
Measurement Land Use 1997 1998 1999 Site 1 – recorder Sewered 10.88 9.7 2.91 Site 2 – recorder Sewered 6.19 12.2 2.27 Site 3 – recorder Nonsewered 10.71 - 1.88 Site 4 – recorder Undeveloped 12.92 11.8 6.33 Mean – recorders - 10.18 11.23 3.35
Mean – water levels - 3.99 7.86 0.88 Table 3: Comparison of recharge calculated using continuous recorder with recharge calculated using water elevations.
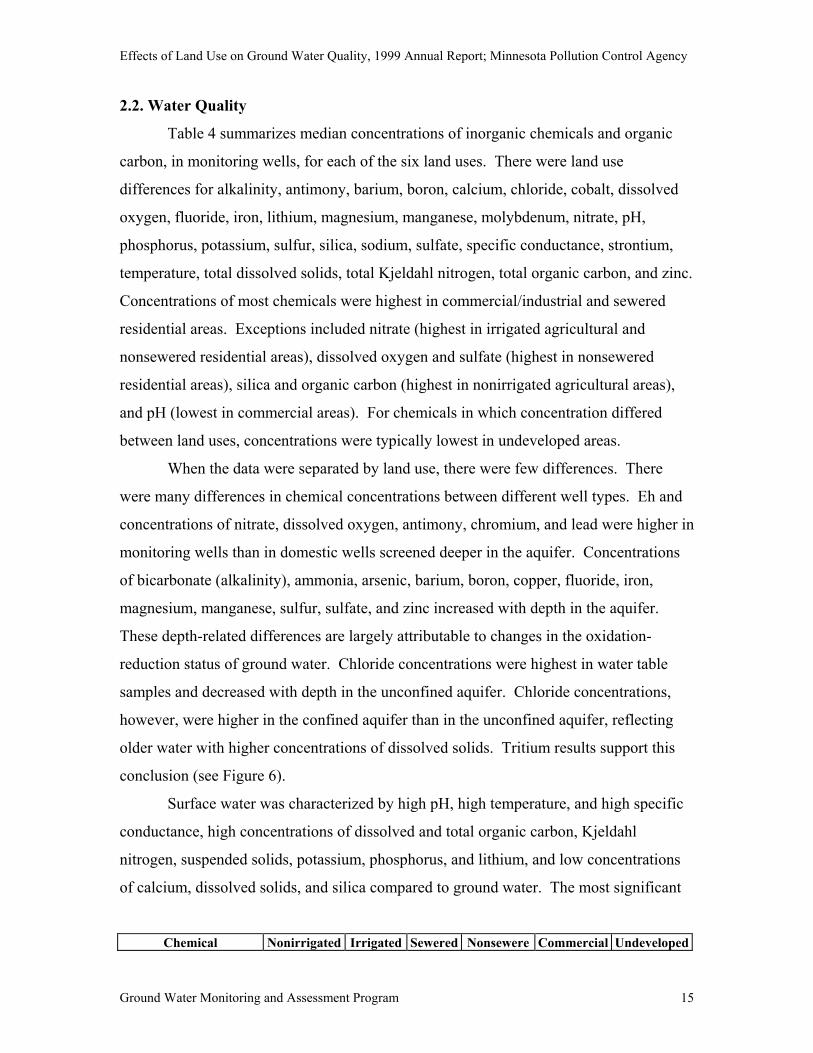
Tritium concentrations are plotted as a function of depth in Figure 6. Tritium
concentrations increase with depth up to about 100 feet, then may decrease at deeper
depths, although we collected only one sample below 100 feet. The tritium distribution
suggests increasing ground water age with depth. Water at the 100 foot depth appears to
have originated in the late 1950’s and early 1960’s, when tritium concentrations in the
atmosphere were at their highest. The results indicate age stratification throughout the
aquifer.
01020304050
0 20 40 60 80 100 120
Depth (ft)
Triti
um u
nits
1985 - present
1970-1985 or mid 1950’s
Early 1960’s
Figure 6: Tritium concentrations as a function of depth in domestic wells.
Effects of Land Use on Ground Water Quality, 1999 Annual Report; Minnesota Pollution Control Agency
Ground Water Monitoring and Assessment Program 15
2.2. Water Quality
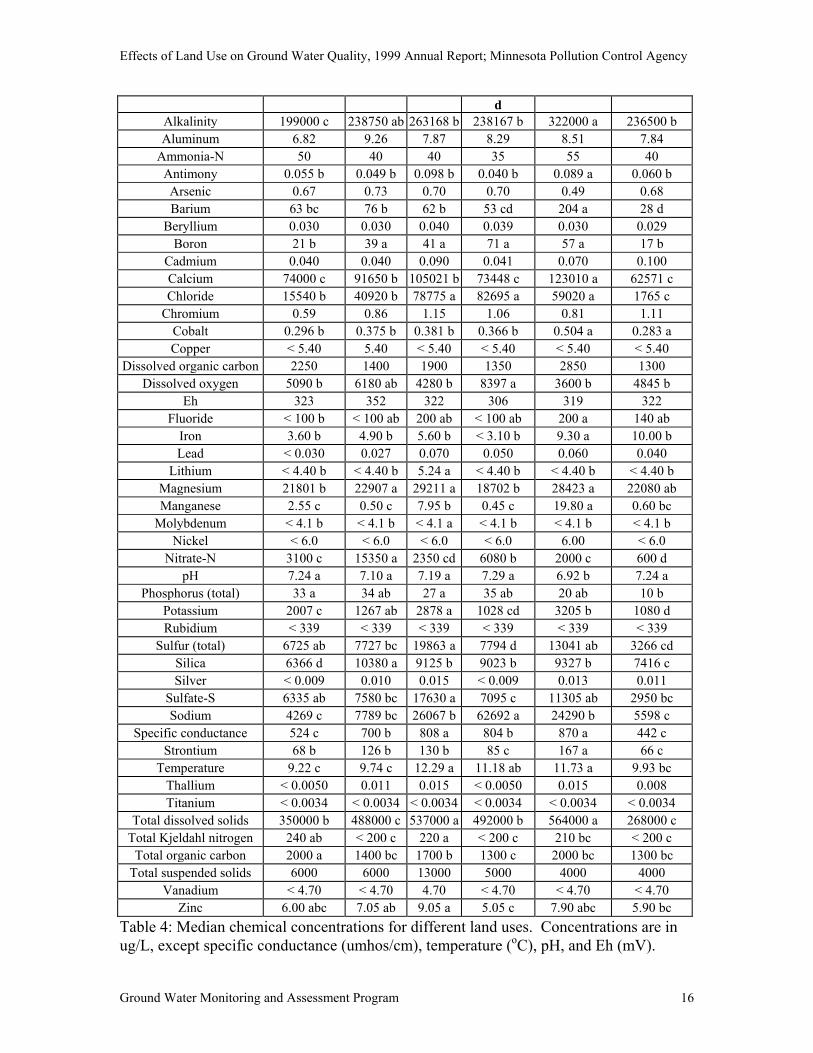
Table 4 summarizes median concentrations of inorganic chemicals and organic
carbon, in monitoring wells, for each of the six land uses. There were land use
differences for alkalinity, antimony, barium, boron, calcium, chloride, cobalt, dissolved
oxygen, fluoride, iron, lithium, magnesium, manganese, molybdenum, nitrate, pH,
phosphorus, potassium, sulfur, silica, sodium, sulfate, specific conductance, strontium,
temperature, total dissolved solids, total Kjeldahl nitrogen, total organic carbon, and zinc.
Concentrations of most chemicals were highest in commercial/industrial and sewered
residential areas. Exceptions included nitrate (highest in irrigated agricultural and
nonsewered residential areas), dissolved oxygen and sulfate (highest in nonsewered
residential areas), silica and organic carbon (highest in nonirrigated agricultural areas),
and pH (lowest in commercial areas). For chemicals in which concentration differed
between land uses, concentrations were typically lowest in undeveloped areas.
When the data were separated by land use, there were few differences. There
were many differences in chemical concentrations between different well types. Eh and
concentrations of nitrate, dissolved oxygen, antimony, chromium, and lead were higher in
monitoring wells than in domestic wells screened deeper in the aquifer. Concentrations
of bicarbonate (alkalinity), ammonia, arsenic, barium, boron, copper, fluoride, iron,
magnesium, manganese, sulfur, sulfate, and zinc increased with depth in the aquifer.
These depth-related differences are largely attributable to changes in the oxidation-
reduction status of ground water. Chloride concentrations were highest in water table
samples and decreased with depth in the unconfined aquifer. Chloride concentrations,
however, were higher in the confined aquifer than in the unconfined aquifer, reflecting
older water with higher concentrations of dissolved solids. Tritium results support this
conclusion (see Figure 6).
Surface water was characterized by high pH, high temperature, and high specific
conductance, high concentrations of dissolved and total organic carbon, Kjeldahl
nitrogen, suspended solids, potassium, phosphorus, and lithium, and low concentrations
of calcium, dissolved solids, and silica compared to ground water. The most significant
Chemical Nonirrigated Irrigated Sewered Nonsewere Commercial Undeveloped
Effects of Land Use on Ground Water Quality, 1999 Annual Report; Minnesota Pollution Control Agency
Ground Water Monitoring and Assessment Program 16
d Alkalinity 199000 c 238750 ab 263168 b 238167 b 322000 a 236500 b Aluminum 6.82 9.26 7.87 8.29 8.51 7.84
Ammonia-N 50 40 40 35 55 40 Antimony 0.055 b 0.049 b 0.098 b 0.040 b 0.089 a 0.060 b Arsenic 0.67 0.73 0.70 0.70 0.49 0.68 Barium 63 bc 76 b 62 b 53 cd 204 a 28 d
Beryllium 0.030 0.030 0.040 0.039 0.030 0.029 Boron 21 b 39 a 41 a 71 a 57 a 17 b
Cadmium 0.040 0.040 0.090 0.041 0.070 0.100 Calcium 74000 c 91650 b 105021 b 73448 c 123010 a 62571 c Chloride 15540 b 40920 b 78775 a 82695 a 59020 a 1765 c
Chromium 0.59 0.86 1.15 1.06 0.81 1.11 Cobalt 0.296 b 0.375 b 0.381 b 0.366 b 0.504 a 0.283 a Copper < 5.40 5.40 < 5.40 < 5.40 < 5.40 < 5.40
Dissolved organic carbon 2250 1400 1900 1350 2850 1300 Dissolved oxygen 5090 b 6180 ab 4280 b 8397 a 3600 b 4845 b
Eh 323 352 322 306 319 322 Fluoride < 100 b < 100 ab 200 ab < 100 ab 200 a 140 ab
Iron 3.60 b 4.90 b 5.60 b < 3.10 b 9.30 a 10.00 b Lead < 0.030 0.027 0.070 0.050 0.060 0.040
Lithium < 4.40 b < 4.40 b 5.24 a < 4.40 b < 4.40 b < 4.40 b Magnesium 21801 b 22907 a 29211 a 18702 b 28423 a 22080 ab Manganese 2.55 c 0.50 c 7.95 b 0.45 c 19.80 a 0.60 bc
Molybdenum < 4.1 b < 4.1 b < 4.1 a < 4.1 b < 4.1 b < 4.1 b Nickel < 6.0 < 6.0 < 6.0 < 6.0 6.00 < 6.0
Nitrate-N 3100 c 15350 a 2350 cd 6080 b 2000 c 600 d pH 7.24 a 7.10 a 7.19 a 7.29 a 6.92 b 7.24 a
Phosphorus (total) 33 a 34 ab 27 a 35 ab 20 ab 10 b Potassium 2007 c 1267 ab 2878 a 1028 cd 3205 b 1080 d Rubidium < 339 < 339 < 339 < 339 < 339 < 339
Sulfur (total) 6725 ab 7727 bc 19863 a 7794 d 13041 ab 3266 cd Silica 6366 d 10380 a 9125 b 9023 b 9327 b 7416 c Silver < 0.009 0.010 0.015 < 0.009 0.013 0.011
Sulfate-S 6335 ab 7580 bc 17630 a 7095 c 11305 ab 2950 bc Sodium 4269 c 7789 bc 26067 b 62692 a 24290 b 5598 c
Specific conductance 524 c 700 b 808 a 804 b 870 a 442 c Strontium 68 b 126 b 130 b 85 c 167 a 66 c
Temperature 9.22 c 9.74 c 12.29 a 11.18 ab 11.73 a 9.93 bc Thallium < 0.0050 0.011 0.015 < 0.0050 0.015 0.008 Titanium < 0.0034 < 0.0034 < 0.0034 < 0.0034 < 0.0034 < 0.0034
Total dissolved solids 350000 b 488000 c 537000 a 492000 b 564000 a 268000 c Total Kjeldahl nitrogen 240 ab < 200 c 220 a < 200 c 210 bc < 200 c
Total organic carbon 2000 a 1400 bc 1700 b 1300 c 2000 bc 1300 bc Total suspended solids 6000 6000 13000 5000 4000 4000
Vanadium < 4.70 < 4.70 4.70 < 4.70 < 4.70 < 4.70 Zinc 6.00 abc 7.05 ab 9.05 a 5.05 c 7.90 abc 5.90 bc
Table 4: Median chemical concentrations for different land uses. Concentrations are in ug/L, except specific conductance (umhos/cm), temperature (oC), pH, and Eh (mV).
Effects of Land Use on Ground Water Quality, 1999 Annual Report; Minnesota Pollution Control Agency
Ground Water Monitoring and Assessment Program 17
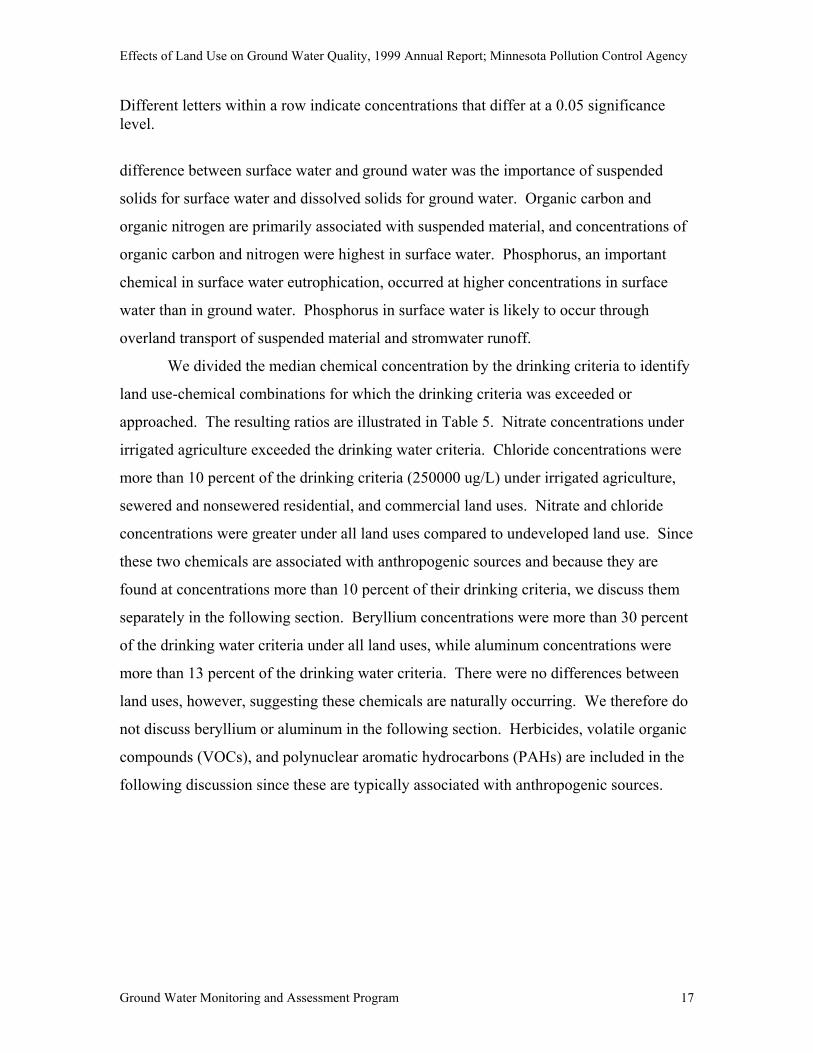
Different letters within a row indicate concentrations that differ at a 0.05 significance level.
difference between surface water and ground water was the importance of suspended
solids for surface water and dissolved solids for ground water. Organic carbon and
organic nitrogen are primarily associated with suspended material, and concentrations of
organic carbon and nitrogen were highest in surface water. Phosphorus, an important
chemical in surface water eutrophication, occurred at higher concentrations in surface
water than in ground water. Phosphorus in surface water is likely to occur through
overland transport of suspended material and stromwater runoff.
We divided the median chemical concentration by the drinking criteria to identify
land use-chemical combinations for which the drinking criteria was exceeded or
approached. The resulting ratios are illustrated in Table 5. Nitrate concentrations under
irrigated agriculture exceeded the drinking water criteria. Chloride concentrations were
more than 10 percent of the drinking criteria (250000 ug/L) under irrigated agriculture,
sewered and nonsewered residential, and commercial land uses. Nitrate and chloride
concentrations were greater under all land uses compared to undeveloped land use. Since
these two chemicals are associated with anthropogenic sources and because they are
found at concentrations more than 10 percent of their drinking criteria, we discuss them
separately in the following section. Beryllium concentrations were more than 30 percent
of the drinking water criteria under all land uses, while aluminum concentrations were
more than 13 percent of the drinking water criteria. There were no differences between
land uses, however, suggesting these chemicals are naturally occurring. We therefore do
not discuss beryllium or aluminum in the following section. Herbicides, volatile organic
compounds (VOCs), and polynuclear aromatic hydrocarbons (PAHs) are included in the
following discussion since these are typically associated with anthropogenic sources.
Effects of Land Use on Ground Water Quality, 1999 Annual Report; Minnesota Pollution Control Agency
Ground Water Monitoring and Assessment Program 18
Chemical Criteria Nonirrigated Irrigated Sewered Nonsewered Commercial Undeveloped Aluminum 50 0.136 0.185 0.157 0.166 0.170 0.157 Antimony 6 0.009 0.008 0.016 0.007 0.015 0.010 Arsenic 10 0.067 0.073 0.070 0.070 0.049 0.068 Barium 2000 0.031 0.038 0.031 0.026 0.102 0.014
Beryllium 0.08 0.375 0.375 0.500 0.489 0.375 0.363 Boron 600 0.036 0.065 0.069 0.119 0.095 0.028
Cadmium 4 0.010 0.010 0.023 0.010 0.018 0.025 Chloride 250000 0.062 0.164 0.315 0.331 0.236 0.007
Chromium 100 0.006 0.009 0.012 0.011 0.008 0.011 Cobalt 30 0.010 0.013 0.013 0.012 0.017 0.009 Copper 1000 < 0.054 0.005 < 0.054 < 0.054 < 0.054 < 0.054 Fluoride 4000 < 0.05 < 0.05 0.050 < 0.05 0.050 0.035
Iron 300 0.012 0.016 0.019 < 0.010 0.031 0.033 Lead 15 < 0.002 0.002 0.005 0.003 0.004 0.003
Manganese 1000 0.003 0.001 0.008 0.000 0.020 0.001 Molybdenum 30 < 0.137 < 0.137 < 0.137 < 0.137 < 0.137 < 0.137
Nickel 100 < 0.06 < 0.06 < 0.06 < 0.06 0.060 < 0.06 Nitrate-N 10000 0.310 1.535 0.235 0.608 0.200 0.060
Silver 30 < 0.0003 0.000 0.001 < 0.0003 0.000 0.000 Sodium 250000 0.017 0.031 0.104 0.251 0.097 0.022
Strontium 4000 0.017 0.031 0.033 0.021 0.042 0.017 Sulfate-S 500000 0.013 0.015 0.035 0.014 0.023 0.006 Thallium 0.6 < 0.0083 0.018 0.024 < 0.0083 0.025 0.013
Vanadium 50 < 0.094 < 0.094 0.094 < 0.094 < 0.094 < 0.094 Zinc 20000 0.0003 0.0004 0.0005 0.0003 0.0004 0.0003
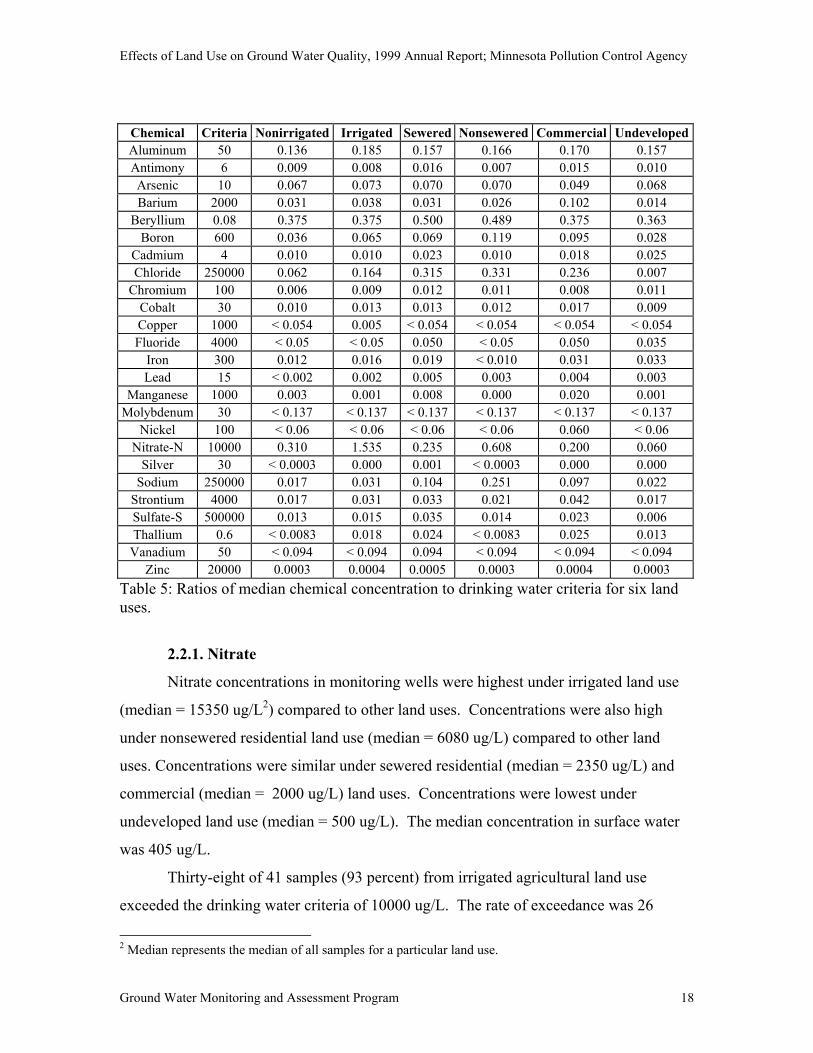
Table 5: Ratios of median chemical concentration to drinking water criteria for six land uses.
2.2.1. Nitrate
Nitrate concentrations in monitoring wells were highest under irrigated land use
(median = 15350 ug/L2) compared to other land uses. Concentrations were also high
under nonsewered residential land use (median = 6080 ug/L) compared to other land
uses. Concentrations were similar under sewered residential (median = 2350 ug/L) and
commercial (median = 2000 ug/L) land uses. Concentrations were lowest under
undeveloped land use (median = 500 ug/L). The median concentration in surface water
was 405 ug/L.
Thirty-eight of 41 samples (93 percent) from irrigated agricultural land use
exceeded the drinking water criteria of 10000 ug/L. The rate of exceedance was 26
2 Median represents the median of all samples for a particular land use.
Effects of Land Use on Ground Water Quality, 1999 Annual Report; Minnesota Pollution Control Agency
Ground Water Monitoring and Assessment Program 19
percent for nonirrigated agriculture, 24 percent for nonsewered residential, 13 percent for
transitional, 5 percent for commercial, 0 percent for sewered residential and undeveloped
land uses, and 0 percent for surface water.
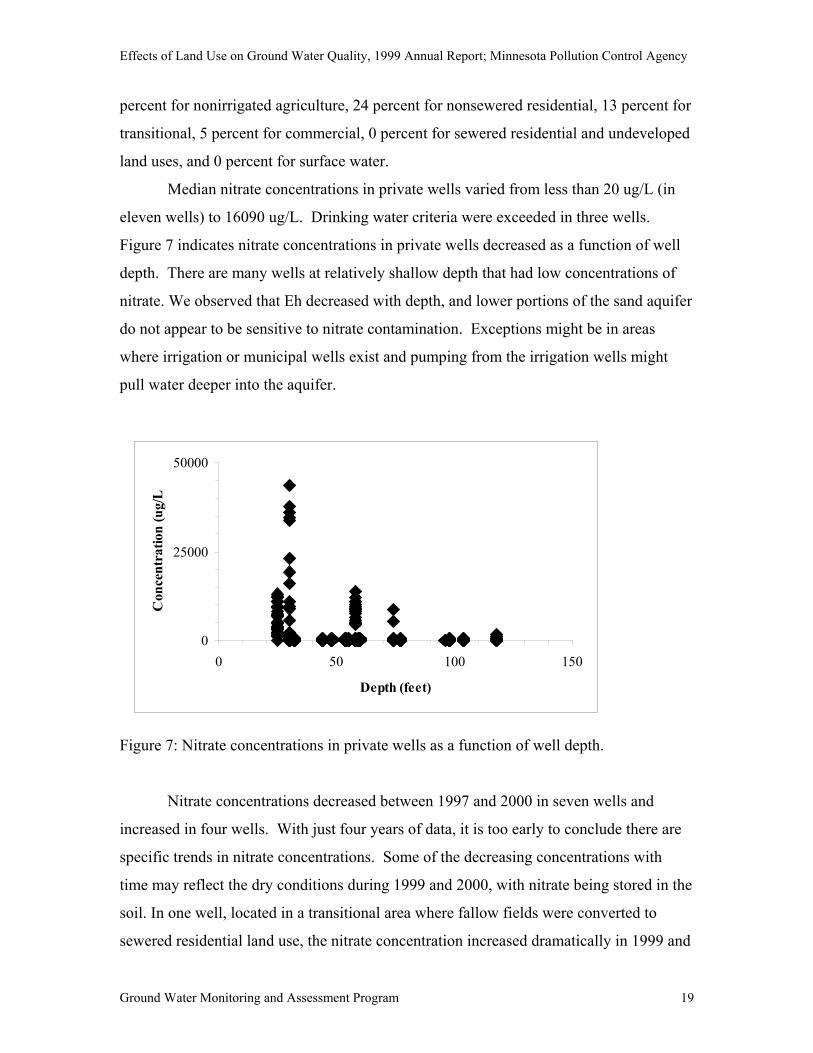
Median nitrate concentrations in private wells varied from less than 20 ug/L (in
eleven wells) to 16090 ug/L. Drinking water criteria were exceeded in three wells.
Figure 7 indicates nitrate concentrations in private wells decreased as a function of well
depth. There are many wells at relatively shallow depth that had low concentrations of
nitrate. We observed that Eh decreased with depth, and lower portions of the sand aquifer
do not appear to be sensitive to nitrate contamination. Exceptions might be in areas
where irrigation or municipal wells exist and pumping from the irrigation wells might
pull water deeper into the aquifer.
0
25000
50000
0 50 100 150
Depth (feet)
Con
cent
ratio
n (u
g/L
)
Figure 7: Nitrate concentrations in private wells as a function of well depth.
Nitrate concentrations decreased between 1997 and 2000 in seven wells and
increased in four wells. With just four years of data, it is too early to conclude there are
specific trends in nitrate concentrations. Some of the decreasing concentrations with
time may reflect the dry conditions during 1999 and 2000, with nitrate being stored in the
soil. In one well, located in a transitional area where fallow fields were converted to
sewered residential land use, the nitrate concentration increased dramatically in 1999 and
Effects of Land Use on Ground Water Quality, 1999 Annual Report; Minnesota Pollution Control Agency
Ground Water Monitoring and Assessment Program 20
2000. The positive correlation may represent release of nitrogen stored in soil or leaching
of nitrate from fertilizer application to lawns that are not yet well established.
2.2.2. Chloride
Chloride does not have a health-based drinking water standard. The Maximum
Contaminant Level (MCL) of 250000 ug/L is based on poor taste chloride imparts to
water. Chloride is not affected by adsorption or degradation processes and is therefore a
conservative chemical in soil and ground water. Chloride is also associated with several
anthropogenic sources, including road salt, animal and human waste, fertilizers, and
industrial products. Chloride is therefore a good indicator of human impacts in the
environment.
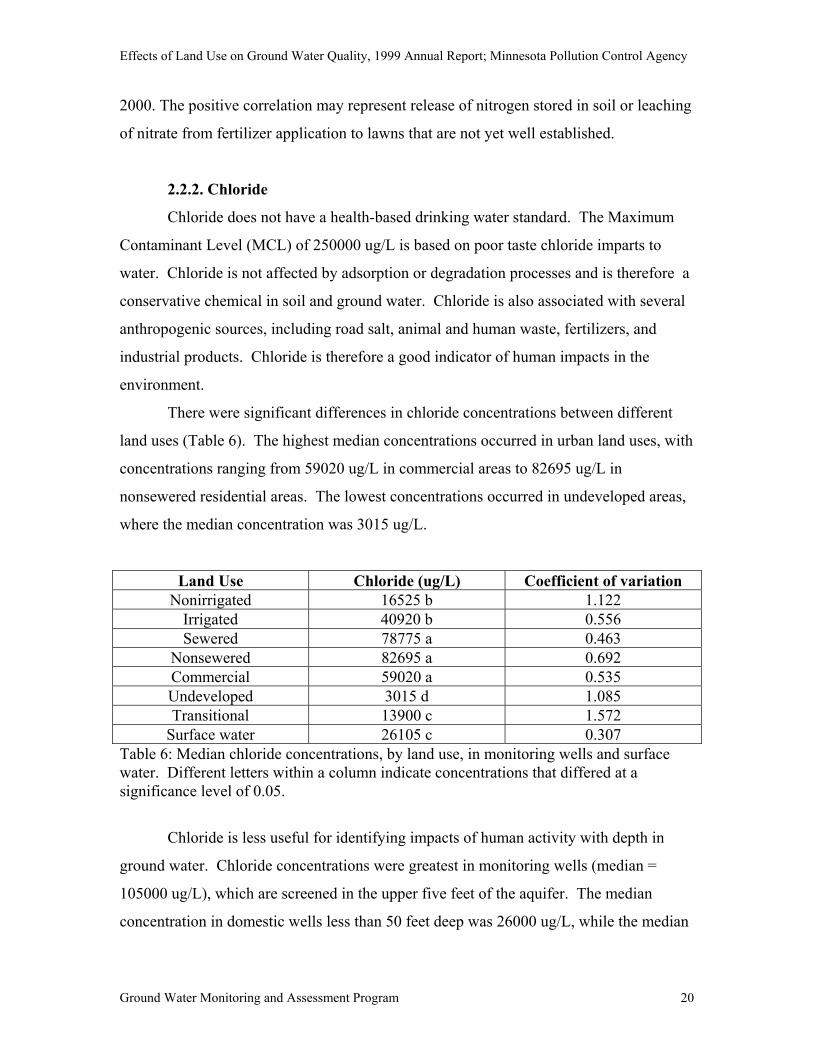
There were significant differences in chloride concentrations between different
land uses (Table 6). The highest median concentrations occurred in urban land uses, with
concentrations ranging from 59020 ug/L in commercial areas to 82695 ug/L in
nonsewered residential areas. The lowest concentrations occurred in undeveloped areas,
where the median concentration was 3015 ug/L.
Land Use Chloride (ug/L) Coefficient of variation Nonirrigated 16525 b 1.122
Irrigated 40920 b 0.556 Sewered 78775 a 0.463
Nonsewered 82695 a 0.692 Commercial 59020 a 0.535 Undeveloped 3015 d 1.085 Transitional 13900 c 1.572
Surface water 26105 c 0.307 Table 6: Median chloride concentrations, by land use, in monitoring wells and surface water. Different letters within a column indicate concentrations that differed at a significance level of 0.05.
Chloride is less useful for identifying impacts of human activity with depth in
ground water. Chloride concentrations were greatest in monitoring wells (median =
105000 ug/L), which are screened in the upper five feet of the aquifer. The median
concentration in domestic wells less than 50 feet deep was 26000 ug/L, while the median
Effects of Land Use on Ground Water Quality, 1999 Annual Report; Minnesota Pollution Control Agency
Ground Water Monitoring and Assessment Program 21
concentration in deeper domestic wells completed in confined aquifers was 40000 ug/L.
Thus, chloride concentrations begin to increase at some depth due to dissolution reactions
within the aquifer.
2.2.3. Volatile Organic Compounds
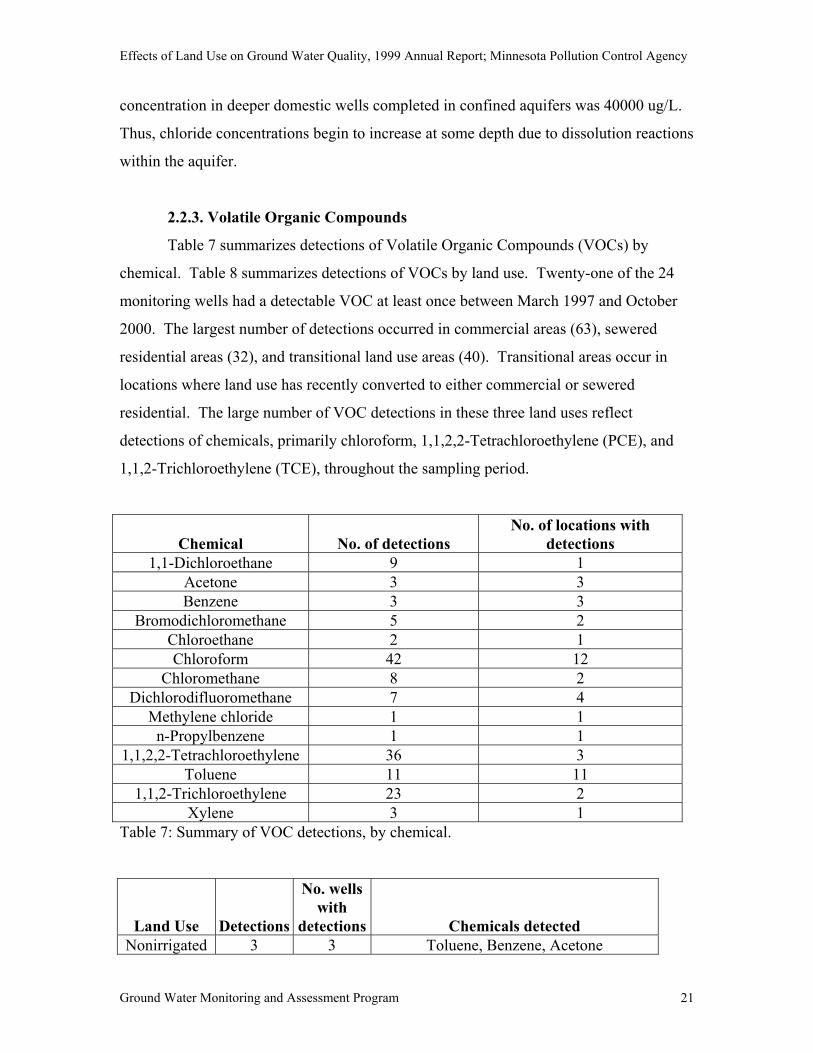
Table 7 summarizes detections of Volatile Organic Compounds (VOCs) by
chemical. Table 8 summarizes detections of VOCs by land use. Twenty-one of the 24
monitoring wells had a detectable VOC at least once between March 1997 and October
2000. The largest number of detections occurred in commercial areas (63), sewered
residential areas (32), and transitional land use areas (40). Transitional areas occur in
locations where land use has recently converted to either commercial or sewered
residential. The large number of VOC detections in these three land uses reflect
detections of chemicals, primarily chloroform, 1,1,2,2-Tetrachloroethylene (PCE), and
1,1,2-Trichloroethylene (TCE), throughout the sampling period.
Chemical No. of detections No. of locations with
detections 1,1-Dichloroethane 9 1
Acetone 3 3 Benzene 3 3
Bromodichloromethane 5 2 Chloroethane 2 1 Chloroform 42 12
Chloromethane 8 2 Dichlorodifluoromethane 7 4
Methylene chloride 1 1 n-Propylbenzene 1 1
1,1,2,2-Tetrachloroethylene 36 3 Toluene 11 11
1,1,2-Trichloroethylene 23 2 Xylene 3 1
Table 7: Summary of VOC detections, by chemical.
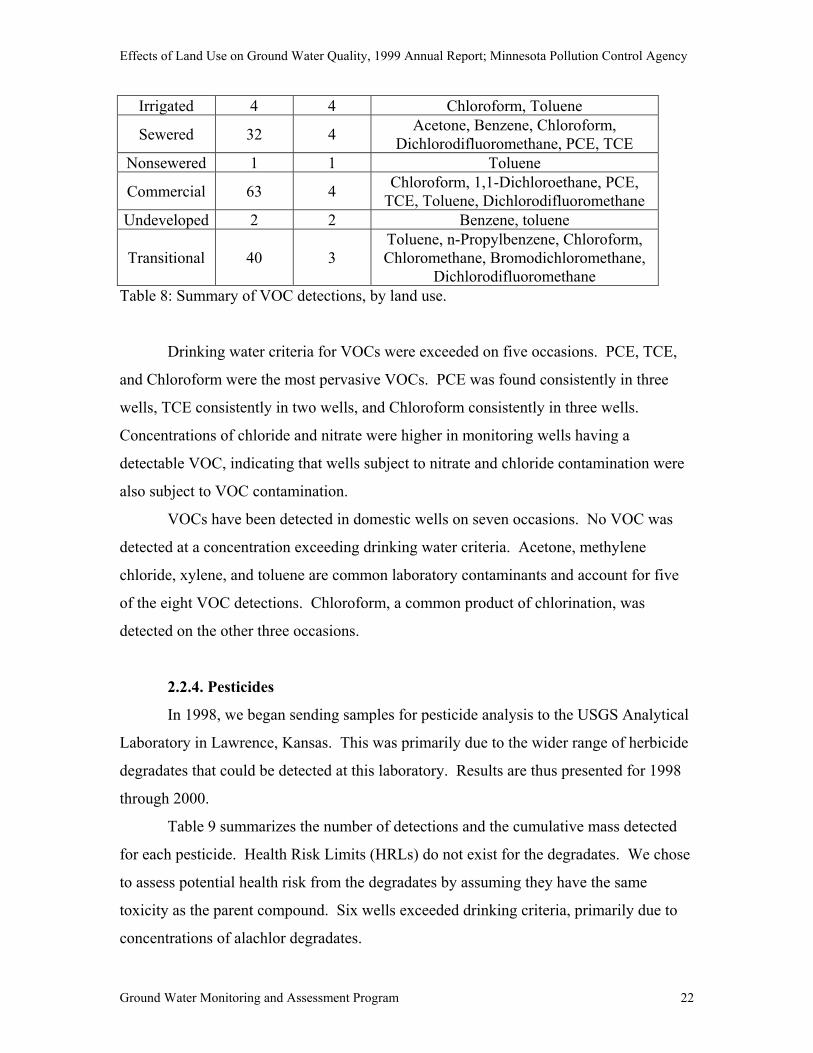
Land Use Detections
No. wells with
detections Chemicals detected Nonirrigated 3 3 Toluene, Benzene, Acetone
Effects of Land Use on Ground Water Quality, 1999 Annual Report; Minnesota Pollution Control Agency
Ground Water Monitoring and Assessment Program 22
Irrigated 4 4 Chloroform, Toluene
Sewered 32 4 Acetone, Benzene, Chloroform, Dichlorodifluoromethane, PCE, TCE
Nonsewered 1 1 Toluene
Commercial 63 4 Chloroform, 1,1-Dichloroethane, PCE, TCE, Toluene, Dichlorodifluoromethane
Undeveloped 2 2 Benzene, toluene
Transitional 40 3 Toluene, n-Propylbenzene, Chloroform, Chloromethane, Bromodichloromethane,
Dichlorodifluoromethane Table 8: Summary of VOC detections, by land use.
Drinking water criteria for VOCs were exceeded on five occasions. PCE, TCE,
and Chloroform were the most pervasive VOCs. PCE was found consistently in three
wells, TCE consistently in two wells, and Chloroform consistently in three wells.
Concentrations of chloride and nitrate were higher in monitoring wells having a
detectable VOC, indicating that wells subject to nitrate and chloride contamination were
also subject to VOC contamination.
VOCs have been detected in domestic wells on seven occasions. No VOC was
detected at a concentration exceeding drinking water criteria. Acetone, methylene
chloride, xylene, and toluene are common laboratory contaminants and account for five
of the eight VOC detections. Chloroform, a common product of chlorination, was
detected on the other three occasions.
2.2.4. Pesticides
In 1998, we began sending samples for pesticide analysis to the USGS Analytical
Laboratory in Lawrence, Kansas. This was primarily due to the wider range of herbicide
degradates that could be detected at this laboratory. Results are thus presented for 1998
through 2000.
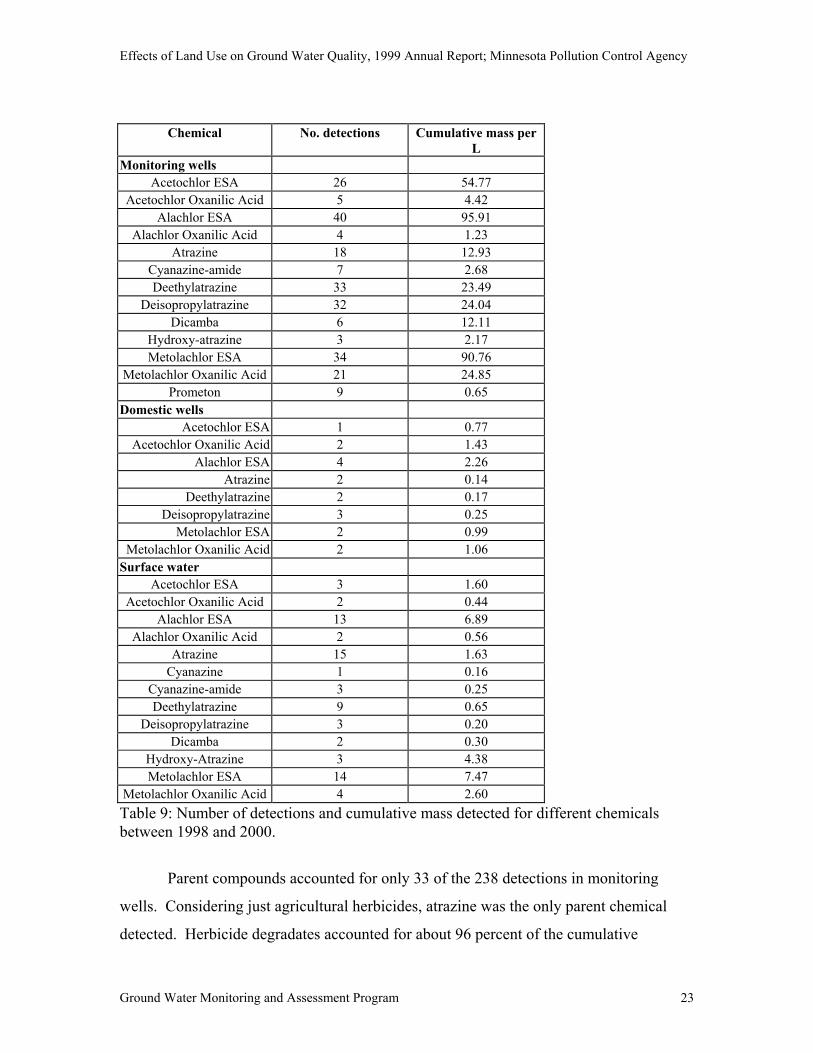
Table 9 summarizes the number of detections and the cumulative mass detected
for each pesticide. Health Risk Limits (HRLs) do not exist for the degradates. We chose
to assess potential health risk from the degradates by assuming they have the same
toxicity as the parent compound. Six wells exceeded drinking criteria, primarily due to
concentrations of alachlor degradates.
Effects of Land Use on Ground Water Quality, 1999 Annual Report; Minnesota Pollution Control Agency
Ground Water Monitoring and Assessment Program 23
Chemical No. detections Cumulative mass per L
Monitoring wells Acetochlor ESA 26 54.77
Acetochlor Oxanilic Acid 5 4.42 Alachlor ESA 40 95.91
Alachlor Oxanilic Acid 4 1.23 Atrazine 18 12.93
Cyanazine-amide 7 2.68 Deethylatrazine 33 23.49
Deisopropylatrazine 32 24.04 Dicamba 6 12.11
Hydroxy-atrazine 3 2.17 Metolachlor ESA 34 90.76
Metolachlor Oxanilic Acid 21 24.85 Prometon 9 0.65
Domestic wells Acetochlor ESA 1 0.77
Acetochlor Oxanilic Acid 2 1.43 Alachlor ESA 4 2.26
Atrazine 2 0.14 Deethylatrazine 2 0.17
Deisopropylatrazine 3 0.25 Metolachlor ESA 2 0.99
Metolachlor Oxanilic Acid 2 1.06 Surface water
Acetochlor ESA 3 1.60 Acetochlor Oxanilic Acid 2 0.44
Alachlor ESA 13 6.89 Alachlor Oxanilic Acid 2 0.56
Atrazine 15 1.63 Cyanazine 1 0.16
Cyanazine-amide 3 0.25 Deethylatrazine 9 0.65
Deisopropylatrazine 3 0.20 Dicamba 2 0.30
Hydroxy-Atrazine 3 4.38 Metolachlor ESA 14 7.47
Metolachlor Oxanilic Acid 4 2.60 Table 9: Number of detections and cumulative mass detected for different chemicals between 1998 and 2000.
Parent compounds accounted for only 33 of the 238 detections in monitoring
wells. Considering just agricultural herbicides, atrazine was the only parent chemical
detected. Herbicide degradates accounted for about 96 percent of the cumulative
Effects of Land Use on Ground Water Quality, 1999 Annual Report; Minnesota Pollution Control Agency
Ground Water Monitoring and Assessment Program 24
herbicide mass detected in monitoring wells. The sulfonic acid (ESA) degradates
accounted for about 69 percent of the cumulative mass and 100 of the 238 herbicide
detections. The ESA form is favored in soil, while the oxanilic acid (OA) form is
favored in ground water. Both degradates are mobile and persistent in aerobic
environments (Philips et al., 1999; Graham et al., 1999). The parent compound appeared
to largely be degraded in soil and then transported to ground water during recharge.
Domestic wells were only sampled once, in Spring of 2000. Nine of 20 domestic
wells had detectable herbicide. ESA degradates accounted for about 44 percent of the
cumulative mass detected in domestic wells.
In surface water, the distribution of herbicide was similar to monitoring wells
except for a single detection of cyanazine. Degradates accounted for about 91 percent of
the cumulative herbicide mass in surface water. The ESA degradates accounted for about
63 percent of the cumulative herbicide mass in surface water samples.
Ratios of deethylatrazine to atrazine (DAR) provide information on the
relationship between herbicide concentrations in surface water and ground water.
Thurman and Fallon (1996) observed a decreasing DAR in surface water for spring
storms following herbicide application. A decreasing DAR indicates increasing
contributions from the parent compound, atrazine. Deethylatrazine only accounts for 6%
of the degradation of atrazine, but it is selectively removed from soil and transported to
ground water and surface water. We observed the highest DAR in spring, suggesting
large ground water contributions to surface water or sampling prior to the major flush of
atrazine with surface runoff. The DAR decreased between spring and summer sampling
events. Our DAR were much higher than those of Thurman and Fallon, indicating
greater degradation of atrazine in soil prior to transport of the degradates to ground water.
Deisopropylatrazine is another degradate of atrazine, but is less mobile than
deethylatrazine. Thurman et al. (1994) suggest the ratio of deisopropylatrazine to
deethylatrazine (D2R) should increase during the growing season, thus reflecting the time
lag in movement of deisopropylatrazine to ground water. The D2R was lowest in spring,
reflecting inputs of deethylatrazine to ground water. The D2R increased through the
growing season, as predicted by Thurman et al. (1998).
Effects of Land Use on Ground Water Quality, 1999 Annual Report; Minnesota Pollution Control Agency
Ground Water Monitoring and Assessment Program 25
Eighty-six percent of samples collected from irrigated agricultural areas had a
detectable herbicide, compared to 68 percent in nonirrigated agriculture and 10 percent or
less percent in the remaining land uses. A detectable herbicide was present in 86 percent
of surface water samples. Triazine and acetanilide herbicides and their degradates
accounted for all herbicide detections under agricultural land use. The median
concentration of 2.91 ug/L under agricultural land use was higher than under other land
uses. Dicamba and Prometon were detected in sewered residential areas. Dicamba is a
common herbicide for lawn use, while Prometon is widely used in road right-of-ways.
Dicamba was detected on two occasions at a concentration greater than 5 ug/L, while
Prometon was found at concentrations less than 0.10 ug/L. Alachlor ESA, metolochlor
ESA, and Prometon were detected in commercial areas. The source of the agricultural
herbicides in samples from commercial areas and in the single sample from an
undeveloped area is unclear. The areas where these herbicides were detected are adjacent
to agricultural fields. The inorganic chemistry in these wells is similar to inorganic
chemistry in other wells from the same land use. Consequently, herbicides may be
associated with drift from herbicide application on adjacent fields.
2.2.5. Polynuclear Aromatic Hydrocarbons (PAHs)
Concentrations of Polynuclear Aromatic Hydrocarbons (PAHs) were below the
reporting limit of 0.010 ug/l in all but one well. Benzo(g,h,i)pyrelene and Indeno(1,2,3,-
c,d)pyrene were detected at concentrations of 0.013 and 0.012 ug/l, respectively, in one
monitoring well. These two chemicals are classified as carcinogenic PAHs (cPAHs),
meaning their toxic endpoint is cancer. The Health Based Value (HBV) for carcinogenic
PAHs is 0.050 ug/l, referenced to Benzo(a)pyrene.3 The relative potency factor for
Indeno(1,2,3-c,d)pyrene is 0.1. Benzo(g,h,i)pyrelene does not have a relative potency
factor. The resulting concentration of cPAHs is therefore greater than 0.012 (considering
just Indeno(1,2,3-c,d)pyrene), but less than 0.050 ug/l, since the relative potency factor
3 The concentration of carcinogenic PAHs in ground water (Ct) is given by Ct = Σ(PF * Ci), where PF is the PAH potency factor and Ci is the concentration of PAH chemical i. The potency factor is a measure of the relative cancer potency, compared to Benzo(a)pyrene. The drinking water criteria to which Ct is compared is 0.050 ug/l.
Effects of Land Use on Ground Water Quality, 1999 Annual Report; Minnesota Pollution Control Agency
Ground Water Monitoring and Assessment Program 26
for Benzo(g,h,i)pyrelene will not exceed 1.0. PAHs in ground water do not appear to be
a concern for human exposure under any land use setting.
2.2.2.6. Perchlorate
In Spring, 2001, we sampled 23 shallow monitoring wells for perchlorate. There
were no detections of perchlorate, at a detection level of 0.5 ug/L.
2.2.2.7. Bacteria
In Spring, 2000, we sampled monitoring and domestic wells for total coliform
bacteria and fecal coliform bacteria. Total coliforms were detected in 8 of 17 samples
from shallow monitoring wells. There was one or more detection in each land use except
transitional areas. All samples from nonirrigated agriculture and nonsewered residential
land use had detectable coliform bacteria. Concentrations were highest under
nonsewered land use, exceeding 200 MPN/100 mL in both samples. The next highest
concentration was 39 MPN/100-mL. Total coliform bacteria were detected in two of 21
sampled wells. Concentrations were 920 and 2.5 MPN/100 mL. E. coli bacteria were not
detected in any sample from domestic wells.
3. Future of the Project
Funding for the St. Cloud land use study is uncertain. The original objectives of
the study included the following.
1. Phase back to annual sampling after four years of quarterly sampling. Annual
sampling included the full analytical suite (ICP, ICP-MS, herbicides, VOCs, major
anions, general chemistry, and field parameters). Annual sampling occurs in spring
following recharge. If annual sampling continues, it appears herbicides and possibly
ICP-MS will be deleted from the chemical parameter list.
2. Monitoring water levels with continuous recorders in select wells. One well was
equipped with a continuous recorder in 2001. If the project is continued, continuous
recorders will be deployed in two wells.
Effects of Land Use on Ground Water Quality, 1999 Annual Report; Minnesota Pollution Control Agency
Ground Water Monitoring and Assessment Program 27
3. Results from the study were to be utilized in computer modeling of the St. Cloud area
and as a predictive tool for estimating ground water impacts under various land use
scenarios. This objective will not be accomplished through the current project.
4. Expansion of the monitoring network to include up to six additional wells in areas
where land use is transitioning in the next few years. This objective will not be
accomplished as part of this project.
5. Sampling for additional chemicals of interest as needed. Examples might include
pesticides previously not sampled, pharmaceuticals, and other chemicals that have not
been sampled but may occur in ground water because of human activity. This
objective will not be accomplished through this project.
Effects of Land Use on Ground Water Quality, 1999 Annual Report; Minnesota Pollution Control Agency
Ground Water Monitoring and Assessment Program 28
References Graham, W.H., D.W. Graham, F. Denoyelles Jr., V.H. Smith, C.K. Larive, and E.M.
Thurman. 1999. Metolochlor and Alachlor Breakdown Product Formation Patterns in Aquatic Field Mesocosms. Environ. Sci. Technol. 33:4471-4476.
Minnesota Pollution Control Agency. 1996. GWMAP Field Guidance Manual. St. Paul,
MN 42p. Minnesota Pollution Control Agency. 1998a. Effects of Land Use on Ground Water
Quality. St. Cloud Area, Minnesota. 1997 Results. St. Paul, MN 59 p. Minnesota Pollution Control Agency. 1998b. Data Analysis Protocol for the Ground
Water Monitoring and Assessment Program (GWMAP). Draft in review. Minnesota Pollution Control Agency. 1999. Effects of Land Use on Ground Water
Quality. St. Cloud Area, Minnesota.1998 Results. St. Paul, MN 46 p. Minnesota Pollution Control Agency. 2000. Effects of Land Use on Ground Water
Quality. St. Cloud Area, Minnesota 1999 Results. St. Paul, MN 38 p. Minnesota Pollution Control Agency. 2001. Effects of Land Use on Ground Water
Quality, St.Cloud Area, Minnesota - . St. Paul, MN 38 p. Philips, P.J., G.R. Wall, E.M. Thurman, D.A. Eckhardt, and J. VanHoesen. 1999.
Metolochlor and its Metabolites in Tile Drain and Stream Runoff in the Canajoharie Creek Watershed. Environ. Sci. Technol. 33:3531-3537.
Thurman, E.M. and J.D. Fallon. 1996. The Deethylatrazine/Atrazine Ratio as a n
Indicator of the Onset of the Spring Flush of Herbicides into Surface Water of the Midwestern United States. Intern. J. Environ. Anal. Chem. 65:203-214.
Thurman, E.M., M.T. Meyer, M.S. Mills, L.R. Zimmerman, C.A. Perry, and D.A.
Goolsby. 1994. Formation and Transport of Deethylatrazine and Deisopropylatrazine in Surface Water. Environ. Sci. Tech. 28:2267-2277.