Embed Size (px)
Citation preview
ACTA AGROPHYSICA
EFFECTS OF LAND USE
AND CULTURAL PRACTICES
ON GREENHOUSE GAS FLUXES IN SOIL
Ryusuke Hatano, Jerzy Lipiec
109
Instytut Agrofizyki im. Bohdana Dobrzańskiego PAN w Lublinie
Rozprawy i Monografie 2004(6)
2
Komitet Redakcyjny
Redaktor Naczelny Ryszard T. Walczak, czł. koresp. PAN
Zastępca Redaktora Naczelnego Józef Horabik
Sekretarz Redakcji Wanda Woźniak
Rada Redakcyjna
Tomasz Brandyk, czł. koresp. PAN – przewodniczący
Ryszard Dębicki Bohdan Dobrzański Danuta Drozd Franciszek Dubert Tadeusz Filipek Józef Fornal Jan Gliński, czł. rzecz. PAN Grzegorz Józefaciuk Eugeniusz Kamiński Andrzej Kędziora Tadeusz Kęsik Krystyna Konstankiewicz Janusz Laskowski
Jerzy Lipiec Piotr P. Lewicki Stanisław Nawrocki, czł. rzecz. PAN Edward Niedźwiecki Viliam Novák, Słowacja Josef Pecen, Czechy Tadeusz Przybysz Stanisław Radwan, czł. koresp. PAU Jan Sielewiesiuk Witold Stępniewski Zbigniew Ślipek Bogusław Szot
Opiniował do druku
Prof. dr hab. Jan Gliński, czł. rzecz. PAN
Adres redakcji Instytut Agrofizyki im. Bohdana Dobrzańskiego PAN, ul. Doświadczalna 4, P.O. Box 201
20-290 Lublin 27, tel. (0-81) 744-50-61, e-mail: [email protected] http: //www.ipan.lublin.pl
Publikacja indeksowana przez
Polish Scientific Journals Contents – Life Sci. w sieci Internet pod adresem http://www.psjc.icm.edu.pl
The paper was published in the frame of activity of the Centre of Excellence AGROPHYSICS –
Contract No.: QLAM-2001-00428 sponsored by EU within the 5FP
Copyright by Instytut Agrofizyki im. Bohdana Dobrzańskiego PAN, Lublin 2004
ISSN 1234-4125
Wydanie I. Nakład 350 egz. Ark. wyd. 4,7 Skład komputerowy: Agata Woźniak, Wanda Woźniak
Druk: Drukarnia ALF-GRAF, ul. Kościuszki 4, 20-006 Lublin
3
CONTENTS
1. INTRODUCTION ……………………………………………………………………… 5
2. CARBON DIOXIDE …………………………………………………………………… 5
2.1. Effect of land use on carbon dioxide flux ………………………………………… 5
2.1.1. Soil flux ……………………………………………………………………... 5
2.1.2. Effect of vegetation ………………………………………………………….. 6
2.1.3. Temporal and spatial variability……………………………………………... 8
2.2. Cultural practices …………………………………………………………………. 10
2.2.1. Effect of tillage on carbon dioxide emissions ……………………………….. 10
2.2.2. Soil aggregates ………………………………………………………………. 13
3. NITROUS OXIDE ……………………………………………………………………… 13
3.1. Effect of land use on nitrous oxide emissions……………………………………... 14
3.2. Cultural practices …………………………………………………………………. 15
3.2.1. Effect of tillage on nitrous oxide emissions …………………………………. 15
3.2.2. Effects of soil compaction …………………………………………………... 15
3.2.3. Effect of fertilisation on nitrous oxide ………………………………………. 18
3.2.4. Effects of crop type and rotations …………………………………………… 19
3.2.5. Spatial and temporal variation of nitrous oxide emissions ………………….. 20
3.2.6. Main soil factors affecting nitrous oxide emissions ………………………… 21
4. METHANE ……………………………………………………………………. 22
4.1. Land use …………………………………………………………………………... 22
4.1.1. Wetlands ……………………………………………………………………. 22
4.1.1.1. Effect of water management on methane emissions ……………………. 24
4.1.2. Upland soils …………………………………………………………………. 25
4.1.3. Effect of fertilization on methane exchange ………………………………… 26
4.1.4. Effect of tillage and compaction on methane exchange …………………….. 27
5. NITRIC OXIDE ………………………………………………………………………… 28
5.1. Effect of land use and soil tillage on nitric oxide emissions ……………………… 28
5.2. Effects of soil physical properties on nitric oxide emissions ……….…………….. 28
5.3. Effect of fertilization on nitric oxide emissions …………………….…………….. 29
5.4. Effects of crop type on nitric oxide emissions ……………………………………. 31
4
6. EFFECT OF LAND USE AND CULTURAL PRACTICES ON FLUXES OF MULTIPLE
GREENHOUSE GASES …………………………………………………………………...
31
6.1. Carbon dioxide, methane, and nitrous oxide …………………………………….. 31
6.2. Carbon dioxide and nitrous oxide ………………………………………………... 32
6.3. Carbon dioxide and methane …………………………………………………….. 32
6.4. Nitrous oxide and methane ………………………………………………………. 32
6.5. Nitrous oxide and nitric oxide …………………………………………………… 33
7. FUTURE TRENDS ……………………………………………………………………... 34
8. CONCLUSIONS ……………………………………………………………………….. 34
9. REFERENCES …………………………………………………………………………. 36
8. SUMMARY …………………………………………………………………………….. 48
9. STRESZCZENIE ……………………………………………………………………….. 49
5
1. INTRODUCTION
Long term records show increasing growth in anthropogenic greenhouse gas emissions, in particular during last decades [79]. There is a considerable uncertainty in the estimates of carbon dioxide (CO2), nitrous oxide (N2O), methane (CH4) and nitric oxide (NO) emissions from soils [e.g, 104,135]. New estimations suggest that input of greenhouse gases to the atmosphere from agricultural production has been previously underestimated [123]. The gases may diffuse to the atmosphere directly from the soil or indirectly through subsurface drainage after leaching [156]. In this review we summarize current knowledge on the effects of land use and cultural practices on greenhouse gas fluxes with emphasis on recent literature. Rates of emission of greenhouse gas rates are reported in the literature in a variety of units. We present the results in their original units and also in the following converted units: g CO2-C m-2 h-1, g N2O -N ha-1 day-1, mg CH4-C m-2 h-1, ng NO-N m-2 s-1.
2. CARBON DIOXIDE
Atmospheric CO2 accounts for 60% of the total greenhouse effect [145] being the second largest flux in the global carbon cycle [177]. In general, past and present conversions of native soils to agriculture have contributed significantly to CO2 emissions to the atmosphere [140]. Agricultural land-use types and cultural practices largely affect the emission and uptake of CO2 and thereby play an important role in sequestering C in soil.
2.1. Effect of land use on carbon dioxide flux
2.1.1. Soil flux
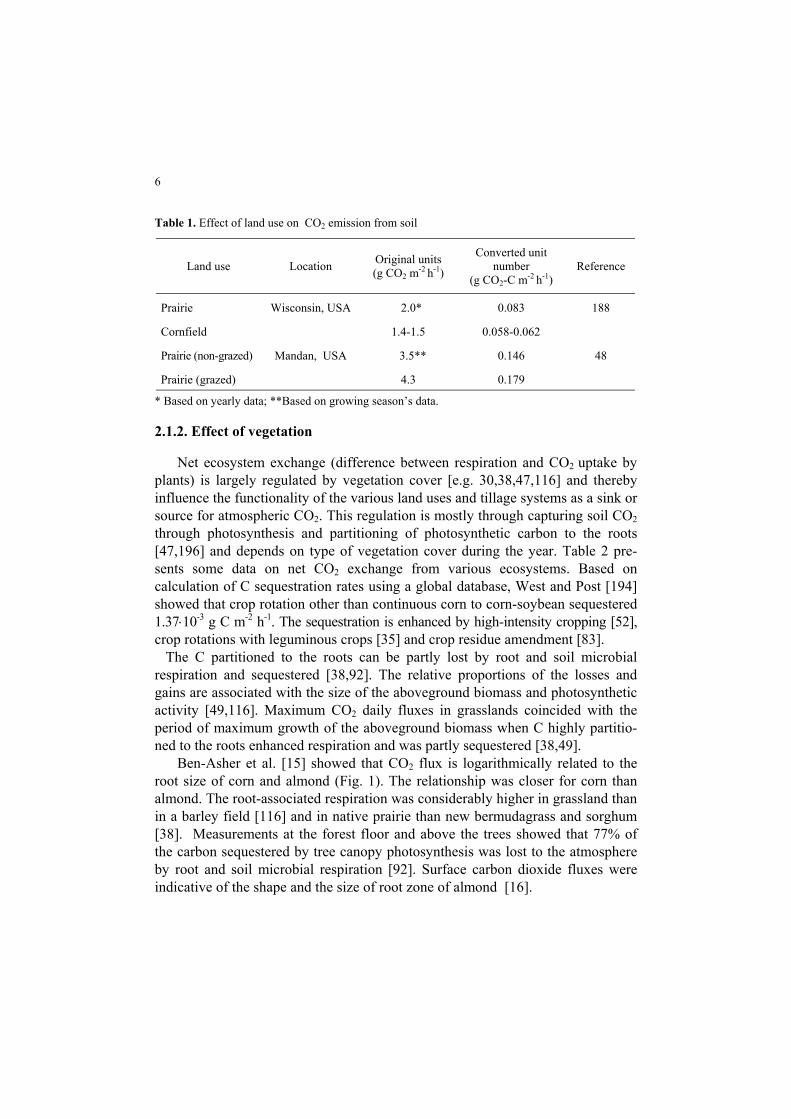
The effect of agricultural land-use type and management on the soil CO2 exchange is related to soil and climate conditions. The results from studies where different land uses were applied on the same site (Tab. 1) indicate enhancing effect of prairie vs. cornfield which can be associated with an extensive fibrous root system and greater microbial and earthworm populations and decomposition of usually present surface residues in prairies. Greater CO2 soil flux from grazed than non-grazed prairie can be partly due to the effect of additional nutrients from livestock excrement. Conversion of grassland supported by organic soil to cultivation in northern climate of Finland resulted in a substantial increase in mineralization of stored organic mate-rial and loss of carbon [116]. However, such conversion under tropical conditions of Venezuela did not cause significant changes in CO2 flux [155].
6
Table 1. Effect of land use on CO2 emission from soil
Land use Location Original units (g CO2 m-2 h-1)
Converted unit number
(g CO2-C m-2 h-1) Reference
Prairie Wisconsin, USA 2.0* 0.083 188 Cornfield 1.4-1.5 0.058-0.062 Prairie (non-grazed) Mandan, USA 3.5** 0.146 48 Prairie (grazed) 4.3 0.179
* Based on yearly data; **Based on growing season’s data.
2.1.2. Effect of vegetation
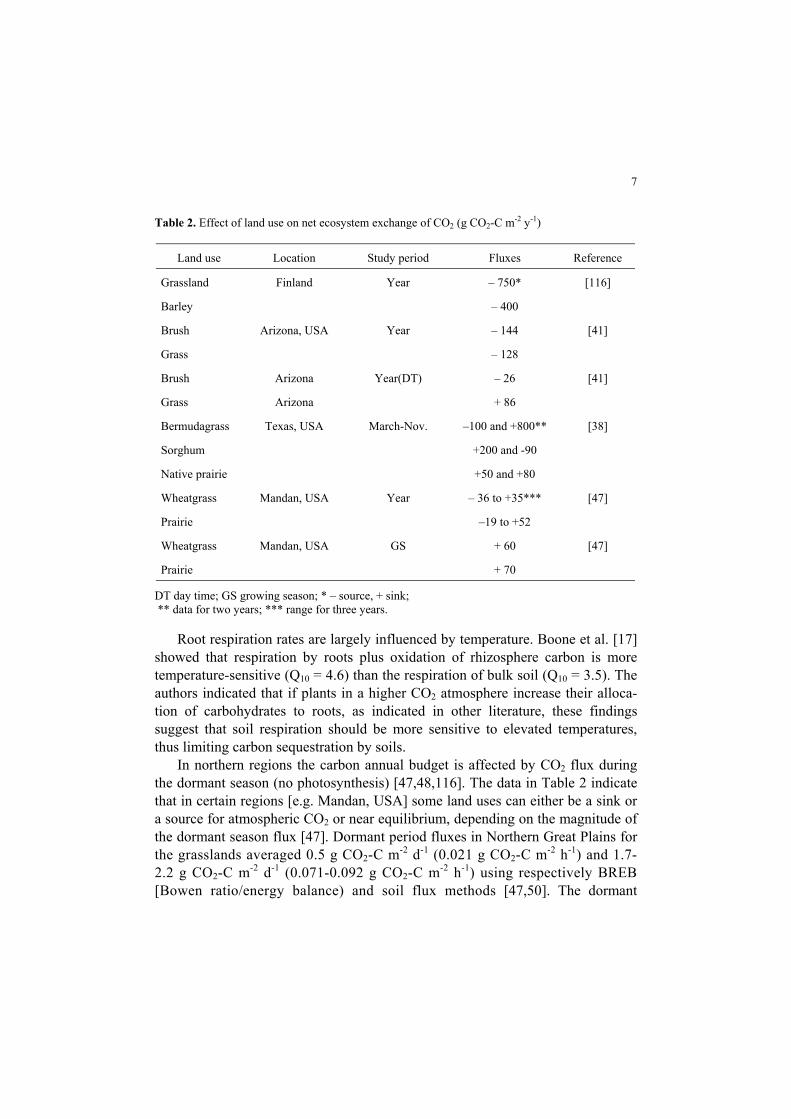
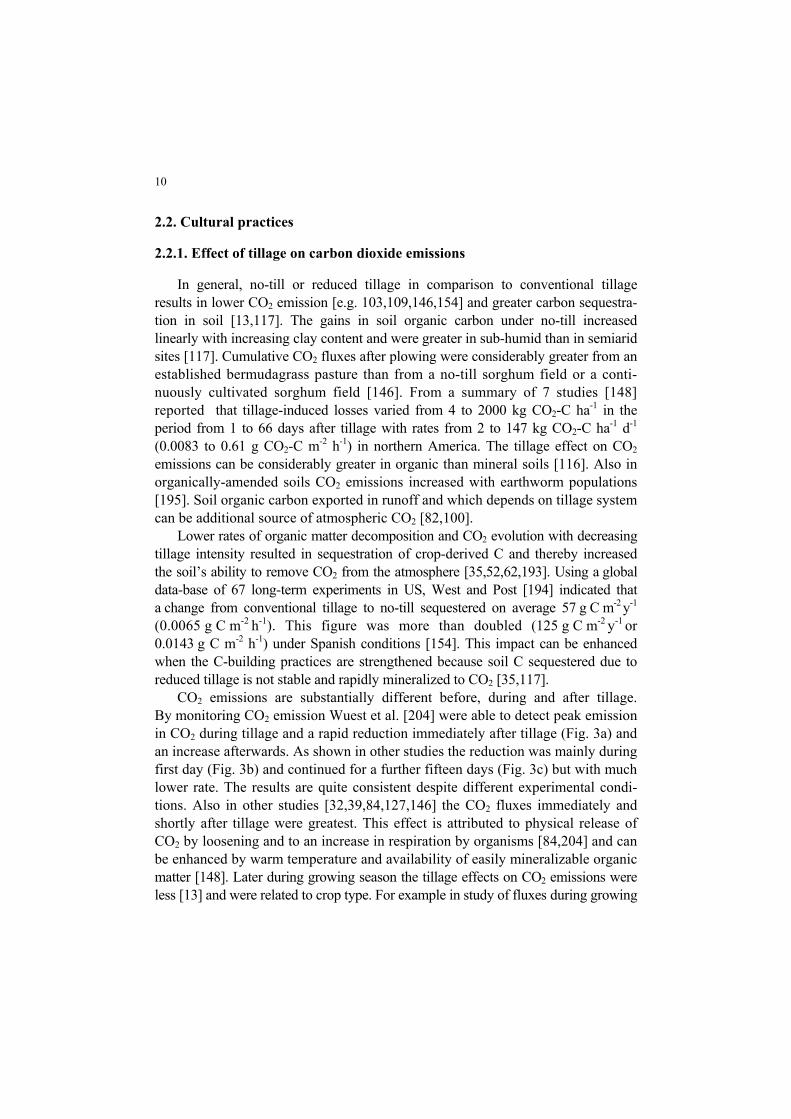
Net ecosystem exchange (difference between respiration and CO2 uptake by plants) is largely regulated by vegetation cover [e.g. 30,38,47,116] and thereby influence the functionality of the various land uses and tillage systems as a sink or source for atmospheric CO2. This regulation is mostly through capturing soil CO2 through photosynthesis and partitioning of photosynthetic carbon to the roots [47,196] and depends on type of vegetation cover during the year. Table 2 pre-sents some data on net CO2 exchange from various ecosystems. Based on calculation of C sequestration rates using a global database, West and Post [194] showed that crop rotation other than continuous corn to corn-soybean sequestered 1.37⋅10-3 g C m-2 h-1. The sequestration is enhanced by high-intensity cropping [52], crop rotations with leguminous crops [35] and crop residue amendment [83]. The C partitioned to the roots can be partly lost by root and soil microbial respiration and sequestered [38,92]. The relative proportions of the losses and gains are associated with the size of the aboveground biomass and photosynthetic activity [49,116]. Maximum CO2 daily fluxes in grasslands coincided with the period of maximum growth of the aboveground biomass when C highly partitio-ned to the roots enhanced respiration and was partly sequestered [38,49]. Ben-Asher et al. [15] showed that CO2 flux is logarithmically related to the root size of corn and almond (Fig. 1). The relationship was closer for corn than almond. The root-associated respiration was considerably higher in grassland than in a barley field [116] and in native prairie than new bermudagrass and sorghum [38]. Measurements at the forest floor and above the trees showed that 77% of the carbon sequestered by tree canopy photosynthesis was lost to the atmosphere by root and soil microbial respiration [92]. Surface carbon dioxide fluxes were indicative of the shape and the size of root zone of almond [16].
7
Table 2. Effect of land use on net ecosystem exchange of CO2 (g CO2-C m-2 y-1)
Land use Location Study period Fluxes Reference
Grassland Finland Year – 750* [116]
Barley – 400
Brush Arizona, USA Year – 144 [41]
Grass – 128
Brush Arizona Year(DT) – 26 [41]
Grass Arizona + 86
Bermudagrass Texas, USA March-Nov. –100 and +800** [38]
Sorghum +200 and -90
Native prairie +50 and +80
Wheatgrass Mandan, USA Year – 36 to +35*** [47]
Prairie –19 to +52
Wheatgrass Mandan, USA GS + 60 [47]
Prairie + 70
DT day time; GS growing season; * – source, + sink; ** data for two years; *** range for three years.
Root respiration rates are largely influenced by temperature. Boone et al. [17] showed that respiration by roots plus oxidation of rhizosphere carbon is more temperature-sensitive (Q10 = 4.6) than the respiration of bulk soil (Q10 = 3.5). The authors indicated that if plants in a higher CO2 atmosphere increase their alloca-tion of carbohydrates to roots, as indicated in other literature, these findings suggest that soil respiration should be more sensitive to elevated temperatures, thus limiting carbon sequestration by soils. In northern regions the carbon annual budget is affected by CO2 flux during the dormant season (no photosynthesis) [47,48,116]. The data in Table 2 indicate that in certain regions [e.g. Mandan, USA] some land uses can either be a sink or a source for atmospheric CO2 or near equilibrium, depending on the magnitude of the dormant season flux [47]. Dormant period fluxes in Northern Great Plains for the grasslands averaged 0.5 g CO2-C m-2 d-1 (0.021 g CO2-C m-2 h-1) and 1.7-2.2 g CO2-C m-2 d-1 (0.071-0.092 g CO2-C m-2 h-1) using respectively BREB [Bowen ratio/energy balance) and soil flux methods [47,50]. The dormant
8
fluxes in Finland were from 1.13 in bare tilled soil to 1.56 g CO2-C m-2 d-1 (0.047 to 0.065 g CO2-C m-2 h-1) in grasslands [116]. In case of over-winter cover crops and perennials such as alfalfa and poplar in south-east Michigan the fluxes were approximately 2 g CO2-C m-2 d-1 (0.08 g CO2-C m-2 h-1) [139].
50
40
30
20
10
010 100 1000 10000 100000
corn almond
CO
2 flu
x (µ
mol
m-2s-1
)
Root number (no. m )-2
0
1
2
CO
flux
(g C
m h
)2
-2-1
Fig. 1. CO2 flux as a function of root number of almond (roots intersecting a cross section of 0.01 m2
on the side wall) and corn ( by a minirhizotron with 0.01 m length increment)[after 15]
2.1.3. Temporal and spatial variability
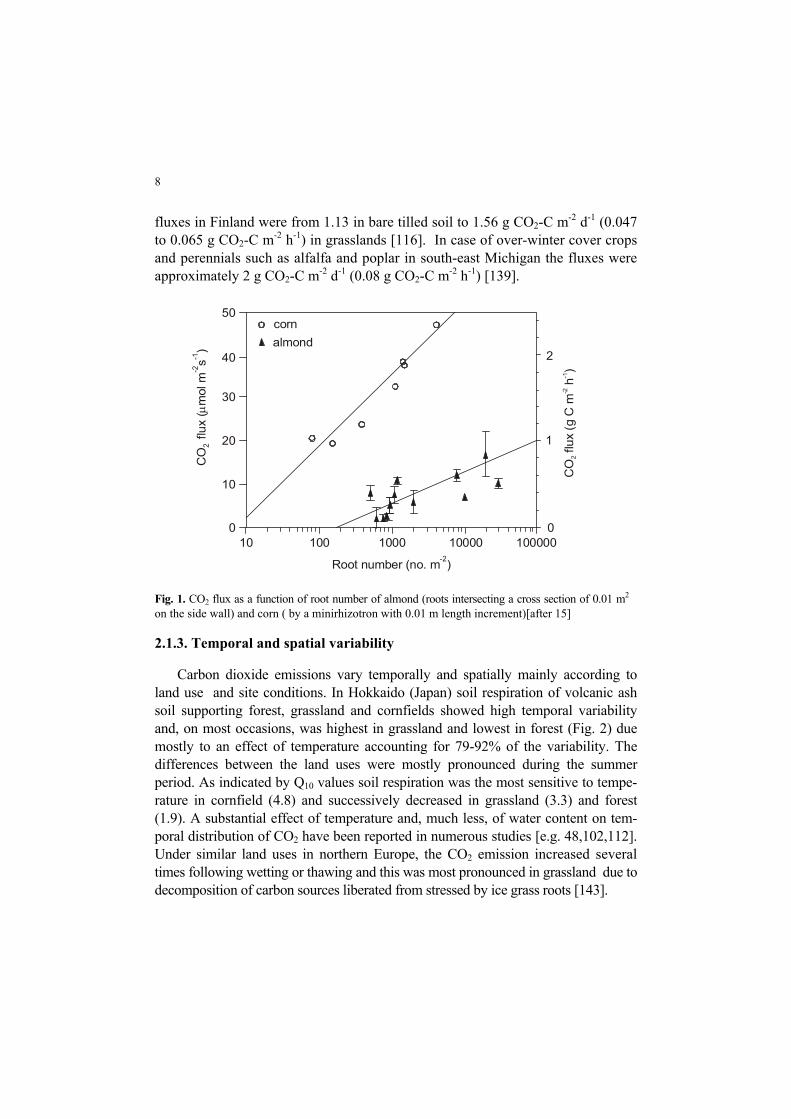
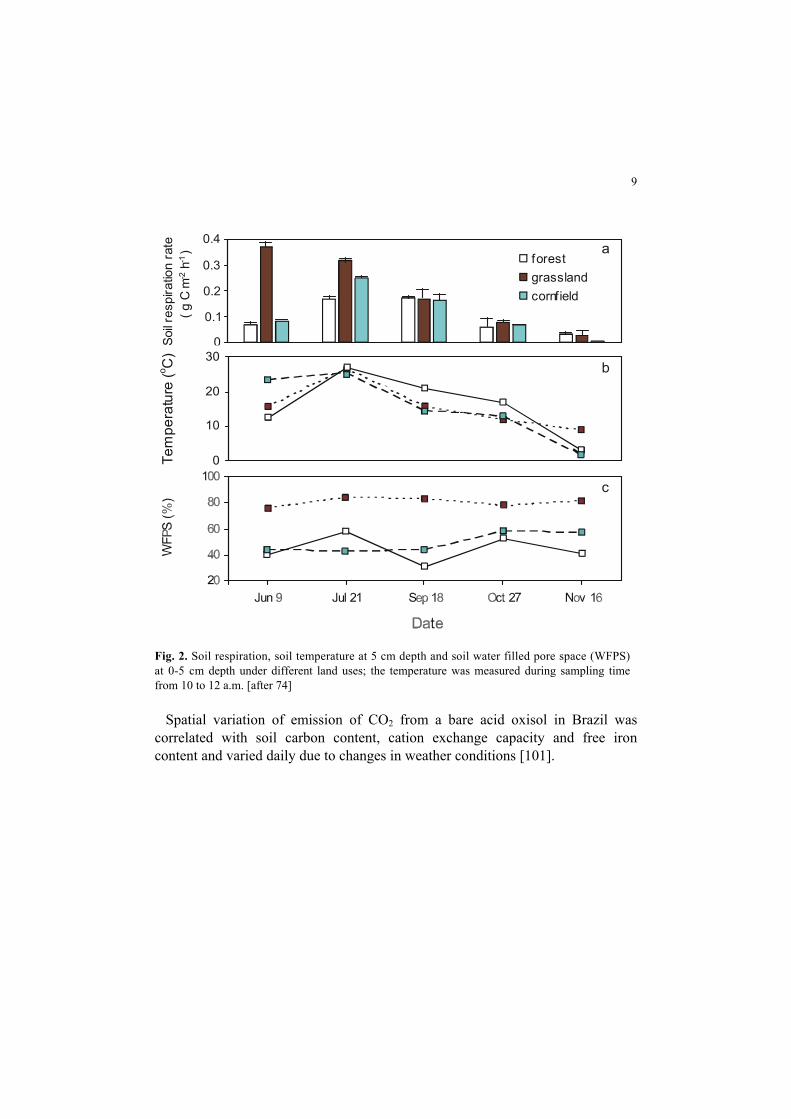
Carbon dioxide emissions vary temporally and spatially mainly according to land use and site conditions. In Hokkaido (Japan) soil respiration of volcanic ash soil supporting forest, grassland and cornfields showed high temporal variability and, on most occasions, was highest in grassland and lowest in forest (Fig. 2) due mostly to an effect of temperature accounting for 79-92% of the variability. The differences between the land uses were mostly pronounced during the summer period. As indicated by Q10 values soil respiration was the most sensitive to tempe-rature in cornfield (4.8) and successively decreased in grassland (3.3) and forest (1.9). A substantial effect of temperature and, much less, of water content on tem-poral distribution of CO2 have been reported in numerous studies [e.g. 48,102,112]. Under similar land uses in northern Europe, the CO2 emission increased several times following wetting or thawing and this was most pronounced in grassland due to decomposition of carbon sources liberated from stressed by ice grass roots [143].
9
Fig. 2. Soil respiration, soil temperature at 5 cm depth and soil water filled pore space (WFPS) at 0-5 cm depth under different land uses; the temperature was measured during sampling time from 10 to 12 a.m. [after 74]
0Soil r
espi
ratio
n ra
te
(g C
m-2
h - 1 ) forest
grasslandcornfield
0
10
20
30
Tem
pera
ture
(o C)
a
b
c
0.1
0.2
0.3
0.4
Spatial variation of emission of CO2 from a bare acid oxisol in Brazil was correlated with soil carbon content, cation exchange capacity and free iron content and varied daily due to changes in weather conditions [101].
10
2.2. Cultural practices
2.2.1. Effect of tillage on carbon dioxide emissions
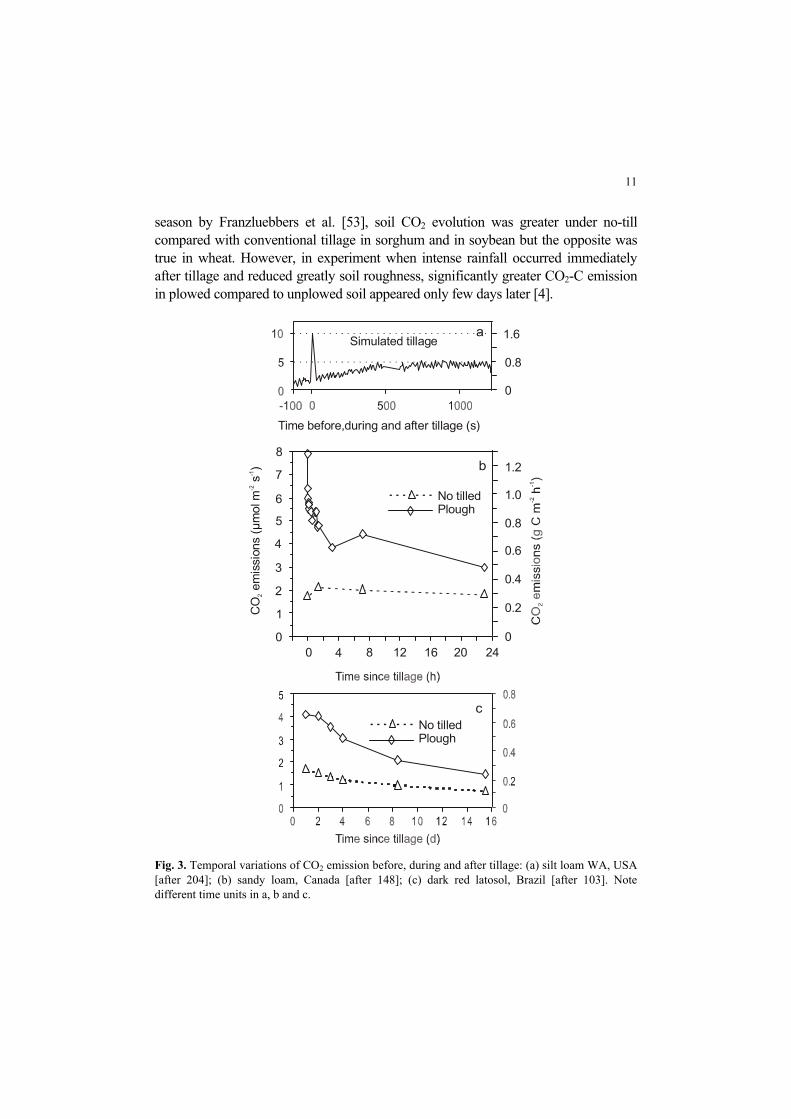
In general, no-till or reduced tillage in comparison to conventional tillage results in lower CO2 emission [e.g. 103,109,146,154] and greater carbon sequestra-tion in soil [13,117]. The gains in soil organic carbon under no-till increased linearly with increasing clay content and were greater in sub-humid than in semiarid sites [117]. Cumulative CO2 fluxes after plowing were considerably greater from an established bermudagrass pasture than from a no-till sorghum field or a conti-nuously cultivated sorghum field [146]. From a summary of 7 studies [148] reported that tillage-induced losses varied from 4 to 2000 kg CO2-C ha-1 in the period from 1 to 66 days after tillage with rates from 2 to 147 kg CO2-C ha-1 d-1 (0.0083 to 0.61 g CO2-C m-2 h-1) in northern America. The tillage effect on CO2 emissions can be considerably greater in organic than mineral soils [116]. Also in organically-amended soils CO2 emissions increased with earthworm populations [195]. Soil organic carbon exported in runoff and which depends on tillage system can be additional source of atmospheric CO2 [82,100]. Lower rates of organic matter decomposition and CO2 evolution with decreasing tillage intensity resulted in sequestration of crop-derived C and thereby increased the soil’s ability to remove CO2 from the atmosphere [35,52,62,193]. Using a global data-base of 67 long-term experiments in US, West and Post [194] indicated that a change from conventional tillage to no-till sequestered on average 57 g C m-2 y-1 (0.0065 g C m-2 h-1). This figure was more than doubled (125 g C m-2 y-1 or 0.0143 g C m-2 h-1) under Spanish conditions [154]. This impact can be enhanced when the C-building practices are strengthened because soil C sequestered due to reduced tillage is not stable and rapidly mineralized to CO2 [35,117]. CO2 emissions are substantially different before, during and after tillage. By monitoring CO2 emission Wuest et al. [204] were able to detect peak emission in CO2 during tillage and a rapid reduction immediately after tillage (Fig. 3a) and an increase afterwards. As shown in other studies the reduction was mainly during first day (Fig. 3b) and continued for a further fifteen days (Fig. 3c) but with much lower rate. The results are quite consistent despite different experimental condi-tions. Also in other studies [32,39,84,127,146] the CO2 fluxes immediately and shortly after tillage were greatest. This effect is attributed to physical release of CO2 by loosening and to an increase in respiration by organisms [84,204] and can be enhanced by warm temperature and availability of easily mineralizable organic matter [148]. Later during growing season the tillage effects on CO2 emissions were less [13] and were related to crop type. For example in study of fluxes during growing
11
season by Franzluebbers et al. [53], soil CO2 evolution was greater under no-till compared with conventional tillage in sorghum and in soybean but the opposite was true in wheat. However, in experiment when intense rainfall occurred immediately after tillage and reduced greatly soil roughness, significantly greater CO2-C emission in plowed compared to unplowed soil appeared only few days later [4].
aSimulated tillage
Time before,during and after tillage (s)
cNo tilledPlough
No tilledPlough
0 4 8 12 16 20 240
1
2
3
4
5
6
7
8
CO
emis
sion
s (
2
µmol
m s
)-2
-1
b
0
0.2
0.4
0.6
0.8
1.0
1.2
0.8
0
1.6
Fig. 3. Temporal variations of CO2 emission before, during and after tillage: (a) silt loam WA, USA [after 204]; (b) sandy loam, Canada [after 148]; (c) dark red latosol, Brazil [after 103]. Note different time units in a, b and c.
12
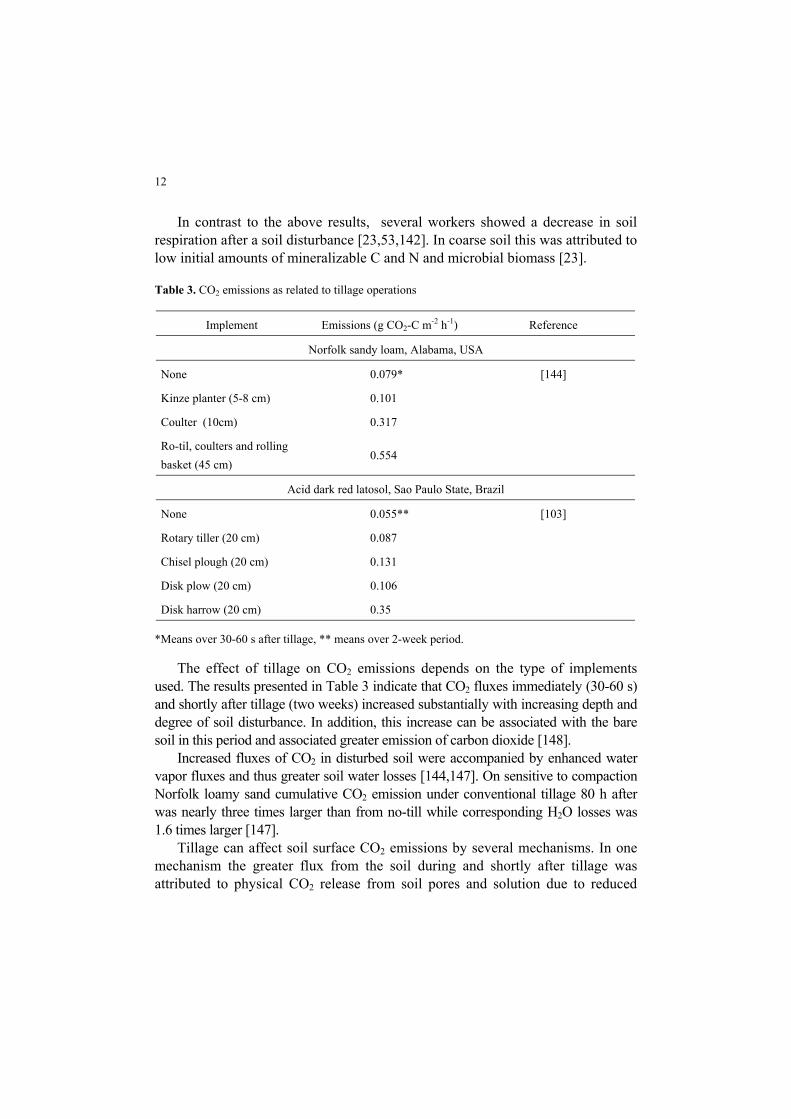
In contrast to the above results, several workers showed a decrease in soil respiration after a soil disturbance [23,53,142]. In coarse soil this was attributed to low initial amounts of mineralizable C and N and microbial biomass [23].
Table 3. CO2 emissions as related to tillage operations
Implement Emissions (g CO2-C m-2 h-1) Reference
Norfolk sandy loam, Alabama, USA
None 0.079* [144] Kinze planter (5-8 cm) 0.101 Coulter (10cm) 0.317 Ro-til, coulters and rolling basket (45 cm)
0.554
Acid dark red latosol, Sao Paulo State, Brazil
None 0.055** [103] Rotary tiller (20 cm) 0.087
Chisel plough (20 cm) 0.131
Disk plow (20 cm) 0.106
Disk harrow (20 cm) 0.35
*Means over 30-60 s after tillage, ** means over 2-week period.
The effect of tillage on CO2 emissions depends on the type of implements used. The results presented in Table 3 indicate that CO2 fluxes immediately (30-60 s) and shortly after tillage (two weeks) increased substantially with increasing depth and degree of soil disturbance. In addition, this increase can be associated with the bare soil in this period and associated greater emission of carbon dioxide [148]. Increased fluxes of CO2 in disturbed soil were accompanied by enhanced water vapor fluxes and thus greater soil water losses [144,147]. On sensitive to compaction Norfolk loamy sand cumulative CO2 emission under conventional tillage 80 h after was nearly three times larger than from no-till while corresponding H2O losses was 1.6 times larger [147]. Tillage can affect soil surface CO2 emissions by several mechanisms. In one mechanism the greater flux from the soil during and shortly after tillage was attributed to physical CO2 release from soil pores and solution due to reduced
13
resistance to gas transfer [146,204]. This explanation can be supported by observations of Calderón et al. [24] and Jackson et al. [84] indicating higher CO2 emissions in tilled than non-tilled soils, despite lower or the same respiration rate. Other mechanisms of the tillage effects are associated with soil temperature and soil water content [4,53,188]. Kiese and Butterbach-Bahl [94] reported that CO2 emission rates were positively correlated with changes in water filled pore space at dry to moderate soil water contents during the dry season, but were negatively correlated to the changes during the wet season. Lower overall CO2 emissions from no-till are also associated with reduced fossil-fuel use C emissions. Based on US average crop inputs, no-till emitted less CO2 from agricultural operations than did conventional tillage, with 137 and 168 kg C ha-1 y-1 (156 and 192g CO2-C m-2 h-1), respectively [193]. In NE Italy minimum tillage contri-buted to the reduction of CO2 emissions of between 200 and 300 m3 ha-1 y-1 (0.45 and 0.67g CO2-C m-2 h-1) [18].
2.2.2. Soil aggregates
Soil tillage and other cultural practices may influence emission of CO2 through their effect on soil aggregation and organic carbon content. Dexter et al. [34] reported that shallow (ploughless) tillage resulted in higher organic carbon (Corg) content in the surface layer and lower Corg content in the deeper layer than the ploughed treatment and basal respiration rates of the aggregates were positively correlated with the Corg contents. This study indicated that some of the Corg is “physically protected” against microbial activity primarily through interactions with clay particles. This protection can be greater in not tilled than tilled soil due to decreasing clay content in the latter, likely due to illuviation and surface runoff [99]. In general, increasing aggregate size was associated with decreasing carbon dioxide production and biomass C [51,159,165], availability of nutrients [157] and evaporation [199,200]. and increasing saturated water conductivity [199]. Reduced carbon dioxide production implies also increasing C sequestration.
3. NITROUS OXIDE
Nitrous oxide is a natural trace gas occurring in the atmosphere. In soils, it is mainly produced from mineral N during the microbial process of nitrification and denitrification [e.g. 14,114]. The annual global emission of N2O from soils is estimated to be 10.2 Tg N or about 58% of all emissions [124]. Most of the nitrous oxide in the atmosphere, thought to be involved in global warming and the depletion of the stratospheric ozone layer is emitted from soil [19,31,160,168].
14
Soil N2O emissions are mainly controlled by the availability of a suitable substrate (nitrogen), soil temperature and factors that reduce the redox potential, e.g. soil wetness, fine soil texture and organic carbon [153,173]. Many activities induced by land use and cultural practices affect these factors.
3.1. Effect of land use on nitrous oxide emissions
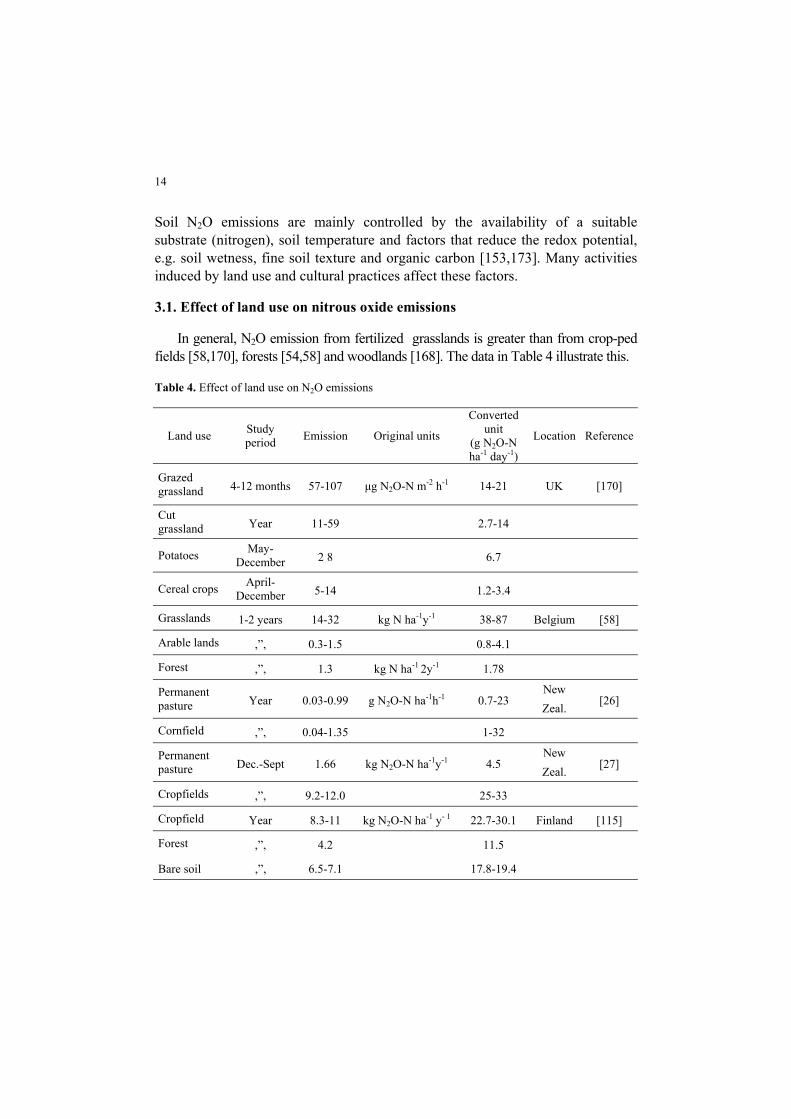
In general, N2O emission from fertilized grasslands is greater than from crop-ped fields [58,170], forests [54,58] and woodlands [168]. The data in Table 4 illustrate this.
Table 4. Effect of land use on N2O emissions
Land use Study period Emission Original units
Converted unit
(g N2O-N ha-1 day-1)
Location Reference
Grazed grassland 4-12 months 57-107 µg N2O-N m-2 h-1 14-21 UK [170]
Cut grassland Year 11-59 2.7-14
Potatoes May-December 2 8 6.7
Cereal crops April-December 5-14 1.2-3.4
Grasslands 1-2 years 14-32 kg N ha-1y-1 38-87 Belgium [58]
Arable lands ,”, 0.3-1.5 0.8-4.1
Forest ,”, 1.3 kg N ha-1 2y-1 1.78
Permanent pasture Year 0.03-0.99 g N2O-N ha-1h-1 0.7-23
New Zeal.
[26]
Cornfield ,”, 0.04-1.35 1-32
Permanent pasture Dec.-Sept 1.66 kg N2O-N ha-1y-1 4.5
New Zeal.
[27]
Cropfields ,”, 9.2-12.0 25-33
Cropfield Year 8.3-11 kg N2O-N ha-1 y- 1 22.7-30.1 Finland [115]
Forest ,”, 4.2 11.5
Bare soil ,”, 6.5-7.1 17.8-19.4
15
Under New Zealand conditions, however, N2O emissions from the permanent pasture were significantly lower than under cropfields [27]. In the mowed grass-land, denitrification is enhanced by anaerobic microsites in the surface horizon. Large emission of N2O in the mown grassland was ascribed to enhanced release of carbon compounds from roots, which stimulates denitrification [10,168]. Under intensively managed and heavily fertilized (up to 500 kg N ha-1) grasslands, N2O-N loss per unit of fertilizer N applied can be larger than the 1.25% used for the global emission inventory [58]. Conversion of grassland to wheat field resulted in 8 times higher emission for 18 months and 25-50% higher after 3 years [125]. However, after returning the wheat field to grassland, mean N2O emission rates were similar in both land uses. A modelling study by Mummey et al. [129] using more than 2900 cropland and grassland sites in USA showed that initial conversion of arable agricultural land to no-till resulted in greater N2O in drier regions and similar or less in warm and wet areas compared with conventional tillage. A large proportion of N2O from agricultural soils is emitted during winter. Mosier et al. [125] showed that higher emissions from grassland than from arable fields during winter are due to greater snow accumulation and denitrification events. Disregarding the emission during the off-season period can lead to serious underestimation of the actual annual N2O flux.
3.2. Cultural practices
3.2.1. Effect of tillage on nitrous oxide emissions
Increased N2O emission from no-tilled compared to tilled soil has been reported in number of papers [e.g. 8,81,100,114,129] with maximum difference as much as several fold. This may be due to increased availability of C [136] and a greater contribution from large aggregates [107] with anoxic centres [67,70] and reduced air-filled porosity [7,13] under no-till. However, in experiment of Arah et al. [7] despite consistently higher denitrification rates in not tilled than ploughed soil N2O emissions were very small due to low gas diffusivity in the soil near the surface. No differences in N2O emission were found between conventionally tilled and not tilled soil with a short history of continuous tillage [26].
3.2.2. Effects of soil compaction
The risk of N2O emissions increases with soil compaction. Accumulated denitrify-cations during 75 days from wheeled and unwheeled wheat field were 3-5 kg N ha-1 (40-67 g N ha-1 day-1) and 15-20 kg N ha-1 (200 -267 g N ha-1 day-1), respectively [9]
16
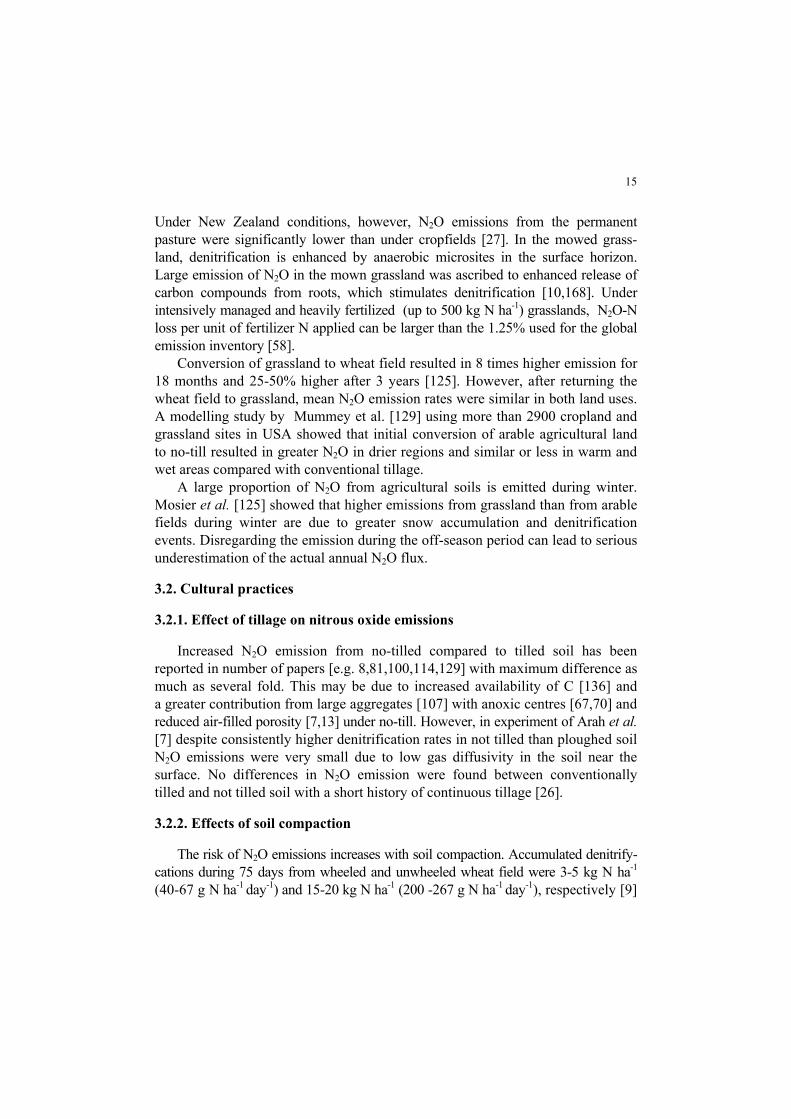
and from a potato field up to 68% of total N2O release was emitted from the compacted tractor tramlines [152]. N2O emissions in compacted and uncompacted sandy loam corresponded to 5.3 and 3.9% of added NH4NO3-N, respectively [63]. In another study on the same soil, compaction effect was four times higher in the NPK-fertilized treatment compared to the unfertilized one [164]. In general, the increased N2O-N emission from compacted soil was accompanied by greater N2O concentration in the soil air. Enhanced N2O emissions from compacted soil were attributed to increased water filled pore space (WFPS) or reduced air-filled porosity [37,110]. Therefore they were most pronounced after rain events [13,63,68,97] and poorly drained clay soils [166,171]. Another factor, similarly to no-till soil, was increased contribution of large aggregates (>20 mm) [9]. Figure 4 clearly illustrates increasing N2O emissions from compacted potato inter-rows in periods of increased WFPS following precipitation. Increased emission from the ridges in August was attributed to herbicide killing of potato tops.
Fig. 4. N2O fluxes and water-filled pore space (WFPS) during the potato growing period [after 46]
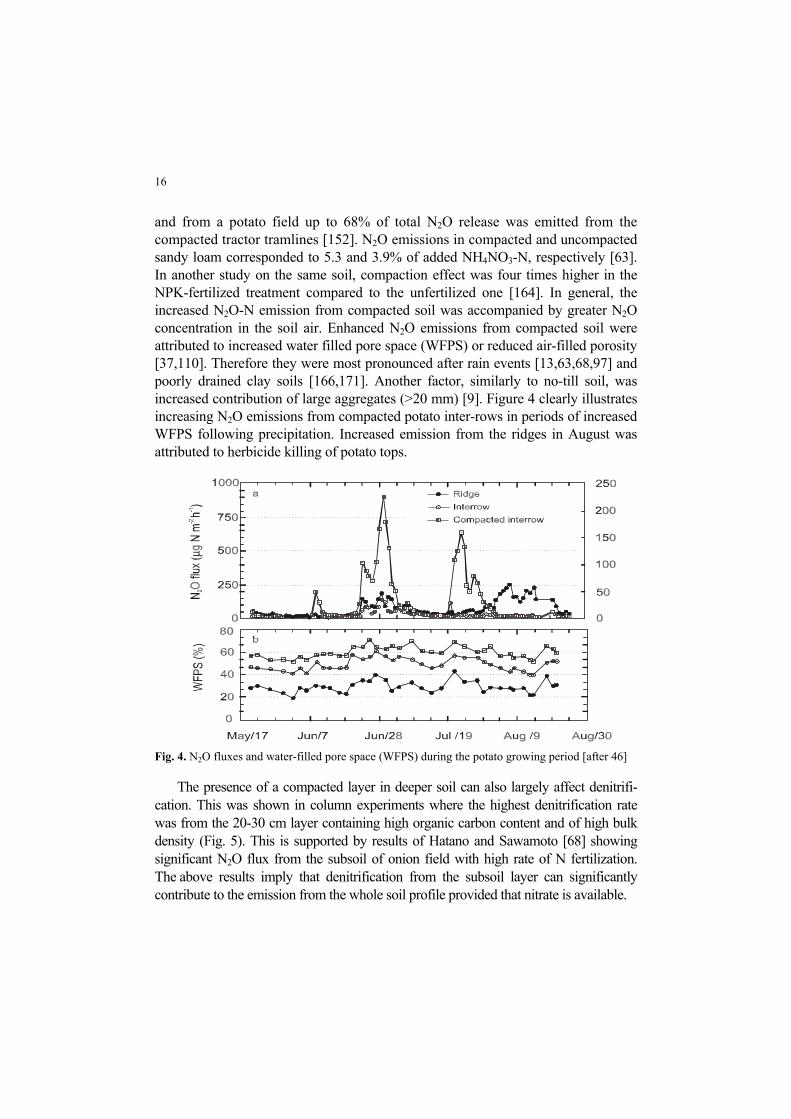
The presence of a compacted layer in deeper soil can also largely affect denitrifi-cation. This was shown in column experiments where the highest denitrification rate was from the 20-30 cm layer containing high organic carbon content and of high bulk density (Fig. 5). This is supported by results of Hatano and Sawamoto [68] showing significant N2O flux from the subsoil of onion field with high rate of N fertilization. The above results imply that denitrification from the subsoil layer can significantly contribute to the emission from the whole soil profile provided that nitrate is available.
17
23 25 28
1.591.21Bulk density (g cm )-3
Soil
dept
h (c
m)
Water content (%,w/w)
a
Water contentBulk density
b
N O-N2
Organic carbon
N O flux (g N ha day )2-1 -1
Total organic carbon (%)
Soil
dept
h (c
m)
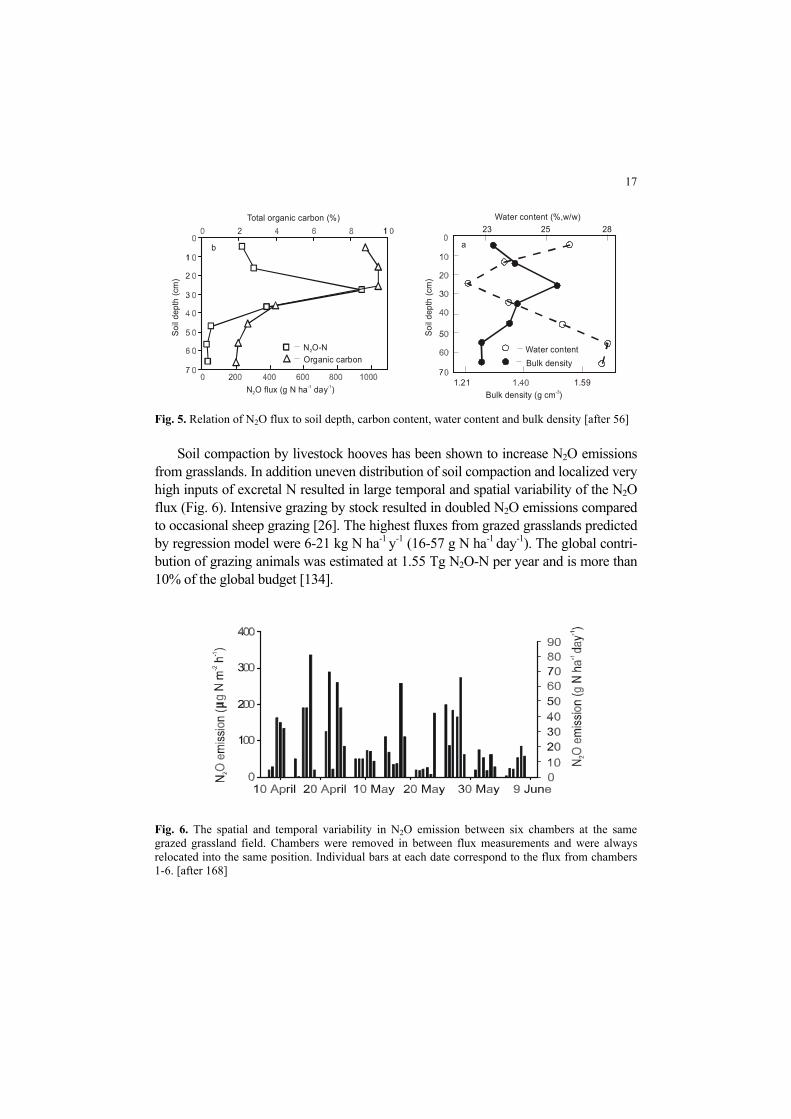
Fig. 5. Relation of N2O flux to soil depth, carbon content, water content and bulk density [after 56] Soil compaction by livestock hooves has been shown to increase N2O emissions from grasslands. In addition uneven distribution of soil compaction and localized very high inputs of excretal N resulted in large temporal and spatial variability of the N2O flux (Fig. 6). Intensive grazing by stock resulted in doubled N2O emissions compared to occasional sheep grazing [26]. The highest fluxes from grazed grasslands predicted by regression model were 6-21 kg N ha-1 y-1 (16-57 g N ha-1 day-1). The global contri-bution of grazing animals was estimated at 1.55 Tg N2O-N per year and is more than 10% of the global budget [134].
Fig. 6. The spatial and temporal variability in N2O emission between six chambers at the same grazed grassland field. Chambers were removed in between flux measurements and were always relocated into the same position. Individual bars at each date correspond to the flux from chambers 1-6. [after 168]
18
3.2.3. Effect of fertilisation on nitrous oxide
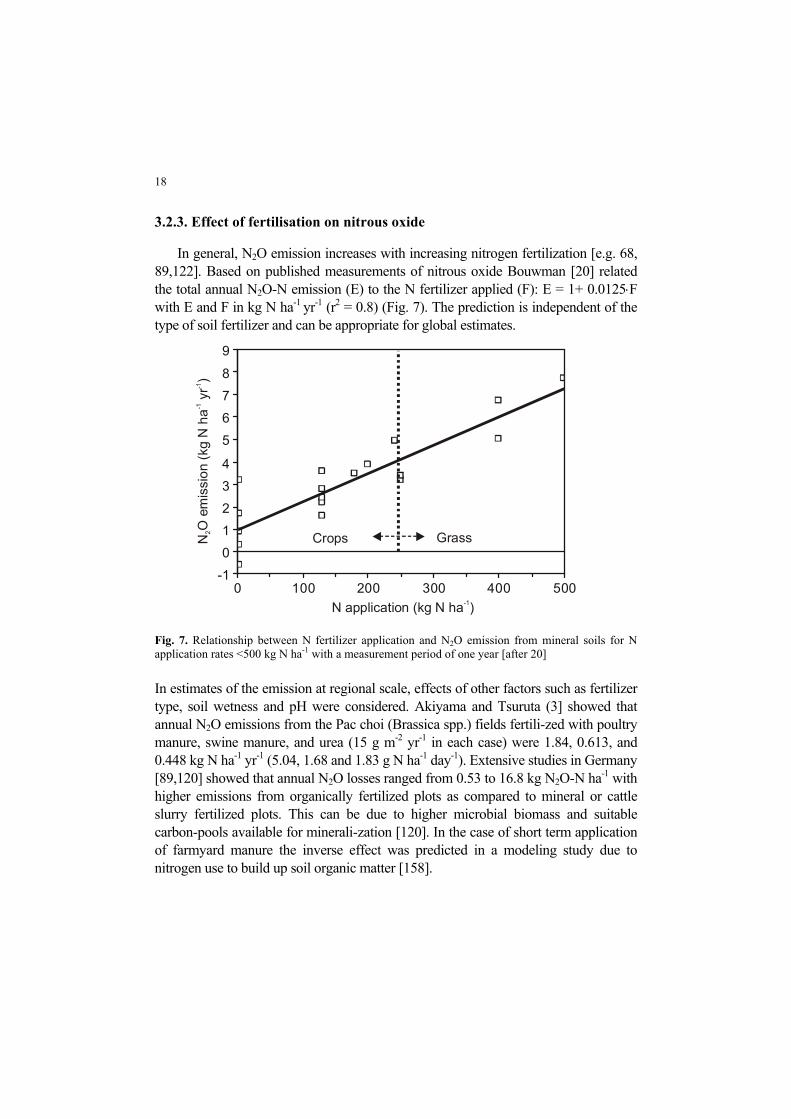
In general, N2O emission increases with increasing nitrogen fertilization [e.g. 68, 89,122]. Based on published measurements of nitrous oxide Bouwman [20] related the total annual N2O-N emission (E) to the N fertilizer applied (F): E = 1+ 0.0125⋅F with E and F in kg N ha-1 yr-1 (r2 = 0.8) (Fig. 7). The prediction is independent of the type of soil fertilizer and can be appropriate for global estimates.
-101234
56789
0 100 200 300 400 500
Crops Grass
N application (kg N ha )-1
NO
em
issi
on (k
g N
ha
yr
)2
-1-1
Fig. 7. Relationship between N fertilizer application and N2O emission from mineral soils for N application rates <500 kg N ha-1 with a measurement period of one year [after 20] In estimates of the emission at regional scale, effects of other factors such as fertilizer type, soil wetness and pH were considered. Akiyama and Tsuruta (3] showed that annual N2O emissions from the Pac choi (Brassica spp.) fields fertili-zed with poultry manure, swine manure, and urea (15 g m-2 yr-1 in each case) were 1.84, 0.613, and 0.448 kg N ha-1 yr-1 (5.04, 1.68 and 1.83 g N ha-1 day-1). Extensive studies in Germany [89,120] showed that annual N2O losses ranged from 0.53 to 16.8 kg N2O-N ha-1 with higher emissions from organically fertilized plots as compared to mineral or cattle slurry fertilized plots. This can be due to higher microbial biomass and suitable carbon-pools available for minerali-zation [120]. In the case of short term application of farmyard manure the inverse effect was predicted in a modeling study due to nitrogen use to build up soil organic matter [158].
19
Major effects of fertilization on N2O emission were frequently observed in wet soil following rainfall or irrigation and this effect was mostly pronounced during the days immediately following fertilizer application [81,160,182]. For example soil fertilized with urea emitted during 120 days the highest amount of N2O (1903 µg N2O-N kg-1 soil) at field water capacity while that with NH4NO3 gave the highest emission (4843 µg N2O-N kg-1 soil) when flooded [137]. In rice fields N2O emission can be substantially reduced, down to less than 0.1% of the applied nitrogen, by applying fertilizer after rather than before flooding and thereby reducing a source of N2O during wetting and drying cycles before permanent flooding [54]. Nitrous oxide emissions from unfertilized tropical sites were typically higher than those in temperate sites whereas those from fertilized sites were within the range for fertilized temperate sites [122]. In fertilized tropical grasslands the N2O emission was almost three times greater from a Vertisol (130 µg N m-2 hr-1 or 31 g N ha-1 day-1) than from an Ultisol and Oxisol (46 µg N m-2 hr-1 or 11 g N ha-1 day-1) [122]. However, there was no significant difference across soils when they were not fertilized. In cooler climates the greatest N2O fluxes occurring in association with freeze-thaw in spring may be minimized by applying N fertilizer and incorporating straw [64]. An important soil factor associated with N fertilization is pH. Tokuda and Hayatsu [183] reported that the application of more than 1 kg N ha-1 yr-1 of nitrogen fertilizer significantly enhanced the N2O emission potential of acidic tea fields where a negative exponential relationship was found between the soil pH value and N2O emission. Substantial reduction of N2O emissions was observed when acid soils were both limed and fertilized [123].
3.2.4. Effects of crop type and rotations
The proportion of N-fertilizer released as N2O depends on the type of crop, due to differences in growth and development, as well as crop rotation and crop residue management [81,87,88]. The N2O emission during the growing season of cereals ranged from one to several percent depending on crop type and experimental conditions [86,97,208]. In general, the emission can be reduced in an actively growing crop and associated quicker nitrogen uptake [13,189]. For this reason Kusa et al. [97] revealed that about 70% of the annual emission occurred near harvesting of onions. N2O emission in a continuous cropping was higher for corn than for soybean [81,114] or alfalfa [114] which implies that legumes would reduce N2O emission. However, in other study [54] legumes contributed in the emission due to denitri-fying of nitrogen fixed by symbiotically living Rhizobia in root nodules.
20
3.2.5. Spatial and temporal variation of nitrous oxide emissions
Spatial distribution of zones with different potential of N2O emission occurs in the scale of soil aggregates and of bulk soil. Using combined N2O and O2
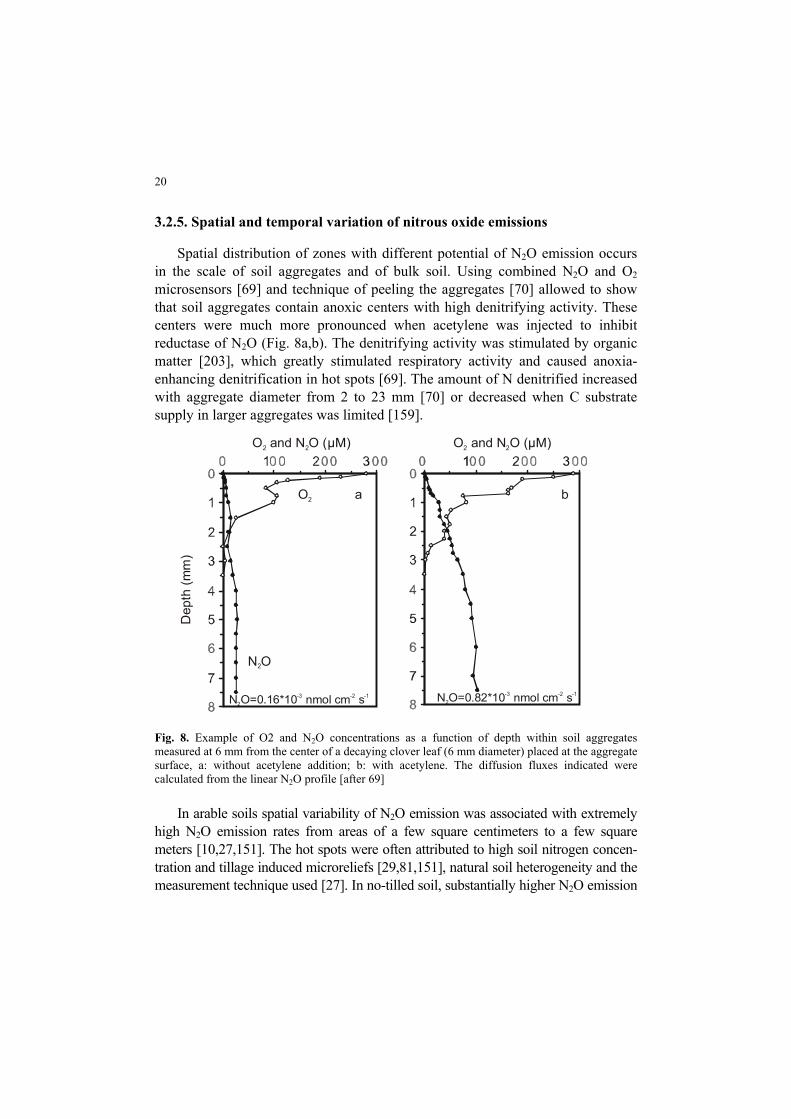
microsensors [69] and technique of peeling the aggregates [70] allowed to show that soil aggregates contain anoxic centers with high denitrifying activity. These centers were much more pronounced when acetylene was injected to inhibit reductase of N2O (Fig. 8a,b). The denitrifying activity was stimulated by organic matter [203], which greatly stimulated respiratory activity and caused anoxia-enhancing denitrification in hot spots [69]. The amount of N denitrified increased with aggregate diameter from 2 to 23 mm [70] or decreased when C substrate supply in larger aggregates was limited [159].
O2
N O2
Dep
th (m
m)
N O=0.16*10 nmol cm s2-3 -2 -1 N O=0.82*10 nmol cm s2
-3 -2 -1
a b
O and N O (2 2 µM) O and N O (2 2 µM)
Fig. 8. Example of O2 and N2O concentrations as a function of depth within soil aggregates measured at 6 mm from the center of a decaying clover leaf (6 mm diameter) placed at the aggregate surface, a: without acetylene addition; b: with acetylene. The diffusion fluxes indicated were calculated from the linear N2O profile [after 69] In arable soils spatial variability of N2O emission was associated with extremely high N2O emission rates from areas of a few square centimeters to a few square meters [10,27,151]. The hot spots were often attributed to high soil nitrogen concen-tration and tillage induced microreliefs [29,81,151], natural soil heterogeneity and the measurement technique used [27]. In no-tilled soil, substantially higher N2O emission
21
was recorded from soil enclosing a drill slit (458 µg N m-2 h-1 or 110 g N ha-1 day-1) than between slits (207 µg N m-2 h-1 or 49 g N ha-1 day-1) [13]. High local N2O fluxes can coincide with wet depression in the ground. Ambus and Christensen [5] reported that patterns of N2O flux at the scale beyond 7 m was controlled by soil moisture variability due to ground topography and at the scale below 1 m – by a patchy distribution of denitrifying microsites. Uneven N2O flux can be also induced by earthworm casts that produce several times more nitrous oxide than bulk soil [40]. Knowledge of the small-scale spatial variability helps improve estimates of the emissions over a larger scale [128]. For repre-sentative N2O loss estimation, Röver et al. [151] suggested measurements with a distan-ce of 1 m between sampling points. However, Yanai et al. [211] showed that by combining principal component analysis with geostatistics, a map of predicted N2O fluxes based on soil properties closely matched the spatial pattern of N2O fluxes which was measured in 10 m by 10 m grids in an onion field. The N2O fluxes were highly variable with an average of 331 µg N m-2 h-1 (79.4 g ha-1 day-1) and CV of 217%. A spatial patterns of N2O fluxes often persists for short time and diurnal changes are largely influenced by cycles in soil temperature [27,170,197] and rainfall and irrigation events through the effects on air-filled porosity [173]. In northern areas with freezing/thawing cycles, approximately half of the annual N2O emission occurs during winter and at thawing [89,115,181]. This effect is relatively high in farmed organic soils [143] and is enhanced by manure application and crop residue incorporation [87,88,150,189]. Peak emissions during soil thawing were explained by the physical release of trapped N2O and/or enhanced denitrification with increasing temperature in the very wet soil [181]. In some other studies, however, fluxes during winter and other periods were comparable [86,197].
3.2.6. Main soil factors affecting nitrous oxide emissions
Studies conducted in more controlled conditions revealed that soil moisture, temperature and availability of and are the most important factors regulating the N
+4NH -
3NO2O emissions.
The effect of soil moisture was well demonstrated in Australia where the emi-ssions were <20 µg N2O-N m-2 h-1 (< 4.8 g N2O-N ha-1 day-1) in dry seasons and from 80 to 242 µg N2O-N m-2 h-1 (19.2 to 58.1 g N2O-N ha-1 day-1) in wetter seasons [94]. With rice, high N2O emission occurred when upland was converted to flooded fields [205,210]. The emission from flooded field was mostly through the rice plants (87%), while in the absence of floodwater – mainly through the soil surface. Water filled pore space (WFPS), which includes differences in bulk density and particle density has often been used to characterize soil moisture conditions
22
[e.g. 10,168,180]. In general, N2O emissions were positively correlated with changes in WFPS up to 50-60% [94] and largely increased at WFPS >60% [107,160,170,182]. Many authors [e.g. 97,170] reported positive relation between N2O emission and temperature. This relation was enhanced at high WFPS (Q10 = 5) [169]. Other important factors influencing N2O emission include soil organic carbon [168,202,203], acidity [14,183] texture [57] and redox potential [80,173,201]. Włodarczyk et al. [202] reported that N2O emission was about 4 times in organic (peaty-muck) than mineral sandy soil.
4. METHANE
The main land use contributors to the atmospheric methane concentration implicating global warming are cultivated wetlands (rice fields) and natural wetlands [104]. Global estimates of annual CH4 emission from rice fields is 100 Tg. Methane is produced in the anaerobic zones through fermentation by methanogenic bacteria (domain Archea). Its transfer from the soil to the atmosphere occurs mostly through aquatic plants, but also by diffusion and as bubbles escaping from the wetland soils [104,130]. In the aerobic zones of wetland and upland soils metha-notrophic bacteria using CH4 as only a C and energy source can oxidize it to CO2. Soil management may account for 20% of overall CH4 emissions [130].
4.1. Land use
4.1.1. Wetlands
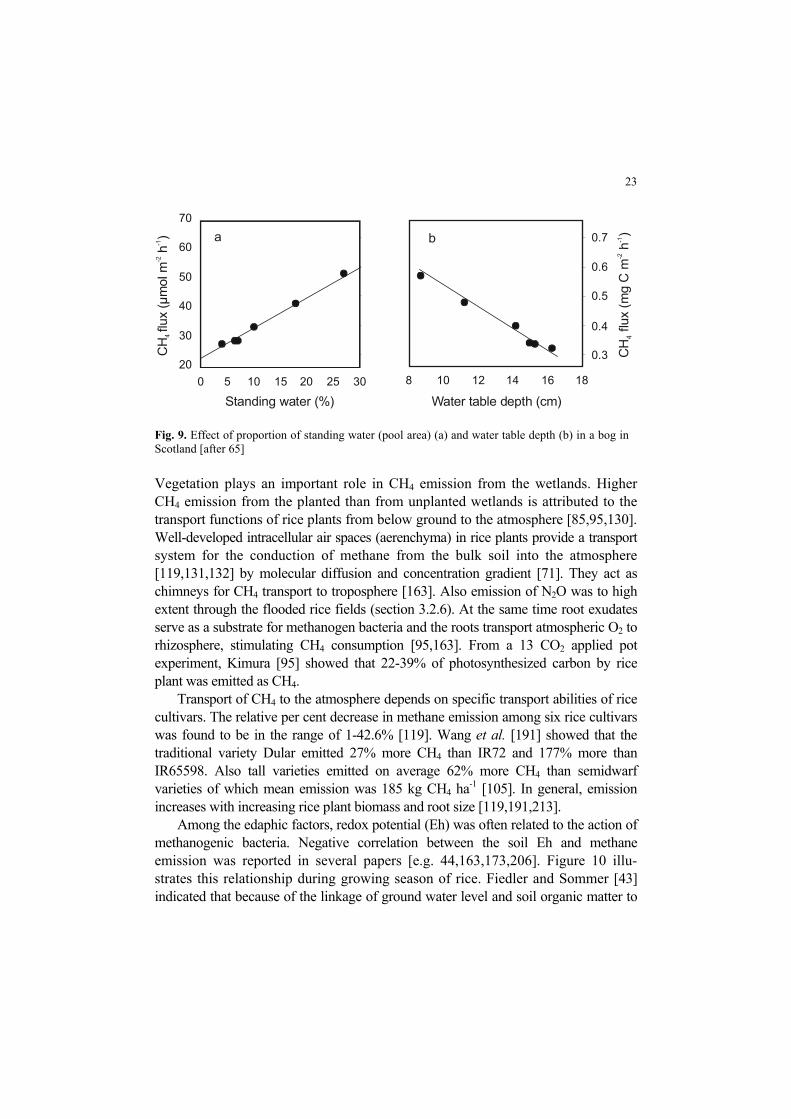
Methane emissions from peat wetlands have been shown to be very sensitive to soil temperature, the extent of standing water and the depth to the water table (Fig. 9), factors that determine the anoxic and unsaturated zones of CH4 production and consumption. The mean methane emission approximately doubled with tem-perature in the range 7-11oC. A similar increase was observed in diffusion of methane when the temperature around roots in hydroponic culture increased from 15 to 30oC [71]. Adding annual soil temperature sum in a multiple regression model significantly accounted for a significant factor of variance of methane emission from a boreal mixed mire in northern Sweden [59].
23
20
30
40
50
60
70
0 5 10 15 20 25 30 8 10 12 14 16 18
a b
Water table depth (cm)Standing water (%)
0.3
0.4
0.5
0.6
0.7
CH
flux
(mg
C m
h)
4-2
-1
CH
flux
(4
µmol
m h
)-2
-1
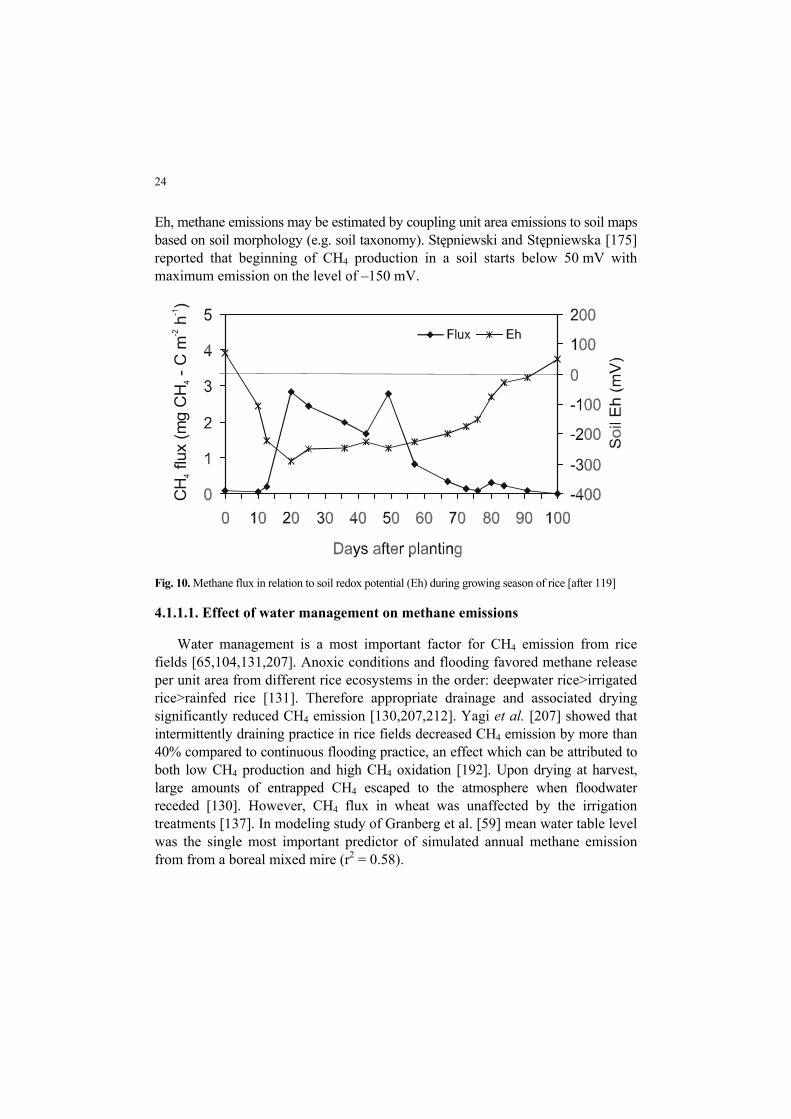
Fig. 9. Effect of proportion of standing water (pool area) (a) and water table depth (b) in a bog in Scotland [after 65] Vegetation plays an important role in CH4 emission from the wetlands. Higher CH4 emission from the planted than from unplanted wetlands is attributed to the transport functions of rice plants from below ground to the atmosphere [85,95,130]. Well-developed intracellular air spaces (aerenchyma) in rice plants provide a transport system for the conduction of methane from the bulk soil into the atmosphere [119,131,132] by molecular diffusion and concentration gradient [71]. They act as chimneys for CH4 transport to troposphere [163]. Also emission of N2O was to high extent through the flooded rice fields (section 3.2.6). At the same time root exudates serve as a substrate for methanogen bacteria and the roots transport atmospheric O2 to rhizosphere, stimulating CH4 consumption [95,163]. From a 13 CO2 applied pot experiment, Kimura [95] showed that 22-39% of photosynthesized carbon by rice plant was emitted as CH4. Transport of CH4 to the atmosphere depends on specific transport abilities of rice cultivars. The relative per cent decrease in methane emission among six rice cultivars was found to be in the range of 1-42.6% [119]. Wang et al. [191] showed that the traditional variety Dular emitted 27% more CH4 than IR72 and 177% more than IR65598. Also tall varieties emitted on average 62% more CH4 than semidwarf varieties of which mean emission was 185 kg CH4 ha-1 [105]. In general, emission increases with increasing rice plant biomass and root size [119,191,213]. Among the edaphic factors, redox potential (Eh) was often related to the action of methanogenic bacteria. Negative correlation between the soil Eh and methane emission was reported in several papers [e.g. 44,163,173,206]. Figure 10 illu-strates this relationship during growing season of rice. Fiedler and Sommer [43] indicated that because of the linkage of ground water level and soil organic matter to
24
Eh, methane emissions may be estimated by coupling unit area emissions to soil maps based on soil morphology (e.g. soil taxonomy). Stępniewski and Stępniewska [175] reported that beginning of CH4 production in a soil starts below 50 mV with maximum emission on the level of –150 mV.
CH
flux
(mg
C- C
m h
)4
4
H-2
-1
Fig. 10. Methane flux in relation to soil redox potential (Eh) during growing season of rice [after 119]
4.1.1.1. Effect of water management on methane emissions
Water management is a most important factor for CH4 emission from rice fields [65,104,131,207]. Anoxic conditions and flooding favored methane release per unit area from different rice ecosystems in the order: deepwater rice>irrigated rice>rainfed rice [131]. Therefore appropriate drainage and associated drying significantly reduced CH4 emission [130,207,212]. Yagi et al. [207] showed that intermittently draining practice in rice fields decreased CH4 emission by more than 40% compared to continuous flooding practice, an effect which can be attributed to both low CH4 production and high CH4 oxidation [192]. Upon drying at harvest, large amounts of entrapped CH4 escaped to the atmosphere when floodwater receded [130]. However, CH4 flux in wheat was unaffected by the irrigation treatments [137]. In modeling study of Granberg et al. [59] mean water table level was the single most important predictor of simulated annual methane emission from from a boreal mixed mire (r2 = 0.58).
25
4.1.2. Upland soils
In general, dry and aerated soils act as sinks for atmospheric CH4. Numerous studies indicated that higher absorption potential occurs in forest or woodland than other land uses such as grasslands [76,123,186,198], cultivated soils [36,76, 113,197], moorland [113] set aside land [36]. Summary of results obtained in 27 studies under temperate climatic conditions made by Hütsch [76] indicate that the ranges in oxidation rates in mg CH4 m-2 day-1 were 0-1.03, 0.03-1.16 and 0-6.9 (or 0-0.03, 0.0009-0.036, 0-0.22 mg C m-2 h-1) for arable soils, grasslands and forest soils, respectively. Atmospheric CH4 oxidation potentials in forest soils exceeded production potentials by up to 10-220 times [21]. There was not significant diffe-rence in CH4 uptake between bare soil and soil cropped with onion [73].
0
10
20
30
Tem
pera
ture
(o C)
Date
20
40
60
80
100
WFP
S (%
)
UD = below detection.
.
.
Jun 9 Jul 21 Sep 18 Oct 27 Nov 16
a
b
c
CH
flux
(mg
C m
h)
4-2
-1
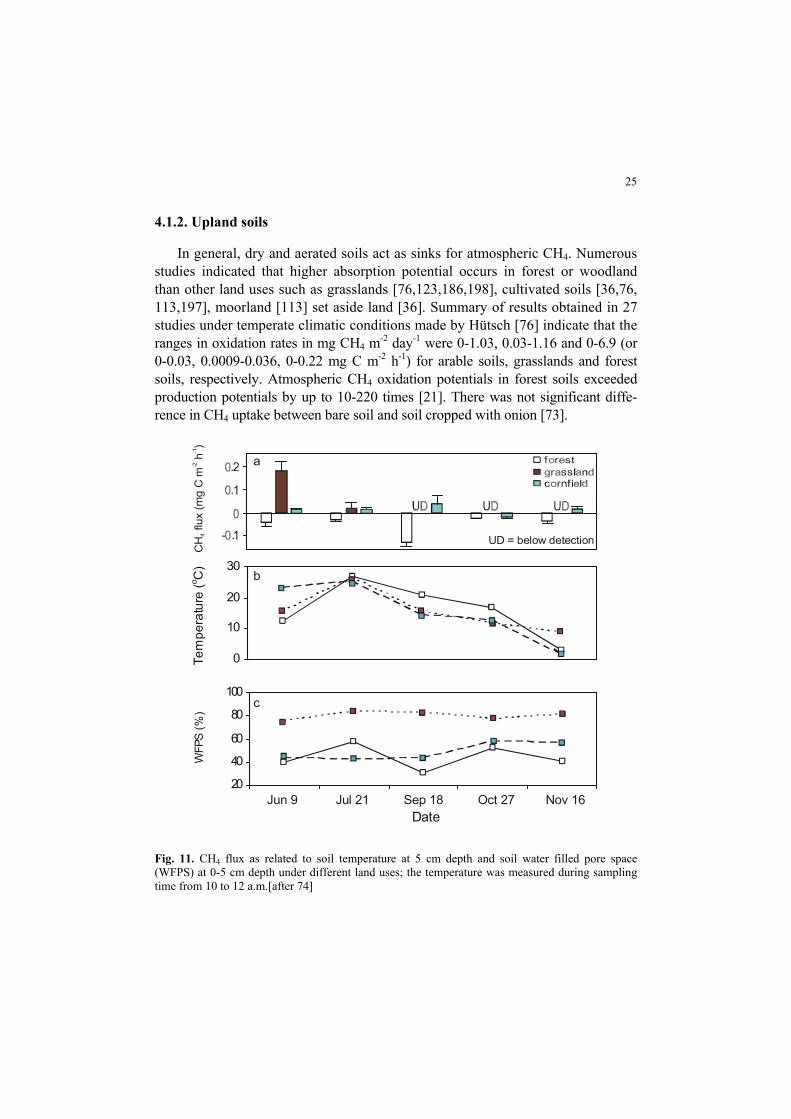
Fig. 11. CH4 flux as related to soil temperature at 5 cm depth and soil water filled pore space (WFPS) at 0-5 cm depth under different land uses; the temperature was measured during sampling time from 10 to 12 a.m.[after 74]
26
Frequently, methane oxidation by aerobic upland soils is low (< 0.1 mg CH4 m-2 h-1 or <0.075 mg C m-2 h-1) relative to its emission in wetlands (approximately 10 g CH4 m-2 h-1 or 7.5 g C m-2 h-1) [73,104]. Measurements on several occasions during the year in Hokkaido (Japan) showed that CH4 was emitted from grassland, absorbed and emitted from cornfield and absorbed by soil under forest (Fig. 11). Tropical ecosystems play an important role in the production [186] and uptake [42,125,186] of atmospheric methane. In the course of one year, fertilized tropical pastures showed net CH4 uptake (−0.34 mg CH4 m−2 day−1 or –0.011 mg C m-2 h-1) while traditional and legume pastures displayed net CH4 emissions (+0.69 and +0.92 mg CH4 m−2 day−1 or +0.022 and + 0.029 mg C m-2 h-1) [186]. In other tropical sites pasture soils showed a net emission even during the dry season [42]. In the tropics the CH4 uptake rates for forests were 10-fold higher than those from forage production sites [122]. The uptake rate of CH4 did not appear to be related to any single variable. It was mostly ascribed to high relative gas diffusivity D/Do, air-filled pore space in the uppermost soil horizons [21,22,74,176] and air permeability [11]. This was due to enhanced gas exchange and favored development of methanotrophs that use methane as energy while oxidizing it to CO2. In addition the CH4 oxidation rate was negatively correlated with soil moisture content [36,42,161] and bulk density [113] that affect gas diffusion coefficient and air-filled porosity.
4.1.3. Effect of fertilization on methane exchange
Nitrogen fertilization either has no affect [e.g. 75,76] or reduces absorption and oxidation of CH4 by the soil [e.g. 73,126,152]. The inhibitory effect of N inputs can be due to decreased soil oxygen content in organic matter reach sites that easily become anoxic [162] and increased population of nitrifies at the expense of methanotrophs [77,78]. Evidence for latter mechanism was supported by higher nitrate content in fertilized than unfertilized soil cropped with onion [73]. In addition, nitrogen fertilization enhances soil acidification and this may decrease CH4 oxidizing activity [76]. Ruser et al. [152] reported that the annual CH4 uptake was 140 and 118 kg C ha-1 (or 1.5 and 1.3 mg C m-2 h-1) for low (50 kg N ha-1) and high (150 kg N ha-1) levels of fertilization, respectively. Fertili-zer addition had a small negative effect on CH4 uptake in the Vertisol, tended to enhance CH4 uptake in the Ultisol and significantly decreased CH4 uptake in the Oxisol in the tropics. In highly N-fertilized onion-cultivated soil, Sawamoto et al. [156] observed that large part (58% of direct emission) of the CH4 was emitted indirectly through the subsurface drainage after leaching and dissolving [122].
27
Usually atmospheric CH4 oxidation is reduced more by ammonium and urea fertilizer than nitrate [104,186,212] and by potassium nitrate than ammonium sulphate [108]. The negative effect of urea can be alleviated by its subsurface application in ploughed soils where atmospheric CH4 uptake will not be hampered too much whereas on no-till soils urea should be avoided because of the highest CH4 oxidizing potential at 5-15 cm depth [76]. Exogenous organic matter (OM) influences methane production. Addition of organic matter to flooded soil resulted in a several times increase of CH4 emission relative to plots with mineral fertilizers [e.g.130,138,161]. The difference of the effect by addition of rice straw compared to urea was most pronounced two months after transplanting [130]. In another study [33] addition of OM resulted in 3-12 times higher CH4 emission with largest emissions when OM was added deeper in the soil. The distribution of fresh organic material activating methano-genic activity was the most dominant factor for the microscale (1 cm) spatial variation in CH4 production [190]. Combined use of inorganic N and organic manure increased the CH4 emission from saturated rice soil to 172% compared to application of the entire amount of N through urea [138] and reduced its consumption from dryland rice field [161]. However, in the case of unflooded arable soils long-term farmyard manure application inhibited CH4 oxidation less than application of the same amount of N as mineral fertilizer [76]. This effect was attributed with population of methanotrophic bacteria.
4.1.4. Effect of tillage and compaction on methane exchange
Some studies showed that methane oxidation potential of upland soils may best be preserved by no-tillage [13,76,93,104] because soil tillage disturbs methane-oxidising microorganisms by disrupting soil structure and releasing soil-entrapped methane. In some tropical soils, however, cultivation had little effect on soil methane uptake [90,124]. Transplanting 30-d-old rice seedlings, direct seeding on wet soil and direct seeding on dry soil reduced CH4 emission by 5%, 13% and 37%, respectively, when compared with transplanting 8-d-old seedlings [96]. In the case of organic amendment, fall plowing compared with spring plowing was a more effective way of mitigating CH4 emission from rice fields. An important factor affecting methane oxidation and emission is soil com-paction [104,152]. In a potato-cropped field, the ridge soil and the uncom-pacted inter-row soil had mean CH4-C oxidation rates of 3.8 and 0.8 µg m-2 h-1 (0.0038 and 0.0008 g CH4-C m-2 h-1), respectively, [152]. However the tractor-compacted soil in this study emitted CH4-C at 2.1 µg m-2 h-1 (0.0021 g CH4-C m-2 h-1) due to anaerobic condition. Similar response was observed by Flessa et al. [46].
28
5. NITRIC OXIDE
Nitric oxide is produced in soils as a result of microbial activity through the processes of nitrification. NO emission to the lower troposphere leads to an increase in the concentration of photochemical oxidants, particularly O3, which adversely affects human health, animals, and plants [e.g. 121,141] and reduces the CH4 sink. It also reacts with water vapor to form nitric acid and nitrous acids, which acidify precipitation and increase N deposition [55,169,172]. Production and emission of NO are mostly controlled by environmental variables such as inorganic nitrogen availability, soil water content and soil temperature. Land use and cultural practices largely influence these variables.
5.1. Effect of land use and soil tillage on nitric oxide emissions
The effect of land use on nitric oxide emissions has not been intensively studied. From the review of Skiba et al. [167] nitric oxide emissions are relatively high in pastures and considerably higher than in forests. Under cropping systems the rate of NO emission is greater for crops with higher fertilizer requirements (e.g. maize vs. wheat). In tropical climate of Costa Rica NO emissions were several times greater in young pastures but lower in older pastures than in mature forests [91,187]. Tillage, in general, stimulates NO emissions, both in temperate and tropical soils. Skiba et al. [167] reported that conventional tillage and green manure incorporation are likely to increase NO emissions by a factor of 2 to 7 for mostly periods of 1 to 3 weeks compared to untilled soil. This was confirmed by more recent studies [28] where NO emission during summer on Maryland’s Eastern Shore from an untilled field of 1.2 ng N m-2 s-1 was significantly lower than from a tilled field (8.6 ng N m-2 s-1). This effect was attributed to an increased amount of soil exposed in the tilled field allowing easier physical transfer of NO out of the soil. These suggest that minimum cultivation strategies can significantly reduce NO emission. Analysis of data from various sites showed that on average tillage is likely responsible for emission 0.5 kg NO-N ha-1 y-1 (0.0016 ng NO-N m-2 s-1) [167].
5.2. Effects of soil physical properties on nitric oxide emissions
Soil water as characterized by the water filled pore space (WFPS) is of critical importance to NO production and transport to the troposphere [141,167,178,179]. The threshold WFPS between water-limited (<60%) and oxygen-limited micro-bial processes or limited escape of NO to the atmosphere seems to be 60% in
29
various soils [25,167]. This value was lower (about 43%) under controlled wetting in laboratory conditions. Peirce and Aneja [141] reported that more than 42% of the total NO flux comes from the top 1 cm of soil, with NO contributions decreasing exponentially with soil depth and very little from soil at a depth of 20 cm or greater. Tabachow et al. [179] showed that soils with increasing WFPS (3-40%) and temperature (15-28oC) generally produce greater quantities of NO. Skiba et al. [167] reported that soil temperature and soil concentration accounted for 60% of the variability in the NO emission, for a range of agricu-ltural and seminatural soils. In dry soils of different climates, however, NO flux was inhibited and had no relationship with temperature [167,178].
-3NO
These two physical parameters and soil nitrogen content are considered to have a reasonably consistent relationship with NO flux and were used as variables in modeling approaches [149,178]. One factor limiting accurate estimates of NO emission is high variability, incorporating the spatial and temporal effects of management practices could increase performance of computer modeling [6,61].
5.3. Effect of fertilization on nitric oxide emissions
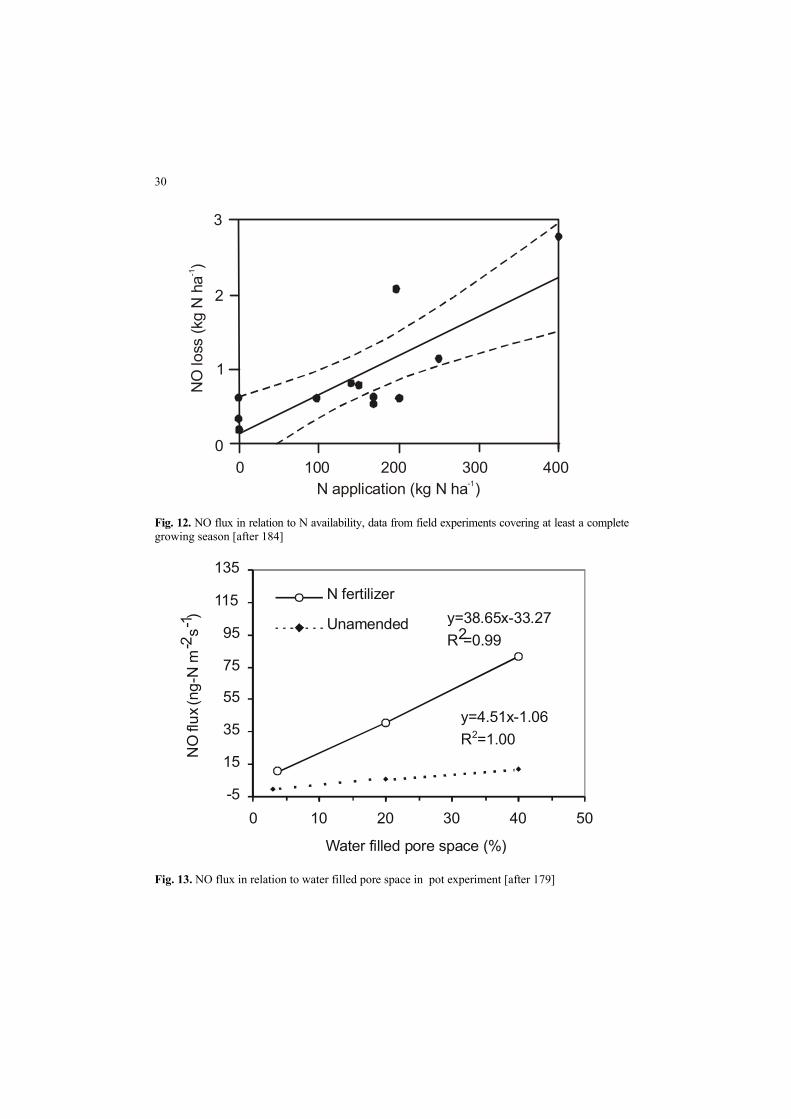
From two comprehensive reviews results that fertilizer-induced nitric oxide emissions vary in a wide range from 0.003 to 11% of applied nitrogen (0-800 kg) [167,184] and average emissions (0.3-0.5%) were several times lower than the 2.5% used in modeling prediction of global NO emission by Yienger and Levy, quoted by Skiba et al. [167]. Using the data from field experiments covering at least a complete growing season and without legumes providing symbiotic nitrogen, Veldkamp and Keller [184] obtained a linear relation between rate of N application and NO emission (Fig. 12). Despite significance of the relationship the authors pointed out that care should be taken in extrapolating these results due to high uncertainty (R2 = 0.64) associated with a variety of fertilizer types, soils, and climate conditions. based fertilizers and urea caused often larger losses of NO than based fertilizers and the losses were more variable in tropical than temperate systems [167,184].
+4NH
-3NO
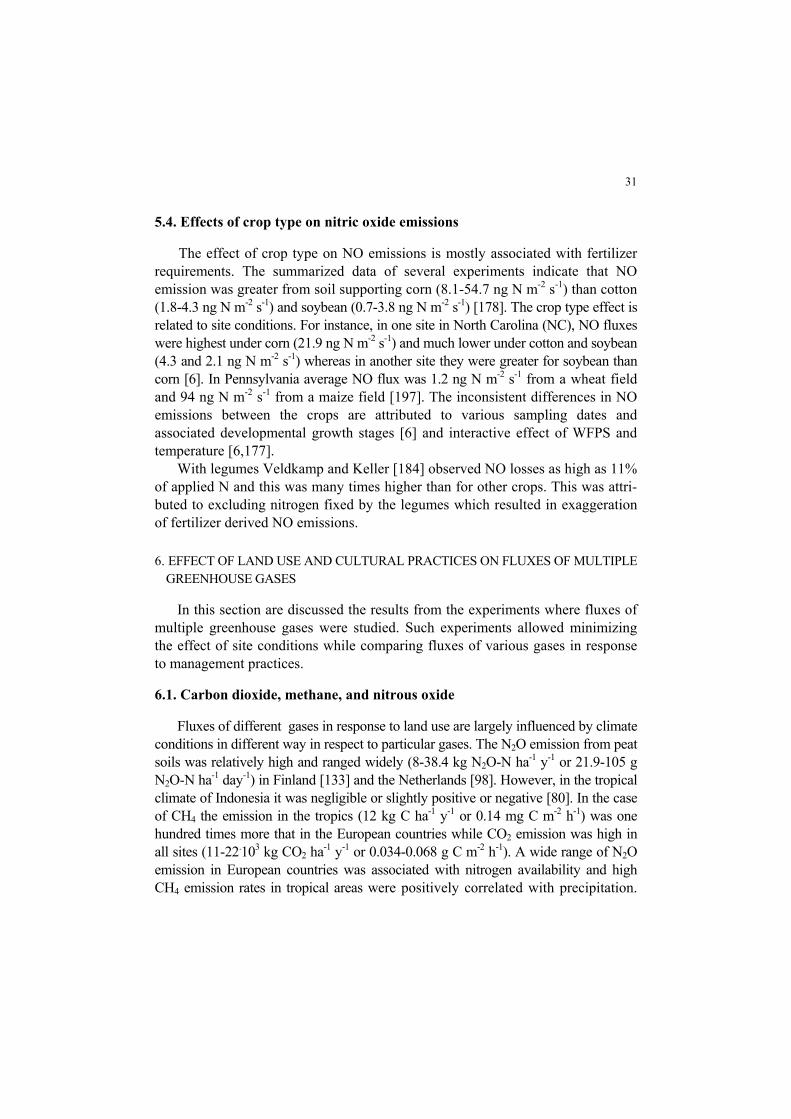
The effect of increasing N fertilization on NO fluxes can be enhanced by water filled pore space [6,105,179]. Figure 13 illustrates these effects on N fertilizer amen-ded and on unamended soils. The trends in NO flux with moisture may change due to interactive effects of fertilization, soil parameters and crop development [6,105]. By thorough analysis processes that produce and regulate NO emissions, Skiba et al. [167] identified viable mitigation strategies of increasing fertilizer use efficiency with consideration of N availability and plant demand, selection of appropriate fertilizer type and cultivation, use of nitrification and urease inhibitors and their environmental and economic effects.
30
N application (kg N ha )-1
0 100 200 300 400
NO
loss
(kg
N h
a)
-1
3
2
1
0
Fig. 12. NO flux in relation to N availability, data from field experiments covering at least a complete growing season [after 184]
Fig. 13. NO flux in relation to water filled pore space in pot experiment [after 179]
-5
15
35
55
75
95
115
135
0 10 20 30 40 5
Water filled pore space (%)
NO
flux(
ng-N
m-2
s-1 )
N fertilizer
Unamended y=38.65x-33.27R2=0.99
y=4.51x-1.06R2=1.00
0
31
5.4. Effects of crop type on nitric oxide emissions
The effect of crop type on NO emissions is mostly associated with fertilizer requirements. The summarized data of several experiments indicate that NO emission was greater from soil supporting corn (8.1-54.7 ng N m-2 s-1) than cotton (1.8-4.3 ng N m-2 s-1) and soybean (0.7-3.8 ng N m-2 s-1) [178]. The crop type effect is related to site conditions. For instance, in one site in North Carolina (NC), NO fluxes were highest under corn (21.9 ng N m-2 s-1) and much lower under cotton and soybean (4.3 and 2.1 ng N m-2 s-1) whereas in another site they were greater for soybean than corn [6]. In Pennsylvania average NO flux was 1.2 ng N m-2 s-1 from a wheat field and 94 ng N m-2 s-1 from a maize field [197]. The inconsistent differences in NO emissions between the crops are attributed to various sampling dates and associated developmental growth stages [6] and interactive effect of WFPS and temperature [6,177]. With legumes Veldkamp and Keller [184] observed NO losses as high as 11% of applied N and this was many times higher than for other crops. This was attri-buted to excluding nitrogen fixed by the legumes which resulted in exaggeration of fertilizer derived NO emissions.
6. EFFECT OF LAND USE AND CULTURAL PRACTICES ON FLUXES OF MULTIPLE GREENHOUSE GASES
In this section are discussed the results from the experiments where fluxes of multiple greenhouse gases were studied. Such experiments allowed minimizing the effect of site conditions while comparing fluxes of various gases in response to management practices.
6.1. Carbon dioxide, methane, and nitrous oxide
Fluxes of different gases in response to land use are largely influenced by climate conditions in different way in respect to particular gases. The N2O emission from peat soils was relatively high and ranged widely (8-38.4 kg N2O-N ha-1 y-1 or 21.9-105 g N2O-N ha-1 day-1) in Finland [133] and the Netherlands [98]. However, in the tropical climate of Indonesia it was negligible or slightly positive or negative [80]. In the case of CH4 the emission in the tropics (12 kg C ha-1 y-1 or 0.14 mg C m-2 h-1) was one hundred times more that in the European countries while CO2 emission was high in all sites (11-22.103 kg CO2 ha-1 y-1 or 0.034-0.068 g C m-2 h-1). A wide range of N2O emission in European countries was associated with nitrogen availability and high CH4 emission rates in tropical areas were positively correlated with precipitation.
32
Converting tropical forest peatland to paddy field [80] increased annual emissions of CO2 and CH4 by 25% and 58%, respectively, while conversion of secondary forest to upland decreased emissions of these gases by 20% and 50%, respectively. However, no clear effect of the conversions was observed for N2O. Under a cool moist climate in Scotland, periods of low CO2 fluxes and very high N2O fluxes under no-tillage were associated with reduced gas diffusivity and air-filled porosity following heavy rainfall [13]. The authors indicated that ploughing and control of compaction can minimize losses of CO2 and N2O whereas CH4 oxidation may be preserved by no-tillage. In another long term study (25 years) in Germany mean integrated emission of the CO2, CH4 and N2O was 4.2 and 3.0 Mg CO2 equivalents for farm with conventional and organic farming, respectively [45].
6.2. Carbon dioxide and nitrous oxide
Studies in tropical rain forests (Northeast Queensland, Australia) showed that N2O emissions were positively correlated with WFPS up to a threshold of 50-60% in the wet season. However, CO2 emissions were positively correlated with WFPS during the dry season and negatively during the wet season [94]. So these imply that correlation of N2O emissions depends on the range of the WFPS and climate. Under flooding conditions diurnal N2O production was positively correlated diurnal CO2 emission and Corg [201] and the CO2 and N2O ratio in the gases evolved increased curvilinearly with redox potential and decreased with N2O and CO2 production [202].
6.3. Carbon dioxide and methane
Research in the tropics [42] showed that forest and pasture soils released more CO2 during the wet than the dry season whereas forest soil CH4 consumption was three times lower during the wet season. However, pasture soils showed a net emission of CH4 even during the dry season. Similar response of the gases was observed in tropical peat land [80]. In diverse Alaskan soils, maximum CO2 production occurred at maximum water holding capacity (WHC) whereas maximum atmospheric CH4 consumption – at 34% WHC [60]. The relative effect of the fertilization in Carex-dominated peatland was considerably greater on CH4 than CO2 emission [1].
6.4. Nitrous oxide and methane
Combined measurements the exchange of both gases were done mostly in tro-pical soils since they notably contribute to the global soil source of N2O and sink for atmospheric CH4 [122,124,186,214]. Some cultural practices such as mineral
33
fertilization, liming and land-use changes were adopted to reduce N2O emission and increase CH4 uptake. Mineral fertilization was used to mitigate the CH4 emission but this practice led to high N2O emission [185,186,214]. To mitigate emission of the gases it is suggested that N fertilizers should not be applied when WFPS is higher than approximately 75% [185]. Liming an acid Oxisol in the tropical grasslands increased N2O emissions and CH4 consumption [124]. Mosier et al. [124] observed that responses of both gases in the tropics are to some extent similar to those in central England [78]. Conversion of native grasslands to arable land decreased the uptake of atmo-spheric CH4, and increased the emission of N2O [122] and the inverse was true when converting arable land to woodland [12]. Afforestation of arable land is considered more beneficial to greenhouse gas exchange than conversion to orga-nic production [12]. CH4 and N2O emissions were strongly correlated with changes in soil redox potential in paddy ricefields [72]. However, significant CH4 emission occurred only at a soil redox potential of < – 100 mv, while the emission of N2O was not significant at potential >+200 mv. The results imply the possibility of using management practices to maintain the redox potential in a range where both N2O and CH4 emissions are relatively low.
6.5. Nitrous oxide and nitric oxide
Emission of both gases is largely influenced by soil conditions. In general, while N2O emissions increased with the moisture content of the soil, NO emissions decreased with increasing soil moisture and rainfall [66,118]. In the UK the annual NO flux (0.79 kg N ha−1 or 0.0025 ng NO-N m–2 s–1) was approximately half the corresponding N2O (1.42 kg N ha−1 or 3.9 g N ha−1 day−1) [66]. In the conceptual model ‘hole in the pipe’ of gaseous N loss [44] the relative amount of N2O or NO that leaks from the pipe is mostly determined by soil water content that together with other factors determines relative rates of nitrification and denitrification. Based on the linear relationship between NO plus N2O emissions and N availability and that between N2O and NO ratio and % WFPS, Verchot et al. [187] developed formulae to predict N2O and NO release, respectively. Predictions by the model agreed well with observed fluxes in different sites suggesting its applicability at a broader scale. The release of both gases were positively correlated to temperature with Q10 values of 3.1 for N2O and 8.7 for NO between 5-30°C [2]. Mean fluxes of N2O decreased appreciably with increasing acidity, while those of NO showed little dependence on pH, with the highest mean flux from the plot at pH 5.9 [209]. N2O emissions were greatest in the finer-textured soils, whereas NO emissions were greater – in the coarser-textured soils [118].
34
7. FUTURE TRENDS
Further studies are required to determine the seasonal effects of different land uses, cultural practices and type of vegetation on determining of soils are a sink or source of atmospheric carbon. To obtain accurate estimates of annual CO2 fluxes in northern regions further research concerning the fluxes during dormant season and periods following wetting and thawing are needed. Additional research are required to quantify the effects of fertilization on N2O and NO formation and emission in relation with land use and cultural practices and fertilizer types. More studies are required to know better the effect of nitrogen fixed by legumes on N2O and NO emission. Better understanding of the effects of land use and cultural practices on rice root exudation and associated growth of methanogenic and methanotrophic bacte-ria and CH4 exchange is needed. There is a large uncertainty in regional and global inventory of greenhouse gas emissions. This motivates the need for better understanding of the spatial and temporal variability of greenhouse gas exchange in relation to management practices. Because most of the annual greenhouse gas losses result from a few maximal fluxes, defining and including these fluxes in a regular sampling schedule could improve the estimates and model predictions. Further studies should also include experiments in which some parameters are controlled. Additional research is required on the effect of soil management on greenhouse gas emissions from deeper soil layers. Research including measurements of multiple gas exchange is needed to weigh beneficial against negative effects of management practices with consideration site-relative importance of particular gases.
8. CONCLUSIONS
1. Land use and cultural practices largely affect greenhouse gas emission through changes in soil physical, chemical and biological properties of soil and crops. These effects depend on type of greenhouse gas and site conditions.
2. CO2 exchange is largely affected by major land uses i.e. cropfield, grassland, forest and woodland. Most variations in the emission is accounted by soil temperature and plant cover. In northern regions whether given soil-plant system is a sink or a source for atmospheric CO2 is mostly dependent on soil CO2 capturing by photo-synthesis and emission during dormant season. The direct effect of tillage on increase in CO2 emission due to reduced resistance to gas transport and elevated temperature is most pronounced during and immediately after tillage. Increased tillage depth and
35
degree of soil disturbance enhance this effect whereas rainfall events diminish this effect. The long-term effect of tillage on CO2 exchange is mostly through the changes in soil organic carbon content and soil structure.
3. Land use, fertilisation, tillage, and crop type largely influence N2O emission. In most cases N2O emission was higher from fertilized grasslands than other land uses (cropfield, forest, woodland). Enhancing effect of nitrogen fertilisation on N2O emission often occurs after rainfall or irrigation. The proportion of N-ferti-lizer released as N2O depends on crop type, crop rotation and crop residue mana-gement. Higher N2O emission from no tilled than tilled soil is ascribed to increased availability of C, greater contribution of larger aggregates with anoxic centres and reduced gas diffusivity and air-filled porosity and greater denitrifying enzyme activity. The effect of soil compaction on the increase in N2O emission is largely related to reduced pore volume and increased contribution of large aggregates. In northern regions peak N2O emissions occur often during winter and at thawing.
4. Wetlands are the largest contributors to atmospheric methane concentra-tion. CH4 emission from wetlands is highly stimulated by addition of organic matter. Water management is the most important factor influencing CH4 emission from ricefields. Drainage of water during the growing season may substantially reduce this emission. The emission from ricefields can be influenced also by pro-perties of rice cultivars and their abilities to transport CH4 to the atmosphere. In upland soils, CH4 is mostly absorbed but can be also emitted depending mostly on air-filled pore space and fertilization. In general CH4 uptake is higher in forests than grasslands cultivated fields. Redox potential (Eh) is the most important edaphic factor determining activity of methanogenic bacteria and absorption of CH4.
5. There is a general trend of increasing NO emission with increasing N-fertilisation and soil water content. When soil water is not limiting NO flux increases exponentially with soil temperature. Interactive effects of fertilisation crop growth and soil parameters result in high temporal variability of NO. Nitric oxide emission can be reduced by application of N-fertilisers at low soil wetness (water filled pore space <20%).
6. Greenhouse gas emissions are very sensitive to spatial and temporal variability of soil and crop parameters, which are largely influenced by land use and cultural practices.
36
9. REFERENCES
1. Aerts R., Toet S.: Nutritional controls on carbon dioxide and methane emission from Carex-dominated peat soils. Soil Biol. Biochem., 29, 1683-1690,1997.
2. Akiyama H., Tsuruta H.: Effect of chemical fertilizer form on N2O, NO and NO2 fluxes from Andisol field. Nutrient Cycling in Agroecosystems., 63, 219-230, 2002.
3. Akiyama H., Tsuruta H.: Nitrous oxide, nitric oxide, and nitrogen dioxide fluxes from soils after manure and urea application. J. Environ. Qual., 32, 423-431, 2003.
4. Alvarez R., Alvarez C.R., Lorenzo G.: Carbon dioxide fluxes following tillage from a mollisol in the Argentine Rolling Pampa. Eur. J. Soil Biol., 37, 161-166, 2001.
5. Ambus P., Christensen S.: Measurement of N2O emission from a fertilized grassland – an analysis of spatial variability. J.Geophys. Res.– Atmosph., 99, 16549-16555, 1994.
6. Aneja V.P., Roelle P.A., Robarge W.R.: Characterization of biogenic nitric oxide source strength in southeast United States. Environ. Pollut, 102, 211-218, 1998.
7. Arah J.R.M., Smith K.A., Crichton I.J., Li H.S.: Nitrous oxide production and deni-trification in Scottish arable soils. J. Soil Sci, 42, 351-367, 1991.
8. Aulakh M.S., Rennie D.A., Paul E.A.: Gaseous nitrogen losses from soils under zero-till as compared with conventional-till management systems. J. Environ. Qual, 13, 130-136, 1984.
9. Bakken L.R., Borresen T., Njøs A.: Effect of soil compaction on soil structure, denitri-fication, and yield of wheat (Triticum aestivum L.). J. Soil Sci., 38, 541-552, 1987.
10. Ball B.C., Horgan G.W., Clayton H., Parker J.P.:. Spatial variability of nitrous oxide fluxes and controlling soil and topographic properties. J. Environ. Qual, 26, 1399-1409, 1997a.
11. Ball B.C., Smith K.A., Klemedtsson L., Brumme R., Sitaula B.K., Hansen S., Priemé A., MacDonald J., Horgan G.W.: The influence of soil gas transport properties on methane oxidation in a selection of northern European soils. J. Geophys. Res., 102, 23309-23317, 1997b.
12. Ball B.C., McTaggart I.P.; Watson C.A.: Influence of organic ley-arable management and afforestation in sandy loam to clay loam soils on fluxes of N2O and CH4 in Scotland. Agriculture, Ecosystems and Environment, 90, 305-317, 2002.
13. Ball B.C., Scott A., Parker J.P.: Field N2O and CH4 fluxes in relation to tillage, compaction and soil quality in Scotland. Soil Tillage Res., 53, 29-39, 1999.
14. Bandibas J., Vermoesen A., Degroot C.J., Vancleemput O.: The effect of different moisture regimes and soil characteristics on nitrous oxide emission and consumption by different soils. Soil Sci., 158, 106-114, 1994.
15. Ben-Asher J., Gardon G. E., Peters D., Rolston D.E., Biggar W.J., Phene C.J., Ephrath J.E.: Determining root activity distribution by measuring surface carbon dioxide fluxes. Soil Sci. Soc. Am. J., 58, 926-930, 1994a.
16. Ben-Asher J., Gardon G. E., Rolston D.E., Peters D., Biggar W.J., Hutmacher R.B.: Determining almond root zone from surface carbon dioxide fluxes. Soil Sci. Soc. Am. J., 58, 930-934, 1994b.
17. Boone R.D., Nadelhoffer K.J., Canary L.D., Kaye J.P.: Roots exert a strong influence on the temperature sensitivity of soil respiration. Nature, 396, 570-572, 1998.
18. Borin M., Menini C., Sartori L.: Effects of tillage systems on energy and carbon balance in north-eastern Italy. Soil Tillage Res., 40, 209-226, 1997.
19. Bouwman A.F.: Soils and the Greenhouse Effect, Wiley, New York, pp., 61-627, 1990.
37
20. Bouwman A.F.: Direct emission of nitrous oxide from agricultural soils. Nutr. Cycl. Agro-ecosyst, 46, 53-70, 1996.
21. Bradford M.A., Ineson P., Wookey P.A., Lappin-Scott H.M.: Role of CH4 oxidation, production and transport in forest soil CH4 flux. Soil Biol. Biochem., 33, 1625-1631, 2001.
22. Brzezińska M., Włodarczyk T., Gliński J.: Effect of methane on soil dehydrogenase activity. Int. Agrophysics, 18, 213-216, 2004.
23. Calderón F.J., Jackson L.E., Scow K.M., Rolston D.E.: Microbial responses to simulated tillage in cultivated and uncultivated soils. Soil Biol. Biochem., 32, 1547-1559, 2000.
24. Calderón F.J., Jackson L.E., Scow K.M., Rolston D.E.: Short-term dynamics of nitrogen, microbial activity, and phospholipid fatty acids after tillage. Soil Sci. Soc. Am., J. 65, 118-126, 2001.
25. Cardenas L., Rondon A., Johansson C., Sanhueza E.: Effects of soil moisture, temperature and inorganic nitrogen on nitric oxide emissions from tropical savannah soils. J.Geophys. Res., 98, 14783-14790, 1993.
26. Choudhary M.A., Akramkhanov A., Saggar S.: Nitrous oxide emissions in soils cropped with under long-term tillage and under permanent pasture in New Zealand. Soil Tillage Res., 62, 61-71, 2001.
27. Choudhary M.A., Akramkhanov A., Saggar S.: Nitrous oxide emissions from a New Zealand cropped soil: tillage effects, spatial and seasonal variability. Agriculture, Ecosystems and Environment, 93, 33-43, 2002.
28. Civerelo K.L., Dickerson R.R.: Nitric oxide soil emissions from tilled and untilled cornfields. Agric.For. Meteorol, 90, 307-311, 1998.
29. Clemens J., Schillinger M.P., Goldbach H.: Spatial variability of N2O emissions and soil parameters of an arable silt loam – a field study. Biol. Fert. Soils, 28, 403-406, 1999.
30. Craine J.M., Wedin D.A., Chapin F.S.: Predominance of ecophysiological controls on soil CO2 flux in a Minnesota grassland. Plant Soil, 207, 77-66, 1999.
31. Crutzen P.J.: The influence of nitrogen oxides on the atmospheric ozone content. Quart. J. Royal Meteorol. Soc., 96, 320-325, 1976.
32. Dao T.H.: Tillage and crop residue effects on carbon dioxide evolution and carbon storage in a Paleustoll. Soil Sci. Soc. Am. J., 62, 250-256, 1998.
33. Delwiche C.C., Cicerone R.J.: Factors affecting methane production under rice. Global Biogeochem. Cycles, 7, 143-155, 1993.
34. Dexter A.R., Arvidsson J., Czyż E.A., Trautner A., Stenberg B.: Respiration rates of soil aggregates in relation to tillage and straw-management practices in the field. Acta Agric. Scand., Sect. B, Soil and Plant Sci., 49, 193-200, 2000.
35. Dick W.A., Blevins R.L., Frye W.W., Peters S.E., Christenson D.R., Pierce F. J., Vitosh M.L.: Impacts of agricultural management practices on C sequestration in forest-derived soils of the eastern Corn Belt. Soil Tillage Res., 47, 235-244, 1998.
36. Dobbie K.E., Smith K.A.: Comparison of CH4 oxidation rates in woodland, arable and set aside soils. Soil Biol. Biochem, 28, 1357-1365, 1996.
37. Douglas J.T., Crawford C.E.: The response of a ryegrass sward to wheel traffic and applied nitrogen. Grass Forage Sci., 48, 91-100, 1993.
38. Dugas W.A., Heuer M.L., Mayeux H.S.: Carbon dioxide fluxes over bermudagrass, native prairie, and sorghum. Agric. Forest Meteorol, 93, 121-139, 1999.
38
39. Ellert B.H., Janzen H.H.: Short-term influence of tillage on CO2 fluxes from a semi-arid soil on the Canadien prairies. Soil Tillage Res., 50, 21-32, 1999.
40. Elliot P.W., Knigth D., Anderson J.M.: Denitrification from earthworm casts and soil from pasture under different fertilizer and drainage regimes. Soil Biol. Biochem., 22, 601-605, 1990.
41. Emmerich W.E.: Carbon dioxide fluxes in a semiarid environment with high carbnate soils. Agricultural Forest Meteorology, 116, 91-102, 2003.
42. Fernandes S. A.P., Bernoux M. Cerri C.C. Feigl B.J. Piccolo M. C.: Seasonal variation of soil chemical properties and CO2 and CH4 fluxes in unfertilized and P-fertilized pastures in an Ultisol of the Brazilian Amazon. Geoderma, 107, 227-241, 2002.
43. Fiedler S., Sommer M.: Methane emissions, groundwater levels and redox potentials of common wetland soils in a temperate-humid climate. Global Biogeochem. Cycles, 14, 1981-1093, 2000.
44. Firestone M.K., Davidson E.A.: Microbiological basis of NO and N2O production and consumption in soil. In: M.O. Andreae and D.S. Schimel (Eds.) Exchange of trace gases between terrestrial ecosystems and the atmosphere. pp 7-21, Wiley and Sons, Chichester, 1989.
45. Flessa H., Ruser R., Dörsch P., Kamp T., Jimenez M.A., Munch J.C., Beese F.: Integrated evaluation of greenhouse gas emissions (CO2, CH4, N2O) from two farming systems in southern Germany. Agriculture, Ecosystems and Environment, 91, 175-190, 2002a.
46. Flessa H., Ruser R., Schilling R., Loftfield N., Munch J.C., Kaiser E.A., Beese F.: N2O and CH4 fluxes in potato fields: automated measurement, management effects and temporal variation. Geoderma, 105, 307-325, 2002b.
47. Frank A.B.: Carbon dioxide fluxes over a grazed prairie and seeded pasture in the Northern Great Plains. Environmental Pollution, 116, 397-403, 2002.
48. Frank A.B., Liebig M.A., Hanson J.D.: Soil carbon dioxide fluxes in northern semiarid grasslands. Soil Biol. Biochem., 34, 1235-1241, 2002.
49. Frank A.B., Dugas W.A.: Carbon dioxide fluxes over a northern, semiarid, mixed-grass prairie. Agric. For Meteorol., 108, 317-326, 2001.
50. Frank A.B., Sims P.L., Bradford J.A., Mielnick P.C., Dugas W.A., Mayeux H.S.: Carbon dioxide fluxes over three Great Plains grasslands. In: Follett, R.F., Kimble, J. M., Lal, R. (Eds.), The potential of U.S. grazing lands to sequester carbon and mitigate the greenhouse effect, Lewis Publishers, Boca Raton, FL, pp., 167-168, 2000.
51. Franzluebbers A.J.: Potential C and N mineralization and microbial biomass from intact and increasingly disturbed soils of varying texture. Soil Biol. Biochem., 31, 1083-1090, 1999.
52. Franzluebbers A.J., Hons F.M., Zuberer D.A.: In situ and potential CO2 evolution from a Fluventic Ustochrept in southcentral Texas as affected by tillage and cropping intensity. Soil Tillage Res., 47, 303-308, 1998.
53. Franzluebbers A.J., Hons F.M., Zuberer D.A.: Tillage and crop effects on seasonal dynamics of soil CO2 evolution, water content, temperature, and bulk density. Appl. Soil Ecology, 2, 95-109, 1995.
54. Freney J.R.: Emission of nitrous oxide from soils used for agriculture. Nutrient Cycling in Agroecosystems, 49, 1-6, 1997.
55. Garrido F., Hénault C., Gaillard H., Pérez S., Germon J.C.: N2O and NO emissions by agricultural soils with low hydraulic potentials. Soil Biol. Biochem., 34, 559-575, 2002.
39
56. Germon J.C., Jacques D.: Denitrifying activity measurement by soil core method, effect of depth and characterisation of N2O /N2 ratio in different soils. Mitteilungen der Deutschen Bodenkundl. Gesellsch, 60, 51-58, 1990.
57. Gliński J., Stępniewska Z., Stępniewski W., Ostrowski J., Szmagara A.: A contribution to the assessment of potential denitrification in arable mineral soils of Poland. J. Water Land Develop., 4, 175-183, 2000.
58. Goossens A.D., De Visscher A., Boeckx A., Van Cleemput O.: Two-year field study on the emission of N2O from coarse and middle-textured Belgian soils with different land use. Nutr. Cycl. Agroecosyst., 60, 23-34, 2001.
59. Granberg G., Ottosson-Lofvenius M., Grip H., Sundh I., Nilsson M.: Effect of climatic variability from 1980 to 1997 on simulated methane emission from a boreal mixed mire in northern Sweden. Global Biogeochem. Cycles, 15, 977-991, 2001.
60. Gulledge J., Schimel J.P.: Moisture control over atmospheric CH4 consumption and CO2 production in diverse Alaskan soils. Soil Biol. Biochem., 30, 1127-1132, 1998.
61. Hall S.J., Matson P.A., Roth P.M.: NOx emissions from soil: Implications for air quality modeling in agricultural regions. Ann. Rev. Energy and Environm., 21, 311-346, 1996.
62. Halvorson A.D., Wienhold B.J., Black A.L.: Tillage, nitrogen, and cropping system effects on soil carbon sequestration. Soil Sci. Soc. Am.J., 66, 906-912, 2002.
63. Hansen S., Maehlum J.E., Bakken L.R.: N2O and CH4 fluxes in soil influenced by fertillization and tractor traffic. Soil Biol. Biochem., 25, 621-630, 1993.
64. Hao X., Chang C., Carefoot J.M., Janzen H.H., Ellert B.H.: Nitrous oxide emissions from an irrigated soil as affected by fertilizer and straw management. Nutr. Cycling Agroecosyst., 60, 1-8, 2001.
65. Hargreaves K.J., Fowler D.: Quantifying the effects of water table and soil temperature on the emission of methane from peat wetland at the field scale. Atmosph. Environ., 32, 19, 3275-3282, 1998.
66. Harrison R.M., Yamulki S., Goulding K.W.T., Webster C.P.: Studies on NO and N2O fluxes from a wheat field. Atmospheric Environment, 29, 1627-1635, 1995.
67. Hatano R., Sakuma T.: A plate model for solute transport through aggregated soil columns. I. Theoretical description. Geoderma, 50, 13-23, 1991.
68. Hatano R., Sawamoto T.: Emission of N2O from a clayey aquic soil cultivated with onion plants. In: Ando, T. et al. (Eds), Plant Nutrition – for Sustainable Food Production and Environment, pp. 555-556, 1997.
69. Højberg O., Revsbech N.P., Tiedje J.M.: Denitrification in soil aggregates analyzed with microsensors for nitrous oxide and oxygen. Soil Sci. Soc. Am. J., 58, 1691-1698, 1994.
70. Horn R., Stępniewski W., Włodarczyk T., Walenzik G., Eckhardt F.E.W.: Denitrification rate and microbial distribution within homogeneous model soil aggregates. Int. Agrophysics, 8, 65-74, 1994.
71. Hosono N. T., Nouchi I.: The dependence of methane transport in rice plants on the root zone temperature. Plant Soil, 191, 233-240, 1997.
72. Hou A.X., Chen G.X., Wang Z.P., Van Cleemput O., Patrick W.H.: Methane and nitrous oxide emissions from a rice field in relation to soil redox and microbial processes. Soil Sci. Soc. Am. J., 64, 2180-2186, 2000.
40
73. Hu R., Hatano R., Kusa K., Sawamoto T.: Effect of nitrogen fertilization on methane flux in a structured clay soil cultivated with onion in Central Hokkaido, Japan. Soil Sci Plant Nutr., 48, 797-804, 2002.
74. Hu R., Kusa K., Hatano R.: Soil respiration and methane flux in adjacent forest, grassland, and cornfield soils in Hokkaido, Japan. Soil Sci. Plant Nutr., 47, 621-627, 2001.
75. Hütsch B.W.: Methane oxidation in arable soil as inhibited by ammonium, nitrate, and organic manure with respect to soil pH. Biol. Fertil. Soils, 28, 27-35, 1998.
76. Hütsch B.W.: Methane oxidation in non-flooded soils as affected by crop production – invited paper. European Journal of Agronomy. 14, 237-260, 2001.
77. Hütsch B.W., Webster C.P., Powlson D.: Long-term effects of nitrogen fertilization on methane oxidation in soil of the Broad-balk Wheat Experiment. Soil Biol. Biochem., 25, 1307-1315, 1993.
78. Hütsch B.W., Webster C.P., Powlson D.: Methane oxidation in soil as affected by land use, soil pH and N fertilization. Soil Biol. Biochem., 26, 1613-1622, 1994.
79. Intergovernmental Panel on Climate Change (IPCC).: Summary for Policymakers. A report of working group I of the Intergovernmental Panel on Climate Change, 1-83 (http://www.ipcc.ch/pub/pub.htm), 2001.
80. Inubushi K., Furukawa Y., Hadi A., Purnomo E., Tsuruta H.: Seasonal changes of CO2, CH4 and N2O fluxes in relation to land-use change in tropical peatlands located in coastal area of South Kalimantan. Chemosphere, 52, 603-608, 2003.
81. Jacinthe P.A., Dick W.A.: Soil management and nitrous oxide emissions from cultivated fields in southern Ohio. Soil Tillage Res., 41, 221-235, 1997.
82. Jacinthe P.A., Lal R., Kimble J.M.: Carbon dioxide evolution in runoff from simulated rainfall on long-term no-till and plowed soils in southwestern Ohio. Soil Tillage Res., 66, 23-33, 2002a.
83. Jacinthe P.A., Lal R., Kimble J.M.: Carbon budget and seasonal carbon dioxide emission from a central Ohio Luvisol as influenced by wheat residue amendment. Soil Tillage Res. 67, 147-157, 2002b.
84. Jackson L.E., Calderón F.J., Steenwerth K.L., Scow K.M., Rolston D.E.: Response of soil microbial processes and continuity structure to tillage events and implications to soil quality. Geoderma, 3-4, 305-317, 2003.
85. Jia Z.J., Cai Z.C., Xu H., Li X.P.: Effect of rice plants on CH4 production, transport, oxidation emission in rice paddy soil. Plant Soil, 230, 211-221, 2001.
86. Jørgensen R.N., Jørgensen B.J., Nielsen N.E., Maag M., Lind A.M. N2O emission from energy crop fields of Miscanthus „Giganteus“ and winter rye. Atmospheric Environment, 18, 2899-2904, 1997.
87. Kaiser E.A., Kohrs K., Kücke M., Schnug E., Heinemeyer O., Munch J.C.: Nitrous oxide release from arable soil: Importance of N-fertilization, crops and season. Soil Biol. Biochem., 30, 1553-1563, 1998a.
88. Kaiser E.A., Kohrs K., Kücke M., Schnug E., Munch J.C., Heinemeyer O.: Nitrous oxide release from arble soil: importance of different perennial forage crops. Biol. Fertil. Soils, 28, 36-43, 1998b.
89. Kaiser E, A., Ruser R.: Nitrous oxide emissions from arable soils in Germany – An evaluation of six long-term field experiments. J. Plant Nutr. Soil Sci., 163, 249-260, 2000.
41
90. Keller M., Mitre M.E., Stallard R.F.: Consumption of atmospheric methane in soils of Central Panama: Effects of agricultural development. Global Biogeochem. Cycles, 4, 21-27, 1990.
91. Keller M., Reiners W.A.: Soil-atmosphere exchange of nitrous oxide, nitric oxide and methane under secondary succession of pasture to forest in the Atlantic lowlands of Costa Rica. Global Biogeochem. Cycles, 8, 399-409, 1994.
92. Kelliher F.M., Llloyd J., Arneth A., Lühker B., Byers J.N., McSeveny T.M., Milukova I., Grigoriev S., Panfyorov M., Sogatchev A., Varlargin A., Ziegler W., Bauer G., Wong S.C., Schulze E.D.: Carbon dioxide efflux density from the floor of a Central Siberian pine forest. Agric. For. Meteorol., 94, 217-232, 1999.
93. Kessavalou A., Mosier A.R., Doran J.W., Drijber R.A., Lyon D.J., Heinemeyer O.: Fluxes of carbon dioxide, nitrous oxide, and methane in grass sod and winter wheat-fallow tillage management. J. Environ. Qual., 27, 1094-1104, 1998.
94. Kiese R., Butterbach-Bahl K.: N2O and CO2 emissions from three different tropical forest sites in the wet tropics of Queensland, Australia. Soil Biol. Biochem., 34, 975-987, 2002.
95. Kimura M.: Sources of methane emitted from paddy fields. Nutr. Cycl. Agroecosyst., 49, 71-78, 1997.
96. Ko J.Y., Kang H.W.: The effects of cultural practices on methane emission from rice fields. Nutr. Cycl. Agroecosyst., 58, 311-314, 2000.
97. Kusa K., Sawamoto T., Hatano R.: Nitrous oxide emissions for six years from a gray lowland soil cultivated with onions in Hokkaido, Japan. Nutr. Cycl. Agroecosyst., 63, 239-247, 2002.
98. Langeveld C.A., Segers R., Dirks B.O.M., van den Pol-van Dasselaar A., Velthof G.L., Hensen A.: Emissions of CO2, CH4 and N2O from pasture on drained peat soils in the Netherlands. Eur. J. Agron., 7, 35-42, 1997.
99. Lal R.: Long-term tillage and maize monoculture effects on a tropical Alfisol in western Nigeria. I. Crop yield and soil physical properties. Soil Tillage Res., 42, 145-160, 1997.
100. Lal R., Fausey N.R., Eckert D.J.: Land use and soil management effects on emissions of radiatively active gases in two Ohio Soils. In: Lal, R., Kimble, J., Levine, E., Stewart, B. (Eds.), Soil Management and Greenhouse Effect. Lewis/CRC Publ., Boca Raton, FL, pp. 41-59, 1995.
101. La Scala Jr., N., Marques Jr., J., Pereira G. T., Cora J.E.: Carbon dioxide emission related to chemical properties of a tropical bare soil. Soil Biol. Biogeochem., 32, 1469-1473, 2000a.
102. La Scala Jr., N., Marques Jr., J., Pereira G. T., Cora J.E.: Short-term temporal changes in the spatial variability model of CO2 emissions from a Brazilian bare soil. Soil Biol. Biogeochem., 32, 1459-1462, 2000b.
103. La Scala Jr., N., Lopes A., Marques Jr., Pereira G.T.: Carbon dioxide emissions after application of tillage systems for a dark red latosol in southern Brazil. Soil Tillage Res., 62, 163-166, 2001.
104. Le Mer J., Roger P.: Production, oxidation, emission and consumption of methane by soils: A review. Eur. J. Soil. Biol., 37, 25-50, 2001.
105. Li Y.X., Aneja V.P., Arya S.P., Rickman J., Brittig J., Roelle P., Kim D.S.: Nitric oxide emission from intensively managed agricultural soil in North Carolina. J. Geoph. Res.-Atmosph., 104, 26115-26123, 1999.
106. Lindau C.W., Bollich P.K., DeLaune R.D.: Effect of rice variety on methane emission from Louisiana rice. Agric., Ecosyst. Environm., 54, 109-114, 1995.
42
107. Linn D.M., Doran J.W.: Effect of water-filled pore space on carbon dioxide and nitrous oxide production in tilled and nontilled soils. Soil Sci. Soc. Am. J. 48, 1267-1272, 1984.
108. Liou R-M.,Huang S-N., Lin C-W.: Methane emission from fields with differences in nitrogen fertilizers and rice varieties in Taiwan paddy soils. Chemosphere, 50, 237-246, 2003.
109. Lipiec J., Hatano R.: Effect of soil tillage and compaction on grrenhouse gas fluxes. In: Gliński J., Józefaciuk G., Stahr K.(Eds.) Soil-Plant-Atmosphe: Aeration and Environmental Problems, 18-29, 2004.
110. Lipiec J., Stępniewski W.: Effects of soil compaction and tillage systems on uptake and losses of nutrients. Soil Tillage Res., 35, 37-52, 1995.
111. Lipschultz F., Zafirou O.C., Wofsy S.C. McElroy M.B., Valois F.W. and Watson S.W.: Production of NO and N2O by soil nitrifying bacteria. Nature 294, 641-643, 1981.
112. Lomander A., Kätterer T., Andrén O.: Modelling the effects of temperature and moisture on CO2 evolution from top- and subsoil using a multi-compartment approach. Soil Biol. Biochem., 30, 2023-2030, 1998.
113. Macdonald J.A., Skiba U. M., Sheppard L.J., Hargreaves K.J., Smith K.A., Fowler D.: Soil environmental variables affecting the flux of methane from a range of forest, moorland and agricultural soils. Biogeochem., 34, 113-132, 1996.
114. MacKenzie A.F., Fan M.X.,Cadrin F.: Nitrous oxide emission as affected by tillage, corn-soybean-alfalfa rotations and nitrogen fertilization. Can. J. Soil Sci., 77, 145-152, 1997.
115. Maljanen M., Liikanen A., Silvola J., Martikainen P.J.: Nitrous oxide emssions from boreal organic soil under different land-use. Soil Biol. Biochem., 35, 1-12, 2003.
116. Maljanen M., Martikainen P.J., Walden J., Silvola J.: CO2 exchange in an organic field growing barley or grass in eastern Finland. Global Change Biol., 7, 679-692, 2001.
117. McConkey Liang B.C., Campbell C.A., Curtin D., Moulin A., Brandt S.A., Lafond G.P.: Crop rotation and tillage impact on carbon sequestration in Canadian prairie soils. Soil Till. Res., 74, 81-90, 2003.
118. Mc Taggart I,P., Akiyama H., Truruta H., Ball B.: Influence of soil physical properties, fertiliser type and moisture tension on N2O and NO emissions from nearly saturated Japanese upland soils. Nutr. Cycling Agroecosyst., 63, 207-217, 2002.
119. Mitra S., Jain M.C., Kumar S., Bandyopadhyay S.K., Kaira N.: Effect of rice cultivars on methane emission. Agric. Ecosyst. Environ., 73, 177-183, 1999.
120. Mogge B., Kaiser E-A., Munch J-C.: Nitrous oxide emissions and denitrification N-losses from agricultural soils in the Borrnhöved Lake region: influence of organic fertilizers and land-use. Soil Biol. Biochem., 31, 1245-1252, 1999.
121. Mosier A.R.: Exchange of gaseous nitrogen compounds between agricultural systems and the atmosphere. Plant Soil, 228, 17-27, 2001.
122. Mosier A.R., Delgado J.A.: Methane and nitrous oxide fluxes in grasslands in Western Puerto Rico. Chemosphere, 35, 2059-2082, 1997.
123. Mosier A.R., Delgado J.A., Keller M.: Methane and nitrous oxide fluxes in an acid Oxisol in western Puerto Rico: effects of tillage, liming and fertilization. Soil Biol. Biochem., 30, 2087-2098, 1998.
124. Mosier A.R., Kroeze C., Nevison C., Oenema O., Seitzinger S., Van Cleemput O.: Closing the global N2O budget: nitrous oxide emissions through the agricultural nitrogen cycle. Nutr. Cycling Agroecosyst., 52, 225-248, 1998.
43
125. Mosier A.R., Parton W.J., Valentine D.W., Ojima D.S., Schimel D.S., Heinemeyer O.: CH4 and N2O fluxes in Colorado shortgrass steppe. 2. Long-term impact of land use change. Global Biogeochem. Cycles, 11, 29-42, 1997.
126. Mosier A. R., Schimel D., Valentine D., Bronson K., Parton W.: Methane and nitrous oxide fluxes in native, fertilized and cultivated grasslands. Nature, 350, 330-332, 1991.
127. Motavalli P.P., Discekici H., Kuhn J.: The impact of land clearing and agricultural practices on soil organic C fractions and CO2 efflux in the Northern Guam aquifer. Agric. Ecosyst. Environ., 1, 17-27, 2000.
128. Mummey D.L., Smith J.L., Bolton Jr H.: Small-scale spatial and temporal variability of N2O flux from a shrub-steppe ecosystem Soil Biol. Biochem., 29, (11/12), 1699-1706, 1997.
129. Mummey D.L., Smith J.L., Bluhm G.R.: Assessment of alternative soil management practices on N2O emissions from US agriculture. Agric. Ecosyst. Environ., 70, 79-87, 1998.
130. Neue H.U., Wassmann R., Lantin R.S., Alberto Ma. C.R., Aduna J.B., Javellana A.M.: Factors affecting methane emission from rice fields. Atmosph. Environ., 30, 1751-1754, 1996.
131. Neue H.U., Wassmann R., Kludze H.K., Bujun W., Lantin R.S.: Factors and processes controlling methane emissions from rice fields. Nutr. Cycl. Agroecosyst., 49, 111-117, 1997.
132. Nouchi I., Mariko S., Aoki K.: Mechanism of methane transport from the rhizosphere to the atmosphere through rice plants. Plant Physiol., 94, 59-66, 1990.
133. Nykanen H., Alm J., Lang K., Silvola J., Martikainen P.J.: Emissions of CH4, N2O and CO2 from a virgin fen drained for grassland in Finland. J. Biogeography, 22, 351-357, 1995.
134. Oenema O., Velthof G.L., Yamulki S., Jarvis SC.: Nitrous oxide emissions from grazed grassland. Soil Use Manage., 13, 288-295, 1997.
135. Olivier J.G.J., Bouwman A.F., Van der Hoek K.W., Berdowski J.M.: Global air emission inventories for anthropogenic sourcess of NOx, NH3 and N2O in 1990. Environ. Pollut., 102, 135-148, 1998.
136. Palma R.M., Rimolo M., Saubidet M.I., Conti M.F.: Influence of tillage system on denitrification in maize-cropped soils. Biol. Fertil. Soils, 25, 142-146, 1997.
137. Pathak H., Nedwell D.B.: Nitrous oxide emission from soil with different fertilizers, water levels and nitrification inhibitors. Water Air Soil Pollut., 129, 217-228, 2001.
138. Pathak H., Prasad S., Bhatia A., Singh S., Kumar S., Singh J., Jain M.C.: Methane emission from rice-wheat cropping system in the Indo-Gangetic plain in relation to irrigation, frmyard manure and dicyandiamide application. Agric. Ecosyst. Environ., 97, 309-316, 2003.
139. Paul E.A., Harris D., Collins H.P., Schulthess U., Robertson G.P.: Evolution of CO2 and soil carbon dynamics in biologically managed, row-crop agroecosystems. Applied Soil Ecology, 11, 53-65, 1999.
140. Paustian K., Elliott E.T., Carter M.R.: Tillage and crop management impacts on soil C storage: use of long-term experiment data. Soil Tillage Research, 47, 7-12, 1998.
141. Peirce J.J., Aneja V.P.; Nitric oxide emissions from engineered soil systems. J. Environ. Eng., 126, 3, 225-232, 2000.
142. Petersen S.O., Klug M.J.: Effects of tillage, storage, and incubation temperature on the phospholipid fatty acid profile of a soil microbial community. Appl.Environm. Microbiol., 60, 2421-2430, 1994.
143. Prieme A., Christensen S.: Natural perturbations, drying-wetting and freezing-thawing cycles, and the emission of nitrous oxide, carbon dioxide and methane from farmed organic soils. Soil Biol. Biogeochem., 33, 2083-2091, 2001.
44
144. Prior S.A., Reicosky D.C., Reeves D.W., Runion G.B., Raper R.L.: Residue and tillage effects on planting implement-induced short-term CO2 and water loss from a loamy sand soil in Alabama. Soil Tillage Res., 54, 197-199, 2000.
145. Rastogi M., Singh S., Pathak H.: Emission of carbon dioxide from soil. Current Sci., 82, 510-517, 2002.
146. Reicosky D.C., Dugas W.A., Torbert H.A.: Tillage-induced soil carbon dioxide loss from different cropping systems Soil Tillage Res., 41, 105-118, 1997.
147. Reicosky D.C., Reeves D.W., Prior S.A., Runion G.B., Rogers H.H., Raper R.L.: Effects of residue management and controlled traffic on carbon dioxide and water loss. Soil Tillage Res., 52, 3-4, 153-165, 1999.
148. Rochette P., Angers D.A.: Soil surface carbon dioxide fluxes induced by spring, summer, and fall moldboard plowing in a sandy loam. Soil Sci. Soc. Am. J., 63, 621-628, 1999.
149. Roelle P.A.; Aneja V.P.: Nitric oxide emissions from soils amended with municipal wast biosolids. Atmosph. Environm. 36, 137-147, 2002.
150. Röver M., Heinemeyer O., Kaiser E.A.: Microbial induced nitrous oxide emissions from arable soil during winter. Soil Biol. Biochem., 30, 1859-1865, 1998.
151. Röver M., Heimemeyer O., Munch J.C., Kaiser E.A.: Spatial heterogeneity within the plough layer: high variability of N2O emission rates. Soil Biol. Biochem., 31, 167-173, 1999.
152. Ruser R., Flessa H., Schilling R., Steindl R., Beese F.: Soil compaction and fertilization effects on nitrous oxide and methane fluxes in potato fields. Soil Sci. Soc. Am. J., 62, 1587-1595, 1998.
153. Sahrawat K., Keeney D.R.: Nitrous oxide emissions from soils. In: Stewart, B.A. (ed), Adv. Soil Sci., Springer, New York vol. 4., pp. 103-148, 1986.
154. Sánchez M.L., Ozores M.I., Colle R., López M.J., De Torre B., García M.A., Pérez I.: Soil CO2 fluxes in cereal land use of the Spanish plateau: influence of conventional and reduced tillage practices. Chemosphere, 47, 837-844, 2002.
155. Sanhueza E., Santana M.: CO2 emissions from tropical savanna soil under first year of cultivation. Interciencia, 19, 20-23, 1994.
156. Sawamoto T., Kusa K., Hu R., Hatano R.: Dissolved N2O, CH4, and CO2 emissions from subsurface-drainage in a structured clay soil cultivated with onion in Central Hokkaido, Japan. Soil Sci. Plant Nutr., 49, 31-38, 2003.
157. Scheu S., Maraun M., Bonkowski M., Alphei J.: Microbial biomass and respiratory activity in soil aggregates of different sizes from the three beechwood sites on a basalt hill. Biol. Fertil. Soils, 21, 69-76, 1996.
158. Schmid M., Neftel A., Riedo M., Fuhrer J.: Process-based modelling of nitrous oxide emissions from different nitrogen sources in mown grassland. Nutr. Cycling Agroecosyst., 60, 177-187, 2001.
159. Seech A.G., Beauchamp E.G.: Denitrification in soil aggregates of different sizes. Soil Sci. Soc. Am. J., 52, 1616-1621, 1988.
160. Simojoki S., Jaakkola A.: Effect of nitrogen fertilization, cropping and irrigation on soil air composition and nitrous oxide emission in a loamy clay. Eur. J. Soil Sci., 51, 413-424, 2000.
161. Singh J.S., Raghubanshi A.S., Reddy V.S., Singh S.; Kashyap A.K.: Methane flux from irrigated paddy and dryland rice fields, and from seasonally dry tropical forest and Savanna soils of India. Soil Biol.Biochem., 30, 135-139, 1998.
45
162. Singh J.S., Singh Smita Raghubanshi A.S., Singh Sarantah Kashyap A.K., Reddy V.S.: Effect of soil nitrogen carbon and moisture on methane uptake by dry tropical forest soils. Plant Soil, 196, 115-121, 1997.
163. Singh S.N.: Exploring correlation between redox potential and other edaphic factors in field and laboratory conditions in relation to methane efflux. Environ. Int., 27, 265-274, 2001.
164. Situala B.K., Hansen S., Situala J.I.B., Bakken L.R.: Effects of soil compaction on N2O emission in agricultural soil. Chemosphere – Global Change Science, 2, 367-371, 2000.
165. Six J., Elliott E.T., Paustian K.: Soil macroaggregate turnover and microaggregate formation: a mechanism for C sequestration under no-tillage agriculture. Soil Biol.Biochem., 32, 2099-2103, 2000.
166. Skiba U.M., Ball B.: The effect of soil texture and soil drainage on emissions of nitric oxide and nitrous oxide. Soil Use Manage., 18, 56-60, 2002.
167. Skiba U, Fowler D., Smith K.A.: Nitric oxide emissions from agricultural soils in temperate and tropical climates: sources, controls and mitigation options. Nutr. Cycl. Agroecosyst., 48, 139-153, 1997.
168. Skiba U.M., Sheppard J., Macdonald J., Fowler D.: Some key environmental variables controlling nitrous oxide emissions from agricultural and semi-natural soils in Scotland. Atmosph. Environ., 32, 3311-3320, 1998.
169. Smith K.A., McTaggart I.P., Tsuruta H.: Emissions of N2O and NO associated with nitrogen fertilization in intensive agriculture, and the potential for mitigation. Soil Use Manage., 13, 296-304, 1997.
170. Smith K.A., Thomson P.E., Clayton H., McTaggart P., Conen F.: Effects of temperature, water content and nitrogen fertilisation on emissions of nitrous oxide by soils. Atmosph. Environ., 32, 3301, 3309, 1998.
171. Soane B.D., van Ouwerkerk C.: Implications of soil compaction in crop production for the quality of the environment. Soil Tillage Res., 35, 5-22, 1995.
172. Stark J.M., Smart D.R., Hart S.C., Haubensak K.A.: Regulation of nitric oxide emissions from forest and rangeland soils of western North America. Ecology, 83, 2278-2292, 2002.
173. Stępniewska Z., Bennicelli R.P., Weiss U., Włodarczyk T., Stahr K.: Denitrification rate in soils as affected by their redox conditions. J. Water Land Develop., 4, 163-173, 2000.
174. Stępniewska Z., Nosalewicz M., Ostrowska A.: Methane and carbon dioxide emissions from a loess soil treated with municipal waste water after second step of purification. Int. Agrophysics, 17, 31-34, 2003.
175. Stępniewski W., Stępniewska Z.: Oxygenology of treatment wetlands and its environmental effects. 7th Int. Conf. Wetland Systems for Water Pollution Control., II, 671-678, 2000.
176. Stępniewski W., Zygmunt M.: Methane oxidation in homogenous soil covers of landfills: a finite-element analysis of the influence of gas diffusion coefficient. Int. Agrophysics, 14, 449-456, 2000.
177. Striegl R.G., Wickland K.P.: Effects of a clear-cut harvest on soil respiration in a jach pine-lichen woodland. Can. J. Forest Res., 28, 534-539, 1998.
178. Sullivan L.J., Moore T.C., Aneja V.P., Robarge W.P., Peirce T.: Environmental variables controlling nitric oxide emissions from agricultural soils in the southeast United States. Atmosph. Environ., 30, 3573-3582, 1996.
179. Tabachow R.S., Pierce J.J., Jousset S.: Nitric oxide emissions from fertilized and biosolids-amended soil. J. Environ. Eng., 127, 517-523, 2001.
46
180. Teepe R., Brumme R., Beese F.: Nitrous oxide emissions from frozen soils under agricultural, fallow and forest land. Soil Biol. Biochem., 32, 1807-1810, 2000.
181. Teepe R., Brumme R., Beese F.: Nitrous oxide emissions from soil during freezing and thawing periods. Soil Biol. Biochem., 33, 1269-1275, 2001.
182. Thornton F.C., Valente R.J.: Soil emissions of nitric oxide and nitrous oxide from no-till corn. Soil Sci. Soc. Am. J., 60, 1127-1133, 1996.
183. Tokuda S., Hayatsu M.: Nitrous oxide emission potential of 21 acidic tea field soils in Japan. Soil Sci. Plant Nutr., 47, 637-642, 2001.
184. Veldkamp E., Keller M.: Fertilizer-induced nitric oxide emissions from agricultural soils. Nutr. Cycl. Agroecosyst., 48, 69-77, 1997.
185. Veldkamp E., Keller M., Nunez M.: Effects of pasture management on N2O and NO emissions from soils in the humid tropics of Costa Rica. Global Biogeeochem. Cycles, 12, 71-79, 1998.
186. Veldkamp E., Weitz A.M.; Keller M.: Management effects on methane fluxes in humid tropical pasture soils. Soil Biol. Biochem., 33, 1493-1499, 2001.
187. Verchot L.V., Davidson E.A., Cattanio J.H., Ackerman I.L., Erickson H.E., Keller M.: Land use change and biogeochemical controls of nitrogen oxide emissions from soils in eastern Amazonia. Global Biogeochem. Cycles, 13, 31-46, 1999.
188. Wagai R., Brye K.R., Gover S.T., Norman J.M., Bundy L.G.: Land use and environmental factors influencing soil surface CO2 flux and microbial biomass in natural and managed ecosystems in southern Wisconsin. Soil Biol. Biochem., 30, 1501-1509, 1998.
189. Wagner-Riddle C., Thurtell G.W.: Nitrous oxide emissions from agricultural fields during winter and spring thaw as affected by management practices. Nutr. Cycl. Agroecosyst., 52, 151-163, 1998.
190. Wachinger G. Fiedler S., Zepp K., Gattinger A., Sommer M., Roth K.: Variability of soil methane production on the micro-scale: spatial association with hot spots of organic material and Archaeal populations. Soil Biol. Biochem., 32, 1121-1130, 2000.
191. Wang B., Neue H.U., Samonte H.P.: Effects of cultivar difference (IR72, IR65598 and Dular) on methane emission. Agric. Ecosyst. Environ., 62, 31-40, 1997.
192. Wassmann R., Neue H.U., Lantin R.S., Makarim K., Chareonsilp N., Buendia L.V., Rennenberg H.: Characterization of methane emissions from rice fields in Asia. Nutr. Cycl. Agroecosyst., 58, 13-22, 2000.
193. West T.O., Marland G.: A synthesis of carbon sequestration, carbon emissions, and net carbon flux in agriculture: comparing tillage practices in the United States. Agric. Ecosyst. Environ., 91, 217-232, 2002.
194. West T.O., Post W.M.: Soil organic carbon sequestration rates by tillage and crop rotation: A global data Analysis, Soil Sci. Soc. Am. J., 66, 1930-1946, 2002.
195. Wessels M.L., Schindler B.P.J., McCartney D.A., ,Subler S., Edwards C.A.: Earthworm effects on soil respiration in corn agroecosystems receiving different nutrient inputs. Soil Biol. Biochem., 29, 409-412, 1997.
196. Widén B.: Seasonal variation in forest-floor CO2 exchange in a Swedish coniferous forest. Agricultural and Forest Meteorology, 111, 283-297, 2002.
197. Williams D.L.l., Ineson P., Coward P.A.: Temporal variations in nitrous oxide fluxes from urine-affected grassland. Soil Biol. Biochem., 31, 779-788, 1999.
47
198. Willison T.W., Webster C.P., Goulding K.W.T., Powlson D.S.: Methane oxidation in tem-perate soils: effects of land use and the chemical form of nitrogen fertiliser. Chemosphere, 30, 539-546, 1995.
199. Witkowska-Walczak B.: Influence of aggregate sizee of Eutric Cambisol and Gleyic Phaeozem on evaporation. Int. Agrophysics, 14, 469-475, 2000.
200. Witkowska-Walczak B.: Hydrophysical characteristics and evaporation of Haplic Luvisol and Mollic Gleysol aggregates. Int. Agrophysics, 17, 137-141, 2003.
201. Włodarczyk T., Stępniewska Z., Brzezińska M.: Denitrification, organic matter and redox potential transformations in Cambisols. Int. Agrophysics, 17, 219-227, 2003.
202. Włodarczyk T., Stępniewski W., Brzezińska M.: Dehydrogenase activity, redox potential, and emissions of carbon dixide and nitrous oxide from Cambisols under flooding conditions. Biol. Fertil. Soils, 36, 200-206, 2002a.
203. Włodarczyk T., Stępniewski W., Brzezińska M., Kotowska U.: N2O emission and sorption in relation to soil dehydrogenase activity and redox potential. Int. Agrophysics, 16, 249-252, 2002b.
204. Wuest S.B., Durr D., Albrecht S.L.: Carbon dioxide flux measurement during simulated tillage. Agron. J., 95, 715-718, 2003.
205. Xing G.X., Shi S.L., Shen G.Y., Du L.J., Xiong Z.Q.: Nitrous oxide emissions from paddy soil in three rice-based cropping systems in China. Nutr. Cycl. Agroecosyst., 64, 135-143, 2002.
206. Yagi K., Minami K.: Effect of organic matter application on methane emission from some Japanese paddy fields, Soil Sci. Plant Nutr., 36, 599-610, 1990.
207. Yagi K., Tsuruta H., Minami K.: Possible options for mitigating methane emission from rice cultivation. Nutr. Cycl. Agroecosys., 49, 213-220, 1997.
208. Yamulki S., Goulding K.W.T., Webster C.P., Harrison R.M.: Studies on NO and N2O fluxes from a wheat field. Atmosph. Environ., 29, 1627-1635, 1995.
209. Yamulki S., Harrison R.M., Goulding K.W.T., Webster C.P.: N2O, NO and NO2 fluxes from a grassland: effect of soil pH. Soil Biol. Biochem., 29, 1199-1208, 1997.
210. Yan X., Shi S., Du L., Xing G.: Pathways of N2O emission from rice paddy soil. Soil Biol. Biochem., 32, 437-440, 2000.
211. Yanai J., Sawamoto T., Oe T., Kusa K., Yamakawa K., Sakamoto K., Naganawa T., Inubushi K., Hatano R. Kosaki T.: Spatial variability of N2O emissions and their soil-related determining factors in an agricultural field. J. Environ. Qual., 32, 1965-1977, 2003.
212. Yang S,S., Chang H.L.: Effect of environmental conditions on methane production and emission from paddy soil. Agric. Ecosyst. Environ., 69, 69-80, 1998.
213. Yao H., Yagi K., Nouchi I.: Importance of physical plant properties on methane transport through several rice cultivars. Plant and Soil, 222, 83-93, 2000.
214. Yue L., Erda L., Rao M.: The effect of agricultural practices on methane and nitrous oxide emissions from rice field and pot experiments. Nutr. Cycl. Agroecosyst., 49, 47-50, 1997.
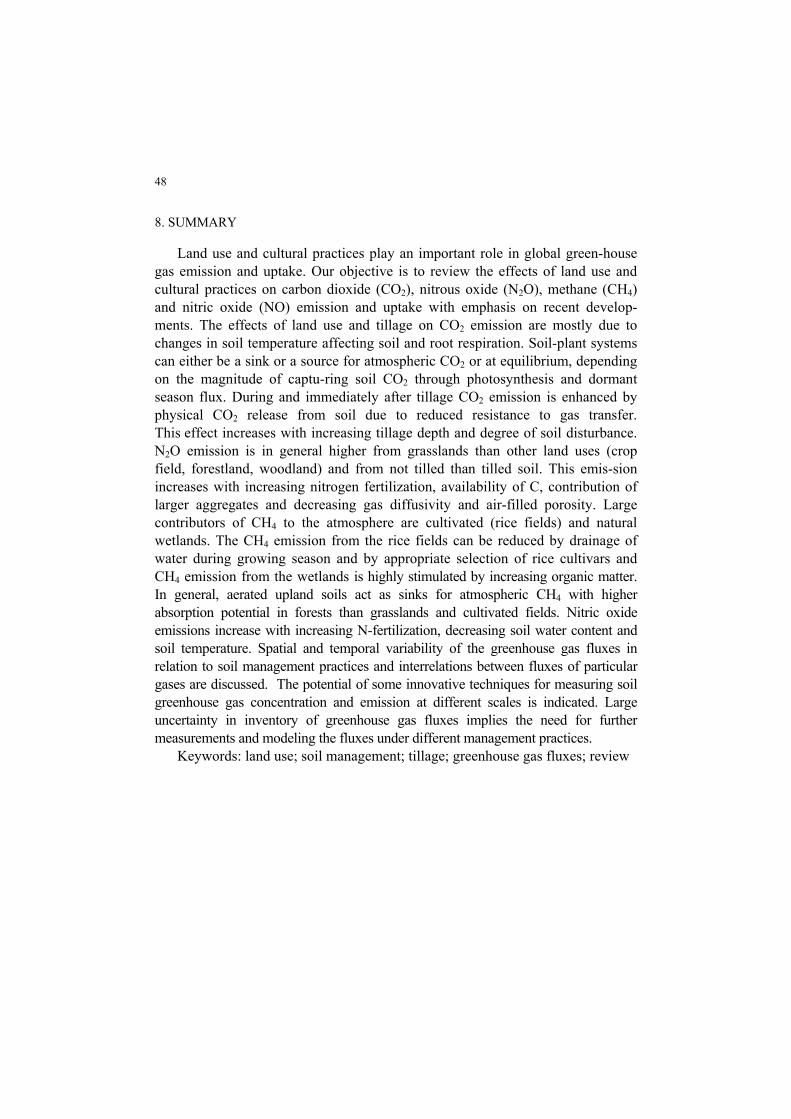
48
8. SUMMARY
Land use and cultural practices play an important role in global green-house gas emission and uptake. Our objective is to review the effects of land use and cultural practices on carbon dioxide (CO2), nitrous oxide (N2O), methane (CH4) and nitric oxide (NO) emission and uptake with emphasis on recent develop-ments. The effects of land use and tillage on CO2 emission are mostly due to changes in soil temperature affecting soil and root respiration. Soil-plant systems can either be a sink or a source for atmospheric CO2 or at equilibrium, depending on the magnitude of captu-ring soil CO2 through photosynthesis and dormant season flux. During and immediately after tillage CO2 emission is enhanced by physical CO2 release from soil due to reduced resistance to gas transfer. This effect increases with increasing tillage depth and degree of soil disturbance. N2O emission is in general higher from grasslands than other land uses (crop field, forestland, woodland) and from not tilled than tilled soil. This emis-sion increases with increasing nitrogen fertilization, availability of C, contribution of larger aggregates and decreasing gas diffusivity and air-filled porosity. Large contributors of CH4 to the atmosphere are cultivated (rice fields) and natural wetlands. The CH4 emission from the rice fields can be reduced by drainage of water during growing season and by appropriate selection of rice cultivars and CH4 emission from the wetlands is highly stimulated by increasing organic matter. In general, aerated upland soils act as sinks for atmospheric CH4 with higher absorption potential in forests than grasslands and cultivated fields. Nitric oxide emissions increase with increasing N-fertilization, decreasing soil water content and soil temperature. Spatial and temporal variability of the greenhouse gas fluxes in relation to soil management practices and interrelations between fluxes of particular gases are discussed. The potential of some innovative techniques for measuring soil greenhouse gas concentration and emission at different scales is indicated. Large uncertainty in inventory of greenhouse gas fluxes implies the need for further measurements and modeling the fluxes under different management practices. Keywords: land use; soil management; tillage; greenhouse gas fluxes; review
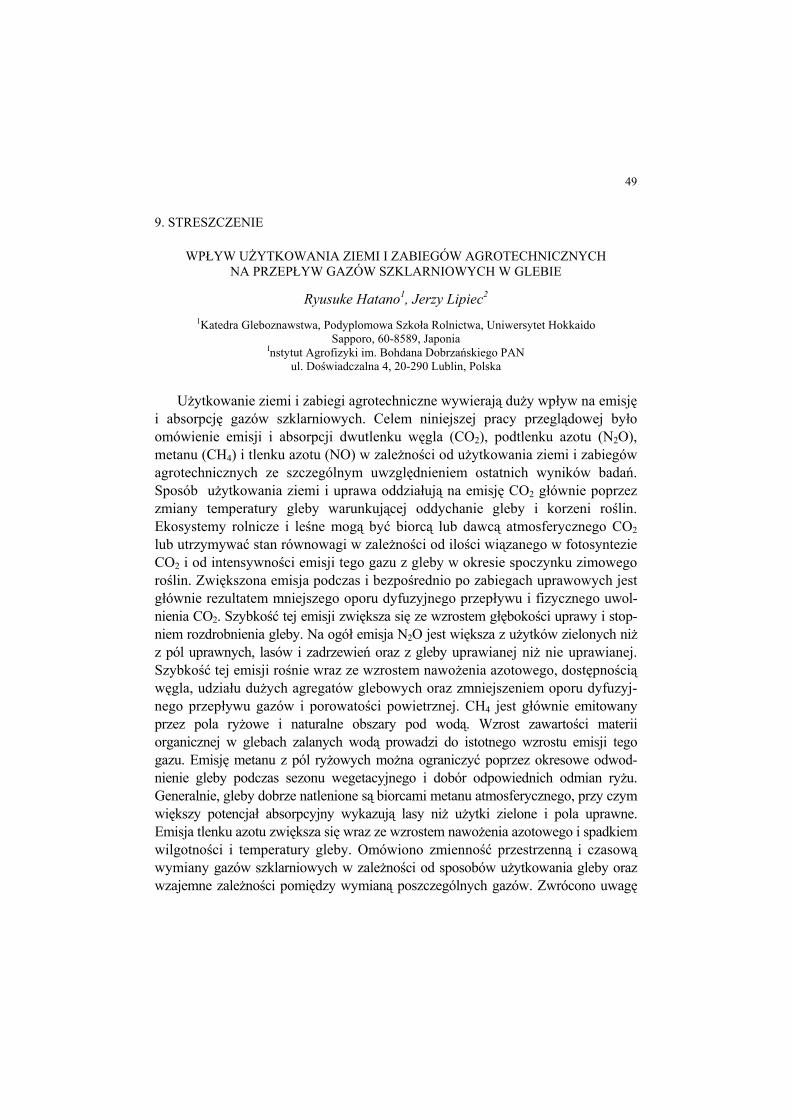
49
9. STRESZCZENIE
WPŁYW UŻYTKOWANIA ZIEMI I ZABIEGÓW AGROTECHNICZNYCH NA PRZEPŁYW GAZÓW SZKLARNIOWYCH W GLEBIE
Ryusuke Hatano1, Jerzy Lipiec2 1Katedra Gleboznawstwa, Podyplomowa Szkoła Rolnictwa, Uniwersytet Hokkaido
Sapporo, 60-8589, Japonia Instytut Agrofizyki im. Bohdana Dobrzańskiego PAN
ul. Doświadczalna 4, 20-290 Lublin, Polska Użytkowanie ziemi i zabiegi agrotechniczne wywierają duży wpływ na emisję i absorpcję gazów szklarniowych. Celem niniejszej pracy przeglądowej było omówienie emisji i absorpcji dwutlenku węgla (CO2), podtlenku azotu (N2O), metanu (CH4) i tlenku azotu (NO) w zależności od użytkowania ziemi i zabiegów agrotechnicznych ze szczególnym uwzględnieniem ostatnich wyników badań. Sposób użytkowania ziemi i uprawa oddziałują na emisję CO2 głównie poprzez zmiany temperatury gleby warunkującej oddychanie gleby i korzeni roślin. Ekosystemy rolnicze i leśne mogą być biorcą lub dawcą atmosferycznego CO2 lub utrzymywać stan równowagi w zależności od ilości wiązanego w fotosyntezie CO2 i od intensywności emisji tego gazu z gleby w okresie spoczynku zimowego roślin. Zwiększona emisja podczas i bezpośrednio po zabiegach uprawowych jest głównie rezultatem mniejszego oporu dyfuzyjnego przepływu i fizycznego uwol-nienia CO2. Szybkość tej emisji zwiększa się ze wzrostem głębokości uprawy i stop-niem rozdrobnienia gleby. Na ogół emisja N2O jest większa z użytków zielonych niż z pól uprawnych, lasów i zadrzewień oraz z gleby uprawianej niż nie uprawianej. Szybkość tej emisji rośnie wraz ze wzrostem nawożenia azotowego, dostępnością węgla, udziału dużych agregatów glebowych oraz zmniejszeniem oporu dyfuzyj-nego przepływu gazów i porowatości powietrznej. CH4 jest głównie emitowany przez pola ryżowe i naturalne obszary pod wodą. Wzrost zawartości materii organicznej w glebach zalanych wodą prowadzi do istotnego wzrostu emisji tego gazu. Emisję metanu z pól ryżowych można ograniczyć poprzez okresowe odwod-nienie gleby podczas sezonu wegetacyjnego i dobór odpowiednich odmian ryżu. Generalnie, gleby dobrze natlenione są biorcami metanu atmosferycznego, przy czym większy potencjał absorpcyjny wykazują lasy niż użytki zielone i pola uprawne. Emisja tlenku azotu zwiększa się wraz ze wzrostem nawożenia azotowego i spadkiem wilgotności i temperatury gleby. Omówiono zmienność przestrzenną i czasową wymiany gazów szklarniowych w zależności od sposobów użytkowania gleby oraz wzajemne zależności pomiędzy wymianą poszczególnych gazów. Zwrócono uwagę

50
na nowe metody pomiaru stężenia i emisji gazów szklarniowych w różnych skalach (agregaty glebowe, pola uprawne). Inwentaryzacja wymiany gazów szklarniowych obarczona jest dużą niepewnością. Stąd wynika potrzeba dalszych pomiarów i badań modelowych emisji i absorpcji tych gazów w zależności od sposobów użytkowania gleby i warunków klimatyczno-glebowych. Słowa kluczowe: użytkowanie gruntu, zabiegi agrotechniczne, przepływ gazów szklarniowych, przegląd literatury
51
Addresses of authors: Ryusuke Hatano Soil Science Laboratory, Graduate School of Agriculture Hokkaido University Sapporo, 60-8589 Japan e-mail: [email protected] Jerzy Lipiec Institute of Agrophysics, Polish Academy of Sciences ul. Doświadczalna 4, 20-290 Lublin, Poland tel. +48 81 7445061 fax +48 81 7445061 e-mail: [email protected]