Embed Size (px)
Citation preview

1
Effects of Gap Size and Excitation Frequency on the
Vibrational Behavior and Wear Rate of Fuel Rods
Zupan Hua, M. D. Thoulessa,b,* and Wei Lua, *
aDepartment of Mechanical Engineering bDepartment of Materials Science & Engineering
University of Michigan Ann Arbor, MI 48109, USA
* Corresponding author. Tel.: +1 734 647 7858 (W. Lu); fax: +1 734 647 3170 E-mail addresses: [email protected] (W. Lu), [email protected] (M.D. Thouless)
Abstract
Grid-to-rod fretting (GTRF) wear is a major cause of fuel leaks. Understanding its mechanism is crucial for improving the reliability of nuclear reactors. In this paper we present a three-dimensional, finite-element based approach, which reveals how the wear rate depends on the size of the gap between the grid and the fuel rod, and on the frequency of the excitation force. We show that these two factors affect the dynamic vibration of the rod, which leads to three different regimes: harmonic, period-doubling and chaotic. The wear rate in the harmonic regime is significantly larger than that in the other two regimes, and reaches a maximum when the excitation frequency is close to the resonant frequency of the system, which is dependent on the gap size. We introduce the concept of a critical gap size that gives the maximum wear rate, and we identify the properties and values of this critical gap size. A wear map is developed as a result of a large number of parametric studies. This map shows quantitatively the wear rate as a function of the gap size and excitation frequency, and will be a valuable tool for the design and optimization of the fuel assembly to reduce the risk of fuel leaks caused by GTRF.
(August 21, 2016)

2
1. Introduction
A major cause of fuel failure in a pressurized water reactor (PWR) is grid-to-rod
fretting (GTRF). This accounts for about 74% of all fuel leaks and is responsible for
costly shutdowns (Kim, 2009). GTRF is a phenomenon in which the turbulent flow of
the coolant exerts excitation forces on the fuel rods, causing the rods to vibrate against
the grid that supports them. This leads to fretting wear of the rod surfaces, i.e., the
zircaloy cladding around the fuel (Axisa et al., 1988; Kim, 2010c). While it has been
recognized that the problem is caused by the complex interaction between the rod, grid
and coolant (Bortoleto et al., 2013; Kim et al., 2001; Kim et al., 2006; Kovács et al.,
2009; Lee et al., 2005; Rubiolo and Young, 2009; Sung et al., 2001; Yan et al., 2011),
there is a lack of quantitative understanding of how the wear rate depends on the size of
the gap between the grid and the rod (referred to later as the "gap size"), and on the
frequency of the excitation force (referred to later as the "excitation frequency"). In this
study we address these two important factors and their roles in the GTRF problem.
The gap between a fuel rod and the grid depends on many factors. The rod is
designed to be held in place by a compressive load between the grid and the rod, using an
initial interference between the two components. However, this pre-load can be relaxed
by creep and deformation during assembly (Kim, 2010a, c), transportation (Kim, 2010c),
and operation (Wang et al., 2013). During operation, a gap can open because of creep-
down of the cladding (Wang et al., 2013), or close again because of fuel swelling or
expansion from hydride formation. A gap can also be created as a result of the formation
of a wear scar (Chung and Lee, 2011; Kim, 2010c; Zhang et al., 2012). Therefore,

3
understanding how the fretting wear is affected by the gap is of critical interest in the
design of nuclear reactors.
The gap size plays an important role in determining the wear rate. Multiple
possible scenarios may work together. A close fit between the rod and grid is often
associated with a larger contact pressure and frictional force, which tend to increase the
wear rate when sliding happens. However, a sufficiently tight fit can restrict sliding at the
contact interface, and therefore reduce the wear rate. A loose connection between the rod
and grid may lead to a high dynamic impact loads during oscillation; this would increase
the wear rate (Kim, 2009, 2013; Kim and Suh, 2008, 2009; Li et al., 2009; Zhang et al.,
2014). However, if the gap between the rod and the grid is too large, the oscillation may
not have sufficient amplitude to cause contact to happen at all; this would reduce the
wear rate. Of course, this is not a desirable condition since the spacer grid will not be able
to provide adequate support for the fuel rod, and wear may shift to adjacent supports.
The wear rate is also sensitive to the excitation frequency. The excitation force
associated with the turbulent flow has dominant frequencies that depend on the
mechanical design and flow velocity (Chen et al., 1995; Delafontaine and Ricciardi, 2012;
Kim, 2010c; Yan et al., 2011). Conceptually, the wear rate is expected to increase with
the fretting frequency (Lee et al., 2005) and the vibration amplitude of the rod, since a
higher fretting frequency means more fretting cycles per unit time, while a larger
amplitude is associated with a larger force. However, the situation is subtler than a simple
dependence on two parameters, because the fretting frequency and the vibration
amplitude of the rod are not independent. The excitation frequency affects both the
fretting frequency and the amplitude in a non-monotonic way, complicating the effect of

4
excitation frequency on wear. We found that as the excitation frequency varies, the rod
may experience harmonic, period-doubling and chaotic modes of vibration (Shaw and
Holmes, 1983). The dependence of the fretting frequency and amplitude of the rod on the
excitation frequency may change dramatically when the vibration mode of the rod
evolves from one regime to another.
Experimental studies of different designs of spacer grids suggest that larger gaps
result in greater wear (Kim, 2009; Kim and Suh, 2008, 2009). However, the conclusions
were tied to the specific conditions that were tested, and to a limited range of gap sizes.
Numerical studies of the GTRF problem, and of the related problem of wear of vibrating
heat-exchanger tubes, give inconclusive results. Some suggest that the wear rate may
decrease with gap size (Rubiolo, 2006; Rubiolo and Young, 2008), while others give
completely opposite predictions (Hassan et al., 2002; Rubiolo and Young, 2009).
Experiments based on displacement-controlled impact suggest that the wear rate
increases with the number of fretting cycles (Lee et al., 2005). However, as shown by
Shaw and Holmes (1983), the effect of excitation frequency on the fretting frequency and
vibration amplitude of a dynamic system, such as a rod, cannot be captured by a simple
displacement-controlled system. This issue forms a major aspect of the present paper.
Most existing numerical models for GTRF have been based on 1-D simulations.
While these models are capable of estimating how normal loads and displacements are
affected by the geometry and vibration, they cannot provide local wear information, since
this requires details about the contacts and local stresses (Hassan et al., 2005). In this
paper we use 3-D finite-element modeling to explore (i) the dynamic response of a fuel
rod under the driving forces of various frequencies induced by the coolant, (ii) the effects

5
of the gap size and initial interference on the wear rate of the rod, and (iii) the effect of
the excitation frequency on the wear rate. There are two key contributions of this study.
The first is the calculation of the critical gap size that generates the greatest wear. The
second is the calculation that shows how this critical gap depends on the excitation
frequency and dynamic response of the rod.
2. Numerical Method
A model of a fuel rod is shown in Fig. 1. The two ends of the rod are pinned. The
center of the rod is constrained by four pins that are connected to springs, and the springs
are connected to a fixed spacer grid. The stiffness of these springs reflects the effective
stiffness of more complicated support structures. Although many modes of vibration will
be exhibited by a fuel rod in a PWR, we limit this study to only the first mode of
vibration, in which the maximum displacement is at the center of the rod. A gap or
interference (defined as a negative gap) is established between the rod and the supports.
This is adjusted as part of the numerical studies. The fuel rod is composed of a zircaloy
cladding and UO2 fuel pellets. The mass of the two materials is combined together when
considering the vibration of the rod. However, it is assumed that the UO2 is not bonded
to the zircaloy, and does not contribute to the stiffness of the rod. The vibration of the rod
is assumed to occur along a plane inclined at 45° to the x- and y-axes, with symmetry
dictating that the amplitudes of the displacements in the x- and y-directions are the same.
This symmetric loading will result in the maximum frictional work rate for a given force
amplitude, however, it should be noted that the motion of the rod can be in any direction
in real applications (Rubiolo, 2006; Rubiolo and Young, 2008). The nomenclature for the

6
parameters and a list of the non-dimensional groups used in this analysis are given in
Tables 1 and 2.
Figure 2 shows a 3-D finite-element model of the rod and supports. The mesh
around the contact areas was refined to capture the contact information accurately. In
particular, the mesh was refined sufficiently to reduce any associated numerical errors to
less than the error bars that appear on any figures. The length and width of the contact
plates are 1.7 and 0.7 times of the outer radius of the rod, respectively. The contact plates
are made from zircaloy, and their dynamic responses are described by springs that have a
characteristic stiffness of ks. Our simulations showed that the effect from any material
damping of the support grid is negligible. The dynamic response of the system is
modeled using ABAQUS implicit dynamics. The contact between the plates and the fuel
rod is formulated using a master-slave contact pair: the surface nodes on the slave surface
move to avoid penetration by the master surface. We validated our model by test
calculations using the same dimensions, boundary conditions and material properties as
those in experiments (Shin et al., 1978) and in other numerical simulations (Sauvé and
Teper, 1987): the vibration displacements and the impact forces that we obtained were
consistent with those published results as shown in Fig. 3. The detailed dimensions and
boundary conditions for these comparisons are given in Shin et al. (1978).
The excitation force was modeled as a harmonic load, so that the effect of various
frequencies could be studied. We investigated a large spectrum of gap sizes and
excitation frequencies. For each calculation, we ran a transient simulation until a steady-
state response emerged, or until we could determine that the response was chaotic. The
chaotic response is expected to appear in some regimes during oscillating impact (Moon

7
and Shaw, 1983; Shaw, 1985; Shaw and Holmes, 1983). When periodic rod vibrations
could be identified, we used the steady-state vibration response to compute and evaluate
the wear rate. Otherwise, the behavior was identified as being chaotic. From the
perspective of understanding GTRF, it is important to appreciate that chaotic behavior
can emerge even when the driving force is harmonic.
The wear rate associated with different parameters was estimated using Archard’s
Law (Johnson, 1984). In the local form of this law, the evolution of the wear depth, w,
with time t at any point (x, y) on a surface is given by
0
( , , ) ( , , )t
w x y t p x y t dµχ= Δ∫ , (1)
where t is time, p(x,y,t) is the local contact pressure,µ is the coefficient of friction, χ is
the wear coefficient, and Δ is the local slip distance. Since the friction coefficient and the
wear coefficient depend on wear mechanisms as well as material and operational
conditions. (Kim et al., 2006; Kim, 2010b; Rubiolo and Young, 2009), our results are
presented using normalized parameters. In this study we defined an average wear rate, or
the increase in depth per unit time, to evaluate and compare the rate at which the wear
depth increased under various conditions. If the rod vibration reached a periodic steady-
state, we divided the accumulated wear depth over a steady-state cycle by the total time
of the cycle, which gives the wear rate. Error bars are determined based on the wear rate
of five cycles. Consideration of additional cycles for the periodic vibration did not change
the result. If no periodicity was observed, the vibration was identified as being chaotic.

8
3. Results
3.1 Vibrational response
Several studies (Moon and Shaw, 1983; Shen et al., 2012; Wei et al., 2011) have
shown that the vibrational response of an object is sensitive to the excitation frequency,
and may exhibit several types of vibrational behaviors. For the GTRF problem
considered here, we first needed to determine whether the system could reach a steady-
state mode of vibration. We identified three types of vibrations. In Type 1, the fuel rod
impacted the plate in each cycle, and the vibration displacement was the same for each
cycle. In Type 2, the fuel rod impacted the plate during each cycle, but the displacement
varied between sequential cycles. In Type 3, the fuel rod might not impact the plate
during some cycles, and the vibration was chaotic.
Figure 4 shows examples of these three types of vibrational responses. The time
in these figures is normalized by the first resonant frequency for the vibration of the free
rod; this was obtained by calculating the vibration mode of a free rod, without any
support plates. The displacement in these figures is normalized by the cladding thickness.
The first two examples of behavior illustrated are Types 1 and 2; they are both periodic,
but have different periods. The vibrational period of the first type is the same as that of
the excitation force; the period of the second type is greater than that of the excitation
force. These two types are referred to as the harmonic and period-doubling regimes,
respectively. The third example shown in Fig. 4 is Type 3. It is not periodic, and there
may, or may not be, impact in any given cycle; therefore, it is referred to as the chaotic
regime. This chaotic response arises because of the nonlinearity of the system; a detailed
discussion about its origin can be found in Moon and Shaw (1983) and in Thompson and

9
Ghaffari (1982). The wear rate during chaotic vibrations is relatively low since the rate
of impact with the plate is small.
Figure 5 shows the impact force in the harmonic regime. The impact force is
defined as the integration of the contact pressure p(x,y,t) over the contact area. The
impact force and the slip during contact both increase with gap size. Therefore the wear
rate increases with gap size in this regime. However, it should be noted that this trend
persists only in the harmonic regime, because the contact force and slip change in a non-
monotonic way in the other two regimes.
3.2 The effects of gap size and excitation frequency on the wear rate
Harmonic regime: We calculated the wear rate using the method discussed in Section 2.
The maximum local wear rate (referred to later simply as the "wear rate"), W, was
obtained by surveying all contact points in the contact area. The dependence of the wear
rate on the gap size is shown in Fig. 6. The wear rate increases with the gap size, until it
peaks at a critical gap size, and then drops suddenly. The correlation between the wear
rate and the gap size in the harmonic regime can be understood by referring to Fig. 5. As
the gap size increases, both the impact force and the slip distance increase. Therefore, the
frictional work rate becomes larger, and the wear rate per cycle increases. The number of
impacts per unit of time in the harmonic regime is given by the excitation frequency, and
is independent of gap size. As a result, the wear rate increases with the gap size.
Beyond the critical gap size, the vibration becomes chaotic. In the chaotic regime,
the vibration is not periodic and the wear rates are somewhat dependent on the specific
sampling intervals that are chosen for evaluation. However, they are all very small in

10
comparison to the wear rate in the harmonic and period-doubling regimes, as shown in
Fig. 6. The reason for the small wear rate is that the chaotic vibration significantly
reduces the chance of contact between the fuel rod and the plate, as shown in Fig. 4(c). In
the chaotic regime the vibrational behavior is fairly complicated owing to the lack of
periodicity. However, for practical applications we do not need to worry much about this
regime, since the wear rate is small. A comparison between the plots in Fig. 6 shows that
the critical size of gap at which chaotic behavior occurs decreases as the normalized
excitation frequency, f/fn, increases.
Period-doubling regime: Figure 7 shows the relationship between the wear rate and the
gap size at a lower excitation frequency, where the period-doubling regime appears.
Although the wear rate still increases with the gap size in the period-doubling regime, it
fluctuates more significantly. A comparison between Fig. 7 and Fig. 6 shows that the
wear rate is smaller for those conditions where a period-doubling regime exists.
However, it should be noted that there is no sharp boundary between the harmonic,
period-doubling and chaotic regimes.
3.3 A wear rate map of the gap size and the excitation frequency
We performed a series of calculations similar to those used to produce Figs. 5 and
6, covering a large spectrum of gap sizes and excitation frequencies. The results are
presented as a wear map in Fig. 8, which shows the dependence of the wear rate on the
gap size and excitation frequency. In the harmonic regime, there is a critical gap that is
associated with the maximum wear rate for each excitation frequency. When the gap
exceeds this critical value, the vibration becomes chaotic and the wear rate drops
dramatically.

11
We found that the maximum wear rate in the landscape of gap size and excitation
frequency correlates with the natural resonance of the system, which is defined as the
frequency of the first mode of free vibration of a system consisting of the rod and support
plates. To determine the resonant frequency of the system, we applied an initial
displacement to the rod that was large enough to cause contact between the rod and the
plate. We then released the rod, and observed the vibration for the displacement at the
middle of the rod. When the gap size was relatively small, we found that the vibration
was dominated by the first mode, and that the resonant frequency of the system was,
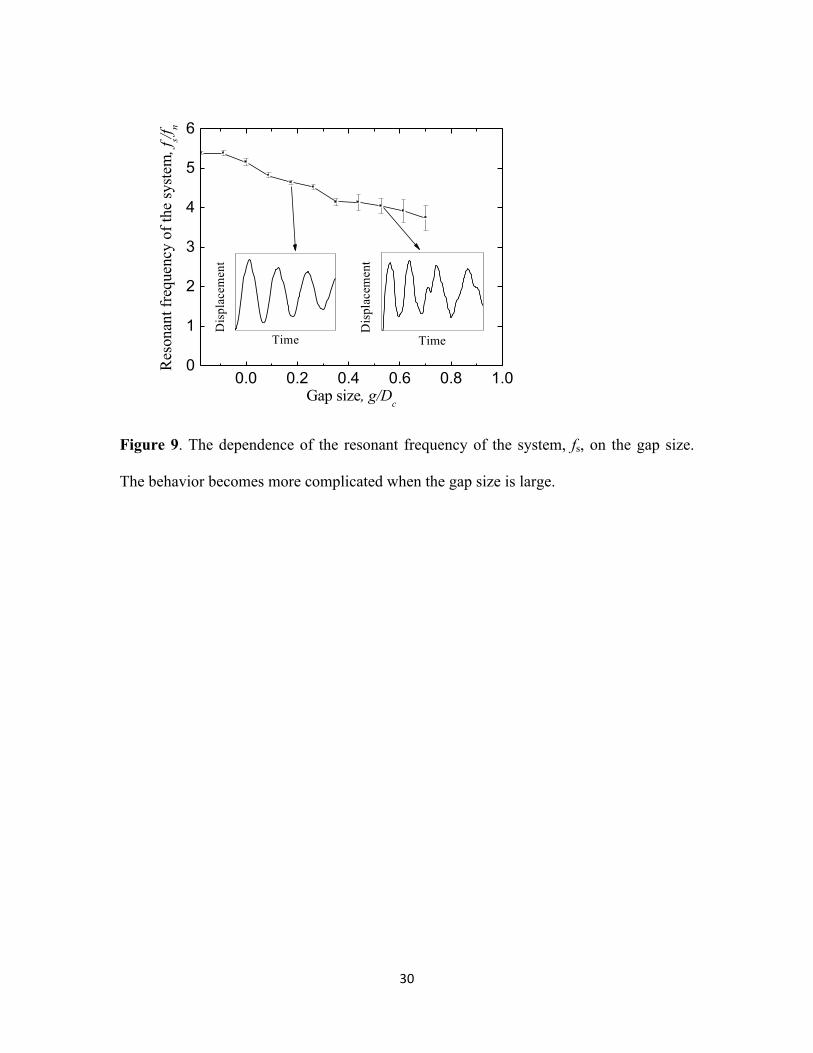
therefore, straightforward to determine. The dependence of the resonant frequency of the
system on the gap size in this regime is shown in Fig. 9, which also shows how the
nonlinearities become more significant as the gap size increases.
The plot of Fig. 9 is superimposed on the map given in Fig. 8. It will be seen that
the curve appears generally to overlap the peaks in the wear-rate contours. In other
words, the peak wear rates correspond to the resonance conditions. Although the
amplitude of the excitation force does affect the magnitude of the wear rate, it has little
effect on the location of these peak wear rates, because the resonant frequency of the
system is independent of the loading amplitude. The dependence of the wear rate on the
gap size and the excitation frequency becomes more complicated with the appearance of
period-doubling and chaotic behavior, but the wear rates in these regimes are much
smaller.
For a given excitation frequency and amplitude, there will be no wear if the gap
size is larger than the vibration amplitude of a free rod. We simulated the vibration of a
free rod under different excitation frequencies. Using the maximum vibration amplitude,

12
we can identify the wear and no-wear regimes. These are shown in Fig. 10 (as well as
being partially shown in Fig. 8). When the excitation frequency is close to the resonant
frequency of the free rod, or f/fn=1, we have the largest possible gap size that results in
some wear. However, as shown in Fig. 8, the wear rate is relatively small in this
condition.
We can also gain some insights about the excitation frequency from the
perspective of wear growth. The gap size increases as a result of wear. When the
excitation frequency is relatively low, say close to or a little above f/fn=1, the wear scar
grows slowly. However, wear will occur over an extended time, continuing even when
the gap becomes relatively large. On the other hand, in the harmonic regime, with a
relatively high excitation frequency, the wear rate is large. The wear scar will initially
grow quickly, but then decrease rapidly as the gap size increases, and the vibration
becomes chaotic.
4. Discussion
In GTRF problems, the vibration frequencies of the fuel rod observed in tests
(Kim, 2010c; Rubiolo and Young, 2009) or simulations (Rubiolo, 2006; Rubiolo and
Young, 2008) are significantly smaller than the dominant frequencies of the turbulent
flow (Delafontaine and Ricciardi, 2012; Yan et al., 2011). Instead, the vibration is more
likely to be a resonant response to certain frequencies close to the natural frequency of a
continuously supported rod (Choi et al., 2004). Indeed, we found that a resonant
frequency can be defined for a system with a small gap between the support and the fuel
rod, which results in a maximum wear rate. In real applications, the stiffness of the fuel
rod may change over time when pellets start to bond to the cladding. However, the

13
results of Fig. 8 are presented in a non-dimensional form. Therefore, if the resonant
frequency of the rod or of the system at any given time is determined through a separate
FEA simulation, the maximum wear rate can be easily predicted using this figure, even if
the boundary conditions such as the gap size, the rod stiffness or the dominant load
amplitude are changed.
In this study we simulated a unit two-span spacer-grid segment of the fuel rod,
and investigated gap formation at the center. It was assumed that there is sufficient
support to the fuel rod at the end points. This model can also represent the case of a two-
span/one-support spacer grid along the entire length of the fuel rod, after scaling the
length of the rod. In real applications, simultaneous gap formation at multiple supports
can happen, which makes the problem more complicated. However, the results of the
simple model provided important understanding of how the gap size and excitation
frequency affect the vibration and wear rate. We expect that the method and the
understanding, such as using the resonant frequency of the system to determine the
excitation frequency that results in the maximum wear rate for a given gap size, can be
extended to more complicated situations. For instance, one can use a 1-D model to
identify the system resonant frequency (Kim, 2010b), and then map the displacement to a
3-D model to calculate wear.
5. Conclusions
In this paper we investigated the effects of gap size and excitation frequency on
the vibration and wear rate of a fuel rod using a 3D dynamic model. It was observed that
the wear rate is sensitive to the vibration response of the system. One of the important
observations of this work is that chaotic behavior occurs in such a system, even if it is

14
assumed that the forcing function from the fluid is periodic. The wear rate in the
harmonic regime is significantly larger than that in the period-doubling or chaotic
regimes. Based on simulations of a large spectrum of gap sizes and excitation frequencies,
we found that there is a critical gap size resulting in a maximum wear rate, and that this
critical gap depends on the excitation frequency. The peak wear rate appears to occur at
vibrations corresponding to the natural resonance of the system, which also depends on
the gap size. By avoiding the high-wear-rate regimes through geometrical design of the
fuel assembly, the risk of fuel leak due to GTRF wear can be significantly reduced. For
this purpose, our present study focused on quantifying and evaluating the effect of gap
size on the wear rate. Tracking the growth of wear scars (Hu et al., 2015a; Hu et al.,
2015b, 2016) as well as incorporating mechanisms such as creep is currently in progress.
Acknowledgements
This research was supported by the Consortium for Advanced Simulation of Light
Water Reactors (http://www.casl.gov), an Energy Innovation Hub
(http://www.energy.gov/hubs) for Modeling and Simulation of Nuclear Reactors under
U.S. Department of Energy Contract No. DE-AC05-00OR22725.

15
References
Axisa, F., Antunes, J., Villard, B., 1988. Overview of numerical methods for predicting
flow-induced vibration. Journal of Pressure Vessel Technology 110, 6-14.
Bortoleto, E.M., Rovani, A.C., Seriacopi, V., Profito, F.J., Zachariadis, D.C., Machado,
I.F., Sinatora, A., Souza, R.M., 2013. Experimental and numerical analysis of dry
contact in the pin on disc test. Wear 301, 19-26.
Chen, S.S., Zhu, S., Cai, Y., 1995. Experiment of chaotic vibration of loosely supported
tube rows in cross-flow. Journal of Pressure Vessel Technology 117, 204-212.
Choi, M.H., Kang, H.S., Yoon, K.H., Song, K.N., 2004. Vibration analysis of a dummy
fuel rod continuously supported by spacer grids. Nuclear Engineering and Design 232,
185-196.
Chung, I., Lee, M., 2011. An experimental study on fretting wear behavior of cross-
contacting Inconel 690 tubes. Nuclear Engineering and Design 241, 4103-4110.
Delafontaine, S., Ricciardi, G., 2012. Fluctuating pressure calculation induced by axial
flow trough mixing grid. Nuclear Engineering and Design 242, 233-246.
Hassan, M.A., Weaver, D.S., Dokainish, M.A., 2002. A simulation of the turbulence
response of heat exchanger tubes in lattice-bar supports. Journal of Fluids and
Structures 16, 1145-1176.
Hassan, M.A., Weaver, D.S., Dokainish, M.A., 2005. A new tube/support impact model
for heat exchanger tubes. Journal of Fluids and Structures 21, 561-577.
Hu, Z., Lu, W., Thouless, M.D., 2015a. Slip and wear at a corner with Coulomb friction
and an interfacial strength. Wear 338–339, 242-251.
Hu, Z., Lu, W., Thouless, M.D., Barber, J.R., 2015b. Simulation of wear evolution using
fictitious eigenstrains. Tribology International 82, Part A, 191-194.
Hu, Z., Lu, W., Thouless, M.D., Barber, J.R., 2016. Effect of plastic deformation on the
evolution of wear and local stress fields in fretting. International Journal of Solids and
Structures 82, 1-8.
Johnson, K., 1984. Contact mechanics. Cambridge University Press, Cambridge, UK.
Kim, H.-K., Kim, S.-J., Yoon, K.-H., Kang, H.-S., Song, K.-N., 2001. Fretting wear of
laterally supported tube. Wear 250, 535-543.

16
Kim, H.-K., Lee, Y.-H., Heo, S.-P., 2006. Mechanical and experimental investigation on
nuclear fuel fretting. Tribology International 39, 1305-1319.
Kim, K.-T., 2009. The study on grid-to-rod fretting wear models for PWR fuel. Nuclear
Engineering and Design 239, 2820-2824.
Kim, K.-T., 2010a. The effect of fuel rod loading speed on spacer grid spring force.
Nuclear Engineering and Design 240, 2884-2889.
Kim, K.-T., 2010b. The effect of fuel rod supporting conditions on fuel rod vibration
characteristics and grid-to-rod fretting wear. Nuclear Engineering and Design 240,
1386-1391.
Kim, K.-T., 2010c. A study on the grid-to-rod fretting wear-induced fuel failure observed
in the 16×16KOFA fuel. Nuclear Engineering and Design 240, 756-762.
Kim, K.-T., 2013. Applicability of out-of-pile fretting wear tests to in-reactor fretting
wear-induced failure time prediction. Journal of Nuclear Materials 433, 364-371.
Kim, K.-T., Suh, J.-M., 2008. Development of an advanced PWR fuel for OPR1000s in
Korea. Nuclear Engineering and Design 238, 2606-2613.
Kim, K.-T., Suh, J.-M., 2009. Impact of nuclear fuel assembly design on Grid-to-Rod
Fretting Wear. Journal of Nuclear Science and Technology 46, 149-157.
Kovács, S., Stabel, J., Ren, M., Ladouceur, B., 2009. Comparative study on rod fretting
behavior of different spacer spring geometries. Wear 266, 194-199.
Lee, Y.-H., Kim, H.-K., Jung, Y.-H., 2005. Effect of impact frequency on the wear
behavior of spring-supported tubes in room and high temperature distilled water.
Wear 259, 329-336.
Li, X.C., Gu, H., Gao, X.L., 2009. Molecular Dynamics Study on Mechanical Properties
and Interfacial Morphology of an Aluminum Matrix Nanocomposite Reinforced by
-Silicon Carbide Nanoparticles. Journal of Computational and Theoretical
Nanoscience 6, 61-72.
Moon, F.C., Shaw, S.W., 1983. Chaotic vibrations of a beam with non-linear boundary
conditions. International Journal of Non-Linear Mechanics 18, 465-477.
Rubiolo, P.R., 2006. Probabilistic prediction of fretting-wear damage of nuclear fuel rods.
Nuclear Engineering and Design 236, 1628-1640.

17
Rubiolo, P.R., Young, M.Y., 2008. VITRAN: an advance statistic tool to evaluate
fretting-wear damage. Journal of Power and Energy Systems 2, 57-66.
Rubiolo, P.R., Young, M.Y., 2009. On the factors affecting the fretting-wear risk of PWR
fuel assemblies. Nuclear Engineering and Design 239, 68-79.
Sauvé, R.G., Teper, W.W., 1987. Impact simulation of process equipment tubes and
support plates—A numerical algorithm. Journal of Pressure Vessel Technology 109,
70-79.
Shaw, S.W., 1985. Forced vibrations of a beam with one-sided amplitude constraint:
Theory and experiment. Journal of Sound and Vibration 99, 199-212.
Shaw, S.W., Holmes, P.J., 1983. A periodically forced impact oscillator with large
dissipation. Journal of Applied Mechanics 50, 849-857.
Shen, X., Liu, Y., Cao, L., Chen, X., 2012. Numerical simulation of sliding wear for self-
lubricating spherical plain bearings. Journal of Materials Research and Technology 1,
8.
Shin, Y., Sass, D., Jendrzejczyk, J., 1978. Vibro-impact responses of a tube with tube--
baffle interaction. Argonne National Lab., Ill.(USA).
Sung, J.H., Kim, T.H., Kim, S.S., 2001. Fretting damage of TiN coated zircaloy-4 tube.
Wear 250, 658-664.
Thompson, J.M.T., Ghaffari, R., 1982. Chaos after period-doubling bifurcations in the
resonance of an impact oscillator. Physics Letters A 91, 5-8.
Wang, H., Hu, Z., Lu, W., Thouless, M.D., 2013. A mechanism-based framework for the
numerical analysis of creep in zircaloy-4. J Nucl Mater 433, 188-198.
Wei, C., Chan, J., Garmire, D., 2011. 3-axes MEMS Hall-effect sensor, Sensors
Applications Symposium (SAS), 2011 IEEE, pp. 141-144.
Yan, J., Yuan, K., Tatli, E., Karoutas, Z., 2011. A new method to predict Grid-To-Rod
Fretting in a PWR fuel assembly inlet region. Nuclear Engineering and Design 241,
2974-2982.
Zhang, J., Johnston, J., Chattopadhyay, A., 2014. Physics-based multiscale damage
criterion for fatigue crack prediction in aluminium alloy. Fatigue & Fracture of
Engineering Materials & Structures 37, 119-131.

18
Zhang, J., Liu, K., Luo, C., Chattopadhyay, A., 2012. Crack initiation and fatigue life
prediction on aluminum lug joints using statistical volume element–based multiscale
modeling. Journal of Intelligent Material Systems and Structures.

19
Tables
Table 1: Nomenclature
Dc thickness of the Zircaloy cladding E Young’s modulus of the Zircaloy cladding f excitation frequency fn resonant frequency of a free rod Fa amplitude of the excitation force g gap size ks stiffness of the spring L half-length of the rod p local contact pressure R outer radius of the rod t time U displacement of the rod w wear depth W maximum local wear rate in the contact area
(increase in depth per unit time) Δ slip distance µ coefficient of friction v ρ
Poisson’s ratio of the Zircaloy cladding density of the Zircaloy cladding
χ wear coefficient
Table 2: Values of non-dimensional parameters held fixed in all the calculations
/ cL D 920 / cR D 7.5
a
c s
FD k
41.2 10−×
µ 0.25 χE 43 10× s
c
kED
32 10−×
2 2nL f
Eρ
66 10−×
ν 0.342

20
Figures
Figure 1. A schematic illustration of the model used for the GTRF simulation. The fuel
rod has an outer radius of R with a cladding thickness of Dc. Four support plates are
connected to springs with a stiffness of ks. The gap between the fuel rod and the plate is g.
The rod vibrates along a plane that is diagonal to the x- and y-axes.

21
Figure 2. The 3-D finite-element model used for the dynamic simulations. Each plate is
connected to ground springs with a total stiffness of ks. Contact elements and refined
meshes are used in the contact regions.

22
(a)
0 1 2 3 4 5-0.06
-0.04
-0.02
0.00
0.02
0.04
0.06
0.08
Dis
plac
emen
t, U/D
c
Time,tf
Experiment (Shin et al.,1978)Simulation (Sauve and Teper,1987)
(b)
0 1 2 3 4 50
2
4
6
8
10
Forc
e,F/F a
Time,tf
Experiment (Shin et al.,1978)Simulation (Sauve and Teper,1987)
Figure 3. The displacement (a) and impact force (b) of the validation model are
consistent with published experiments and numerical simulations.

23
(a)
0.0 0.5 1.0 1.5-0.4
-0.2
0.0
0.2
0.4
Displacement,
U/D
c
Time, tfn
Fa/(Dcks)=1.2×10-4
f/fn=5, g/Dc=0.05
(b)
0 1 2 3
-0.4
-0.2
0.0
0.2
0.4
Displacement,
U/D
c
Time, tfn
Fa/(Dcks)=1.2×10-4
f/fn=2, g/Dc=0.2

24
(c)
0.0 0.5 1.0 1.5-0.3
-0.2
-0.1
0.0
0.1
0.2
0.3Fa/(Dcks)=1.2×10
-4 f/fn=5, g/Dc=0.2
Displacement,
U/D
c
Time, tfn
Figure 4. Three types of vibrations were observed in the simulations. (a) Type 1: the rod
impacts the plate in each cycle. The vibration is periodic, and the period is equal to that
of the excitation force. (b) Type 2: the rod impacts the plate in each cycle. The vibration
is periodic but with a period greater than that of the excitation force. The period of the
vibration changes with gap size. (c) Type 3: the rod may or may not impact the plate in
any given excitation cycle, and the vibration is chaotic.

25
0.0 0.5 1.0 1.50
2
4
6
8
10
12
14Fa/(Dcks)=1.2×10-4
f/fn=5
Impa
ct fo
rce,
F/F
a
Time, tfn
g/Dc=0.130.090.05
Figure 5. The impact force increases with the gap size, g/Dc, in the harmonic regime.

26
(a)
-0.2 0.0 0.2 0.4 0.6 0.8 1.0 1.20.0
0.2
0.4
0.6
0.8
1.0
Gap size, g/Dc
Harmonic
Fa/(Dcks)=1.2×10-4
f/fn=3M
axim
um lo
cal w
ear r
ate,
WD
c/(χF a f n)
Chaotic
(b)
-0.2 0.0 0.2 0.4 0.60.0
0.5
1.0
1.5
2.0
Harmonic
Gap size, g/Dc
Fa/(Dcks)=1.2×10-4
f/fn=4
Max
imum
loca
l wea
r rat
e, W
Dc/(χ
F a f n)
Chaotic

27
(c)
-0.2 -0.1 0.0 0.1 0.2 0.3 0.40
10
20
30
40
50
60
Gap size, g/Dc
Harmonic
Fa/(Dcks)=1.2×10-4
f/fn=5M
axim
um lo
cal w
ear r
ate,
WD
c/(χF a f n)
Chaotic
Figure 6. Plots of the relationship between the maximum local wear rate and the gap size
at various excitation frequencies of f/fn=3, 4 and 5. The wear rate with an interference (a
negative gap size) is smaller than that with a gap. The wear rate increases with the gap
size until it peaks at a particular gap that we call the critical gap size. Beyond this the
vibration becomes chaotic and the wear rate drops dramatically.

28
-0.2 0.0 0.2 0.4 0.60.00
0.02
0.04
0.06
0.08
0.10
0.12
Gap size, g/Dc
ChaoticHarmonic
Fa/(Dcks)=1.2×10-4
f/fn=1
Max
imum
loca
l wea
r rat
e, W
Dc/(χ
F a f n)
Period doubling
Figure 7. Plot of the relationship between the maximum local wear rate and the gap size
at excitation frequencies of f/fn=1. With the existence of a period-doubling regime, the
wear rate is smaller than that in Fig. 5.

29
0.0 0.2 0.4 0.6 0.8 1.00
1
2
3
4
5
6
Resonant frequency of the system
Fa/(Dcks)=1.2×10-4
No wear
No wear 1E-01
1E+00
1E+01
1E+02Exci
tatio
n fr
eque
ncy,
f/f n
Gap size, g/Dc
Chaotic
Harmonic
Period Doubling Chaotic
Wear rateWDc/(χFafn)
Figure 8. A wear-rate map for a large spectrum of gap sizes and excitation frequencies.
The critical gap size, which is associated with the maximum wear rate, lies within the
harmonic regime. In the no wear region the amplitude of the rod vibration is smaller than
the gap size so that no impact between the rod and plate can happen. The curve of the
resonant frequency of the system (from Fig. 8) appears to overlap with the peaks in the
contour.
30
0.0 0.2 0.4 0.6 0.8 1.00
1
2
3
4
5
6
Dis
plac
emen
t
Time
Dis
plac
emen
t
Time
Res
onan
t fre
quen
cy o
f the
syst
em, f
s/f n
Gap size, g/Dc
Figure 9. The dependence of the resonant frequency of the system, fs, on the gap size.
The behavior becomes more complicated when the gap size is large.

31
0 1 2 3 4 5 6 7 80
1
2
3
4
5
6
Exci
tatio
n fr
eque
ncy,
f/f n
Gap size, g/Dc
Wear
No wear
No wear
Fa/(Dcks)=1.2×10-4
Figure 10. There is no wear if the gap size is larger than the vibration amplitude of the
rod.