Embed Size (px)
Citation preview
DOCUMENT RESUME
ED 046 974 TM 000 33a
AITHOP"T7LR
PUB DATENOT"
EDRS PRICEDESCRIPTORS
ABSTRACT
Segal, MarilynEffects of Four Different Perceptual TrainingPrograms on IQ and Reading Readiness in the LowerSocio-Fcononic Level Ksindergarten Child.Feb 71/Up.: Paper presented at the Annual Meeting of theAmerican Educational Research Association, New York,New York, 7ebruary 1971
EDPS Price Mr-$0.65Auditory Perception, Auditory Training, BehavioralObleotives, Curriculum Development, CurriculumPlanning, Day Care Programs, 7conomicallyDisadvantaged, *Intelligence Quotient, *KindergartenChildren, *Lower Class Students, Negro Students.*Perceptual Development, Perceptual MotorCoordination, Program Yffectiver5,ss, *PeadinoReadiness, Sensory Training, Skill Development,Socially Disadvantaged, Training Techniques, VisualPerception
The effects of four different kinds of perceptualtraining programs on TQ ard Reading Readiness in a population oflower socio-economic level kindergarten children were explored toprovide useful information for curriculum Planning. Pate. was gatheredon 54 disadvantaoed olds in an ORO day care center. During theafternoon session, children were randomly assigned to treatmentgroups for formal learning activities. The same general curriculumwas followed in all treatment. groups, bait each treatment stressed adifferent kind of perceptual training: Tre,itment 1 stressed "generalreadiness," non-alphabet, and visual skills; Treatment 2 stressedalphabet perceptual skills in a primarily visual mode; Treatmentstressed alphabet perceptual skills in a Primarily auditory mode: are'rPatment a placed equal stress on auditory and visual alphabetperceptual skills. At the end of the treatment period (3. days), allfour groups improved one or more stanine points on reading readinessmeasures. Group a scored significantly better than the other threegroups pooled in terms of TO gain, and significantly better than theauditory group on reading readiness in suhtpsts measuring visualperceptual abilities. Data is reported anr, analyzed in completedetail. (Author/PF)
!
EFFECTS OF FOUR DIFFERENT PERCEPTUAL TRAININGPROGRAMS ON IQ AND READING READINESS IN THE LOWER
SOCIO-ECONOMIC LEVEL KINDERGARTEN CHILI)
by
Marilyn Segal
U II DEPARTMENT OFHEALTH, EDUCATION
&WELFAREOFFICE OF EDUCATION
THIS DOCUMENT HASBEEN REPRODUCED
ExACTLY AS RECEIVED FROMTHE PERSON OR
ORGANIZATION ORIGINATING11 POINTSM
OF
VIM OR OPINIONSSTATED DO NOT NE
SARILy REPRESENT OFFICIALOFFICE OF (DU
CATION POSITION OR POLICY
A wide variety of reading readiness, programs for the lower socio-
economic level (SEL I) black child have been developed in recent years.
These programs vary in methodology, content and focus, and reflect diver-
gent opinions as to the need priorities of the SET, I black child. Pro-
grams giving the same priority to perceptual training, differ both as to
the 'eve of perceptual skills they focus on, and to the relative impor-
tance assigned to auditory and visual modality training. The present study
is concerned with the evaluation of four different perceptual training pro-
grams for the SEL I kindergarten child. It explores the effects of these
programs on IQ change and reading readiness measures and provides informa-
tion that can be used as the basis of a curriculum decision.
The poor performance of the SEL I child on perceptual tasks (Spathe,
.1967; Harris, 1969) and the importance of perceptual skills in early reading
performance (RudniCkj967; Ashlock, 1967) is well documented. There is
however, a lack of agreement as to the type of reading readiness experience
that will have the highest probability of enabling the SEL I child to
acquire the skills that are important for early reading performance.
Many educational theorists concerned with reading readiness stress the
importance of developing a cluster of general readiness perceptual skills
(Rudnick, 3947; Frostig, 1966). According to this school of thought, general
readiness non-alphabet skills must be mastered before the child can be suc-
cessful with the higher-order alphabet skills directly involved in decoding.
ton- alphabet perceptual skills associated with reading performance include
visual motor skills, visual and auditory perception skills, seriation and
auditory visual integration.

Visual-Motor Skills. The relationship of visual-motor skills to read-
ing performance has not been clearly defined. Delacato (1963), Getman
and Hendrickson (1966), and HarriS (1968) report significant correlations
between visual-motor skills and reading performance. Grattan and Martin
(1965), Kershner (1969), and Taylor and Nolde (1969) report no siginifi-
cant difference between measures of visual-motor proficiency and meas-
ures of reading performance. Jeralyn Flack (1968) reports highly sig-
nificant relationships between reading and throw-and-catch and zigzag-run
tests, but no relationship between reading, kicking, jumping, and reach
tests.
Visual Skills. Marianne Frostig (Frostig and Horne, 1964) identifies six
visual perception skills associated.with reading performance: position
in space, spatial relationship, figure ground perception, perceptual con-
stancy, directionality, and hand-eye coordination. To measure these vari-
ables, Frostig Oevelopcd a visual perception test. Correlation studies
.14kd-on Frostig's test yield conflicting results. Quentin R. Bryan (1964)
reports a study with first, second, and third grade children in which
visual perception, as measured by the Frostig test, is a better predictor
of first grade reading success than intelligence or reading readiness
scores. In studies by both Jacobs (1968) and Weingart (1968), perceptual
scores based on the Frostig test are not correlated with first grade read-
ing performance. Frostig developed a reading readiness program designed
to develop the six visual perception skills to which she assigns priority.
Jean Coins (1958) administered sixteen different visual perception
measures to 120 first grade students. Using factor analysis, she identi-
fied two factors which clarify the intercorrelation patterns of 0.e sixteen
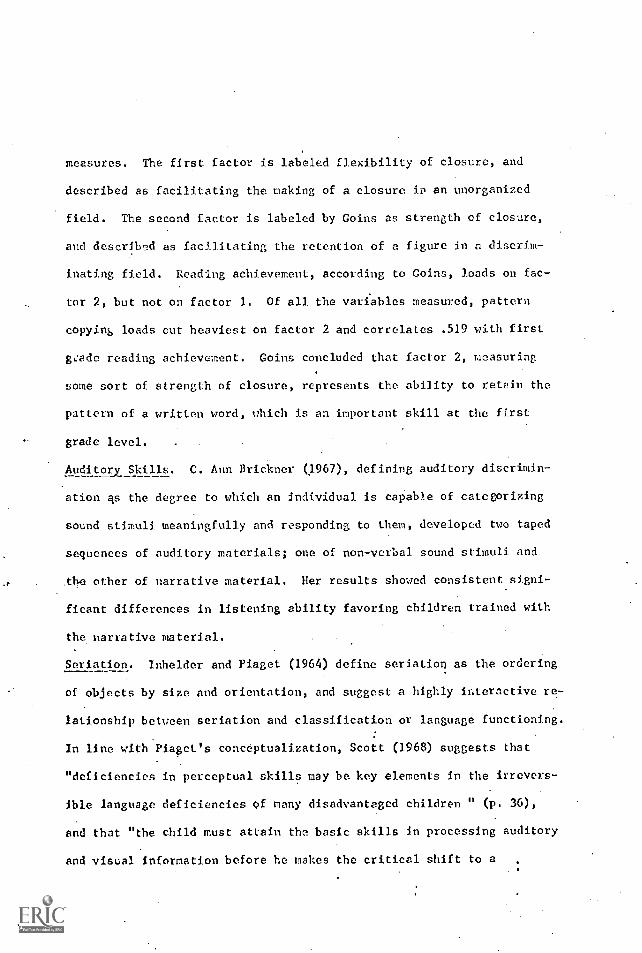
measures. The first factor is labeled flexibility of closure, and
described as facilitating the making of a closure io an unorganized
field. The second factor is labeled by Coins as strength of closure,
and described as facilitating the retention of a figure in a discrim-
inating field. Reading achievement, according to Coins, loads on fac-
tor 2, but not on factor 1. Of all the variables measured, pattern
copying loads out heaviest on factor 2 and correlates .519 with first
grade reading achievement. Coins concluded that factor 2, measuring
some sort of strength of closure, represents the ability to retain the
pattern of a written word, which is an important skill at the first
grade level.
Auditory Skills. C. Ann Brickner (1967), defining auditory discrimin-
ation qs the degree to which an individual is capable of categorizing
sound stimuli meaningfully and responding to them, developed two taped
sequences of auditory materials; one of non-verbal sound stimuli and
the other of narrative material. Her results showed consistent signi-
ficant differences in listening ability favoring children trained with
the narrative material.
Seriation. Inhelder and Piaget (1964) define seriation as the ordering
of objects by size and orientation, and suggest a highly interactive re-
lationship between seriation and classification or language functioning.
In line with Piaget's conceptualization, Scott (1968) suggests that
"deficiencies in perceptual skills may be key elements in the irrevers-
ible language deficiencies of many disadvantaged children " (p. 36),
and that "the child must attain the basic skills in processing auditory
and visual'information before he makes the critical shift to a
predominantly visual approach with the advent of formal reading,"
(p. 37). Using an experimental serration test with 365 Kindergarten
subjects, Scott reported a significant (.58) Pearson product correla-
tion between the California Seriation and Reading Achievement Test
Scores. Hershoren (1969) and Hurley (1968) corroborate Scott's find-
ings. Using the visual-motor sequencing sub-test (VMS) of the Illin-
ois Test of Psycholinguistic Abilities, Hershoren reports a correlation
of .61 between VMS and second grade reading comprehension. Using the
same sequencing measure, Hurley reports that VMS scores discriminated
between adequate and inadequate readers with a population of second
grade readers taught by a phonics approach. On U. other hand, Sterritt,
et al, (1968) report no sign.ificance between reading success and visual-
motor sequencing in a population of second grade readers'.
Auditory -- Visual Integration. The role of auditory-visual integration
in the decoding process has received considerable attention in several
studies. In a study by Raab, Deutsch, and Freedman (1960), more diffi-
culty in shifting modalities was reported for poor.readers than for
.good readers. .Birch and Belmont (1964), correlating auditory-visual in-
tegration task scores of Kindergarten children with first and second
grade reading performance, report an r of .70 with grade one reading
and an r of .42 with second grade reading. Hurd (1967), un the other
hand, discounts the importance of auditory-visual shifting. Using a
specifically designed perceptual apparatus to measure a reaction time,
Hurd.reports is of .969 and .970 between the ability to shift from aud-
itory to visual, and the ability to respond to stimuli in the same chan-
nel. On the basis of there high coefficients, Hurd concludes that
-5--
shifting behavior is not independent of the ability to respond to
stimuli in a single channel. Furthermore, coefficients computed be-
tween auditory-visual shifting and reading achievement were not sig-
. -ificant at the .05 level. On the basis of these findings, Hurd sug-
gests that only "randoe.relationships exist between sense modality
shifting and reading achievement. Sterritt, et al (1968), in a study
of six subpiocesses involved in decoding, test the hypothesis that
more errors would be made by a group of Kindergarten children on per-
ceptual subtests involving modality transfer than on perceptual sub-
tests that do not involve a transfer. In line with the findings of
Hurd, this hypothesis was not supported.
Despite the body of research that relates general readiness per-
ceptual skills to reading performance, many investigators challenge the
assumption that competency in underlying perceptual skills is a pre-
requisite.for successful decoding. They qaestion the automatic trans-
fer. of acquired general perceptual skills to the decoding process.
Harris (1969), in discussing the effect of perceptual training on per-
formance, asserts that, "transfer of what is learned during percept-
ual training to the art of reading is not automatic, and sometimes
does not take place." Muehl (1960) compares the performance on word
list learning of children trained with a word list matching task with
children trained with a geometric forms matching. task. The children
trained with the word list performed significantly better, In an effort
to minimise the problem of transfer, many investigators, to-seeking out
reliable predictors of reading success, have focused on perceptual var-
iables directly associated with decoding behaviors.
Several auditory and Visual alphabet sub-skills that relate to
reading performance have been identified in the liteature.
Specific Visual Skills. Letter naming is recognized throughout the
literature as the best single predictor of first grade reading achieve-
ment. Jeanne Chall (1967) analyzes seven predictive studies that re-
late knowledge of letters or letter-sound relationships to reading
achievement. These seven studies report correlation coefficients from
.3 to .9 between letter naming and early reading. The strength of
letter naming as a predictor o2 reading success has been substantiated
in a series of studies postdating Chall, most notably in the Dykstra
(1968) study, in which Tindings from twenty-seven separate reading
studies were coordinated and summarized. Silberberg (1968) and Panther
(1967) have also produced studies in which alphabet knowledge emerges
as the single best predictor of early reading performance.
Visual Discrimination of Letters and Words. Several investigators have
. '&kplOred the strategies used by children to identify words or letters.
In an attempt to clarify the sub-skill component crucial to alphabet
knowledge, Gibson, Gibson, Pick, and Osser (1962) conducted an experi-
mental study of letterlike forms by which they investigated the dim-
ensions of difference that are critical for the differentiation of let-
ters for children four through eight years old. Twelve ietterlike forms
were constructed as standards, and transformations were developed for
each standard, including three degrees of change from line to curve or
vice versa, five changes in orientation, two perspective transformations,
and two topological transformations. Errors were classified according
to type of transformation mistakenly identified with the standard: The
investigators found a difference in performance between children four
through eight years old not only in terms of the amount of error, but
also in terms of the type of error. An analysis of the differences in
type of error committed confirmed the hypothesis that the child has to
learn the critical features of letters,.so that, "because of transfer
from his already good ability to differentiate critical features of ob-
jects, he does not start outicold" (Gibson, Gibson, Pick, and Osser,
1962, 0.905). These authors suggest that children learn the distinc-
tive features of letters by simply "looking repeatedly at many samples
of letters containing varying and invariant features." In an investi-
gation of the bases of word recognition, Marchbanks and Levin (1965)
found that with first grade children, the first letter of a wore is the
most salient cue used in decoding. They related this dependency on
latter cue to preliminary alphabet training.
C. A. Shea (1968) investigated word discrimination in early read-
ing. In a test of the predictive validity of a word discrimination test,
Shea reports that a combination of a Lorge-Thorndike test and a visual
discrimination word test was a better predictor of readiness to read than
the combination of Lorge-Thorndike and the Metropolitan Readiness battery,
with a correlation coefficient of .65 between achievement on the visual
discrimination test and achievement on the word recognition test.
Specific Auditory Skills. Several different auditory skills related to
deco-ding have beenpointed out in the literature. Walter MacGinitie
(1967) stresses the importance of auditory perception of letter sounds
in beginning reading acquisition, whether the child is taught reading by
a linguistic or a looksay approach. Mortenson (1968), measuring the
ability of a group of Kindergarten children to discriminate beginAing,
-8-
middle, and final sounds, reports a significant difference in all three
measures across socio-economic levels. Dykstra (1966), administering
seven auditory discrimination sub-tests from a series of published read-
ing readiness tests, reported correlation coefficients between the aud-
itory discrimination measures and the reading tests ranging from .19 to
.43. By combining all seven tests, Dykstra.was able to account for 32
to 38 percent of the variance in reading achievement.
Auditory Blending and Segmenting. Jeanne Chall (1963) investigated the
importance of auditory blending as a.factor in reading success where
blending is described as the ability to reproduce a word by synthesizing
its component sounds. Durrell and Murhpy (1963) demonstrated the import-
ance of a reverse ability - the ability to segment words into sounds that
correspond in sequence to letters of letter groups.
Educators who take the position that a reading readiness program for
the SEL I child should have as an objective the development of these per-
ceptual alphabet skills, disagree as to the relative importance of visual
versus' auditory training. Some educators, attributing reading difficulties
to a lack of training in auditory skills, insist that top priority should
be, given to the training of auditory skills in the readiness stage (Chall,
1967; MacCinitie, 1967; Darrel, 1958). Other educatorS., taking the posi-
tion that reading is a visual act, assign top priority to visual skill
training (Scott,'1968;Trostig & Horne, 1964;. Coins, 1958; Wheelock &
Silvaroli, 1967; Bryan, 1964). Still another group insists that decoding
involves an auditory-visual transformation, and that equal stress should
be placed on auditory and visual training in the readiness stage (Balnuth,
1968; Connell, 1968; Mortenson, 1968). Balnuth, 1968, reviewing eight
studies in which the use of one modality is compared with the
simultaneous use of more than one modality, reports the combination as
superior in each instance.
In the present study, one investigator develops fcur perceptual
training programs with each program reflecting a different point of
view as to the kind of sub-skill training that will be'mot beneficial
for the black SEL I Kindergarten child.
(1) GENERAL READINESS PROGRAM (GRP)
The rationale of the GRP program is that general readiness skills
are the prerequisites for higher order alphabet skills, and should be
taught first. This is'particularly important with a population that is
known to perform poorly on tests that measure perceptual sub-skills.
(2) VISUAL ALPHABET PERCEPTUAL PROGRAM (VAP)
The. rationale of the VAP program is that reading is primarily a
visual act. Pre-reading programs, therefore, should assign major pri-
ority to visual modality experiences. These experiences will be most
valuable when they involve exposure to the same symbCds that the child
will use in decoding.
(3) AUDITORY ALPHABETH PROGRAM (AAP)
The rationale of the AAP program is that auditory skills are vital
for successful decoding but are not acquired automatically. This is par-
ticularly true with the child whose ear is attuned to a different dialect
or the child who has not been accustomed to attending to auditory input.
Stress on auditory alphabet skill development will enable the child too
dcsriminate and identify phonemes and will increase his probability of
achieving success with early reading.
(I,) AUDITORY-VISUAL ALPHABET PRECEPTION PROGRAM (AVAP)
The rationale of the AVAP program is that decoding Involves an
auditory-visual transformation and that both auditory and visual skills
are essential for successful performance. Perception is a learned be-
havior involving the interpretation of sensory input. When the sensory
input of a pre-reading program includes letter forms and letter sounds,
the child learns to attend to and interpret the same kind of stimuli to
which he will be exposed in a reading program.
TOTAL PROGRAM
In The present study, these four perceptual programs are tests with-
in the context of a total Kindergarten program. The overall program en-
dorses the Piagetian learning model, which conceives of learning as the
end result of interaction between the child and .his environment. By keep-
ing constant the overall educational experience to which the child is
exposed, differences attributable to a perceptual treatment program can
Iv. identified.
HYPOTHESES
The present study tests five hypotheses relating to the effects of
the four treatment programs.
Hypothesis I. There will be no significant difference in performance
between AVAP and GRP on post - treatment measures of auditory and visual
perception.
Rationale of Hypothesis I. In both the AVAP. and GRP programs, there is
equal emphasis on'auditory and visual discrimination tasks, with the
discrimination tasks in the general readiness program involving geo-
metric shapes and non-verbal sounds, and the discrimination tasks in the
AVAP program involving letter shapes'and letter sounds. We would expect
the GRP group to out-perform the AVM) group if perceptual skill develop-
ment followed a hierarchical model in which successful performance of
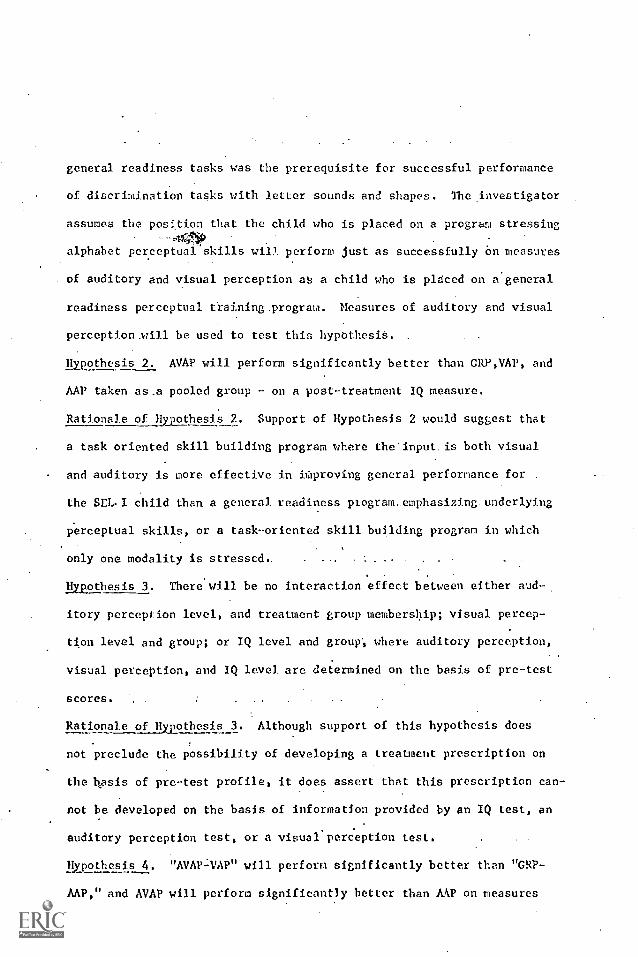
general readiness tasks was the prerequisite for successful performance
of discrimination tasks with letter sounds and shapes. The investigator
assumes the position that the child who is placed on a program stressing
alphabet perceptuai'skills will perform just as successfully On measures
of auditory and visual perception aS a child who is placed on a general
readiness perceptual training.program. Measures of auditory and visual
perception. will be used to test this hypOthesiS.
Hypothesis 2. AVAP will perform significantly better than GRP,VAP, and
AAP taken as .a pooled group - on a post-treatment IQ measure,
Rationale of Hypothesis 2. Support of Hypothesis 2 would suggest that .
a task oriented skill building program where the'input.is both visual
and auditory is more effective in improving general performance for .
the SEL.I child than a general readiness plogram_emphasising underlying
perceptual skills, or a task-oriented skill building program in which
only one modality is stressed.
Hypothesis 3. There will be no interaction effect between either aud-
itory perception level, and treatment group membership; visual percep-
tion level and group; or IQ level and group', where auditory perception,
visual perception, and IQ level are determined on the basis of pre-test
Scores.
Rationale of Hypothesis 3. Although support of this hypothesis does
not preclude the possibility of developing a treatment prescription on
the basis of pre-test profile, it does assert that this prescription can-
not be developed on the basis of information provided by an IQ test, an
auditory perception test, or a visual.perc'eption test.
apothesis 4. "AVAP-IVAP" will perform significantly better than "GRP-
AAP," and AVAP will perform significantly better than AAP on measures
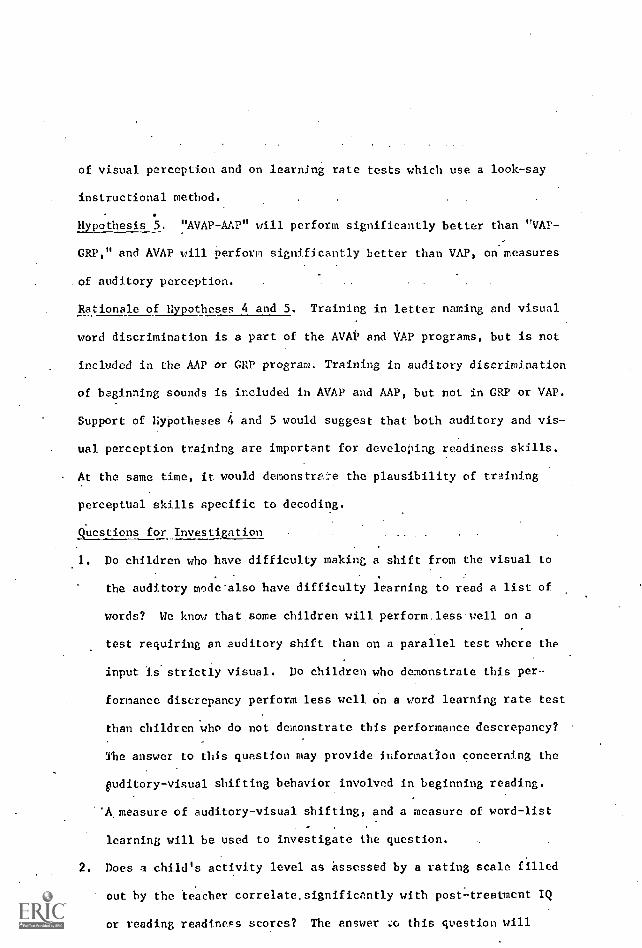
of visual perception and on learning rate tests which use a look-say
instructional method.
Hypothesis 5. "AVAP-AAP" will perform significantly better than "VAP-
GRP," and AVAP will perform significantly better than VAP, on measures
of auditory perception.
Rationale of Hypotheses 4 and 5. Training in letter naming and visual
word discrimination is a part of the AVAP and VAP programs, but is not
included in the AAP or GRP program. Training in auditory discrimination
of beginning sounds is included in AVAP and AAP, but not in GRP or VAP.
Support of Hypotheses 4 and 5 would suggest that both auditory and vis-
ual perception training are important for developing readiness skills.
At the same time, it would demonstree the plausibility of training
perceptual skills specific to decoding.
Questions for Investigation
1. Do children who have difficulty making a shift from the visual to
the auditory mode'also have difficulty learning to read a list of
words? We know that some children will perform.less-well on a
test requiring an auditory shift than on a parallel test where the
input Is strictly visual. Do children who demonstrate this per-
formance discrepancy perform less well on a word learning rate test
than children who do not demonstrate this performance descrepancy?
The answer to this question may provide information concerning the
giuditory-visual shifting behavior involved in beginning reading.
''A. measure of auditory-visual shifting, and a measure of word-list
learning will be used to investigate the question.
2. Does a child's activity level as assessed by a rating scale filled
out by the teacher correlate.significantly with post-treatment IQ
or reading readiness scores? The answer -.:cd this question will
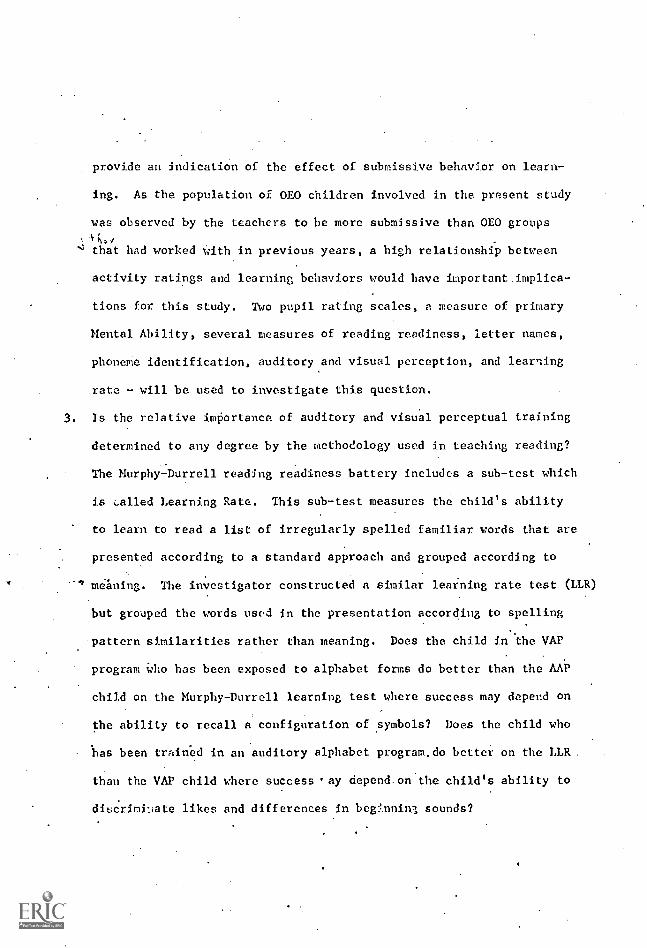
provide an indication of the effect of submissive behavior on learn-
ing. As the population of 0E0 children involved in the present study
was observed by the teachers to be more submissive than 0E0 groups
that had worked with in previous years, a high relationship between
activity ratings and learning behaviors would have important implica-
tions for this study. Two pupil rating scales, a measure of primary
Mental Ability, several measures of reading readiness, letter names,
phoneme identification, auditory and visual perception, and learning
rate - will be used to investigate this question.
3. Is the relative importance of auditory and visual perceptual training
determined to any degree by the methodology used in teaching reading?
The Murphy-Durrell reading readiness battery includes a sub-test which
is called Learning Rate. This sub-test measures the child's ability
to learn to read a list of irregularly spelled familiar words that are
presented according to a standard approach and grouped according to
meaning. The investigator constructed a similar learning rate test (LLR)
but grouped the words used in the presentation according to spelling
pattern similarities rather than meaning. Does the child in the VAP
program Who has been exposed to alphabet forms do better than the AAP
child on the Murphy-Durrell learning.test where success may depend on
the ability to recall a configuration of symbols? Does the child who
has been trained in an auditory alphabet program.do better on the LLR.
than the VAP child where success 'ay depend.on the child's ability to
discriminate likes and differences in beginninl sounds?
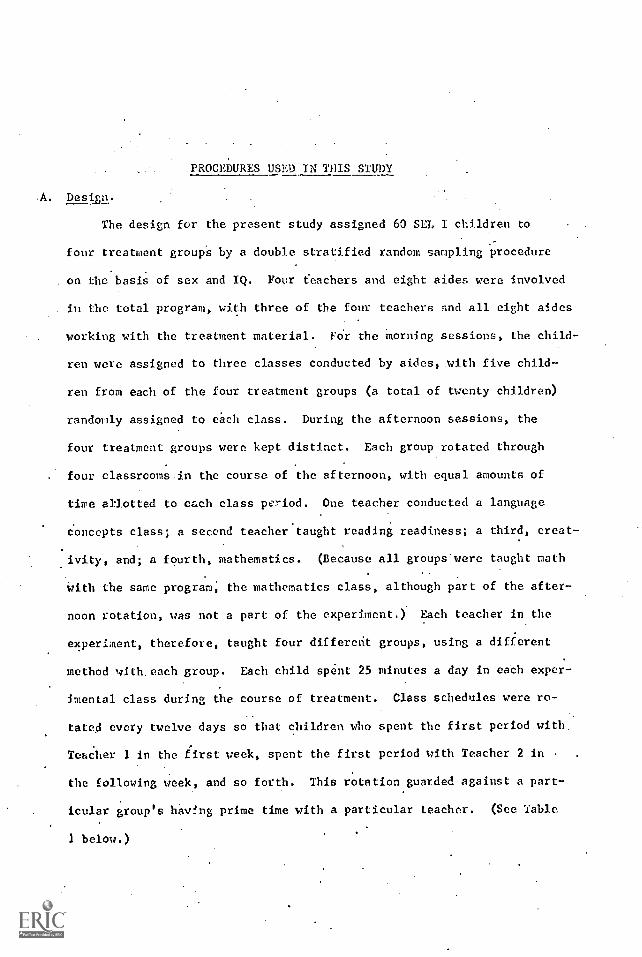
.PROCEDURES USED IN TUTS STUDY
.A. Design.
The design for the present study assigned 60 SET I children to
four treatment groups by a double stratified random sampling procedure
. on the basis of sex and IQ. Four teachers and eight aides were involved
in the total program, with three of the four teachers and all eight aides
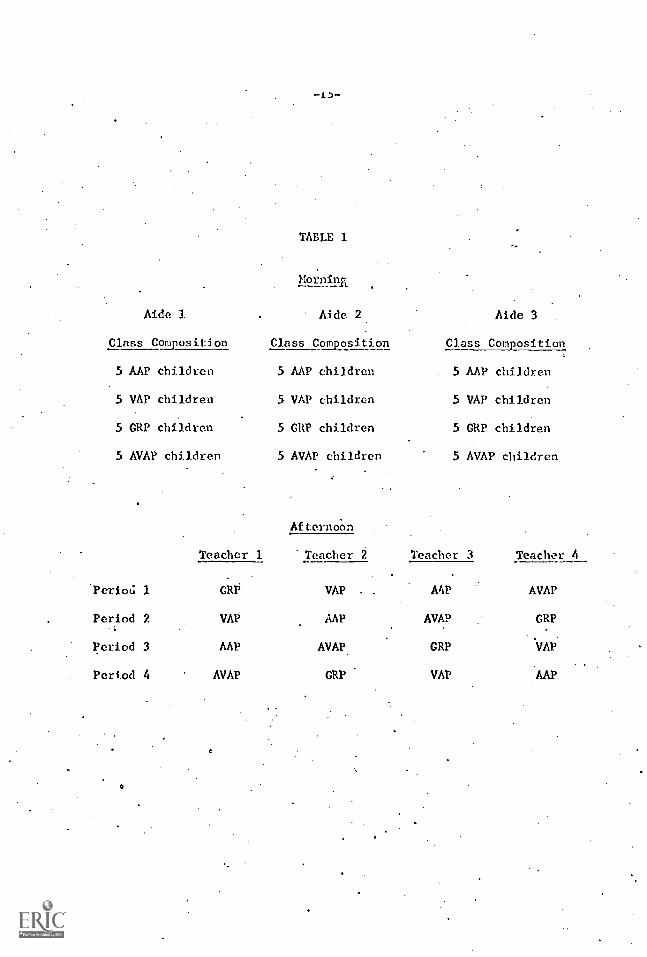
working with the treatment material. For the morning sessions, the child-
ren were assigned to three classes conducted by aides, with five child-
ren from each of the four treatment groups (a total of twenty children)
randomly assigned to each class. During the afternoon sessions, the
four treatment groups were kept distinct. Each group rotated through
four classrooms in the course of the afternoon, with equal amounts of
time allotted to each class period. One teacher conducted a language
concepts class; a second teacher taught reading readiness; a third, creat-
ivity, and; a fourth, mathematics. (Because all groups were taught math
With the same program, the mathematics class, although part of the after-
noon rotation, was not a part of the experiment.) Each teacher in the
experiment, therefore, taught four different groups, using a different
method with. each group. Each child spent 25 minutes a day in each exper-
imental class during the course of treatment. Class schedules were ro-
tated every twelve days so that children who spent the first period with.
Teacher 1 in the first week, spent the first period with Teacher 2 in
the following week, and so forth. This rotation guarded against a part-
icular group's hav!ng prime time with a particular teacher. (See Table
1 below.)
Aide 3.
Class Co position
5 AAP children
5 VAP children
5 GRP children
5 AVAP children
Teacher 1
TABLE 1
Morning
Aide 2
Class Composition
5 AAP children
5 VAP children
5 GRP children
5 AVAP children
Afternoon
Teacher 2
Aide 3
Class Composition
5 AAP children
5 VAP children
5 GRP children
5 AVAP children
Teacher 3 Teacher 4
'Perio6 1 GRP VAP . AAP AVAP
Period 2 VAP AAP AVAP GRP
Period 3 AAP AVAP GRP VAP.
Period 4 AVAP GRP VAP AAP
O
T.
B. Development of Curriculum.
The development of curriculum for the present study was a major
undertaking. The study called for an overall curriculum that would be
appropriate for the SEL I child and would remain across treatment groups
except for the perceptual training component. This perceptual training
component had to be designed according to the specifications of each
type of treatment, and then introduced into the general curriculum as
an addition or modification. There were three classrooms in the exper-
iment: reading readiness, creativity, and language concepts. Although
the most concentrated perceptual training took place in the reading read-
iness classroom, perceptual training was also introduced into the language
concepts and creativity classrooms: The investigator developed specific
prograbs for each of the classrooms in the experiment, with four separ-
ate "editions" of these programs designed according to the specifica-
tions of the four experimental treatments. No special program was (level-
aq
oped for mathematics, as the mathematics teacher used the same mathematics
curriculum for all four treatment groups.
The fist step in the building of curriculum was the development: of
objectives for the three experimental classrooms. These objectives were
expressed in general terms for the creativity classroom and in behavioral
terms for the language concepts classroom and the reading readiness class-
room. The listing of objectives served four purposes: (1) It provided a
set of guidelines for the teacher; (2) it provided a means of keeping
the four treatments parallel; (3) it provided a basis for ongoing pro-
gress records, and; (4) it gave the instruction a programmed format and
thus opened up the possibility for replication.
e
The second step in the construction of the treatment program was
the development of a list of suggested activities to accompany the be-
havioral objectives. Based on the assumption that learning takes place
as the result of an interaction between the child and his environment,
the suggested activities were designed to provide experiences that would
maximize the opportunity for the SET, child to learn through encounter
rather than drill. These activities included the following features:
a. Several activities were suggested for each behavioral objective,
providing alternatives that would take into account individual pre-
ferences, and enable a child to learn through successive encounters
with his environment.
b. Suggested activities emphasized.small group and individual activities,
thus providing the child with opportunities for interaction with his
peers as well as interaction with an adult on a one-to-one basis.
c. Concrete manipulative materials were used extensively.
d:' Wherever possible, instructional materials included a self-correct-
ive element so that the child could receive immediate feedback and
reinforcement.
e. The activities provided the basis for individualized instruction in
which an appropriate starting point and pace could be selected for
. each child.
1. Reading Readiness.
Tne GRP reading readiness program was designed to develop an array
of underlying auditory and visual skills related to decoding behavior.
Three major sources were tapped: (a) Descriptive statistics revealing
perceptual deficits of the SEG I child; (b) published studies relAing
performance in different perceptual tasks to decoding, and; (c) published
programs or listings of underlying perceptual skills related to decoding
behavior, including the Frostig Program (Frostig & Horne, 1964), the
New York Curriculum (1968) Sequence of Objectives, the Hartford "Follow-
Through" Program (1969), Lauren Resnick's Preschool Curriculum (Resnick,
1967), and the Llorens Training Program (Llorens, et al., 1969).
The three reading readiness alphabet programs followed essentially
the same format as the CRP reading readiness programs. The behavioral
objectives listed for the NAP reading readiness program represent a mod-
ification of the general readiness visual perception listing, since with
these objectives, the emphasis was shifted from visual experience with
shape, color, and abstract symbol to visual experience with letters.
Letters were used in tasks requiring discrimination, identification, per-
. ceptual constancy, sequency, figure-ground perception, and spatial orien-
tation. The behavioral objectives listed for the AAP reading readiness
program also represent a modification of general readiness auditory
perception objectives, since the emphasis here is on the matching, iden-
tifying, ordering, and discriminating of letter sounds. The AVAP behav-
ioral objectives incorporate the objectives of both NAP and AAP, and
include a series of tasks that require modality shifting. In developing
behavioral objectives and suggested activities for alphabet reading
readiness programs, the following sources were tapped: The New York Cur-
riculum (1968), the Lyons and Carnahan (1966) Reading Readiness Objec-
tives Program, Chall (1967), and Bereiter and Engleman (1967).
2. Language Concepts
.Behavioral objectives for the language concepts program are derived
from the literature that describes the u:Lque cognitive style and language
characteristics of the SEL I child (Baratz, 1969; Cazden, 1968). The
language concepts program stresses listening, language production, ver-
bal interaction, categorization, and generalization. Emphasis was placed
on communication rather than production of standard English syntax. In
line with the finding that the SEL I child acquires language through the
co-occurrence of label and referent, routines in which the child describes
an ongoing action were given particular emphasis. Pattern drills were in-
troduced with the hope of training the SEL I child to use language in a
mediational role, allowing him to use internal language as a cognitive
tool (Bereiter, Engleman, Dsborn, and Reidford, 1966). Games and routines
were introduced to teach constructions with a low frequency in SEL I black
language repertoire. Accordingly, "not" constructions, pronouns, pass-
.ive constructions, function words, ,and tense constructions were given
special emphasis. General instructions to the teacher in a manual accomp-
anying the objective listings pointed up the importance to the child of
self-expression through language and discouraged the teacher from "cor-
recting" non-standard usage. Major sources for the language concepts ob-
jectives and activities were: Bereiter and Engelman, Osborn, and Reidford
(1966), Gotkin (1968), Baratz (1969), and O'Donnell (1068). AAP, VAP. and
AVAP versions of the general readiness program included the same behavior-
al objectives as the GRP language program. In the suggested activities,
however, modifications in line with the treatment prescription were in-
. troduced whenever appropriate. An example follows:.
Behavioral Objective:0
Suggested Activity forGRP Equipment:
Uses "rot" constructionappropriately in a sentence.
A series of containers withobjects belonging to tvo dif-feral classes in each contain-er. One container has shellsand'rocks; a, second containerhas leaves and flowers; a thirdcontainer has squares of paperand squares of fabric.
-20--
Procedure:
Suggested Activity for VAPEquipment:
Procedure:
Suggested Activity of AAPEquipment:
Procedure:
Suggested Activity for AVAPEquipment:
Procedure:
Creativity
Each child selects one object fromone container and describes it usingthis format:
"This is a shell. It is not a rock."
A series of containers, each hold-ing two letters.
The child selects a letter and says,"This is a b. This is not a d."
A series of containers, each holdingtwo pairs of rhyming objects, or twopairs of objects with like beginningsounds. Examples are: shell - bell,car - star, for rhyming objects; bell-boat, cat - car, for objects withlike beginning sounds.
The child selects an object from oneof the containers. "This is a cat.It begins like car. It does not be-gin like dog."
A series of containers,each holdingtwo objects and two letters; theletters correspond to the beginningsounds of the objects. For example,with the letters b and w, the objectsmight be a ball and a wagon.
The child selects an object. "This is
a ball. It begins with a b. It does: not begin with a w."
For the creativity program, objectives were stated in general rather
than:behavioral terns. The teacher was given a bookof daily lesson plans
with activities inc:cuded for each of the four treatment groups. These act-
ivities included for each day an art or craft activity, and a mu2ic, dance,
or dramatic activity, with appropriate modifications for the different
treatment groups. An:example of a craft activity follows:
-21
MATERIAL: CLAY
Suggested Activity for GRP: Make a variety of shapes with clay.
Suggested Activity for AAP: Make objects with the same beginningsounds as boy.(Ball, baads, boats,bananas serve as models.)
Suggested Activity for VAP: Make an upper case and lower caseb out of clay.
Suggested Activity for AVAP: Make a lower case b and an objectthat begins with the b sound.
C. Description of Sample.
The sample for the study consisted of 30 males and 30 females, ranging
at the beginning fo the study from four years six months to six years of
age, with 90 percent of the children between five and six years old. Fifty-
three of the children were black and white. These children were recruited
by the staff of the Office of Economic Opportunity in Broward County, Florida.
All of the children in the study came from economically deprived areas in
the environs of Hollywood, Florida. Family income ranged from $3,000 to
$4',000 per family per year. The majority of the children lived either in
. project single dwelling or project apartments located in Hollywood, West
Hollywood, and Dania; 6 of the children camefrom the migrant worker colony
in Mvie. Statistics on employment, marital status, and.parent education
were difficult to acquire as the parents were se-sitive about being ques-
tioned. (Parents of registrants responded verbally to a questionnaire on
the family, but were not required to answer any questions if they raised
objectl.ons,) Thirty-five families responded to a question on marital status.
Of these, 25 reported parents living together, 8 reported parental separa-
tion with child living with mother, and 2 listed themselves as "guardians."
Applicants who did not respond to the question on marital status may have
been protective of their aid-to-dependent children status, or perhaps were
-22-
involved in family situations where parentage was not clearly delineated.
Nine families responded to the question on educational status of both
parents, and nine more reported the highest grade attended by one parent.
Among these respondees, three parents had attended two years of college,
eleven parents were graduated from high school, and four parents had gone
through the eleventh grade. The remaining respondees on education re-
ported between four and ten years of schoOl. attendance. It was the impres-
sion of the OEO social worker that applicantt. who failed to respond to .
the question on education were likely not have finished elementary school.
Occupations were reported for 25 fathers and 17. mothers. Eleven fathers
worked in construction, seven in service, four in farming or gardening,
and two in auto repairs. Fifteen mothers were domestics, one was a beau-
tician, and one was a nurse's aide. It was the impression of the social
worker that many fathers who did not list their occupations worked as day
laborers, fruit pickers, or field workers. Place of birth and number of
siblings were listed on all applications. All. but three of the children,
were born in Florida and all but seven were born in Broward County. The
mean number of children per family was three'
All children in the school were given a physical examination during
the course of treatment and reports were made available to the investiga-
tor. The most common health problem was anemia with hemoglobin below a
gram percentage of 37 reported for all OEO children in the school. (A
gram percentage of less than 65 falls below the normal range.) Four cases
of systolic murmur, three cases of coarse chest rales, three orthopedic
problems, two ear problems, two cases of ketone bodies in the urine, one
hydrocele, one umbilical hernia, one protruding abdomen, one case of
epilepsy, and several uper respiratory infections were reported by the
-23-
physician. Children with special problems were wait-listed for referral
to a specialist. Daily vitamin and iron pills were prescribed for all
of the O.F.O. children.
D. Setting
The study was conducted in the University School Center in liollywood,
Florida. The University School is a private, non-profit school with a close
working relationship with the Social and Behavioral Sciences Center of
Nova University. It was housed in the Sunday School wing of Temple Beth El.
The University School, jointly with the Broward County Office of Economic
Opportunity, sponsored a Day Care program for SEL I Kintergarten children
The SEL I children in the center were all Head Start applicants who were
not enrolled in the regular Broward County Head Start program because of
either late applications or lack of space in the facility in their area.
The children were bussed to school by the Office of Economic Opportunity,
and were given hot lunches through the Broward County School System. The
chlidren remained In school for the entire day, with the morning program.
conducted under the auspices .of the Office of Economic Opportunity Day Care
staff, and the afternoon program conducted under the auspices of the Uni-
versity School staff.
The Staff. Two full time staff members employed by the Office of Econom-
ic Opportunity and eight trainees sponsored by, the Broward County Economic
Opportunity Center were associated with the SEL I program. Two teachers
from the University School worked half-time with the SEL I program. In
addition, there were several volunteers, including a retired art teacher,
who he?ped with the morning program. Formal instruction took place in
the afternoon, with one teacher and two Opportunity Center aides la each
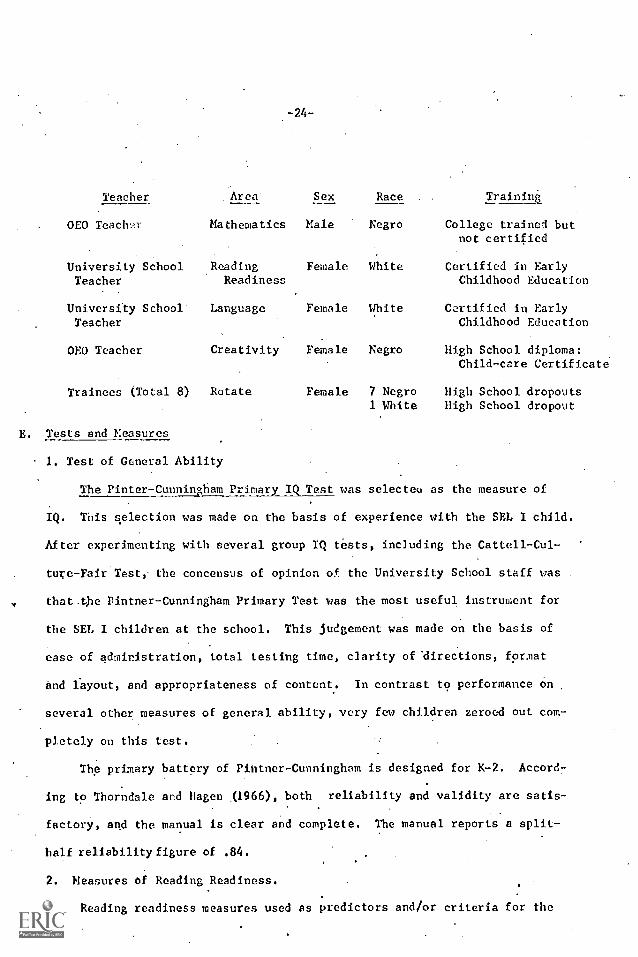
classroom. Qualifications of staff members follow.
-24-
Teacher Area Sex Race Training.
CEO Teach Mathematics Male Negro College trained butnot certified
University School Reading Female White Certified in Early
Teacher Readiness Childhood Education
. University School Language Female White Certified in EarlyTeacher Childhood Education
CEO Teacher Creativity Female Negro High School diploma:Child-care Certificate
Trainees (Total 8) Rotate Female 7 Negro High School dropouts1 White High School dropout
E. Tests and Measures
1. Test of General Ability
The Pinter-Cunningham Primary IQ Test was selecteu as the measure of
IQ. This selection was made on the basis of experience with the SEL I child.
After experimenting with several group IQ tests, including the Cattell-Cul-
ture-Fair Test, the concensus of opinion of the University School staff was
that the Pintner-Cunningham Primary Test was the most useful instrument for
the SEL I children at the school. This judgement was made on the basis of
ease of administration, total testing time, clarity of 'directions, format
and fayout, and appropriateness of content. In contrast to performance on
several other measures of general ability, very few children zeroed out com-
pletely on this lest.
The primary battery of Pintner-Cunningham is designed for K-2. Accord-
ing to Thorndale and Hagen (1966), both reliability and validity are satis-
factory, and the manual is clear and complete. The manual reports a split -
half reliability figure of .84.
2. Measures of Reading Readiness.
Reading readiness measures used as predictors and/or criteria for the
-25--
study lnclvle: (a) the MurphyDurrell Reading Readiness Analysis sub-tests;
Phonemes Part I, Letter Names, and Learning Rate; (b) the Gates-MacGinitie
Readiness Measures:Auditory Discrimination and Visual Discrimination subtests;
(c) a linguistic learning rate test developed by the investigator using the
same format as the Murphy-Durrell Learning Rate Test with modification of
the word list and mode of presentation, and; (d) an auditory-visual shifting
test constructed by the investigator.
Murphy- Durrell. Reading Readiness Measures: The Murphy-Durrell Reading Readi-
ness Analysis was selected as one of the operational measures of reading read-
iness. It was the only standard Reading Readiness battery reported in Buros
(1968) that included both a phoneme discrimination test and a learning rate
measure. Three sub-tests from the Murphy-Durrell Analysis were used as both
pretests pnd post-tests: (a) the phonemes test, providing an inventory of
the child's ability to identify separate sounds in spoken words; (b) the
letter names test, measuring the child's ability to identify named letters,
and;r(c)-the learning rate test, measuring the number of woixis a child can
recognize one hour after a formal instructional presentation using a stand-
ard look-say approach. The odd-even split-half realiability coefficient for
the Phonemes is .94, for Letter Names, .94, and for Learnihg Rate, .88, The
total test reliability using odd-even, split-half correlation coefficients
is .98, the correlation with the Pintner-Cunningham Primary Test is .94,
and the'predictive validity coefficient with the Stanford Reading Achieve-
ment Test is .65.
Gates-MacGinitie Reading Readiness Measures: The Gates-MacGinitie Reading
Readiness Test was selected as a second operational measure of Reading Readiness.
-20-
behavior. These rating scales were not a part of the original plan for the
study but were an outgrowth of a conference with the school principal. The
principal expressed the opinion that this class of 0E0 children seemed quiet-
er and more submissive than children who had been in the school An previous
years. Because the sample for the study was small, it seemed-important to
have a pre-measure of any atypical behavior that could have an effect on
treatment. The pupil rating scales were modifications of behavior rating
scales that had been developed and had been developed and used in the University
School. The Attending Behavior Scale was developed as a measure of vari,,us
attending behaviors including responsiveness, attention span, and ability
to follow directions. These behaviors were rated as excellent, very good,
good, fair or poor. The Activity Level scale was developed as a measure
.4f the child's response level, and included amount of activity, speed of
activity, amount of talking and amount of laughter. These behaviors are
rated on a 5 roint scale: 1 = to little; 2 = somewhat too little; 3 =
appropriate; 4 = somewhat too much, and; 5 = too much (see Appendix )).
F. Administration of Pro.gram
1. Administration of Pre-Tests.
Pre-tests were conducted in a two-week period prior to the introduc-
tion of the treatment regime. Several members of the University School
staff, and several volunteers from the community with prior testing experi-
ence, administered the pre-tests. All standardized group tests were given
.on Tuesday, Wednesday, and Thursday. Manual specifications were adhered
to exactly. Group size was held at the minimum level suggested by the
manual, and adult-pupil ratio was held at the maximum level. Where the
manual presented an option of giving the test in one or two sittings, the
second option was selected. For four weeks prior to the testing program
-27-
children were given daily practice in the following tasks: (a) placing a
mark on a picture; (b) making an X; andt(c) drawing a line under a picture.
The following pre-test measures were collected for the total study
population prior to treatment:
(a) Pintner-Cunningham Primary IQ Test.
0) Murphy-Durrell Reading Readiness Analysis: Phonemes Part I,Letter Names, and Learning Rate Sub-tests.
(c) Cates-MacGinitie Reading Measures: Auditory Discrimination
and Visual Discrimination Sub-tests.
(d) Auditory-Visual Shifting Test constructed by the examiner.
In addition, teacher aide teams were asked to fill out pupil rating sheets,
with each team responsible for completing the fornis for twenty children.
When team members could not decide upon or agree upon a particular rating,
a supervIsory teacher was consulted.
-28-
Sampling Procedures. Pre-tests were administered to a total sample of
64 children. On the bases of these pre-tests four children were eliminated
from the sample. Three children zeroed out completely on the pre-tests
(scribbled across the pages), and could not be assigned a score. One child
was partially sighted and could not be tested. The 60 remaining children
were stratified according to sex and IQ level (upper, middle, or lower third)
and randomly assigned to treatment group through a double stratification
procedure.
Orientation
Teacher orientation extended over a three-day period, with the first
day devoted to a group conference, and the second and third days devoted to
individual conferences with each of the three teachers involved in the ex-
perimental program. The following materials were given to each of the
experimental teachers at the beginning of the conference:
a. A set of behavioral objectives and suggested activities arranged
in sequence (see Appendix-A).
b. A teacher's manual with detailed instructions for suggested activities
(see Appendix-F).
.c. A game kit with materials and detailed instructions for all self-
corrective manipulative games to be used in the programs. These games were
constructed specifically for the study in accordance with the behavioral
objectives set forth (see-Appendix-G).
d. A set of booklets with pencil and'paper activities for each child.O
These activities were constructed for the study in accordance with the
behavioral objectives (see_Appendix-H).
e. A kit of records, books, and materials purchased for the study.
-29-
f. 1. set of tapes with cards and a listening board to be used for
individualized listening activities (see-Appendix-I).
g. A set of individual child record sheets constructed in accord-
ance with the behavioral objectives (see-.Appendix
The Course of Treatment
The course of treatment extended over a three-month period and in-
cluded a total of thirty-six instructional:days., The investigator had
planned for a total of sixty instructional days but several unexpected
contingencies arose which eliminated a total of twenty-four treatment days.
Five days were lost because of health visits scheduled by the Board of
Health, four days were lost because of bus breakdowns, three days because
of special programs scheduled by the 0E0 Office, six days because of
teacher illness, four days because of unscheduled school holidays, and two
days because building construction required the facility to be evacuated.
The period of time devoted to treatment per day was also cut back. Original
plans called for 40-minute class period, giving each child a total of 120
minutes or two hours per day in a treatment program. Lunch schedules and
bus schedules interferred with this timetable, so that each period'had to be
cut from 40 to 25 minutes. This gave each child approximately 75 minutes
per day in a treatment program. The afternoon period was always apportioned
so that each treatment group spent an equal period of time in each of the
four classrooms, with a bell signaling the end of each period.
Attrition. Seven children were dropped from the original sample.
Five OE these children left the school, a sixth child was dropped from the
study when it was discovered that the birthdate was wrong on her applica-
tion form and she was only three years old, and a seventh child was dropped
because he had been absent for seven consecutive weeks. The investigator
had stated as a preliminary condition that any child absent nor( than two
consecutive weeks would be dropped from the sample.
Follow-ups were done on the five children who left the school. In
two cases, families had moved away from the area. In two other cases, the
children were taken out because of "family troubles"; in the fifth case,
the family would not give a reason. As a result of this attrition, the
composition of the final groups was as follows: GRP, 13; VAP, 13; AAP, 14;
and AVAP, 13.
Administration of Post-tests
Post-tests were carried on during the two-week period following
the treatment course by a team of testers similar to the pre-test team.
Morning classroom groupings, in which treatment groups had proportional
representation, were retained during this testing period. The following
post-tests were administered to the total population:
(a) Pintner-Cunningham Primary IQ Test.
(b) Murphy-Durrell Phonemes Part I and Letter Names Sub-tests.
(c) Gates-MacGinitie Auditory Discrimination and Visual Dis-crimination Sub-tests.
(d) Linguistic Learning Rate Test constructed by the examiner.
-31-
DATA ANALYSIS
Pre-treatment Information
Prior to the treatment, the following measures were collected on the
total group: The Pintner&nningham Nentil Ability Test, Form A; the
Cates-MacGinitie Readingness Skills sub-tests II and III; the Nurphy-Durrell
Reading Readiness Analysis, Phonemes sub-test Part I, Letter Names sub-
test Part I, and Learning Rate Test; and auditory- -visual shifting test
constructed by the investigator, Attending Behavior Rating, and Activity
Level Rating.
Pre-test measures for the population tended to be positively skewed
(see Appendix L for distributions) with a disproportionate number of chil-
dren receiving zero scores on the letter names test, the learning rate test,
and the Gates Visual Perception Test (see Table 2). Unfortunately, this
truncated distribution could have obscured'real differences in the sample
that may Have influenced the outcome of treatment. According to national
norms, mean scores for the sample were in the 2nd stanine on standard
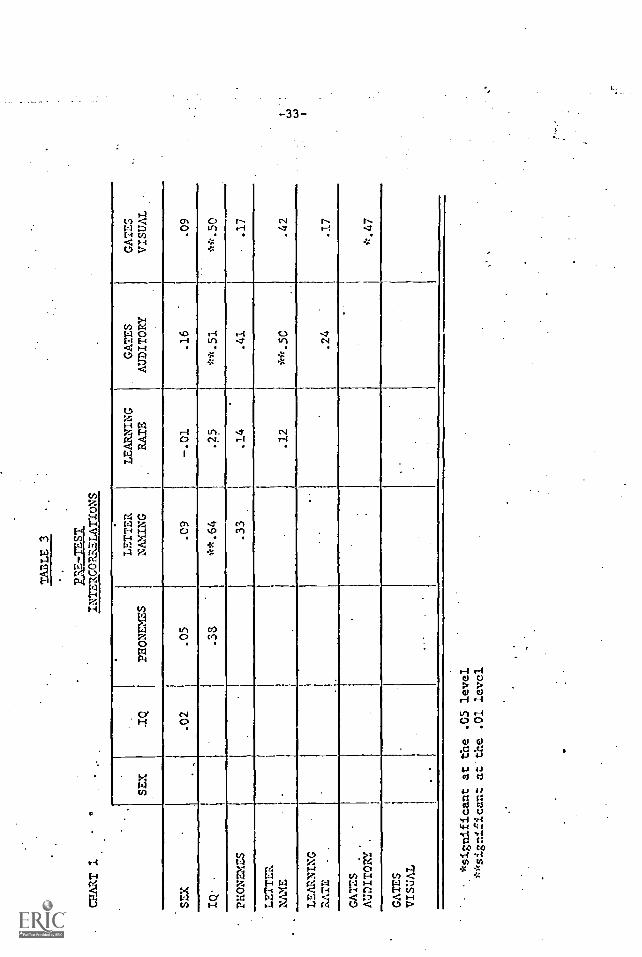
reading readiness sub-tests and IQ. Reading readiness measures were not
independent,. ith Letter Naming, and Gates Auditory and Vistual tests sig-
nificantly correlated with IQ (see Table 3).
Treatment Groups
A double stratifield random sampling procedure 'was used for distribution
of the sample into treatment groups. Subjects were categorized according to
sex and IQ level. A raw score of 17 nr under represented the cut-off point
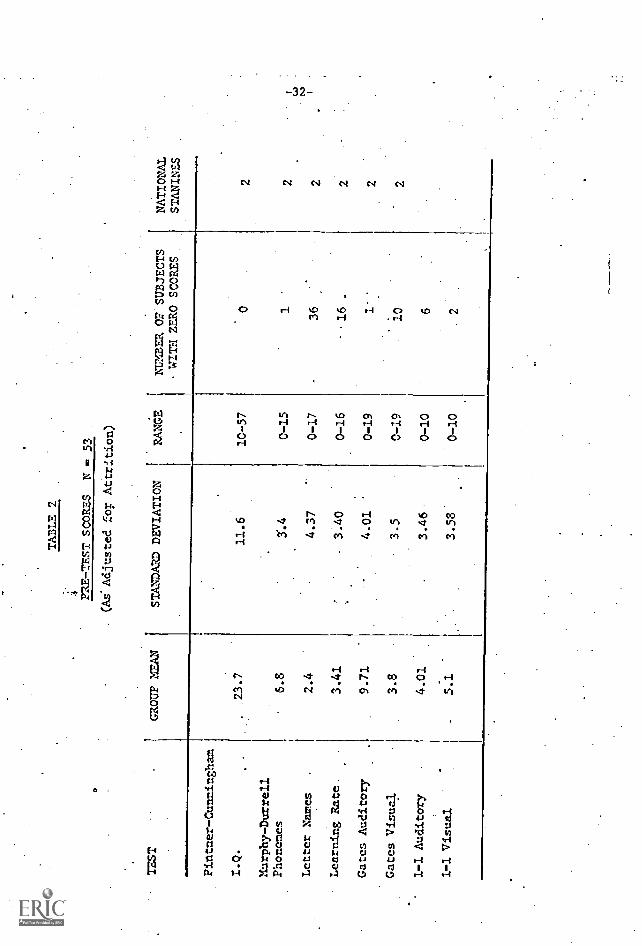
TABLE 2
0
TEST
GROUP MEAN
PRE --TEST SCORES
N Q 53
NUMBER OF SUBJECTS
WITH ZERO SCORES
NATIONAL
STANINES
(As'Adjv.sted foF Attrition)
STANDARD DEVIATION
RANGE
Fintner-Cunningham
I.Q.
23.7
11.6
10-57
02
Murphy-Durrell
Phonemes
6.8
0-15
12
Letter Names
2.4
4.37
0-17
36
2
Learning Rate.
3.41
3.40
0-16
16
.
Gates Auditory
9.71
4.01
'
0-19
2
Gates Visual
3.8
3.5
0-19
102
1-1 Auditory
4.01
3.46
0-10
6
1-1 Visual
5.1
3.58'
0-10
.2
CrIART
TABLE 3
PRETEST
INTERCORRELATIONS
SEX
IQ
PHONEMES
LETTER
NAMING
LEARNING
-RATE
GATES
AUDITORY
GATES
VISUAL
:
SEX
.02
.05
.09
.01
.16
.09
IQ-
.38
**.64
.25
**.51
**.50
PHONEMES
.33
.14
.41
.17
LETTER
NAME
.12
**.50
.42
LEARNING
RATE
-.
..
.24
'.17
GATES
AUDITORY
.*.47
GATES
VISUAL
..
..
.
*significant at the .05 level
**significant at the .01 level
s ,
-34-
for low IQ, and a raw score of 24 or over represented the cut-off point for
high IQ. A table of random numbers was used to placeSubjects from the six
cells, representing sex and IQ level, into four treatment groups.
Using all pre-test scores as variables, a discriminant function analy-
sis was performed using the Veldman Discriminant Function Program (1967).
The discriminant function yielded a nonsignificant overall F ratio of 1.109
(p = .35 with D.F. 18 and 124). The univariate F tests for the four treat-
ment groups on each of the individual pre-tests were also nonsignificant.
On the basis of this analysis, the original treatment assignments were
maintained. In a second discriminant function analysis where study drop-
outs were deleted all the F ratios remained nonsignificant.
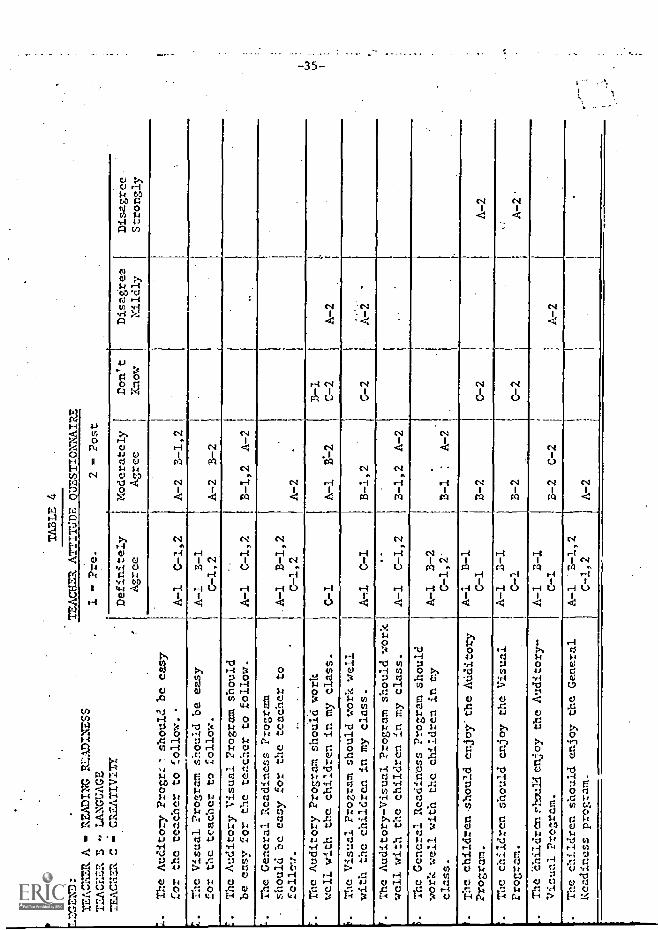
Teachers' Oyinionnaires
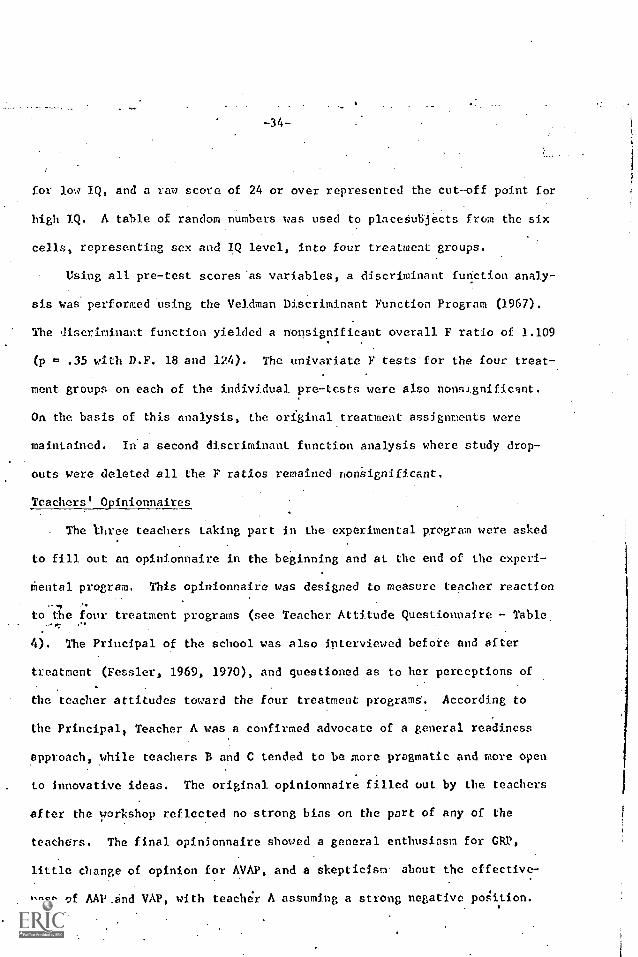
The three teachers taking part in the experimental program were asked
to fill out an opinionnaire in the beginning and at the end of the experi-
Mental program. This opinionnaire was designed to measure teacher reaction
"to the four treatment programs (see Teacher. Attitude Questionnaire - Table,
4). The Principal of the school was also interviewed before and after
treatment (Fessler, 1969, 1970), and questioned as to her perceptions of
the teacher attitudes toward the four treatment programs. According to
the Principal= Teacher A was a confirmed advocate of a general readiness
approach, while teachers E and C tended to be more pragmatic and more open
to innovative ideas. The original opinionnaire filled out by the teachers
after the workshop reflected no strong bins on the part of any of the
teachers. The final opinionnaire showed a general enthusiasm for CRP,
little change of opinion for AVAP, and a skepticism about the effective-
ness of AAP.and VAP, with teacher A assuming a strong negative position.
:GEND:
TEA= A
READING BL'ADINESS
=ACE= B n LANGUAGE
TABLE 4
TEACHER ATTITUDE QUESTIONNAIRE
1Pre.
2Post
1.
TEACNZR C
CRZATIVTLTY
The Auditory Progrc7 should be easy
for the teacher to follow.
Definitely
Agree
Moderately
Agree
Don't
Know
Disagree
Mildly
Disagree
Strongly
A-I
C-1,2
A-2
B-I,2
Z.
Tice Visual Program should be easy
for the teacher to follow.
A-I
B-1
C-I,2
A-2
B-2
.The Auditory Visual Program should
be easy for the teacher to follow.
A -i
C-1,2
B-1,2 A -2
..
The General Readiness Program
should be easy for the teacher to
faller.
.A.-1
B-1,2
C-1,2
A -2
The Auditory Program should work
well with the children in my class.
C-1
A-1
B.-2
B-I
C-2
.._
A-2
i.
The Visual Program should work well
with the children in my class.
Al C-1
B -i,2
C-2
.....
A -2
r.
The Auditory-Visual Program should work
well with the children in my class.
Fil
C-I,2
3-1,2 A-2
i.
The General Readiness Program should
work well with the children in my
class.
A-1
B-2
C-1,2'
B-1
:A-2
.
The children should enjoy the Atiditory
Program.
A-1
B-I
C-1
B-2
C-2
A-2
.The children should enjoy the Visual
Program.
A-1 B-1
C-1
B-2
C-2
,A-2'
The children rhou34 enjoy the Auditory-
Visual Program.
A-1
B-1
C-1
B-2
C-2
A-2
.The children should enjoy the General
Readiness program.
A-1
B-1,2
C-1,2
A-2
-36-
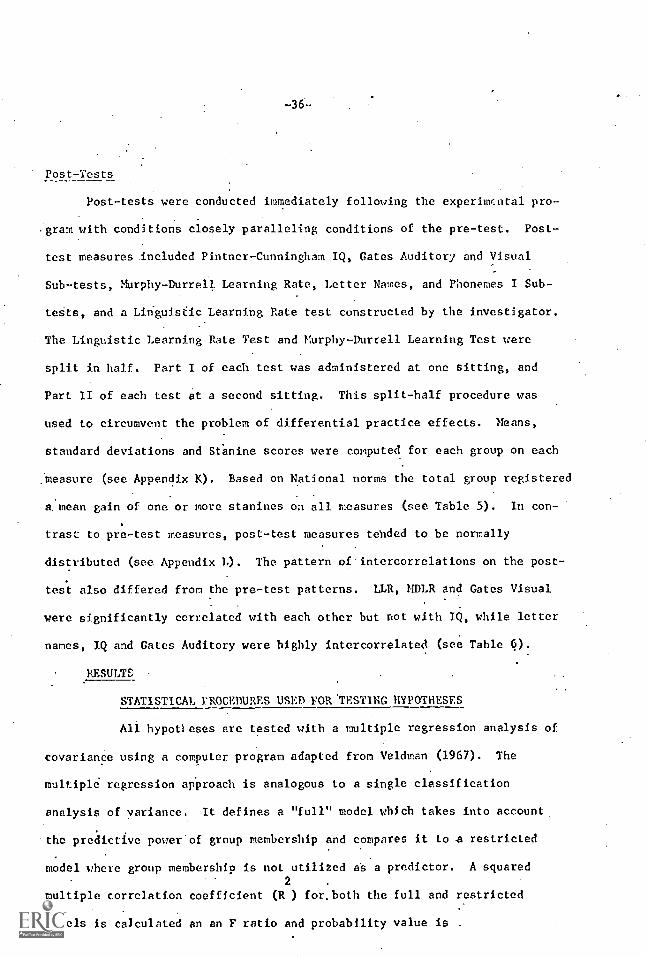
Post-Tests
Post-tests were conducted immediately following the experimental pro-
:gram with conditions closely paralleling conditions of the pre-test. Post-
test measures included Pintner-Cunningham IQ, Gates Auditory and Visual
Sub-tests, Murphy-Durrell Learning Rate, Letter Names, and Phonemes I Sub-
teSts, and a Linguistic Learning Rate test constructed by the investigator.
The Linguistic Learning Rate Test and Murphy-Durrell Learning Test were
split in half. Part I of each test was administered at one sitting, and
Part II of each test at a second sitting. This split-half procedure was
used to circumvent the problem of differential practice effects. Means,
standard deviations and Stanine scores were computed for each group on each
:measure (see Appendix K). Based on National norms the total group registered
a. mean gain of one or more stanines on all measures (see Table 5). In con-
trast to pre-test measures, post-test measures tended to be normally
distributed (see Appendix L). The pattern of intercorrelations on the post-
test also differed from the pre-test patterns. LLR, MDLR and Gates Visual
were significantly correlated with each other but not with IQ, while letter
names, IQ and Gates Auditory were highly intercorrelated (see Table G).
RESULTS
STATISTICAL PROCEDURES USED FOR 'TESTING HYPOTHESES
All hypofteses are tested with a multiple regression analysis of
covariance using a computer program adapted from Veld man (1967). The
multiple regression approach is analogous to a single classification
analysis of variance. It defines a "full" model which takes into account,
the predictive power'of group membership and compares it to -a restricted
model where group membership is not utilized as a predictor. A squared2
multiple correlation coefficient (R ) for, both the full and restricted
models is calculated an an F ratio and probability value is .
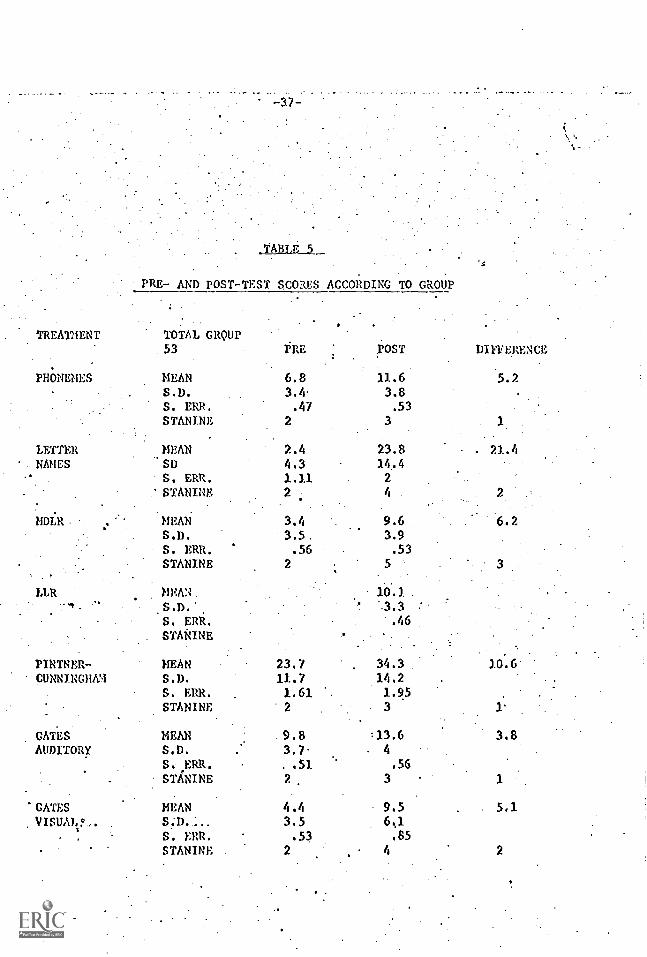
-37-
TREATMENT
PHONEMES
LETTERNAMES
moi,R:
LLR
PINTNER-CUNNINGHAM
GATESAUDITORY
'GATESVISUAL..
TABLE 5
PRE- AND POST-TEST SCORES ACCORDING TO GROUP
TOTAL GROUP53 PRE POST DIFFERENCE
MEAN 6.8 11.6 5.2S.D. 3.4 3.8S. ERR. .47 .53
STANINE 2 3 1
MEAN 2.4 23.8 . 21.4SD 4.3 14,4S. ERR. 1.11 2
STANINE 2 4 2
MEAN 3.4 9.6 6.2.
S.D. 3.5. 3.9
S. ERR. .56 .53
STANINE 2 5
MEAN 10.1S.D.'. .3.3S. ERR. .46
STANINE
MEAN 23.7 34.3 10.6S.D. 11.7 14.2S. ERR. 1.61 1.95
STANINE 2 3 1
MEAN 9.8 -13.6 3.8S.D. 3.7 4
S. ERR. . .51 .56
STANINE 2 3 1
MEAN 4.4 9.5 5.1S.D.... 3.5 61S. ERR. .53 .85
STANINE 2 4 2
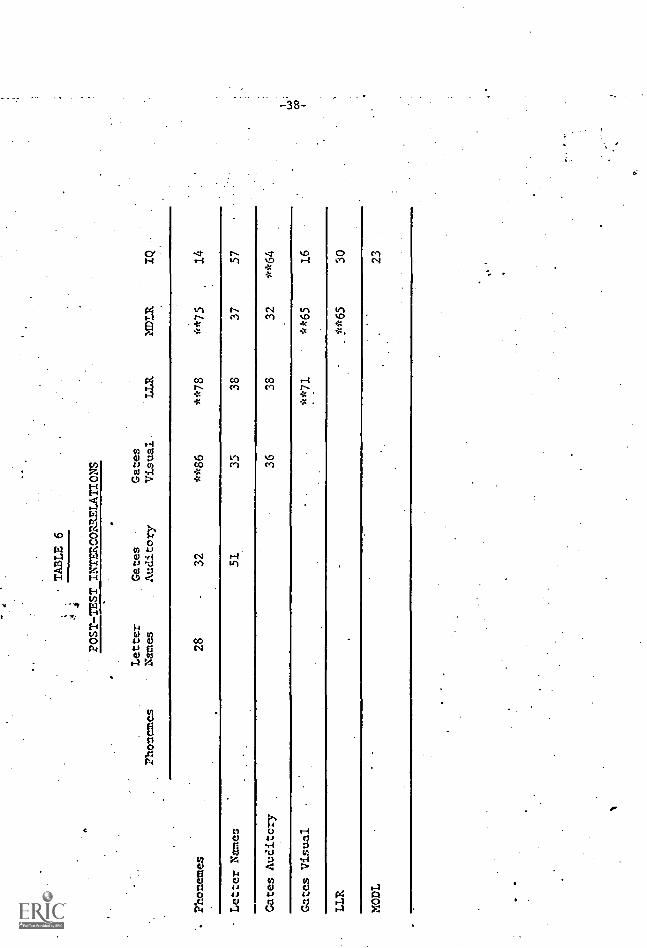
TABLE 6
POST-TEST INTERCORRELATIONS
Phonemes
Letter
Phonemes
Names
Gates
Auditory
Gates
Visual
LLR
MDLR
28
32
**86
**78
**75
14
Letter Names
51
35
38
37
57
Gates Auditory
36
38
32
**64
Gates Visual
Ii=
.111
70`
**71
*A65
16
LLR
.**65
30
MODL
23
o.
-39-
calculated on the basis of the R2 difference between the two models.
This procedure does not require an equal number of subjeCts per cell.
The investigator used multiple regression analysis of covariance
rather than variance in testing all hypotheses to control for differences
in post-test performance that could be attributed to differences in pre-
test performance. In each instance the covariate is a pre-test score
used as a predictor in bbth the full and restricted models to eliminate
the H2 difference between models that could be explained by entering
knowledge or ability.
A pre-condition of the analysis of covariance is the establishment
of homogeneity of regression or parallelism of regression lines. The
establishment of homogeneity of regression indicates that the amount of
change in post-test score per unit of pre-test score isthe'same for all
treatment groups. Models are set up to test for homogeneity of regression
according to the procedures recommended in Ward and Bottenberg (1963).
(See Appendix E.) The full model uses the pre-test score of each treat-
ment group as a separate predictor, and romputes partial regression
weights for each predictor. The reduced model combines all treatment
group covariate scores into one predictor and computes a single regression
weight.
STATISTICAL ANALYSIS OF HYPOTHESES
(For the purpose of the analysis all hypotheses are stated in the null
font.)
HYPOTHESIS 1.
(A) With homogeneity of regression established, and Gates ReadingReadiness Auditory Perception Pre-test scores used as a co-variate, there will be no significant difference in performancebetween AVAP and GRP using the Gates Readiness Auditory Percep-tion Post-test as a criterion.
-4V-
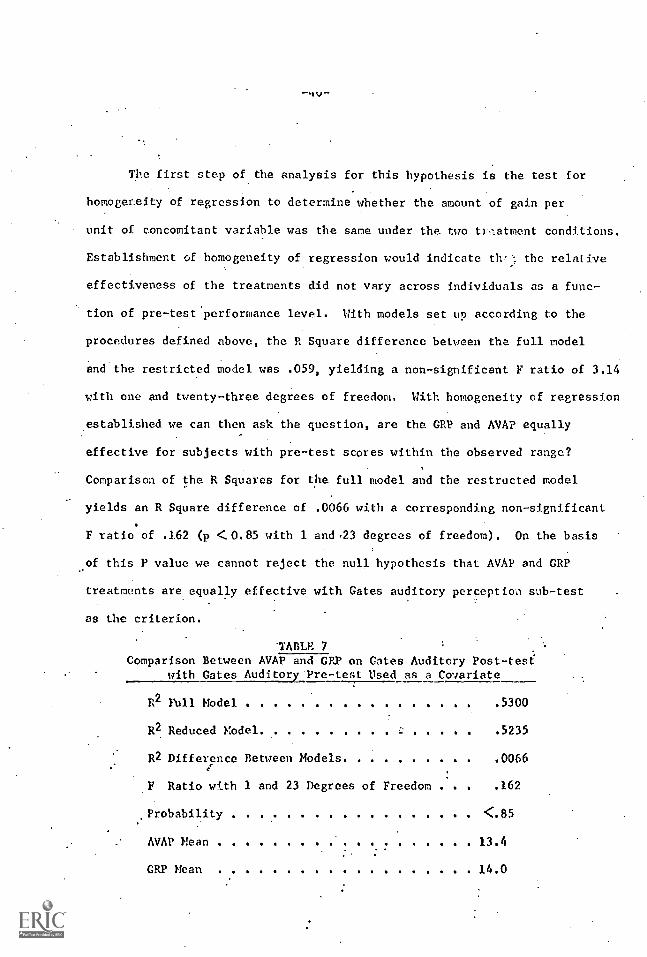
The first step of the analysis for this hypothesis is the test for
homogeneity of regression to determine whether the amount of gain per
unit of concomitant variable was the same under the two t),-.atment conditions.
Establishment of homogeneity of regression would indicate th .:. the relative
effectiveness of the treatments did not vary across individuals as a func-
tion of pre-test performance level. With models set up according to the
procedures defined above, the R Square difference between the full model
and the restricted model was .059, yielding a non-significant F ratio of 3.14
with one and twenty-three degrees of freedom. With homogeneity of regression
established we can then ask the question, are the GRP and AVAP equally
effective for subjects with pre-test scores within the observed range?
Comparison of the R Squares for the full model and the restructed model
yields an R Square difference of .0066 with a corresponding non-significant
F ratio. of .162 (p <0.85 with 1 and,23 degrees of freedom). On the basis
of this P value we cannot reject the null hypothesis that AVAP and GRP
treatments are equally effective with Gates auditory perceptioa sub-test
as the criterion.
'TABLE 7
Comparison Between AVAP and GRP on Gates Auditory Post -testwith Gates Auditory Pre-test Used as a Covariate
R2 Full Model 5300
R2 Reduced Model 5235
R2 Difference Between Models 0066
F Ratio with 1 and 23 Degrees of Freedom . . . .162
Probability <85
AVAP Mean 134
GRP Mean 140
-41-
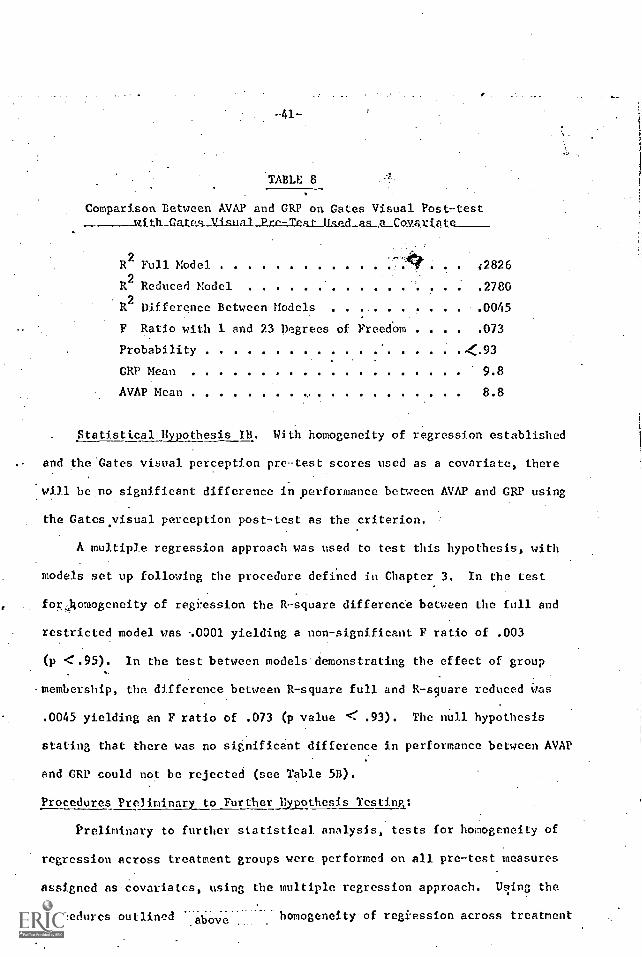
TABLE 8
Comparison Between AVAP and GRP on Gates Visual Post-testwith_Gaies__Visual Prp-Tpuusa_as_a cov_aziatQ
R2Full Model
R2Reduced Model
i2826
.2780
R2
Difference Between Models .0045
F Ratio with 1 and 23 Degrees of Freedom . . . .073
Probability 4C.93
GRP Mean 9.8
AVAP Mean 8.8
Statistical Hypothesis TB. With homogeneity of regression established
and the'Cates visual perception pre-test scores used as a covariate, there
will be, no significant difference in- rformance between AVAP and GRP using
the Gates visual perception post-test as the criterion.
A multiple regression approach was used to test this hypothesis, with
models set up following the procedure defined in Chapter 3. In the test
forjomogeneity of regi-ession the R -- square differende between the full and
restricted model was -.0001 yielding a non-significant F ratio of .003
(p .95). In the test between models demonstrating the effect of group
. membership, the difference between R-square full and R- square reduced Was
.0045 yielding an F ratio of .073 (p value < .93). The null hypothesis.
stating that there was no significant difference in performance between AVAP
and CRP could not be rejected (see Table 58).
Procedures Preliminary to Further Hypothesis Testing:
Preliminary to further statistical. analysis, tests for homogeneity of
regression across treatment groups were performed on all pre-test measures
assigned as-covariates, using the multiple regression approach. Using the
procedures outlined homogeneity of regiession across treatment
-4Z-
groups was established for all covariates with the exception of Gates Audi-
tory (see Table 9). In the case of Gates Auditory Test the R-square differ-
ence between the full and restricted model was .13 yielding an F value of
3.13, significant at the .05 level. Homogeneity of regression between pre-
and post-Gates Auditory Perception Test had already been established for
GRP and VAP. It seemed appropriate, therefore, to explore the pre-post
scores scattergrams for the four treatment groups (Appendix N). It is evi-
dent from the scattergrams that the relatLonship between pre-test and post --
test scores is erratic in the VAP treatment group. Accordingly, the Gates
Auditory pre -costs could not be used appropriately as a covariate in data
analysis when all four groups are considered in the analysis.
Statistical Hypothesis 2. With homogeneity of regression established
and Pintner-Cunningham pre-scores used as a covariate, there will be no
significmit difference in performance between AVAP and "GRP, AAP, and VAP"
taken as a pooled group.
The Manova program was used for this analysis, using the special con-
trast option (Edwards, 1967), allowing a comparison between AVAP and the
average of GRP, VAP and AAP. This analysis yielded an F value of 2.98,
.significant at the .05 level with 3 and 49 degrees of freedom. On the
basis of this analysis we can reject the null hypothesis stating that there
is no significant difference in post- -test Piutnei--Cunningham IQ scores re-
suiting from. treatment (see Table 10).
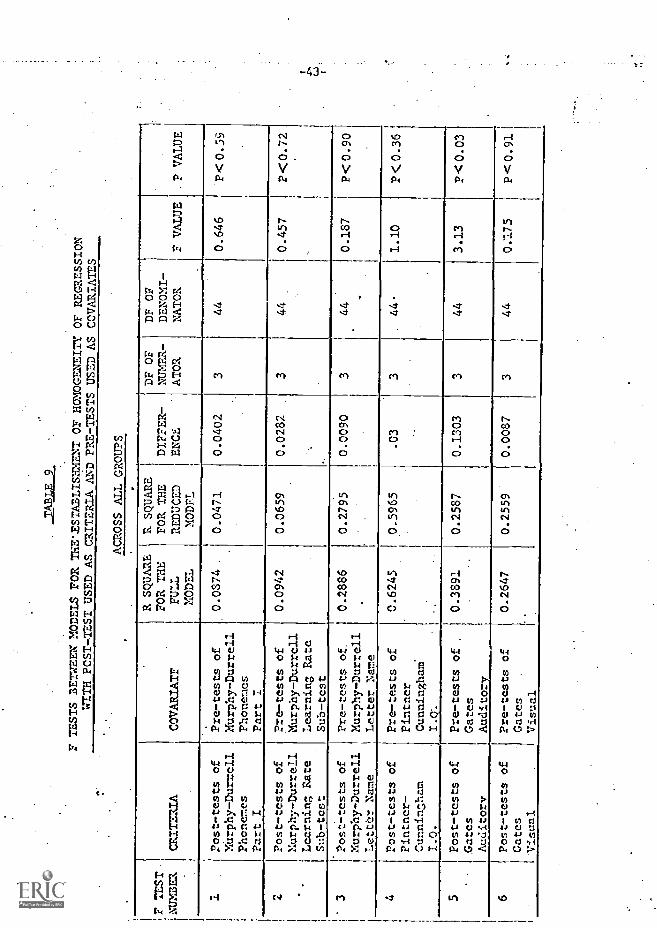
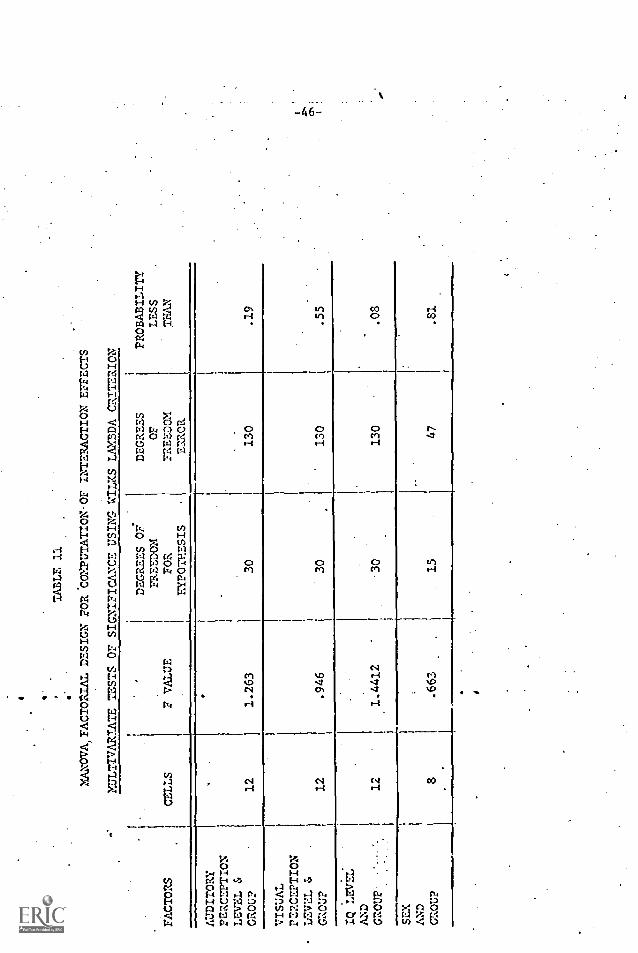
Statistical Hypothesis 3. With homogeneity of regression established
and piV-test scores used as covariates, there will'be no interaction effect
between 2y-treatment (a) auditory perception level and group, (b) visual
perception level and group, (c) IQ level and group, on post-test performance.
SABLE 9
F TESTS BETWEEN MODELS FOR THE'ESTABLISMENT OF
HOMOGENEITY OF REGRESSION
WITH POST -TEST USED AS CRITERIA AND PRE-TESTS
USED AS COVARIATES
ACROSS ALL GROUPS
F TEST.
NUMBER
CRITERIA
COVARIATF
R SQUARE
FOR THE
FULL
MODEL
R SQUARE
FOR THE
REDUCED
MODFL
DIFFER-
ENCE
DF OF
NUMER-
ATOR
DF OF
DENOMI-
NATOR
P VALUE
.P VALUE
1Post-tests of
Pre-tests of
0.0874
0.0471
0.0402
344
0.646
P4:0.55
MUrphy-Durrell
Murphy-Durrell
Phonemes
Phonemes
Part I
Part I
2Post-tests of
Pre-tests of
0.0942
0.0659
0.0282
344
0.457
P.<0.72
Murphy-Durrell
Murphy-Durrell
Learning Rate
Learning Rate
Sub-test
Sub-test
3Post-tests of
Pre-tests of.
0.2886
0.2795
0.0090
344
0.187
P<C0.90
Murphy-Durrell
Murphy-Durre11
.
LettUr Name
Letter Name
4Post-tests of
Pre-tests of
0.6245
0.5965
.03
3.44
1.10
P<:10.36
Pintner-
Pintner
..
Cunninsham
Cunningham
.
I.O.
I.Q.
.
5Post-tests of
Pre-tests of
.0.3891
0.2587
0.1303
344
3.13
P<0.03
Gates
Gates
Auditory
Auditory
6Post-tests of
Pre-tests of
0.2647
0.2559
0.0087
344
0:175
P4C0.91
Cates
1:4,,fti
Gates
vi_qun1
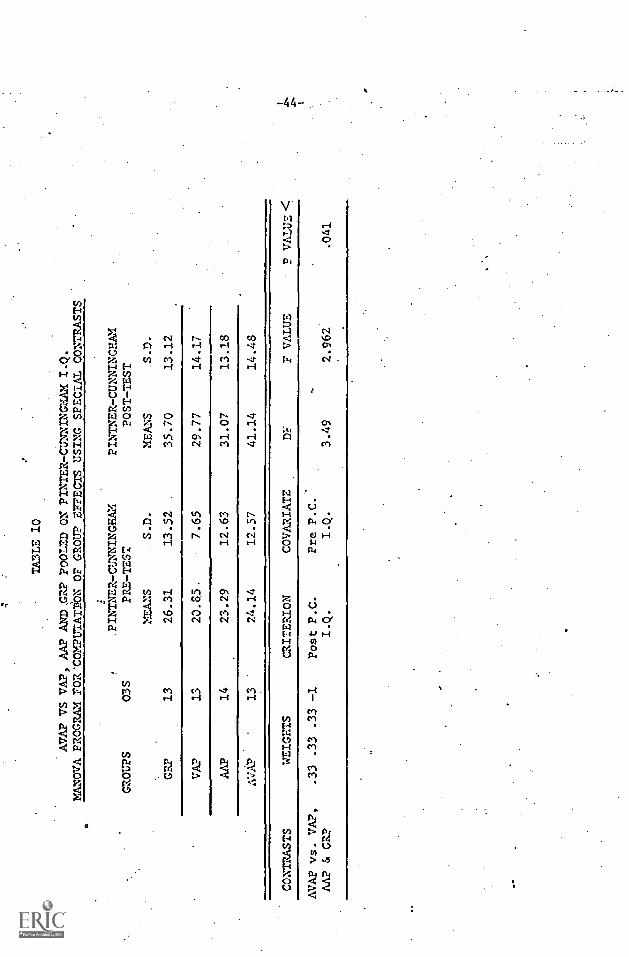
TABLE 10
AVAP VS VA?, AAP AND .GRP POOLED ON PINTERCUNNINGHAK I.Q.
MANOVA PROGRAM FOR'COMPUTATIiON OF GROUP EFFECTS USING SPECIAL CONTRASTS
.PINTNER7-CUNNINGHAM
PINTNER-CUNNINGHAM
GROUPS
03S
PRE-TEST
POST-TEST
MEANS
_S.D.
MEANS
.S.D.
GRP
13
26.31
13.52
.35.70
13.12
VA?
13
20.85.
'
7.65
29.77
14.17
AAP
14
23.29
12.63
31.07
13.18
AVAIL'
13
24.14
12.57
41.14
14.48
CONTRASTS
WEIGHTS
CRITERION
COVARIATE
D1
F VALUE
P VALUE <
AVAP vs. VAP,
.33 .33 .33 -1
Post P.C.
Pre P.C.
-
AAP & GRP
I.Q.
I.Q.
3.49
2.962
.041
-45-
. For this analysis, each subject was assigned a level score of 1, 2 or 3
for visual, auditory and IQ level,according to the ordinal position of his
associated pre test scores on the Gates visual and auditory pre-tests and
the Pintner-Cunningham IQ test. In each case, individuals scoring in the
lower third of the distribution were Assigned a 1, in the middle third a 2,
and in the upper third a 3.
Using the Manova program with a 3 x kfactorial design, three analyses
were performed testing the interaction effect of pre-treatment auditory
level and group, pre-treatment visual level and group, and pre-treatment Y.Q
level and group. No significant interaction effects were revealed (see
Table 11), and the null hypothesis could not be rejected,
Statistical Hypothesis 4. With .homogeneity of regression established
and the MurphyDurrell letter names, learninp rate, and the Gates visual
perception scores used as covariates, thero: will be no significant differ-
ences in performance (a) between AVAP and VAP pooled and GRP and AAP pooled,
and (b) between AVAP and: AAP on post-test perfor.ance Using the Murphy-
DurrA.1 letter names sub-test, the Gates visual perz,eption sub-test, and
the Murphy -Durrell learning rate sub-test as the criteria.
A multivariate analysis of variance with special conerasts was used to
test this hypothesis. In the first analysis AVAP and VAP (where treatment
included visual alphabet training) were combined, and AAP and GRP (the
groups that did not receive visual alphabet training) were combined. The
'analysis yielded a nonsignificant P value of 1.5, (p However, the0
univariate test with the letter name sub -test approaches significance,
yielding a F value of 3.817 and a probability value of .056 (Table 12).
The multivariate analyds comparing AVAP and AAP on letter names and Murphy-
Darrell Learning Fate yields an F value of 3.4, significant at the .05 level,
4'
TABLE 11
MANOVA,FACTOAIAL DESIGN FOR 'COXPUTATION'OF INTERACTION EFFECTS
XULTIVARIATE TESTS OF SIGNIFICANCE USING WILKS LAMBDA CRITERION
FACT02S
CELLS
.
.
F VALUE
DEGREES OF
FREEDOM
FOR
EYPOTHESIS
DEGREES
OF
'FREEDOM
ERROR
PROBABILITY
LESS
.
THAN
AUDITORY
PERCEPTION
LEVEL &
.
GROUP
12
1.263
30
130
.19
VISUAL
PERCEPTION
TJEVEL &
GROUP
12
.946
30
130
-
.55
..
IQ LEVEL
AND
GROUP ...
12
1.4412
'
'30
.
130
.
-
.08
SEX
AND
moup
S
; .663
15
-
47
.
.81
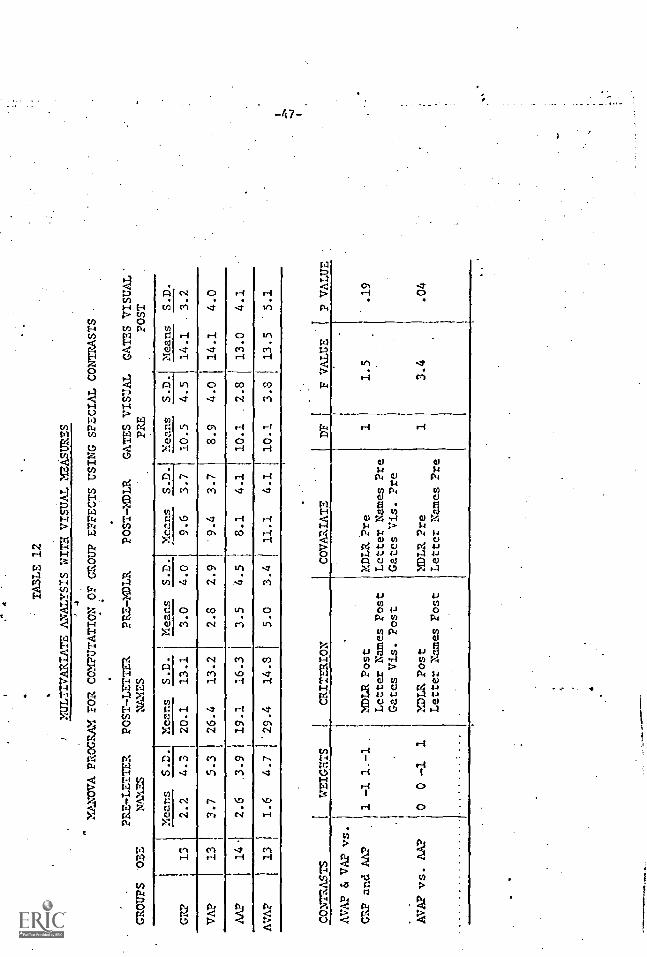
TABLE 12
MULTIVARIATE ANALYSIS WITH VISUAL MEASURES
4
MANOVA PROGRAM FOR COMPUTATION OF GROUP EFFECTS USING SPECIAL CONTRASTS
PRE-LETTER
POST-LETTER
GROUPS
-OBE
NAMES
NAMES
PRE-MDLR
POST-MDLR
GATES VISUAL GATES VISUAL"
PRE
-POST
GRP
13
Means
S.D.
Means
S.D.
Means
S.D.
Means
S.D.
Means
S.D.
Means
S.D.
3.2
2.2
4.3
20.1
13.1
3.0
4.0
9.6
3.7
10.5
4.5
14.1
VA?
13
3.7
5.3
26.4
13.2
2.8
2.9
9.4
3.7
8.9
4.0
14.1
4.0
AAP
14
2.6
.3.9
19.1
16.3
3.5
4.5
8.1
4.1
10.1
2.8
13.0
4.1
AVAP
13
1.6
4.7
29.4
14.8
5.0
3.4
11.1
4.1
10.1
3.8
13.5
5.1
CONTRASTS
WEIGHTS
CRITERION
COVARIATE
DF
F VALUE1
P VALUE
AVAP & VAP vs.
GRP and AAP
1-1
1.-1
YMLR Post
MDLR Pre
11.5
.19
Letter Names Post
Letter Names Pre
Gates Vis. Post
Gates Vis. Pre
AVAP vs. AAP
00-1
1?MLR Post
MDLR Pre
13.4
.04
Letter. Names Post
Letter Names Pre
-48-
The univariate F value for the letter name test was 5.53 and for the Murphy -
Durrell Learning Rate Test 5.55 with P values of .038 and .022 respectively
(Table 12).
On the basis of this analysis, we cannot reject Hypothesis 4, Part I,
asserting that there will be no significant difference in performance on
visual measures between groups given specific visual alphabet training, and
groups not given specific alphabet training. We can, however, reject Part
II of the Hypothesis. There is a significant difference on visual measures
between AVAP and AAP, the group. that received auditory and visual alphabet
training, and the group that received only auditory alphabet training. In
the univariate tests the visual measures show significant differences while
the auditory measures do not (Table 13).
Statistical Hypothesis 5. With homogeneity of regression established
and Murphy-Durrell Phonemes and Learning Rate Tests used as covariates,
there will be no significant difference in performance on the Nurphy-Durrell
phoneme tests between (1) AVAP and AAP pooled; and GRP*and VAP pooled, or
(2) between AVAP and VAP (Gates Auditory Perception sub-test is omitted
from the analysis as homogeneity of regression was not established (Table
14)..
Hypothesis 2 was tested with a multivariate analysis program again
using the special contrast option. Combining AVAP with VAP and GRP with
AAP, specific auditory alphabet training groups with nonspecific auditory
alphabet training groups, the analysis yields a nonsignificant F value of
1.341 (p less than .2666) with no significant univariate F tests. The null
hypothesis, therefore, cannot be rejected.
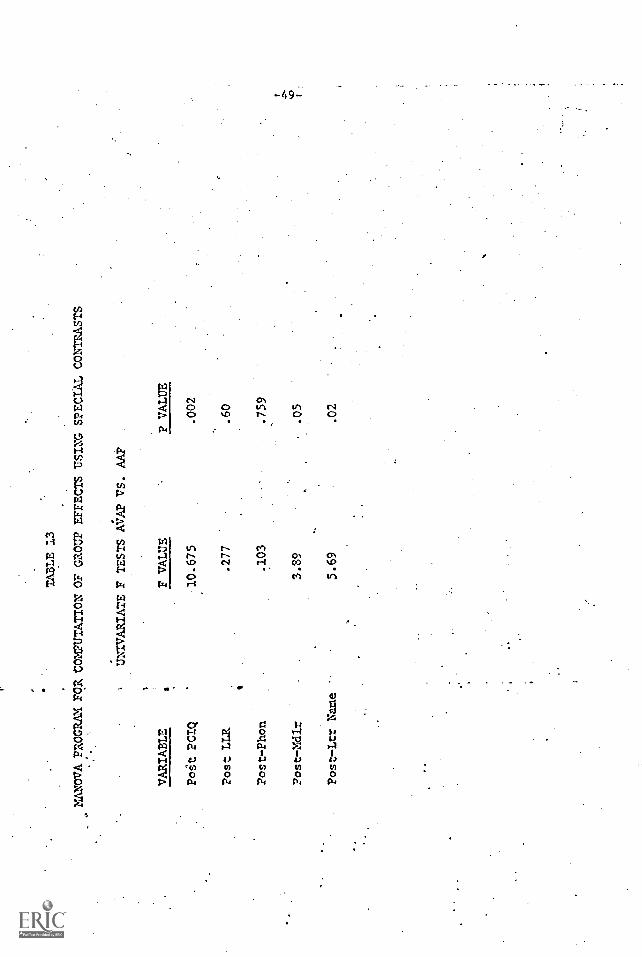
TABLE 13
MANOVA PROGRAM. FOR COMPUTATION OF GROUP EFFECTS USING SPECIAL CONTRASTS
VARIABLE
LTNIVARIATE F TESTS AVAP VS. AAP
F VALUE
P VALUE
Poit PCIQ
10.675
.002
Post LLR
.277
.60
Post-Phon
.103
:759
Post -Mdlr
3.89
.05
Post-Ltr Mae
'
5.69
.02
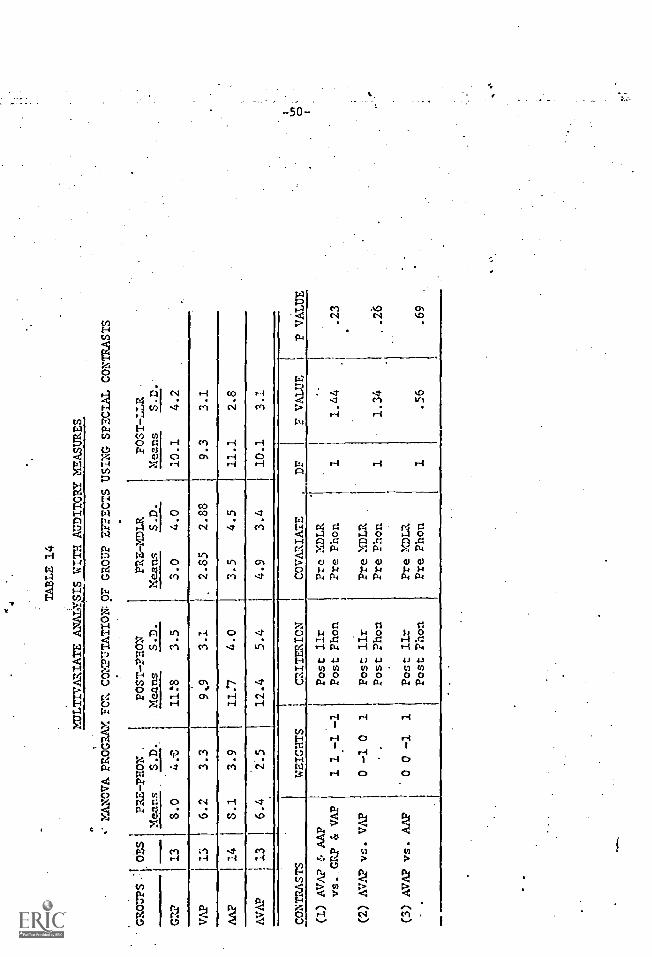
TABLE 14
MULTIVARIATE ANAT*S WITH AUDITORY MEASURES
MANOVA PROGRAM FOR COMPUTATION: 9P GROUP EXPECTS USING SPECIAL CONTRASTS
.
GROUPS.- OBS
PRE-PEON .
POST-PEON
PRE-MDLR
Means
S.D.
.Meens
S.D.
Means
S.D.
GRP
f 13
3.0
4.S
11,8
3.5
3.0
4.0
POST-LLR
Means
S.D.
10.1
4.2
VA?
13
6.2
3.3
9,9
3.1
2.85
2.88
9.3
3.1
14
I8.1
3.9
11:7
4.0
3.5
4.5
11.1
2.8
AVAP
, 13
I6.4
2.5
12.4
5.4
4.9
3.4
10.1
3.1
CONTRASTS
(1) AVAP & AAP
vs. GRP & VAP
(2) AVAP vs.
va
(3) AVAP vs. AAP
WEIGHTS
CRITERION
COVARIATE
D7
7 VALUE
Post Ilr
Pre MDLR
1 1-1-1
Post Phon
Pre Phon
11.44
0 -1 0
1Post IIr
Pre MDLR
Post Phon
Pre Phon
11.34
0 0 -1
1Post Ilr
Pre MDLR
Post ?hon
Pre ?hon
1.56
F VALUE
.23 6
.69
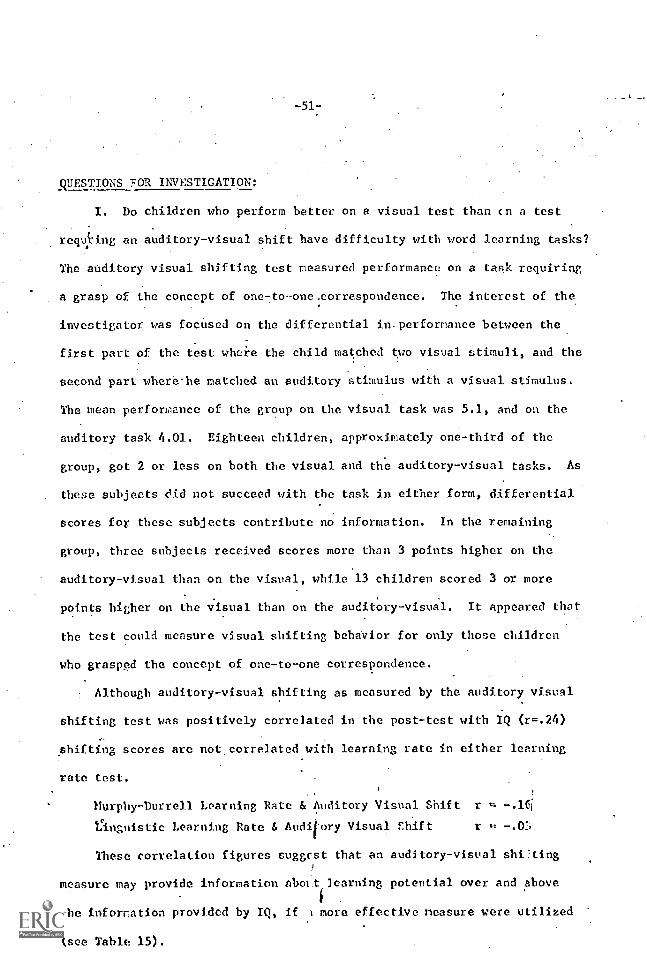
-517
QUESTIONS 'OR INVESTIGATION:
I. Do children who perform better on a visual test than cn a test
requring an auditory-visual shift have difficulty with word learning tasks?
The auditory visual shifting test measured performance on a task requiring
a grasp of the concept of one-to-one:correspondence. The interest of the
investigator was focused on the differential in performance between the
first part of the test wheie the child matched two visual stimuli, and the
second part where-he matched an auditory stimulus with a visual stimulus,
The mean performance of the group on the visual task was 5.1, and on the
auditory task CO]. Eighteen children, approximately one-third of the
group, got 2 or less on both the visual and the auditory-visual tasks. As
these subjects did not succeed with the task in either form, differential
scores for these subjects contribute no information. In the remaining
group, three subjects received scores more than 3 points higher on the
auditory-visual than on the visual, while 13 children scored 3 or more
points higher on the visual than on the auditory-visual. It appeared that
the test could measure visual shifting behavior for only those children
who grasped the concept of one-to-one correspondence.
Although auditory-visual shifting as measured by the auditory visual
shifting test was positively correlated in the post-test with IQ (r=.24)
shifting scores are not correlated with learning rate in either learning
rate test.
Murphy-Durrell Learning Rate & Auditory Visual Shift r
teinguistic Learning Rate & Audilory Visual shift r
These correlation figures suggest that an auditory-visual shi:ting
measure may provide information abolt learning potential over and above
the information provided by IQ, if 1 more effective measure were utilized
(see Table 15).
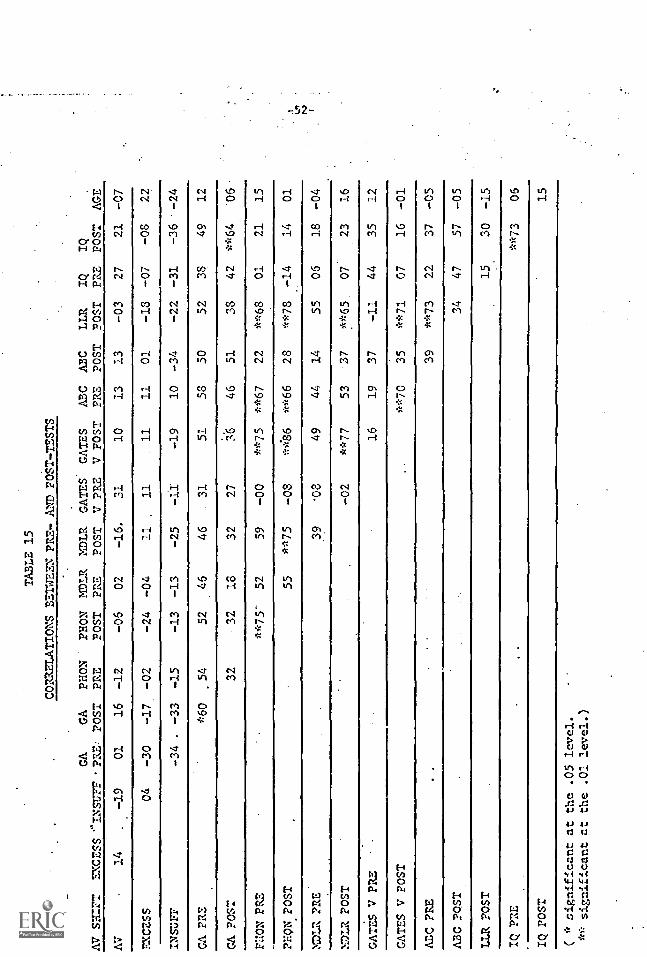
TABLE 15
CORRELATIONS BETWEEN PRE- AND POST-TESTS
GA
AV SEITT
EXCESS ''/NSB77 .PRE
GA
POST
PEON
PRE
PEON
POST
MDLR
PRE
MDLR
POST
GATES
V PRE
GATES
V POST
ABC
PRE
ABC
POST
LLR
POST
IQ
PRE
IQPOST
AGE
AV
14
.-19
01
16
-12
-06
02
-16.
31
10
13
13
-03
27
21
-07
7.XCESS
04
-30
-17
-02
-24
-04
11
.11
11
II
01
-18
-07
-08
22
INSUFF
-34
.-33
-15
-13
-13
-25
-II
-19
10
-34
-22
-31
-36
-24
GA PRE
*60
,54
52
46
46
31
51
58
50
52
38
49
12
CA POST
32
32
16
32"
27
3.6
46
51
38
42
**64
06-
PION PRE
**75-
52
59
-00
**75
**67
22
**68
01
21
15
?HQN POST
55
**75-
-OS
**86
**66
28
**78
-14
14
01
MDLR ?RE
39
03
49
44
14
55
06
18
-04
MD= POST
-02
**77
53
37
**65,
07'
23
16
CATES V PRE
16
19
37
-11
44
35
12
CATES V POST
**70
35
**71
07
16
-01
ABC ?RE
39
**73
22
37
-05
ABC POST
34
47
57
-05
LLR POST
15
30
-15
IQ PRE
**73
06
IQ POST
15
( * significant at the .05 level.
** significant at the .01 level.)
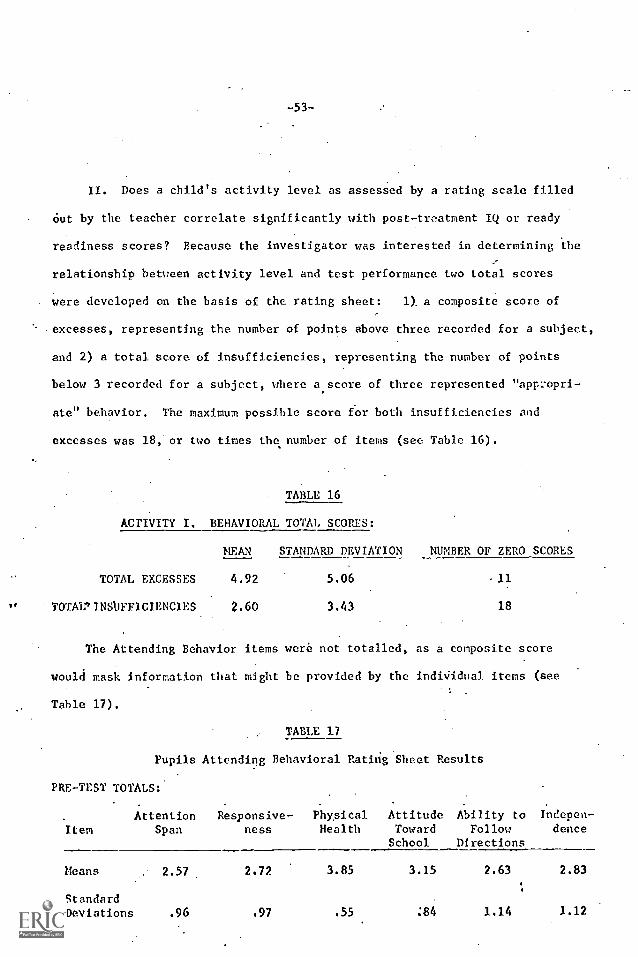
-53-
II. Does a child's activity level as assessed by a rating scale filled
Out by the teacher correlate significantly with post-treatment I(1 or ready
readiness scores? Because the investigator was interested in determining the
relationship between activity level and test performance two total scores
were developed on the basis of the rating sheet: 1). a composite score of
excesses, representing the number of points above three recorded for a subject,
and 2) a total score of insufficiencies, representing the number of points
below 3 recorded for a subject, where a score of three represented "appropri-
ate" behavior. The maximum possible score for both insufficiencies and
excesses was 18, or two times the number of items (see Table 16).
TABLE 16
ACTIVITY I. BEHAVIORAL TOTAL SCORES:
MEAN STANDARD DEVIATION NUMBER OF ZERO SCORES
TOTAL EXCESSES 4.92
TOTAL'INSUFFICIENCIES 2.60
5.06 11
3.43 18
The Attending Behavior items were not totalled, as a composite score
would mask information that might be provided by the indiVidual items (see
Table 17).
TABLE 17
Pupils Attending Behavioral Rating Sheet Results
PRE-TEST TOTALS:.
. Attention Responsive- Physical Attitude Ability to Indepen-
Item Span ness Health Toward Follow denceSchool Directions
Means 2.57 2.72 3.85 3.15 2.63 2.83
StandardDeviations .96 .97 .55 :84 1.14 1.12
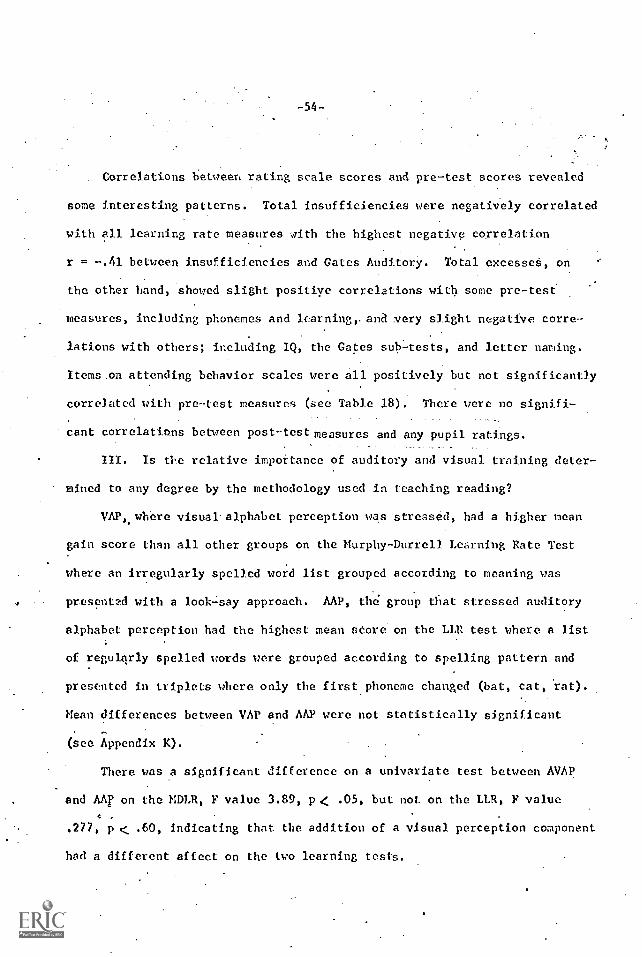
-54--
Correlations between rating scale scores and pre-test scores revealed
some interesting patterns. Total insufficiencies were negatively correlated
with all learning rate measures :,pith the highest negative correlation
r = -.41 between insufficiencies and Gates Auditory. Total excesses, on
the other hand, showed slight positiye correlations with some pre-test
measures, including phonemes and learning, and. ery slight negative corre-
lations with others; including IQ, the Gates sub:tests, and letter naming.
Items on attending behavior scales were all positively but not significantly
correlated with pre-test measures (see Table 18). There were no signifi-
cant correlations between post-test measures and any pupil ratings.
III. Is the relative importance of auditory and visual training deter-
mined to any degree by the methodology used in teaching reading?
VAP,. where visual alphabet perception was stressed, had a higher mean
gain score than all other groups on the Murphy-Durrell Learning Rate Test
where an irregularly spelled word list grouped according to meaning was
presented with a look-say approach. AAP, the group that stressed auditory
alphabet perception had the highest mean store on the LLU test where a list
of regularly spelled words were grouped according to spelling pattern and
presented in triplets where only the first phoneme changed (bat, cat, 'rat).
Mean differences between VAP and AAP were not statistically significant
(see Appendix 1.0.
There was a significant difference on a univariate test between AVAP
and AAF on the MDLR, F value 3.89, p< .05, but not on the LLR, F value
.277, p < .60, indicating that the addition of a visual perception component
had a different affect on the two learning tests.
-56-
DISCUSSIONS & CONCLUSIONS
The purpose of the present study is to provide information that can be
helpful in planning a kindergarten perceptual program for the SEL I black
child. Although the experimental hypotheseS of the investigator are not
supported in every instance, the study provides information that sheds
light on several pivotal issues involving perceptual training.
The first issue concerns the appropriate sequencing of a perceptual
training program. Educators who advocate placing the SEL I black kinder-
garten child on a program that emphasizes general readiness non-alphabet
skills assume a hierarchical model in which a Cluster of lower-order
perceptual sub-skills serve as prerequisites for higher-order perceptual
sub-skills directly involved in decoding. Because the black SEL I child
is known to lack mastery of the lower-order sub-skills, he is placed on a
general readiness program in the kindergarten year.
The firs hypothesis in the present study, assumes the. position that
the SEL I child will be just as successful on a program that stresses
alphabet skills as he will be on a program that stresses general readiness
non - alphabet skills. This hypothesis is supported. There is no signifi-
cant difference between AVAP and GRP on post-test measures of auditory and
visjal perception. On the Gates Auditory post-test, GRP registers a mean
gain of.3.6 raw score points compared with a mean gain of 3.4 for AVAP,
-57-
and on the Gates Visual post -test GRP shows a mean gain of 4.2 compared
with a mean gain of 5.7 for AVAP. The assumption of a hierarchical model
in which lower level non-alphabet skills are prerequisites for higher-order
alphabet skills is not validated by the data in the present study. The
outcome of the study would be consistent, however, with a theoretical posi-
tion asserting that the crucial element in a, perceptual program is not the
kind of symbol that is perceived or manipulated, but the operations involVed
in their perception or manipulation. It may not be important in terms of
a child's developmert whether he deals With geometric or alphabetic symbols.
What may be important is the mental operation, the attending, f: itering,
focusing, matching, serializing or categorizing processcsrequired by the
task. If the task demands in AVAP and GRP are equally appropriate for the
SEL I black child, the type of visual or auditory symbols manipulated in
the tasks they provide would not be critical.
A second, and closely related issue, is whether the child's pre -test
profile can provide information which will allow the teacher to decide
what kind of perceptual program would best serve his needs. In the present
study there was no interaction between treatment group andfpre-test IQ
level, visual perception level as measured by Gates Visual sub-test, or
auditory perception level as measured by Gates Auditory sub-test. These
findings do not preclude the possibility of matching treatment to pre-test
.profile. They do suggest that assignment to a particular treatment group
cannot be made simply on the basis of IQ, or on the basis of selected
readiness measures.' The practice of placing low IQ children in a general
readiness program, and higher IQ children on an alphabet skill program is
not supported.
The.third issue concerns the relative effectiveness of visual and
auditory alphabet training programs. Here there are four Concerns:
a. Are the development of auditory and visual alphabet
skills linked to maturation, or can their development
be accelerated through training?
b. Does auditory training improve auditory skills and
visual training improve visualskillS?
c. What is the relative importance of visual and
auditory training in preparing a child to rend?
d. Is the relative importance of auditory and visual
perceptual, training determined to any extent by
the methodology of a subsequent reading program?
a.. Are the development of auditory and visual alphabet skills
linked to maturation, or can their development be accelerated through train-
ing? The correlation of age with other readiness measures used in the
present study provides some information relative to this question. None
of the post-test readiness measures are significantly correlated with age.
our of the seven correlation coefficients between age and readiness scores
are positive, three are negative. Apparently maturation alone cannot
explain perceptual development. The effect of training on development,
must be recoenized as intricate. .
b. Does auditory training improve auditory skills Ane visual train-
ing impr6ve visual skills? This question cannot be answered definitively
on the basis of the present study. The investigator hypothesized that
AVAP and AAP would outnerform VA}' and CRP on auditory alphabet measures,
and that. AVAP aLd VAP would outperform MP and GIT on visual perception
-59--
alphabet measures. These hypotheses were not supported. One of the diffi-
culties here is the problem of sub-test validity. The investip,ator divided
the reading readiness sub-tests into two categories, auditory and visual,
according to their apparent content. Gates Visual, Murphy-Durrell Learning
Rate, and Letter Names were classified as visual, and Gates Auditory and
Murphy-Durrell Phonemes were classified as auditory. Examination of the
task requirements and intercorrelation patterns of these tests indicates
that other classificatory schemes are possible. Four of the post-tests,
LLR, MDLR, Gates Visual, and Phonemes, are significantly intercorrelated,
but are not correlated with IQ. The common and critical element in each
LLR
LLR
IiDLR
GATES VIS.
PHONEMES
MDLR
**.65
GATES VIS. PHONEMES
**.78
**.75
k**.86
_IQ
.30
.23
.16
.14
**.71
.49
(** significant at the .01 level)
of these tests may be the ability of the-child to mat:e an auditory or
visual discrimination and/or association. The other two reading readiness
tests, Letter. Naming and Gates Auditory, are correlated with each other,
r .51, and also with IQ. The correlation is .64 between Gates Auditory
and 1Q and .57 between Letter Naming and IQ. An examination of the task
demands Of the Letter Name and the Gates Auditory sub-tests suggests that
both these tests require the interpretation of a visual symbol. In the
Gates AUditory test, for instance, when the examiner says, "marks, march,"
the critical feature may not be the childts ability to discriminate between
the two words he hears, but his ability to identify the symbol for "marks"
-60-
and the drawing that is representative of the word "march." In the Letter
Name,test, the examiner names a series of letters which the child must
mark off on an answer sheet. In order to mark off the appropriate letter,
the child must be able to identify its critical features, It may be that
the Gates Auditory and the Letter Naming sub-test measure an ability to
deal with symbolic content which 58 different from the discrimination and
association ability that is tapped on the other sub-tests.
Although the "auditory vs, visual' is not the only classificatory
scheme Chat can be used to group the sub-tests, the meen scores on the
sub-tests indicate a trend in the direction of the original hypothesis.
. The mean gain score for AAP-AVAP on the Phonemestest was 4.8, compared to
a mean gain score for GRP VAP of 3.75. The mean gain score for AVAP VAP
on the Letter Names test was 24.8, compared to a mean gain for GRP - AAP
of 17.1.
C. What is the relative importance of visual and auditory training
in preparing a child toread? Although there is no significant difference
between VAP and AAP in the reading readiness measures in the multivariate
sense, AVAP is signir.icantly better than AAP (p < .05), but not signifi-
cantly better than VAP, indicating that the VAP program had a greater
immediate effect on the reading readiness measures than the AAP program.
An examination of the rank order of the four treatment groups gives addi-
tional support to the,claim that the VAP program is superior to AAP. It
is possible, however, that the teachers' original prediction as to treat-
ment outcome may have served as a self fulfilling prophecy and influenced
the results.
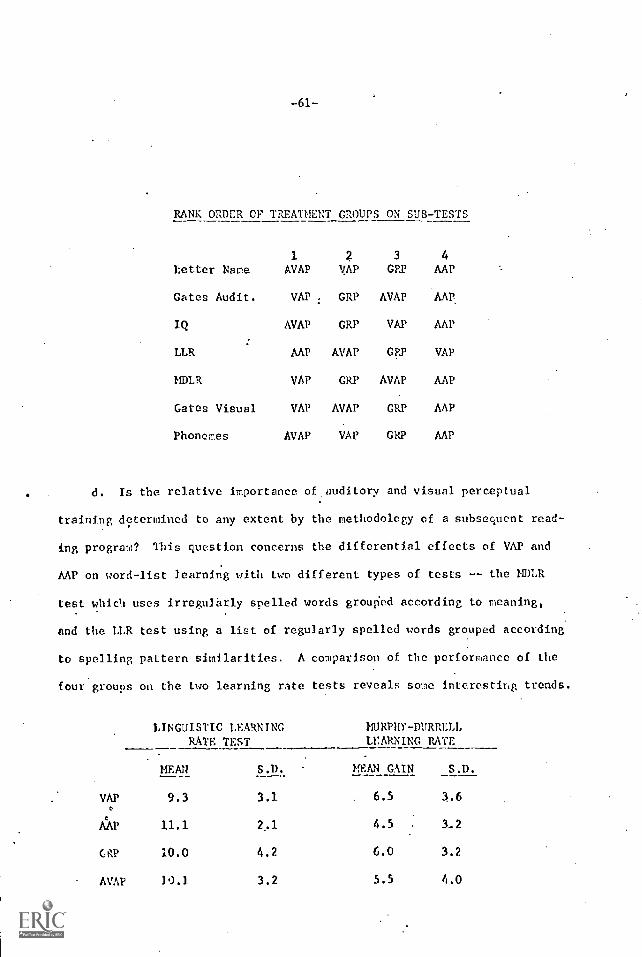
-61-
RANK ORDER OF TREATMENT GROUPS ON SUB-TESTS
1 2 3 4
Letter Name AVAP VAP GRP AAP
Gates Audit. VAP : GRP AVAP AAP
IQ AVAP GRP VAP AAP
LLR AAP AVAP GRP VAP
MDLR VAP GRP AVAP AAP
Gates Visual VAP AVAP GRP AAP
Phonemes AVAP VAP GRP AAP
d. Is the relative importance of auditory and visual perceptual
training determined to any extent by the methodology of a subsequent read-
ing program? This question concerns the differential effects of VAP and
AAP on word-list learning with two different types of tests -- the NDLR
test which uses irregularly spelled words grouped according to meaning,
and the LLR test using a list of regularly spelled words grouped according
to spelling pattern similarities. A comparison of the performance of the
four groups on the two learning rate tests reveals some interesting trends.
LINGUISTIC LEARNING MURPHY-DURRELLRATE TEST LEARNING RATE
MEAN S.D. MEAN GAIN S.D.
VAP 9.3 3.1 6.5 3.60
AP 11.1 2,1 4.5 3..2
GRP 10.0 4.2 6.0 3.2
AVAP J.) 3.2 5.5 4.0
-62--
GRP and AVM', the two groups that had equal stress on auditory and visual
inpur, had almost identical mean scores on both Learning Rate tests:. VAP,
where visual training was stressed, scores highest on the MDLR and lowest
on the Liguistic Learning Rate test, AAP, where auditory training was stressed,
scores lowest on the HDLR and highest on the LLR. Considering that the LLR
and MDLR are highly correlated, (r = .65) and follow an almost identical
format, these differences although not statistically significant, suggest the
need for further inqu4_ry.. If it is established that auditory training is
particularly important when a linguistic reading approach is followed, and
visual. training is particularly important when a loOk say approach is
followed, this information could provide important guidelines for determining
the appropfiate emphasis for a particular reading readiness perceptual
program.
The fourth issue concerns the relative overall effectiveness of the
four treatment programs for the SEL I kindergarten child. Because of the
limited predictive validity of reading readiness measures, and the relative
-63-
stability of. IQ, the investigator selected IQ as the basis for evaluating
the four treatment programs. Here the statistical findings are decisive.
After 36 days of treatment, controlling for pretest performance, AVAP
performed significantly better than GRP, VAP and AAP pooled on the Pintner-
Cunningham Primary Ability Test. In terms of raw scores, the mean score
gain for the AVAP group was 16.6 compared to 9.3 for CRP, 8.9 for VAP and
2.,
4 7.8 for AAP. In addition, while three subjects in.GRP, VAP and AAP showed1
a loss between pre- and post-tests, all subjects in AVAP uCired 4 or more
points between pre- and post-tests.
The question arises, then, as to what it was about: AVAP that created
the significant difference. AVAP differed from GRP in that it stressed
alphabet rather than general readiness skills. The differences in post-
test performance, however, were not in the reading readiness scores that
were intended to measure the alphabet skills, but in the IQ test- that was
intended to measure primary ability. A plausible explanation of these
results may be that the children in the AVAP program, receiving dual modal-
ity input as well as experience with new and challenging tests, learned a
new set of behaviors rather than a new set of skills. The superior per-
formance of the AVAP group on the IQ test was not predicted by the teachers.
The opinionai.res indicated that teachers ,ere unanimous in their feeling
that GRP was as or more effective than /VAP, and that the children found
the GRP program more enjoyable. This discrepancy between teacher opinion
and testing outcome could have been based on the fact that space limita-
tions placed constraints on the alphabet groups that were not placed on
the general readiness group. The afternoon classes were held in class-
rooms which were used in the mornivg for a pre-kindergarten program. These
-64-
rooms were well equipped with general readiness per.:,ptual material. The
CP2 children were the only group that could be allowed free access to this
material-
A final and most important question raised by the study concerns the
overall effectiveness of treatment for the total population, Considering
that the children had spent a month prior to treatment practicing tasks
that involved listening to directions and making appropriate written res-.
ponses, the differences in scores between pre-tests and post-tests cannot
be attributed to the practice effect of making marks on paper. An exLmi-
nation of the mean stanine gains (based on national norms) for the total
group after 36 days of treatment, attests to the effectiveness of the total
curriculum. The total group gained one stanine point on Murphy-Durrell
phonemes, Gates Auditory and Pintner-Cunningham IQ, two stanine points on
Gates Visual perception subtest, and three stanine points on Murphy-Durrell
Learning rate test. No one group, however, outperformed the other three
groups on all rending readiness post test measures. In addition, each of
the four treatment groups gained at least one stanine point on each of the
six post-tests. Considering the length of the trcatlcnt period, these
stanine gain scores are impressive. They cannot be explained solely on
the basis of maturation or specific skill training. Perhaps the real
learning that took place in the program involved a kind of task orientation.
Through interaction with a carefully structured environment, the children
may have learned to filter out irrelevant stimuli, and attend to the
critical features of a task, Active participation in a task-oriented
learning environment nay have given them a better grasp of Cie idea of a
task, and taught' then how to mobilize their cognitive resotreces for more
-65-
effective performance. Whether or not this kind of learning will have a
lasting effect on performance cannot be predicted. It may well depend on
the kind of experiences these children encounter as they continue through
the system.
LIMITATIONS OF THE STUDY
Limitations in the study can be attributed to flaws in the research
design itself, difficulty with procedures, and problems associated with
the restrictions imposed by the setting.
LIMITATIONS ATTRIBUTABLE TO DESIGN
Although the design controlled for contamination resulting from
teacher behavior, it did net control for contamination resulting from
student behaviors. Students in AAP were heard singing alphabet songs on
their way to and from class, and children on the VAP program were observed
drawing letters on the chalk-board during morning classes.
LIMITATIONS ATTRIBUTABLE TO PROCEDURE
Reliability and validity Could not be established for the Auditory
Visual Shifting Test and the Linguistic Learning Rate Test.
LIMITATIONS ATTRIBUTABLE TO THE SETTING
The major limitations of the study arc attributable to the setting.
The n of 60, representing the total population available in the setting,
is small, the teacher aides with the program were untrained, and only two
out of the three teachers supervising the afternoon program ware certified.
The course of treatment, and the length of treatment time per day, were
drastically'shortened due to such contingencies as bus breakdown, health
visits, building repairs, and teacher absence, The elassroom-:haring and
storage problems made it. difficult for the teacher to change the materials
-66-
in the classroom according to treatment specifications. Thus, the AVAP,
VAP, and AAP children were not permitted access to open shelves contain-
ing general readiness materials.
SUGGESTIONS FOR FURTHER RESEARCH
Because of the limitations of the present study, a replication study
with a larger n, a more adequate staff and a longer training period may
be in order. The following questions could be pursued in a replication
study:
(1) Are there differences in performance on reading readiness
measures associated with treatment groups?
(2) Is a program stressing visual and auditory alphabet
skills more effective than a program stressing general
readiness percep'ual skills?
,3) Does a group trained in auditory perception perform
better on auditory measures of reading readiness, and a group
trained in visual perception perform .better on visual measures
of reading readiness? (In answering this question it may be
advantageous to use a different set of reading readiness
Measures as criterion.)
(4) Does the visually trained group perform better oh the
Murphy - Burrell Reading Readiness measure, and the group
trained in auditory perception perform.belter on the
Linguistic Learning Rale test?
(5) Are gains in post-test performance maintained over time?
-67--
(6) Are there differences in reading performance in the first grade
attributable to treatment? If so, are these differences
maintained in the upper grades?
(7) Are there differences in non-reading measures including
language, mathematics, attending behaviors, and affect
associated with treatment?
(8) Would four weeks of VAP followed by four weeks of AAP or
vice versa-be as effective as eight weeks of AV/S'?
(9) Do the teacher rating sheets assessing attending behaviors
and activity level contribute to the prediction of reading
readiness and/or reading achievement?
(10) What is the relationship between success within treatment
as measured by the behavioral objectives and post-test
scores?
Additional Research Questions:
(1) Is there a relationship between audit.ory-visual shifting
behavior and reading readiness performance?
(2) Would the effects of treatment be the same with a
non-SEL I population?
SUMgARY AN)) CONCLUSI6NS
The present study compares the effectiveness of four different per-
ceptual training prescriptions introduced into a structured curriculum
with a population of 60 SEL I kindergarten children.
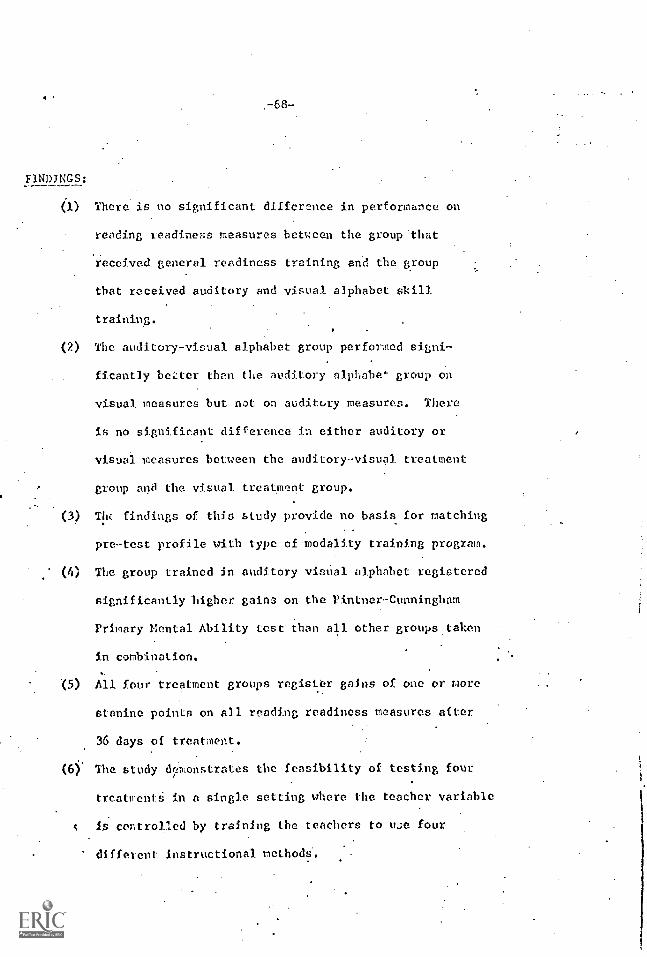
0
.-68-
FINDINGS;
(1) There is no significant difference in performance on
reading readiness measures between the group"that
received general readiness training and the group
that received auditory and visual alphabet skill
training.
(2) The auditory-visual alphabet group performed signi-
ficantly beater than the auditory alphabe,7 group on
visual measures but not on auditory measures. There
is no significant difference in either auditory or
visual measures between the auditory-visual treatment
group and the visual treatment group.
(3) The findings of this study provide no basis for matching
pre test profile with type of modality training program.
(4) The group trained in auditory visual alphabet registered
significantly higher gains on the PintnerCunningham
Primary Mental Ability test than all other groups taken
in combination.
5) All four treatment groups register gains of one or more
stanine points on all reading readiness measures after.
36 days of treatment.
(6) The study 4monstrates the feasibility of testing four
treatments in a single setting where the teacher variable
is controlled by training the teachers to noe four
different instructional methods.
PT
A by-- product of the present study is a total kindergarten curriculum
with demonstrated effectiveness with the SET. I child. A sequence of
behavioral objectives was developed in the areas of lantoage and percep-
tion, and a set of general objectives was developed for the creativity
program. Lists of suggested activities accompanied all behavioral
objectives, and appropriate teacher manuals and instructional materials
were provided. All instructional materials that were not commercially
available were constructed for the program. The total curriculum was
individualized with major emphasis on individual and small group activity.
A record-keeping system was developed in accordance with the behavioral
objectives so that progress could ba assesseu on an on-going basis.
, ''
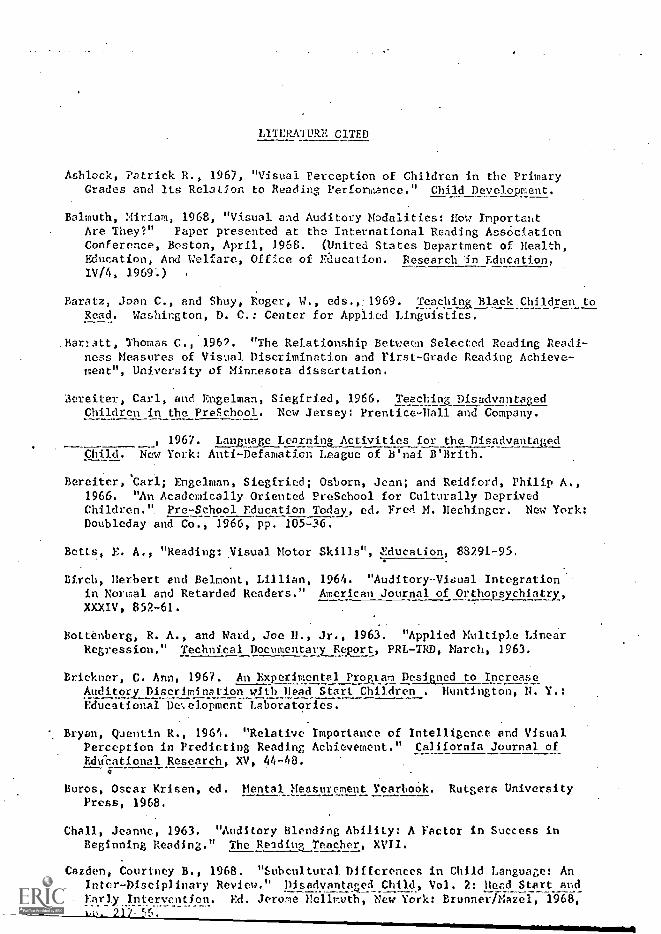
LITERAIURE CITED
Ashlock, Patrick R., 1967, "Visual Perception of Children in the PrimaryGrades and Its Relation to Reading Performance." Child Development.
Balmuth, Miriam, 1968, "Visual and Auditory Modalities: How ImportantAre They?" Paper presented at the International Reading AssociationConference, Boston, April, 1968. (United States Department of Health,Education, And Welfare, Office of Education. Research in Education,IV/4, 1969.)
Baratz, Joan C., and Shuy, Roger, W., eds.,.. 1969. Teaching Black Children toRead. Washington, D. C.: Center for Applied Linguistics.
Barrett, Thomas C., 1969. "The Relationship Between Selected Reading Readi-ness Measures of Visual Discrimination and First-Grade Reading Achieve-ment", University of Minnesota dissertation.
Jereiter, Carl, and Engelman, Siegfried, 1966. Teaching DisadvantagedChildren in the PreSchool. New Jersey: Prentice-Hall and Company.
, 1967. Language Learnino, Activities for the DisadvantagedChild. New York: Anti-Defamation League of B'nai B'Brith.
Bereiter, Carl; Engelman, Siegfried; Osborn, Jean; and Reidford, Philip A.,1966. "An Academically Oriented PreSchool for Culturally DeprivedChildren.". Pre-School Education Today, ed. Fred M. Hechinger. New York:Doubleday and Co., 1966, pp. 105-36.
Betts, E. A., "Reading: Visual Motor Skills", Zducation, 88291-95.
Birch, Herbert end Belmont, Lillian, 1964. "Auditory-Viaual Integrationin Normal and Retarded Readers." American Journal of Orthopsychiatry,XXXIV, 852-61.
Bottenberg, R. A., and Ward, Joe H., Jr., 1963. "Applied Multiple LinearRegression." Technical Documentary Report, PRL -TRD, March, 1963.
Brickner, C. Ann, 1967. An Experimental Program Designed to IncreaseAuditory Discrimination with Head Start Children . Huntington, N. Y.:Educational De\elopment Laboratories.
Bryan, Quentin R., 1964. "Relative Importance of Intelligence and VisualPerception in Predicting Reading Achievement." California Journal ofEddeational Research, XV, 44-48.
0
Buros, Oscar Xrisen, ed. Mental Measurement Yearbook. Rutgers UniversityPress, 1968.
Chall, Jeanne, 1963. "Auditory Blending Ability: A Factor in Success inBeginning Reading." The Readin9 Teacher, XVII.
Cazden, Courtney B., 1968. "Subcultural Differences in Child Language: AnInter-Disciplinary Review." HisadvantagedChild, Vol. 2: Head Start andFerlylntervention. Ed. Jerome New York: Brunner /hazel, 1968,L., 21-7-56.
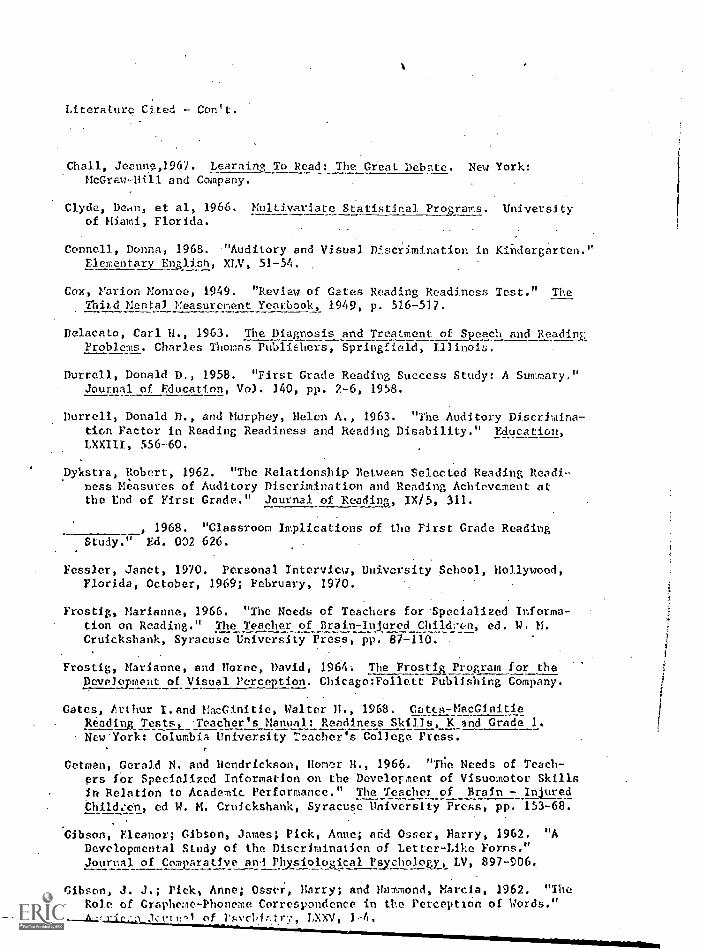
Literature Cited - Con't.
Chall, Jeanne,1961. Learning To Read: The Great Debate. New York:McGrau-Hill and Company.
Clyde, Dean, et al, 1966. Multivariate Statistical Programs. Universityof Miami, Florida.
Connell, Donna, 1968. "Auditory and Visual Discrimination in Kindergarten."Elementary Eulish, XLV, 51-54.
.
Cox, Marion Monroe, 1949. "Review of Gates Reading Readiness Test." TheThild Mental Measurement Yearbook, 1949, p. 516-517.
Delacato, Carl H., 1963. The Diagnosis and Treatment of Speech and ReadingProblems. Charles Thomas Publishers, Springfield, Illinois.
Durrell, Donald D., 1958. "First Grade Reading Success Study: A Summary."Journal of Education, Vol. 140, pp. 2-6, 1958.
Durrell, Donald D., and Murphey, Helen A., 1963. "The Auditory Discrimina-tion Factor in Reading Readiness and Reading Disability." Education,LXXIII, 556-60.
pykstra, Robert, 1962. "The Relationship Between Selected Reading Readi-ness Measures of Auditory Discrimination and Reading Achievement atthe End of First Grade." Journal of Reading, IX/5, 311.
1968. "Classroom Implications of the First Grade ReadingStudy." Ed. 002 626.
Fessler, Janet, 1970. Personal Interview, University School, Hollywood,Florida, October, 1969; February, 1970.
Frostig, Marianne, 1966. "The Needs of Teachers for Specialized Informa-tion on Reading." The Teacher of Brain-Injured Children, ed. W, H.Cruickshank, Syracuse University Press, pp. 87-110.
Frostig, Marianne, and Horne, David, 1964; The FrosLig Program for theDevelopment of Visual Perception. Chicago:Follett Publishing Company.---
Gates, Arthur Land MaeGinitie, Walter H., 1968. Catts-MacGinitieReadies Tests, -Teacher's Manual: Readiness Skills, K and Grade 1.New'York: Columbia University Teacher's College Press.
Getman, Gerald N. and Hendrickson, Homer H., 1966. "The Needs of Teach-ers for Specialized Information on the Develorment of Visuomotor Skillsin Relation to Academic Performance." The Teacher of Brain - InjuredChild.cn, ed W. M. Cruickshank, Syracuse University Press, pp. 153-68.
Gibson, Eleanor; Gibson, James; Pick, Anne; and Osser, Harry, 1962. "ADevelopmental Study of the Discrimination of Letter-Like Forns."Journal of Comparative ant Physiological Psychology, LV, 897 -906.
Gibson, J. J.; Pick, Anne; Osser, Marry; and Hammond, Marcia, 1962. "The
Role of Grapheme-Phoneme Correspondence in the PerceptiOn of Words."-A JcAltr11 of 1'svc1.17y., LXXV, 1-4.
Literature Cited - Con't.
Coins, Jean T., 1958. Visual Perceptual Abilities and Early Reading Pro-gress. Supplementary Education Monographs, LXXXVII, Chicago: Universityof Chicago Press.
Gotkin, Lassar G., 1968. "Programmed Instruction as a Strategy for Develop-ing Curricula for Disadvantaged Children." Language Remediation forjheDisadvantaged PreSchool Child. Ed., M. Brottman. Monographs of theSociety for Research in Child Development, Serial No. 124, XXXIII/8(1968), 19-34.
Grattan, Paul E. and Martin, Milton B., 1965. :"Neuro-Muscular CoordinationVersus Reading Ability." American Journal of Optometry, (August, 1965),450-58.
Eagan, Elizabeth; Thorndike, Robert, 1959. Ten Thousand Careers. New York:
Wiley, 1959.
Harris, Albert J., 1968. "Diagnosis and Remedial Instruction in Reading."Innovation and Changes in Reading Instruction. The Sixty-Seventh Year-book of the National Socaity for the Study of Education, Part II, Ed.,Helen M. Robinson. Chicago: University of Chicago Press, pp. 159-94.
Harris, L. A., 1969. "Interest and the Initial. Acquisition of Words."sue Reading Teacher, XXII, 312-14, 7
Hartford Follow-Through Program, 1969. Hartford Board of Education, Depart-meet of Elementary Education. "Follow- Through" Kindergarten:Jequenceof Activities. By Joseph D. Randazzo. Hartford, Connecticut (Mimeo-graphed).
Hershoren, A., 1969. "Comparison of the Predictive Validity of the RevisedStanford -Binet Intelligence Scale and the ITPA." Exceptional Children,
XXXV, 517-21.
Hirst, Wilma E., et al, 1969. Identification in the _Kindergarten of FactorsThat Make for Future Success in Reading and Ieentification and Diagnosisin the Kindergarten of Potential Reading Disability Cases: Final Report.Cheyenne: Wyoming State Department of Education.
Hughes, Earl F.; LaRue, Richard; Yost, Michael, Jr., 1969. MAEOVA Multi-
variate Analysis of Variance on Small Computers. Clyde Computing Ser-vices, Miami, Florida, 1969.
Hurd, Donald E., 1967. A Study of the Relationship Between Reading Achieve-ment and Sense Modality Shifting. Ed. 065 219 .
Hurley, Oliver L., 1968. "Perceptual Integration and Reading Problems."Exceptional Children, XXXV, 207-15.
Inhelder, Barbel and Piaget, Jean, 1964. The Early. Growth_of Logic in the
Child. trans., E. A. Lanzer and D. Pa.,,ert. New York: Norton & Company.
Jacobs, James N., 1968. "An Evaluation of the Frostig Visual -- Perceptual
Training Program." Educational Leadership Rescarch Supplement. Cin-
cinnati: Division of fTrogram Development of the Public Schools, pp. 332-40.

Literature Cited - Con't.
Kershner, John R., 1969. "Children's Spatial Representations." Unpublishedpaper presented at the American Education Research Association, Los Angeles,
California; February, 1969 (Typescript).
Llorens, Lela A. et al, 1964. "Cognitive and Perceptual Motor Functions."American Journal of. Occupational Therapy, XVIII, 202-8.
Lyons and Carnahan Program, 1966. Lyons and Carnahan, Inc. Phonics We Use:
Book A, Pre-Primer and Primer Levels. Chicago.
MacGinitie, Walter H., 1967. "Auditory Perception in Reading." Education,
LXXXVII, 532 38.
Minuchin, Patricia and Biber, Barbara, 1968. "A Child Development Approachto Language in the Preschool Disadvantaged Child." Language Remcdiation,
ee., M. A. Brottman, Monographs of the Society for Research in Child De-velopment, Serial No. 124, XXXIII/8, pp. 6-18.
Mortenson, W. Paul, 1968. "Selected Pro-reading Tasks, Socionetric Status,and Sex." The Reading Teacher, XXII/1, 45-61.
Muehl, Siegmar, 1960. ."The Effects of Visual. Discrimination Pre-trainingon Learning to Read a Vocabulary Test in Kindergarten Children." Journal
of Educational. Psychology, LI/4, 217-21.
New York Curriculum, 1968. New York City Board of Education, "Sequential. Levels of Reading Skills, rre Kindergarten-Grade 12." Brooklyn, N.Y.
O'Donnell, C. Michael P., 1958. A Comparison of the Reading Readiness ofKindergarten Pupils Exposed to Conceptual-Language and Basal Reader Pre-Reading Programs: A.Pilot ctudy..(Final Report. Augusta, Maine: StateDepartment of Education.
Panther, Edward 1., 1967. "Prediction of First Grade Reading Achievement."ie Elementary School Journal, LXVIII, 64-48.
Plack, Jeralyn J., 1968. "Relationship Between Achievement in Reading andAchievement in Selected Motor Skills in Elementary School Children."The Research Quarterly., XXXIXP, 1063-68.
Raab, S.; Deutsch, M.; and Freedman, A. M., 1960. "Perceptual Shifting andSet in Normal School. Children of Different Reading Achievement Levels."Perr.eptual and Motor Skills, X, 187-92.
:Resnick, Lauren B., 1967. Preschool Curriculum. Pittsburgh: University ofPittsburgh Learning Research and Developmental Center.
Rudnick, Graham, 1967. "Auditory and Visual Rhythm Perception and ReadingAbility." Child Develument, June, 1967.
Scott, ralph, 1968.Reading Seriatic
Shpe, C. A., 1968.
"Perceptual Readiness as a Predictor of Success inTest." The Rcalitmyeaehr, Vol. 22, 1968, NI. 36-39.
'isual Discrimination of Words and Reading ReadinePs.", Vol. 21, January, 1968, pp. 361-67.
Literature Cited - Con't.
Silberbeg, Norman E., 1968. "PredictiVe Efficiency of the Gates ReadingReadiness Tests." The Elementary_School Journal, January, 1968, Vol.68, pp. 213-18.
1968. "The Effects of Kindergarten Instruction in Alphabetand Numbers on First Grade Reading" Kenny Rehabilitation Institute,Minnesota.
Spache, George D.; Andres, Micaela c.r Curtis, N. A.; Rowland, Minnie Lee;and I.!eld, Minnie Ball. "A Longitudinal First Grade Reading ReadinessProgram." Issues and innovations in the Teaching of Reading. Ed. JoeFrost. Chicago: Scott, Poresman and Co., 1967.
Stertitt, Graham M., et al, 1968. Sequential Pattern Perception and Read-ing? Paper presented at International Reading Association Conference,Boston, Massachusetts. April 24-27, 1968.
Taylor, Raymond G. and Nolde, S. Van L., 1969. "Correlative Study BetweenReading, Laterality, Mobility, and Binocularity." Exceptional Thildren,
Vol. 35, 1969, pp. 627-31.
Veldman, Donald J. Fortran Programming for the Behavioral Sciences. NewYork: Holt, Rinehart & Winston, 196.7.
We:Lkart, David P., at al, 1967. "Penny Pre-School Report." Progress Pro-
ject, Ypsilanti, Michigan: Ypsilanti Public Schools, 1967.
Weingart, Roger, 1968. The Reading Teacher, XXII, 325-28.
Wheelock, W. H. and Silvaroli, N. J., 1967. "Visual Discrimination Train-ing for Beginning Readers." The Readies Teacher, XXI (1967), 114-20.