Embed Size (px)
Citation preview
Effects of different management regimes on mangrove ecosystem
services in Java, Indonesia
Effects of different management regimes on mangrove ecosystem services in Java, Indonesia
Van Oudenhoven, A.P.E., A.J. Siahainenia, I. Sualia, F.H. Tonneijck, S. Van der Ploeg and R.S. de Groot
Technical paper for the ‘Mangrove Capital’ project
December 2014
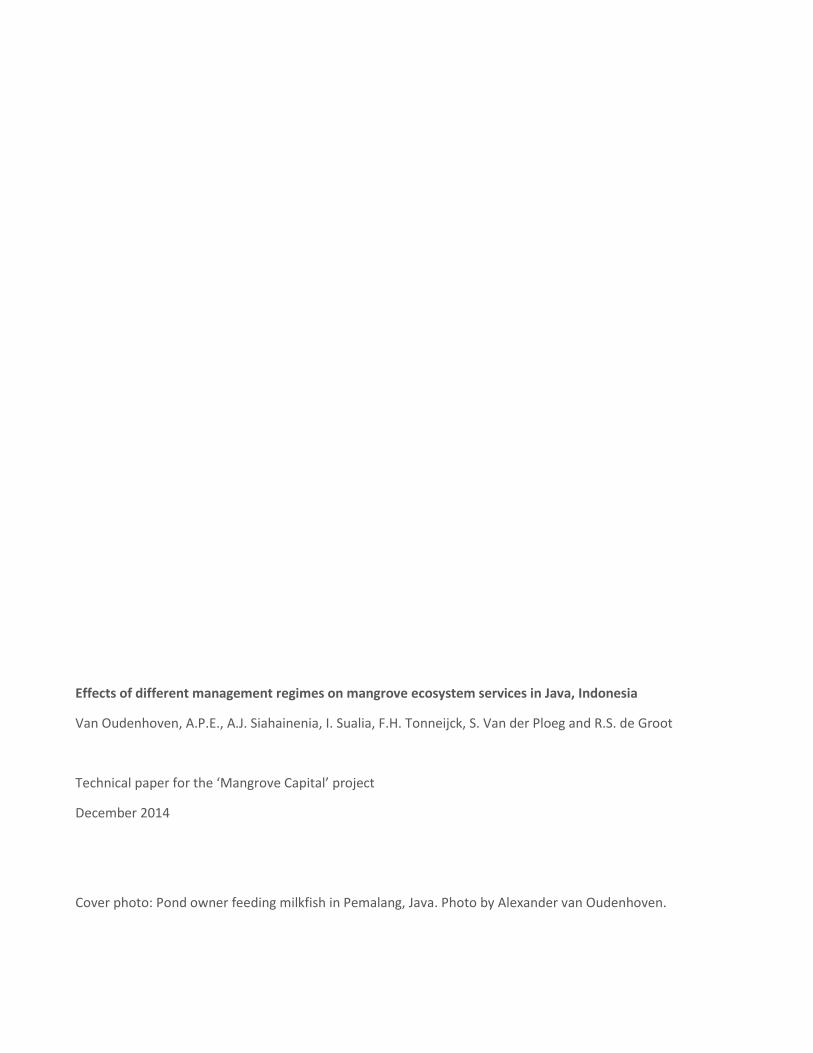
Cover photo: Pond owner feeding milkfish in Pemalang, Java. Photo by Alexander van Oudenhoven.
Effects of different management regimes on mangrove
ecosystem services in Java, Indonesia
Alexander P.E. van Oudenhoven,
Audrie J. Siahainenia, Ita Sualia, Femke H. Tonneijck, Sander van der Ploeg, Rudolf S. de Groot
Published by
Wageningen University (Environmental Systems Analysis Group, Wageningen)
Wetlands International (Ede & Bogor)
Research for this paper was carried out with financial support from Wetlands International, Waterloo
Foundation, and Otter Foundation under the project ‘Mangrove Capital: capturing mangrove values in land use
planning and production systems’.
Authors:
Alexander van Oudenhoven (Environmental Systems Analysis Group, Wageningen University (WUR))
Audrie Siahainenia (WUR, Wetlands International)
Ita Sualia (Wetlands International)
Femke Tonneijck (Wetlands International)
Sander van der Ploeg (WUR)
Rudolf de Groot (WUR)
Correspondence:
Rudolf S. de Groot
Environmental Systems Analysis Group, Wageningen University
P.O. Box 47, 6700 AA Wageningen, The Netherlands.
Email: [email protected]
Femke Tonneijck
Wetlands International
PO Box 471, 6700 AL, Wageningen, The Netherlands
Email: [email protected]
With contributions from:
Sacha Amaruzaman, Ekaningrum Damastuti, Tiara Habibie, Theresia Maturbongs, Anna McIvor, Etwin K.
Sabarini, Mark Spalding, Nyoman Suryadiputra, Lam Khai Thanh
Suggested citation:
Van Oudenhoven, A.P.E., A.J. Siahainenia, I. Sualia, F.H. Tonneijck, S. Van der Ploeg and R.S. de Groot 2014.
Effects of different management regimes on mangrove ecosystem services in Java, Indonesia. Published by
Wageningen University (Wageningen) and Wetlands International (Ede & Bogor).
Contents of this report have been published, together with new findings, in a scientific peer reviewed article
published in Ocean & Coastal Management as: Van Oudenhoven et al (in press). Effects of different
management regimes on mangrove ecosystem services in Java, Indonesia. Ocean & Coastal Management.
http://dx.doi.org/10.1016/j.ocecoaman.2015.08.003
v
Summary
Indonesia is home to the largest area of mangrove forests in the world. Urban expansion, aquaculture farms,
oil-palm plantations and timber extraction have caused an estimated decline of about 1.2 million hectares of
Indonesia’s mangroves since the 1980’s, and currently only 3 million hectares remain. The major cause of
mangrove conversion is aquaculture expansion. Assessing global values of mangrove ecosystem services has
been useful to draw attention to the value of mangroves for humans, but these values cannot simply be
extrapolated to specific areas and as such cannot inform management.
Most valuation studies of mangrove ecosystem services talk about ‘mangroves’ that are in reality subject to
widely different management regimes and as such are difficult to compare. This is one of the explanations for
the wide ranges in values. Making sound decisions on management of (former) mangrove systems requires
knowledge on the impact of management on the provisioning of all relevant ecosystem services. However,
mangrove ecosystem services provision is rarely directly linked to management. Our report intends to fill this
gap.
This report reviews the current state of mangrove ecosystem services and relates their provision to different
mangrove management regimes in Java, Indonesia. Based on our findings, decision makers and managers
should be able to explore the crucial elements of optimal coastal management, by considering which
management purpose will result in the provision of which bundle of ecosystem services.
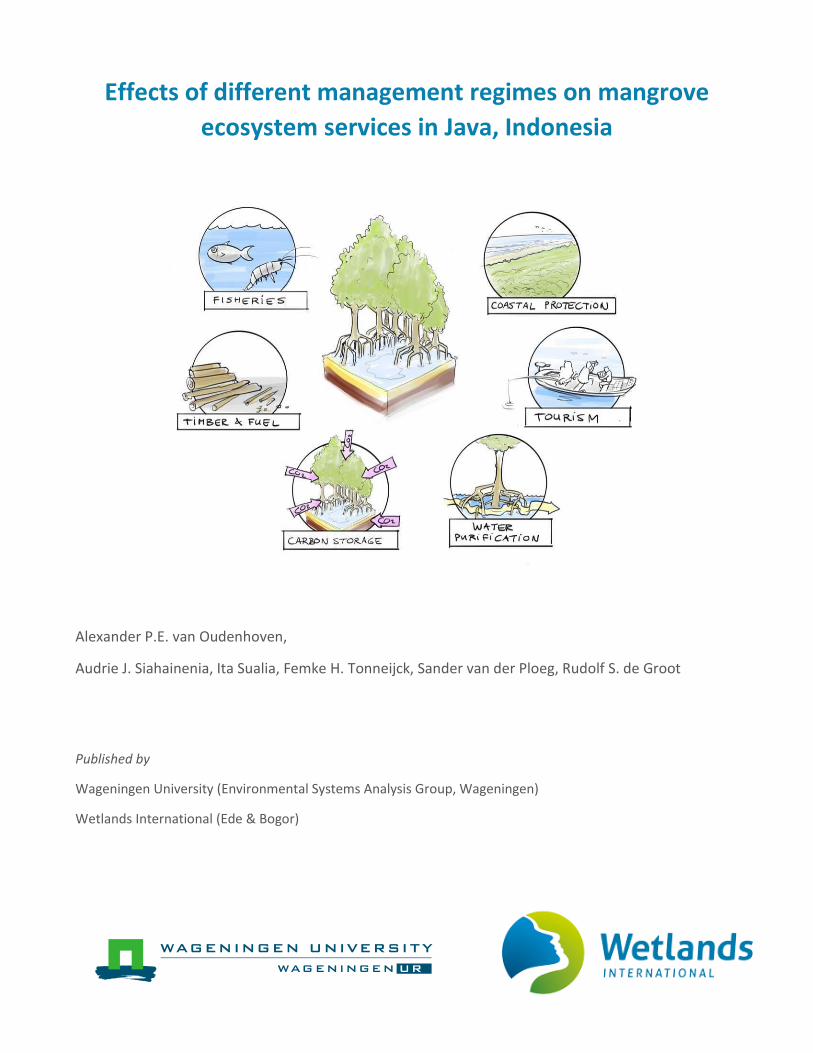
More specifically, this report details which ecosystem properties underpin ecosystem service provision, and
describes state and performance indicators for seven ecosystem services: food, raw materials, coastal
protection, carbon sequestration, water purification, nursery for fish and shrimp, and nature-based recreation.
Mangrove tree age (and related height, diameter, root length, species richness and structural complexity) were
found crucial for all seven ecosystem services.
This report’s typology of management regimes is new to science, in that it develops a full range of ten specific
management characteristics and indicators, and eight ecological characteristics. The typology used the local
variation in legislation and management activities. Moreover, the easily measurable ecological characteristics
served to both verify management regimes on location and to quantify ecosystem services. A rapid field
assessment was conducted to verify the management regimes. This study’s typology is firmly rooted in
scientific literature and Javanese legislation, and enables a consistent indicator-based comparison of ecosystem
service provision for multiple management regimes. A further novelty in the typology is the inclusion of silvo-
fishery, eco-certified aquaculture and the comparison between natural and converted mangrove systems (i.e.
aquaculture). Our review yielded nine different silvo-fishery models that vary widely in their management and
ecological characteristics and, therefore, the ability to provide ecosystem services. Comparing mangrove
management regimes to aquaculture regimes enables decision makers to compare trade-offs for the first time.
Natural mangroves were found to score highest for all ecosystem services except food. Conversely, mangroves
converted to aquaculture received the maximum score for food production, but this coincides with low or even
negative provision of all other ecosystem services. Such disservices are high carbon emissions, wave height
increase (increasing flood risk) and water pollution. Nevertheless, fishery yields in more natural mangrove
systems compare in magnitude (in terms of kg/ha/yr) to aquaculture, while also providing additional benefits.
However, this may entail a wide variety of species in the case of mangroves while aquaculture delivers specific
target species. Mangrove plantations and silvo-fisheries, which combine rehabilitation with raw materials and
shrimp provision, respectively, also outscore mangroves converted for aquaculture. This clearly indicates the
merits of restoring mangroves formerly used for intensive land use.
6
Table of contents
1 Introduction 8
1.1 Background: Mangrove degradation and conversion in Indonesia and the world 8
1.2 Communicating consequences of mangrove conversion and degradation 8
1.3 Impacts of land management on mangrove ecosystem services 9
1.4 Aims and set-up of this paper 11
2 Approach and Methods 12
2.1 Mangrove ecosystem services classification and analysis 12
2.2 Developing a typology of management regimes for (former) mangrove areas 15
2.3 Determining ecosystem services provision per management regime 19
3 Typology and overview of mangrove ecosystem services 21
3.1 Provisioning services 22
3.2 Regulating services 27
3.3 Habitat services 34
3.4 Cultural services 36
4 Typology of mangrove management regimes in Java, Indonesia 39
4.1 Comparison of mangrove management regime 41
4.2 Natural mangrove forests – conservation and protection 44
4.3 Low intensity use mangrove forests – production 46
4.4 High intensity use mangrove systems – rehabilitation 48
4.5 Mangrove systems converted for aquaculture 52
4.6 Abandoned aquaculture 56
5 Mangrove ecosystem services provided by different management regimes 57
5.1 Natural mangrove forests 58
5.2 Low intensity use mangrove forests 63
5.3 High intensity use mangrove systems 66
5.4 Mangrove ecosystems converted for aquaculture 70
7
5.5 Abandoned aquaculture 74
6 Overall comparison of ecosystem service provision per management regime 75
6.1 Comparison per ecosystem service 76
6.2 Comparison per management regime 80
7 Discussion of methodological aspects and implications for decision making 80
7.1 Management regime typology: illustrating management decisions 80
7.2 Using easy-to-observe indicators to quantify ecosystem services 82
7.3 Implications for decision making 83
References 84
APPENDIX 1: Overview of all management regimes 92
APPENDIX 2: Officially recognised forest classifications in Indonesia 95
APPENDIX 3: Food, raw materials and medicinal use of mangrove species 96
APPENDIX 4: Different silvo-fishery models in Indonesia 98
Chapter 1: Introduction
8
1. Introduction
1.1. Background: Mangrove degradation and conversion in Indonesia and the world
As the country with the world’s fourth-longest coastline, Indonesia is home to the largest area of mangrove
forests in the world (Spalding et al. 2010). Although many types of mangrove habitats exist, mangroves are
generally described as both the group of plants as well as the habitat type (or community) in coastal zones
(Spalding et al. 2010). Mangrove trees live in the intertidal zone and are well known for their salt-water
tolerance and ability to cope with tidal currents. However, with two-thirds of the world’s human population
living along the coasts, and the resulting economic activities that take place, the extent of mangrove forests has
been decreasing rapidly over the past decades. According to the FAO (2007), global mangrove cover reduced
from close to 19 million in 1980 to just over 15 million in 2005, a decline of 19 per cent. Recent studies
estimated that Indonesia’s mangrove areas currently cover about 3 million ha (Spalding et al. 2010), with
reliable estimates ranging from 2.9 million (Giesen et al. 2006, FAO 2007) to 3.2 million (Bakosurtanal 2009,
Indonesia's governmental geo-information agency), which is approximately 21% of the world’s mangrove
cover, and Indonesia’s mangrove forests contain 45 (not including introduced species) of the world’s 75 species
of genuine mangrove.
Due to pressures from increasing population and socio-economic development, Indonesia’s mangroves have
been degraded and converted heavily, especially since the 1970’s. Urban expansion, aquaculture farms, oil-
palm plantations and the economic value of mangrove timber itself have caused an estimated decline of about
1.2 million hectares of mangroves since the 1980’s (FAO 2007, Spalding et al. 2010). Many factors are behind
mangrove degradation and conversion, but the major cause is aquaculture expansion, which are mainly
brackish water fish and shrimp farms (Primavera 1995, Barbier and Cox 2003). In the whole of Asia, aquaculture
has been found to contribute to 58% of mangrove loss, with 41% the result of shrimp farming alone (Walters et
al. 2008). Estimates on the contribution of aquaculture to Indonesia’s mangrove forest loss differ, but are
considerable. Giesen et al. (2006), estimated that 25% of the mangrove loss was due to the aquaculture, while
the Indonesian Forestry Ministry’s Analysis (Dephut 2005) found that up to 2003, 50% of the mangrove loss
was the result of aquaculture ponds construction. These percentages differ per province and district, with East-
Kalimantan (45% in one decade), Central Sulawesi (70% in 15 years) as notable examples (Armitage 2002). It
should be noted that the remainder of the causes of mangrove forest loss can be attributed to a combination
of conversion for agriculture (including oil palm and rice paddies) and coastal erosion and mangrove
degradation resulting from overexploitation, of mainly intensively managed agriculture and aquaculture
(Giesen et al. 2006, Walters et al. 2008). In Asia, the conversion of mangroves to aquaculture ponds has been
largely fuelled by governmental support, large investments by the private sector as well as large-scale
assistance from development agencies like the World Bank and Asian Development Bank (Walters et al. 2008).
1.2. Communicating consequences of mangrove conversion and degradation
To inform policy-makers and other stakeholders of the consequences of mangrove loss, scientists and non-
governmental organisations have often emphasised how mangrove areas are of value to humans (e.g.
Rönnbäck 1999, Singh et al. 2010, Barbier et al. 2011). Ecosystem services are defined as the contributions of
ecosystems to human well-being (TEEB 2010b). The concept of ecosystem services has become an increasingly
popular metaphor to demonstrate how the disappearance of mangroves affects the provision of critical
services, such as fuelwood, food, coastal protection, and nursery for fish and crustaceans (Brander et al. 2012).
The continued degradation of mangroves can have far-reaching consequences, because the condition and
Chapter 1: Introduction
9
management of ecosystem services are considered the most important factors that influence poverty
reduction and human well-being (MA 2005). Mangrove ecosystem services are known to have considerable
ecological, social, and economic value (Manson et al. 2005, Rönnbäck et al. 2007, Barbier et al. 2011), but it has
become common practice to emphasise the economic value.
A clear advantage of communicating the economic value of mangrove ecosystem services is the use of a single,
uniform unit (currency). Global valuation studies on mangrove ecosystem services offer useful insight into
average values of mangrove ecosystems (Barbier et al. 2011, Brander et al. 2012, Salem and Mercer 2012, Vo
et al. 2012), but generally fail to account for the value of the total bundle of ecosystem services provided as
well as differences in biodiversity, environmental and socio-economic characteristics. A major challenge for
successful and appropriate economic valuation of mangrove ecosystem services is that it requires the
integration of ecological and socio-economic systems, which are both highly complex and dynamic. Translating
ecological processes and structures into actual ecosystem services is already difficult enough, but it becomes
even more complex if we are to understand how the ecosystem services are provided to and appreciated by
people (Barbier et al. 2011). Therefore, a comprehensive assessment of the links between natural systems and
the benefits derived by humans and their values would be required for successful and integrated economic
valuation (Barbier 2007, Polasky and Segerson 2009). Currently, few studies have managed to account for this
link, and only a limited number of ecosystem services have been valued economically. If we were to integrate
and present the state of the art literature on the value of mangrove ecosystem services in Indonesia or
Southeast Asia, we would present only a fraction of the services that are actually provided, which would mostly
be marketed goods. Moreover, scientific literature on ecosystem services by mangrove ecosystems in
Indonesia is scattered, and generally fails to account for the ecological and biophysical features that underpin
ecosystem service provision. Therefore, it is crucial to understand what ecosystem services are provided in
Indonesia, and on which biophysical and ecological features this provision depends. Another thing we have to
realise is that humans are interactive and major components in most mangrove ecosystems. Human activities
greatly determine the mangroves’ biophysical and ecological features and consequently, ecosystem services.
Up to now, the effect of human activities on mangrove ecosystem services has rarely been considered in
literature on economic valuation.
1.3. Impacts of land management on mangrove ecosystem services
The worldwide degradation and transformation of ecosystems suggest that managers and decision makers
have limited understanding of what is at stake in terms of economic and social benefits and values (Barbier et
al. 2008). It is commonly believed that failure to consider important ecosystem services and their value in
current policy and management decisions is a major reason for the continued ecosystem degradation (TEEB
2010b, Barbier et al. 2011). Considering the economic consequences in terms of ecosystem services gained or
lost is critical because most ecosystems, especially coastal and forest areas, face the risk of being converted to
other economic activities (Chan et al. 2011). When the “true value” of mangroves and all provided services is
known, management can be based on practical compromises, and realistic outcomes and targets can be agreed
on (Barbier et al. 2008). However, due to a lack of data, valuation studies can only provide a limited amount of
useful information about the consequences of management decisions, because they do not account for
differences in management of mangrove areas. For instance, consider how natural mangrove ecosystems,
mangrove plantations, or aquaculture ponds are being managed.
Reviews of literature mangrove ecosystems and their services and benefits on the global level tend to
categorise these entirely different systems either as simply ‘mangroves’, or differentiates between mangroves
and aquaculture systems. However, ecosystem services provided by mangrove plantations and especially
Chapter 1: Introduction
10
aquaculture ponds depend largely on external, artificial inputs, and intensive management activities. Natural
mangroves provide important regulating, nursery and recreation services whose provision and value depend
almost entirely on just ecological and biophysical characteristics. Differences in management of mangrove
ecosystems, plantations, aquaculture areas, etc. should be acknowledged in mangrove ecosystem services
literature, as the net benefit of ecosystem services is greatly dependent on the input and labour that was
required to generate the service. Understanding the effects of management on ecosystem service provision is
crucial in projecting the consequences of policies and decisions that affect ecosystem services. There is a need
for compiling and analysing empirical evidence to support land management, as most management tends to be
grounded in assumptions that have not been verified (ICSU-UNESCO-UNU 2008).
Coastal areas are heavily impacted by human activities, because many people live in coastal areas and socio-
economic activities are prevalent (Barbier et al. 2008). Mangrove areas are no exception, with impacts ranging
from low (gathering fuel wood, fishing) to the highest possible, i.e. replacement of pre-existing mangrove
ecosystems with built structures.
In line with Van Oudenhoven et al. (2012), we define land management as:
“human activities that directly affect land cover, in the context of a given land-use purpose.”
These activities are generally embedded in an organisation structure of coordinated land use and spatial
planning. The purpose for which humans undertake management activities (i.e. land use) can be influenced by
policy regulations, socio-economic development, climate change, local traditions, etc. (Verburg et al. 2013). To
achieve a purpose or target, certain activities need to be undertaken, such as cutting trees, harvesting NTFP,
fencing an area, building tourism facilities, constructing and maintaining fish ponds, applying inputs to the
ponds, etc. We note that management not necessarily aims at improving the provision of ecosystem services or
natural resources (agriculture, tourism, etc.), but also at the general development of land (i.e. infrastructure
development, building, conversion of land), which could have unforeseen negative consequences (Chan et al.
2011). Examples of land management include coastal zone management (Peña-Cortés et al. 2013), ecosystem
management (Brussard et al. 1998), and forest management (FAO 1994). In the context of mangrove
ecosystems, land management also includes activities that relate to water management (Lewis III 2005). We
acknowledge the crucial role of water management and include aspects of it in our assessment, but throughout
the paper we will stick to the term land management because it encompasses the management of the entire
mangrove ecosystem. In ecosystem services literature, ecosystem management has often been incorrectly
used as a synonym for land management. It should be noted that ecosystem management refers to managing
an area to conserve ecosystem services and biological resources, while sustaining human use (Brussard et al.
1998, MA 2005). In other words, it assumes a balanced human-nature relationship, which is not often the case
in mangrove areas. Land management activities also include those with a purpose aim to conserve nature or to
restore degraded areas. Especially land managers or local communities that are responsible for national parks,
protection forests, recreation areas, etc. focus on conservation of the important characteristics of ecosystems,
e.g. their biodiversity, water quality, and aesthetic values (Turner et al. 1995, Chan et al. 2011). Recent studies
by De Groot et al. (2013) and Benayas et al. (2009), have emphasised the benefits of ecosystem restoration,
underlining that restoration can also be seen as an important management activity that influences ecosystem
service provision.
In this study, we intend to study the effect of multiple management activities in a systematic and practical way.
To this end, we have developed a comprehensive, yet flexible typology of management regimes. This typology
should be applicable to (former) mangrove ecosystems in the context of Javanese policy and management
practices, and account for different intensities of management.
Chapter 1: Introduction
11
Management regimes are defined as “the bundle of human activities that collectively serve one or
multiple land-use purpose(s).”
These management regimes result in a distinguishable land use, land cover, ecological and other
characteristics of a given area, which we define as a management state, i.e. a ‘snapshot’ that
captures the outcome of human activities.
At a larger spatial scale, multiple management regimes can co-occur at the same time. For instance, an area
can be characterised by aquaculture ponds bordering a protected mangrove area. Management activities in the
former can include additional feeding, artificial fish stocking, pesticide application, and using water pumps to
simulate tidal movement, whereas activities in a protected area include fishing, harvesting fuel wood by local
communities and active protection by patrolling marshals. As a result, aquaculture ponds are likely to have few
mangrove trees and species, high fish seed density of artificial stocks, low soil bulk density, and high nutrient
and pesticide concentrations in effluent water and soil. Protected mangrove areas are likely to have high
species richness of mangroves, naturally occurring fish and crustaceans, considerably more mature mangrove
trees, and clay to sandy substrate. Aquaculture and natural systems are managed for several different and
some similar purposes, but it is the difference in management activities and intensity thereof that will result in
clearly discernable management states. Management activities are determined by numerous factors, such as
ownership status, mangrove ecology, policies, local communities, etc. In our typology of management regimes
and states we try to account for these important factors, as they can be considered as indirect drivers to
ecosystem service provision.
1.4. Aims and set-up of this paper
The overall objective of this technical paper is to review the current state of mangrove ecosystem services and
relate their provision to different mangrove management regimes in Java, Indonesia. Based on our findings,
decision-makers and managers should be able to explore the crucial elements of optimal coastal management,
by considering which management purpose will result in the provision of which bundle of ecosystem services.
In Chapter 3, we first review literature on key ecosystem services that Indonesia’s mangrove ecosystems
provide, as well as key biophysical and ecological characteristics on which their provision depends. We then
describe a new typology of management regimes for mangrove ecosystems in Chapter 4. We distinguish five
general categories of management regimes, in order of increasing land-use intensity: natural, low intensity use,
high intensity use, converted and abandoned mangroves. Within these five broad categories we furthermore
distinguish 11 specific management regimes. These management regimes are determined by the management
activities that take place, and their impact can be assessed through ecological and biophysical characteristics,
which have been quantified as measurable ecosystem service indicators. We describe the effects of the
management regimes on ecosystem service provision in Chapter 5, thereby focusing on seven ecosystem
services that have been identified as key for the Mangrove Capital project: food, raw materials, coastal
protection, carbon sequestration, water purification, nursery for commercial fish and shrimp species, and
nature-based recreation. The results are integrated in Chapter 6, in which we explore which management
regime would be optimal for bundles of ecosystem services. In addition, gaps in the current state of quantifying
key mangrove ecosystem services are discussed, as well as implications for research and management.
Finally, in Chapter 7, we discuss two crucial aspects of our research approach, namely the management regime
typology and the indicator-based quantification of ecosystem services. These aspects are discussed from a
decision-making perspective. Finally, we conclude the implications of our report’s findings for decision making.
The findings could inform decision makers about where to restore mangroves, and how to manage them. By
Chapter 1: Introduction
12
providing information on what management aspects to consider for the optimal provision of mangrove
ecosystem services, more balanced decisions and strategies could be formulated.
2. Approach and Methods
For this technical paper we have compiled knowledge from state of the art literature on mangrove
management as well as biophysical and ecological research on mangrove ecosystem services. In addition,
relevant policy documents from, among others, the Indonesian government, Ministry of Forestry and the
Fishery Agency were checked.
We first describe how we how we classified and analysed the mangrove ecosystem services (section 2.1), then
how we characterised and formulated the management regimes (section 2.2), followed by an explanation of
how we linked the management regime typology with ecosystem services provision (2.3).
2.1. Mangrove ecosystem services classification and analysis
2.1.1. Ecosystem services provided by mangroves
The concept of ecosystem services became increasingly popular in interdisciplinary science in the late 1990’s,
with key publications bringing the ecological (Daily et al. 1997) and economic (Costanza et al. 1997) value of the
world’s ecosystems to the front. The publication of the MA, the Millennium Ecosystem Assessment (2005),
brought the state of the earth’s ecosystems and the services they provide under the attention of both policy-
makers and a wider audience. The MA defined ecosystem services as the benefits that nature provide, a
definition which was further refined by a recent study into “The Economics of Ecosystems and Biodiversity”
(TEEB 2010b) into the “direct and indirect contributions to human well-being” provided by ecosystems which
are divided in provisioning (resources), regulating (useful processes), habitat or supporting, and cultural (non-
material benefits) services. Although these and other definitions have being criticised, and will probably be so
for a long while, it is important to note that most definitions tend not to differ that much (Schröter et al. 2014).
The definition of ecosystem services is generally subtly altered depending on the scope of the analysis or
project.
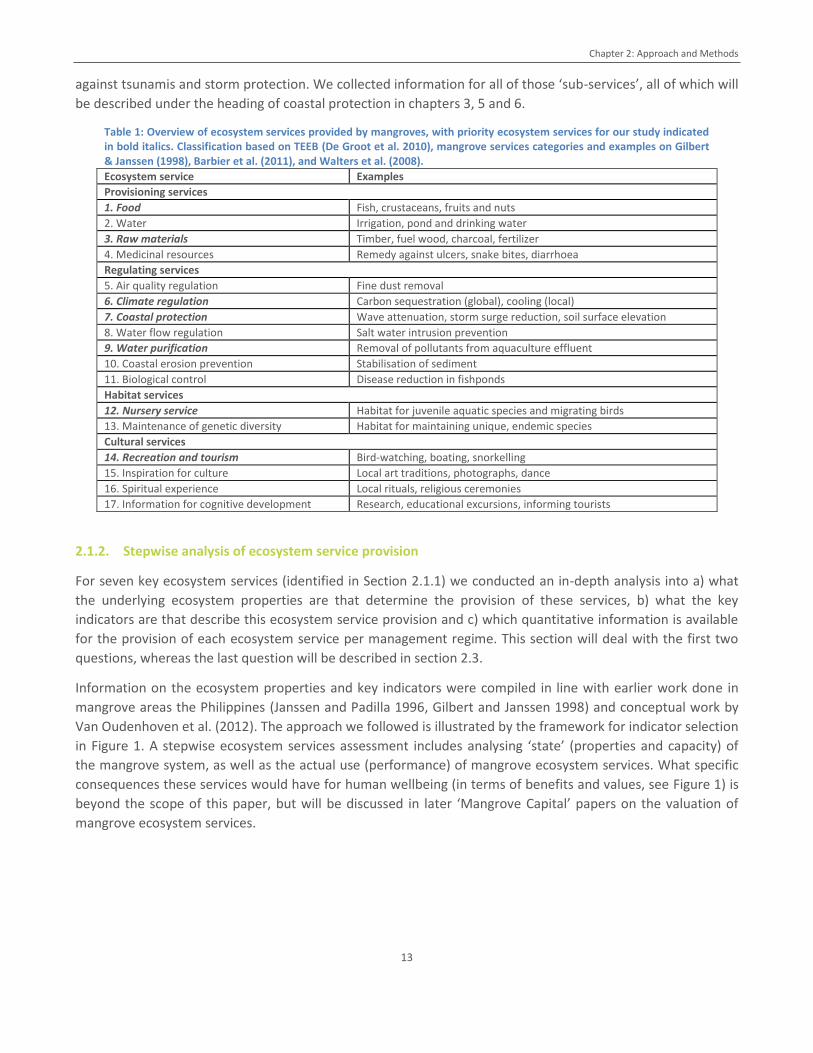
Based on literature, an overview of mangrove ecosystem services was compiled (see Table 1). In the context of
the Mangrove Capital project, 7 key ecosystem services were then selected, through extensive consultation of
scientific, governmental and non-governmental project partners; Wetlands International (headquarters,
Indonesia office, plus local partners), Deltares, The Nature Conservancy, Wageningen University, the
Agricultural University of Bogor (IPB) and representatives of the government of Indonesia. The services that are
highlighted (in bold) in Table 1 were considered most important, because they appealed to decision-makers at
different levels (national, district) and/or would impact local stakeholders the most. Of the ecosystem services
listed, four have received most attention in literature in terms of determining their socio-economic value to
coastal populations, namely fish and non-timber forest products (NTFP) as directly used products, nursery and
breeding for near- and offshore fisheries, and mangroves as natural storm barrier (Walters et al. 2008).
We focus on seven key services, but other ecosystem services will also be shortly described in this paper.
Furthermore, we discovered that ‘coastal protection’ was interpreted by our partners and fellow-scientists as a
combination of many different services, ranging from coastal erosion prevention, wave attenuation, protection
Chapter 2: Approach and Methods
13
against tsunamis and storm protection. We collected information for all of those ‘sub-services’, all of which will
be described under the heading of coastal protection in chapters 3, 5 and 6.
Table 1: Overview of ecosystem services provided by mangroves, with priority ecosystem services for our study indicated in bold italics. Classification based on TEEB (De Groot et al. 2010), mangrove services categories and examples on Gilbert & Janssen (1998), Barbier et al. (2011), and Walters et al. (2008). Ecosystem service Examples
Provisioning services
1. Food Fish, crustaceans, fruits and nuts
2. Water Irrigation, pond and drinking water
3. Raw materials Timber, fuel wood, charcoal, fertilizer
4. Medicinal resources Remedy against ulcers, snake bites, diarrhoea
Regulating services
5. Air quality regulation Fine dust removal
6. Climate regulation Carbon sequestration (global), cooling (local)
7. Coastal protection Wave attenuation, storm surge reduction, soil surface elevation
8. Water flow regulation Salt water intrusion prevention
9. Water purification Removal of pollutants from aquaculture effluent
10. Coastal erosion prevention Stabilisation of sediment
11. Biological control Disease reduction in fishponds
Habitat services
12. Nursery service Habitat for juvenile aquatic species and migrating birds
13. Maintenance of genetic diversity Habitat for maintaining unique, endemic species
Cultural services
14. Recreation and tourism Bird-watching, boating, snorkelling
15. Inspiration for culture Local art traditions, photographs, dance
16. Spiritual experience Local rituals, religious ceremonies
17. Information for cognitive development Research, educational excursions, informing tourists
2.1.2. Stepwise analysis of ecosystem service provision
For seven key ecosystem services (identified in Section 2.1.1) we conducted an in-depth analysis into a) what
the underlying ecosystem properties are that determine the provision of these services, b) what the key
indicators are that describe this ecosystem service provision and c) which quantitative information is available
for the provision of each ecosystem service per management regime. This section will deal with the first two
questions, whereas the last question will be described in section 2.3.
Information on the ecosystem properties and key indicators were compiled in line with earlier work done in
mangrove areas the Philippines (Janssen and Padilla 1996, Gilbert and Janssen 1998) and conceptual work by
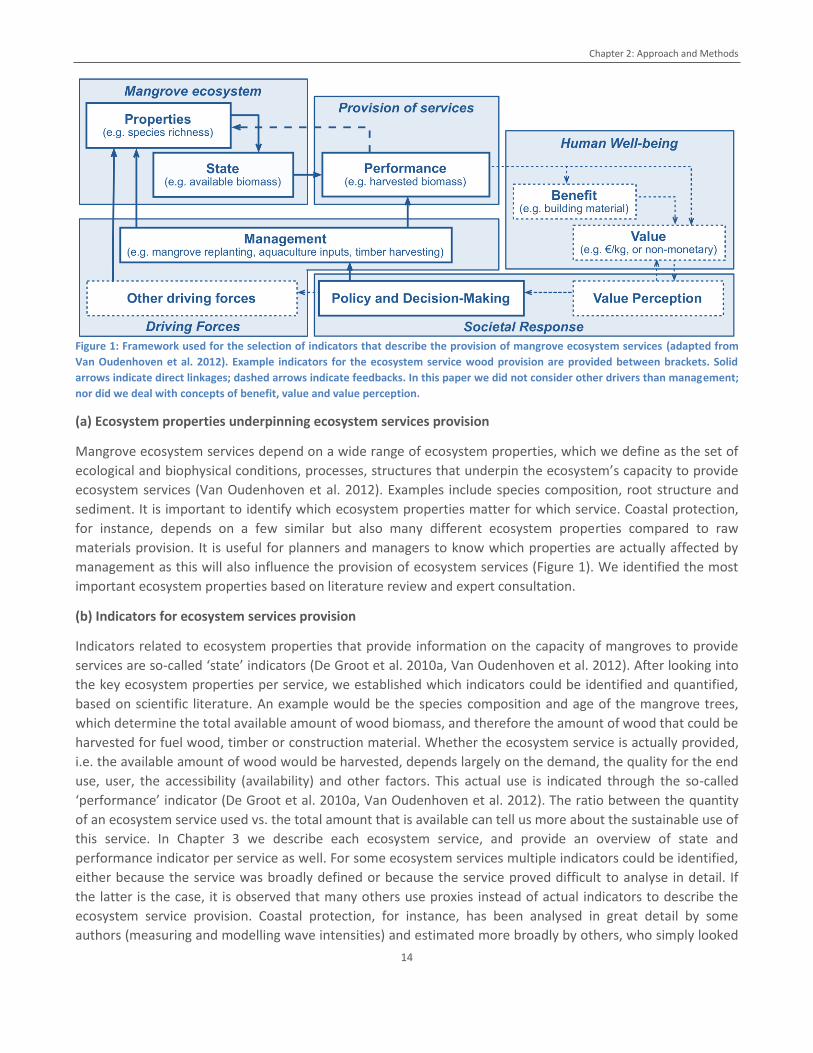
Van Oudenhoven et al. (2012). The approach we followed is illustrated by the framework for indicator selection
in Figure 1. A stepwise ecosystem services assessment includes analysing ‘state’ (properties and capacity) of
the mangrove system, as well as the actual use (performance) of mangrove ecosystem services. What specific
consequences these services would have for human wellbeing (in terms of benefits and values, see Figure 1) is
beyond the scope of this paper, but will be discussed in later ‘Mangrove Capital’ papers on the valuation of
mangrove ecosystem services.
Chapter 2: Approach and Methods
14
Figure 1: Framework used for the selection of indicators that describe the provision of mangrove ecosystem services (adapted from
Van Oudenhoven et al. 2012). Example indicators for the ecosystem service wood provision are provided between brackets. Solid
arrows indicate direct linkages; dashed arrows indicate feedbacks. In this paper we did not consider other drivers than management;
nor did we deal with concepts of benefit, value and value perception.
(a) Ecosystem properties underpinning ecosystem services provision
Mangrove ecosystem services depend on a wide range of ecosystem properties, which we define as the set of
ecological and biophysical conditions, processes, structures that underpin the ecosystem’s capacity to provide
ecosystem services (Van Oudenhoven et al. 2012). Examples include species composition, root structure and
sediment. It is important to identify which ecosystem properties matter for which service. Coastal protection,
for instance, depends on a few similar but also many different ecosystem properties compared to raw
materials provision. It is useful for planners and managers to know which properties are actually affected by
management as this will also influence the provision of ecosystem services (Figure 1). We identified the most
important ecosystem properties based on literature review and expert consultation.
(b) Indicators for ecosystem services provision
Indicators related to ecosystem properties that provide information on the capacity of mangroves to provide
services are so-called ‘state’ indicators (De Groot et al. 2010a, Van Oudenhoven et al. 2012). After looking into
the key ecosystem properties per service, we established which indicators could be identified and quantified,
based on scientific literature. An example would be the species composition and age of the mangrove trees,
which determine the total available amount of wood biomass, and therefore the amount of wood that could be
harvested for fuel wood, timber or construction material. Whether the ecosystem service is actually provided,
i.e. the available amount of wood would be harvested, depends largely on the demand, the quality for the end
use, user, the accessibility (availability) and other factors. This actual use is indicated through the so-called
‘performance’ indicator (De Groot et al. 2010a, Van Oudenhoven et al. 2012). The ratio between the quantity
of an ecosystem service used vs. the total amount that is available can tell us more about the sustainable use of
this service. In Chapter 3 we describe each ecosystem service, and provide an overview of state and
performance indicator per service as well. For some ecosystem services multiple indicators could be identified,
either because the service was broadly defined or because the service proved difficult to analyse in detail. If
the latter is the case, it is observed that many others use proxies instead of actual indicators to describe the
ecosystem service provision. Coastal protection, for instance, has been analysed in great detail by some
authors (measuring and modelling wave intensities) and estimated more broadly by others, who simply looked
Chapter 2: Approach and Methods
15
into the impacts of floods or the question whether floods occurred when mangroves were present or not (for
details please see section 3.2).
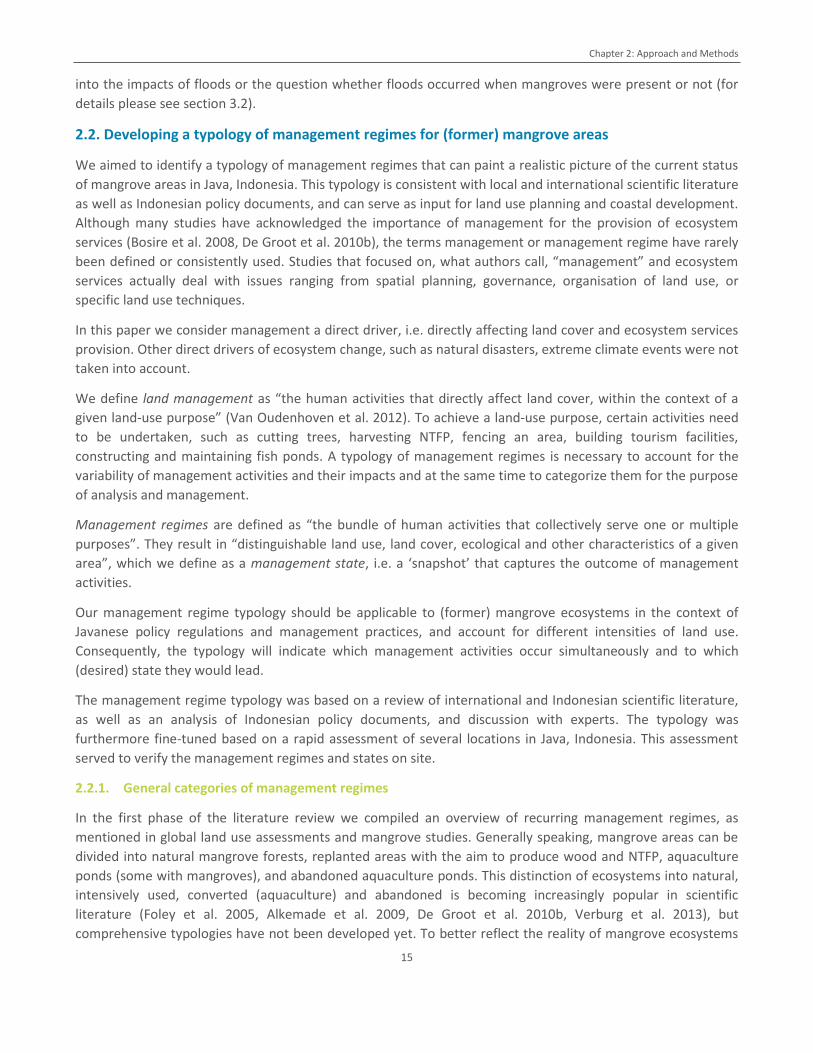
2.2. Developing a typology of management regimes for (former) mangrove areas
We aimed to identify a typology of management regimes that can paint a realistic picture of the current status
of mangrove areas in Java, Indonesia. This typology is consistent with local and international scientific literature
as well as Indonesian policy documents, and can serve as input for land use planning and coastal development.
Although many studies have acknowledged the importance of management for the provision of ecosystem
services (Bosire et al. 2008, De Groot et al. 2010b), the terms management or management regime have rarely
been defined or consistently used. Studies that focused on, what authors call, “management” and ecosystem
services actually deal with issues ranging from spatial planning, governance, organisation of land use, or
specific land use techniques.
In this paper we consider management a direct driver, i.e. directly affecting land cover and ecosystem services
provision. Other direct drivers of ecosystem change, such as natural disasters, extreme climate events were not
taken into account.
We define land management as “the human activities that directly affect land cover, within the context of a
given land-use purpose” (Van Oudenhoven et al. 2012). To achieve a land-use purpose, certain activities need
to be undertaken, such as cutting trees, harvesting NTFP, fencing an area, building tourism facilities,
constructing and maintaining fish ponds. A typology of management regimes is necessary to account for the
variability of management activities and their impacts and at the same time to categorize them for the purpose
of analysis and management.
Management regimes are defined as “the bundle of human activities that collectively serve one or multiple
purposes”. They result in “distinguishable land use, land cover, ecological and other characteristics of a given
area”, which we define as a management state, i.e. a ‘snapshot’ that captures the outcome of management
activities.
Our management regime typology should be applicable to (former) mangrove ecosystems in the context of
Javanese policy regulations and management practices, and account for different intensities of land use.
Consequently, the typology will indicate which management activities occur simultaneously and to which
(desired) state they would lead.
The management regime typology was based on a review of international and Indonesian scientific literature,
as well as an analysis of Indonesian policy documents, and discussion with experts. The typology was
furthermore fine-tuned based on a rapid assessment of several locations in Java, Indonesia. This assessment
served to verify the management regimes and states on site.
2.2.1. General categories of management regimes
In the first phase of the literature review we compiled an overview of recurring management regimes, as
mentioned in global land use assessments and mangrove studies. Generally speaking, mangrove areas can be
divided into natural mangrove forests, replanted areas with the aim to produce wood and NTFP, aquaculture
ponds (some with mangroves), and abandoned aquaculture ponds. This distinction of ecosystems into natural,
intensively used, converted (aquaculture) and abandoned is becoming increasingly popular in scientific
literature (Foley et al. 2005, Alkemade et al. 2009, De Groot et al. 2010b, Verburg et al. 2013), but
comprehensive typologies have not been developed yet. To better reflect the reality of mangrove ecosystems
Chapter 2: Approach and Methods
16
as being highly influenced by human activities, we first developed five broad categories of management
regimes (based on Gilbert and Janssen 1998, Macintosh et al. 2002, Saenger 2002, Walters et al. 2008). The
categories are listed below, and examples of management activities that take place are provided.
1) Natural mangrove forests - protected or conserved for their ecological or cultural function. Activities
can include hunting, fishing, and limited NTFP collecting (deadwood only) by local communities, as well
as constructing and maintaining nature-based tourism and recreation facilities.
2) Low intensity use mangrove forests - managed for their economic function, i.e. to provide forest
products such as timber and NTFP. Activities can include fishing, creating recreation possibilities, high
intensity harvesting of NTFP and timber, selective cutting, compulsory replanting of trees and other
measures to reduce ecological impacts of harvesting.
3) High intensity use mangrove systems - rehabilitation and plantation areas, where possible integrated
with aquaculture. Activities can include replanting and maintaining mangroves, aquaculture (silvo-
fishery), fishing, recreation, low intensity NTFP harvesting, maintenance of dykes.
4) Mangrove forests converted for aquaculture and other land use types. Activities can include clear-cut,
dyke construction and maintenance, pumping seawater, applying fertilizer, pesticide, antibiotics,
additional feed and other input, pruning remaining mangroves, replanting mangroves, harvesting
NTFP.
5) Abandoned aquaculture ponds - mangrove forests that have been converted to aquaculture but are
now depleted and therefore abandoned and unused. Concrete dykes, machinery, and remaining
pollution can still be found. They can be seen as potential rehabilitation areas.
The five main categories can be characterised by decreasing natural mangrove cover and protection thereof,
and increasing focus on production of wood, NTFP, and/or food. The categories are further described in
Chapter 4, and summarised in Tables 4 and 5. To account for the on-the-ground reality of mangrove areas in
Java, we also developed specific management regimes that were based policy regulations, management
activities and indicators thereof, and ecological characteristics. Based on the five main categories, we still
observe much variability within each category and therefore we have subdivided them into specific
management regimes.
2.2.2. Indicators of management regimes
After further research into mangrove management in Indonesia, we developed more specific management
regimes to fully capture the dynamic socio-economic and ecological condition of Indonesia’s mangrove areas.
This is confirmed by international scientific literature, which increasingly calls for the inclusion of socio-
economic, topographical, ecological, and political characteristics in assessments on land management and
ecosystem services (e.g. Ghazoul 2007, Barbier et al. 2008). We especially note the importance of considering
the legal status of mangrove areas (protected nature or resources, timber extraction permitted, restricted
extraction of NTFP etc.) and aquaculture areas (ownership, use of additional inputs, certification, rehabilitation
required etc.), which provides a context for which management activities are likely to take place in an area.
The specific management regimes were based on three categories of information and selected indicators, of
which an overview is provided in Table 2 below. The categories are policy regulations (i.e. the context of the
management), occurring management activities and ecological and biophysical characteristics of the resulting
management states.
For the policy regulations, Indonesian policy documents and scientific policy literature were studied to discover
the status of different mangrove areas, in terms of ownership, jurisdiction and for which economic or
Chapter 2: Approach and Methods
17
ecological function the areas should be managed. It is clearly stated in policy documents which activities are
allowed to take place where, and we used these documents as a starting point for our typology. The Indonesian
policy documents we consulted include ‘Guidelines for the development of a Mangrove Management Model’
(Ministry of Forestry Indonesia 2012), the National Forestry Act (1999), the ‘National strategy of Mangrove
Ecosystem Management’ by the Government of Indonesia (2012), and regulations on ‘Guidelines for
management of Forest Reserves and Nature Conservation Areas’ (Government of Indonesia 2011). Policy-
related aspects mainly refer to legal restrictions or concessions, and ownership issues. Although a certain area
might be extremely rich in biodiversity and fish stocks, district or national laws might restrict access. This would
have great consequences for the level of ecosystem services provision. Although an area might have great
potential to provide services, the actual use and therefore the value in terms of goods and services would be
limited. Alternatively, it could be that an area is targeted for a certain ecological or economic function, for
instance to provide coastal protection to a village or recreation opportunities for visiting tourists. In
combination, the policy documents provided insight into the targeted functions per management regime,
possible combinations of, and realistic transitions from one to another management regime. The majority of
the forestry policies apply, naturally, to the first three main management categories (natural, low intensity use
and high intensity use mangroves (see section 2.2.1), because in the last two regimes the vegetation will have
been largely removed. In converted mangrove areas regulations on spatial planning, fishery and agriculture
were found to be more applicable.
For the second category of indicators, we listed different management activities that we found in literature
that could take place in management regimes (Table 2). The first eight activities take place mostly in forested
mangrove areas, whereas the final seven indicators of management activities all relate to aquaculture. The first
eight activities were listed as taking place or not (yes/no), and NTFP harvesting with high or low intensity. High
intensity indicates “utilization”, i.e. intensive management to produce and process, which includes optimising
growth, cutting, etc. Low intensity refers to “gathering”, low impact collecting of NTFP such as rattan, honey,
gum, fruit, seeds, and dead material. The other indicators of management activities relate to the intensity of
aquaculture, which can be measured by looking at type and quantity of inputs (fertilizer, stocks), built
structures (dykes, pumps), aeration technique, etc. (Stevenson 1997, Gilbert and Janssen 1998, Barbier et al.
2008, Iftekhar 2008). Literature distinguishes several intensities of aquaculture, which make use of different
quantities of natural resources (including mangroves) and artificial inputs.
Finally, we compiled ecological and biophysical characteristics that would be easy to measure and observe (see
also Table 2). The assessment of the actual ecological and biophysical characteristics can help to determine the
condition of an ecosystem, and/or the impacts of management. These characteristics indicate different levels
of disturbance (e.g. degradation levels), for instance biodiversity (species richness, abundance of fish, etc.),
substrate type and quality, size and age of mangrove trees, etc. We based the listed characteristics on
literature on Indonesian case studies.
The management activities and ecological characteristics served as criteria on which we based our
management regime typology. A cross-tabulation with management activities and ecological characteristics vs.
management regimes was set up (see Table 5). Assumptions on activities that take place within a regime where
were largely based on policy documents. Biophysical characteristics were not considered during the typology
development. Literature on Indonesian and Southeast Asian case studies were used to assess linkages between
management regime, management activities taking place, and management state. Based on the above-
mentioned policy regulations, management activities and ecological characteristics, we were able to draft 11
specific management regimes. Note that not all factors mention in Table 2 were included in the development
Chapter 2: Approach and Methods
18
of the typology, as they were either inconclusive (occurring at many different regimes but not indicating
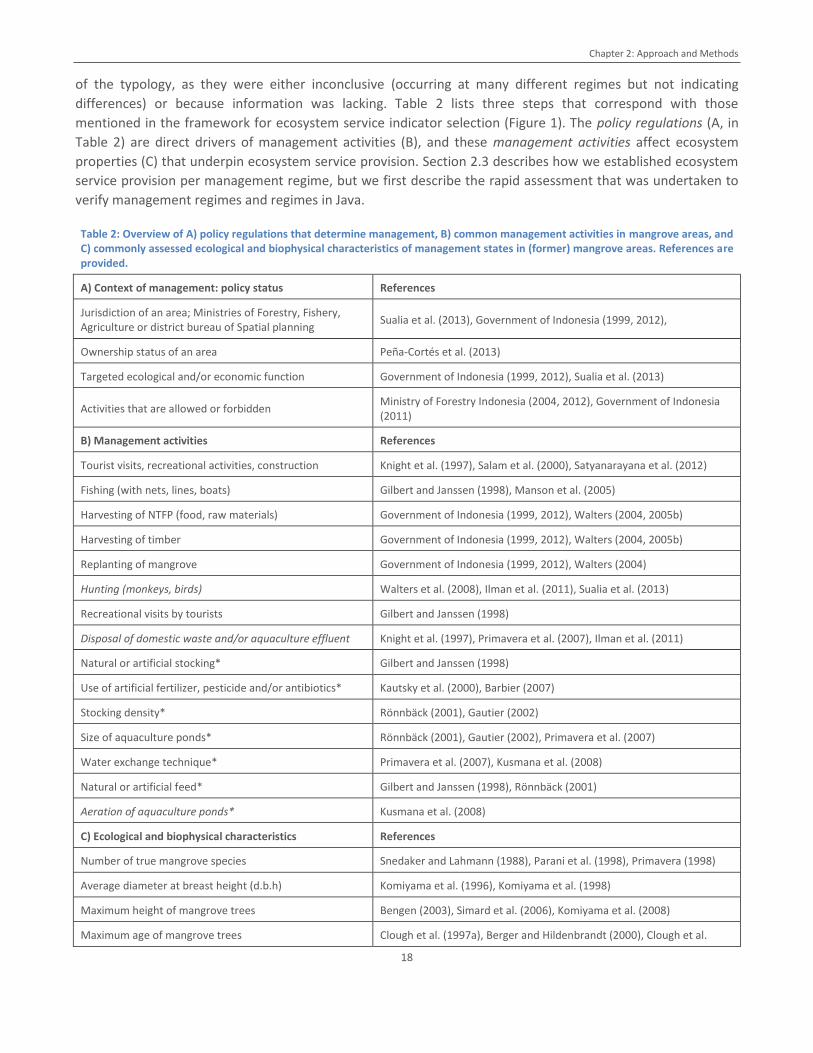
differences) or because information was lacking. Table 2 lists three steps that correspond with those
mentioned in the framework for ecosystem service indicator selection (Figure 1). The policy regulations (A, in
Table 2) are direct drivers of management activities (B), and these management activities affect ecosystem
properties (C) that underpin ecosystem service provision. Section 2.3 describes how we established ecosystem
service provision per management regime, but we first describe the rapid assessment that was undertaken to
verify management regimes and regimes in Java.
Table 2: Overview of A) policy regulations that determine management, B) common management activities in mangrove areas, and C) commonly assessed ecological and biophysical characteristics of management states in (former) mangrove areas. References are provided.
A) Context of management: policy status References
Jurisdiction of an area; Ministries of Forestry, Fishery, Agriculture or district bureau of Spatial planning
Sualia et al. (2013), Government of Indonesia (1999, 2012),
Ownership status of an area Peña-Cortés et al. (2013)
Targeted ecological and/or economic function Government of Indonesia (1999, 2012), Sualia et al. (2013)
Activities that are allowed or forbidden Ministry of Forestry Indonesia (2004, 2012), Government of Indonesia (2011)
B) Management activities References
Tourist visits, recreational activities, construction Knight et al. (1997), Salam et al. (2000), Satyanarayana et al. (2012)
Fishing (with nets, lines, boats) Gilbert and Janssen (1998), Manson et al. (2005)
Harvesting of NTFP (food, raw materials) Government of Indonesia (1999, 2012), Walters (2004, 2005b)
Harvesting of timber Government of Indonesia (1999, 2012), Walters (2004, 2005b)
Replanting of mangrove Government of Indonesia (1999, 2012), Walters (2004)
Hunting (monkeys, birds) Walters et al. (2008), Ilman et al. (2011), Sualia et al. (2013)
Recreational visits by tourists Gilbert and Janssen (1998)
Disposal of domestic waste and/or aquaculture effluent Knight et al. (1997), Primavera et al. (2007), Ilman et al. (2011)
Natural or artificial stocking* Gilbert and Janssen (1998)
Use of artificial fertilizer, pesticide and/or antibiotics* Kautsky et al. (2000), Barbier (2007)
Stocking density* Rönnbäck (2001), Gautier (2002)
Size of aquaculture ponds* Rönnbäck (2001), Gautier (2002), Primavera et al. (2007)
Water exchange technique* Primavera et al. (2007), Kusmana et al. (2008)
Natural or artificial feed* Gilbert and Janssen (1998), Rönnbäck (2001)
Aeration of aquaculture ponds* Kusmana et al. (2008)
C) Ecological and biophysical characteristics References
Number of true mangrove species Snedaker and Lahmann (1988), Parani et al. (1998), Primavera (1998)
Average diameter at breast height (d.b.h) Komiyama et al. (1996), Komiyama et al. (1998)
Maximum height of mangrove trees Bengen (2003), Simard et al. (2006), Komiyama et al. (2008)
Maximum age of mangrove trees Clough et al. (1997a), Berger and Hildenbrandt (2000), Clough et al.
Chapter 2: Approach and Methods
19
(2000), Alongi et al. (1998), Alongi (2002), Bengen (2003)
Maximum perimeter of mangrove trees Mumby et al. (2004), Manson et al. (2005), Mumby (2006)
Maximum root length of mangrove trees Farnsworth and Ellison (1996), Komiyama et al. (1998)
Undergrowth Matthijs et al. (1999)
Nr. of seedlings and saplings Clarke and Allaway (1993), Primavera (1998)
Temperature of substrate, water Middelburg et al. (1996)
Soil substrate Schrijvers et al. (1995), Middelburg et al. (1996)
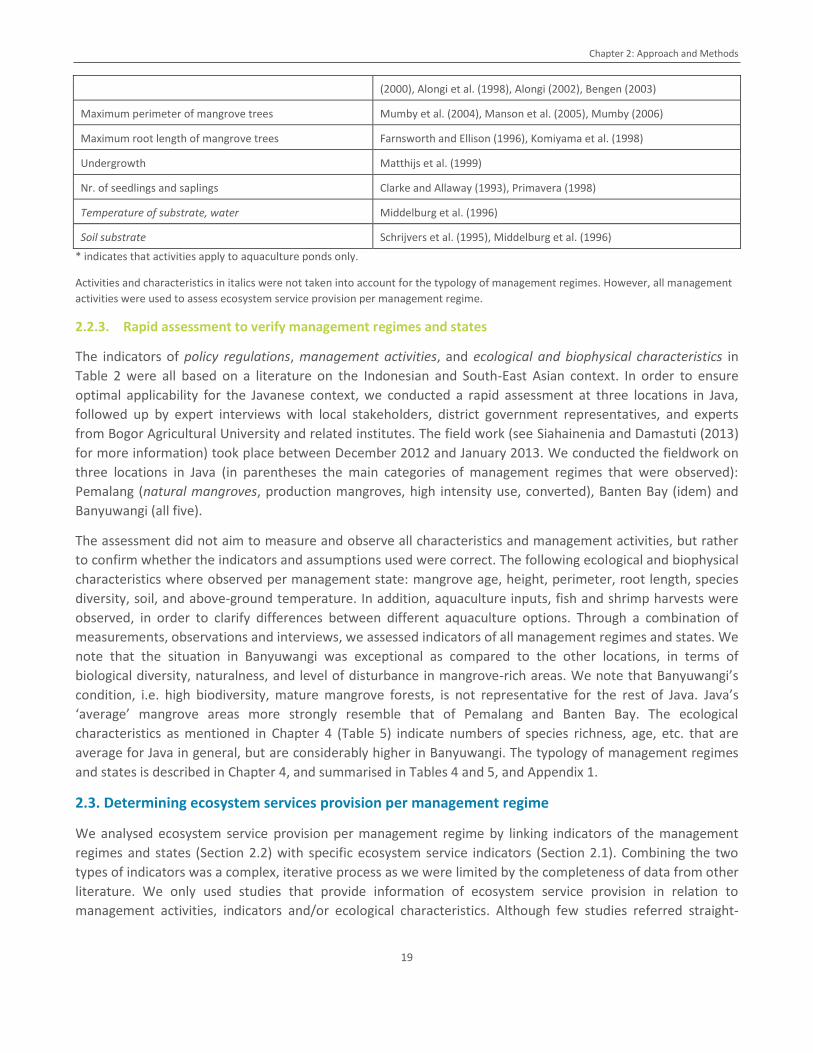
* indicates that activities apply to aquaculture ponds only.
Activities and characteristics in italics were not taken into account for the typology of management regimes. However, all management
activities were used to assess ecosystem service provision per management regime.
2.2.3. Rapid assessment to verify management regimes and states
The indicators of policy regulations, management activities, and ecological and biophysical characteristics in
Table 2 were all based on a literature on the Indonesian and South-East Asian context. In order to ensure
optimal applicability for the Javanese context, we conducted a rapid assessment at three locations in Java,
followed up by expert interviews with local stakeholders, district government representatives, and experts
from Bogor Agricultural University and related institutes. The field work (see Siahainenia and Damastuti (2013)
for more information) took place between December 2012 and January 2013. We conducted the fieldwork on
three locations in Java (in parentheses the main categories of management regimes that were observed):
Pemalang (natural mangroves, production mangroves, high intensity use, converted), Banten Bay (idem) and
Banyuwangi (all five).
The assessment did not aim to measure and observe all characteristics and management activities, but rather
to confirm whether the indicators and assumptions used were correct. The following ecological and biophysical
characteristics where observed per management state: mangrove age, height, perimeter, root length, species
diversity, soil, and above-ground temperature. In addition, aquaculture inputs, fish and shrimp harvests were
observed, in order to clarify differences between different aquaculture options. Through a combination of
measurements, observations and interviews, we assessed indicators of all management regimes and states. We
note that the situation in Banyuwangi was exceptional as compared to the other locations, in terms of
biological diversity, naturalness, and level of disturbance in mangrove-rich areas. We note that Banyuwangi’s
condition, i.e. high biodiversity, mature mangrove forests, is not representative for the rest of Java. Java’s
‘average’ mangrove areas more strongly resemble that of Pemalang and Banten Bay. The ecological
characteristics as mentioned in Chapter 4 (Table 5) indicate numbers of species richness, age, etc. that are
average for Java in general, but are considerably higher in Banyuwangi. The typology of management regimes
and states is described in Chapter 4, and summarised in Tables 4 and 5, and Appendix 1.
2.3. Determining ecosystem services provision per management regime
We analysed ecosystem service provision per management regime by linking indicators of the management
regimes and states (Section 2.2) with specific ecosystem service indicators (Section 2.1). Combining the two
types of indicators was a complex, iterative process as we were limited by the completeness of data from other
literature. We only used studies that provide information of ecosystem service provision in relation to
management activities, indicators and/or ecological characteristics. Although few studies referred straight-
Chapter 2: Approach and Methods
20
forward to ‘management regimes’ we could retrieve useful information from study-site descriptions, for
instance on age of mangrove trees, aquaculture inputs and protection status.
Most of the management activities, management indicators and ecological characteristics listed in Table 2
could be related to ecosystem service provision. Table 5 was used as the final checklist to link ecosystem
service provision with our management regimes. We assigned information on ecosystem service provision to a
certain management regime always based always on a combination of ecological characteristics and assumed
management activities. For instance, important information could be derived from a study in the Philippines
that was reported in Janssen and Padilla (1996) and Gilbert and Janssen (1998). Their exercise, in which a
mangrove area of 110 ha was assigned different management regimes, yielded results on food, raw materials,
coastal protection, and ecotourism provided by conservation (referred to as “preservation”), protected
(“subsistence forestry”) and commercial / production forests (“commercial forestry”), as well silvo-fishery
(“aqua-silviculture”), extensive (“semi-intensive”) and semi-intensive (“intensive”) aquaculture. Based on the
indicators they used to describe their management regimes, we could link many of their results to the
management state typology we had identified.
Reliable quantitative and qualitative information was available on fish catch for aquaculture, carbon
sequestration by and raw materials harvest in most management regimes, and nursery service by natural
mangroves. However, we had to interpret or interpolate many results because they could not be explicitly
linked to all management regimes. In addition, we found other factors that determine ecosystem service
provision regardless of management. For example, a lot of information is available on coastal protection and
water purification by mangrove forests. However, indicators for the provision of these services were difficult to
link to management regimes as they were either too specific (‘slope of forest floor’) or too general (‘total area
of mangrove forest’). In many cases, we had to make assumptions, which are clearly indicated in Chapter 5. For
each service provided by each management regime, we indicate which indicators we could consider for the
analysis, and which additional ones would have to be taken into account for a more precise, location-specific
assessment. For instance, it was not possible to use the indicator ‘spatial extent of mangrove forest’, because
our typology distinguishes between the management regimes based on other, non-spatial characteristics. The
ability of a mangrove area to purify water, attenuate wave impacts or provide nursery strongly depends on the
spatial extent of mangroves, and we therefore had to assume that all mangrove areas that matched other
desired ecological characteristics were also sufficiently large.
Quantitative results were preferred but not always available and qualitative information proved more reliable
and consistent for most regulating services. We indicate per service if information on state and/or performance
indicators could be collected per management regime. Quantitative information served to indicate differences
between management regimes and provide an order of magnitude. The information should not be interpreted
as absolute numbers as local variation is high. When multiple sources provided quantitative information, we
presented the full range of possible outcomes as found in the consulted literature, of which references are
provided. No statistical analysis was conducted to establish significant differences between management
regimes, but we indicate if the original sources provide statistical information. In some cases we had
information on two outlying management regimes, but not on the regime in between. In that case we
interpolated the original results, to provide a quantitative indication. If interpolation or other assumptions
were used, we described it in the results section. Although most service provision that is quantified is given per
ha and year, we note that most management regimes can be regarded as subject to continuous change.
Therefore, the quantitative values we provide should be regarded as indicative only and not as absolute
Chapter 2: Approach and Methods
21
guidelines. We focused solely on different aquaculture options in our comparison of ‘converted mangroves’
and therefore other land use types of converted mangroves were not considered.
Chapter 4 describes ecosystem service provision per management regime. Quantitative and qualitative
information was integrated using a low-medium-high scoring system. Scores were provided relative to the
highest possible result for each ecosystem service. When appropriate, we also provide negative scores, e.g. to
indicate water pollution instead of purification, or CO2 emission instead of sequestration. We indicate if the
results have a high or low certainty of being applicable and true to the specific management regime. A result is
considered highly certain if it has been quantified by multiple sources, if multiple ecosystem service indicators
have been used, if it has been linked to multiple indicators of management regimes, and if it is applicable to the
context of Java. A result is considered of low certainty if it is interpolated, based on few reliable ecosystem
service indicators, shows a weak link to the management regime, and is difficult to apply to the context of Java.
Chapter 5 integrates the findings as presented in Chapter 4 into one table. We provide a summary table with
relative scores (Table 10) to enable a comparison of all ecosystem services per management regime, including
those for which reliable quantitative information was lacking.
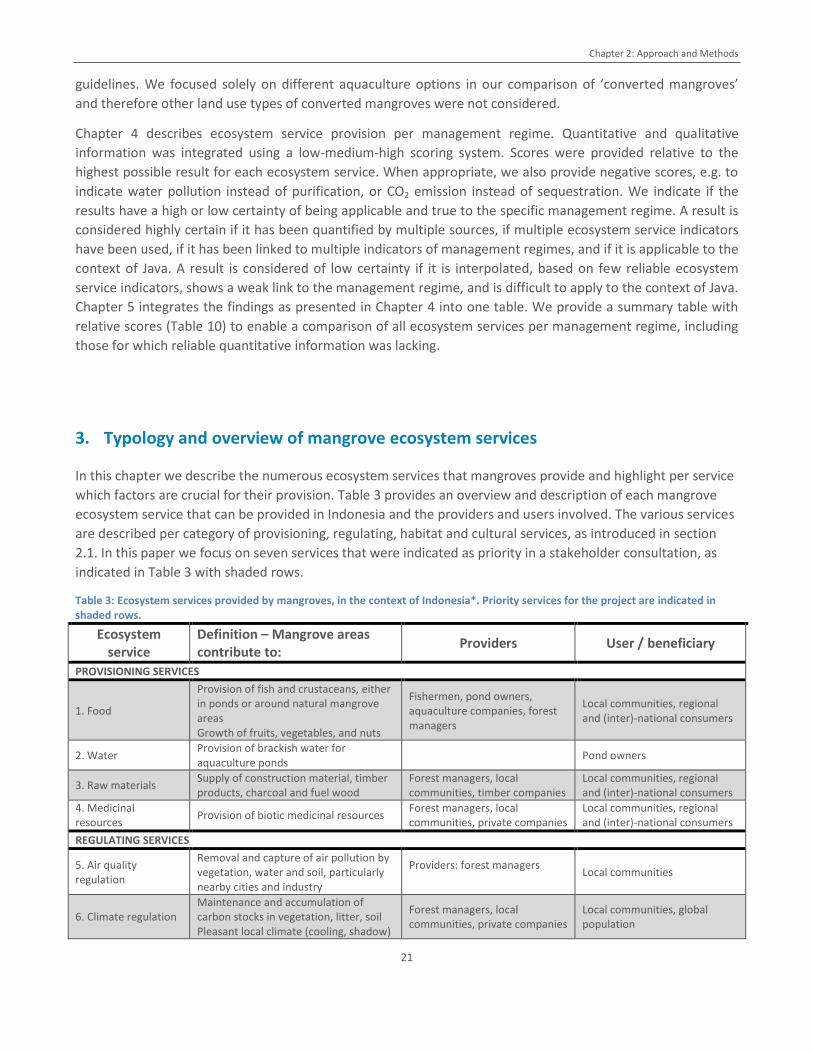
3. Typology and overview of mangrove ecosystem services
In this chapter we describe the numerous ecosystem services that mangroves provide and highlight per service
which factors are crucial for their provision. Table 3 provides an overview and description of each mangrove
ecosystem service that can be provided in Indonesia and the providers and users involved. The various services
are described per category of provisioning, regulating, habitat and cultural services, as introduced in section
2.1. In this paper we focus on seven services that were indicated as priority in a stakeholder consultation, as
indicated in Table 3 with shaded rows.
Table 3: Ecosystem services provided by mangroves, in the context of Indonesia*. Priority services for the project are indicated in shaded rows.
Ecosystem service
Definition – Mangrove areas contribute to:
Providers User / beneficiary
PROVISIONING SERVICES
1. Food
Provision of fish and crustaceans, either in ponds or around natural mangrove areas Growth of fruits, vegetables, and nuts
Fishermen, pond owners, aquaculture companies, forest managers
Local communities, regional and (inter)-national consumers
2. Water Provision of brackish water for aquaculture ponds
Pond owners
3. Raw materials Supply of construction material, timber products, charcoal and fuel wood
Forest managers, local communities, timber companies
Local communities, regional and (inter)-national consumers
4. Medicinal resources
Provision of biotic medicinal resources Forest managers, local communities, private companies
Local communities, regional and (inter)-national consumers
REGULATING SERVICES
5. Air quality regulation
Removal and capture of air pollution by vegetation, water and soil, particularly nearby cities and industry
Providers: forest managers
Local communities
6. Climate regulation Maintenance and accumulation of carbon stocks in vegetation, litter, soil Pleasant local climate (cooling, shadow)
Forest managers, local communities, private companies
Local communities, global population
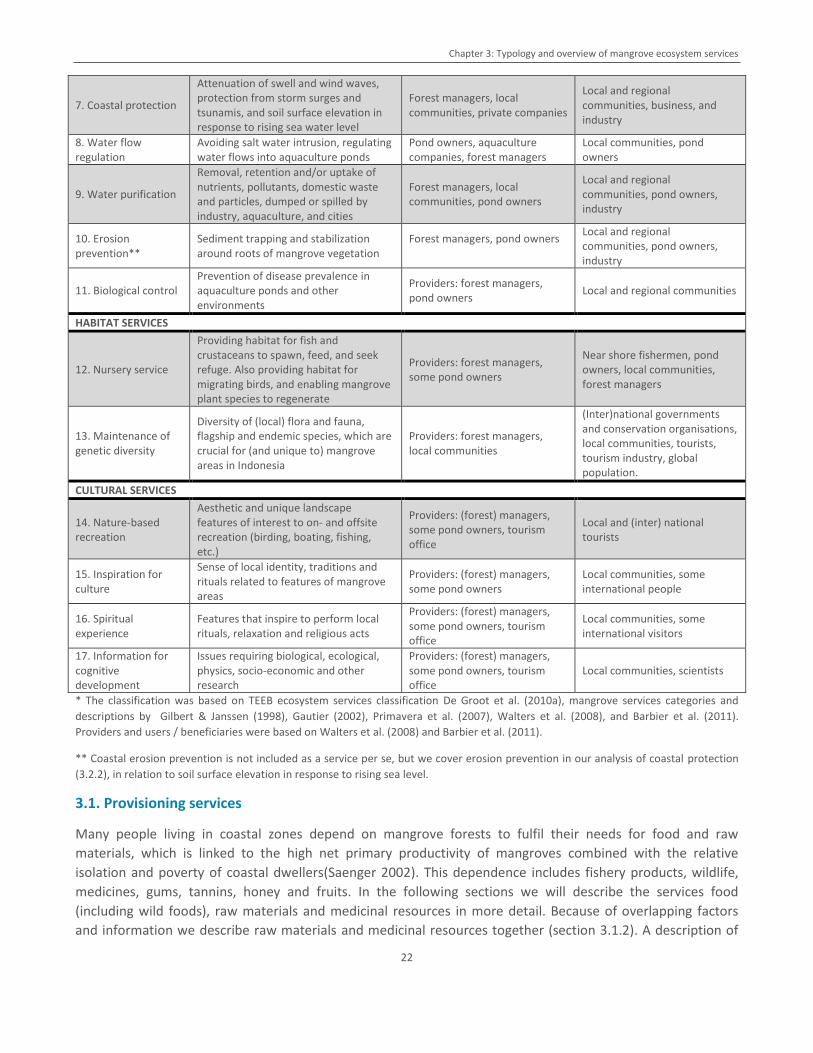
Chapter 3: Typology and overview of mangrove ecosystem services
22
7. Coastal protection
Attenuation of swell and wind waves, protection from storm surges and tsunamis, and soil surface elevation in response to rising sea water level
Forest managers, local communities, private companies
Local and regional communities, business, and industry
8. Water flow regulation
Avoiding salt water intrusion, regulating water flows into aquaculture ponds
Pond owners, aquaculture companies, forest managers
Local communities, pond owners
9. Water purification
Removal, retention and/or uptake of nutrients, pollutants, domestic waste and particles, dumped or spilled by industry, aquaculture, and cities
Forest managers, local communities, pond owners
Local and regional communities, pond owners, industry
10. Erosion prevention**
Sediment trapping and stabilization around roots of mangrove vegetation
Forest managers, pond owners
Local and regional communities, pond owners, industry
11. Biological control Prevention of disease prevalence in aquaculture ponds and other environments
Providers: forest managers, pond owners
Local and regional communities
HABITAT SERVICES
12. Nursery service
Providing habitat for fish and crustaceans to spawn, feed, and seek refuge. Also providing habitat for migrating birds, and enabling mangrove plant species to regenerate
Providers: forest managers, some pond owners
Near shore fishermen, pond owners, local communities, forest managers
13. Maintenance of genetic diversity
Diversity of (local) flora and fauna, flagship and endemic species, which are crucial for (and unique to) mangrove areas in Indonesia
Providers: forest managers, local communities
(Inter)national governments and conservation organisations, local communities, tourists, tourism industry, global population.
CULTURAL SERVICES
14. Nature-based recreation
Aesthetic and unique landscape features of interest to on- and offsite recreation (birding, boating, fishing, etc.)
Providers: (forest) managers, some pond owners, tourism office
Local and (inter) national tourists
15. Inspiration for culture
Sense of local identity, traditions and rituals related to features of mangrove areas
Providers: (forest) managers, some pond owners
Local communities, some international people
16. Spiritual experience
Features that inspire to perform local rituals, relaxation and religious acts
Providers: (forest) managers, some pond owners, tourism office
Local communities, some international visitors
17. Information for cognitive development
Issues requiring biological, ecological, physics, socio-economic and other research
Providers: (forest) managers, some pond owners, tourism office
Local communities, scientists
* The classification was based on TEEB ecosystem services classification De Groot et al. (2010a), mangrove services categories and
descriptions by Gilbert & Janssen (1998), Gautier (2002), Primavera et al. (2007), Walters et al. (2008), and Barbier et al. (2011).
Providers and users / beneficiaries were based on Walters et al. (2008) and Barbier et al. (2011).
** Coastal erosion prevention is not included as a service per se, but we cover erosion prevention in our analysis of coastal protection
(3.2.2), in relation to soil surface elevation in response to rising sea level.
3.1. Provisioning services
Many people living in coastal zones depend on mangrove forests to fulfil their needs for food and raw
materials, which is linked to the high net primary productivity of mangroves combined with the relative
isolation and poverty of coastal dwellers(Saenger 2002). This dependence includes fishery products, wildlife,
medicines, gums, tannins, honey and fruits. In the following sections we will describe the services food
(including wild foods), raw materials and medicinal resources in more detail. Because of overlapping factors
and information we describe raw materials and medicinal resources together (section 3.1.2). A description of
Chapter 3: Typology and overview of mangrove ecosystem services
23
the service water provision (Table 3) is not included in this section, since limited information and examples
were available.
However, it goes without saying that especially the provision of fresh and unpolluted brackish sea and river
water to ponds is important to aquaculture pond owners. Large amounts of water are needed for aquaculture
and, consequently, large amounts are also disposed of in surrounding water bodies, often with high nutrient
and contaminant concentrations (see water purification).
3.1.1. Food
We divide food resources into fish and crustaceans (shrimp and crabs), and other wild foods, which include
fruits, nuts, and vegetables, on the other side.
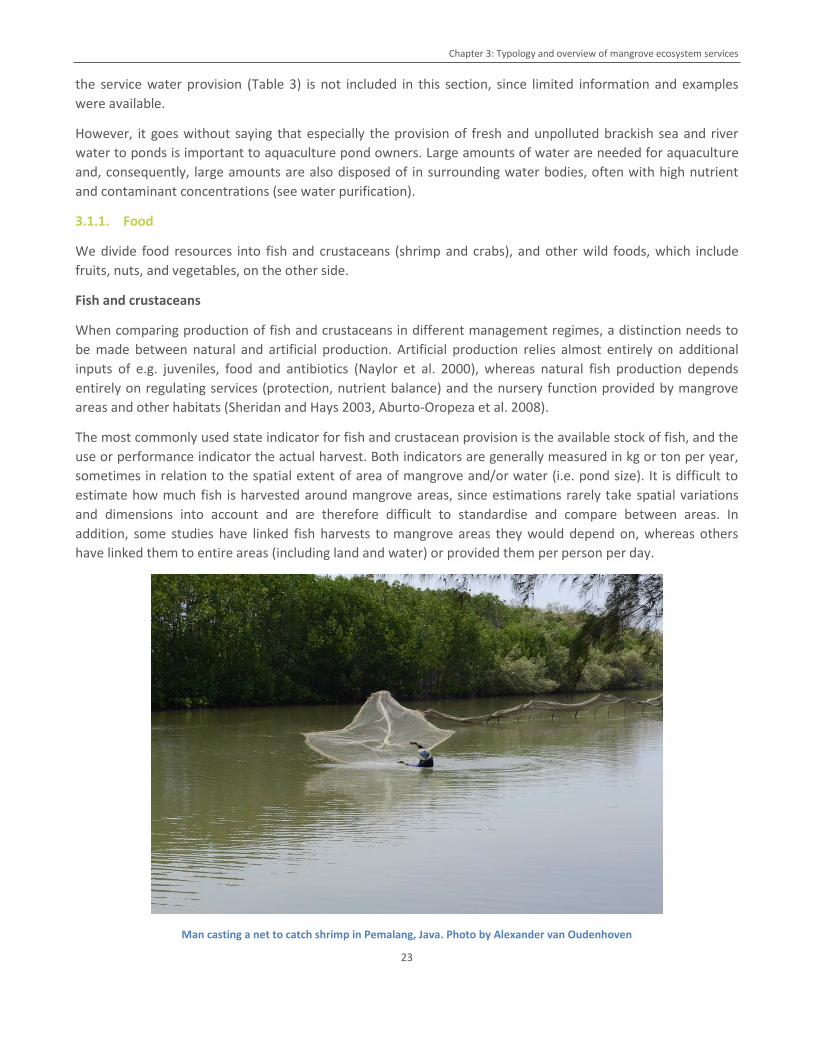
Fish and crustaceans
When comparing production of fish and crustaceans in different management regimes, a distinction needs to
be made between natural and artificial production. Artificial production relies almost entirely on additional
inputs of e.g. juveniles, food and antibiotics (Naylor et al. 2000), whereas natural fish production depends
entirely on regulating services (protection, nutrient balance) and the nursery function provided by mangrove
areas and other habitats (Sheridan and Hays 2003, Aburto-Oropeza et al. 2008).
The most commonly used state indicator for fish and crustacean provision is the available stock of fish, and the
use or performance indicator the actual harvest. Both indicators are generally measured in kg or ton per year,
sometimes in relation to the spatial extent of area of mangrove and/or water (i.e. pond size). It is difficult to
estimate how much fish is harvested around mangrove areas, since estimations rarely take spatial variations
and dimensions into account and are therefore difficult to standardise and compare between areas. In
addition, some studies have linked fish harvests to mangrove areas they would depend on, whereas others
have linked them to entire areas (including land and water) or provided them per person per day.
Man casting a net to catch shrimp in Pemalang, Java. Photo by Alexander van Oudenhoven
Chapter 3: Typology and overview of mangrove ecosystem services
24
For this paper it is important to highlight underlying production processes and management intensities for both
natural and artificial production of fish and crustaceans. Natural production (and therefore fishery) depends
mainly on the ecological and biophysical conditions of the ecosystem. These conditions are related to habitats
(food abundance, predation), trophic subsidy (migrating biota, outwelling) and physical subsidy (lowered
turbity, nutrient and pollutant levels and stabilized salinity), among others (Rönnbäck 1999). Though few
commercial fish are permanent residents in mangroves, many depend on them in one of more phases of their
lifecycle. An overview of these species can be found in Rönnbäck (1999), who also states that fish stand stocks
in mangrove ecosystems have been estimated at ranging from 4 to 25 g m-2, which is generally much higher
than other (adjacent) coastal habitats. For an overview of which factors determine the occurrence of fish stocks
and nursery service by mangroves, see section 4.3.1 on nursery service. Commercially interesting species in
Indonesia that are caught in the mangrove ecosystem are mainly shrimp, molluscs, and crabs (Ilman et al.
2011). Many fish and crustaceans, however, are also caught for local market and own subsistence.
Aquaculture in Indonesia is mainly focused on the production of shrimp and, to a lesser extent, milkfish and
crab (Ilman et al. 2011). Although some aquaculture ponds occur further away from the coastline, the vast
majority have been created after conversion of mangrove and other coastal ecosystems (Sukardjo 2009).
Especially towards the mid-nineties, shrimp aquaculture expanded tremendously, and nowadays is still a major
economic asset in Indonesia. Annually, about 160.000 t of shrimp are produced in Indonesia, the large majority
for export (MMA 2009). As described in Section 4.5, fish and shrimp farming typically involves inclosing the
stock in a secure system, away from predators and competitors (extensive aquaculture), with additional
feeding (semi-intensive aquaculture) or provided with all nutritional and disease preventive requirements
(intensive aquaculture) (Naylor et al. 2000). Apart from the nursery function of mangroves and other natural
ecosystems for the seeds or juveniles of shrimps and fish, aquaculture also depends on additional ecosystem
services (Rönnbäck 1999). Water flowing out of mangrove systems into ponds contains important food
resources (detritus). The quality of aquaculture effluent water, part of which is generally being reused, can be
discarded of sediments, pollutants and excess nutrients by mangroves (Rönnbäck 1999 and section 4.2.3).
Surrounding mangrove areas can be an important buffer in case of high water levels, thereby preventing
floods, water erosion and destruction of the pond dikes. And finally, mangrove greenbelts can dissipate energy
from waves, thereby contributing to storm and flood prevention (McIvor et al. 2012a, McIvor et al. 2012b and
section 3.2.2).
Other foods
Either whole plants or specific parts of mangrove plants are harvested because of their nutritious value.
Although some examples are known of hunted mammals, especially rodents and monkeys, the foods derived
from mangrove systems are generally fruits, vegetables, honey and syrups. Especially fruits are known to have
a high nutritious value (Ilman et al. 2011). Similar to fish and crustaceans, the most commonly used indicator to
measure the potential of a mangrove area to provide wild food (state indicator) is the total mass of available
food per unit of space and time. The performance indicator would be amount of food actually harvested.
The availability of wild foods is strongly dependent on species diversity, age of plants and accessibility for
harvesting. Although the fruits from Rhizophora spp are mainly used, also other species like Bruguiera,
Acrostichum, Avicennia, and Sonneratia produce edible fruits. The general public is quite wary of the fact that
some fruits contain toxic substances (HCN mainly), but most of them can be quite easily rinsed away, making
the fruit safe to eat (Kusmana 2010). Because species richness and conditions on which species’ success
depend are crucial factors for the provision of wild foods, raw materials and medicinal plants, we have
compiled a table in which the most common mangrove plant species, their uses and the required conditions
Chapter 3: Typology and overview of mangrove ecosystem services
25
are summarised for all three ecosystem services (Appendix 3). The main conditions considered in literature are
tidal effects and soil type (mud, clay, sand). Although not considered within the scope of the study, we
hypothesise which foods and material would be provided by which management regime in Appendix 3.
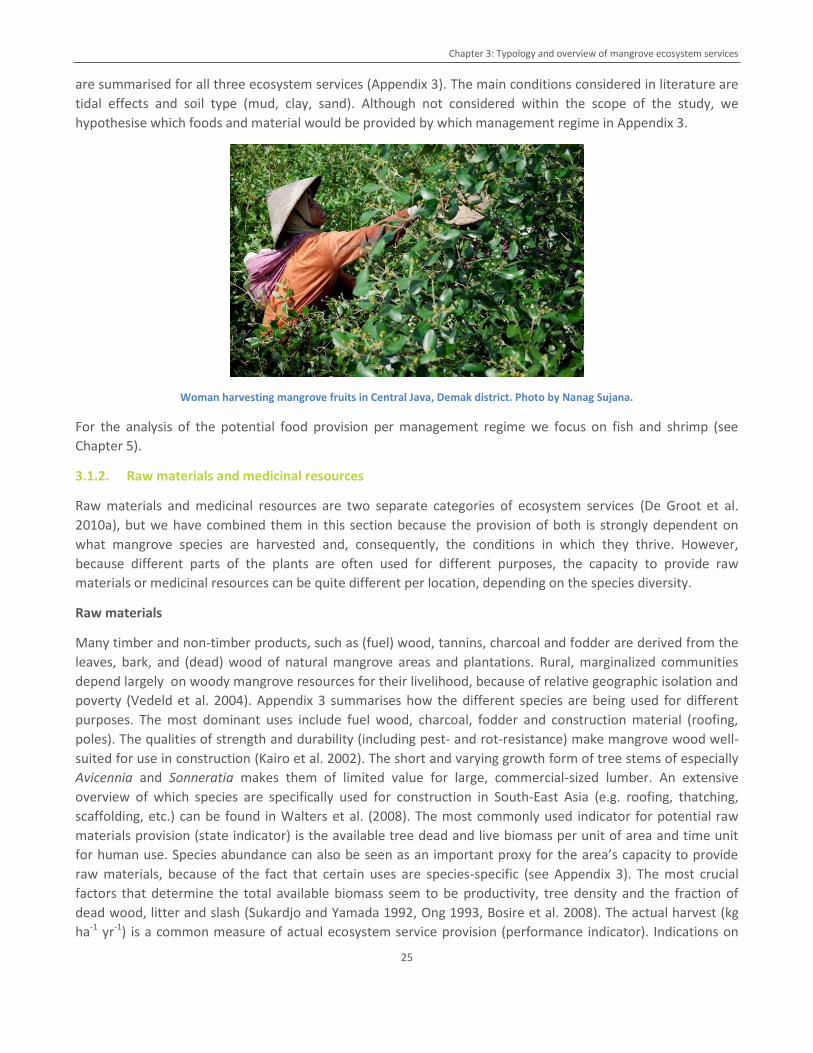
Woman harvesting mangrove fruits in Central Java, Demak district. Photo by Nanag Sujana.
For the analysis of the potential food provision per management regime we focus on fish and shrimp (see
Chapter 5).
3.1.2. Raw materials and medicinal resources
Raw materials and medicinal resources are two separate categories of ecosystem services (De Groot et al.
2010a), but we have combined them in this section because the provision of both is strongly dependent on
what mangrove species are harvested and, consequently, the conditions in which they thrive. However,
because different parts of the plants are often used for different purposes, the capacity to provide raw
materials or medicinal resources can be quite different per location, depending on the species diversity.
Raw materials
Many timber and non-timber products, such as (fuel) wood, tannins, charcoal and fodder are derived from the
leaves, bark, and (dead) wood of natural mangrove areas and plantations. Rural, marginalized communities
depend largely on woody mangrove resources for their livelihood, because of relative geographic isolation and
poverty (Vedeld et al. 2004). Appendix 3 summarises how the different species are being used for different
purposes. The most dominant uses include fuel wood, charcoal, fodder and construction material (roofing,
poles). The qualities of strength and durability (including pest- and rot-resistance) make mangrove wood well-
suited for use in construction (Kairo et al. 2002). The short and varying growth form of tree stems of especially
Avicennia and Sonneratia makes them of limited value for large, commercial-sized lumber. An extensive
overview of which species are specifically used for construction in South-East Asia (e.g. roofing, thatching,
scaffolding, etc.) can be found in Walters et al. (2008). The most commonly used indicator for potential raw
materials provision (state indicator) is the available tree dead and live biomass per unit of area and time unit
for human use. Species abundance can also be seen as an important proxy for the area’s capacity to provide
raw materials, because of the fact that certain uses are species-specific (see Appendix 3). The most crucial
factors that determine the total available biomass seem to be productivity, tree density and the fraction of
dead wood, litter and slash (Sukardjo and Yamada 1992, Ong 1993, Bosire et al. 2008). The actual harvest (kg
ha-1 yr-1) is a common measure of actual ecosystem service provision (performance indicator). Indications on
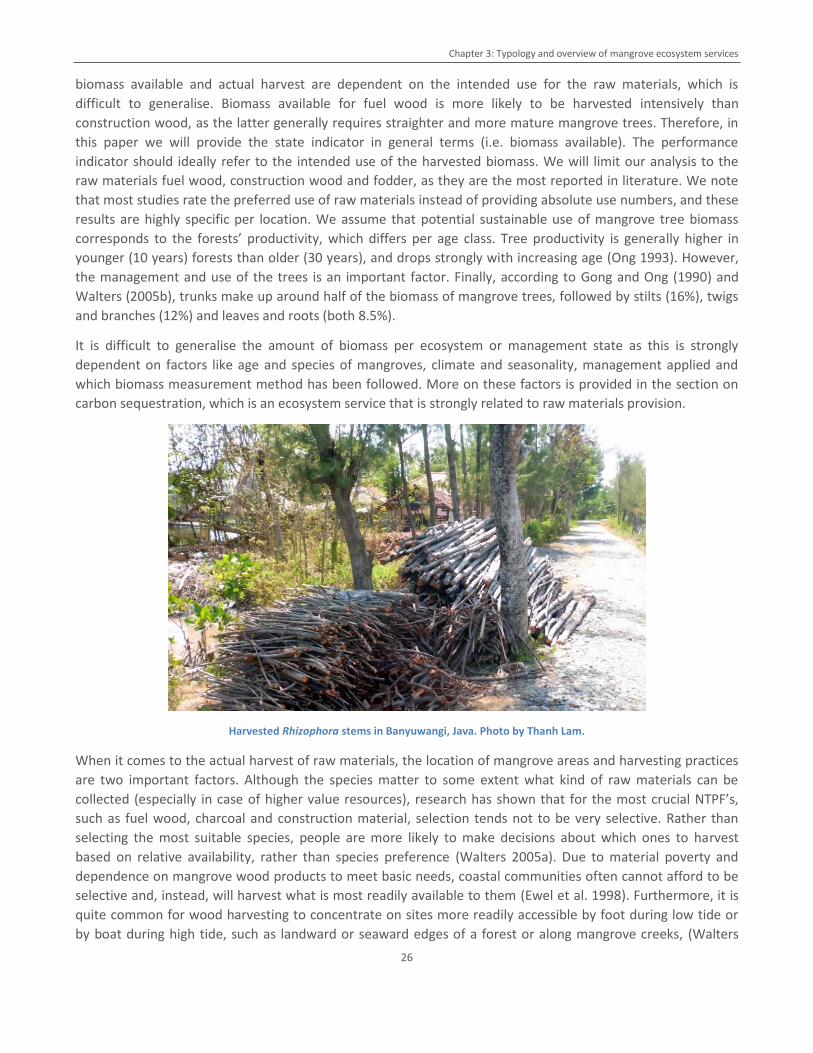
Chapter 3: Typology and overview of mangrove ecosystem services
26
biomass available and actual harvest are dependent on the intended use for the raw materials, which is
difficult to generalise. Biomass available for fuel wood is more likely to be harvested intensively than
construction wood, as the latter generally requires straighter and more mature mangrove trees. Therefore, in
this paper we will provide the state indicator in general terms (i.e. biomass available). The performance
indicator should ideally refer to the intended use of the harvested biomass. We will limit our analysis to the
raw materials fuel wood, construction wood and fodder, as they are the most reported in literature. We note
that most studies rate the preferred use of raw materials instead of providing absolute use numbers, and these
results are highly specific per location. We assume that potential sustainable use of mangrove tree biomass
corresponds to the forests’ productivity, which differs per age class. Tree productivity is generally higher in
younger (10 years) forests than older (30 years), and drops strongly with increasing age (Ong 1993). However,
the management and use of the trees is an important factor. Finally, according to Gong and Ong (1990) and
Walters (2005b), trunks make up around half of the biomass of mangrove trees, followed by stilts (16%), twigs
and branches (12%) and leaves and roots (both 8.5%).
It is difficult to generalise the amount of biomass per ecosystem or management state as this is strongly
dependent on factors like age and species of mangroves, climate and seasonality, management applied and
which biomass measurement method has been followed. More on these factors is provided in the section on
carbon sequestration, which is an ecosystem service that is strongly related to raw materials provision.
Harvested Rhizophora stems in Banyuwangi, Java. Photo by Thanh Lam.
When it comes to the actual harvest of raw materials, the location of mangrove areas and harvesting practices
are two important factors. Although the species matter to some extent what kind of raw materials can be
collected (especially in case of higher value resources), research has shown that for the most crucial NTPF’s,
such as fuel wood, charcoal and construction material, selection tends not to be very selective. Rather than
selecting the most suitable species, people are more likely to make decisions about which ones to harvest
based on relative availability, rather than species preference (Walters 2005a). Due to material poverty and
dependence on mangrove wood products to meet basic needs, coastal communities often cannot afford to be
selective and, instead, will harvest what is most readily available to them (Ewel et al. 1998). Furthermore, it is
quite common for wood harvesting to concentrate on sites more readily accessible by foot during low tide or
by boat during high tide, such as landward or seaward edges of a forest or along mangrove creeks, (Walters
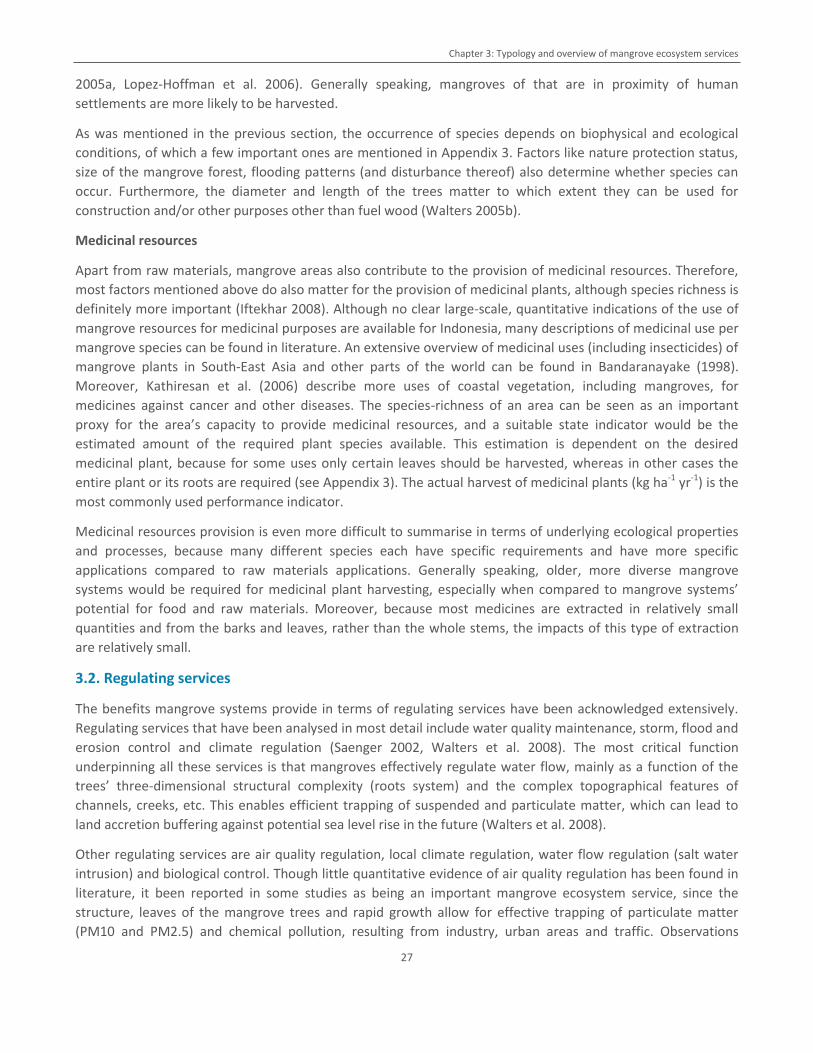
Chapter 3: Typology and overview of mangrove ecosystem services
27
2005a, Lopez-Hoffman et al. 2006). Generally speaking, mangroves of that are in proximity of human
settlements are more likely to be harvested.
As was mentioned in the previous section, the occurrence of species depends on biophysical and ecological
conditions, of which a few important ones are mentioned in Appendix 3. Factors like nature protection status,
size of the mangrove forest, flooding patterns (and disturbance thereof) also determine whether species can
occur. Furthermore, the diameter and length of the trees matter to which extent they can be used for
construction and/or other purposes other than fuel wood (Walters 2005b).
Medicinal resources
Apart from raw materials, mangrove areas also contribute to the provision of medicinal resources. Therefore,
most factors mentioned above do also matter for the provision of medicinal plants, although species richness is
definitely more important (Iftekhar 2008). Although no clear large-scale, quantitative indications of the use of
mangrove resources for medicinal purposes are available for Indonesia, many descriptions of medicinal use per
mangrove species can be found in literature. An extensive overview of medicinal uses (including insecticides) of
mangrove plants in South-East Asia and other parts of the world can be found in Bandaranayake (1998).
Moreover, Kathiresan et al. (2006) describe more uses of coastal vegetation, including mangroves, for
medicines against cancer and other diseases. The species-richness of an area can be seen as an important
proxy for the area’s capacity to provide medicinal resources, and a suitable state indicator would be the
estimated amount of the required plant species available. This estimation is dependent on the desired
medicinal plant, because for some uses only certain leaves should be harvested, whereas in other cases the
entire plant or its roots are required (see Appendix 3). The actual harvest of medicinal plants (kg ha-1 yr-1) is the
most commonly used performance indicator.
Medicinal resources provision is even more difficult to summarise in terms of underlying ecological properties
and processes, because many different species each have specific requirements and have more specific
applications compared to raw materials applications. Generally speaking, older, more diverse mangrove
systems would be required for medicinal plant harvesting, especially when compared to mangrove systems’
potential for food and raw materials. Moreover, because most medicines are extracted in relatively small
quantities and from the barks and leaves, rather than the whole stems, the impacts of this type of extraction
are relatively small.
3.2. Regulating services
The benefits mangrove systems provide in terms of regulating services have been acknowledged extensively.
Regulating services that have been analysed in most detail include water quality maintenance, storm, flood and
erosion control and climate regulation (Saenger 2002, Walters et al. 2008). The most critical function
underpinning all these services is that mangroves effectively regulate water flow, mainly as a function of the
trees’ three-dimensional structural complexity (roots system) and the complex topographical features of
channels, creeks, etc. This enables efficient trapping of suspended and particulate matter, which can lead to
land accretion buffering against potential sea level rise in the future (Walters et al. 2008).
Other regulating services are air quality regulation, local climate regulation, water flow regulation (salt water
intrusion) and biological control. Though little quantitative evidence of air quality regulation has been found in
literature, it been reported in some studies as being an important mangrove ecosystem service, since the
structure, leaves of the mangrove trees and rapid growth allow for effective trapping of particulate matter
(PM10 and PM2.5) and chemical pollution, resulting from industry, urban areas and traffic. Observations
Chapter 3: Typology and overview of mangrove ecosystem services
28
revealed that several communities living close to roads and industries had planted mangroves in ditches and
greenbelts to improve the air quality in their neighbourhood. In addition, anecdotal evidence exists on the
contribution of dense, mature mangrove forests to a more stable (local) microclimate. Results show
temperatures that are lower during the day-time and higher during the night-time.
Water flow regulation, and especially the prevention of salt water intrusion to agriculture, aquaculture and
drink water systems has also been acknowledged but evidence from studies with qualitative and/or
quantitative analysis remains limited (Ilman et al. 2011). Biological control by mangrove vegetation mainly
refers to the prevention of water-borne diseases in aquaculture and inhabited environments. Especially shrimp
ponds run the risk of generating diseases. It should also be noted that, at the same time, local communities
have also indicated to be displeased by the increased occurrence of mosquito-related diseases and nuisance as
a result of mangrove replanting activities (Ilman et al. 2011).
We discuss global climate regulation (carbon storage and sequestration) in section 3.2.1, coastal protection
(wave attenuation, storm surge reduction, soil surface elevation and erosion protection) in section 3.2.2, and
water purification (N and P removal) in section 3.2.3 in more detail.
3.2.1. Global climate regulation: carbon storage and sequestration
Mangrove ecosystems are highly productive and biogeochemically active ecosystems, and as such represent
important sinks of carbon in the biosphere (Ong 1993, Walters et al. 2008). The carbon stock per unit area of
mangrove forest can be enormous, as photosynthesis rates of mangrove trees are high and the top layers of
mangrove sediments store large amounts of organic carbon, the latter typically higher than of other tropical
forests. If successfully managed, mangrove ecosystems thus have the potential to contribute to global CO2
sequestration (Alongi 2012). Successful management for carbon sequestration mainly relates to long-term
protection of vegetation and soil, i.e. preventing destructive human activities, and restoring mangrove
vegetation so that soil layers get accumulated.
The assessment of carbon storage and carbon sequestration entails crucially different methods and time scales,
as well as careful consideration of where carbon is actually stored and/or sequestered. Carbon storage is
measured in amounts of carbon per unit of area (e.g. ton ha-1), which can be seen as a state indicator for
carbon sequestration. Carbon sequestration has a temporal aspect, as it is the amount of carbon sequestered
over time (e.g. ton ha-1 year-1). Mangrove ecosystems sequester carbon within living biomass both
aboveground (leaves, stems, roots, branches) and belowground (roots), within non-living biomass (litter and
deadwood), and as organic matter within their sediments (Mcleod et al. 2011, Alongi 2012). Carbon
sequestration in biomass typically takes several decennia at the most, whereas carbon sequestration in
sediments is more a matter of millennia (Mcleod et al. 2011). Therefore, management impacts that clear
vegetation and expose mangrove soils will result in immediate emission of carbon that has been sequestered
over generations and more. For instance, a much-cited study by Ong (1993) in Malaysian mangrove forests
showed that conversion to aquaculture ponds could result in the total emission of 150 ton C ha–1 from standing
biomass removal of and 750 t C ha–1 from the oxidation of organic matter in mangrove sediments. Moreover,
assuming that this process occurs in a 10 years period, the carbon loss from sediments (75 ton C ha–1 yr–1)
would be 50 times the C sequestration rate in this forest (Ong 1993). If anything, this example shows the
importance of protecting mangrove forests and thereby preventing carbon emissions, in addition to replanting
mangroves to contribute to short-term and small-scale ‘re-sequestration’ of CO2
Above- and belowground storage of carbon depends on many factors. We will here focus on a few key factors,
but recommend e.g. studies by Bouillon et al. (2008), Donato et al. (2011), Kauffman et al. (2011), Kauffman et
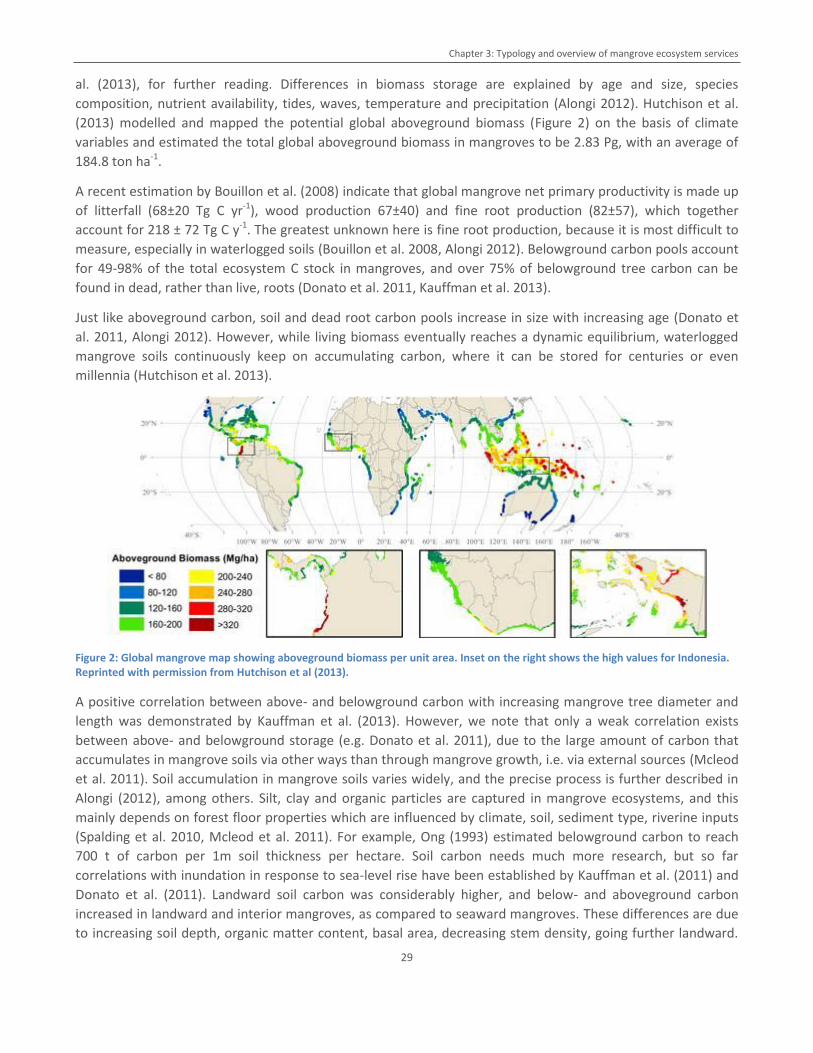
Chapter 3: Typology and overview of mangrove ecosystem services
29
al. (2013), for further reading. Differences in biomass storage are explained by age and size, species
composition, nutrient availability, tides, waves, temperature and precipitation (Alongi 2012). Hutchison et al.
(2013) modelled and mapped the potential global aboveground biomass (Figure 2) on the basis of climate
variables and estimated the total global aboveground biomass in mangroves to be 2.83 Pg, with an average of
184.8 ton ha-1.
A recent estimation by Bouillon et al. (2008) indicate that global mangrove net primary productivity is made up
of litterfall (68±20 Tg C yr-1), wood production 67±40) and fine root production (82±57), which together
account for 218 ± 72 Tg C y-1. The greatest unknown here is fine root production, because it is most difficult to
measure, especially in waterlogged soils (Bouillon et al. 2008, Alongi 2012). Belowground carbon pools account
for 49-98% of the total ecosystem C stock in mangroves, and over 75% of belowground tree carbon can be
found in dead, rather than live, roots (Donato et al. 2011, Kauffman et al. 2013).
Just like aboveground carbon, soil and dead root carbon pools increase in size with increasing age (Donato et
al. 2011, Alongi 2012). However, while living biomass eventually reaches a dynamic equilibrium, waterlogged
mangrove soils continuously keep on accumulating carbon, where it can be stored for centuries or even
millennia (Hutchison et al. 2013).
Figure 2: Global mangrove map showing aboveground biomass per unit area. Inset on the right shows the high values for Indonesia. Reprinted with permission from Hutchison et al (2013).
A positive correlation between above- and belowground carbon with increasing mangrove tree diameter and
length was demonstrated by Kauffman et al. (2013). However, we note that only a weak correlation exists
between above- and belowground storage (e.g. Donato et al. 2011), due to the large amount of carbon that
accumulates in mangrove soils via other ways than through mangrove growth, i.e. via external sources (Mcleod
et al. 2011). Soil accumulation in mangrove soils varies widely, and the precise process is further described in
Alongi (2012), among others. Silt, clay and organic particles are captured in mangrove ecosystems, and this
mainly depends on forest floor properties which are influenced by climate, soil, sediment type, riverine inputs
(Spalding et al. 2010, Mcleod et al. 2011). For example, Ong (1993) estimated belowground carbon to reach
700 t of carbon per 1m soil thickness per hectare. Soil carbon needs much more research, but so far
correlations with inundation in response to sea-level rise have been established by Kauffman et al. (2011) and
Donato et al. (2011). Landward soil carbon was considerably higher, and below- and aboveground carbon
increased in landward and interior mangroves, as compared to seaward mangroves. These differences are due
to increasing soil depth, organic matter content, basal area, decreasing stem density, going further landward.
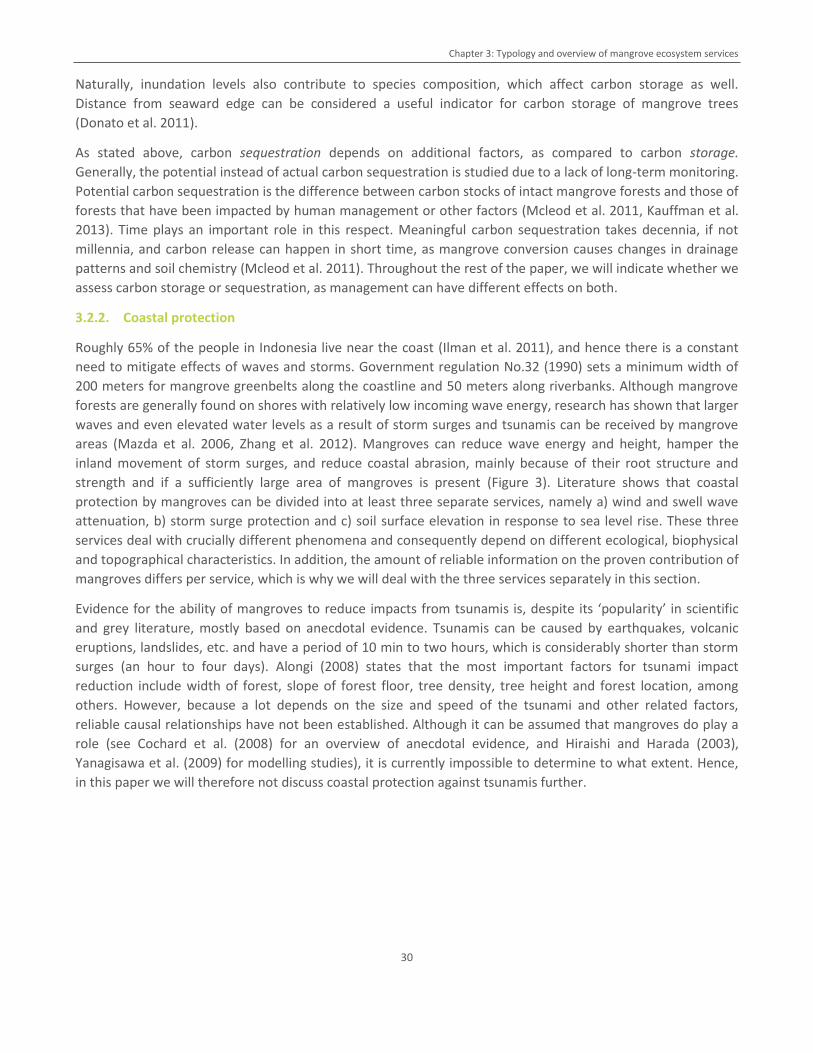
Chapter 3: Typology and overview of mangrove ecosystem services
30
Naturally, inundation levels also contribute to species composition, which affect carbon storage as well.
Distance from seaward edge can be considered a useful indicator for carbon storage of mangrove trees
(Donato et al. 2011).
As stated above, carbon sequestration depends on additional factors, as compared to carbon storage.
Generally, the potential instead of actual carbon sequestration is studied due to a lack of long-term monitoring.
Potential carbon sequestration is the difference between carbon stocks of intact mangrove forests and those of
forests that have been impacted by human management or other factors (Mcleod et al. 2011, Kauffman et al.
2013). Time plays an important role in this respect. Meaningful carbon sequestration takes decennia, if not
millennia, and carbon release can happen in short time, as mangrove conversion causes changes in drainage
patterns and soil chemistry (Mcleod et al. 2011). Throughout the rest of the paper, we will indicate whether we
assess carbon storage or sequestration, as management can have different effects on both.
3.2.2. Coastal protection
Roughly 65% of the people in Indonesia live near the coast (Ilman et al. 2011), and hence there is a constant
need to mitigate effects of waves and storms. Government regulation No.32 (1990) sets a minimum width of
200 meters for mangrove greenbelts along the coastline and 50 meters along riverbanks. Although mangrove
forests are generally found on shores with relatively low incoming wave energy, research has shown that larger
waves and even elevated water levels as a result of storm surges and tsunamis can be received by mangrove
areas (Mazda et al. 2006, Zhang et al. 2012). Mangroves can reduce wave energy and height, hamper the
inland movement of storm surges, and reduce coastal abrasion, mainly because of their root structure and
strength and if a sufficiently large area of mangroves is present (Figure 3). Literature shows that coastal
protection by mangroves can be divided into at least three separate services, namely a) wind and swell wave
attenuation, b) storm surge protection and c) soil surface elevation in response to sea level rise. These three
services deal with crucially different phenomena and consequently depend on different ecological, biophysical
and topographical characteristics. In addition, the amount of reliable information on the proven contribution of
mangroves differs per service, which is why we will deal with the three services separately in this section.
Evidence for the ability of mangroves to reduce impacts from tsunamis is, despite its ‘popularity’ in scientific
and grey literature, mostly based on anecdotal evidence. Tsunamis can be caused by earthquakes, volcanic
eruptions, landslides, etc. and have a period of 10 min to two hours, which is considerably shorter than storm
surges (an hour to four days). Alongi (2008) states that the most important factors for tsunami impact
reduction include width of forest, slope of forest floor, tree density, tree height and forest location, among
others. However, because a lot depends on the size and speed of the tsunami and other related factors,
reliable causal relationships have not been established. Although it can be assumed that mangroves do play a
role (see Cochard et al. (2008) for an overview of anecdotal evidence, and Hiraishi and Harada (2003),
Yanagisawa et al. (2009) for modelling studies), it is currently impossible to determine to what extent. Hence,
in this paper we will therefore not discuss coastal protection against tsunamis further.
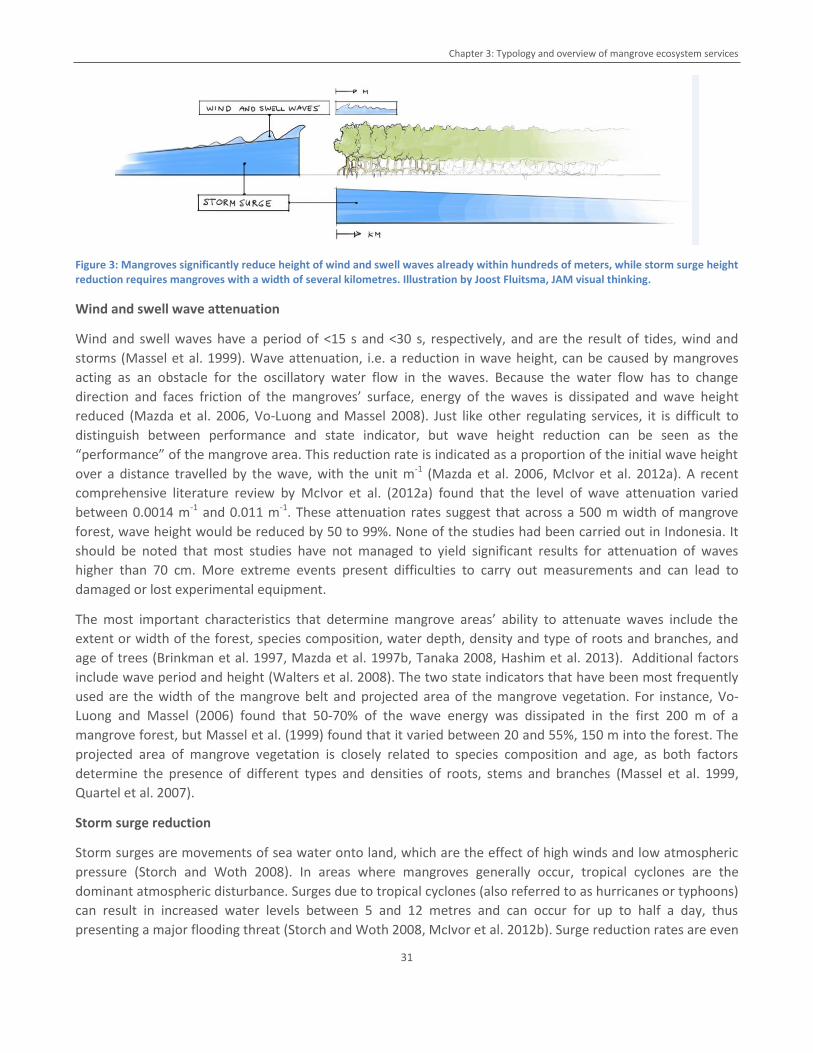
Chapter 3: Typology and overview of mangrove ecosystem services
31
Figure 3: Mangroves significantly reduce height of wind and swell waves already within hundreds of meters, while storm surge height reduction requires mangroves with a width of several kilometres. Illustration by Joost Fluitsma, JAM visual thinking.
Wind and swell wave attenuation
Wind and swell waves have a period of <15 s and <30 s, respectively, and are the result of tides, wind and
storms (Massel et al. 1999). Wave attenuation, i.e. a reduction in wave height, can be caused by mangroves
acting as an obstacle for the oscillatory water flow in the waves. Because the water flow has to change
direction and faces friction of the mangroves’ surface, energy of the waves is dissipated and wave height
reduced (Mazda et al. 2006, Vo-Luong and Massel 2008). Just like other regulating services, it is difficult to
distinguish between performance and state indicator, but wave height reduction can be seen as the
“performance” of the mangrove area. This reduction rate is indicated as a proportion of the initial wave height
over a distance travelled by the wave, with the unit m-1 (Mazda et al. 2006, McIvor et al. 2012a). A recent
comprehensive literature review by McIvor et al. (2012a) found that the level of wave attenuation varied
between 0.0014 m-1 and 0.011 m-1. These attenuation rates suggest that across a 500 m width of mangrove
forest, wave height would be reduced by 50 to 99%. None of the studies had been carried out in Indonesia. It
should be noted that most studies have not managed to yield significant results for attenuation of waves
higher than 70 cm. More extreme events present difficulties to carry out measurements and can lead to
damaged or lost experimental equipment.
The most important characteristics that determine mangrove areas’ ability to attenuate waves include the
extent or width of the forest, species composition, water depth, density and type of roots and branches, and
age of trees (Brinkman et al. 1997, Mazda et al. 1997b, Tanaka 2008, Hashim et al. 2013). Additional factors
include wave period and height (Walters et al. 2008). The two state indicators that have been most frequently
used are the width of the mangrove belt and projected area of the mangrove vegetation. For instance, Vo-
Luong and Massel (2006) found that 50-70% of the wave energy was dissipated in the first 200 m of a
mangrove forest, but Massel et al. (1999) found that it varied between 20 and 55%, 150 m into the forest. The
projected area of mangrove vegetation is closely related to species composition and age, as both factors
determine the presence of different types and densities of roots, stems and branches (Massel et al. 1999,
Quartel et al. 2007).
Storm surge reduction
Storm surges are movements of sea water onto land, which are the effect of high winds and low atmospheric
pressure (Storch and Woth 2008). In areas where mangroves generally occur, tropical cyclones are the
dominant atmospheric disturbance. Surges due to tropical cyclones (also referred to as hurricanes or typhoons)
can result in increased water levels between 5 and 12 metres and can occur for up to half a day, thus
presenting a major flooding threat (Storch and Woth 2008, McIvor et al. 2012b). Surge reduction rates are even
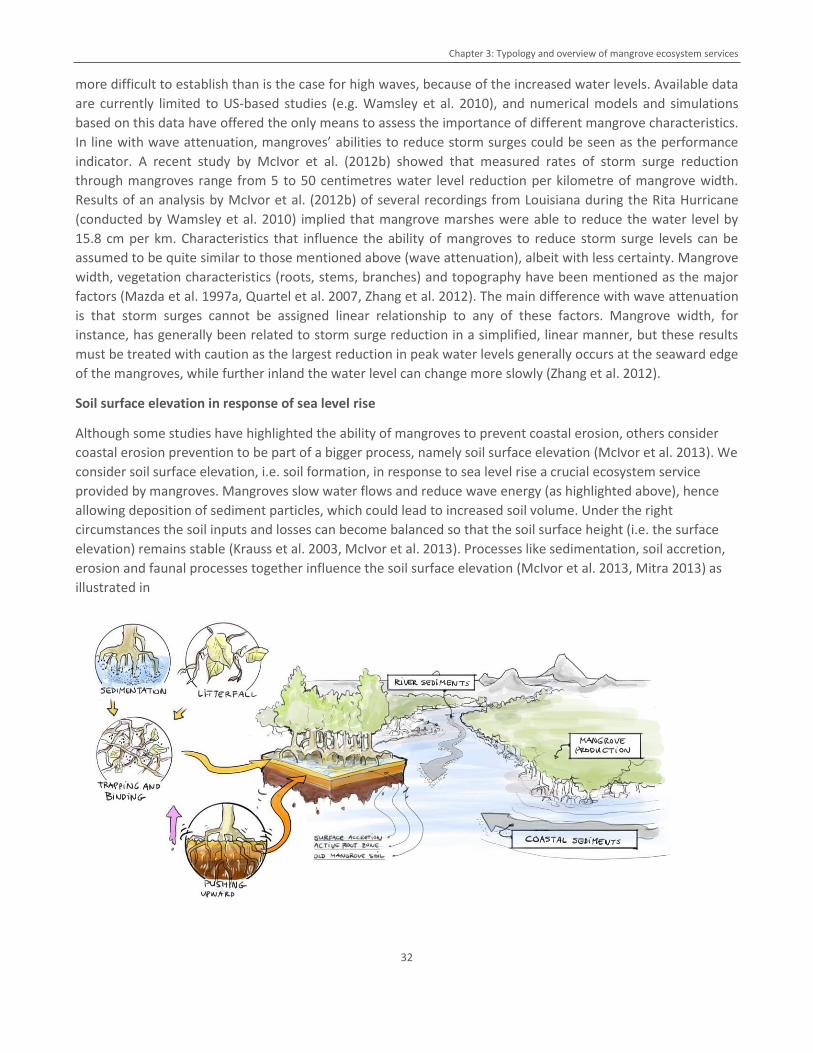
Chapter 3: Typology and overview of mangrove ecosystem services
32
more difficult to establish than is the case for high waves, because of the increased water levels. Available data
are currently limited to US-based studies (e.g. Wamsley et al. 2010), and numerical models and simulations
based on this data have offered the only means to assess the importance of different mangrove characteristics.
In line with wave attenuation, mangroves’ abilities to reduce storm surges could be seen as the performance
indicator. A recent study by McIvor et al. (2012b) showed that measured rates of storm surge reduction
through mangroves range from 5 to 50 centimetres water level reduction per kilometre of mangrove width.
Results of an analysis by McIvor et al. (2012b) of several recordings from Louisiana during the Rita Hurricane
(conducted by Wamsley et al. 2010) implied that mangrove marshes were able to reduce the water level by
15.8 cm per km. Characteristics that influence the ability of mangroves to reduce storm surge levels can be
assumed to be quite similar to those mentioned above (wave attenuation), albeit with less certainty. Mangrove
width, vegetation characteristics (roots, stems, branches) and topography have been mentioned as the major
factors (Mazda et al. 1997a, Quartel et al. 2007, Zhang et al. 2012). The main difference with wave attenuation
is that storm surges cannot be assigned linear relationship to any of these factors. Mangrove width, for
instance, has generally been related to storm surge reduction in a simplified, linear manner, but these results
must be treated with caution as the largest reduction in peak water levels generally occurs at the seaward edge
of the mangroves, while further inland the water level can change more slowly (Zhang et al. 2012).
Soil surface elevation in response of sea level rise
Although some studies have highlighted the ability of mangroves to prevent coastal erosion, others consider
coastal erosion prevention to be part of a bigger process, namely soil surface elevation (McIvor et al. 2013). We
consider soil surface elevation, i.e. soil formation, in response to sea level rise a crucial ecosystem service
provided by mangroves. Mangroves slow water flows and reduce wave energy (as highlighted above), hence
allowing deposition of sediment particles, which could lead to increased soil volume. Under the right
circumstances the soil inputs and losses can become balanced so that the soil surface height (i.e. the surface
elevation) remains stable (Krauss et al. 2003, McIvor et al. 2013). Processes like sedimentation, soil accretion,
erosion and faunal processes together influence the soil surface elevation (McIvor et al. 2013, Mitra 2013) as
illustrated in
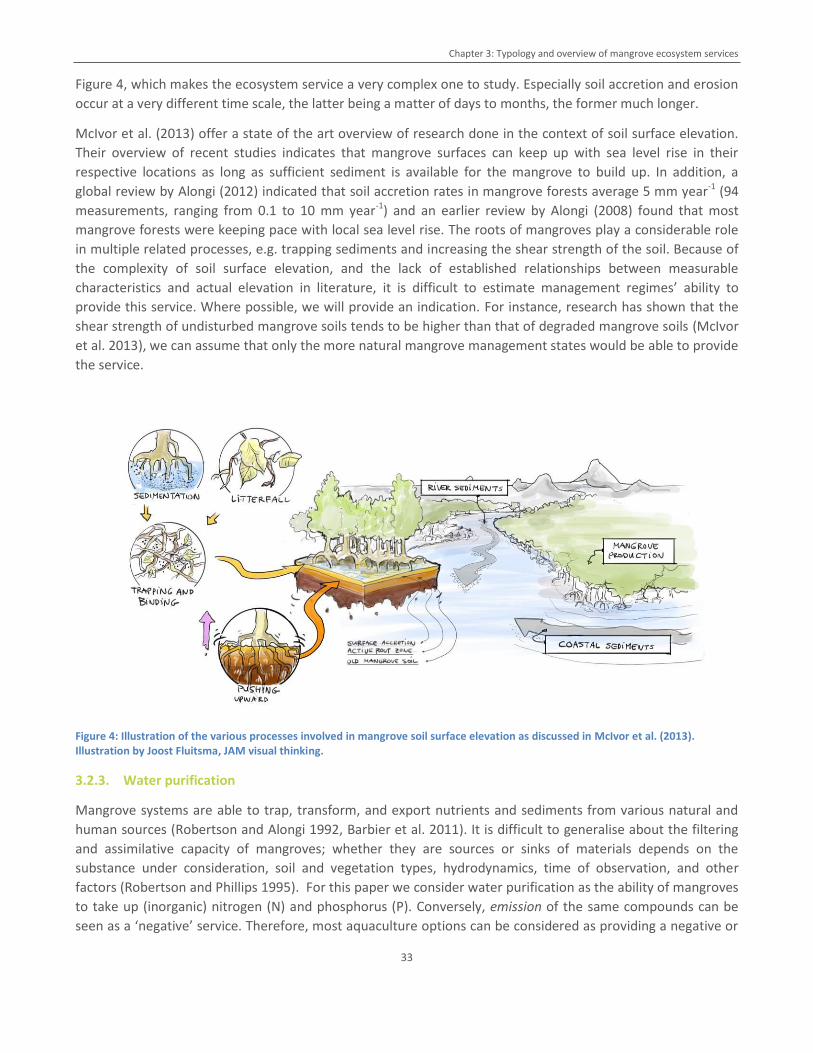
Chapter 3: Typology and overview of mangrove ecosystem services
33
Figure 4, which makes the ecosystem service a very complex one to study. Especially soil accretion and erosion
occur at a very different time scale, the latter being a matter of days to months, the former much longer.
McIvor et al. (2013) offer a state of the art overview of research done in the context of soil surface elevation.
Their overview of recent studies indicates that mangrove surfaces can keep up with sea level rise in their
respective locations as long as sufficient sediment is available for the mangrove to build up. In addition, a
global review by Alongi (2012) indicated that soil accretion rates in mangrove forests average 5 mm year-1 (94
measurements, ranging from 0.1 to 10 mm year-1) and an earlier review by Alongi (2008) found that most
mangrove forests were keeping pace with local sea level rise. The roots of mangroves play a considerable role
in multiple related processes, e.g. trapping sediments and increasing the shear strength of the soil. Because of
the complexity of soil surface elevation, and the lack of established relationships between measurable
characteristics and actual elevation in literature, it is difficult to estimate management regimes’ ability to
provide this service. Where possible, we will provide an indication. For instance, research has shown that the
shear strength of undisturbed mangrove soils tends to be higher than that of degraded mangrove soils (McIvor
et al. 2013), we can assume that only the more natural mangrove management states would be able to provide
the service.
Figure 4: Illustration of the various processes involved in mangrove soil surface elevation as discussed in McIvor et al. (2013). Illustration by Joost Fluitsma, JAM visual thinking.
3.2.3. Water purification
Mangrove systems are able to trap, transform, and export nutrients and sediments from various natural and
human sources (Robertson and Alongi 1992, Barbier et al. 2011). It is difficult to generalise about the filtering
and assimilative capacity of mangroves; whether they are sources or sinks of materials depends on the
substance under consideration, soil and vegetation types, hydrodynamics, time of observation, and other
factors (Robertson and Phillips 1995). For this paper we consider water purification as the ability of mangroves
to take up (inorganic) nitrogen (N) and phosphorus (P). Conversely, emission of the same compounds can be
seen as a ‘negative’ service. Therefore, most aquaculture options can be considered as providing a negative or
Chapter 3: Typology and overview of mangrove ecosystem services
34
‘disservice’. Emission of N and P is often indicated in mg L-1 or mg ha-1 yr-1. As with many regulating services,
distinguishing between actual and potential service provision is difficult for water purification; actual uptake or
removal of nutrients from the system can be seen as a performance indicator, whereas the potential removal
or uptake can be seen as a state indicator.
Uptake of the compounds is mostly measured in kg per ha of mangrove per year. Without mangroves to filter,
waste laden pond effluent water from aquaculture often has to be reused causing self-pollution (Rönnbäck
1999) in the farm system itself, but also affecting remaining mangroves and other habitats, which are often
important for local communities. We focus on the removal of N and P because of the relevance for aquaculture
and fishery and because these compounds have been most extensively studied. Generally speaking, mangrove
ecosystems deal with excess nutrients and pollutants in three ways, namely through 1) absorbing the
pollutants and storing them in its roots, stems and leaves (nutrients such as N and P, and heavy metals), 2)
improving sedimentation of suspended materials in the water between and around the roots (heavy metals, P,
suspended solids), and 3) indirectly, by providing a habitat for waste decomposing (micro-)organisms (i.e. for
denitrification) (Li et al. 2008). In this paper we focus on the first two processes. We note that the complete
nutrient cycle in mangroves is more complicated, and the uptake of excess nutrients (i.e. water purification) is
only a part of this cycle. We refer to Twilley and Day (1999) for more information on nutrient cycles related to
mangrove ecosystems. By focussing on excess nutrient removal we tackle mangrove ecosystems’ crucial
services, because of continuously high emissions by aquaculture ponds.
First, the ability of mangrove roots, stems and leaves to “remove” nutrients has been mostly linked to
mangroves’ (maximum) requirements to support net primary productivity, i.e. how much kg ha-1 yr-1of N and P
do mangrove forest require for their productivity. Conservative estimates indicate that Rhizophora-dominated
forests require an average of 219 (N) and 20 (P) kg ha-1 yr-1, taking into account litterfall, wood accumulation
and root production (Robertson and Phillips 1995). Despite the fact that these estimations are conservative, it
is important to note that mangrove forests can only be used as nutrient filters if sufficient mangrove area is
present and if nutrients are retained or recycled within sediments or removed through biomass harvesting.
Mangrove productivity furthermore depends on forest structure as well as species- and age-specific
photosynthesis and evapotranspiration rates (Li et al. 2008).
Second, mangrove soils also play an important role for the uptake of N and P. Reactive P can be immobilised in
sediments, depending on clay mineralogy, iron content and redox status (Robertson and Phillips 1995, Li et al.
2008). The extent to which nitrogen is taken up by sediments is discussed in Robertson and Phillips (1995).
Despite the fact that most of the above mentioned relations and factors have not been extensively quantified,
it can be stated that key factors for water purification include water salinity, water flow speed, plant density
and structure (all related to retention time – higher retention time increases N and P fixation), nutrient input
(lower with high input), health of mangrove system and opportunity for continuous nutrient uptake (extent of
mangrove area, opportunity for harvesting, retention or recycling). Moreover, especially P uptake requires
undisturbed sediments.
3.3. Habitat services
This category of ecosystem services deals with both the benefits of different aspects of biodiversity to humans
as well as the benefits to biodiversity maintenance itself. Habitat services include the nursery service and
maintenance of genetic diversity. The nursery service, on which we will focus throughout this paper, deals with
the supporting role of ecosystems for breeding and nesting ground, feeding and protective habitat for juvenile
stages of the life cycles or resting or feeding habitat for migratory animal species. Some of these species have a
Chapter 3: Typology and overview of mangrove ecosystem services
35
commercial or conservation-related role (e.g. medicinal plants, shrimps or characteristic species like the orang-
utan), and it is to those species that most attention is generally directed.
However, ecosystems are also crucial for the maintenance of biodiversity itself, which is the focus of the
second habitat service ‘maintenance of genetic diversity’, or gene-pool protection (TEEB 2010a). The role of
biodiversity in relation to ecosystem services has been debated heavily (c.f. Schröter et al. 2014), and currently
biodiversity is seen as a regulator of ecosystem processes, contributor to the potential of ecosystem services,
and as an ecosystem service itself (Mace et al. 2012). Reyers et al. (2010) described how all other ecosystem
services are underpinned by biodiversity in the second chapter of the TEEB report. We will not include the
service ‘maintenance of genetic diversity’ in the remainder of the paper, as we consider the underpinning
function of biodiversity for the studied ecosystem services of primary importance, such as for the provision of
water purification, carbon sequestration and nature-based recreation. In the context of Java’s or Indonesia’s
mangroves, we point out that many endemic and unique animal and plant species occur, and as such we
should consider the natural mangrove areas as hotspots or ‘gene banks’ of genetic diversity. Ilman et al. (2011)
reviewed that several studies together mention at least 200 plant species living in mangrove ecosystems. Of
these, 43 species are categorised as true mangroves, while the others are mangrove associates. In addition, 14
of the mangrove species are categorised as rare in Indonesia and/or globally. Animal species of interest in Java
include water birds, proboscis monkeys, mangrove cat and several reptiles and amphibians living in the
substrate.
Mangroves are known to support fishery (around mangroves and on sea) as well as aquaculture by providing a
breeding and nursery ground or living habitat to various fish and crustaceans (Rönnbäck 1999, Walters et al.
2008). In Indonesia, the role of mangrove as nursery grounds is mainly seen as supporting local coastal and
offshore fisheries and providing shrimp larvae for the aquaculture industry (Ilman et al. 2011). The term
nursery implies that a habitat enhances the density, survival and growth of juveniles, as well as movement to
adult habitats (Sheridan and Hays 2003). As a result, mangroves can be considered nursery grounds for given
species if their contribution to the production of juveniles that are recruited to adults’ population is larger than
that of other habitats (Baran and Hambrey 1999, Sheridan and Hays 2003). This can be in the form of shelter,
food and refuge, which increases growth, production and spawning opportunities (Walters et al. 2008).
The nursery service has considerable linkages and overlaps with the food service (3.1.1), in the sense that
fishery numbers are to some extent the result of nursery habitats provided by mangroves and other
ecosystems. However, this relationship is a complicated one, due to several factors (Sheridan and Hays 2003).
One factor is that mangroves, sea-grass beds, un-vegetated shallows, and coral reefs generally form integrated
ecosystems of high productivity (Rönnbäck 1999), so often the contribution of mangroves is strongly
dependent on or smaller than that of other habitats. Another issue is that fish species and crustaceans can be
classified into different ‘user-types’ of the mangrove ecosystem: permanent (entire lifecycle), temporary (at
least one stage of life cycle) and short-term residents (Walters et al. 2008). For instance, in their crucial early
life stages (larvae, juveniles), many fish and shellfish species utilize mangroves as nursery grounds, before
emigrating to other systems as adults (coastal shelves or deep sea). Because of these differences in
dependency and residence time, it is difficult to empirically prove the specific contribution mangrove area to
the species that are actually caught (Sheridan and Hays 2003).
The main indicators that have been used to assess the nursery service are the amount of fish or other species
caught or available per area of mangrove (Baran 1999, Pauly and Ingles 1999) or the relative contribution of an
area to a given harvest (Pauly and Ingles 1999, Rönnbäck et al. 2003). The former can be calculated with the
help of models. Examples include models by Yanez-Arancibia et al. (1985, developed in Mexico) and Sasekumar
Chapter 3: Typology and overview of mangrove ecosystem services
36
and Chong (1987, developed in Malaysia), which relate mangrove areas to catches of fish and shrimp,
respectively. Such simple models have often been calibrated for different study locations, by comparing
modelled results to actual harvest numbers. Pauly and Ingles (1999) established a relationship between the
log10 of intertidal vegetation (mainly mangroves) area and the log10 of maximum sustainable penaeid shrimp
yield in Indonesia. However, Pauly and Ingles (1999) argued together with Baran (1999) that the predictive
value of such models is very low, and that they merely serve to illustrate the fact that both mangroves and
aquatic species need the same conditions. Most importantly, such models fail to provide conclusive evidence
that mangrove cover would be the causal factor for shrimp or fish occurrence, unless they are calibrated based
on local data. Reviews by Sheridan and Hays (2003), and more recently by Engle (2011) showed that the
majority of nursery service studies failed to provide conclusive evidence. The studies either determined the
amount of fish available in a given mangrove area or the amount of fish closely located to these areas, and
compared these numbers to other areas. However, they rarely attempted to empirically relate the amount of
fish juveniles that are recruited in mangrove areas and the extent to which they mature into adults that can be
caught. Therefore, we use ‘fish and shrimp caught per area of mangrove’ as an indicator for food provision
(Section 3.1.1) and not nursery. Some quantitative information from fish landings near mangrove areas (see
also 3.1.1. and section 5 on food ecosystem service) can also be used as proxies for the nursery service. For
instance, an extensive review by Rönnbäck (1999) showed that fish standing stock in mangrove areas ranged
from 4 to 25 g m-2, which is much higher than adjacent coastal habitats. The subsequent review by Rönnbäck et
al. (2003) showed that this ratio between fish stock in mangrove areas compared to other habitats generally
amounted to 4 -10, with higher values also reported. The most reliable nursery service indicator would be the
fraction of juvenile species that depend mostly on the presence of mangrove areas and mature into adults that
can be caught. It is not surprising that few studies have managed to study this relationship, as it is difficult to
prove under natural circumstances that the caught species have truly grown up in the mangrove area close to
which they have been caught.
Nonetheless, many studies have provided useful qualitative indications and proxies for our analysis. Reliable
evidence for the potential of nursery service can be provided if certain qualitative factors are taken into
account. Nursery service potential can be provided if 1) ample nutrients are present as food source for
juveniles, as a result of nutrient trapping, tidal mixing and freshwater inflow; 2) refuge for juvenile fish and
shrimp is provided through turbidity and presence of roots, which reduce the perception distance of predators;
3) a diversity of spatial and trophic niches can be found, as a result of structural complexity, high biodiversity
and shallowness of estuarine habitats; 4) hydrodynamic cycles are found to retain immigrating larvae and
juveniles; and 5) pollution and other pressures are mitigated and hydrological cycles remained intact (Baran
1999, Rönnbäck 1999, Sheridan and Hays 2003, Walters et al. 2008). In other words, an ideal nursery ground is
mature, strongly embedded in estuarine systems, in pristine state, high in structural and biological diversity.
The degree of importance of these factors differs slightly for crustaceans compared to most fish species, which
will become apparent in section 5.
3.4. Cultural services
Cultural services embody a wide range of uses, traditions and beliefs that are closely connected to natural
ecosystems. We already highlighted that for many coastal communities, their traditional use of mangrove
resources is strongly connected with the health and functioning of the system. This use of and dependence on
natural resources is often intimately tied to local culture, heritage, and traditional knowledge (Walters et al.
2008). The variety within coastal ecosystems provides humans with many opportunities for aesthetic and
Chapter 3: Typology and overview of mangrove ecosystem services
37
recreational experiences, cultural and artistic inspiration, and spiritual and religious enrichment (Mastaller
1997, Rönnbäck et al. 2007).
We note that cultural services are generally difficult to quantify or map, as they are determined by the
appreciation and sentiments of local people. Since it is quite difficult to exactly pinpoint what local people find
truly important, inspirational or historically relevant, it is a challenge to specifically link this to coastal
management. Locations of special cultural interest could vary between one old tree, a field or even the entire
water body that communities live close to. In the light of mangrove management it should be noted that it is
therefore equally difficult to find out to what extent people attach cultural values to mangroves. This can only
be found out through personal interviews, of which results are mostly not applicable for generalisation. We will
deal with nature-based recreation in 3.4.1 and highlight the other cultural services combined in 3.4.2.
3.4.1. Nature-based recreation
Nature-based recreation is defined as recreational activities done that relate to natural elements or the
presence of nature in general. Recreation differs from tourism in the sense that tourists are assumed to spend
a night on location; tourists become recreationists the moments they take part in recreational activities
(Puustinen et al. 2009). Nature based recreation is strongly related to but not mutually interchangeable with
ecotourism, i.e. responsible travel to natural areas that conserves the environment and sustains the well-being
of local people (Gössling 1999, Wood 2002). Ecotourism therefore refers to a concept, defined by a set of
guiding principles (see Wood (2002) see for an overview), but also to a specific market segment. Nature-based
recreation refers to activities such as diving, birding, canoeing, etc., all of which could be done sustainably but
is not assumed to be so automatically. In the case of mangrove ecosystem services, the recreational activity
should be linked to the presence of mangroves for it to be classified as nature-based recreation. Construction
of tourist facilities such as hotels and other accommodation can be considered a proxy for recreational
activities, but not a direct indicator. Accommodation built close to mangrove forest can be seen as a clear sign
that recreation activities are taking place. Recreation and tourism have both negative and positive effects on
coastal environments. They can stimulate protection of areas with natural and/or cultural importance, and
create employment opportunities for coastal communities. However, often large-scale recreation activities and
tourist facilities’ construction led to fragmentation and degradation of coastal ecosystems, such as sea grass
communities, coral reefs and mangroves. For example, large hotel development on beach fronts, as is the case
in Bali, has resulted in large-scale coastal erosion and damaged mangrove vegetation (Knight et al. 1997).
Recreation is strongly linked to another cultural service, namely aesthetic appreciation. For instance, Kaplowitz
(2001) found strong links between aesthetic appreciation of mangroves and recreation in Mexico, and
Rönnbäck et al. (2007) did the same in the Philippines. Examples in Indonesia are quite scarce, which is mainly
due to the fact that management for purposes of recreation and tourism has not been well developed yet by
governments, local community, or the private sector (Ilman et al. 2011). This highlights the first and foremost
requirement for recreation; it needs to be facilitated by local governance and planning, by making locations
accessible (roads, bridges, parking place, entrance), creating awareness of potential users (advertisement,
communication), etc. (Satyanarayana et al. 2012). All this requires coordination, funding, competence and
personnel. The few examples of mangrove areas that have been developed and managed as a tourist venue are
listed by Ilman et al. (2011), some of which are mentioned in Chapter 5.
Nature-based recreation is still largely seen as a demand-driven ecosystem service because, in addition to the
above mentioned access and awareness of users, it also depends on the presence of natural areas, biodiversity,
animal species, etc. (Boon et al. 2002, Puustinen et al. 2009). There have been no studies on nature value
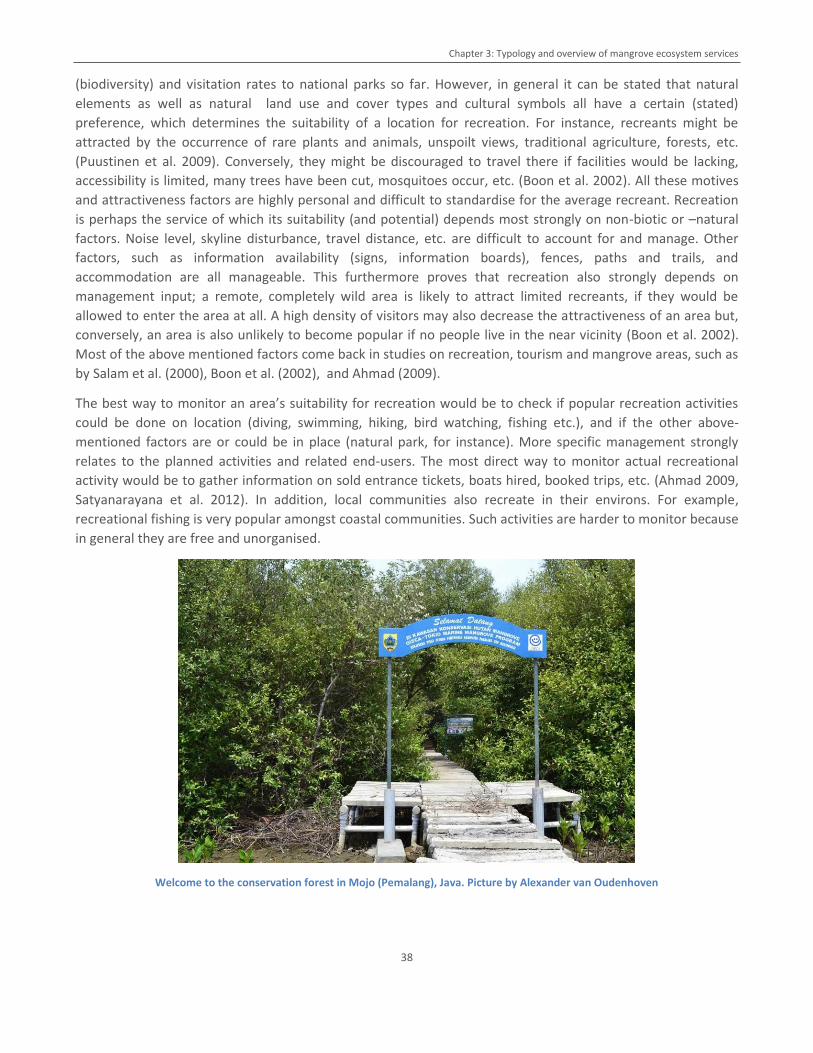
Chapter 3: Typology and overview of mangrove ecosystem services
38
(biodiversity) and visitation rates to national parks so far. However, in general it can be stated that natural
elements as well as natural land use and cover types and cultural symbols all have a certain (stated)
preference, which determines the suitability of a location for recreation. For instance, recreants might be
attracted by the occurrence of rare plants and animals, unspoilt views, traditional agriculture, forests, etc.
(Puustinen et al. 2009). Conversely, they might be discouraged to travel there if facilities would be lacking,
accessibility is limited, many trees have been cut, mosquitoes occur, etc. (Boon et al. 2002). All these motives
and attractiveness factors are highly personal and difficult to standardise for the average recreant. Recreation
is perhaps the service of which its suitability (and potential) depends most strongly on non-biotic or –natural
factors. Noise level, skyline disturbance, travel distance, etc. are difficult to account for and manage. Other
factors, such as information availability (signs, information boards), fences, paths and trails, and
accommodation are all manageable. This furthermore proves that recreation also strongly depends on
management input; a remote, completely wild area is likely to attract limited recreants, if they would be
allowed to enter the area at all. A high density of visitors may also decrease the attractiveness of an area but,
conversely, an area is also unlikely to become popular if no people live in the near vicinity (Boon et al. 2002).
Most of the above mentioned factors come back in studies on recreation, tourism and mangrove areas, such as
by Salam et al. (2000), Boon et al. (2002), and Ahmad (2009).
The best way to monitor an area’s suitability for recreation would be to check if popular recreation activities
could be done on location (diving, swimming, hiking, bird watching, fishing etc.), and if the other above-
mentioned factors are or could be in place (natural park, for instance). More specific management strongly
relates to the planned activities and related end-users. The most direct way to monitor actual recreational
activity would be to gather information on sold entrance tickets, boats hired, booked trips, etc. (Ahmad 2009,
Satyanarayana et al. 2012). In addition, local communities also recreate in their environs. For example,
recreational fishing is very popular amongst coastal communities. Such activities are harder to monitor because
in general they are free and unorganised.
Welcome to the conservation forest in Mojo (Pemalang), Java. Picture by Alexander van Oudenhoven
Chapter 3: Typology and overview of mangrove ecosystem services
39
3.4.2. Other cultural services
Other cultural services than recreation and tourism are generally more enjoyed by local coastal communities.
These services include inspiration for culture, spiritual experience, aesthetic appreciation and information for
cognitive development. The Asmat in Irian Jaya, Indonesia, are an example of people who have largely
preserved their traditions and beliefs (Mastaller 1997), which are strongly related to the mangrove ecosystem.
Such examples are becoming increasingly rare due to urbanisation and loss of natural area. Although literature
acknowledges the importance of cultural services (e.g. Mastaller 1997, Kaplowitz 2001, Rönnbäck et al. 2007),
actual research on the topic has been very limited and are in general qualitative studies with local importance.
Perhaps the best-known service would be information for cognitive development, which can be more easily
monitored than other cultural services, for instance through tracking education facilities and knowledge
exchange. Generally, education and information facilities are more abundant than recreation accommodation
in Indonesia, which is a result of large-scale NGO activity. Most accommodations for visitors have been
constructed with the aim to educate or facilitate research and recreational activities are an added benefit.
Examples can be seen at the Mangrove Information Centre (Bali), the Environmental Education Centre (PPLH)
at Puntondo South Sulawesi, and the Lebah Foundation Mangrove Research Centre in Aceh (Ilman et al. 2011).
Chapter 4: Typology of mangrove management regimes in Java, Indonesia
40
4. Typology of mangrove management regimes in Java, Indonesia
In this chapter we present and discuss the developed typology of mangrove management regimes. Our
typology should be applicable to (former) mangrove ecosystems in the context of Javanese policy and
management practices, and account for different intensities of management. Consequently, the typology will
indicate which management activities occur simultaneously and to which (desired) state they would lead.
We aimed to identify a typology of management regimes that can paint a realistic picture of the current status
of mangrove areas in Java, Indonesia. The typology is consistent with local and international scientific literature
as well as Indonesian policy documents. Although many studies have acknowledged the importance of
management for the provision of ecosystem services (Bosire et al. 2008, De Groot et al. 2010b), the terms
management or management regime have rarely been defined or consistently used. Studies that focused on,
what authors call, ‘management’ and ecosystem services actually deal with issues ranging from spatial
planning, governance, organisation of land use, or specific land use techniques.
This typology enables decision-makers, planners, managers and practitioners to explore the crucial elements of
optimal coastal/mangrove management, by considering which management purpose will result in the provision
of which bundle of ecosystem services. It also enables researchers to systematically analyse current land use
and cover change and its’ consequences. We distinguish 11 specific management regimes, which have been
divided into five main categories (Table 4). The five categories are (in order of increasing land-use intensity):
natural, low intensity use, high intensity use, converted and abandoned mangroves. The management regimes
are determined by the management activities that take place, and their impact can be assessed through
ecological and biophysical characteristics, the management state, which have been quantified as measurable
indicators (as described in section 2.2).
We note that a typical coastal area generally hosts a diversity of management regimes (for definitions please
see section 1.3). For instance, intensive aquaculture sites can be partly surrounded or shielded by a greenbelt
of replanted or remaining natural mangrove areas, just as areas with silvo-fisheries can be near intensive
aquaculture ponds. A management regime should therefore not be regarded as a description of an entire
coastal area, but rather as a component that shapes the land cover in combination with other management
regimes. We furthermore acknowledge that policy in Indonesia is quite unpredictable and continuously subject
to change. We therefore advise the reader to also consult the report by Sualia et al. (2013) on policy
regulations relating to sustainable shrimp aquaculture in Indonesia, as it provides a more complete overview of
relevant regulations.
The typology of management regimes is shown in Table 4, which provides an overview of the 5 main categories
as well as a short description of the management context and specific management activities per management
regime. We note that the management activities listed in Table 4 are based on interpretations of policy
documents and literature, and could differ from reality on the ground from case to case. We furthermore
acknowledge the potential impacts of illegal activities, such as trespassing, fishing, timber harvesting, etc. but
we still use policy regulations as the framework of our typology because it provides the most consistent and
reliable context for the management regimes.
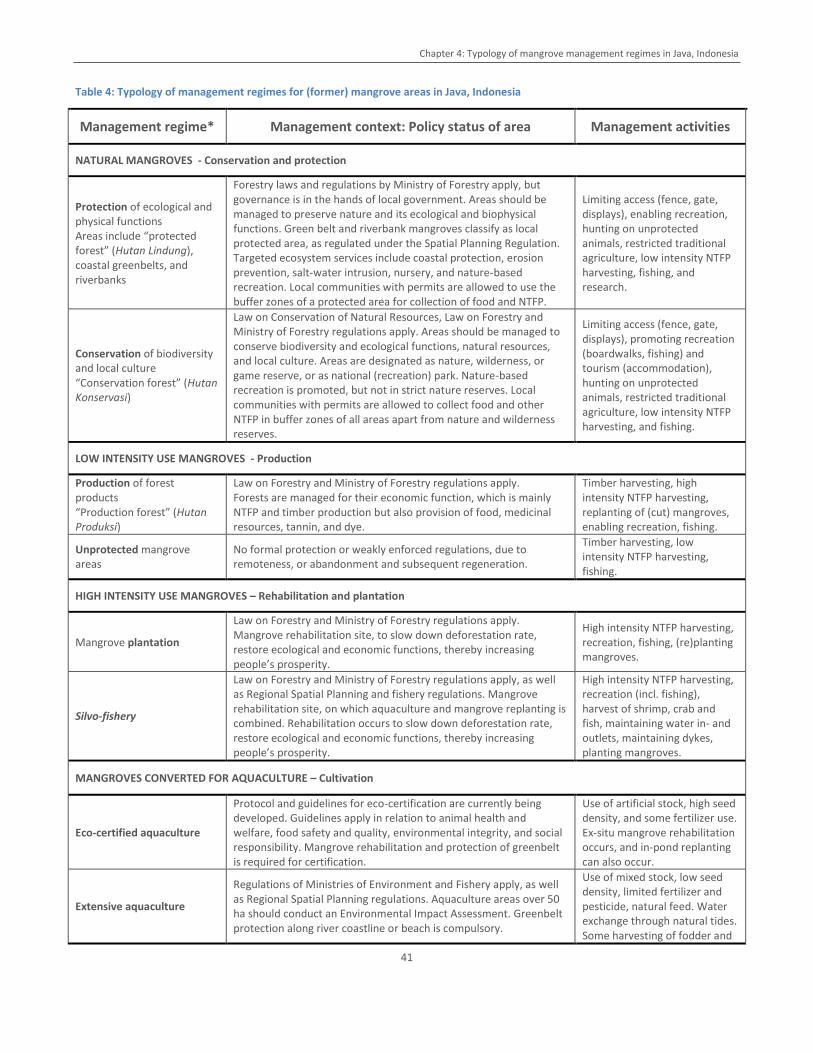
Chapter 4: Typology of mangrove management regimes in Java, Indonesia
41
Table 4: Typology of management regimes for (former) mangrove areas in Java, Indonesia
Management regime* Management context: Policy status of area Management activities
NATURAL MANGROVES - Conservation and protection
Protection of ecological and physical functions Areas include “protected forest” (Hutan Lindung), coastal greenbelts, and riverbanks
Forestry laws and regulations by Ministry of Forestry apply, but governance is in the hands of local government. Areas should be managed to preserve nature and its ecological and biophysical functions. Green belt and riverbank mangroves classify as local protected area, as regulated under the Spatial Planning Regulation. Targeted ecosystem services include coastal protection, erosion prevention, salt-water intrusion, nursery, and nature-based recreation. Local communities with permits are allowed to use the buffer zones of a protected area for collection of food and NTFP.
Limiting access (fence, gate, displays), enabling recreation, hunting on unprotected animals, restricted traditional agriculture, low intensity NTFP harvesting, fishing, and research.
Conservation of biodiversity and local culture “Conservation forest” (Hutan Konservasi)
Law on Conservation of Natural Resources, Law on Forestry and Ministry of Forestry regulations apply. Areas should be managed to conserve biodiversity and ecological functions, natural resources, and local culture. Areas are designated as nature, wilderness, or game reserve, or as national (recreation) park. Nature-based recreation is promoted, but not in strict nature reserves. Local communities with permits are allowed to collect food and other NTFP in buffer zones of all areas apart from nature and wilderness reserves.
Limiting access (fence, gate, displays), promoting recreation (boardwalks, fishing) and tourism (accommodation), hunting on unprotected animals, restricted traditional agriculture, low intensity NTFP harvesting, and fishing.
LOW INTENSITY USE MANGROVES - Production
Production of forest products “Production forest” (Hutan Produksi)
Law on Forestry and Ministry of Forestry regulations apply. Forests are managed for their economic function, which is mainly NTFP and timber production but also provision of food, medicinal resources, tannin, and dye.
Timber harvesting, high intensity NTFP harvesting, replanting of (cut) mangroves, enabling recreation, fishing.
Unprotected mangrove areas
No formal protection or weakly enforced regulations, due to remoteness, or abandonment and subsequent regeneration.
Timber harvesting, low intensity NTFP harvesting, fishing.
HIGH INTENSITY USE MANGROVES – Rehabilitation and plantation
Mangrove plantation
Law on Forestry and Ministry of Forestry regulations apply. Mangrove rehabilitation site, to slow down deforestation rate, restore ecological and economic functions, thereby increasing people’s prosperity.
High intensity NTFP harvesting, recreation, fishing, (re)planting mangroves.
Silvo-fishery
Law on Forestry and Ministry of Forestry regulations apply, as well as Regional Spatial Planning and fishery regulations. Mangrove rehabilitation site, on which aquaculture and mangrove replanting is combined. Rehabilitation occurs to slow down deforestation rate, restore ecological and economic functions, thereby increasing people’s prosperity.
High intensity NTFP harvesting, recreation (incl. fishing), harvest of shrimp, crab and fish, maintaining water in- and outlets, maintaining dykes, planting mangroves.
MANGROVES CONVERTED FOR AQUACULTURE – Cultivation
Eco-certified aquaculture
Protocol and guidelines for eco-certification are currently being developed. Guidelines apply in relation to animal health and welfare, food safety and quality, environmental integrity, and social responsibility. Mangrove rehabilitation and protection of greenbelt is required for certification.
Use of artificial stock, high seed density, and some fertilizer use. Ex-situ mangrove rehabilitation occurs, and in-pond replanting can also occur.
Extensive aquaculture
Regulations of Ministries of Environment and Fishery apply, as well as Regional Spatial Planning regulations. Aquaculture areas over 50 ha should conduct an Environmental Impact Assessment. Greenbelt protection along river coastline or beach is compulsory.
Use of mixed stock, low seed density, limited fertilizer and pesticide, natural feed. Water exchange through natural tides. Some harvesting of fodder and
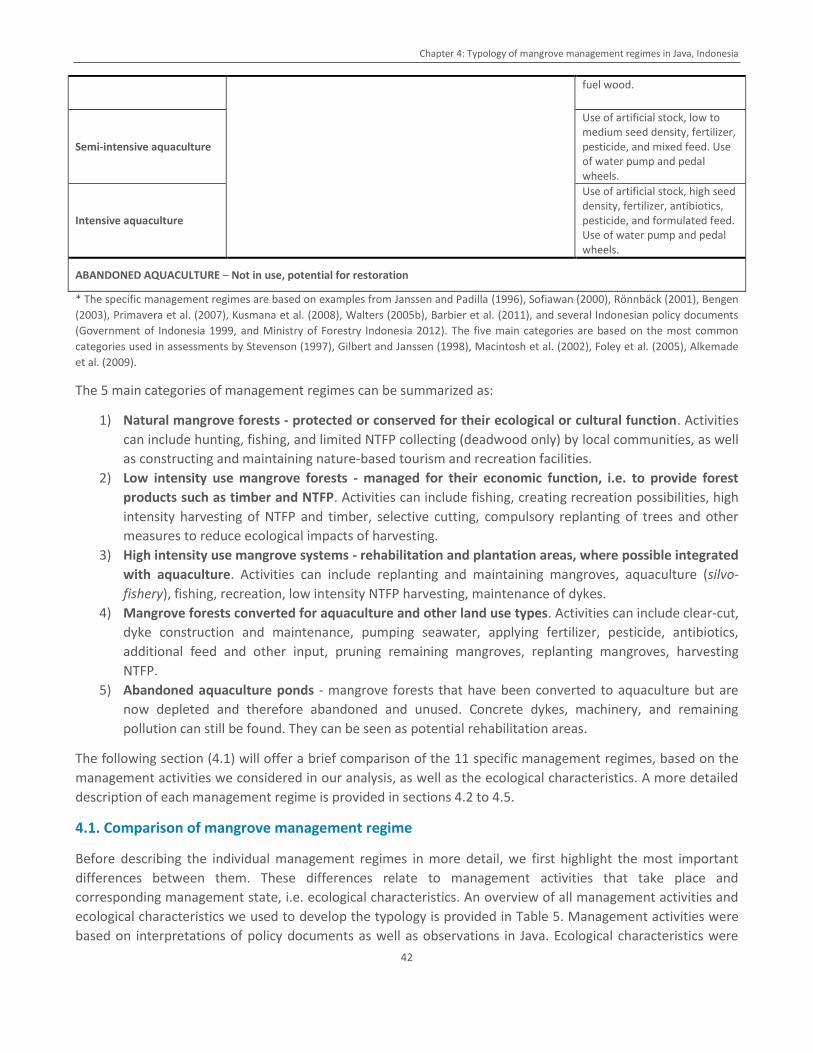
Chapter 4: Typology of mangrove management regimes in Java, Indonesia
42
fuel wood.
Semi-intensive aquaculture
Use of artificial stock, low to medium seed density, fertilizer, pesticide, and mixed feed. Use of water pump and pedal wheels.
Intensive aquaculture
Use of artificial stock, high seed density, fertilizer, antibiotics, pesticide, and formulated feed. Use of water pump and pedal wheels.
ABANDONED AQUACULTURE – Not in use, potential for restoration
* The specific management regimes are based on examples from Janssen and Padilla (1996), Sofiawan (2000), Rönnbäck (2001), Bengen
(2003), Primavera et al. (2007), Kusmana et al. (2008), Walters (2005b), Barbier et al. (2011), and several Indonesian policy documents
(Government of Indonesia 1999, and Ministry of Forestry Indonesia 2012). The five main categories are based on the most common
categories used in assessments by Stevenson (1997), Gilbert and Janssen (1998), Macintosh et al. (2002), Foley et al. (2005), Alkemade
et al. (2009).
The 5 main categories of management regimes can be summarized as:
1) Natural mangrove forests - protected or conserved for their ecological or cultural function. Activities
can include hunting, fishing, and limited NTFP collecting (deadwood only) by local communities, as well
as constructing and maintaining nature-based tourism and recreation facilities.
2) Low intensity use mangrove forests - managed for their economic function, i.e. to provide forest
products such as timber and NTFP. Activities can include fishing, creating recreation possibilities, high
intensity harvesting of NTFP and timber, selective cutting, compulsory replanting of trees and other
measures to reduce ecological impacts of harvesting.
3) High intensity use mangrove systems - rehabilitation and plantation areas, where possible integrated
with aquaculture. Activities can include replanting and maintaining mangroves, aquaculture (silvo-
fishery), fishing, recreation, low intensity NTFP harvesting, maintenance of dykes.
4) Mangrove forests converted for aquaculture and other land use types. Activities can include clear-cut,
dyke construction and maintenance, pumping seawater, applying fertilizer, pesticide, antibiotics,
additional feed and other input, pruning remaining mangroves, replanting mangroves, harvesting
NTFP.
5) Abandoned aquaculture ponds - mangrove forests that have been converted to aquaculture but are
now depleted and therefore abandoned and unused. Concrete dykes, machinery, and remaining
pollution can still be found. They can be seen as potential rehabilitation areas.
The following section (4.1) will offer a brief comparison of the 11 specific management regimes, based on the
management activities we considered in our analysis, as well as the ecological characteristics. A more detailed
description of each management regime is provided in sections 4.2 to 4.5.
4.1. Comparison of mangrove management regime
Before describing the individual management regimes in more detail, we first highlight the most important
differences between them. These differences relate to management activities that take place and
corresponding management state, i.e. ecological characteristics. An overview of all management activities and
ecological characteristics we used to develop the typology is provided in Table 5. Management activities were
based on interpretations of policy documents as well as observations in Java. Ecological characteristics were
Chapter 4: Typology of mangrove management regimes in Java, Indonesia
43
based on literature review combined with field measurements. We also found additional ecological
characteristics (undergrowth, number of seedlings) and biophysical characteristics (substrate type,
temperature), but these were not included in Table 5. A complete overview of all information per management
regime can be found in Appendix 1. For more details on the methods see Chapter 2.
Based on our literature review we found that the most frequently occurring activities that take place in natural,
production and rehabilitation mangrove ecosystems include recreation, fishing, and NTFP harvesting. All of
these are to a certain extent allowed in each management regime, although a higher intensity NTFP harvesting
is allowed in production mangroves. This means that local people (with permits) are allowed to cut wood and
other NTFP from mangrove trees (i.e. ‘utilization’), whereas low intensity NTFP harvesting is limited to
collecting deadwood and other materials without affecting the condition of the vegetation (‘gathering’). Fishing
generally occurs around mangrove areas, and takes place at the same high intensity regardless of the
management status of an area. Recreation by tourists takes place in all management regimes with mangrove
cover, but is more strongly promoted in conservation forests. Most conservation forests (five out of the six
types that exist) have the specific function of providing (limited) nature-based tourism, which means that
infrastructure and recreation facilities are generally in place to support this function.
As shown in Table 5, starting from protection forests, all ecological characteristics slowly decrease in value,
with the starkest drops occurring in average d.b.h. and maximum age of mangrove trees. Maximum height,
perimeter and root length drop in correspondence with the age of oldest mangrove trees.
The main difference between silvo-fisheries and plantations is the occurrence of aquaculture ponds in the
former. Despite that the ecological characteristics do not differ much between them. The amount of mangrove
cover is of course different between the two rehabilitation options, due to the occurrence of ponds in silvo-
fisheries. Mangrove areas that have been converted to aquaculture ponds can be separated based on inputs
and pond size. In extensive aquaculture and semi-intensive ponds we can still find some mangrove trees,
generally replanted, young and with little to no growth of roots. Further differences between aquaculture
options are described in section 4.5.
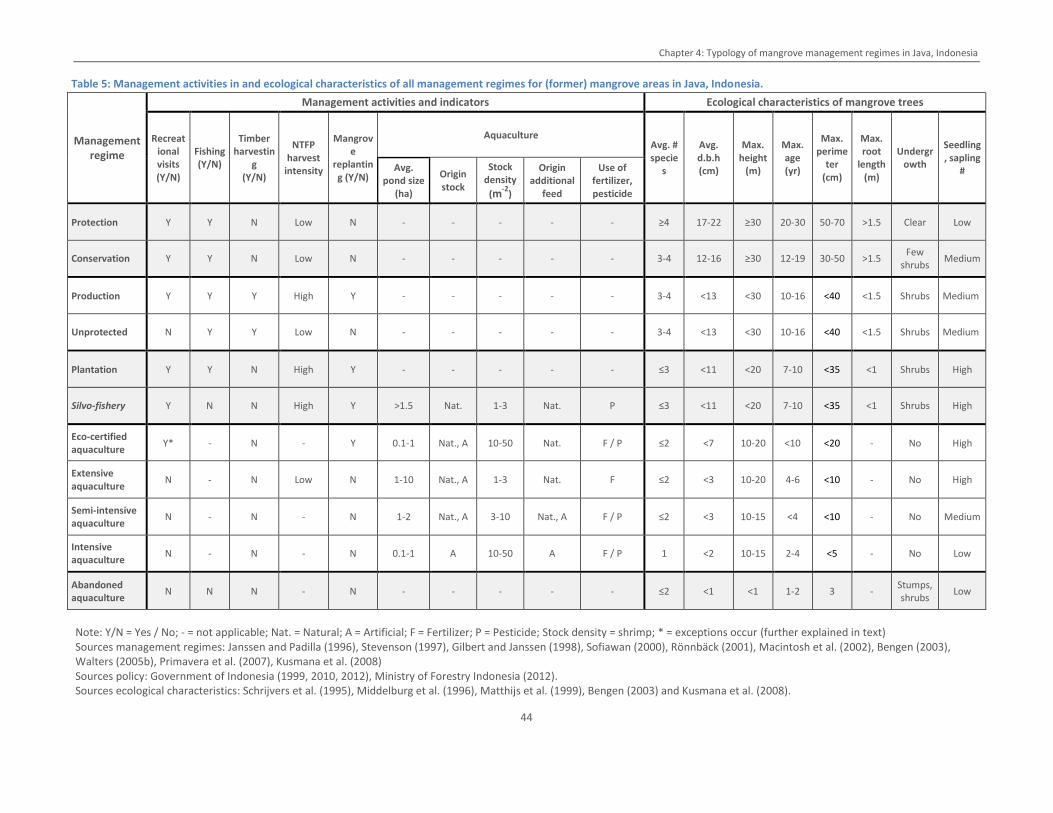
Chapter 4: Typology of mangrove management regimes in Java, Indonesia
44
Table 5: Management activities in and ecological characteristics of all management regimes for (former) mangrove areas in Java, Indonesia.
Management regime
Management activities and indicators Ecological characteristics of mangrove trees
Recreational visits (Y/N)
Fishing (Y/N)
Timber harvestin
g (Y/N)
NTFP harvest
intensity
Mangrove
replanting (Y/N)
Aquaculture Avg. # specie
s
Avg. d.b.h (cm)
Max. height
(m)
Max. age (yr)
Max. perime
ter (cm)
Max. root
length (m)
Undergrowth
Seedling, sapling
# Avg. pond size
(ha)
Origin stock
Stock density
(m-2
)
Origin additional
feed
Use of fertilizer, pesticide
Protection Y Y N Low N - - - - - ≥4 17-22 ≥30 20-30 50-70 >1.5 Clear Low
Conservation Y Y N Low N - - - - - 3-4 12-16 ≥30 12-19 30-50 >1.5 Few
shrubs Medium
Production Y Y Y High Y - - - - - 3-4 <13 <30 10-16 <40 <1.5 Shrubs Medium
Unprotected N Y Y Low N - - - - - 3-4 <13 <30 10-16 <40 <1.5 Shrubs Medium
Plantation Y Y N High Y - - - - - ≤3 <11 <20 7-10 <35 <1 Shrubs High
Silvo-fishery Y N N High Y >1.5 Nat. 1-3 Nat. P ≤3 <11 <20 7-10 <35 <1 Shrubs High
Eco-certified aquaculture
Y* - N - Y 0.1-1 Nat., A 10-50 Nat. F / P ≤2 <7 10-20 <10 <20 - No High
Extensive aquaculture
N - N Low N 1-10 Nat., A 1-3 Nat. F ≤2 <3 10-20 4-6 <10 - No High
Semi-intensive aquaculture
N - N - N 1-2 Nat., A 3-10 Nat., A F / P ≤2 <3 10-15 <4 <10 - No Medium
Intensive aquaculture
N - N - N 0.1-1 A 10-50 A F / P 1 <2 10-15 2-4 <5 - No Low
Abandoned aquaculture
N N N - N - - - - - ≤2 <1 <1 1-2 3 - Stumps, shrubs
Low
Note: Y/N = Yes / No; - = not applicable; Nat. = Natural; A = Artificial; F = Fertilizer; P = Pesticide; Stock density = shrimp; * = exceptions occur (further explained in text) Sources management regimes: Janssen and Padilla (1996), Stevenson (1997), Gilbert and Janssen (1998), Sofiawan (2000), Rönnbäck (2001), Macintosh et al. (2002), Bengen (2003), Walters (2005b), Primavera et al. (2007), Kusmana et al. (2008) Sources policy: Government of Indonesia (1999, 2010, 2012), Ministry of Forestry Indonesia (2012). Sources ecological characteristics: Schrijvers et al. (1995), Middelburg et al. (1996), Matthijs et al. (1999), Bengen (2003) and Kusmana et al. (2008).
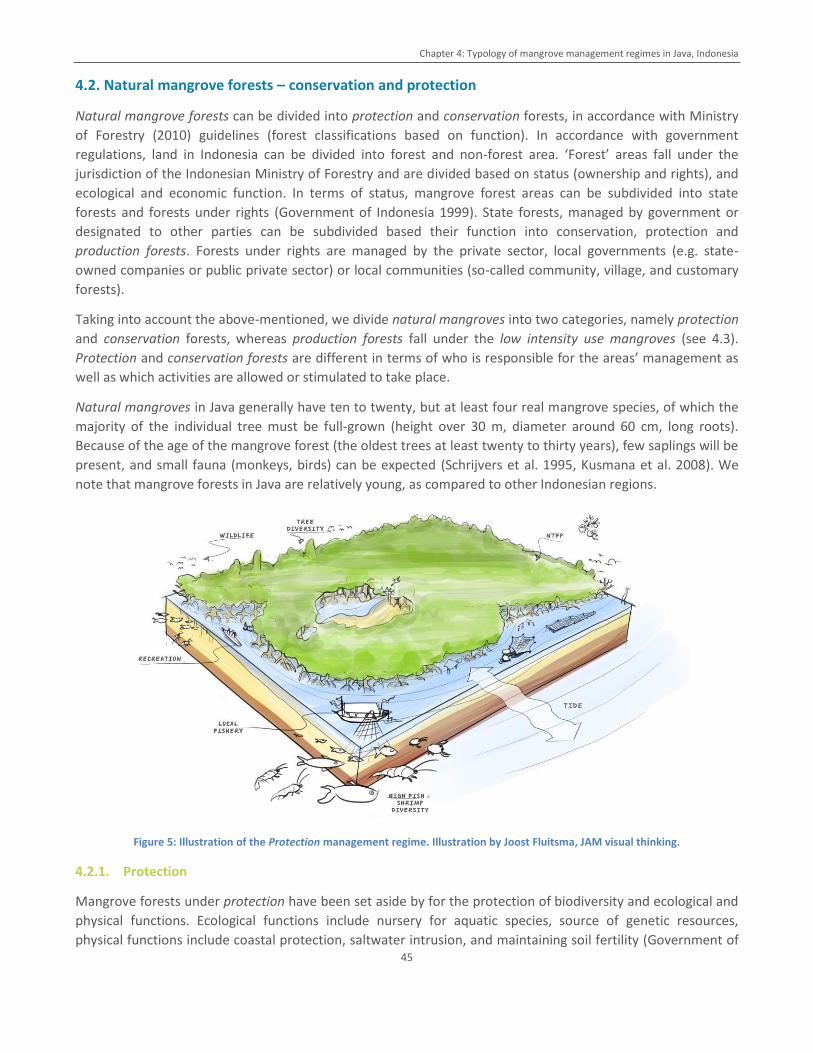
Chapter 4: Typology of mangrove management regimes in Java, Indonesia
45
4.2. Natural mangrove forests – conservation and protection
Natural mangrove forests can be divided into protection and conservation forests, in accordance with Ministry
of Forestry (2010) guidelines (forest classifications based on function). In accordance with government
regulations, land in Indonesia can be divided into forest and non-forest area. ‘Forest’ areas fall under the
jurisdiction of the Indonesian Ministry of Forestry and are divided based on status (ownership and rights), and
ecological and economic function. In terms of status, mangrove forest areas can be subdivided into state
forests and forests under rights (Government of Indonesia 1999). State forests, managed by government or
designated to other parties can be subdivided based their function into conservation, protection and
production forests. Forests under rights are managed by the private sector, local governments (e.g. state-
owned companies or public private sector) or local communities (so-called community, village, and customary
forests).
Taking into account the above-mentioned, we divide natural mangroves into two categories, namely protection
and conservation forests, whereas production forests fall under the low intensity use mangroves (see 4.3).
Protection and conservation forests are different in terms of who is responsible for the areas’ management as
well as which activities are allowed or stimulated to take place.
Natural mangroves in Java generally have ten to twenty, but at least four real mangrove species, of which the
majority of the individual tree must be full-grown (height over 30 m, diameter around 60 cm, long roots).
Because of the age of the mangrove forest (the oldest trees at least twenty to thirty years), few saplings will be
present, and small fauna (monkeys, birds) can be expected (Schrijvers et al. 1995, Kusmana et al. 2008). We
note that mangrove forests in Java are relatively young, as compared to other Indonesian regions.
Figure 5: Illustration of the Protection management regime. Illustration by Joost Fluitsma, JAM visual thinking.
4.2.1. Protection
Mangrove forests under protection have been set aside by for the protection of biodiversity and ecological and
physical functions. Ecological functions include nursery for aquatic species, source of genetic resources,
physical functions include coastal protection, saltwater intrusion, and maintaining soil fertility (Government of
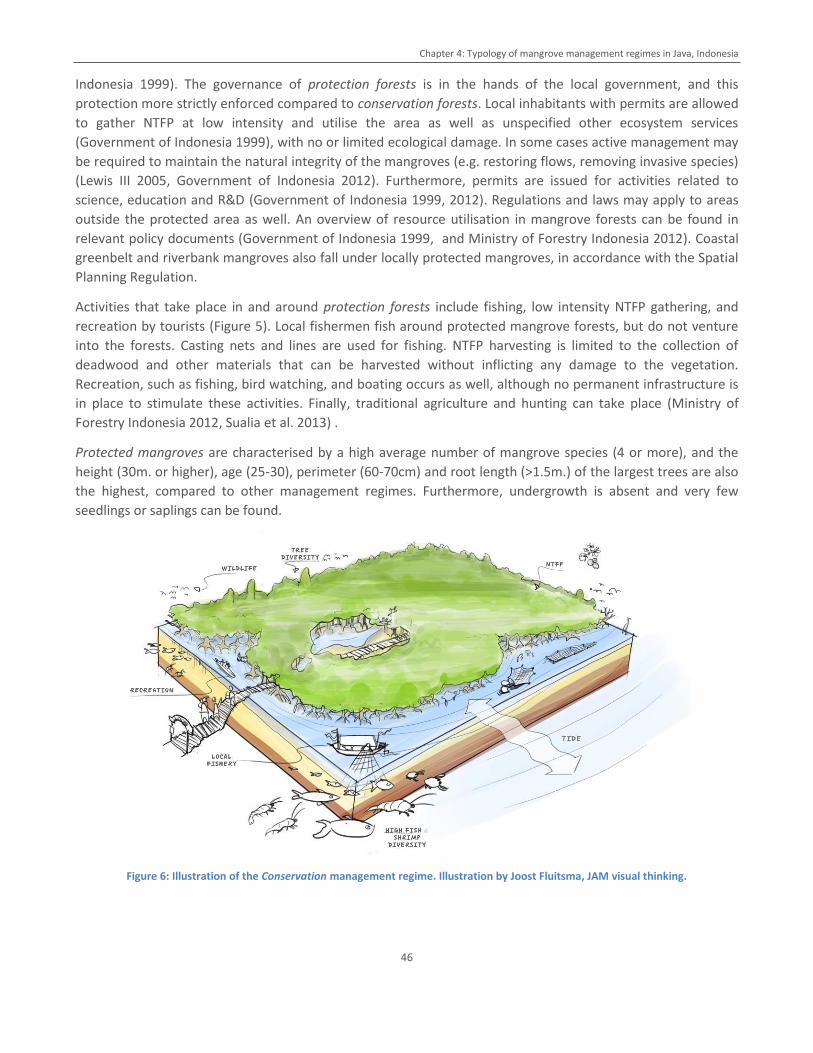
Chapter 4: Typology of mangrove management regimes in Java, Indonesia
46
Indonesia 1999). The governance of protection forests is in the hands of the local government, and this
protection more strictly enforced compared to conservation forests. Local inhabitants with permits are allowed
to gather NTFP at low intensity and utilise the area as well as unspecified other ecosystem services
(Government of Indonesia 1999), with no or limited ecological damage. In some cases active management may
be required to maintain the natural integrity of the mangroves (e.g. restoring flows, removing invasive species)
(Lewis III 2005, Government of Indonesia 2012). Furthermore, permits are issued for activities related to
science, education and R&D (Government of Indonesia 1999, 2012). Regulations and laws may apply to areas
outside the protected area as well. An overview of resource utilisation in mangrove forests can be found in
relevant policy documents (Government of Indonesia 1999, and Ministry of Forestry Indonesia 2012). Coastal
greenbelt and riverbank mangroves also fall under locally protected mangroves, in accordance with the Spatial
Planning Regulation.
Activities that take place in and around protection forests include fishing, low intensity NTFP gathering, and
recreation by tourists (Figure 5). Local fishermen fish around protected mangrove forests, but do not venture
into the forests. Casting nets and lines are used for fishing. NTFP harvesting is limited to the collection of
deadwood and other materials that can be harvested without inflicting any damage to the vegetation.
Recreation, such as fishing, bird watching, and boating occurs as well, although no permanent infrastructure is
in place to stimulate these activities. Finally, traditional agriculture and hunting can take place (Ministry of
Forestry Indonesia 2012, Sualia et al. 2013) .
Protected mangroves are characterised by a high average number of mangrove species (4 or more), and the
height (30m. or higher), age (25-30), perimeter (60-70cm) and root length (>1.5m.) of the largest trees are also
the highest, compared to other management regimes. Furthermore, undergrowth is absent and very few
seedlings or saplings can be found.
Figure 6: Illustration of the Conservation management regime. Illustration by Joost Fluitsma, JAM visual thinking.
Chapter 4: Typology of mangrove management regimes in Java, Indonesia
47
4.2.2. Conservation
Mangrove conservation forests are natural mangrove forests of which unique ecological, economic and
biological characteristics have been recognised (Figure 6). Their main function is the preservation of
biodiversity (flora and fauna), natural resources and local culture (Government of Indonesia 1999).
Conservation efforts should support the protection of a buffer zone and its resources, but mainly conservation
of the ecosystem’s biodiversity in general. Conservation forests can be subdivided into forest reserves (e.g.
nature or game reserve), hunting parks or nature conservation forests (e.g. national park, and nature-
recreation park) (Government of Indonesia 2011). Different zones within conservation forests can overlap with
other management regimes and states, such as protected blocks (rules of protected mangroves apply), forest
zone, production zone (rules of production forests apply), and zones with another purpose (Government of
Indonesia 1999). As opposed to protection forests, conservation forests fall under the jurisdiction of the
Ministry of Forestry, and not local government.
Construction and maintenance of recreation facilities (walking tracks, boat trips, information centres) is a
central activity within conservation forests, as nature-based tourism is strongly promoted in all but one
conservation area options (strict nature reserve). Fishing takes place around, and low intensity NTFP harvesting
inside conservation forests, by local communities with permits. All activities, including tourism, must not affect
the area’s biodiversity and integrity. In addition, traditional hunting and agriculture takes place. Important
differences exist between National parks and Nature reserves, because the former having no formal function in
terms of conservation of cultural heritage and nature-based tourism and being a “no-take” zone.
As Table 5 shows, all characteristics of the mangrove trees have fractionally lower values than in protection
forests. Moreover, the number of saplings and undergrowth cover is notably higher in mangrove conservation
forests. Especially the average d.b.h. (12-16 vs. 17-22 cm) and maximum age (16-20 vs. 25-30) are substantially
different for conservation and protection forests, respectively. The average temperature of the clay / sandy
substrate is around 25-26 °C. During our field visits in Java, we noted areas that were similar to mangrove
conservation forests in terms of policy aspects and management activities, but were notably younger and less
well developed. Many of these areas exist in Indonesia nowadays, because of large-scale abandonment of
aquaculture areas (due to floods, shrimp disease, etc.) in the 1990’s and early 2000’s. The most notable
difference with other mangrove conservation forests lies in the maximum age (12-16 yr.) and corresponding
size (<30 m, 30-40 cm perimeter) of trees and roots (<1.5 m.). The average number of mangrove species,
however, is similar to that in more developed mangrove conservation forests. The occurrence of young
conservation forests results in the wide range of values in Table 5.
4.3. Low intensity use mangrove forests – production
Low intensity use mangrove forests are either actively managed by communities, through private ownership
(through leases of certain periods), or the government (ranging from local to regional), or freely used for NTFP
harvesting and timber extraction due to lacking protection. We distinguish between mangrove production
forests and unprotected mangrove forests. Both can be natural or replanted mangrove areas. In this
management category activities should not significantly alter the ecosystems biophysical properties and not
involve construction of permanent infrastructure. Only limited commercial use of mangrove forest resources is
allowed (Government of Indonesia 2010, 2012).
Low intensity use mangroves are characterised by relatively young mangroves, as compared to natural
mangrove areas; the oldest mangrove trees can be up to sixteen years, whereas in natural areas they can be up
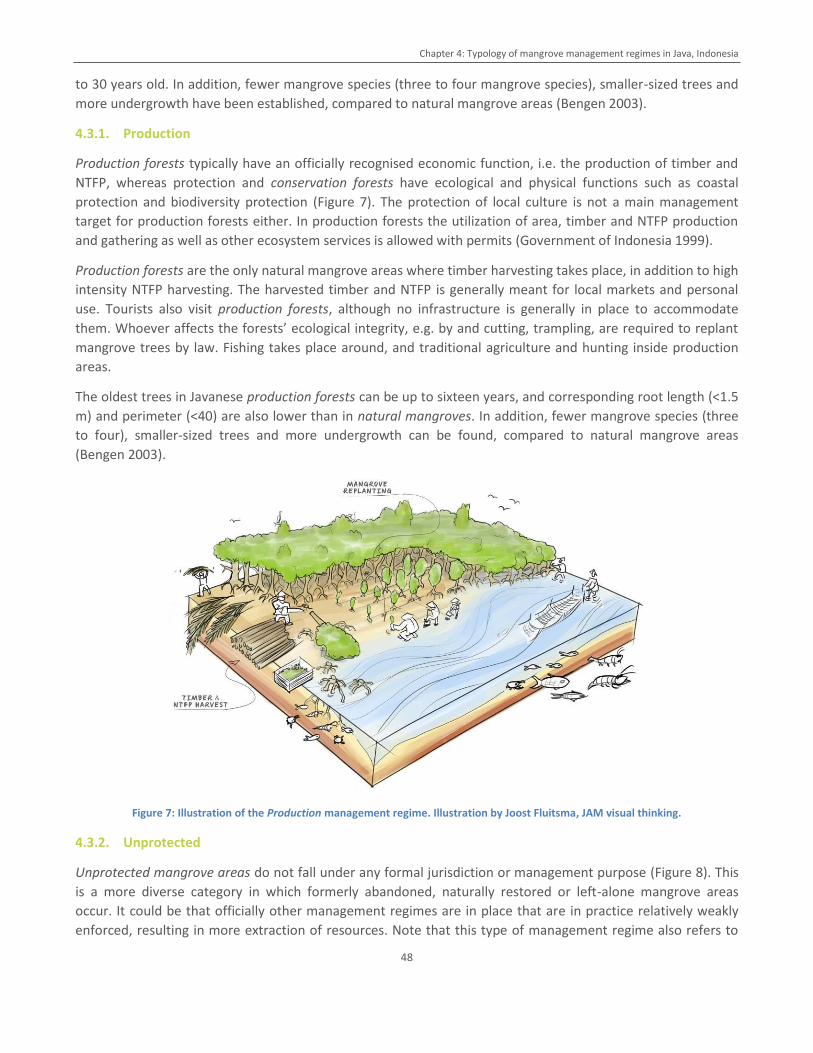
Chapter 4: Typology of mangrove management regimes in Java, Indonesia
48
to 30 years old. In addition, fewer mangrove species (three to four mangrove species), smaller-sized trees and
more undergrowth have been established, compared to natural mangrove areas (Bengen 2003).
4.3.1. Production
Production forests typically have an officially recognised economic function, i.e. the production of timber and
NTFP, whereas protection and conservation forests have ecological and physical functions such as coastal
protection and biodiversity protection (Figure 7). The protection of local culture is not a main management
target for production forests either. In production forests the utilization of area, timber and NTFP production
and gathering as well as other ecosystem services is allowed with permits (Government of Indonesia 1999).
Production forests are the only natural mangrove areas where timber harvesting takes place, in addition to high
intensity NTFP harvesting. The harvested timber and NTFP is generally meant for local markets and personal
use. Tourists also visit production forests, although no infrastructure is generally in place to accommodate
them. Whoever affects the forests’ ecological integrity, e.g. by and cutting, trampling, are required to replant
mangrove trees by law. Fishing takes place around, and traditional agriculture and hunting inside production
areas.
The oldest trees in Javanese production forests can be up to sixteen years, and corresponding root length (<1.5
m) and perimeter (<40) are also lower than in natural mangroves. In addition, fewer mangrove species (three
to four), smaller-sized trees and more undergrowth can be found, compared to natural mangrove areas
(Bengen 2003).
Figure 7: Illustration of the Production management regime. Illustration by Joost Fluitsma, JAM visual thinking.
4.3.2. Unprotected
Unprotected mangrove areas do not fall under any formal jurisdiction or management purpose (Figure 8). This
is a more diverse category in which formerly abandoned, naturally restored or left-alone mangrove areas
occur. It could be that officially other management regimes are in place that are in practice relatively weakly
enforced, resulting in more extraction of resources. Note that this type of management regime also refers to
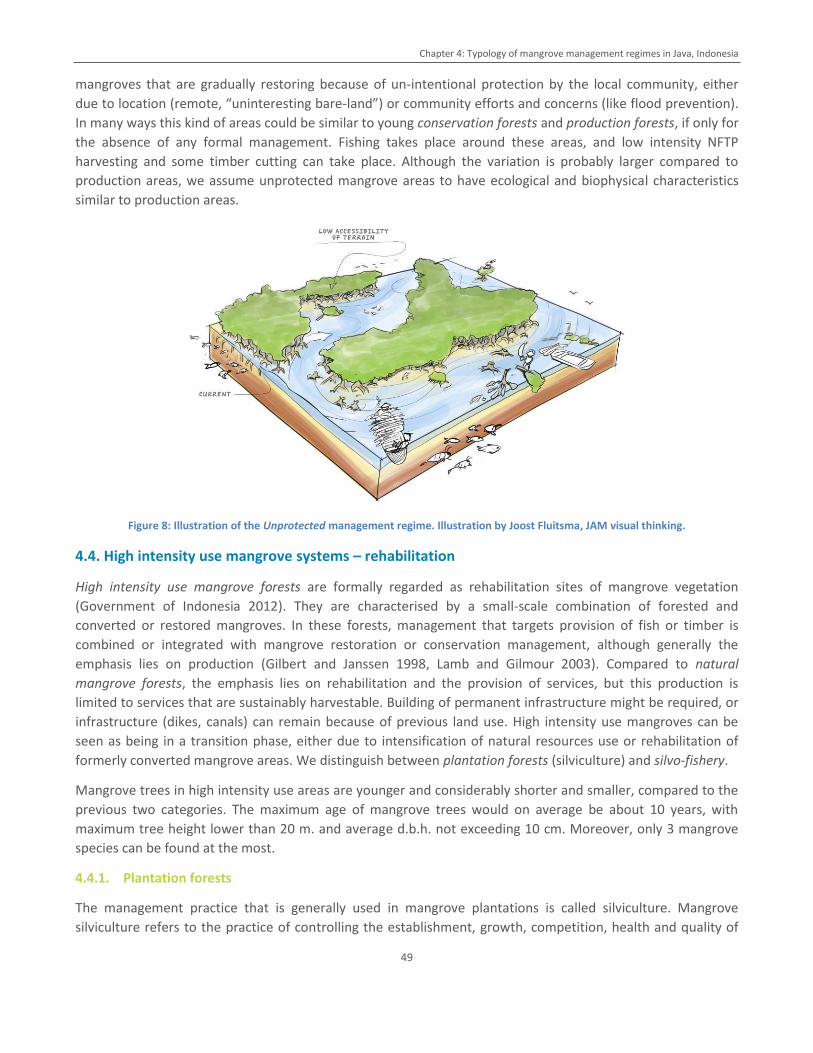
Chapter 4: Typology of mangrove management regimes in Java, Indonesia
49
mangroves that are gradually restoring because of un-intentional protection by the local community, either
due to location (remote, “uninteresting bare-land”) or community efforts and concerns (like flood prevention).
In many ways this kind of areas could be similar to young conservation forests and production forests, if only for
the absence of any formal management. Fishing takes place around these areas, and low intensity NFTP
harvesting and some timber cutting can take place. Although the variation is probably larger compared to
production areas, we assume unprotected mangrove areas to have ecological and biophysical characteristics
similar to production areas.
Figure 8: Illustration of the Unprotected management regime. Illustration by Joost Fluitsma, JAM visual thinking.
4.4. High intensity use mangrove systems – rehabilitation
High intensity use mangrove forests are formally regarded as rehabilitation sites of mangrove vegetation
(Government of Indonesia 2012). They are characterised by a small-scale combination of forested and
converted or restored mangroves. In these forests, management that targets provision of fish or timber is
combined or integrated with mangrove restoration or conservation management, although generally the
emphasis lies on production (Gilbert and Janssen 1998, Lamb and Gilmour 2003). Compared to natural
mangrove forests, the emphasis lies on rehabilitation and the provision of services, but this production is
limited to services that are sustainably harvestable. Building of permanent infrastructure might be required, or
infrastructure (dikes, canals) can remain because of previous land use. High intensity use mangroves can be
seen as being in a transition phase, either due to intensification of natural resources use or rehabilitation of
formerly converted mangrove areas. We distinguish between plantation forests (silviculture) and silvo-fishery.
Mangrove trees in high intensity use areas are younger and considerably shorter and smaller, compared to the
previous two categories. The maximum age of mangrove trees would on average be about 10 years, with
maximum tree height lower than 20 m. and average d.b.h. not exceeding 10 cm. Moreover, only 3 mangrove
species can be found at the most.
4.4.1. Plantation forests
The management practice that is generally used in mangrove plantations is called silviculture. Mangrove
silviculture refers to the practice of controlling the establishment, growth, competition, health and quality of
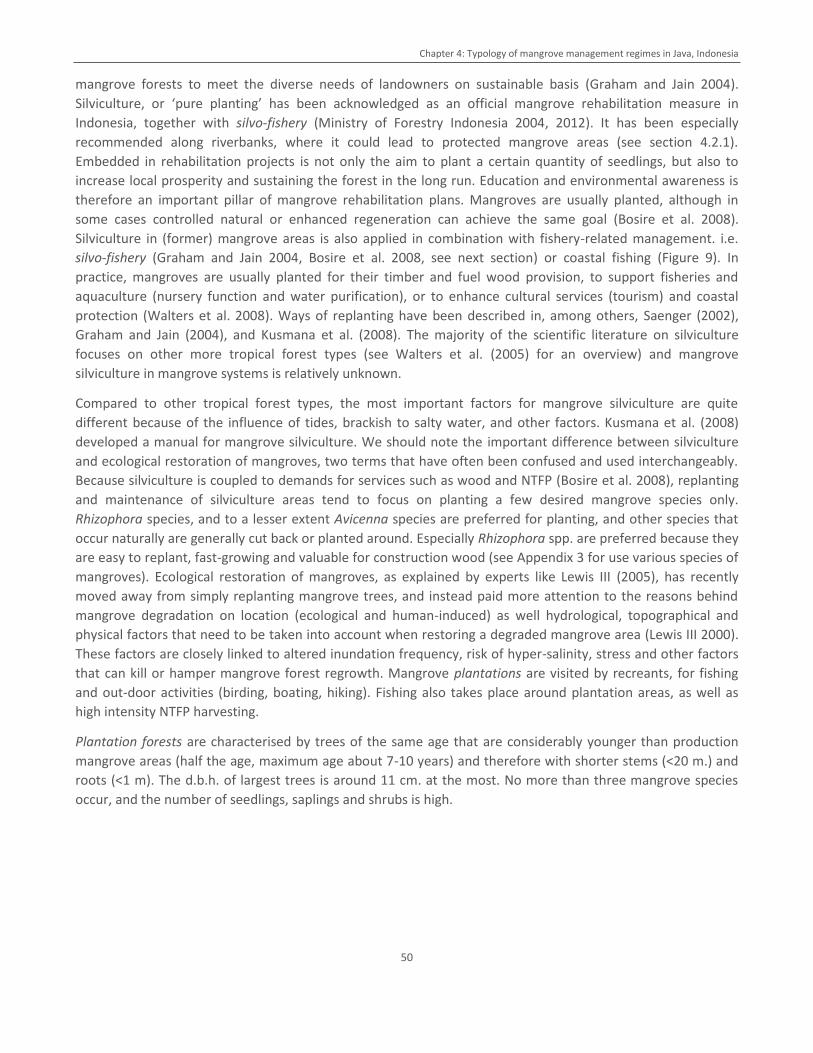
Chapter 4: Typology of mangrove management regimes in Java, Indonesia
50
mangrove forests to meet the diverse needs of landowners on sustainable basis (Graham and Jain 2004).
Silviculture, or ‘pure planting’ has been acknowledged as an official mangrove rehabilitation measure in
Indonesia, together with silvo-fishery (Ministry of Forestry Indonesia 2004, 2012). It has been especially
recommended along riverbanks, where it could lead to protected mangrove areas (see section 4.2.1).
Embedded in rehabilitation projects is not only the aim to plant a certain quantity of seedlings, but also to
increase local prosperity and sustaining the forest in the long run. Education and environmental awareness is
therefore an important pillar of mangrove rehabilitation plans. Mangroves are usually planted, although in
some cases controlled natural or enhanced regeneration can achieve the same goal (Bosire et al. 2008).
Silviculture in (former) mangrove areas is also applied in combination with fishery-related management. i.e.
silvo-fishery (Graham and Jain 2004, Bosire et al. 2008, see next section) or coastal fishing (Figure 9). In
practice, mangroves are usually planted for their timber and fuel wood provision, to support fisheries and
aquaculture (nursery function and water purification), or to enhance cultural services (tourism) and coastal
protection (Walters et al. 2008). Ways of replanting have been described in, among others, Saenger (2002),
Graham and Jain (2004), and Kusmana et al. (2008). The majority of the scientific literature on silviculture
focuses on other more tropical forest types (see Walters et al. (2005) for an overview) and mangrove
silviculture in mangrove systems is relatively unknown.
Compared to other tropical forest types, the most important factors for mangrove silviculture are quite
different because of the influence of tides, brackish to salty water, and other factors. Kusmana et al. (2008)
developed a manual for mangrove silviculture. We should note the important difference between silviculture
and ecological restoration of mangroves, two terms that have often been confused and used interchangeably.
Because silviculture is coupled to demands for services such as wood and NTFP (Bosire et al. 2008), replanting
and maintenance of silviculture areas tend to focus on planting a few desired mangrove species only.
Rhizophora species, and to a lesser extent Avicenna species are preferred for planting, and other species that
occur naturally are generally cut back or planted around. Especially Rhizophora spp. are preferred because they
are easy to replant, fast-growing and valuable for construction wood (see Appendix 3 for use various species of
mangroves). Ecological restoration of mangroves, as explained by experts like Lewis III (2005), has recently
moved away from simply replanting mangrove trees, and instead paid more attention to the reasons behind
mangrove degradation on location (ecological and human-induced) as well hydrological, topographical and
physical factors that need to be taken into account when restoring a degraded mangrove area (Lewis III 2000).
These factors are closely linked to altered inundation frequency, risk of hyper-salinity, stress and other factors
that can kill or hamper mangrove forest regrowth. Mangrove plantations are visited by recreants, for fishing
and out-door activities (birding, boating, hiking). Fishing also takes place around plantation areas, as well as
high intensity NTFP harvesting.
Plantation forests are characterised by trees of the same age that are considerably younger than production
mangrove areas (half the age, maximum age about 7-10 years) and therefore with shorter stems (<20 m.) and
roots (<1 m). The d.b.h. of largest trees is around 11 cm. at the most. No more than three mangrove species
occur, and the number of seedlings, saplings and shrubs is high.
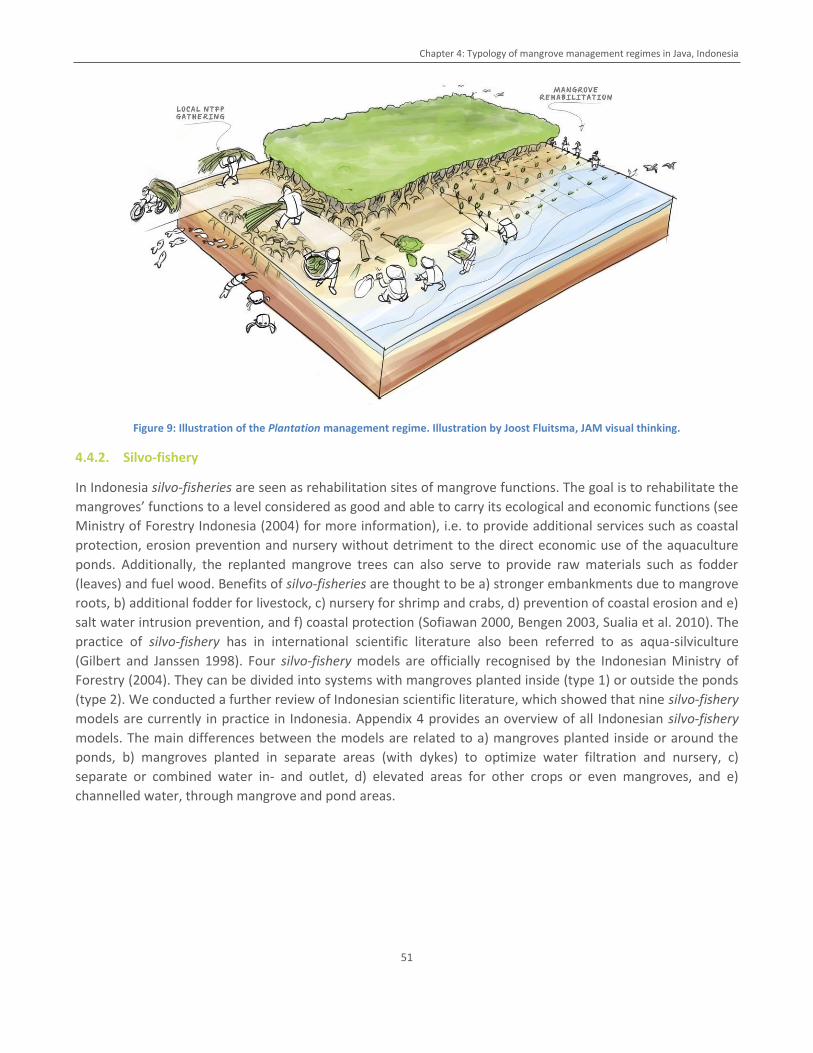
Chapter 4: Typology of mangrove management regimes in Java, Indonesia
51
Figure 9: Illustration of the Plantation management regime. Illustration by Joost Fluitsma, JAM visual thinking.
4.4.2. Silvo-fishery
In Indonesia silvo-fisheries are seen as rehabilitation sites of mangrove functions. The goal is to rehabilitate the
mangroves’ functions to a level considered as good and able to carry its ecological and economic functions (see
Ministry of Forestry Indonesia (2004) for more information), i.e. to provide additional services such as coastal
protection, erosion prevention and nursery without detriment to the direct economic use of the aquaculture
ponds. Additionally, the replanted mangrove trees can also serve to provide raw materials such as fodder
(leaves) and fuel wood. Benefits of silvo-fisheries are thought to be a) stronger embankments due to mangrove
roots, b) additional fodder for livestock, c) nursery for shrimp and crabs, d) prevention of coastal erosion and e)
salt water intrusion prevention, and f) coastal protection (Sofiawan 2000, Bengen 2003, Sualia et al. 2010). The
practice of silvo-fishery has in international scientific literature also been referred to as aqua-silviculture
(Gilbert and Janssen 1998). Four silvo-fishery models are officially recognised by the Indonesian Ministry of
Forestry (2004). They can be divided into systems with mangroves planted inside (type 1) or outside the ponds
(type 2). We conducted a further review of Indonesian scientific literature, which showed that nine silvo-fishery
models are currently in practice in Indonesia. Appendix 4 provides an overview of all Indonesian silvo-fishery
models. The main differences between the models are related to a) mangroves planted inside or around the
ponds, b) mangroves planted in separate areas (with dykes) to optimize water filtration and nursery, c)
separate or combined water in- and outlet, d) elevated areas for other crops or even mangroves, and e)
channelled water, through mangrove and pond areas.
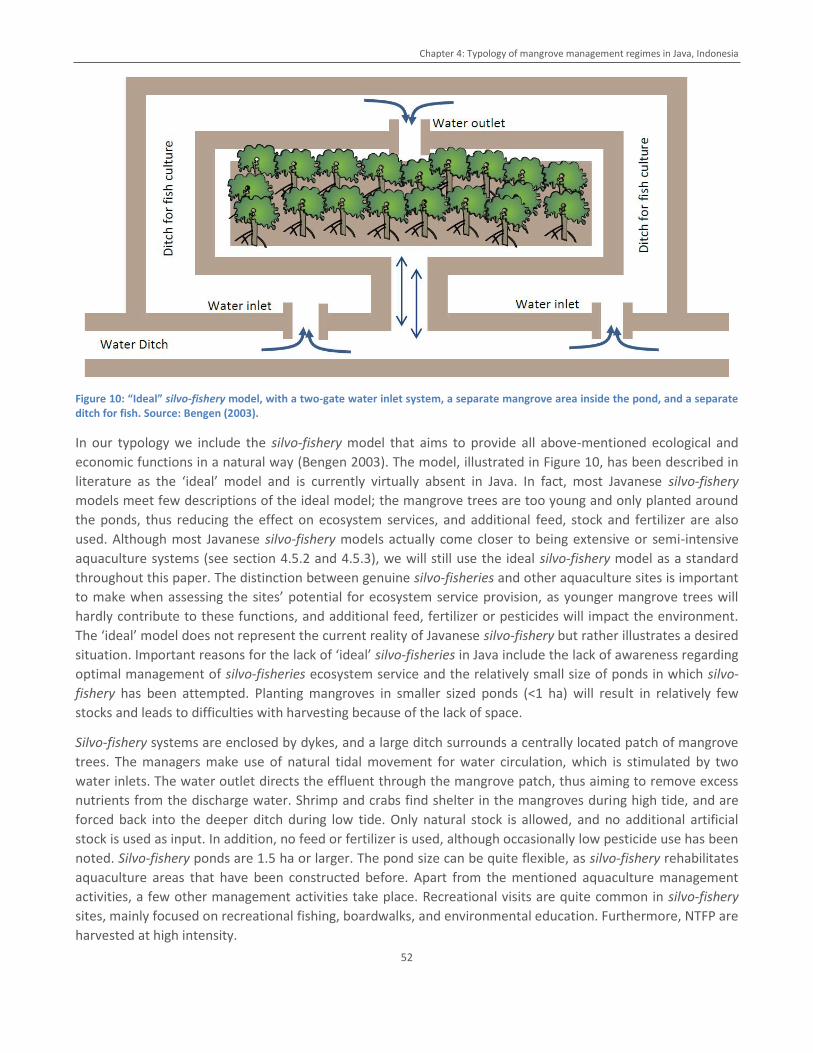
Chapter 4: Typology of mangrove management regimes in Java, Indonesia
52
Figure 10: “Ideal” silvo-fishery model, with a two-gate water inlet system, a separate mangrove area inside the pond, and a separate ditch for fish. Source: Bengen (2003).
In our typology we include the silvo-fishery model that aims to provide all above-mentioned ecological and
economic functions in a natural way (Bengen 2003). The model, illustrated in Figure 10, has been described in
literature as the ‘ideal’ model and is currently virtually absent in Java. In fact, most Javanese silvo-fishery
models meet few descriptions of the ideal model; the mangrove trees are too young and only planted around
the ponds, thus reducing the effect on ecosystem services, and additional feed, stock and fertilizer are also
used. Although most Javanese silvo-fishery models actually come closer to being extensive or semi-intensive
aquaculture systems (see section 4.5.2 and 4.5.3), we will still use the ideal silvo-fishery model as a standard
throughout this paper. The distinction between genuine silvo-fisheries and other aquaculture sites is important
to make when assessing the sites’ potential for ecosystem service provision, as younger mangrove trees will
hardly contribute to these functions, and additional feed, fertilizer or pesticides will impact the environment.
The ‘ideal’ model does not represent the current reality of Javanese silvo-fishery but rather illustrates a desired
situation. Important reasons for the lack of ‘ideal’ silvo-fisheries in Java include the lack of awareness regarding
optimal management of silvo-fisheries ecosystem service and the relatively small size of ponds in which silvo-
fishery has been attempted. Planting mangroves in smaller sized ponds (<1 ha) will result in relatively few
stocks and leads to difficulties with harvesting because of the lack of space.
Silvo-fishery systems are enclosed by dykes, and a large ditch surrounds a centrally located patch of mangrove
trees. The managers make use of natural tidal movement for water circulation, which is stimulated by two
water inlets. The water outlet directs the effluent through the mangrove patch, thus aiming to remove excess
nutrients from the discharge water. Shrimp and crabs find shelter in the mangroves during high tide, and are
forced back into the deeper ditch during low tide. Only natural stock is allowed, and no additional artificial
stock is used as input. In addition, no feed or fertilizer is used, although occasionally low pesticide use has been
noted. Silvo-fishery ponds are 1.5 ha or larger. The pond size can be quite flexible, as silvo-fishery rehabilitates
aquaculture areas that have been constructed before. Apart from the mentioned aquaculture management
activities, a few other management activities take place. Recreational visits are quite common in silvo-fishery
sites, mainly focused on recreational fishing, boardwalks, and environmental education. Furthermore, NTFP are
harvested at high intensity.
Chapter 4: Typology of mangrove management regimes in Java, Indonesia
53
The amount of mangrove cover per pond is quite variable, but is estimated to be around 30-40% of the pond
(Bengen 2003 and personal communication). Silvo-fisheries that can be considered fully functional are
characterised by trees that are considerably younger than production mangrove areas (half the age, maximum
age about 7-10 years) and therefore with shorter stems shorter (<20 m.) and roots (<1 m). The d.b.h. of largest
trees is around 11 cm. at the most. No more than three mangrove species occur, and the number of seedlings
and saplings is high. Shrubs are abundant as well, and the temperature of the sandy/ clay substrate is between
28-30°C. We furthermore note that silvo-fisheries with mangrove trees younger than seven years should still be
regarded as silvo-fisheries and mangrove rehabilitation sites, but this system is not yet able to provide all
functions. Especially nursery for shrimps and crabs is not proven to be provided by younger replanted
mangrove trees, at least not on the scale that shrimp yields can be attributed to the presence of the mangrove
trees (Bengen 2003 and expert interviews).
4.5. Mangrove systems converted for aquaculture
Converted mangrove systems are mangrove forests that have been cleared and converted into other land use
purposes. In this study, different forms and intensities of aquaculture constitute the major share of converted
mangroves; at Indonesian coastal areas, land has been cleared and converted mainly into aquaculture,
agriculture, oil palm plantation, or industrial areas. The most important role within this category is played by
different variations of aquaculture. Shrimp farming is the predominant aquaculture business undertaken in
mangrove area In Indonesia, and responsible for the conversion of somewhere between 20 and 50% of
Indonesia’s mangrove area since the 1970’s (Dephut 2005). The main difference with the previously mentioned
categories is the lands normally belongs to (or is leased by) individuals or private companies instead of
communities or governments. The owners of this land will follow regulations stipulated by other non-forestry
ministries, for instance when related to aquaculture development in areas over 50 ha (Ministry of
Environment); greenbelt protection along the downstream river banks (Ministry of Public Works regulation) or
along the beach (follow the Presidential Decree No 32/1990). Apart from this, if the coastal lands are used for
agriculture, then the activity should follow certain rules stipulated by the Ministry of Agriculture, and many
fishery and aquaculture areas should follow regulations from the Ministry of Fishery. It could occur that locally
regulations of ministries will have to be combined, or interpreted differently, and in some occasions the
Regional Spatial Planning bureau might overrule this by ordering the conversion of certain areas. This already
highly dynamic situation is aggravated by the fact that some local district offices could again overrule certain
decrees or regulations.
In biophysical and ecological terms the main difference with previous categories is the relative absence of
mangrove trees; the ones that are (still) present are relatively young (up to 5 yr.), have very short roots (if any
at all), and are surrounded by a few seedlings and no undergrowth. Notable exception is eco-certified organic
aquaculture (4.4.1), for which mangrove replanting is required as compensation for land conversion. However,
this replanting is not yet required in proximity of the ponds (unlike silvo-fisheries), and is therefore considered
a different management regime (e.g. plantation or protection). Aquaculture ranges from extensive to intensive,
based on the level of feed input and/or fertilizer used, and the stocking density. Characteristics of aquaculture
below are mostly based on Rönnbäck (2001), unless stated otherwise, and apply primarily to shrimp
aquaculture. Where possible, we distinguish between shrimp and fish aquaculture, and we indicate which
information applies to which type.
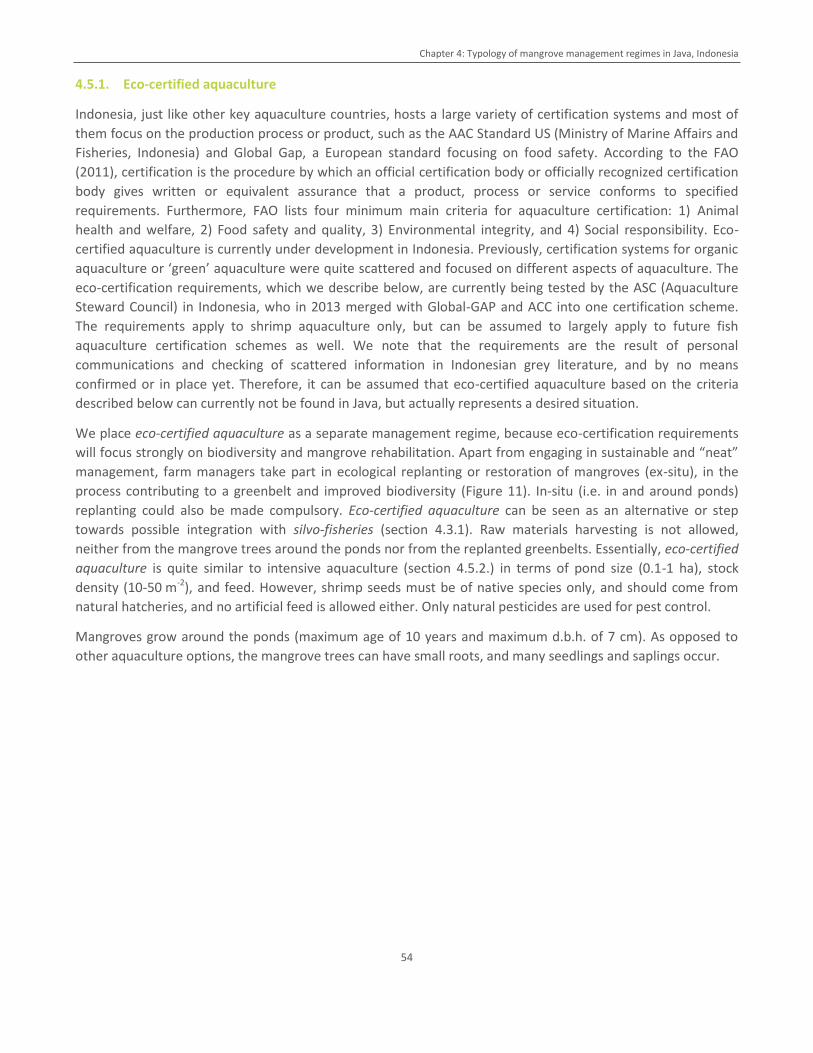
Chapter 4: Typology of mangrove management regimes in Java, Indonesia
54
4.5.1. Eco-certified aquaculture
Indonesia, just like other key aquaculture countries, hosts a large variety of certification systems and most of
them focus on the production process or product, such as the AAC Standard US (Ministry of Marine Affairs and
Fisheries, Indonesia) and Global Gap, a European standard focusing on food safety. According to the FAO
(2011), certification is the procedure by which an official certification body or officially recognized certification
body gives written or equivalent assurance that a product, process or service conforms to specified
requirements. Furthermore, FAO lists four minimum main criteria for aquaculture certification: 1) Animal
health and welfare, 2) Food safety and quality, 3) Environmental integrity, and 4) Social responsibility. Eco-
certified aquaculture is currently under development in Indonesia. Previously, certification systems for organic
aquaculture or ‘green’ aquaculture were quite scattered and focused on different aspects of aquaculture. The
eco-certification requirements, which we describe below, are currently being tested by the ASC (Aquaculture
Steward Council) in Indonesia, who in 2013 merged with Global-GAP and ACC into one certification scheme.
The requirements apply to shrimp aquaculture only, but can be assumed to largely apply to future fish
aquaculture certification schemes as well. We note that the requirements are the result of personal
communications and checking of scattered information in Indonesian grey literature, and by no means
confirmed or in place yet. Therefore, it can be assumed that eco-certified aquaculture based on the criteria
described below can currently not be found in Java, but actually represents a desired situation.
We place eco-certified aquaculture as a separate management regime, because eco-certification requirements
will focus strongly on biodiversity and mangrove rehabilitation. Apart from engaging in sustainable and “neat”
management, farm managers take part in ecological replanting or restoration of mangroves (ex-situ), in the
process contributing to a greenbelt and improved biodiversity (Figure 11). In-situ (i.e. in and around ponds)
replanting could also be made compulsory. Eco-certified aquaculture can be seen as an alternative or step
towards possible integration with silvo-fisheries (section 4.3.1). Raw materials harvesting is not allowed,
neither from the mangrove trees around the ponds nor from the replanted greenbelts. Essentially, eco-certified
aquaculture is quite similar to intensive aquaculture (section 4.5.2.) in terms of pond size (0.1-1 ha), stock
density (10-50 m-2), and feed. However, shrimp seeds must be of native species only, and should come from
natural hatcheries, and no artificial feed is allowed either. Only natural pesticides are used for pest control.
Mangroves grow around the ponds (maximum age of 10 years and maximum d.b.h. of 7 cm). As opposed to
other aquaculture options, the mangrove trees can have small roots, and many seedlings and saplings occur.
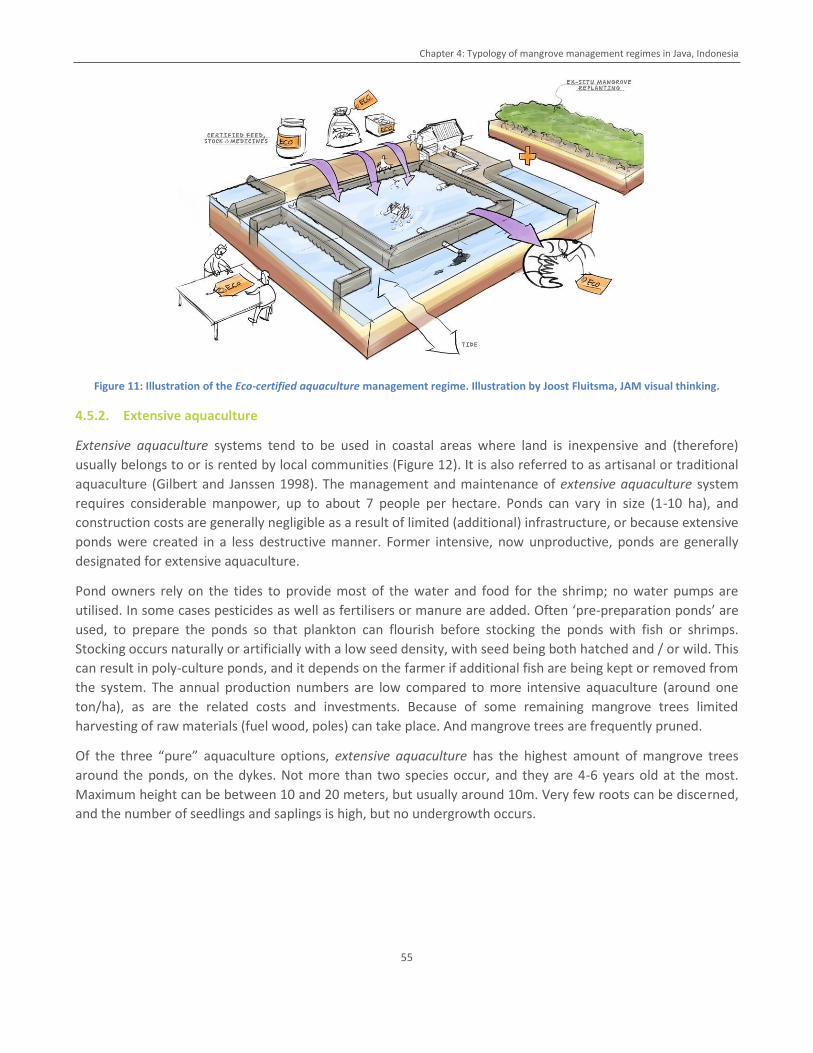
Chapter 4: Typology of mangrove management regimes in Java, Indonesia
55
Figure 11: Illustration of the Eco-certified aquaculture management regime. Illustration by Joost Fluitsma, JAM visual thinking.
4.5.2. Extensive aquaculture
Extensive aquaculture systems tend to be used in coastal areas where land is inexpensive and (therefore)
usually belongs to or is rented by local communities (Figure 12). It is also referred to as artisanal or traditional
aquaculture (Gilbert and Janssen 1998). The management and maintenance of extensive aquaculture system
requires considerable manpower, up to about 7 people per hectare. Ponds can vary in size (1-10 ha), and
construction costs are generally negligible as a result of limited (additional) infrastructure, or because extensive
ponds were created in a less destructive manner. Former intensive, now unproductive, ponds are generally
designated for extensive aquaculture.
Pond owners rely on the tides to provide most of the water and food for the shrimp; no water pumps are
utilised. In some cases pesticides as well as fertilisers or manure are added. Often ‘pre-preparation ponds’ are
used, to prepare the ponds so that plankton can flourish before stocking the ponds with fish or shrimps.
Stocking occurs naturally or artificially with a low seed density, with seed being both hatched and / or wild. This
can result in poly-culture ponds, and it depends on the farmer if additional fish are being kept or removed from
the system. The annual production numbers are low compared to more intensive aquaculture (around one
ton/ha), as are the related costs and investments. Because of some remaining mangrove trees limited
harvesting of raw materials (fuel wood, poles) can take place. And mangrove trees are frequently pruned.
Of the three “pure” aquaculture options, extensive aquaculture has the highest amount of mangrove trees
around the ponds, on the dykes. Not more than two species occur, and they are 4-6 years old at the most.
Maximum height can be between 10 and 20 meters, but usually around 10m. Very few roots can be discerned,
and the number of seedlings and saplings is high, but no undergrowth occurs.
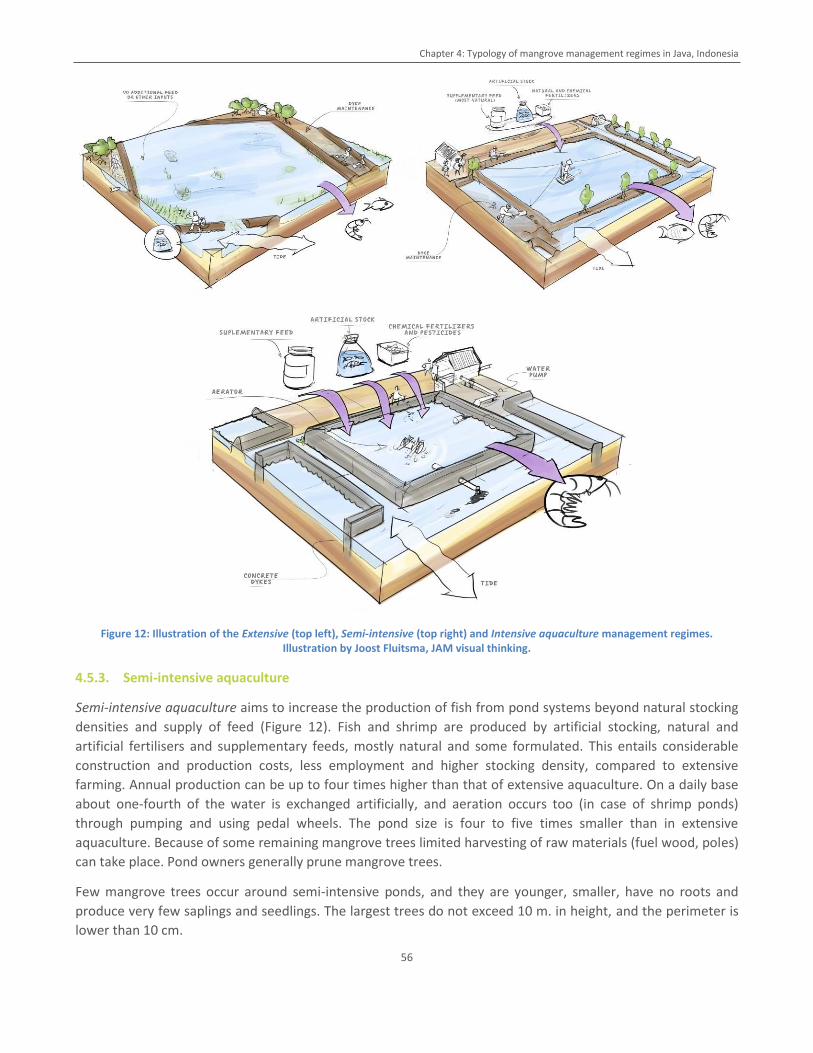
Chapter 4: Typology of mangrove management regimes in Java, Indonesia
56
Figure 12: Illustration of the Extensive (top left), Semi-intensive (top right) and Intensive aquaculture management regimes. Illustration by Joost Fluitsma, JAM visual thinking.
4.5.3. Semi-intensive aquaculture
Semi-intensive aquaculture aims to increase the production of fish from pond systems beyond natural stocking
densities and supply of feed (Figure 12). Fish and shrimp are produced by artificial stocking, natural and
artificial fertilisers and supplementary feeds, mostly natural and some formulated. This entails considerable
construction and production costs, less employment and higher stocking density, compared to extensive
farming. Annual production can be up to four times higher than that of extensive aquaculture. On a daily base
about one-fourth of the water is exchanged artificially, and aeration occurs too (in case of shrimp ponds)
through pumping and using pedal wheels. The pond size is four to five times smaller than in extensive
aquaculture. Because of some remaining mangrove trees limited harvesting of raw materials (fuel wood, poles)
can take place. Pond owners generally prune mangrove trees.
Few mangrove trees occur around semi-intensive ponds, and they are younger, smaller, have no roots and
produce very few saplings and seedlings. The largest trees do not exceed 10 m. in height, and the perimeter is
lower than 10 cm.
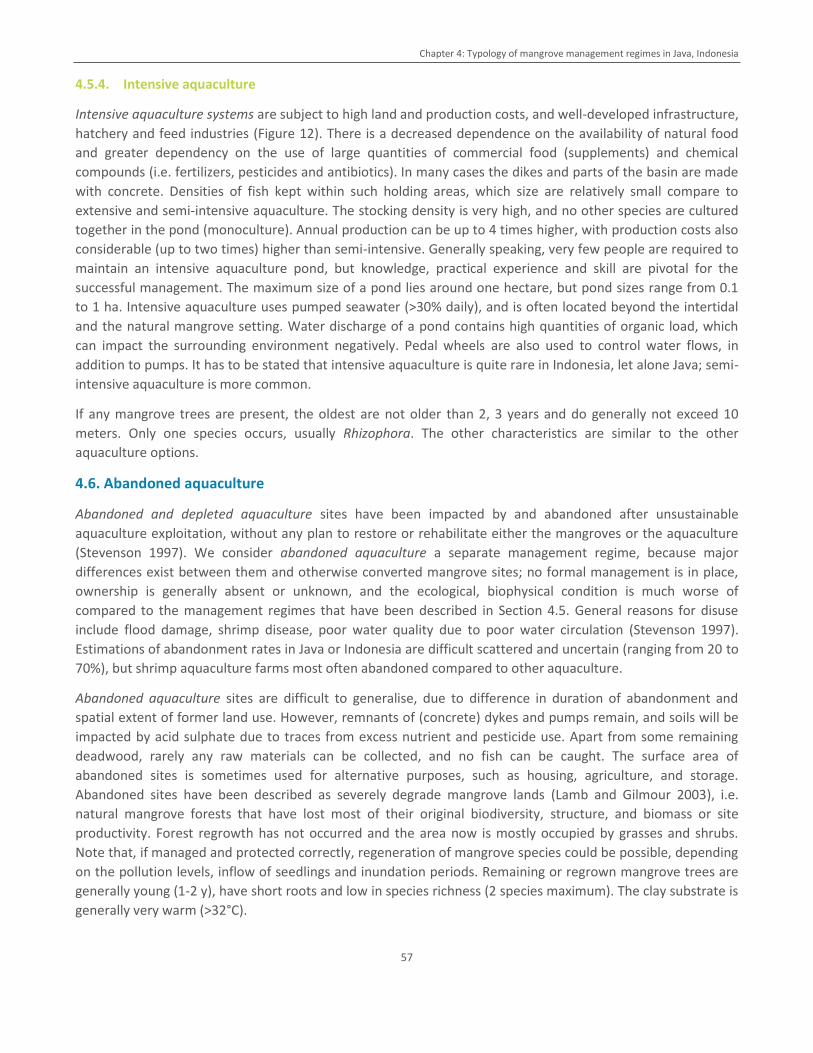
Chapter 4: Typology of mangrove management regimes in Java, Indonesia
57
4.5.4. Intensive aquaculture
Intensive aquaculture systems are subject to high land and production costs, and well-developed infrastructure,
hatchery and feed industries (Figure 12). There is a decreased dependence on the availability of natural food
and greater dependency on the use of large quantities of commercial food (supplements) and chemical
compounds (i.e. fertilizers, pesticides and antibiotics). In many cases the dikes and parts of the basin are made
with concrete. Densities of fish kept within such holding areas, which size are relatively small compare to
extensive and semi-intensive aquaculture. The stocking density is very high, and no other species are cultured
together in the pond (monoculture). Annual production can be up to 4 times higher, with production costs also
considerable (up to two times) higher than semi-intensive. Generally speaking, very few people are required to
maintain an intensive aquaculture pond, but knowledge, practical experience and skill are pivotal for the
successful management. The maximum size of a pond lies around one hectare, but pond sizes range from 0.1
to 1 ha. Intensive aquaculture uses pumped seawater (>30% daily), and is often located beyond the intertidal
and the natural mangrove setting. Water discharge of a pond contains high quantities of organic load, which
can impact the surrounding environment negatively. Pedal wheels are also used to control water flows, in
addition to pumps. It has to be stated that intensive aquaculture is quite rare in Indonesia, let alone Java; semi-
intensive aquaculture is more common.
If any mangrove trees are present, the oldest are not older than 2, 3 years and do generally not exceed 10
meters. Only one species occurs, usually Rhizophora. The other characteristics are similar to the other
aquaculture options.
4.6. Abandoned aquaculture
Abandoned and depleted aquaculture sites have been impacted by and abandoned after unsustainable
aquaculture exploitation, without any plan to restore or rehabilitate either the mangroves or the aquaculture
(Stevenson 1997). We consider abandoned aquaculture a separate management regime, because major
differences exist between them and otherwise converted mangrove sites; no formal management is in place,
ownership is generally absent or unknown, and the ecological, biophysical condition is much worse of
compared to the management regimes that have been described in Section 4.5. General reasons for disuse
include flood damage, shrimp disease, poor water quality due to poor water circulation (Stevenson 1997).
Estimations of abandonment rates in Java or Indonesia are difficult scattered and uncertain (ranging from 20 to
70%), but shrimp aquaculture farms most often abandoned compared to other aquaculture.
Abandoned aquaculture sites are difficult to generalise, due to difference in duration of abandonment and
spatial extent of former land use. However, remnants of (concrete) dykes and pumps remain, and soils will be
impacted by acid sulphate due to traces from excess nutrient and pesticide use. Apart from some remaining
deadwood, rarely any raw materials can be collected, and no fish can be caught. The surface area of
abandoned sites is sometimes used for alternative purposes, such as housing, agriculture, and storage.
Abandoned sites have been described as severely degrade mangrove lands (Lamb and Gilmour 2003), i.e.
natural mangrove forests that have lost most of their original biodiversity, structure, and biomass or site
productivity. Forest regrowth has not occurred and the area now is mostly occupied by grasses and shrubs.
Note that, if managed and protected correctly, regeneration of mangrove species could be possible, depending
on the pollution levels, inflow of seedlings and inundation periods. Remaining or regrown mangrove trees are
generally young (1-2 y), have short roots and low in species richness (2 species maximum). The clay substrate is
generally very warm (>32°C).
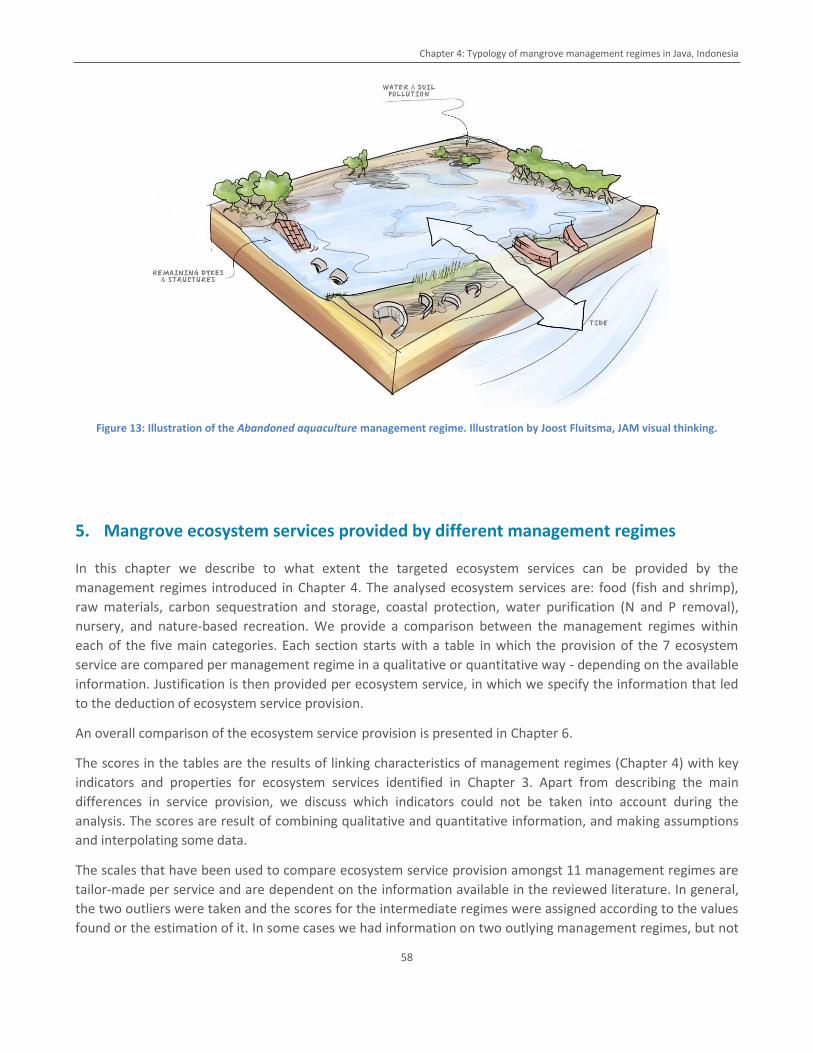
Chapter 4: Typology of mangrove management regimes in Java, Indonesia
58
Figure 13: Illustration of the Abandoned aquaculture management regime. Illustration by Joost Fluitsma, JAM visual thinking.
5. Mangrove ecosystem services provided by different management regimes
In this chapter we describe to what extent the targeted ecosystem services can be provided by the
management regimes introduced in Chapter 4. The analysed ecosystem services are: food (fish and shrimp),
raw materials, carbon sequestration and storage, coastal protection, water purification (N and P removal),
nursery, and nature-based recreation. We provide a comparison between the management regimes within
each of the five main categories. Each section starts with a table in which the provision of the 7 ecosystem
service are compared per management regime in a qualitative or quantitative way - depending on the available
information. Justification is then provided per ecosystem service, in which we specify the information that led
to the deduction of ecosystem service provision.
An overall comparison of the ecosystem service provision is presented in Chapter 6.
The scores in the tables are the results of linking characteristics of management regimes (Chapter 4) with key
indicators and properties for ecosystem services identified in Chapter 3. Apart from describing the main
differences in service provision, we discuss which indicators could not be taken into account during the
analysis. The scores are result of combining qualitative and quantitative information, and making assumptions
and interpolating some data.
The scales that have been used to compare ecosystem service provision amongst 11 management regimes are
tailor-made per service and are dependent on the information available in the reviewed literature. In general,
the two outliers were taken and the scores for the intermediate regimes were assigned according to the values
found or the estimation of it. In some cases we had information on two outlying management regimes, but not
Chapter 5:Mangrove ecosystem services provided by different management regimes
59
on the regime in between. In those case we interpolated the original results, to provide a quantitative
indication. If interpolation or other assumptions were used, we described it in the results section. Quantitative
results were preferred but not always available and for especially the regulating services qualitative
information proved more reliable and consistent. We indicate per service if information on state and/or
performance indicators could be collected per management regime. Quantitative information served to
indicate differences between management regimes and provide an order of magnitude. The information
should not be interpreted as absolute numbers.
Service provision is scored using circles (●/○), with the scale of four steps (-/●/●●/●●●). Diamonds (◆/◇) are
used for negative service provision. Close figures (●/◆) indicate high certainty and open symbols (●○/◇) low.
A score is considered highly certain if it has been quantified by multiple sources, if multiple ecosystem service
indicators have been used, if it has been linked to multiple indicators of management regimes, and if it is
applicable to the context of Java. A result is considered of low certainty if it is interpolated, based on few
reliable ecosystem service indicators, shows a weak link to the management regime, and is difficult to apply to
the context of Java. It was decided to use a scale with relatively few categories because this analysis is based on
an extensive literature review and is not supported by field measurements. This means that many of presented
estimates of indicators are from different sources, different case study locations and result of different
measurement methods. Hence there is a high variability, sources are not consistent in their descriptions, and
considerable interpretation and assumptions were needed to generate a consistent typology and the resulting
quantification of the ecosystem services.
5.1. Natural mangrove forests
Natural mangrove forests can be divided into protection and conservation forests, in accordance with Ministry
of Forestry (2010) guidelines. Protection and conservation forests are different in terms of who is responsible
for the areas’ management as well as which activities are allowed or stimulated to take place. The level of
ecosystem services provision for natural mangroves is generally high. Policy restrictions result in some crucial
differences between protection and conservation in terms of management activities that are carried out and
the resulting mangrove state. Under protection forests, the governance of an area is the responsibility of local
governments, and protection forests are generally stricter enforced compared to conservation forests. In
addition, more focus is put on development of recreation facilities in the conservation forests. For a detailed
description of this category and the management regimes please see section 4.2. Table 6 provides an overview
of the ecosystem services provided by natural mangroves.
Table 6: Overview of ecosystem services provided by two management regimes in natural mangroves. Service provision is scored using circles (●/○). Closed circles () indicate high certainty, open circles () low.
Ecosystem Service Protection Conservation
Food (fish and shrimp)
High potential for fish and shrimp provision: estimations of 1-1.6 ton and 4 ton ha
-1 of
mangrove per year, respectively ○○
High potential for fish provision, more variable for shrimp: estimations of 1-1.6 ton and 1-4 ton ha
-1 of
mangrove per year, respectively ○○
Raw materials Available biomass between 150 and 300 ton ha
-1,
max. sustainable yield about 12-24 ton ha-1
. ●●●
Available biomass between 150 and 300 ton ha-1
, max. sustainable yield about 10-17 ton ha
-1.
●●
Carbon storage and sequestration
Large amounts of carbon stored above and below ground, average 430-700 ton C ha
-1 in total.
Sequestration in soils largely unknown ●●●
Storage and sequestration similar to protection. Differences might occur locally due to recreation impacts, lower mangrove age, species richness etc. ●●●
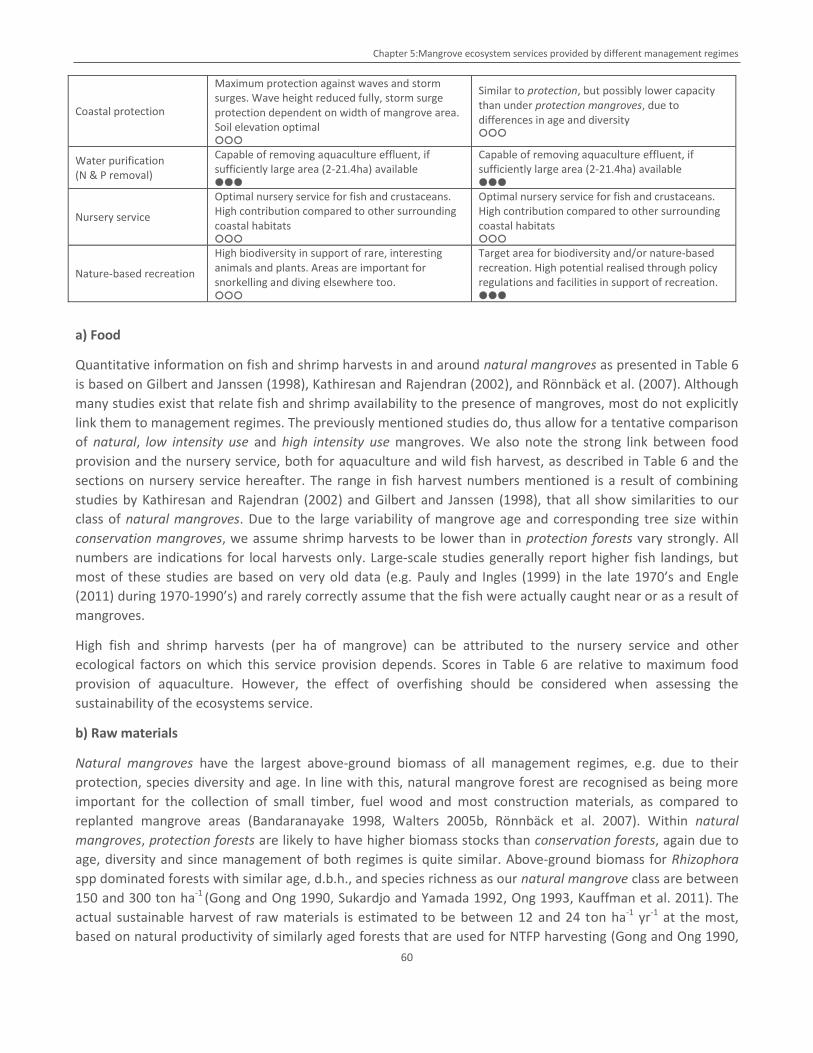
Chapter 5:Mangrove ecosystem services provided by different management regimes
60
Coastal protection
Maximum protection against waves and storm surges. Wave height reduced fully, storm surge protection dependent on width of mangrove area. Soil elevation optimal ○○○
Similar to protection, but possibly lower capacity than under protection mangroves, due to differences in age and diversity ○○○
Water purification (N & P removal)
Capable of removing aquaculture effluent, if sufficiently large area (2-21.4ha) available ●●●
Capable of removing aquaculture effluent, if sufficiently large area (2-21.4ha) available ●●●
Nursery service
Optimal nursery service for fish and crustaceans. High contribution compared to other surrounding coastal habitats ○○○
Optimal nursery service for fish and crustaceans. High contribution compared to other surrounding coastal habitats ○○○
Nature-based recreation
High biodiversity in support of rare, interesting animals and plants. Areas are important for snorkelling and diving elsewhere too. ○○○
Target area for biodiversity and/or nature-based recreation. High potential realised through policy regulations and facilities in support of recreation. ●●●
a) Food
Quantitative information on fish and shrimp harvests in and around natural mangroves as presented in Table 6
is based on Gilbert and Janssen (1998), Kathiresan and Rajendran (2002), and Rönnbäck et al. (2007). Although
many studies exist that relate fish and shrimp availability to the presence of mangroves, most do not explicitly
link them to management regimes. The previously mentioned studies do, thus allow for a tentative comparison
of natural, low intensity use and high intensity use mangroves. We also note the strong link between food
provision and the nursery service, both for aquaculture and wild fish harvest, as described in Table 6 and the
sections on nursery service hereafter. The range in fish harvest numbers mentioned is a result of combining
studies by Kathiresan and Rajendran (2002) and Gilbert and Janssen (1998), that all show similarities to our
class of natural mangroves. Due to the large variability of mangrove age and corresponding tree size within
conservation mangroves, we assume shrimp harvests to be lower than in protection forests vary strongly. All
numbers are indications for local harvests only. Large-scale studies generally report higher fish landings, but
most of these studies are based on very old data (e.g. Pauly and Ingles (1999) in the late 1970’s and Engle
(2011) during 1970-1990’s) and rarely correctly assume that the fish were actually caught near or as a result of
mangroves.
High fish and shrimp harvests (per ha of mangrove) can be attributed to the nursery service and other
ecological factors on which this service provision depends. Scores in Table 6 are relative to maximum food
provision of aquaculture. However, the effect of overfishing should be considered when assessing the
sustainability of the ecosystems service.
b) Raw materials
Natural mangroves have the largest above-ground biomass of all management regimes, e.g. due to their
protection, species diversity and age. In line with this, natural mangrove forest are recognised as being more
important for the collection of small timber, fuel wood and most construction materials, as compared to
replanted mangrove areas (Bandaranayake 1998, Walters 2005b, Rönnbäck et al. 2007). Within natural
mangroves, protection forests are likely to have higher biomass stocks than conservation forests, again due to
age, diversity and since management of both regimes is quite similar. Above-ground biomass for Rhizophora
spp dominated forests with similar age, d.b.h., and species richness as our natural mangrove class are between
150 and 300 ton ha-1 (Gong and Ong 1990, Sukardjo and Yamada 1992, Ong 1993, Kauffman et al. 2011). The
actual sustainable harvest of raw materials is estimated to be between 12 and 24 ton ha-1 yr-1 at the most,
based on natural productivity of similarly aged forests that are used for NTFP harvesting (Gong and Ong 1990,
Chapter 5:Mangrove ecosystem services provided by different management regimes
61
Ong 1993, Bosire et al. 2008). We expect that the raw material harvest in protection and conservation
mangrove will generally be lower than in these studies, because of lower accessibility for non-local
communities.
Biomass stands for conservation forests are lower and more variable, ranging from 90 to 250 ton ha-1 (Gong and
Ong 1990, Sukardjo and Yamada 1992, Ong 1993, Bosire et al. 2008). Based on the corresponding productivity
rates, we can expect maximum sustainable yields between 10 and 17 ton ha-1 yr-1 (Gong and Ong 1990, Ong
1993, Bosire et al. 2008). It remains to be seen what the actual harvest will be in protection and conservation
forests, but we expect it to be generally lower than indicated, because of reduced accessibility for non-local
communities.
c) Carbon storage and sequestration
Quantitative data on carbon storage and sequestration in Indonesia is scarce, and very few studies estimate
belowground carbon storage or sequestration, whilst the latter represents a major fraction of the total
amount. Moreover, most studies estimate carbon storage rather than sequestration, which is why we report
quantified state rather than performance of carbon sequestration. The few carbon sequestration data we can
provide are for aboveground biomass only and from studies of younger systems (plantations generally) outside
Indonesia (see section 5.3).
Reliable estimations of total carbon storage in Indonesian mangroves that match our protection and
conservation forest management regimes indicate ranges of 430-700 ton C ha-1 (Alongi et al. 2008, Alongi
2012). Quantified carbon storage data could be retrieved by matching d.b.h, species richness and mangrove
age in the cited studies to our classes. Additional studies on Indo-Pacific mangroves found both higher
(maximum over 1000 t C.ha-1) and lower outcomes, depending on the maximum soil depth being measured
(Ong 1993, Donato et al. 2011, Kauffman et al. 2011). Protection of 25-year-old mangrove forests in Malaysia,
that we consider to be similar to protection mangrove forests in Java, was calculated to prevent carbon
emissions from sediments of 75 ton C ha–1 yr–1 that would have been the result of conversion and 10 years of
inaction afterwards (Ong 1993). For mangroves that match the characteristics of our conservation forest
regime, this rate would be around 50 ton C ha–1 yr–1 (Ong 1993). Both estimations can be considered
conservative, as effects on soil carbon are only partly accounted for. This study by Ong (1993) serves to
illustrate that both conservation and protection areas have substantial potential for carbon storage and
sequestration.
Estimations by Alongi (2012) of global total carbon sequestration by mangrove forests indicate a rate of 174
ton C m-2 yr-1. However, data on sequestration are limited, incomplete, and should be treated with caution.
Conservation mangrove forests are likely to store less carbon because of assumed impacts from recreation, in
the form of boating, walking, littering, etc. We furthermore note that young conservation forests are likely to
store considerably less carbon but sequester more than mature conservation forests.
d) Coastal Protection
Although both management regimes within the natural mangroves category are highly suitable for coastal
protection, small differences are expected between protection and conservation forest management regimes in
terms of storm surge reduction and soil surface elevation. The conservation subcategory is likely to score
somewhat lower due to impacts of recreation and lower maturity and species richness. Moreover, protection
forests are specifically designated for coastal protection and other physical functions, and are locally governed,
i.e. by people who depend direct on coastal protection.
Chapter 5:Mangrove ecosystem services provided by different management regimes
62
Ample studies have proven the ability of natural mangroves to attenuate wind and swell waves. Because of the
species diversity, high age, density and length of roots, stems and branches, and related factors we assumed
that the projected area and structural diversity of natural mangroves is sufficiently large, and the mangrove
belt is sufficiently wide to attenuate smaller waves (Quartel et al. 2007, Tanaka 2008, Hashim et al. 2013). We
assume that the width of natural mangrove barriers generally exceeds the width of maximum 500 m required
for attenuation of waves height by 50 – 99% (McIvor et al. 2012a), because the high species diversity and age
that is required to classify as protection mangroves is highly unlikely to occur in just narrow stretches of
mangrove.
The ability of natural mangroves to reduce storm surges has been reported less often in literature, and most
estimations have been made for lower intensity surges and with less certainty on the exact contribution of
mangrove characteristics. However, the current understanding is that measured reductions in peak water
levels range from of 5 to 50 cm per kilometre of mangrove (McIvor et al. 2012b). This implies that a mangrove
belt several kilometres wide is needed to significantly reduce storm surge water levels. It has to be noted that,
unlike wave attenuation, this reduction is non-linear over distance travelled by the surge (Zhang et al. 2012).
Because of high diversity, age, density of roots, stems and branches and related factors, it can be assumed that
storm surges can be reduced almost entirely, provided that the width of the mangrove area is sufficient and
that the presence of rivers and open areas does not reduce the ability of mangroves to reduce peak water
levels (Krauss et al. 2009, Zhang et al. 2012).
We consider surface elevation in response to sea level rise to be highest in the natural mangrove category as
compared to all other categories, because of the occurrence of undisturbed soils with high sheer strength,
diversity of root types and naturalness (Krauss et al. 2003, McKee and Vervaeke 2009).
Our scores for coastal protection must be treated with caution and are quite uncertain, as indicated by the
open circles. Despite the fact that indicators such as maturity, species and structural diversity all point in the
right direction, in the end coastal protection depends on continuous width and projected area of the mangrove
area. These factors have not been explicitly taken into account in our definition of management regimes.
e) Water purification
Most studies have focused on the amount of N and P that could be removed per area unit of mangrove, in
which mangroves typically had a species diversity of 3 to 7 and an average age of at least 7 years. Hence, in
terms of species diversity and age, both protected and conservation management regimes can be assumed to
remove N and P from effluent of surrounding aquaculture ponds. The most-cited study on this topic was done
by Robertson and Phillips (1995), while Gautier (2002) and Primavera et al. (2007) offered useful additional
findings. Robertson and Phillips (1995) estimated that up 7.4 (N) and 21.4 (P) ha of mangrove forest would be
required to filter the nutrient load per hectare of intensive shrimp pond, respectively. Their characterisation of
intensive shrimp ponds corresponds with the one presented in Chapter 4, so it is fair to say that the values
present realistic maximum required areas of mangroves. For semi-intensive aquaculture ponds, Robertson and
Phillips (1995) estimated that 2.4 (N) and 2.8 (P) ha of mangroves would be needed. The values for N-removal
were confirmed by Primavera et al. (2007) (1.8–5.4 ha of mangroves per 1 ha pond) and Gautier (2002).
Altogether, the results of modelling and experimental studies show that the required amount of mangrove
cover is likely to be in the range of 2.4-9 ha for N removal, and 3-1.4 ha for P removal, although most results
indicate that for semi-intensive ponds the required amount would be around 2-6 ha for removal of both
components, and for intensive ponds 5-21.4 ha. Because of the required characteristics for water purification,
Chapter 5:Mangrove ecosystem services provided by different management regimes
63
natural mangroves would be highly suitable to provide the service, but this is of course dependent on the
location of the mangrove areas (generally not close to aquaculture ponds) and the spatial extent.
There are no differences to be expected between the two management regimes. The impact of large amounts
being deposited into natural mangrove forests have been studied by Primavera et al. (2007), among others.
They recommend incorporating settling ponds before release of effluent water to adjacent mangrove filters.
Their own experiments, with this settling pond incorporated into the approach, showed no lower growth and
regeneration in trials with 4 and 7 different mangrove species. In fact, in both systems an average benign effect
of effluent water on biomass growth was reported. The impacts on other aspects of biodiversity, such as faunal
abundance, have not been researched. This could be a reason for caution, as this could have consequences for
recreation and biodiversity per se.
f) Nursery service
Although the majority of the studies on nursery service have focused on natural mangrove forests, more
specific ecological and biophysical characteristics to enable matching with our management regimes in the
Javanese context are generally not provided. This is often due to the scale of the analysis and the fact that
coarse spatial data were used. Nonetheless, based on the qualitative factors that determine the nursery service
potential, we can assume that both protected and mangrove categories offer optimal nursery habitats for fish
and crustaceans. The low disturbance, high naturalness, maturity, species and structural diversity, and
presence of roots found in natural mangroves all contribute to this high potential. Moreover, it can be assumed
that natural mangrove forests are generally embedded in complex, integrated coastal and/or estuarine
systems, which implies that hydrological and hydrodynamic cycles are likely to be intact (Baran and Hambrey
1999, Rönnbäck 1999).
Studies that have attempted to quantify the contribution of mangrove forests to fish catch (see earlier section
on food) all point at the relatively high catch numbers as compared to other coastal habitats (e.g. Rönnbäck et
al. 2003). An extensive study by Kathiresan and Rajendran (2002), however indicated that with increasing
species diversity of mangrove forests the amount of fish and shrimp harvested also went up due to higher
“niche diversity”. Although this is primarily a harvest indication, it can also be seen as an indication that the
relative contribution of the nursery service is highest in forests with high mangrove species diversity. This
especially holds true for shellfish. Harvests of shellfish were three times higher in natural mangroves compared
to low and high intensity use systems.
The potential contribution of natural mangrove forests to shrimp spawns was assessed by Rönnbäck et al.
(2003). They concluded that, depending on the aquaculture intensity, between 0.2 and 2.4 m2 of natural
mangrove would be needed per kg shrimp, if all shrimp larvae would be natural. In the most intensive case,
Rönnbäck et al. (2003) calculated, this would mean that between 11.800-47.200 ha of mangrove forests would
be needed to support over 4000 ha of intensive shrimp farms.
Preliminary observations in Banyuwangi (Java, Indonesia), finally, indicate that the models by Yanez-Arancibia
et al. (1985) and Sasekumar and Chong (1987) provide an excellent basis for estimating the nursery service for
fish and shrimp, respectively. The observed fish harvest of 1.6 kg ha-1 day-1 was only 0.1 kg higher compared to
the model, whereas the observed shrimp harvest of 6 kg ha-1 day-1 was 0.5 kg lower compared to modelled
(Siahainenia and Damastuti 2013). Although these findings will have to be confirmed by repeated experiments
and models calibrated for the specific location, they offer an indication of the contribution of the low intensity
and natural mangrove forest management regimes in Java, Indonesia.
Chapter 5:Mangrove ecosystem services provided by different management regimes
64
g) Nature-based recreation
Most recreational activities take place in or are dependent on intact natural mangrove forests, but
management is necessary to accommodate and protect these. Policy regulations indicate that mangrove
conservation forests are designated for biodiversity conservation and activities related to ‘ecotourism’.
Although protected mangrove forests would have equally high potential for recreation, this potential is not fully
realised due to government restrictions. Recreation is allowed but not promoted in protected mangroves.
However, it should be pointed out that recreation in the proximity of mangroves, such as snorkelling, diving,
etc. depends entirely on the intactness and health of nearby mangrove ecosystems (Mathieu et al. 2003). In
this way, protection forests still contribute to nature-based recreation. Another reason why we score natural
mangroves high for nature-based recreation is the high biodiversity value and, consequently, the high
likelihood to watch birds and other wildlife (Salam et al. 2000, Laapo et al. 2012). By organising boat tours
around areas of high biodiversity (to watch birds, monkeys, etc.) recreation can also take place around
protected mangrove forests. The occurrence of high biodiversity, opportunity to fish and watch rare plant and
animal species combined with the supporting role for beach-recreation (snorkelling and diving) makes
protection forests crucial for nature-based recreation (Knight et al. 1997, Satyanarayana et al. 2012).
A typical example of a mangrove conservation forest facilitating eco-tourism and related activities is the
Tarakan Urban Protection Forest in East Kalimantan. It is a 9 ha mangrove ecosystem close to the commercial
centre of Tarakan city and is managed to promote functions such as education, research, green belt, and
monkey conservation. The Alas Purwo national park in Banyuwangi is another example of a successful
conservation area for recreation and tourism, but it has to be said that very few other examples can be found.
The combined focus on ecological and cultural functions is typical for conservation forests. Although
conservation forests in Java will not have the high biodiversity of protected forests, the opportunity created by
information stands, boardwalks, organised tours and other facilities will make conservation forests crucial
locations for nature-based recreation (Knight et al. 1997, Satyanarayana et al. 2012). It should be noted,
however, that not all mangrove conservation forests are necessarily ecotourism sites, as they can have other
functions as well. Because research on tourism in mangrove forests is very limited, and only one good example
of a properly managed conservation forest in Java could be found, our indications provided remain speculative,
especially regarding protection forests.
5.2. Low intensity use mangrove forests
We distinguish between mangrove production forests and unprotected mangrove forests. Both can be natural
or replanted mangrove areas. In this management category management activities should not significantly
alter the ecosystem’s biophysical properties and not involve construction of permanent infrastructure. Only
limited commercial use of mangrove forest resources is allowed (Government of Indonesia 2010, 2012). For a
detailed description of this category and the management regimes please see section 4.3.
The level of ecosystem services provision for low intensity use mangrove forests is generally high, but also more
variable as compared to natural mangrove forests. For example, the extraction of timber and NTFP influences
many other ecosystem services. These management activities are typical examples of in the low and high
intensity management categories. Table 7 provides an overview of the ecosystem services provided by low
intensity use mangroves.
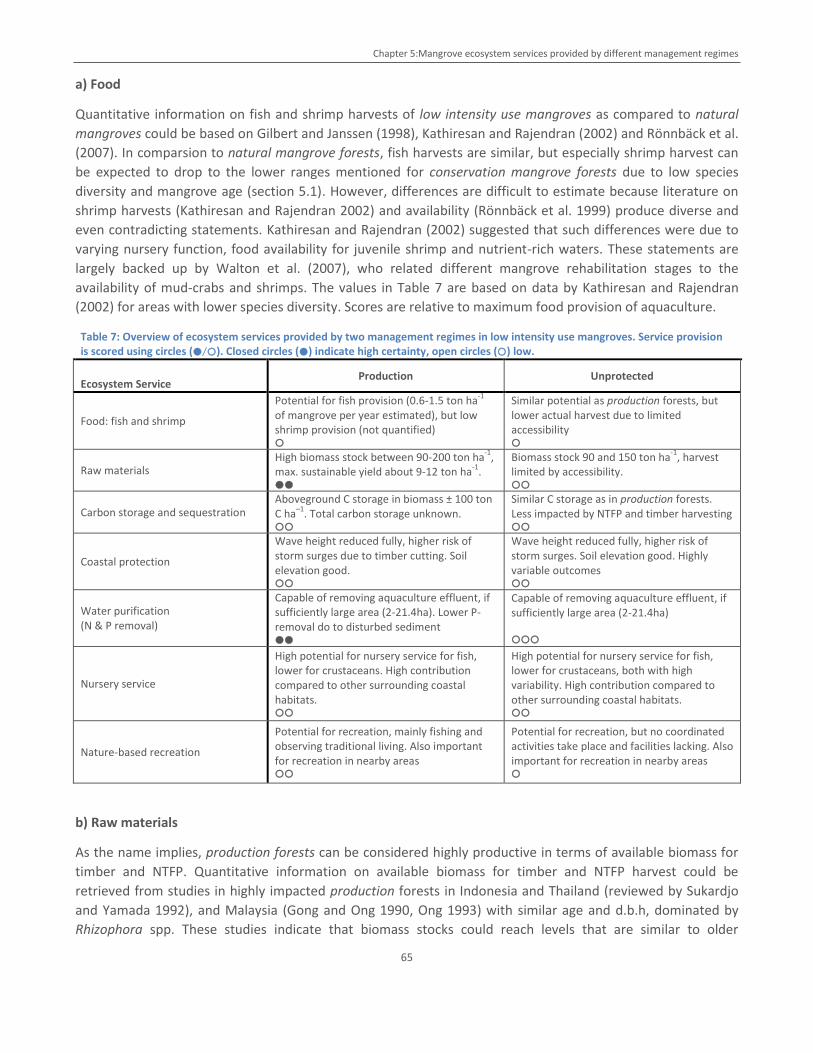
Chapter 5:Mangrove ecosystem services provided by different management regimes
65
a) Food
Quantitative information on fish and shrimp harvests of low intensity use mangroves as compared to natural
mangroves could be based on Gilbert and Janssen (1998), Kathiresan and Rajendran (2002) and Rönnbäck et al.
(2007). In comparsion to natural mangrove forests, fish harvests are similar, but especially shrimp harvest can
be expected to drop to the lower ranges mentioned for conservation mangrove forests due to low species
diversity and mangrove age (section 5.1). However, differences are difficult to estimate because literature on
shrimp harvests (Kathiresan and Rajendran 2002) and availability (Rönnbäck et al. 1999) produce diverse and
even contradicting statements. Kathiresan and Rajendran (2002) suggested that such differences were due to
varying nursery function, food availability for juvenile shrimp and nutrient-rich waters. These statements are
largely backed up by Walton et al. (2007), who related different mangrove rehabilitation stages to the
availability of mud-crabs and shrimps. The values in Table 7 are based on data by Kathiresan and Rajendran
(2002) for areas with lower species diversity. Scores are relative to maximum food provision of aquaculture.
Table 7: Overview of ecosystem services provided by two management regimes in low intensity use mangroves. Service provision is scored using circles (●/○). Closed circles (●) indicate high certainty, open circles (○) low.
Ecosystem Service Production Unprotected
Food: fish and shrimp
Potential for fish provision (0.6-1.5 ton ha-1
of mangrove per year estimated), but low shrimp provision (not quantified) ○
Similar potential as production forests, but lower actual harvest due to limited accessibility ○
Raw materials High biomass stock between 90-200 ton ha
-1,
max. sustainable yield about 9-12 ton ha-1
. ●●
Biomass stock 90 and 150 ton ha-1
, harvest limited by accessibility. ○○
Carbon storage and sequestration Aboveground C storage in biomass ± 100 ton C ha
–1. Total carbon storage unknown.
○○
Similar C storage as in production forests. Less impacted by NTFP and timber harvesting ○○
Coastal protection
Wave height reduced fully, higher risk of storm surges due to timber cutting. Soil elevation good. ○○
Wave height reduced fully, higher risk of storm surges. Soil elevation good. Highly variable outcomes ○○
Water purification (N & P removal)
Capable of removing aquaculture effluent, if sufficiently large area (2-21.4ha). Lower P-removal do to disturbed sediment ●●
Capable of removing aquaculture effluent, if sufficiently large area (2-21.4ha) ○○○
Nursery service
High potential for nursery service for fish, lower for crustaceans. High contribution compared to other surrounding coastal habitats. ○○
High potential for nursery service for fish, lower for crustaceans, both with high variability. High contribution compared to other surrounding coastal habitats. ○○
Nature-based recreation
Potential for recreation, mainly fishing and observing traditional living. Also important for recreation in nearby areas ○○
Potential for recreation, but no coordinated activities take place and facilities lacking. Also important for recreation in nearby areas ○
b) Raw materials
As the name implies, production forests can be considered highly productive in terms of available biomass for
timber and NTFP. Quantitative information on available biomass for timber and NTFP harvest could be
retrieved from studies in highly impacted production forests in Indonesia and Thailand (reviewed by Sukardjo
and Yamada 1992), and Malaysia (Gong and Ong 1990, Ong 1993) with similar age and d.b.h, dominated by
Rhizophora spp. These studies indicate that biomass stocks could reach levels that are similar to older
Chapter 5:Mangrove ecosystem services provided by different management regimes
66
protection forests. Due to heavy thinning, stem density numbers can double compared to similarly aged natural
mangrove forests (c.f. Bosire et al. 2008). Biomass levels for up to 13 years-old mangrove production forests
can reach 90 to 200 ton ha-1 year-1, and maximum sustainable yield levels are estimated at 9 to 12 ton ha-1
year-1 (Gong and Ong 1990, Sukardjo and Yamada 1992, Ong 1993, Bosire et al. 2008).
Unprotected mangroves are less heavily impacted and less accessible than production forests. Based on Gong
and Ong (1990), we assume that available biomass will be lower but still in the same order of magnitude and
actual biomass harvests well below maximum sustainable yield levels.
c) Carbon storage and sequestration
Reliable data of total carbon storage in forests that resemble Javanese production forests - in terms of age,
species richness, size and, to some extent, management activities of timber harvesting and high intensity NTFP
harvesting - are available from Malaysia (Ong 1993). Especially timber and NTFP harvesting affects the amount
of carbon stored and sequestered, as both affect biomass carbon pools and especially timber activities affect
soil carbon contents (Kairo et al. 2002, Bosire et al. 2008). How carbon storage is affected precisely is difficult
to estimate, as this is dependent on specific management practices and effects on soil carbon are
understudied. Typically, mangroves of the age of conservation forests would have around 500 ton C ha–1
(Kauffman et al. 2013) and this number will be lower in production forest due to management impacts
although studies have reported stable carbon storage of production forests that are efficiently managed (e.g.
Ong 1993, Bosire et al. 2008). Aboveground biomass is likely to be impacted by management activities, and
would typically be around 100 ton C ha–1, which is considerably lower than similarly aged but not harvested
mangrove areas (Ong 1993, Bosire et al. 2008). Lower amounts of standing biomass is a useful and reliable
indicator for lower amount of total carbon storage, but the big unknown is how soil carbon is affected.
Unprotected mangrove forests may score higher in terms of carbon storage when assuming that human
impacts are considerably lower. Nonetheless, we provide the same score as for production forests, but we
acknowledge the wide range of possible outcomes.
d) Coastal Protection
Wave attenuation may occur fully in production forests, because of the sufficiently high age, large roots and
considerable diversity of mangrove species, assuming that the mangrove width is sufficient. Moreover, the
species that generally occur in low intensity use mangroves have been positively correlated to wave
attenuation and, to a lesser extent, storm surge protection (Mazda et al. 1997b, Mazda et al. 2006, Quartel et
al. 2007).
Differences occur between the low intensity use management regimes, due to the impacts of high intensity
extraction of timber and NRFP in production forests and the unpredictable situation in unprotected mangroves.
Production forests are likely to have more open areas as a result of timber extraction, which increases the risk
of storm surges (Krauss et al. 2009). The potential for coastal protection of an unprotected area is highly
variable. If undisturbed, the potential for coastal protection could be as high as young mangrove conservation
forests, especially because unprotected areas often occur close to aquaculture or inhabited areas. Due to the
tree age of both management regimes, it can be assumed that surface elevation may be able to keep up with
sea level rise if sufficient sediment is available, albeit not at the same level as natural areas (McKee and
Vervaeke 2009). We note that species and structural diversity, and root length of low intensity use mangroves
are lower compared to that of natural mangroves and therefore their overall potential for coastal protection is
scored lower.
Chapter 5:Mangrove ecosystem services provided by different management regimes
67
e) Water purification
We consider the potential of production forests for water purification of surrounding aquaculture ponds to be
comparable to natural mangroves, in view of their age, presence of roots, size, presence of saplings and young
trees, and expected structure (Robertson and Phillips 1995, Li et al. 2008). Mangrove production forests could
even benefit from filtering excess nutrients, as Primavera et al. (2007) and Gautier (2002) showed that
production forests’ productivity could even benefit from filtering excess N, due to frequent timber and NTFP
harvesting. The extraction of timber and NTFP could mean a reduced ability to take up P, because of disturbed
sediments due to timber and NTFP harvesting (Li et al. 2008). This would be less likely to apply to unprotected
mangrove forests, as timber extraction does not take place.
f) Nursery service
The potential of low intensity use areas to provide the nursery service is expected to be generally lower and
more variable as compared to natural mangroves, especially for shrimp. This is due to increased disturbance,
decreased naturalness, maturity, species and structural diversity. It can be assumed that production and
unprotected forests have a similar potential for nursery, although this is the result of different factors. Higher
pressures as a result of timber and high intensity NTFP extraction and a general lack of conservation in
production forests will likely result in interrupted hydrodynamic cycles and hampered connectivity with other
ecosystems (Rönnbäck 1999). However, literature suggests that even mangroves with lower species diversity
can provide considerable nursery service, because they are still embedded in coastal and / or estuarine
ecosystems (Baran and Hambrey 1999, Rönnbäck 1999). Studies by Rönnbäck et al. (1999), Primavera (1998),
Walton et al. (2007), and others suggest that even with lower species diversity and lower age of mangroves,
considerable amounts of fish and crustaceans could be expected. Studies into harvests, e.g. Kathiresan and
Rajendran (2002) and Janssen and Padilla (1996), largely confirm this, although the amount of shrimp caught
can be expected to drop more quickly than fish. As we have to assume connectedness with other ecosystems
for both management regimes, it is difficult to provide scores for the nursery service. All other indicators point
at a considerable potential for nursery.
Unprotected mangroves are likely to suffer less from disturbance by timber and NTFP extraction than
protection forest, but assumptions on connectedness with other ecosystems are difficult to make.
g) Nature-based recreation
Recreation and eco-tourism is allowed in production forests, and because of the naturalness and opportunities
to fish, watch birds, etc. recreation is a serious option in production forests. Compared to natural mangroves,
there are few places of natural or spiritual interest in low intensity use mangroves, but especially fishing could
be an interesting activity to promote. In addition, production forests might be an interesting location to
observe traditional agriculture and hunting. Due to their remoteness and lack of facilities, unprotected
mangroves can be assumed to have very low potential for recreation. Both regimes could, however, be
important for recreation in nearby coastal areas (Mathieu et al. 2003).
5.3. High intensity use mangrove systems
High intensity use mangrove forests are formally regarded as rehabilitation sites of mangrove vegetation
(Government of Indonesia 2012). They are characterised by a small-scale combination of forested, converted
and/or restored mangroves. In these forests, management that targets provision of fish or timber is combined
or integrated with mangrove restoration or conservation management, although generally the emphasis lies on
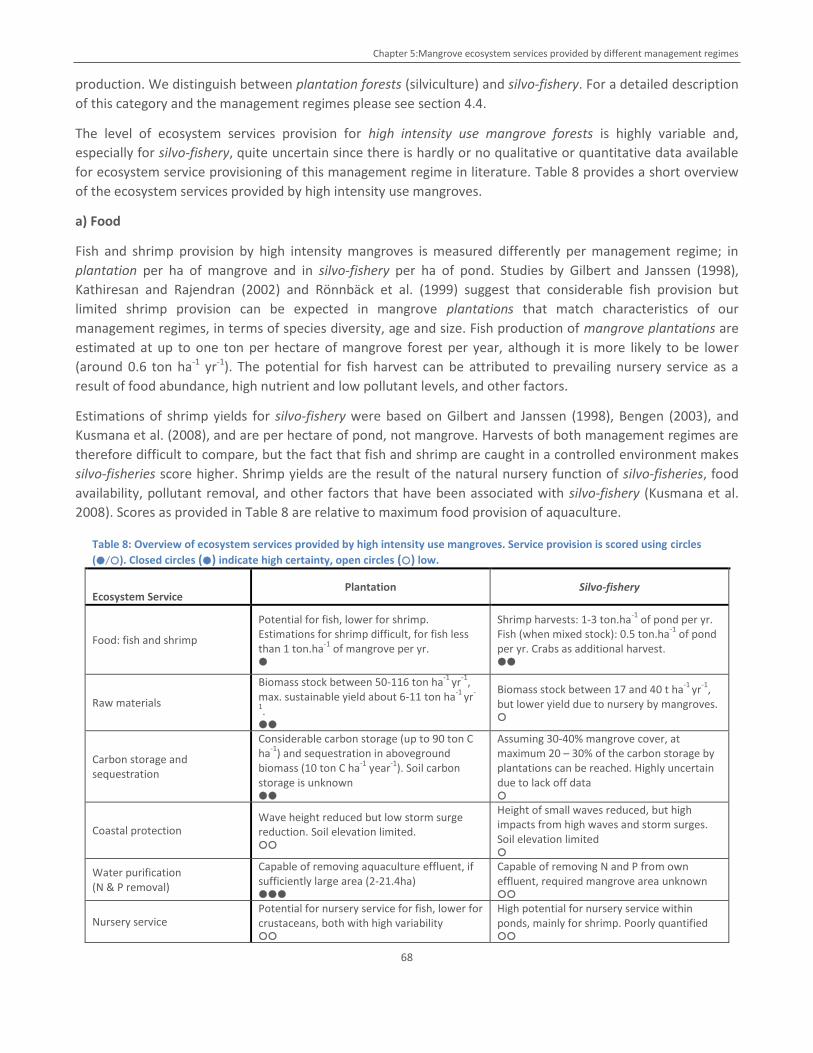
Chapter 5:Mangrove ecosystem services provided by different management regimes
68
production. We distinguish between plantation forests (silviculture) and silvo-fishery. For a detailed description
of this category and the management regimes please see section 4.4.
The level of ecosystem services provision for high intensity use mangrove forests is highly variable and,
especially for silvo-fishery, quite uncertain since there is hardly or no qualitative or quantitative data available
for ecosystem service provisioning of this management regime in literature. Table 8 provides a short overview
of the ecosystem services provided by high intensity use mangroves.
a) Food
Fish and shrimp provision by high intensity mangroves is measured differently per management regime; in
plantation per ha of mangrove and in silvo-fishery per ha of pond. Studies by Gilbert and Janssen (1998),
Kathiresan and Rajendran (2002) and Rönnbäck et al. (1999) suggest that considerable fish provision but
limited shrimp provision can be expected in mangrove plantations that match characteristics of our
management regimes, in terms of species diversity, age and size. Fish production of mangrove plantations are
estimated at up to one ton per hectare of mangrove forest per year, although it is more likely to be lower
(around 0.6 ton ha-1 yr-1). The potential for fish harvest can be attributed to prevailing nursery service as a
result of food abundance, high nutrient and low pollutant levels, and other factors.
Estimations of shrimp yields for silvo-fishery were based on Gilbert and Janssen (1998), Bengen (2003), and
Kusmana et al. (2008), and are per hectare of pond, not mangrove. Harvests of both management regimes are
therefore difficult to compare, but the fact that fish and shrimp are caught in a controlled environment makes
silvo-fisheries score higher. Shrimp yields are the result of the natural nursery function of silvo-fisheries, food
availability, pollutant removal, and other factors that have been associated with silvo-fishery (Kusmana et al.
2008). Scores as provided in Table 8 are relative to maximum food provision of aquaculture.
Table 8: Overview of ecosystem services provided by high intensity use mangroves. Service provision is scored using circles
(●/○). Closed circles (●) indicate high certainty, open circles (○) low.
Ecosystem Service Plantation Silvo-fishery
Food: fish and shrimp
Potential for fish, lower for shrimp. Estimations for shrimp difficult, for fish less than 1 ton.ha
-1 of mangrove per yr.
●
Shrimp harvests: 1-3 ton.ha-1
of pond per yr. Fish (when mixed stock): 0.5 ton.ha
-1 of pond
per yr. Crabs as additional harvest. ●●
Raw materials
Biomass stock between 50-116 ton ha-1
yr-1
, max. sustainable yield about 6-11 ton ha
-1 yr
-
1. ●●
Biomass stock between 17 and 40 t ha-1
yr-1
, but lower yield due to nursery by mangroves. ○
Carbon storage and sequestration
Considerable carbon storage (up to 90 ton C ha
-1) and sequestration in aboveground
biomass (10 ton C ha-1
year-1
). Soil carbon storage is unknown
●●
Assuming 30-40% mangrove cover, at maximum 20 – 30% of the carbon storage by plantations can be reached. Highly uncertain due to lack off data ○
Coastal protection Wave height reduced but low storm surge reduction. Soil elevation limited. ○○
Height of small waves reduced, but high impacts from high waves and storm surges. Soil elevation limited ○
Water purification (N & P removal)
Capable of removing aquaculture effluent, if sufficiently large area (2-21.4ha) ●●●
Capable of removing N and P from own effluent, required mangrove area unknown ○○
Nursery service Potential for nursery service for fish, lower for crustaceans, both with high variability ○○
High potential for nursery service within ponds, mainly for shrimp. Poorly quantified ○○
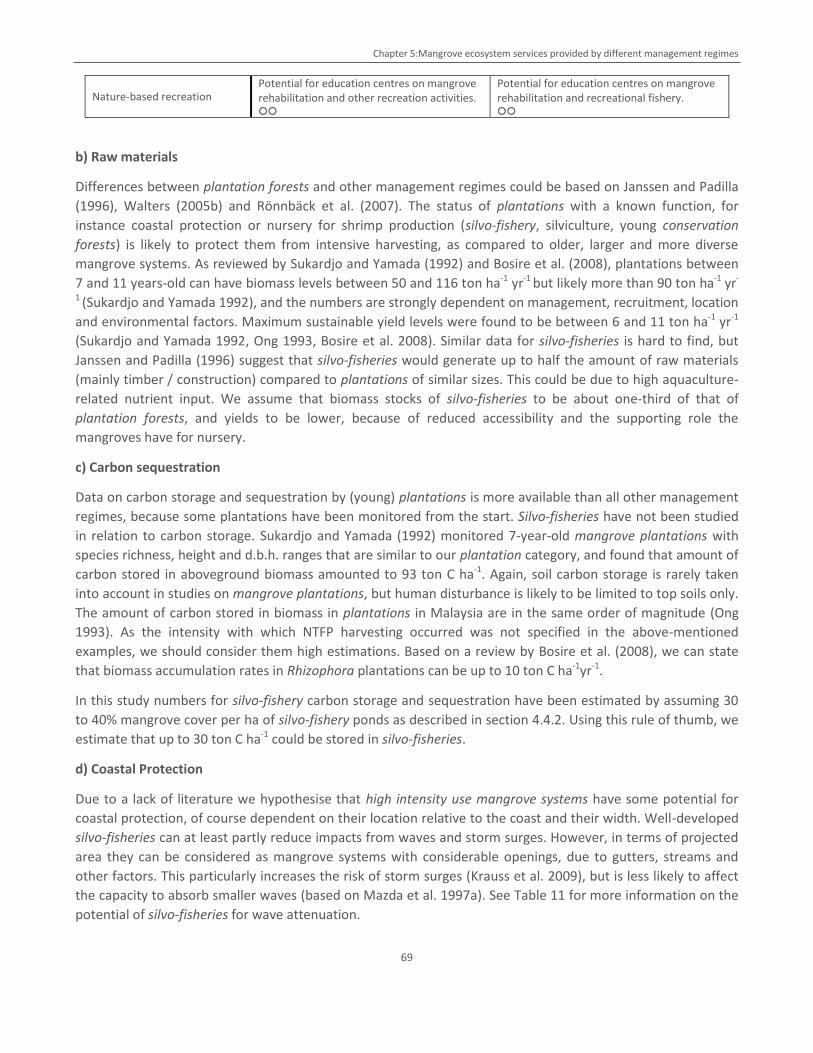
Chapter 5:Mangrove ecosystem services provided by different management regimes
69
Nature-based recreation Potential for education centres on mangrove rehabilitation and other recreation activities. ○○
Potential for education centres on mangrove rehabilitation and recreational fishery. ○○
b) Raw materials
Differences between plantation forests and other management regimes could be based on Janssen and Padilla
(1996), Walters (2005b) and Rönnbäck et al. (2007). The status of plantations with a known function, for
instance coastal protection or nursery for shrimp production (silvo-fishery, silviculture, young conservation
forests) is likely to protect them from intensive harvesting, as compared to older, larger and more diverse
mangrove systems. As reviewed by Sukardjo and Yamada (1992) and Bosire et al. (2008), plantations between
7 and 11 years-old can have biomass levels between 50 and 116 ton ha-1 yr-1 but likely more than 90 ton ha-1 yr-
1 (Sukardjo and Yamada 1992), and the numbers are strongly dependent on management, recruitment, location
and environmental factors. Maximum sustainable yield levels were found to be between 6 and 11 ton ha-1 yr-1
(Sukardjo and Yamada 1992, Ong 1993, Bosire et al. 2008). Similar data for silvo-fisheries is hard to find, but
Janssen and Padilla (1996) suggest that silvo-fisheries would generate up to half the amount of raw materials
(mainly timber / construction) compared to plantations of similar sizes. This could be due to high aquaculture-
related nutrient input. We assume that biomass stocks of silvo-fisheries to be about one-third of that of
plantation forests, and yields to be lower, because of reduced accessibility and the supporting role the
mangroves have for nursery.
c) Carbon sequestration
Data on carbon storage and sequestration by (young) plantations is more available than all other management
regimes, because some plantations have been monitored from the start. Silvo-fisheries have not been studied
in relation to carbon storage. Sukardjo and Yamada (1992) monitored 7-year-old mangrove plantations with
species richness, height and d.b.h. ranges that are similar to our plantation category, and found that amount of
carbon stored in aboveground biomass amounted to 93 ton C ha-1. Again, soil carbon storage is rarely taken
into account in studies on mangrove plantations, but human disturbance is likely to be limited to top soils only.
The amount of carbon stored in biomass in plantations in Malaysia are in the same order of magnitude (Ong
1993). As the intensity with which NTFP harvesting occurred was not specified in the above-mentioned
examples, we should consider them high estimations. Based on a review by Bosire et al. (2008), we can state
that biomass accumulation rates in Rhizophora plantations can be up to 10 ton C ha-1yr-1.
In this study numbers for silvo-fishery carbon storage and sequestration have been estimated by assuming 30
to 40% mangrove cover per ha of silvo-fishery ponds as described in section 4.4.2. Using this rule of thumb, we
estimate that up to 30 ton C ha-1 could be stored in silvo-fisheries.
d) Coastal Protection
Due to a lack of literature we hypothesise that high intensity use mangrove systems have some potential for
coastal protection, of course dependent on their location relative to the coast and their width. Well-developed
silvo-fisheries can at least partly reduce impacts from waves and storm surges. However, in terms of projected
area they can be considered as mangrove systems with considerable openings, due to gutters, streams and
other factors. This particularly increases the risk of storm surges (Krauss et al. 2009), but is less likely to affect
the capacity to absorb smaller waves (based on Mazda et al. 1997a). See Table 11 for more information on the
potential of silvo-fisheries for wave attenuation.
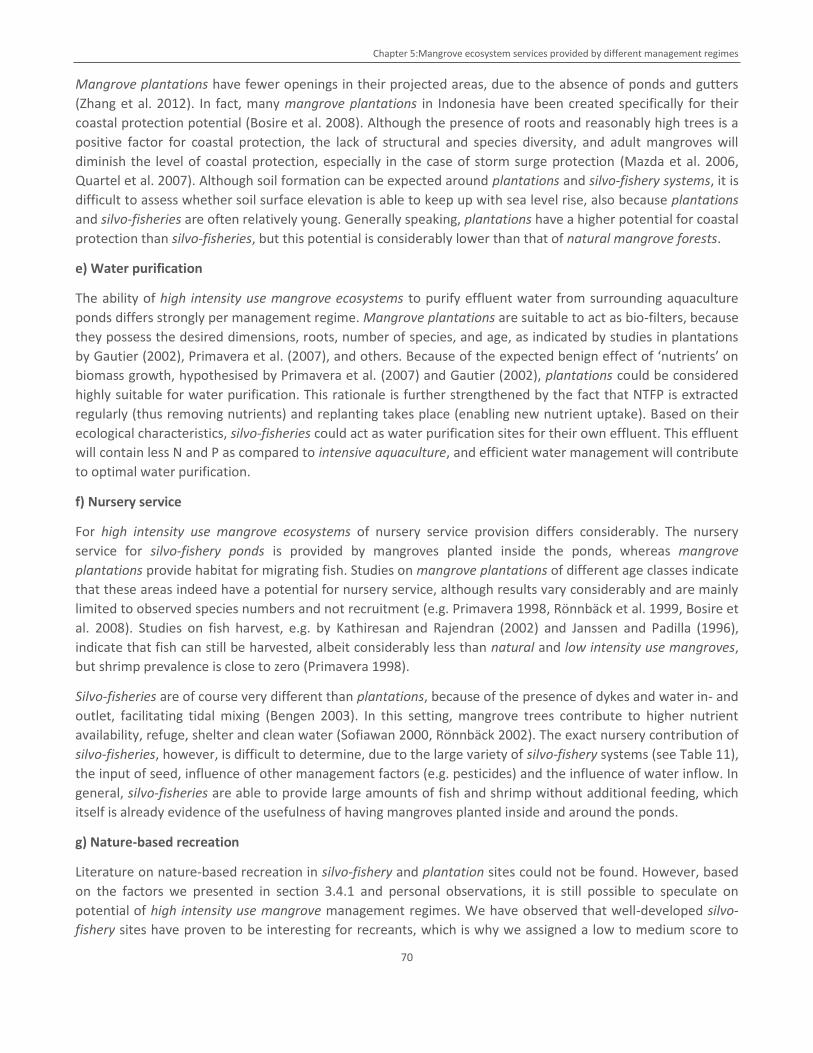
Chapter 5:Mangrove ecosystem services provided by different management regimes
70
Mangrove plantations have fewer openings in their projected areas, due to the absence of ponds and gutters
(Zhang et al. 2012). In fact, many mangrove plantations in Indonesia have been created specifically for their
coastal protection potential (Bosire et al. 2008). Although the presence of roots and reasonably high trees is a
positive factor for coastal protection, the lack of structural and species diversity, and adult mangroves will
diminish the level of coastal protection, especially in the case of storm surge protection (Mazda et al. 2006,
Quartel et al. 2007). Although soil formation can be expected around plantations and silvo-fishery systems, it is
difficult to assess whether soil surface elevation is able to keep up with sea level rise, also because plantations
and silvo-fisheries are often relatively young. Generally speaking, plantations have a higher potential for coastal
protection than silvo-fisheries, but this potential is considerably lower than that of natural mangrove forests.
e) Water purification
The ability of high intensity use mangrove ecosystems to purify effluent water from surrounding aquaculture
ponds differs strongly per management regime. Mangrove plantations are suitable to act as bio-filters, because
they possess the desired dimensions, roots, number of species, and age, as indicated by studies in plantations
by Gautier (2002), Primavera et al. (2007), and others. Because of the expected benign effect of ‘nutrients’ on
biomass growth, hypothesised by Primavera et al. (2007) and Gautier (2002), plantations could be considered
highly suitable for water purification. This rationale is further strengthened by the fact that NTFP is extracted
regularly (thus removing nutrients) and replanting takes place (enabling new nutrient uptake). Based on their
ecological characteristics, silvo-fisheries could act as water purification sites for their own effluent. This effluent
will contain less N and P as compared to intensive aquaculture, and efficient water management will contribute
to optimal water purification.
f) Nursery service
For high intensity use mangrove ecosystems of nursery service provision differs considerably. The nursery
service for silvo-fishery ponds is provided by mangroves planted inside the ponds, whereas mangrove
plantations provide habitat for migrating fish. Studies on mangrove plantations of different age classes indicate
that these areas indeed have a potential for nursery service, although results vary considerably and are mainly
limited to observed species numbers and not recruitment (e.g. Primavera 1998, Rönnbäck et al. 1999, Bosire et
al. 2008). Studies on fish harvest, e.g. by Kathiresan and Rajendran (2002) and Janssen and Padilla (1996),
indicate that fish can still be harvested, albeit considerably less than natural and low intensity use mangroves,
but shrimp prevalence is close to zero (Primavera 1998).
Silvo-fisheries are of course very different than plantations, because of the presence of dykes and water in- and
outlet, facilitating tidal mixing (Bengen 2003). In this setting, mangrove trees contribute to higher nutrient
availability, refuge, shelter and clean water (Sofiawan 2000, Rönnbäck 2002). The exact nursery contribution of
silvo-fisheries, however, is difficult to determine, due to the large variety of silvo-fishery systems (see Table 11),
the input of seed, influence of other management factors (e.g. pesticides) and the influence of water inflow. In
general, silvo-fisheries are able to provide large amounts of fish and shrimp without additional feeding, which
itself is already evidence of the usefulness of having mangroves planted inside and around the ponds.
g) Nature-based recreation
Literature on nature-based recreation in silvo-fishery and plantation sites could not be found. However, based
on the factors we presented in section 3.4.1 and personal observations, it is still possible to speculate on
potential of high intensity use mangrove management regimes. We have observed that well-developed silvo-
fishery sites have proven to be interesting for recreants, which is why we assigned a low to medium score to
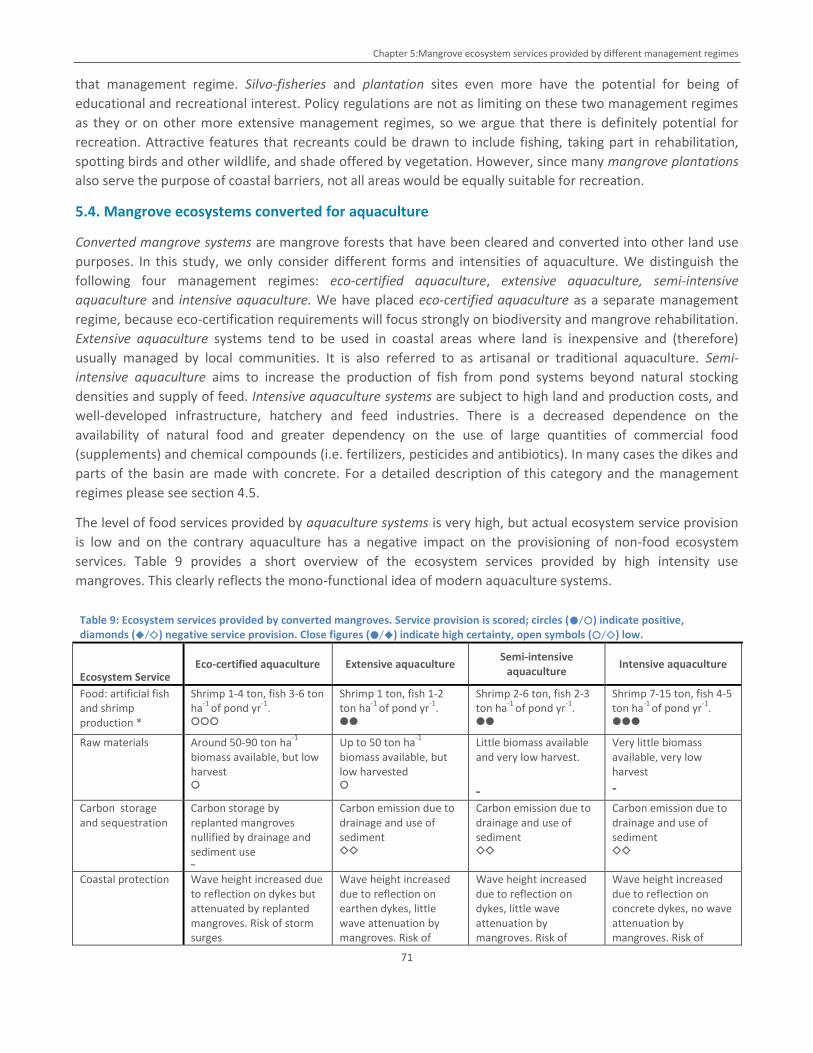
Chapter 5:Mangrove ecosystem services provided by different management regimes
71
that management regime. Silvo-fisheries and plantation sites even more have the potential for being of
educational and recreational interest. Policy regulations are not as limiting on these two management regimes
as they or on other more extensive management regimes, so we argue that there is definitely potential for
recreation. Attractive features that recreants could be drawn to include fishing, taking part in rehabilitation,
spotting birds and other wildlife, and shade offered by vegetation. However, since many mangrove plantations
also serve the purpose of coastal barriers, not all areas would be equally suitable for recreation.
5.4. Mangrove ecosystems converted for aquaculture
Converted mangrove systems are mangrove forests that have been cleared and converted into other land use
purposes. In this study, we only consider different forms and intensities of aquaculture. We distinguish the
following four management regimes: eco-certified aquaculture, extensive aquaculture, semi-intensive
aquaculture and intensive aquaculture. We have placed eco-certified aquaculture as a separate management
regime, because eco-certification requirements will focus strongly on biodiversity and mangrove rehabilitation.
Extensive aquaculture systems tend to be used in coastal areas where land is inexpensive and (therefore)
usually managed by local communities. It is also referred to as artisanal or traditional aquaculture. Semi-
intensive aquaculture aims to increase the production of fish from pond systems beyond natural stocking
densities and supply of feed. Intensive aquaculture systems are subject to high land and production costs, and
well-developed infrastructure, hatchery and feed industries. There is a decreased dependence on the
availability of natural food and greater dependency on the use of large quantities of commercial food
(supplements) and chemical compounds (i.e. fertilizers, pesticides and antibiotics). In many cases the dikes and
parts of the basin are made with concrete. For a detailed description of this category and the management
regimes please see section 4.5.
The level of food services provided by aquaculture systems is very high, but actual ecosystem service provision
is low and on the contrary aquaculture has a negative impact on the provisioning of non-food ecosystem
services. Table 9 provides a short overview of the ecosystem services provided by high intensity use
mangroves. This clearly reflects the mono-functional idea of modern aquaculture systems.
Table 9: Ecosystem services provided by converted mangroves. Service provision is scored; circles (●/○) indicate positive, diamonds (◆/◇) negative service provision. Close figures (●/◆) indicate high certainty, open symbols (○/◇) low.
Ecosystem Service Eco-certified aquaculture Extensive aquaculture
Semi-intensive aquaculture
Intensive aquaculture
Food: artificial fish and shrimp production *
Shrimp 1-4 ton, fish 3-6 ton ha
-1 of pond yr
-1.
○○○
Shrimp 1 ton, fish 1-2 ton ha
-1 of pond yr
-1.
●●
Shrimp 2-6 ton, fish 2-3 ton ha
-1 of pond yr
-1.
●●
Shrimp 7-15 ton, fish 4-5 ton ha
-1 of pond yr
-1.
●●●
Raw materials Around 50-90 ton ha-1
biomass available, but low harvest ○
Up to 50 ton ha-1
biomass available, but low harvested ○
Little biomass available and very low harvest.
-
Very little biomass available, very low harvest
-
Carbon storage and sequestration
Carbon storage by replanted mangroves nullified by drainage and sediment use -
Carbon emission due to drainage and use of sediment ◇◇
Carbon emission due to drainage and use of sediment ◇◇
Carbon emission due to drainage and use of sediment ◇◇
Coastal protection Wave height increased due to reflection on dykes but attenuated by replanted mangroves. Risk of storm surges
Wave height increased due to reflection on earthen dykes, little wave attenuation by mangroves. Risk of
Wave height increased due to reflection on dykes, little wave attenuation by mangroves. Risk of
Wave height increased due to reflection on concrete dykes, no wave attenuation by mangroves. Risk of
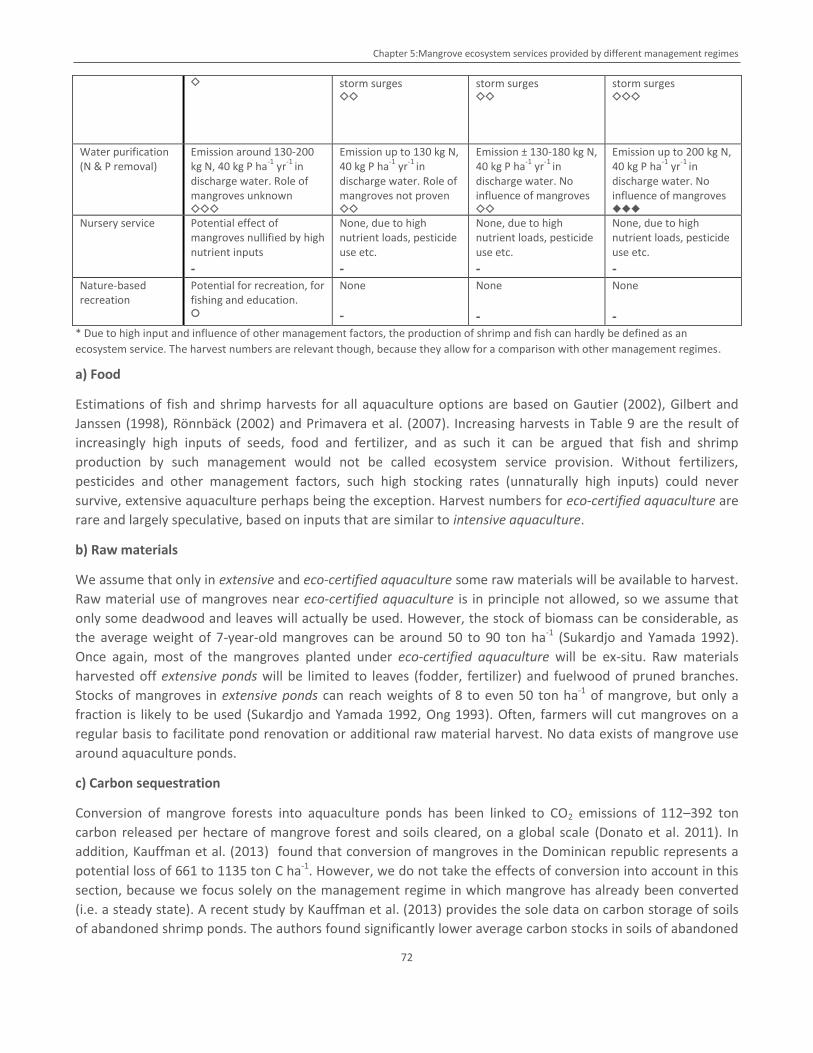
Chapter 5:Mangrove ecosystem services provided by different management regimes
72
◇ storm surges ◇◇
storm surges ◇◇
storm surges ◇◇◇
Water purification (N & P removal)
Emission around 130-200 kg N, 40 kg P ha
-1 yr
-1 in
discharge water. Role of mangroves unknown ◇◇◇
Emission up to 130 kg N, 40 kg P ha
-1 yr
-1 in
discharge water. Role of mangroves not proven ◇◇
Emission ± 130-180 kg N, 40 kg P ha
-1 yr
-1 in
discharge water. No influence of mangroves ◇◇
Emission up to 200 kg N, 40 kg P ha
-1 yr
-1 in
discharge water. No influence of mangroves ◆◆◆
Nursery service Potential effect of mangroves nullified by high nutrient inputs
-
None, due to high nutrient loads, pesticide use etc.
-
None, due to high nutrient loads, pesticide use etc.
-
None, due to high nutrient loads, pesticide use etc.
-
Nature-based recreation
Potential for recreation, for fishing and education. ○
None
-
None
-
None
-
* Due to high input and influence of other management factors, the production of shrimp and fish can hardly be defined as an
ecosystem service. The harvest numbers are relevant though, because they allow for a comparison with other management regimes.
a) Food
Estimations of fish and shrimp harvests for all aquaculture options are based on Gautier (2002), Gilbert and
Janssen (1998), Rönnbäck (2002) and Primavera et al. (2007). Increasing harvests in Table 9 are the result of
increasingly high inputs of seeds, food and fertilizer, and as such it can be argued that fish and shrimp
production by such management would not be called ecosystem service provision. Without fertilizers,
pesticides and other management factors, such high stocking rates (unnaturally high inputs) could never
survive, extensive aquaculture perhaps being the exception. Harvest numbers for eco-certified aquaculture are
rare and largely speculative, based on inputs that are similar to intensive aquaculture.
b) Raw materials
We assume that only in extensive and eco-certified aquaculture some raw materials will be available to harvest.
Raw material use of mangroves near eco-certified aquaculture is in principle not allowed, so we assume that
only some deadwood and leaves will actually be used. However, the stock of biomass can be considerable, as
the average weight of 7-year-old mangroves can be around 50 to 90 ton ha-1 (Sukardjo and Yamada 1992).
Once again, most of the mangroves planted under eco-certified aquaculture will be ex-situ. Raw materials
harvested off extensive ponds will be limited to leaves (fodder, fertilizer) and fuelwood of pruned branches.
Stocks of mangroves in extensive ponds can reach weights of 8 to even 50 ton ha-1 of mangrove, but only a
fraction is likely to be used (Sukardjo and Yamada 1992, Ong 1993). Often, farmers will cut mangroves on a
regular basis to facilitate pond renovation or additional raw material harvest. No data exists of mangrove use
around aquaculture ponds.
c) Carbon sequestration
Conversion of mangrove forests into aquaculture ponds has been linked to CO2 emissions of 112–392 ton
carbon released per hectare of mangrove forest and soils cleared, on a global scale (Donato et al. 2011). In
addition, Kauffman et al. (2013) found that conversion of mangroves in the Dominican republic represents a
potential loss of 661 to 1135 ton C ha-1. However, we do not take the effects of conversion into account in this
section, because we focus solely on the management regime in which mangrove has already been converted
(i.e. a steady state). A recent study by Kauffman et al. (2013) provides the sole data on carbon storage of soils
of abandoned shrimp ponds. The authors found significantly lower average carbon stocks in soils of abandoned
Chapter 5:Mangrove ecosystem services provided by different management regimes
73
shrimp ponds, namely 95 ton C ha-1, compared to the average of 853 ton C ha-1 in all other mangrove forests,
possibly indicating the loss of carbon after mangrove conversion to aquaculture. This number of 95 ton C is an
indicator of the state of abandoned shrimp ponds only, and definitely not of the performance in terms of
carbon sequestration.
Moreover, due to the management activities in most active aquaculture ponds, we assume that the carbon is
more likely to be released than sequestered. As indicated by Ong (1993), carbon loss from oxidizing sediments
can be up to 75 ton C ha–1.yr–1 in converted mangrove areas. In addition, shrimp and fish farmers in Java tend
to drain their ponds at least twice a year and dig up soil to fortify their dykes and other structures. In
combination, these activities lead to further loss of soil carbon (Kautsky et al. 2000, Mcleod et al. 2011). We
therefore assume that extensive, semi-intensive, and intensive aquaculture are net emitters of carbon. The few
mangroves that are found around the ponds are frequently pruned and/or replaced, and do not contribute to
additional productivity that is stored within the aquaculture system. Eco-certified aquaculture, on the other
hand, could potentially contribute to carbon storage, through mangrove rehabilitation and protection that is
required. However, this is highly uncertain, as eco-certification is still under development, and no specifics of
the rehabilitation are known. In-situ rehabilitation and replanting is required by various governmental
regulations and mangrove trees within the system need to be of considerable age and size. This could indicate
a potential of eco-certification to store carbon. However, a lot would depend on how sediments are treated; if
sediment management is similar to that of other aquaculture options, then it is likely that eco-certified
aquaculture will also result in net carbon emissions.
d) Coastal Protection
Most aquaculture ponds are surrounded by earthen or concrete dykes, some of which with mangrove trees
planted on them. Although these dykes may offer some protection against wave impacts in the short term,
they do not buffer against storm surges. Moreover, Winterwerp et al. (2013) demonstrated that in the longer
term dykes exacerbate erosion in former mangrove mud coasts. Hard structures, such as aquaculture pond
bunds and breakwaters, disturb the balance of incoming and outgoing sediment. Waves reflect on the
structure, becoming increase in height and take more sediment away. These bigger waves can erode two to
four times more soil in front of the hard structure, eventually leading to the collapse of the structure. Such
collapsed sea walls are useless in preventing erosion, but still increase the height of the waves (Winterwerp et
al. 2013; Figure 14). Hence, this can be considered a disservice. Only some extensive and eco-certified
aquaculture systems could be able to reduce some of the height of incoming waves as a result of replanted or
remaining mangrove stretches of sufficient age. However, the roots are still extremely small, and the trees are
generally uniform in size and pruned, which reduces the already minimal projected area of the mangrove rows
and areas. Finally, eco-certified aquaculture could contribute to coastal protection and mangrove rehabilitation
in general, mostly through ex-situ measures. Since this will generally involve establishing a greenbelt, this might
lead to more effective coastal protection.
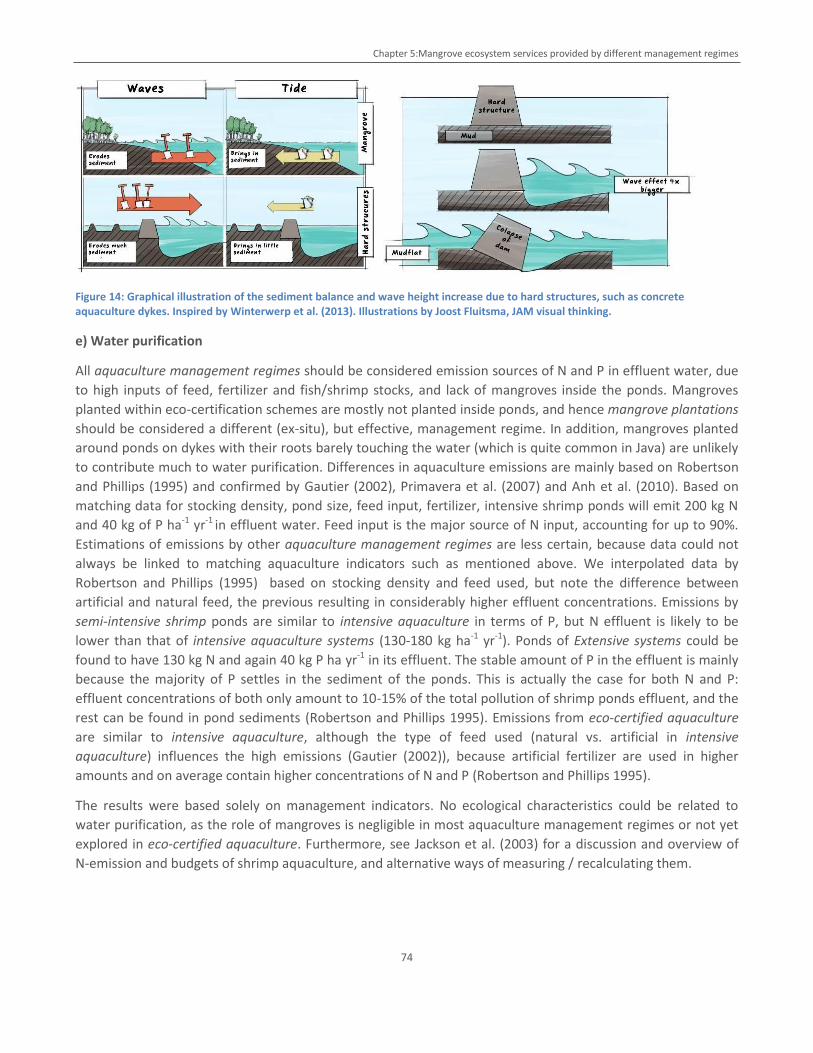
Chapter 5:Mangrove ecosystem services provided by different management regimes
74
Figure 14: Graphical illustration of the sediment balance and wave height increase due to hard structures, such as concrete aquaculture dykes. Inspired by Winterwerp et al. (2013). Illustrations by Joost Fluitsma, JAM visual thinking.
e) Water purification
All aquaculture management regimes should be considered emission sources of N and P in effluent water, due
to high inputs of feed, fertilizer and fish/shrimp stocks, and lack of mangroves inside the ponds. Mangroves
planted within eco-certification schemes are mostly not planted inside ponds, and hence mangrove plantations
should be considered a different (ex-situ), but effective, management regime. In addition, mangroves planted
around ponds on dykes with their roots barely touching the water (which is quite common in Java) are unlikely
to contribute much to water purification. Differences in aquaculture emissions are mainly based on Robertson
and Phillips (1995) and confirmed by Gautier (2002), Primavera et al. (2007) and Anh et al. (2010). Based on
matching data for stocking density, pond size, feed input, fertilizer, intensive shrimp ponds will emit 200 kg N
and 40 kg of P ha-1 yr-1 in effluent water. Feed input is the major source of N input, accounting for up to 90%.
Estimations of emissions by other aquaculture management regimes are less certain, because data could not
always be linked to matching aquaculture indicators such as mentioned above. We interpolated data by
Robertson and Phillips (1995) based on stocking density and feed used, but note the difference between
artificial and natural feed, the previous resulting in considerably higher effluent concentrations. Emissions by
semi-intensive shrimp ponds are similar to intensive aquaculture in terms of P, but N effluent is likely to be
lower than that of intensive aquaculture systems (130-180 kg ha-1 yr-1). Ponds of Extensive systems could be
found to have 130 kg N and again 40 kg P ha yr-1 in its effluent. The stable amount of P in the effluent is mainly
because the majority of P settles in the sediment of the ponds. This is actually the case for both N and P:
effluent concentrations of both only amount to 10-15% of the total pollution of shrimp ponds effluent, and the
rest can be found in pond sediments (Robertson and Phillips 1995). Emissions from eco-certified aquaculture
are similar to intensive aquaculture, although the type of feed used (natural vs. artificial in intensive
aquaculture) influences the high emissions (Gautier (2002)), because artificial fertilizer are used in higher
amounts and on average contain higher concentrations of N and P (Robertson and Phillips 1995).
The results were based solely on management indicators. No ecological characteristics could be related to
water purification, as the role of mangroves is negligible in most aquaculture management regimes or not yet
explored in eco-certified aquaculture. Furthermore, see Jackson et al. (2003) for a discussion and overview of
N-emission and budgets of shrimp aquaculture, and alternative ways of measuring / recalculating them.
Chapter 5:Mangrove ecosystem services provided by different management regimes
75
f) Nursery service
In principle, none of the aquaculture management regimes provides real nursery functions. The fact that
extensive aquaculture systems require no additional feeding can be attributed to the nutritional value of the
inflowing water, and not to mangroves that have been planted on dykes. Eco-certified aquaculture could in
principle be capable of contributing to the nursery service ex- and in-situ, if integrated or combined with silvo-
fishery or other areas. The high nutrient concentrations in the water due to high inputs likely prevent natural
nursery, and no shelter can be provided for either fish or shrimp. The likelihood for potential nursery decreases
with increasing intensity of aquaculture, due to usage of pesticides, fertilizer, nutrients, and drainage of ponds.
g) Nature-based recreation
Due to the absence of natural features that could be of interest to recreants we can assume that no recreation
service is provided in aquaculture sites. Eco-certified shrimp ponds have the potential to become tourist
attractions, just like silvo-fisheries, because of their role in mangrove rehabilitation (education and ecological
interest) and shrimp aquaculture.
5.5. Abandoned aquaculture
As stated in Section 4.6, this category is characterised by severe environmental problems, such as polluted
soils, degraded biodiversity, remaining concrete or metal structures (Stevenson 1997, Lamb and Gilmour 2003).
One of the most comprehensive studies on abandoned ponds in Thailand was done by Stevenson (1997). He
found that acid sulfate soils were reported in 50% of the abandoned ponds. This can lead to destroyed food
resources, displaced biota, high (toxic) aluminium and iron concentrations and other altered physical and
chemical properties. In addition, the soil is also likely to be strongly altered due to the clearance of mangroves,
cultivation of shrimp and fish and abandonment. Soil erosion will be high, whereas soil water storage and
biodiversity of soul fauna is likely to be lowered. In addition, sediment levels will be high (increased transport),
as will organic and inorganic constituents, with strongly depleted soil organic matter through leaching and
mineralization.
Although some of the abandoned sites are being used for alternative purposes such as housing or storage, we
can assume that provision of fish and shrimp, and raw materials is low to non-existent. Nursery service cannot
be provide either, as is depend on species diversity, age and biomass of mangrove trees. In addition, nature-
based recreation is also unlikely to take place, because of the lack of actual nature, and polluted water and
soils. However, carbon sequestration, coastal protection and water purification require some explanation, as
the biggest problem related to abandoned ponds lies in their sediments and remaining structures.
A recent study by Kauffman et al. (2013) provides a rare look into the carbon storage of soils of abandoned
shrimp ponds. The authors found significantly lower average carbon storage in abandoned shrimp ponds,
namely 95 ton C ha-1, compared to the average of 853 ton C ha-1 in all other mangrove areas. Much would
depend on what happens to the remaining sediment. It is unlikely to be dug up and reused as is the case in
active aquaculture ponds, but will still continue to oxidise and emit carbon (Ong 1993). Despite the fact that
soils of abandoned ponds capture carbon, they must not be considered as contributing to sequestration,
because of the lack of vegetation (i.e. production) and decreased drainage conditions. Therefore, abandoned
ponds get a negative score, albeit that their emission is probably lower than that of active aquaculture due to
lack of active management. Soils of abandoned aquaculture ponds are not only high in carbon that could be
released, but also N and P are fixed into sediments. The majority of aquaculture effluent is stored in sediments,
not in effluent water, so abandoned ponds can be seen as sources of continuous pollution of excess nutrients.
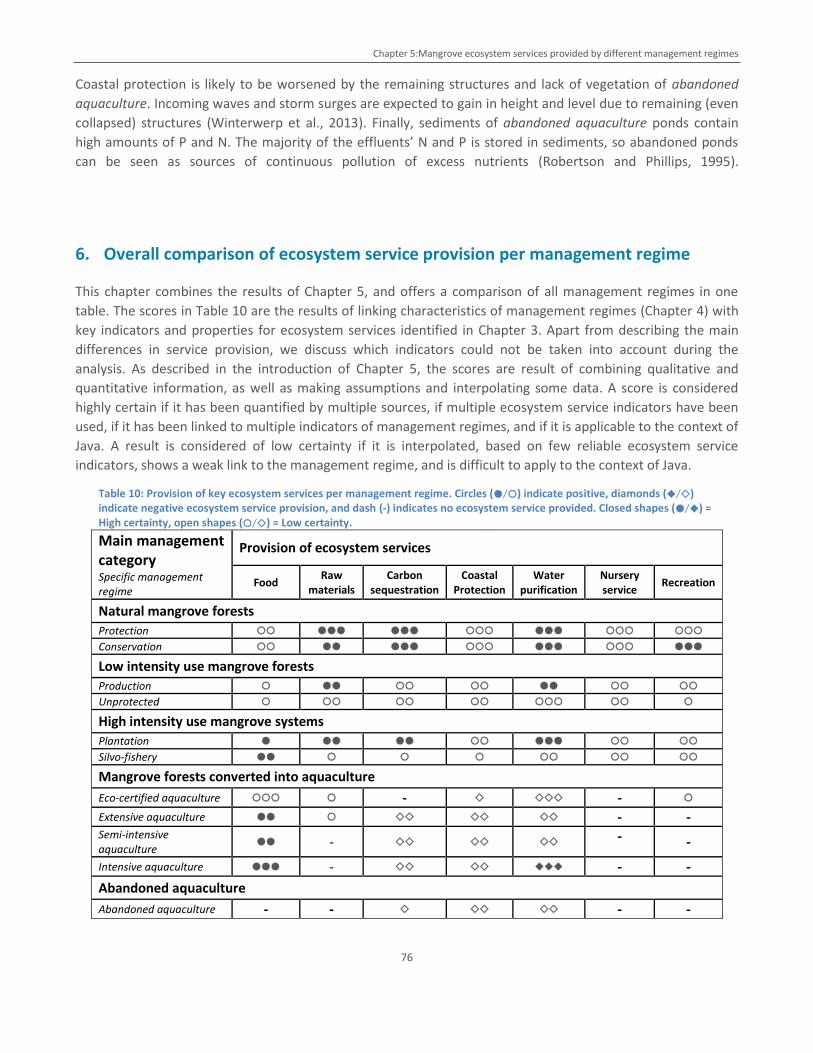
Chapter 5:Mangrove ecosystem services provided by different management regimes
76
Coastal protection is likely to be worsened by the remaining structures and lack of vegetation of abandoned
aquaculture. Incoming waves and storm surges are expected to gain in height and level due to remaining (even
collapsed) structures (Winterwerp et al., 2013). Finally, sediments of abandoned aquaculture ponds contain
high amounts of P and N. The majority of the effluents’ N and P is stored in sediments, so abandoned ponds
can be seen as sources of continuous pollution of excess nutrients (Robertson and Phillips, 1995).
6. Overall comparison of ecosystem service provision per management regime
This chapter combines the results of Chapter 5, and offers a comparison of all management regimes in one
table. The scores in Table 10 are the results of linking characteristics of management regimes (Chapter 4) with
key indicators and properties for ecosystem services identified in Chapter 3. Apart from describing the main
differences in service provision, we discuss which indicators could not be taken into account during the
analysis. As described in the introduction of Chapter 5, the scores are result of combining qualitative and
quantitative information, as well as making assumptions and interpolating some data. A score is considered
highly certain if it has been quantified by multiple sources, if multiple ecosystem service indicators have been
used, if it has been linked to multiple indicators of management regimes, and if it is applicable to the context of
Java. A result is considered of low certainty if it is interpolated, based on few reliable ecosystem service
indicators, shows a weak link to the management regime, and is difficult to apply to the context of Java.
Table 10: Provision of key ecosystem services per management regime. Circles (●/○) indicate positive, diamonds (◆/◇) indicate negative ecosystem service provision, and dash (-) indicates no ecosystem service provided. Closed shapes (●/◆) = High certainty, open shapes (○/◇) = Low certainty.
Main management category Specific management regime
Provision of ecosystem services
Food Raw
materials Carbon
sequestration Coastal
Protection Water
purification Nursery service
Recreation
Natural mangrove forests
Protection ○○ ●●● ●●● ○○○ ●●● ○○○ ○○○
Conservation ○○ ●● ●●● ○○○ ●●● ○○○ ●●●
Low intensity use mangrove forests
Production ○ ●● ○○ ○○ ●● ○○ ○○
Unprotected ○ ○○ ○○ ○○ ○○○ ○○ ○
High intensity use mangrove systems
Plantation ● ●● ●● ○○ ●●● ○○ ○○
Silvo-fishery ●● ○ ○ ○ ○○ ○○ ○○
Mangrove forests converted into aquaculture
Eco-certified aquaculture ○○○ ○ - ◇ ◇◇◇ - ○
Extensive aquaculture ●● ○ ◇◇ ◇◇ ◇◇ - - Semi-intensive aquaculture
●● - ◇◇ ◇◇ ◇◇ - -
Intensive aquaculture ●●● - ◇◇ ◇◇ ◆◆◆ - -
Abandoned aquaculture
Abandoned aquaculture - - ◇ ◇◇ ◇◇ - -
Chapter 6: Overall comparison of ecosystem service provision per management regime
77
6.1. Comparison per ecosystem service
For each ecosystem service we describe important differences and possible explanation for these differences.
For most services we were only able to estimate potential provision, and only for food, raw materials and
water purifications were we able to estimate actual provision. We note that raw materials’ provision is strongly
linked to carbon sequestration (negative correlation) and that food provision depends on most regulating
services as well as nursery.
a) Food
As explained in Section 3.1.1, we explicitly distinguish between natural and artificial fish and shrimp
production, i.e. caught around mangrove areas or kept in confined aquaculture ponds. A comparison of
amounts harvested between natural ecosystems and aquaculture ponds is problematic, because generally only
harvests from the latter can really be related to a defined area. Gilbert and Janssen (1998) and Kathiresan and
Rajendran (2002) present harvests for almost all management regimes, which allowed us to compare the
potential provision per management regime, albeith with different units. We would like to stress, that natural,
low intensity use mangroves and plantations can be best compared with it each other (the highest amount of
fish provided by protection forests), and the different aquaculture options can best be compared between
themselves and to some extent to silvo-fishery. The unit used for aquaculture and silvo-fishery is tonnes per
hectare of pond, whereas all other management regimes refer to tonnes per hectare of mangrove. The scores
in Table 10 are relative to maximum food provision of aquaculture, not of protection forests.
Potentially the highest amount of naturally caught fish and shrimp is linked to protected and mangrove
conservation forests, respectively. All low intensity use mangroves were considered to have potential for fish
and shrimp harvesting, although shrimp numbers were generally reported to plummet with decreasing
mangrove species richness and increasing human impacts. This is especially noticeable in studies on mangrove
plantations with relatively young mangroves, where some fish but rarely any shrimp could be caught. All in all,
however, quantitative information on fish and shrimp harvests for the first three categories of management
regimes could only be sporadically found and is highly variable. As a result it was not only difficult to find
reliable harvest numbers, but also to relate these numbers to various management regimes. In contrast,
harvest numbers for aquaculture options were easier to get hold off and compare, except for certified organic
aquaculture. We see that with increasing intensity (higher feeding, stocking and fertiliser application) the
harvests also increase. It remains to be seen, though, that the net economic benefits from more intensive
aquaculture are also higher, because of potentially higher costs for personal and inputs. High fish and shrimp
harvests in natural systems can be attributed to present nursery service and all ecological factors on which the
provision depends. However, the effect of overfishing should be considered when assessing the sustainability
of the ecosystems service.
b) Raw materials
Available above-ground biomass was considered an indicator for potential raw materials provision, and several
assumptions were for calculating actual maximum sustainable yields. We used biomass levels as measured and
reviewed by Gong and Ong (1990), Sukardjo and Yamada (1992), Ong (1993), Bosire et al. (2008), andKauffman
et al. (2011), which could be linked to species richness, age and corresponding indicators of tree size. However,
an important indicator we did not consider was stem density. Stem density has often been related to biomass
levels related to management impacts, but was difficult to generalise and link to a specific management
regime. We therefore provided ranges for different measurements done in Indonesia, Malaysia and Thailand.
Data for most management regimes was abundant, but for unprotected areas, silvo-fisheries and aquaculture
Chapter 6: Overall comparison of ecosystem service provision per management regime
78
interpolations had to be made. Moreover, forests of different age respond differently to management
pressures. The information on biomass levels is strongly related to carbon sequestration potential (see below),
although we use a different unit (total mass vs. mass of carbon stored) and only include above-ground biomass
in the analysis of raw materials, as compared to total above- and belowground biomass and soil for carbon
sequestration.
Mangrove wood is generally used for construction and fuel wood, and less for timber. Although the location
relative to villages was also pointed out as a key factor, we could not really account for that. We should
furthermore note that, despite restrictions in place, conservation forests and protection forests are still likely to
be under pressure from quite intensive, illegal harvesting. Despite the abundance of data, not much
information is available on the impact of different harvesting techniques of raw materials (Walters 2005b).
Despite the fact that species have been linked to many different uses and applications (see Appendix 3), we
found that occurrence of species is a less important factor for the provision of raw materials. Only for some
species have people been reported to travel further (c.f. Walters 2005b), but these species are generally quite
widely distributed. Despite its lower significance we have provided a table in which we relate the occurrence of
the best reported mangrove species to the different management regimes in Appendix 3. The information in
Appendix 3 is probably more relevant for medicinal plants and wild foods, as we could not provide quantitative
information of specific raw material use per management regime.
c) Carbon sequestration
The assessment of carbon storage and carbon sequestration entails crucially different methods and time scales,
as well as careful consideration of where carbon is actually stored and/or sequestered. Carbon storage can be
seen as a state indicator for carbon sequestration, and is in fact more often studied than actual sequestration.
Potential carbon sequestration is the difference between carbon stocks of intact mangrove forests and those of
forests that have been impacted by human management or other factors (Mcleod et al. 2011, Kauffman et al.
2013). Therefore, by looking at Table 10 from top to bottom, differences between management regimes can be
regarded as potential carbon sequestration due to rehabilitation or, conversely, as potential emission resulted
by mangrove conversion. As reported earlier, conversion into aquaculture ponds can result in CO2 emissions of
112–392 ton carbon ha-1 year-1 (Donato et al. 2011). However, carbon sequestration rates will not reach this
order of magnitude, as it is process that takes much longer (Mcleod et al. 2011). Carbon storage decreased per
management regime with decreasing age and size of mangrove trees, but plantations can be seen as an
important regime to stabilize carbon storage or even enable sequestration. Quantitative data on carbon
sequestration in Indonesia is scarce, and very few studies estimate carbon storage by roots and soils, which
represents a major fraction of the total number. Moreover, most studies estimate carbon storage rather than
sequestration, which is why we report quantified state rather than performance of carbon sequestration. Most
reliable data on carbon storage could be retrieved for natural mangroves, whereas information on actual
sequestration was more readily available for mangrove plantations. Carbon stocks of soils are especially
understudied, as well as impacts of management on these stocks. This was the major cause for uncertainties of
results. We could retrieve most information based on management state indicators of age, d.b.h., length and
species number, but found it more difficult to account for effects of timber harvesting in production forests as
well as effects of recreation on carbon sequestration and storage in other management regimes. Other factors
we did not take into account included inundation and species composition. Finally, temporal aspects are
difficult to account for within this analysis.
Chapter 6: Overall comparison of ecosystem service provision per management regime
79
d) Coastal Protection
Coastal protection can be divided into wind and swell wave attenuation, storm surge reduction and soil surface
elevation. Ours is an assessment of the potential for coastal protection only, as evidence on actual coastal
protection is limited to wave attenuation and is mostly not provided per management regime.
The scores for coastal protection take into account the potential of different management regimes to
contribute to wind and swell wave attenuation, as well as storm surge protection. The main factors that
contribute to this potential include the projected area of mangroves because of diversity in structures and
mangrove species, presence of roots, the width of a mangrove area, and topography. The potential of
management regimes to provide coastal protection decreases with decreasing naturalness, age and species
diversity of the mangroves. Important factors we could not take into account are width of mangrove belt and
projected area. Therefore, our scores are highly uncertain but can still be seen as a valid relative estimation of
coastal protection potential. Management factors that influence coastal protection potential include timber
extraction and other activities that create openings in the projected area of mangroves.
The amount of information available for wind and swell waves is sufficient to back up the scores in Table 10,
but research on storm surges and especially soil surface elevation is limited. Management regimes on which
less is known include unprotected areas and silvo-fisheries. One of the most important factors that could not
fully be taken into account was the width of the mangrove area. Although it could be argued that more mature
and species-rich areas required a minimum size that exceeds that of the required mangrove area for coastal
protection, this cannot be stated with certainty. The difference in coastal protection potential is furthermore
based on projected area, which is largely determined by species diversity, height, age, presence of roots, stems
and branches. Finally, aquaculture systems and silvo-fisheries have limited potential to buffer impacts of waves
and especially storm surges. The constructed dykes would buffer some wave impacts, but the lack of projected
area in either option would constitute a high risk of storm surges. Silvo-fisheries and some eco-certified
aquaculture could buffer some storm surge impacts, although most of the potential as a result of eco-certified
aquaculture would be ex-situ.
e) Water purification
We consider water purification as the ability of mangroves to take up (inorganic) nitrogen (N) and phosphorus
(P). Conversely, emission of the same compounds can be seen as a ‘negative’ service. Most aquaculture options
can be considered as providing a negative or ‘disservice’, but most other management regimes could
contribute to water purification of both N and P. However, for the potential provision of water purification we
assumed that areas would be bordering aquaculture ponds and sufficient area of mangrove forest would be
available. This had to be assumed, since our management regimes are not spatially explicit. Altogether the
results of modelling and experimental studies show that the required minimum area of mangrove forest is
likely to be in the range of 2.4-9 ha for N removal, and 3-21.4 ha for P removal, although most results indicate
that for semi-intensive ponds the required amount would be around 2-6 ha for removal of both components,
and for intensive ponds 5-21.4 ha.
The scores provided in Table 10 could not be based on spatial extent, but we could consider information on
potential for biomass harvesting and regrowth/replanting, sufficient age (> 6 years), healthy roots, and stable
muddy sediment. Because fully matured ecosystems are neither required nor preferred for water purification,
mangrove production forests and plantations seem equally suitable as natural mangroves (Gautier 2002,
Primavera et al. 2007). Another reason for this high potential lies in the fact that harvesting of NTFP, as well as
replanting, has a positive effect on water purification. However, timber wood extraction in production forests is
Chapter 6: Overall comparison of ecosystem service provision per management regime
80
likely to decrease the system’s ability to take up P in the sediment (Li et al. 2008). The role of silvo-fisheries in
water purification is not fully proven yet, but our ‘ideal’ silvo-fishery should capture all nutrients from its own
system. Another difference in ability to purify water between low intensity and natural mangrove areas lies in
the presence of saplings, and relatively younger trees.
We note that most of the N and P emissions from aquaculture systems (about 85%) can actually be found in
pond sediments. Furthermore, N and P removal from water only constitutes a small part of the nutrient cycle
within mangrove ecosystems and aquaculture systems. We refer to Jackson et al. (2003) for a discussion and
overview of N-emission and budgets of shrimp aquaculture, and Twilley and Day (1999) for an overview of
mangrove ecosystems’ nutrient cycle. Furthermore, most sources on N removal did not take into account
nutrient loss through denitrification. Although taking this into account would substantially lower the required
amount of mangrove (estimated 0.04-0.12 per ha of pond (Rivera-Monroy et al. 1999)), it would entail many
unresolved uncertainties. Moreover, the area required for effective P removal would not change due to this
difference in results, thus the total required area would remain the same.
f) Nursery service for fish and crustaceans
Mangrove ecosystems can be considered to have added value as nursery grounds for fish species and
crustaceans if their contribution to the production of juveniles is larger than that of other ecosystem types
(Baran and Hambrey 1999, Sheridan and Hays 2003). This can be in the form of shelter, food and refuge, which
increases growth, production and spawning opportunities (Walters et al. 2008). With decreasing age and
diversity of mangrove species, mangrove management regimes become less suitable nursery grounds. Many
indicators such as root length, structural diversity, species diversity, and lack of pollution could be accounted
for, but assumptions had to be made on the connectivity of mangrove ecosystems with sea grass beds, coral
reefs and un-vegetated shallows (the mud flats). Mangrove ecosystems are more likely to be nursery grounds
when connected to any of these ecosystems, but we could not account for this. However, it can be assumed
that protection and conservation mangrove forests, unprotected and some production forests have the
potential to provide nursery. Results are highly uncertain, because mostly qualitative and some quantitative
information was used. In addition, only potential but no actual nursery could be indicated, although the
provision of food (indicated above) could serve as an appropriate proxy. We furthermore note that nursery for
shrimp is more severely impacted by management intensity compared to fish populations (Baran and Hambrey
1999, Rönnbäck 1999).
g) Nature-based recreation
For nature-based recreation a clear distinction between natural, low intensity use and other areas can be
found. This is mainly based on the fact that we can safely assume that most recreational activities take place or
are dependent on intact mangrove areas. Moreover, because in most mangrove conservation forests the focus
is more on recreation and tourism, we assigned these categories the highest score. These areas not only have a
well-protected biodiversity, but are also most likely to have the government-stimulated management directed
towards recreation. An important condition for recreation around natural mangroves would be to reduce
impacts from users, for instance through limiting access to vulnerable places and promoting organised boat
tours instead of individual boat rental. Moreover, it should be pointed out that recreation close to, but not
around mangroves, such as snorkelling, diving, etc. still strongly depends on the intactness and health of
mangrove systems. Several well-developed silvo-fishery sites have proven to be interesting for recreants, which
is why we assigned a low to medium score to that management regime.
Chapter 6: Overall comparison of ecosystem service provision per management regime
81
6.2. Comparison per management regime
Based on Table 10, it can be stated that natural mangrove forests achieve the highest total scores for total
ecosystem service provision. Especially protection forests provide maximum amounts of regulating, cultural
and nursery services, which result in high provision of raw materials and food as well. Difference between
protection and conservation forests are largely due to recreation impacts as well as differences in governance
(local vs. central).
Low intensity use mangrove forests score lower for each ecosystem service. This is mainly due the limited
maturity of Java’s production forests; literature shows that more mature production forests are likely to provide
more raw materials due to their high productivity. Results for unprotected mangrove forests are highly
uncertain, and scores for regulating services by production forests were difficult to verify.
Results on high intensity use mangrove systems are highly variable and uncertain. Plantation forests score
relatively high, and most results have a high certainty, due to extensive research on mangrove plantations in
relation to natural mangrove forests. Plantations’ potential for water purification are particularly interesting,
because of the possible combination of raw material harvest and removal of effluent nutrients. Results on
silvo-fishery systems are highly uncertain, but offer a glimpse of what silvo-fishery systems might be able to
provide in terms of total ecosystem service provision. Silvo-fisheries have the potential to provide provisioning,
regulating and nursery services, simply be existing and maturing, without the need for intensive management
and heavily impacting activities.
Aquaculture systems are managed for the purpose of food production, and this shows clearly in Table 10. None
of the other services is provided, and negative scores are even assigned on water purification and carbon
sequestration. The role of sediments in aquaculture pond management is crucial, as sound management could
prevent additional nutrient and carbon emissions.
7. Discussion of methodological aspects and implications for decision making
The overall objective of this technical paper was to review the current state of mangrove ecosystem services
and relate their provision to different mangrove management regimes in Java, Indonesia. Here, we shortly
discuss the two crucial elements of this report’s methodology, namely the management regime typology and
our indicator-based approach towards quantifying ecosystem services. We reflect on advantages and
shortcomings of these two crucial methodological aspects from a decision-making perspective. Finally, we
consider the implications of this report’s findings for coastal management and decision making.
7.1. Management regime typology: illustrating management decisions
The typology of management regimes and corresponding states should be regarded primarily as an analytical
tool to assess effects of management on ecosystem service provision and not a precise account of Java’s
coastal mangrove systems. However, the eleven management regimes are firmly grounded on Java’s and
Indonesia’s policy reality, and can be considered realistic albeit simplified ‘snapshots’ of mangrove
management. The typology captures most of Java’s and even the Indonesia’s current reality in terms of policy
regulations and human activities that are likely to take place. Especially the ecological and biophysical
Chapter 7: Discussion of methodological aspects and implications for decision making
82
characteristics of Indonesia’s mangrove ecosystems are highly variable, and should therefore always need to be
calibrated and verified for each new location.
Most of this report’s management regimes are recognized in government policies and occur frequently in Java.
All natural, low intensity use and high intensity use management regimes are based either on existing or
drafted mangrove forest management regulations. Changes in this legislation are highly unlikely to result in a
different typology. The regimes unprotected mangroves, silvo-fisheries, eco-certified aquaculture and, to some
extent, converted mangroves deviate from the other regimes in this respect. While unprotected mangroves are
not listed in official policy documents, in reality they could be observed throughout Java, especially where
aquaculture had been abandoned. This report’s literature review yielded a list of nine different silvo-fishery
variations that are found throughout Indonesia (Appendix 4), some of which are new to international scientific
literature. Interestingly, our review found that the formally recognised silvo-fishery variations (four out of the
nine) are unable to provide all ecosystem services that they formally aim to provide (Bengen, 2003, Sofiawan,
2000, Table IV.1 in Appendix 4). Although the ‘ideal’ silvo-fishery regime that we considered in our typology is
currently virtually absent in Java, we included the regime to encourage its consideration in decision making.
Eco-certified aquaculture is also currently non-existent in Java, as standards were only recently launched. This
regime could provide benefits as mangrove trees planted outside the ponds could strengthen greenbelts and
consequently provide coastal protection (McIvor et al., 2012a). We also included ‘converted’ systems, which
have mostly been described as either intensive land-use systems or ‘degraded’ systems in both scientific
literature (e.g. Verburg et al., 2013; Braat et al., 2008) and Indonesian policy documents. We included
converted mangroves in the typology because they are the main cause for mangrove decline and their
outcomes should be compared to the benefits derived from differently managed systems to assess trade-offs
between management decisions (Rönnbäck et al., 2003). Note that we did not consider the effects of the
activity mangrove conversion, as we only compared converted with ‘intact’ mangrove systems.
The management regimes studied here could enable the formulation of likely pathways, or scenarios, such as
‘rehabilitation’ (e.g. abandoned aquaculture to silvo-fishery or conservation forest) or ‘degradation’ (e.g.
plantation to aquaculture or conservation area to plantation). It is important to note that the terms ‘degraded’,
‘rehabilitated’, ‘restored’ are frequently but inconsistently used terms in both scientific literature and policy
documents. The official terminology of the Indonesian government describes intact, degraded and severely
degraded mangrove areas. In addition, rehabilitation and restoration are common terms. However, both within
scientific literature and policy documents, these terms have been found to have different, and often outlying,
meanings. We have elected not to list degraded, restored and rehabilitated as separate regimes per se
(contrary to some assessments), due to the fact that the terms restoration, rehabilitation and even degradation
refer to processes that can have more than one end phase or goal, be it ecological or economical. Whenever
we refer to these processes, it will be in the form of end or intermediate phases of them. This to prevent that
in our analyses dynamic processes will be compared to (steady) states or phases. Our typology is applicable to
Java (because locally verified), and largely to the rest of Indonesia (policy setting), as well as South-East Asia.
However, every study that should want to compare management regimes should first look into the regional
policy context and verify management activities and corresponding ecological characteristics.
Typologies of management regimes applied to specific ecosystems are rare in the literature. The typology
presented here is the first to develop a full range of specific management characteristics and indicators, and
ecological characteristics. The typology used the local variation in legislation and management activities.
Moreover, the easily measurable ecological characteristics served to both verify management regimes on
location and to quantify ecosystem services.
Chapter 7: Discussion of methodological aspects and implications for decision making
83
7.2. Using easy-to-observe indicators to quantify ecosystem services
We integrated qualitative and quantitative information on drivers, ecosystem properties, and ‘state’ and
‘performance’ indicators of ecosystem services. Although some studies have reviewed indicators for multiple
mangrove ecosystem services (e.g. Barbier et al., 2011), few have also applied the indicators in an ecosystem
service assessment or linked them to ecosystem properties. We selected our indicators based on the scientific
consensus on important ecosystem service indicators, rather than all available indicators. Our analysis was
limited by the selected ecosystem services, but this selection was made in dialogue with decision makers. We,
consequently, ignored poorly studied but important other mangrove ecosystem services, such as other foods
than fish and crustaceans and medicinal resources (see Appendix A), water provision for aquaculture ponds,
salt water intrusion prevention and spiritual enrichment (Rönnbäck et al., 2007; Walters et al., 2008). Because
most of these services are provided by natural and low intensity use mangroves, we consider our current
results as especially underestimating total ecosystem service provision by these management regimes.
Quantitative information and data on actual ecosystem services provision (i.e. use) is scarce for important
services, such as coastal protection, raw materials, nursery service and carbon storage. We related
management indicators and ecological characteristics of management regimes with ecosystem service
indicators and were able to ‘transfer’ information from other regions to Java. Moreover, combining qualitative
and quantitative indicators enabled a comprehensive comparison of service provision per management regime.
Especially differences between regulating services are better explained by qualitative information (i.e. traits)
because complex ecological processes underpinning service provision have not been sufficiently quantified.
Our ecosystem service scores per regime integrate and quantify qualitative findings. If we had only considered
quantitative indicators, our analysis would have excluded the coastal protection and nursery services, which
are key for informing decision makers, and the analysis would have been more limited for the other services.
The key indicators for assessing and monitoring the effects of management on ecosystem services were
mangrove age (and related height, diameter etc.), species richness and structural diversity. These indicators
inform how ecosystem service provision per management regime will change over time. The high amount of
results that are qualified as ‘uncertain’ is caused by lacking empirical studies, but we are confident that our
approach has resulted in finding robust relative differences between most management regimes.
Policy-relevant research of mangrove management and ecosystem services could benefit from more systematic
integration of ecological research with land use, social, economic and management research (c.f. Peña-Cortés
et al., 2013; Verburg et al., 2013). This integration is relevant because mangroves are continuously pressured
by humans and ecological research has been conducted for decades. Following our research approach (Figure
1), future research should focus on quantifying all linkages between management, ecosystem properties and
mangroves’ capacity to provide services and, finally, the socio-economic and cultural value of mangrove
ecosystem services. This will provide more insight in the complexity of socio-ecological systems and will
support sustainable management decisions. Furthermore, our approach and the proposed management
regime typology can facilitate a more integrated valuation of mangrove ecosystem services for each
management regime (Barbier et al., 2011).
Most ecosystem services research in mangroves has focused on comparing provision of few services (e.g.
wood, shrimp and carbon storage) in two or three ‘regimes’. Examples include natural mangroves compared to
plantations (e.g. Bosire et al., 2008; Ong, 1993) and comparing different aquaculture systems (Gautier, 2002;
Rönnbäck et al., 2003). Gilbert and Janssen (1998) analysed multiple ecosystem services provided through
multiple ‘management alternatives’. They suggested some alternatives that correspond to the management
regimes proposed here, such as ‘preservation’ (conservation), ‘subsistence forestry’ (protection) and ‘aqua-
Chapter 7: Discussion of methodological aspects and implications for decision making
84
silviculture’ (silvo-fishery). Because Gilbert and Janssen (1998) based their final conclusions on the monetary
value of marketed ecosystem services only, they conclude that aquaculture systems are the most preferred
alternative, while conservation and preservation alternatives generate substantially less value. Our study
compared all ecosystem services that were relevant for decision making and, consequently, ‘valued’ the
importance of services such as coastal protection, carbon sequestration and water purification to be equally
important as food and raw material provision.
7.3. Implications for decision making
The management regime typology proposed in this study offers a range of options related to land-use planning
and coastal management. Decision makers can assess the consequences of choosing a specific management
regime by considering the ecosystem services provided per regime. We integrated findings on multiple
ecosystem services, most of which are currently not yet considered in decision making. The results highlight
crucial differences between natural mangroves and mangroves converted for aquaculture and the potential
benefits of rehabilitating aquaculture systems. Our results show the consequences of management decisions in
terms of ecosystem services, but current management decisions are mostly based on other criteria, such as
economic profits, biodiversity protection and employment opportunities (Peña-Cortés et al., 2013). More
balanced management decisions could be made if criteria such as ecosystem services, health, safety,
employment were considered in addition to economic returns. For example, aquaculture systems provide food
to many but economic returns to a few individual managers and investors, whereas the disservices affect all
stakeholders, including pond owners and local inhabitants.
At the time of writing this report, Ita Sualia and several ‘Mangrove Capital’ project partners were involved in
incorporating knowledge on mangrove ecosystem services into the updated coastal management plan of
Pangpang Bay (Banywangi), one of our rapid field assessment locations. Apart from incorporating wishes from
sectors, such as aquaculture and fisheries, local decision makers were interested in how the current
management situation would compare to situations in which mangrove rehabilitation and protection would
have a more important role. Our study’s findings have contributed to a better understanding of mangrove
ecosystem services and a shared vision among decision makers that the upcoming Pangpang Bay management
plan priority issues should include mangrove protection, mangrove-integrated aquaculture, protected and
regulated fisheries, ecotourism promotion and better integrated governance. These priority issues have now
been selected into a broader local government programme aiming to create more jobs, help the poor and help
the region to grow economically. A forum of Pangpang Bay’s stakeholders will, as part of the management
plan, monitor progress on an annual basis, and the region has now selected as a wetland area of high
importance in Java.
References
85
References
Aburto-Oropeza, O., E. Ezcurra, G. Danemann, V. Valdez, J. Murray and E. Sala. 2008. Mangroves in the Gulf of California increase fishery yields. Proceedings of the National Academy of Sciences 105: 10456-10459.
Ahmad, S. 2009. Recreational values of mangrove forest in Larut Matang, Perak Journal of Tropical Forest Science 21: 81-87.
Alkemade, R., M. van Oorschot, L. Miles, C. Nellemann, M. Bakkenes and B. ten Brink. 2009. GLOBIO3: A Framework to Investigate Options for Reducing Global Terrestrial Biodiversity Loss. Ecosystems 12: 374-390.
Alongi, D., L. A. Trott, Rachmansyah, F. Tirendi, A. D. MCKinnon and M. C. Undu. 2008. Growth and development of mangrove forests overlying smothered coral reefs, Sulawesi and Sumatra, Indonesia. Marine Ecology Progress Series 370: 97-109.
Alongi, D. M. 2002. Present state and future of the world's mangrove forests. Environmental Conservation 29: 331-349.
Alongi, D. M. 2008. Mangrove forests: Resilience, protection from tsunamis, and responses to global climate change. Estuarine, Coastal and Shelf Science 76: 1-13.
Alongi, D. M. 2012. Carbon sequestration in mangrove forests. Carbon Management 3: 313-322.
Alongi, D. M., A. Sasekumar, F. Tirendi and P. Dixon. 1998. The influence of stand age on benthic decomposition and recycling of organic matter in managed mangrove forests of Malaysia. Journal of Experimental Marine Biology and Ecology 225: 197-218.
Anh, P. T., C. Kroeze, S. R. Bush and A. P. J. Mol. 2010. Water pollution by intensive brackish shrimp farming in south-east Vietnam: Causes and options for control. Agricultural Water Management 97: 872-882.
Armitage, D. 2002. Socio-institutional dynamics and the political ecology of mangrove forest conservation in Central Sulawesi, Indonesia. Global Environmental Change 12: 203-217.
Bakosurtanal 2009. Peta Mangroves Indonesia. Pusat Survey Sumberdaya Alam Laut. Badan Koordinasi Survey dan Pemetaan Nasional. Bakosurtanal, Indonesian Geospatial Information Agency, Jakarta.
Bandaranayake, W. M. 1998. Traditional and medicinal uses of mangroves. Mangroves and Salt Marshes 2: 133-148.
Baran, E. 1999. A review of quantified relationships between mangroves and coastal resources. Phuket Marine Biological Center Research Bulletin 62: 57-64.
Baran, E. and J. Hambrey. 1999. Mangrove Conservation and Coastal Management in Southeast Asia: What Impact on Fishery Resources? Marine Pollution Bulletin 37: 431-440.
Barbier, E. B. 2007. Valuing ecosystem services as productive inputs. Economic Policy 22: 177-229.
Barbier, E. B. and M. Cox. 2003. Does Economic Development Lead to Mangrove Loss? A Cross-Country Analysis. Contemporary Economic Policy 21: 418-432.
Barbier, E. B., S. D. Hacker, C. Kennedy, E. W. Koch, A. C. Stier and B. R. Silliman. 2011. The value of estuarine and coastal ecosystem services. Ecological Monographs 81: 169-193.
Barbier, E. B., E. W. Koch, B. R. Silliman, S. D. Hacker, E. Wolanski, J. Primavera, E. F. Granek, S. Polasky, S. Aswani and L. A. Cramer. 2008. Coastal ecosystem-based management with nonlinear ecological functions and values. Science 319: 321-323.
Benayas, J. M. R., A. C. Newton, A. Diaz and J. M. Bullock. 2009. Enhancement of Biodiversity and Ecosystem Services by Ecological Restoration: A Meta-Analysis. Science 325: 1121-1124.
Bengen, D. G. 2003. Introduction and Management of Mangrove Ecosystems. PKSPL-IPB. 59pp.
Berger, U. and H. Hildenbrandt. 2000. A new approach to spatially explicit modelling of forest dynamics: spacing, ageing and neighbourhood competition of mangrove trees. Ecological Modelling 132: 287-302.
Boon, P. I., T. R. Burridge and M. Fluker. 2002. A Case for Supply-led Nature-based Tourism Within the Marine and Coastal Temperate Systems of South-Eastern Australia. Journal of Ecotourism 1: 93-103.
Bosire, J. O., F. Dahdouh-Guebas, M. Walton, B. I. Crona, R. R. Lewis III, C. Field, J. G. Kairo and N. Koedam. 2008. Functionality of restored mangroves: A review. Aquatic Botany 89: 251-259.
References
86
Bouillon, S., A. V. Borges, E. Castañeda-Moya, K. Diele, T. Dittmar, N. C. Duke, E. Kristensen, S. Y. Lee, C. Marchand, J. J. Middelburg, V. H. Rivera-Monroy, T. J. Smith, III and R. R. Twilley. 2008. Mangrove production and carbon sinks: A revision of global budget estimates. Global Biogeochemical Cycles 22: GB2013.
Brander, L. M., A. J. Wagtendonk, S. Hussain, A. McVittie, P. H. Verburg, R. S. de Groot and S. van der Ploeg. 2012. Ecosystem service values for mangroves in Southeast Asia: A meta-analysis and value transfer application. Ecosystem Services 1: 62-69.
Brinkman, R. M., S. R. Massel, P. V. Ridd and K. Furukawa. 1997. Surface wave attenuation in mangrove forests. Proceedings of the Combined Australasian Coastal Engineering and Ports Conference (Christchurch): 941-946.
Brussard, P. F., J. M. Reed and C. R. Tracy. 1998. Ecosystem management: what is it really? Landscape and Urban Planning 40: 9-20.
Chan, K. M. A., L. Hoshizaki and B. Klinkenberg. 2011. Ecosystem Services in Conservation Planning: Targeted Benefits vs. Co-Benefits or Costs? PLoS ONE 6: e24378.
Clarke, P. and W. Allaway. 1993. The regeneration niche of the grey mangrove (Avicennia marina): effects of salinity, light and sediment factors on establishment, growth and survival in the field. Oecologia 93: 548-556.
Clough, B., D. T. Tan, D. X. Phuong and D. C. Buu. 2000. Canopy leaf area index and litter fall in stands of the mangrove Rhizophora apiculata of different age in the Mekong Delta, Vietnam. Aquatic Botany 66: 311-320.
Cochard, R., S. L. Ranamukhaarachchi, G. P. Shivakoti, O. V. Shipin, P. J. Edwards and K. T. Seeland. 2008. The 2004 tsunami in Aceh and Southern Thailand: A review on coastal ecosystems, wave hazards and vulnerability. Perspectives in Plant Ecology, Evolution and Systematics 10: 3-40.
Costanza, R., R. d'Arge, R. De Groot, S. Farber, M. Grasso, B. Hannon, K. Limburg, S. Naeem, R. V. O'Neill, J. Paruelo, R. G. Raskin, P. Sutton and M. van den Belt. 1997. The value of the world's ecosystem services and natural capital. Nature 387: 253-260.
Daily, G. C., S. Alexander, P. R. Ehrlich, L. Goulder, J. Lubchenco, P. A. Matson, A. Mooney, S. Postel, S. H. Schneider, D. Tilman and G. M. Woodwell. 1997. Ecosystem services; benefits supplied to human societies by natural ecosystems. Issues in Ecology 2: 1-16.
De Groot, R., B. Fisher, M. Christie, J. Aronson, L. Braat, R. Haines-Young, J. Gowdy, E. Maltby, A. Neuville, S. Polasky, R. Portela and I. Ring. 2010a. Integrating the ecological and economic dimensions in biodiversity and ecosystem service valuation. Pages 9-40 in P. Kumar, editor. The Economics of Ecosystems and Biodiversity: Ecological and Economic Foundations. Earthscan, London.
De Groot, R. S., R. Alkemade, L. Braat, L. Hein and L. Willemen. 2010b. Challenges in integrating the concept of ecosystem services and values in landscape planning, management and decision making. Ecological Complexity 7: 260-272.
De Groot, R. S., J. Blignaut, S. Van Der Ploeg, J. Aronson, T. Elmqvist and J. Farley. 2013. Benefits of Investing in Ecosystem Restoration. Conservation Biology.
Dephut 2005. Peta Penutupan Lahan dan Vegetasi sampai dengan 2003. Departemen Kehutanan. Downloaded on 27 October 2010 from http://www.dephut.go.id/INFORMASI/INTAG/Peta%20Tematik/PL&Veg/VEG_2003.htm. Indonesian Ministry of Forestry, Jakarta.
Donato, D., J. Boone Kauffman, D. Murdiyarso, S. Kurnianto, M. Stidham and M. Kanninen. 2011. Mangroves among the most carbon-rich forests in the tropics. Nature Geoscience 4: 293-297.
Engle, V. 2011. Estimating the Provision of Ecosystem Services by Gulf of Mexico Coastal Wetlands. Wetlands 31: 179-193.
Ewel, K. C., R. R. Twilley and J. E. Ong. 1998. Different kinds of mangrove forests provide different goods and services. Global Ecological Biogeography Letters 7: 83-94.
FAO 1994. Mangrove forest management guidelines. FAO Forestry Paper 117. Food and Agriculture Organization of the United Nations, Rome.
FAO 2007. The world's mangroves 1980-2005. A thematic study prepared in the framework of the Global Forest Resources Assessment 2005. FAO forestry paper 153., Forest and Agriculture Organization of the United Nations, Rome, Italy.
FAO 2011. Technical guidelines on aquaculture certification. FAO, Rome.
Farnsworth, E. J. and A. M. Ellison. 1996. Sun-shade adaptability of the red mangrove, Rhizophora mangle (Rhizophoraceae): changes through ontogeny at several levels of biological organization. American Journal of Botany: 1131-1143.
References
87
Foley, J. A., R. DeFries, G. P. Asner, C. Barford, G. Bonan, S. R. Carpenter, F. S. Chapin, M. T. Coe, G. C. Daily, H. K. Gibbs, J. H. Helkowski, T. Holloway, E. A. Howard, C. J. Kucharik, C. Monfreda, J. A. Patz, I. C. Prentice, N. Ramankutty and P. K. Snyder. 2005. Global consequences of land use. Science 309: 570-574.
Gautier, D. 2002. The Integration of Mangrove and Shrimp Farming: A Case Study on the Caribbean Coast of Colombia. Report prepared under the World Bank, NACA, WWF and FAO Consortium Program on Shrimp Farming and the Environment. Work in Progress for Public Discussion. Published by the Consortium. 26 pages.
Ghazoul, J. 2007. Recognising the Complexities of Ecosystem Management and the Ecosystem Service Concept. GAIA - Ecological Perspectives for Science and Society 16: 215-221.
Giesen, W., S. Wulfraatt, M. Zieren and L. Scholten 2006. Mangrove Guide Book for Southeast Asia. FAO and Wetlands International., Rome.
Gilbert, A. J. and R. Janssen. 1998. Use of environmental functions to communicate the values of a mangrove ecosystem under different management regimes. Ecological Economics 25: 323-346.
Gong, W. K. and J. E. Ong. 1990. Plant biomass and nutrient flux in a managed mangrove forest in Malaysia. Estuarine, Coastal and Shelf Science 31: 519-530.
Gössling, S. 1999. Ecotourism: a means to safeguard biodiversity and ecosystem functions? Ecological Economics 29: 303-320.
Government of Indonesia. 1999. Forestry Act No. 41/1999. Indonesia.
Government of Indonesia. 2010. Government Regulation No 10/2010 on Guidelines for changing forests use and function.
Government of Indonesia. 2011. Government Regulation No. 28/2011 on Management of Forest Reserves and Nature Conservation Areas.
Government of Indonesia. 2012. Presidential Decree 73/2012 concerning the National Strategy on Mangrove Ecosystem Management. Released in September 2012.
Graham, R. T. and T. B. Jain 2004. Past, present, and future role of silviculture in forest management. USDA Forest Service Proceedings RMRS-P-34., USDA Forest Service.
Hashim, A. M., S. M. P. Catherine and H. Takaijudin. 2013. Effectiveness of Mangrove Forests in Surface Wave Attenuation: A Review. Research Journal of Applied Sciences, Engineering and Technology 5: 4483-4488.
Hiraishi, T. and K. Harada. 2003. Greenbelt Tsunami Prevention in South-Pacific Region. Report of the Port and Airport Research Institute 42: 1-23.
Hutchison, J., A. Manica, R. Swetnam, A. Balmford and M. Spalding. 2013. Predicting global patterns in mangrove forest biomass. Conservation Letters.
ICSU-UNESCO-UNU (International Council for Science, United Nations Educational Scientific and Cultural Organization, United Nations University). 2008. Ecosystem Change and Human Well-being. Research and Monitoring Priorities Based on the Findings of the Millennium Ecosystem Assessment. International Council for Science (ICSU), Paris.
Iftekhar, M. S. 2008. Functions and development of reforested mangrove areas: A review. International Journal of Biodiversity Science & Management 4: 1-14.
Ilman, M., I. T. C. Wibisono and I. N. N. Suryadiputra 2011. State of the art information on mangrove ecosystems in Indonesia. Wetlands International-Indonesia Programme, Bogor.
Jackson, C., N. Preston, P. J. Thompson and M. Burford. 2003. Nitrogen budget and effluent nitrogen components at an intensive shrimp farm. Aquaculture 218: 397-411.
Janssen, R. and J. E. Padilla 1996. Valuation and Evaluation of Management Alternatives for the Pagbilao Mangrove Forest.
Kairo, J. G., F. Dahdouh-Guebas, P. O. Gwaba, C. Ochieng and N. Koedam. 2002. Regeneration status of mangrove forests in Mida Creek, Kenya: a compromised or secured future? Ambio 31: 562-568.
Kaplowitz, M. D. 2001. Assessing mangrove products and services at the local level: the use of focus groups and individual interviews. Landscape and Urban Planning 56: 53-60.
References
88
Kathiresan, K., N. S. Boopathy and S. Kavitha. 2006. Coastal vegetation —An underexplored source of anticancer drugs. Indian Journal of Natural Products and Resources 5: 115-119.
Kathiresan, K. and N. Rajendran. 2002. Fishery resources and economic gain in three mangrove areas on the south-east coast of India. Fisheries Management and Ecology 9: 277-283.
Kauffman, J. B., C. Heider, T. Cole, K. Dwire and D. Donato. 2011. Ecosystem Carbon Stocks of Micronesian Mangrove Forests. Wetlands 31: 343-352.
Kauffman, J. B., C. Heider, J. Norfolk and F. Payton. 2013. Carbon stocks of intact mangroves and carbon emissions arising from their conversion in the Dominican Republic. Ecological Applications.
Kautsky, N., P. Rönnbäck, M. Tedengren and M. Troell. 2000. Ecosystem perspectives on management of disease in shrimp pond farming. Aquaculture 191: 145-161.
Knight, D., B. Mitchell and G. Wall. 1997. Bali: Sustainable Development, Tourism and Coastal Management. Ambio 26: 90-96.
Komiyama, A., J. E. Ong and S. Poungparn. 2008. Allometry, biomass, and productivity of mangrove forests: A review. Aquatic Botany 89: 128-137.
Komiyama, A., T. Santiean, M. Higo, P. Patanaponpaiboon, J. Kongsangchai and K. Ogino. 1996. Microtopography, soil hardness and survival of mangrove (Rhizophora apiculata BL.) seedlings planted in an abandoned tin-mining area. Forest Ecology and Management 81: 243-248.
Komiyama, A., P. Tanapermpool, S. Havanond, C. Maknual, P. Patanaponpaiboon, A. Sumida, T. Ohnishi and S. Kato. 1998. Mortality and growth of cut pieces of viviparous mangrove (Rhizophora apiculata and R. mucronata) seedlings in the field condition. Forest Ecology and Management 112: 227-231.
Krauss, K., T. Doyle, T. Doyle, C. Swarzenski, A. From, R. Day and W. Conner. 2009. Water level observations in mangrove swamps during two hurricanes in Florida. Wetlands 29: 142-149.
Krauss, K. W., J. A. Allen and D. R. Cahoon. 2003. Differential rates of vertical accretion and elevation change among aerial root types in Micronesian mangrove forests. Estuarine, Coastal and Shelf Science 56: 251-259.
Kusmana, C. 2010. Peran mangrove bagi sistem penyangga kehidupan dan ketahanan pangan, energi serta obat-obatan bagi masyarakat pedesaan di pesisir. Kehutanan IPB, Bogor. Downloadable via: http://cecep_kusmana.staff.ipb.ac.id/2010/06/15/peran-mangrove-bagi-sistem-penyangga-kehidupan-dan-ketahanan-pangan-energi-serta-obat-obatan-bagi-masyarakat-pedesaan-di-pesisir/
Kusmana, C., Istomo, C. Wibowo, S. W. Budi, I. Z. Siregar, T. Tiryana and S. Sukardjo 2008. Manual of mangrove silvi-culture in Indonesia. Directorate General of Land Rehabilitation and Social Forestry. Ministry of Forestry and KOICA, Jakarta.
Laapo, A., A. Fahrudin, D. G. Bengen and A. Damar. 2012. Study of Mangrove Areas Characteristic and Suitability for Mangrove Ecotourism Activity in Togean Islands of Togean Islands National Park. Forum Pasca Sarjana 33.
Lamb, D. and D. Gilmour 2003. Rehabilitation and restoration of degraded forests. IUCN and WWF, Gland, Switzerland.
Lewis III, R. R. 2000. Ecologically based goal setting in mangrove forest and tidal marsh restoration. Ecological Engineering 15: 191-198.
Lewis III, R. R. 2005. Ecological engineering for successful management and restoration of mangrove forests. Ecological Engineering 24: 403-418.
Li, N., S. Chen, X. Zhou, C. Li, J. Shao, R. Wang, E. Fritz, A. Hüttermann and A. Polle. 2008. Effect of NaCl on photosynthesis, salt accumulation and ion compartmentation in two mangrove species, Kandelia candel and Bruguiera gymnorhiza. Aquatic Botany 88: 303-310.
Lopez-Hoffman, L., I. E. Monroe, E. Narvaez, M. Martinez-Ramos and D. D. Ackerly. 2006. Sustainability of mangrove harvesting: how do harvesters’ perceptions differ from ecological analysis? Ecology and Society 11: art 14.
MA (Millennium Ecosystem Assessment). 2005. Ecosystems and Human Well-Being: Synthesis report. Island Press, Washington D.C.
Mace, G. M., K. Norris and A. H. Fitter. 2012. Biodiversity and ecosystem services: a multilayered relationship. Trends in Ecology & Evolution 27: 19-26.
References
89
Macintosh, D. J., M. J. Phillips, R. R. Lewis III and B. Clough 2002. Annexes to the: Thematic review on coastal wetland habitats and shrimp aquaculture. Case studies 1-6. Report prepared under the World Bank, NACA, WWF and FAO Consortium Program on Shrimp Farming and the Environment. Work in Progress for Public Discussion. Published by the Consortium. 211 pp.
Manson, F. J., N. R. Loneragan, G. A. Skilleter and S. R. Phinn. 2005. An evaluation of the evidence for linkages between mangroves and fisheries: A synthesis of the literature and identification of research directions. Oceanography and Marine Biology 43: 483-513.
Massel, S. R., K. Furukawa and R. M. Brinkman. 1999. Surface wave propagation in mangrove forests. Fluid Dynamics Research 24: 219.
Mastaller, M. 1997. Mangroves, the Forgotten Forest between Land and Sea. Tropical Press Sdn. Bhd, Kuala Lumpur, Malaysia.
Mathieu, L. F., I. H. Langford and W. Kenyon. 2003. Valuing marine parks in a developing country: a case study of the Seychelles. Environment and Development Economics 8.
Matthijs, S., J. Tack, D. van Speybroeck and N. Koedam. 1999. Mangrove species zonation and soil redox state, sulphide concentration and salinity in Gazi Bay (Kenya), a preliminary study. Mangroves and Salt Marshes 3: 243-249.
Mazda, Y., M. Magi, Y. Ikeda, T. Kurokawa and T. Asano. 2006. Wave reduction in a mangrove forest dominated by Sonneratia sp. Wetlands Ecology and Management 14: 365-378.
Mazda, Y., M. Magi, M. Kogo and P. Hong. 1997a. Mangroves as a coastal protection from waves in the Tong King delta, Vietnam. Mangroves and Salt Marshes 1: 127-135.
Mazda, Y., E. Wolanski, B. King, A. Sase, D. Ohtsuka and M. Magi. 1997b. Drag force due to vegetation in mangrove swamps. Mangroves and Salt Marshes 1: 193-199.
McIvor, A. L., I. Möller, T. Spencer and M. Spalding 2012a. Reduction of wind and swell waves by mangroves. Natural Coastal Protection Series: Report 1. Cambridge Coastal Research Unit Working Paper 40., The Nature Conservancy and Wetlands International, Cambridge.
McIvor, A. L., T. Spencer, I. Möller and M. Spalding 2012b. Storm surge reduction by mangroves. Natural Coastal Protection Series: Report 2. Cambridge Coastal Research Unit Working Paper 41., The Nature Conservancy and Wetlands International, Cambridge, UK.
McIvor, A. L., T. Spencer, I. Möller and M. Spalding 2013. The response of mangrove soil surface elevation to sea level rise. Natural Coastal Protection Series: Report 3. Cambridge Coastal Research Unit Working Paper 42. The Nature Conservancy and Wetlands International, Cambridge, UK.
McKee, K. L. and W. C. Vervaeke. 2009. Impacts of human disturbance on soil erosion potential and habitat stability of mangrove-dominated islands in the Pelican Cays and Twin Cays Ranges, Belize. Smithsonian Contributions to the Marine Sciences 38.
Mcleod, E., G. L. Chmura, S. Bouillon, R. Salm, M. Björk, C. M. Duarte, C. E. Lovelock, W. H. Schlesinger and B. R. Silliman. 2011. A blueprint for blue carbon: toward an improved understanding of the role of vegetated coastal habitats in sequestering CO2. Frontiers in Ecology and the Environment 9: 552-560.
Middelburg, J. J., J. Nieuwenhuize, F. J. Slim and B. Ohowa. 1996. Sediment Biogeochemistry in an East African Mangrove Forest (Gazi Bay, Kenya). Biogeochemistry 34: 133-155.
Ministry of Forestry Indonesia. 2004. Ministry of Forestry Regulation No.3/2004 Attachment I: Guidelines on Mangrove forest rehabilitation under Forest and Land Rehabilitation Movement. Indonesia.
Ministry of Forestry Indonesia 2012. Guidelines for the development of a mangrove management models. Original name: Pedoman Pembangunan Model-model Pengelolaan Hutan Mangrove. Developed by the Directorate-General of Watershed Management and Social Forestry, Directorate of Forest and Land Rehabilitation and Ministry of Marine Affairs and Fishery. Ministry of Forestry, Indonesia, Jakarta.
Mitra, A. 2013. How Mangroves Resist Natural Disaster? Pages 107-129 in A. Mitra, editor. Sensitivity of Mangrove Ecosystem to Changing Climate. Springer India.
MMA. 2009. What is Tarakan Aquaculture. PT Mustika Minanusa Aurora. In Ilman, M. (ed). Workshop Report. Sustainable Shrimp Coastal Rehabilitation and Conservation. Bogor. 26-27 October 2009. Wetlands International Indonesia Programme.
Mumby, P. J. 2006. Connectivity of reef fish between mangroves and coral reefs: Algorithms for the design of marine reserves at seascape scales. Biological Conservation 128: 215-222.
References
90
Mumby, P. J., A. J. Edwards, J. E. Arias-González, K. C. Lindeman, P. G. Blackwell, A. Gall, M. I. Gorczynska, A. R. Harborne, C. L. Pescod, H. Renken, C. C. C. Wabnitz and G. Llewenyn. 2004. Mangroves enhance the biomass of coral reef fish communities in the Caribbean. Nature 427: 533-536.
Naylor, R. L., R. J. Goldburg, J. H. Primavera, N. Kautsky, M. C. M. Beveridge, J. Clay, C. Folke, J. Lubchenco, H. Mooney and M. Troell. 2000. Effect of aquaculture on world fish supplies. Nature 405: 1017-1024.
Ong, J. E. 1993. Mangroves - a carbon source and sink. Chemosphere 27: 1097-1107.
Parani, M., M. Lakshmi, P. Senthilkumar, N. Ram and A. Parida. 1998. Molecular phylogeny of mangroves V. Analysis of genome relationships in mangrove species using RAPD and RFLP markers. Theoretical and Applied Genetics 97: 617-625.
Pauly, D. and J. Ingles. 1999. The relationship between shrimp yields and intertidal vegetation (mangrove) areas: A reassessment. Pages 311-318 in A. Yáñez-Arancibia and A. L. Lara-Domínguez, editors. Ecosistemas de Manglar en América Tropical. Instituto de Ecología A.C., México, UICN/ORMA, Costa Rica, NOAA/NMFS Silver Spring (MD), USA.
Peña-Cortés, F., D. Rozas-Vásquez, G. Rebolledo, J. Pincheira-Ulbrich, M. Escalona, E. Hauenstein, L. Vargas-Chacoff, C. Bertrán, J. Tapia and M. Cisternas. 2013. Territorial Planning for Coastal Zones in Chile: The Need for Geographical-Environmental and Natural Risk Indicators for Spatial Decision Support Systems. International Journal of Geosciences 4: 17-29.
Polasky, S. and K. Segerson. 2009. Integrating ecology and economics in the study of ecosystem services: some lessons learned. Annual Review of Resource Economics 1: 409-434.
Primavera, J., J. Altamirano, M. Lebata, A. A. Reyes and C. Pitogo. 2007. Mangroves and shrimp pond culture effluents in Aklan, Panay Is., Central Philippines. Bulletin of Marine Science 80: 795-804.
Primavera, J. H. 1995. Mangroves and brackish water pond culture in the Philippines. Hydrobiologia 295: 303-309.
Primavera, J. H. 1998. Mangroves as Nurseries: Shrimp Populations in Mangrove and Non-mangrove Habitats. Estuarine, Coastal and Shelf Science 46: 457-464.
Puustinen, J., E. Pouta, N. Marjo and S. Tuija. 2009. Visits to national parks and the provision of natural and man-made recreation and tourism resources. Journal of Ecotourism 8: 18-31.
Quartel, S., A. Kroon, P. Augustinus, P. Van Santen and N. H. Tri. 2007. Wave attenuation in coastal mangroves in the Red River Delta, Vietnam. Journal of Asian Earth Sciences 29: 576-584.
Reyers, B., P. O’Farrell, F. Schutyser, G. Bidoglio, U. Dhar, H. Gundimeda, M. L. Paracchini and O. Gomez Prieto. 2010. Measuring Biophysical Quantities and the Use of Indicators. Pages 113-148 in P. Kumar, editor. The Economics of Ecosystems and Biodiversity: Ecological and Economic Foundations. Earthscan, London.
Rivera-Monroy, V. H., L. A. Torres, N. Bahamon, F. Newmark and R. R. Twilley. 1999. The potential use of mangrove forests as nitrogen sinks of shrimp aquaculture pond effluents: the role of denitrification. Journal of the World Aquaculture Society 30: 12-25.
Robertson, A. I. and D. M. Alongi. 1992. Tropical Mangrove Ecosystems. AGU, Washington, DC.
Robertson, A. I. and M. J. Phillips. 1995. Mangroves as filters of shrimp pond effluents: predictions and biogeochemical research needs. Hydrobiologia 295: 311-321.
Rönnbäck, P. 1999. The ecological basis for economic value of seafood production supported by mangrove ecosystems. Ecological Economics 29: 235-252.
Rönnbäck, P. 2001. Shrimp aquaculture - State of the art. Report 1, Swedish EIA Centre, Uppsala.
Rönnbäck, P. 2002. Environmentally Sustainable Shrimp Aquaculture. Swedish Society for Nature Conservation. 25p.
Rönnbäck, P., B. Crona and L. Ingwall. 2007. The return of ecosystem goods and services in replanted mangrove forests: perspectives from local communities in Kenya. Environmental Conservation 34: 313-324.
Rönnbäck, P., M. Troell, N. Kautsky and J. H. Primavera. 1999. Distribution Pattern of Shrimps and Fish Among Avicennia and Rhizophora Microhabitats in the Pagbilao Mangroves, Philippines. Estuarine, Coastal and Shelf Science 48: 223-234.
Rönnbäck, P., M. Troell, T. Zetterström and D. E. Babu. 2003. Mangrove dependence and socio-economic concerns in shrimp hatcheries of Andhra Pradesh, India. Environmental Conservation 30: 344-352.
References
91
Saenger, P. 2002. Mangrove Ecology, Silviculture and Conservation. Kluwer Academic Publishers, Dordrecht, Netherlands.
Salam, M. A., G. R. Lindsay and M. C. M. Beveridge. 2000. Eco-tourism to Protect the Reserve Mangrove Forest the Sundarbans and its Flora and Fauna. Anatolia 11: 56-66.
Salem, M. E. and D. E. Mercer. 2012. The Economic Value of Mangroves: A Meta-Analysis. Sustainability 4: 359-383.
Sasekumar, A. and V. C. Chong 1987. Mangroves and prawns: further perspectives. Proceedings of 10th Annual Seminar of the Malaysian Society of Marine Sciences: p 10-22. Department of Zoology, University of Malaya.
Satyanarayana, B., P. Bhanderi, M. Debry, D. Maniatis, F. Foré, D. Badgie, K. Jammeh, T. Vanwing, C. Farcy, N. Koedam and F. Dahdouh-Guebas. 2012. A Socio-Ecological Assessment Aiming at Improved Forest Resource Management and Sustainable Ecotourism Development in the Mangroves of Tanbi Wetland National Park, The Gambia, West Africa. Ambio 41: 513-526.
Schrijvers, J., D. Gansbeke and M. Vincx. 1995. Macrobenthic infauna of mangroves and surrounding beaches at Gazi Bay, Kenya. Hydrobiologia 306: 53-66.
Schröter, M., E. H. van der Zanden, A. P. E. van Oudenhoven, R. P. Remme, H. M. Serna-Chavez, R. S. de Groot and P. Opdam. 2014. Ecosystem Services as a Contested Concept: A Synthesis of Critique and Counter-arguments. Conservation Letters.
Sheridan, P. and C. Hays. 2003. Are mangroves nursery habitat for transient fishes and decapods? Wetlands 23: 449-458.
Siahainenia, A. and E. Damastuti 2013. Comparison of mangrove management states in Java, Indonesia – ecology, fishery and coastal protection. Wetlands International (Ede) and Wageningen University (Wageningen).
Simard, M., K. Zhang, V. H. Rivera-Monroy, M. S. Ross, P. L. Ruiz, E. Castañeda-Moya, R. R. Twilley and E. Rodriguez. 2006. Mapping height and biomass of mangrove forests in Everglades National Park with SRTM elevation data. Photogrammetric Engineering and Remote Sensing 72: 299-311.
Singh, A., P. Bhattacharya, P. Vyas and S. Roy. 2010. Contribution of NTFPs in the Livelihood of Mangrove Forest Dwellers of Sundarban. Journal of Human Ecology 29: 191-200.
Snedaker, S. C. and E. J. Lahmann. 1988. Mangrove understorey absence: a consequence of evolution. J. Trop. Ecol 4: 311-314.
Sofiawan, A. 2000. Sustainable Mangrove Utilization: Developing Silvofishery models. Wetlands Conservation Newsletter. Wetlands International – Indonesia Programme, Bogor.
Spalding, M., M. Kainuma and L. Collins. 2010. World Atlas of Mangrove. Earthscan, London, UK.
Stevenson, N. J. 1997. Disused shrimp ponds: Options for redevelopment of mangroves. Coastal Management 25: 425-435.
Storch, H. and K. Woth. 2008. Storm surges: perspectives and options. Sustainability Science 3: 33-43.
Sualia, I., M. Ilman and I. N. Suryadiputra 2010. Indonesian Shrimp Sustainability. Status Quo Report. Coastal Restoration and Conservation Programme - Indonesia. Wetlands International - Indonesia Programme, Bogor.
Sualia, I., E. Kuslati and I. N. Suryadiputra 2013. Policy analysis of shrimp certification and development of sustainable shrimp farms. Original name (Indonesian): Analisis Kebijakan Sertifikasi Udang dan Pengembangan Tambak Berkelanjutan. Wetlands International – Indonesia Programme, Bogor, Indonesia.
Sukardjo, S. 2009. Mangroves for National Development and Conservation in Indonesia: Challenges for the future. Marine Research Indonesia 34: 47-61.
Sukardjo, S. and I. Yamada. 1992. Biomass and productivity of a Rhizophora mucronata Lamarck plantation in Tritih, Central Java, Indonesia. Forest Ecology and Management 49: 195-209.
Tanaka, K. 2008. Effectiveness and limitation of the coastal vegetation for storm surge disaster mitigation. In Investigation report on the storm surge disaster by Cyclone Sidr in 2007, Bangladesh. Published by the Investigation Team of Japan Society of Civil Engineering. URL: http://www.jsce.or.jp/report/46/files/Bangladesh_Investigation.pdf
TEEB 2010a. The Economics of Ecosystems and Biodiversity: ecological and economic foundations. Earthscan, London and Washington.
TEEB 2010b. The Economics of Ecosystems and Biodiversity: Mainstreaming the Economics of Nature: A synthesis of the approach, conclusions and recommendations of TEEB. ISBN 978-3-9813410-3-4, Progress Press, Malta.
References
92
Turner, M. G., G. J. Arthaud, R. T. Engstrom, S. J. Hejl, J. Liu, S. Loeb and K. McKelvey. 1995. Usefulness of Spatially Explicit Population Models in Land Management. Ecological Applications 5: 12-16.
Twilley, R. R. and J. Day. 1999. The productivity and nutrient cycling of mangrove ecosystem. Ecosistemas de manglar en América Tropical. Instituto de Ecología, AC México, UICN/ORMA, Costa Rica, NOAA/NMFS, Silver Spring MD, EUA. p: 127-151.
Van Oudenhoven, A. P. E., K. Petz, R. Alkemade, L. Hein and R. S. de Groot. 2012. Framework for systematic indicator selection to assess effects of land management on ecosystem services. Ecological Indicators 21: 110-122.
Vedeld, P., A. Angelsen, E. Sjaastad and G. K. Berg 2004. Counting on the environment: Forest incomes and the rural poor. Environmental Economics Series Paper No. 98, World Bank, Washington, DC.
Verburg, P. H., O. Mertz, K.-H. Erb, H. Haberl and W. Wu. 2013. Land system change and food security: towards multi-scale land system solutions. Current Opinion in Environmental Sustainability 5: 494-502.
Vo-Luong, H. P. and S. R. Massel. 2006. Experiments on wave motion and suspended sediment concentration at Nang Hai, Can Gio mangrove forest, Southern Vietnam. Oceanologia 48: 23-40.
Vo-Luong, H. P. and S. R. Massel. 2008. Energy dissipation in non-uniform mangrove forests of arbitrary depth. Journal of Marine Systems 74: 603-622.
Vo, Q. T., C. Kuenzer, Q. M. Vo, F. Moder and N. Oppelt. 2012. Review of valuation methods for mangrove ecosystem services. Ecological Indicators 23: 431-446.
Walters, B. B. 2004. Local Management of Mangrove Forests in the Philippines: Successful Conservation or Efficient Resource Exploitation? Human Ecology 32: 177-195.
Walters, B. B. 2005a. Ecological effects of small-scale cutting of Philippine mangrove forests Forest Ecology and Management 206: 331-348.
Walters, B. B. 2005b. Patterns of local wood use and cutting of Philippine Mangrove Forests. Economic Botany 59: 66-76.
Walters, B. B., P. Rönnbäck, J. M. Kovacs, B. Crona, S. A. Hussain, R. Badola, J. H. Primavera, E. Barbier and F. Dahdouh-Guebas. 2008. Ethnobiology, socio-economics and management of mangrove forests: A review. Aquatic Botany 89: 220-236.
Walters, B. B., C. Sabogal, L. K. Snook and E. de Almeida. 2005. Constraints and opportunities for better silvicultural practice in tropical forestry: an interdisciplinary approach. Forest Ecology and Management 209: 3-18.
Walton, M. E., L. Le Vay, J. H. Lebata, J. Binas and J. H. Primavera. 2007. Assessment of the effectiveness of mangrove rehabilitation using exploited and non-exploited indicator species. Biological Conservation 138: 180-188.
Wamsley, T. V., M. A. Cialone, J. M. Smith, J. H. Atkinson and J. D. Rosati. 2010. The potential of wetlands in reducing storm surge. Ocean Engineering 37: 59-68.
Winterwerp, J. C., P. L. A. Erftemeijer, N. Suryadiputra, P. Eijk and L. Zhang. 2013. Defining Eco-Morphodynamic Requirements for Rehabilitating Eroding Mangrove-Mud Coasts. Wetlands 33: 515-526.
Wood, M. E. 2002. Ecotourism: Principles, Practices and Policies for Sustainability. UNEP and TIES, Paris, France.
Yanagisawa, H., S. Koshimura, K. Goto, T. Miyagi, F. Imamura, A. Ruangrassamee and C. Tanavud. 2009. The reduction effects of mangrove forest on a tsunami based on field surveys at Pakarang Cape, Thailand and numerical analysis. Estuarine, Coastal and Shelf Science 81: 27-37.
Yanez-Arancibia, A., G. S. Chavez and P. Sanchez-Gil. 1985. Ecology of control mechanisms of natural fish production in the coastal zone. Pages 571–594 in A. Yanez-Arancibia, editor. Fish Community Ecology in Estuaries and Coastal Lagoons: Towards an Ecosystem Integration. UNAM Press, Mexico.
Zhang, K., H. Liu, Y. Li, H. Xu, J. Shen, J. Rhome and T. J. Smith III. 2012. The role of mangroves in attenuating storm surges. Estuarine, Coastal and Shelf Science 102-103: 11-23.
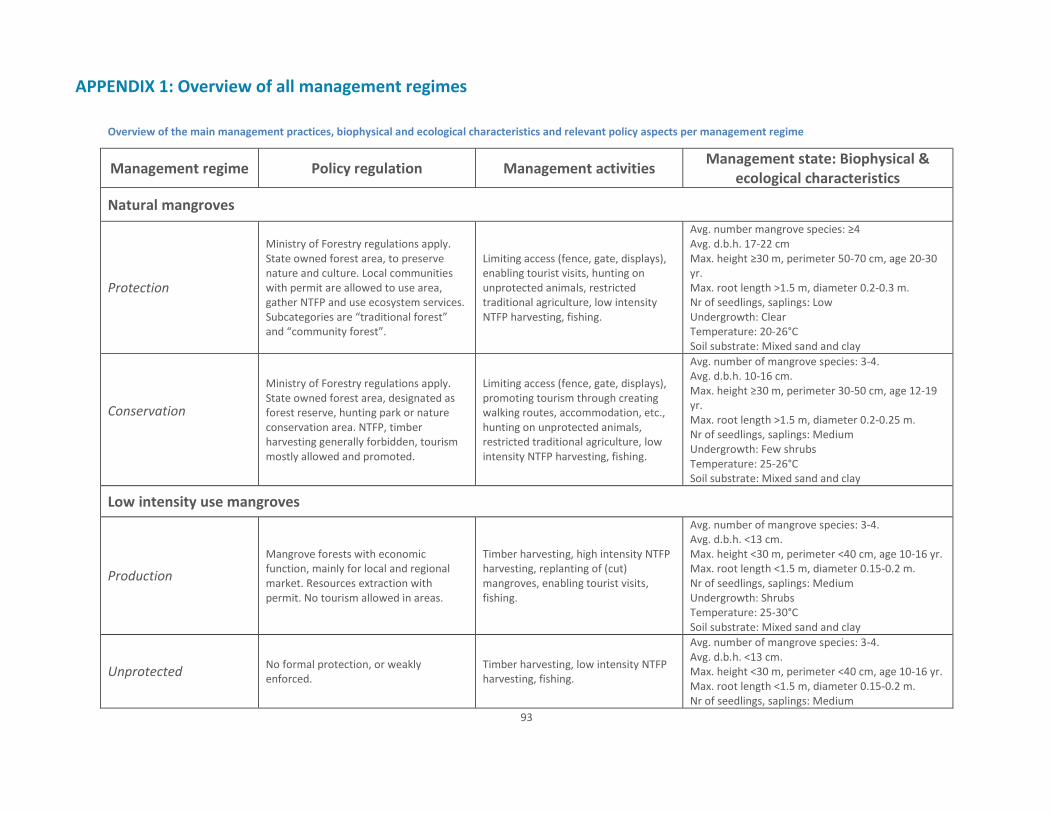
93
APPENDIX 1: Overview of all management regimes
Overview of the main management practices, biophysical and ecological characteristics and relevant policy aspects per management regime
Management regime Policy regulation Management activities Management state: Biophysical &
ecological characteristics
Natural mangroves
Protection
Ministry of Forestry regulations apply. State owned forest area, to preserve nature and culture. Local communities with permit are allowed to use area, gather NTFP and use ecosystem services. Subcategories are “traditional forest” and “community forest”.
Limiting access (fence, gate, displays), enabling tourist visits, hunting on unprotected animals, restricted traditional agriculture, low intensity NTFP harvesting, fishing.
Avg. number mangrove species: ≥4 Avg. d.b.h. 17-22 cm Max. height ≥30 m, perimeter 50-70 cm, age 20-30 yr. Max. root length >1.5 m, diameter 0.2-0.3 m. Nr of seedlings, saplings: Low Undergrowth: Clear Temperature: 20-26°C Soil substrate: Mixed sand and clay
Conservation
Ministry of Forestry regulations apply. State owned forest area, designated as forest reserve, hunting park or nature conservation area. NTFP, timber harvesting generally forbidden, tourism mostly allowed and promoted.
Limiting access (fence, gate, displays), promoting tourism through creating walking routes, accommodation, etc., hunting on unprotected animals, restricted traditional agriculture, low intensity NTFP harvesting, fishing.
Avg. number of mangrove species: 3-4. Avg. d.b.h. 10-16 cm. Max. height ≥30 m, perimeter 30-50 cm, age 12-19 yr. Max. root length >1.5 m, diameter 0.2-0.25 m. Nr of seedlings, saplings: Medium Undergrowth: Few shrubs Temperature: 25-26°C Soil substrate: Mixed sand and clay
Low intensity use mangroves
Production
Mangrove forests with economic function, mainly for local and regional market. Resources extraction with permit. No tourism allowed in areas.
Timber harvesting, high intensity NTFP harvesting, replanting of (cut) mangroves, enabling tourist visits, fishing.
Avg. number of mangrove species: 3-4. Avg. d.b.h. <13 cm. Max. height <30 m, perimeter <40 cm, age 10-16 yr. Max. root length <1.5 m, diameter 0.15-0.2 m. Nr of seedlings, saplings: Medium Undergrowth: Shrubs Temperature: 25-30°C Soil substrate: Mixed sand and clay
Unprotected No formal protection, or weakly enforced.
Timber harvesting, low intensity NTFP harvesting, fishing.
Avg. number of mangrove species: 3-4. Avg. d.b.h. <13 cm. Max. height <30 m, perimeter <40 cm, age 10-16 yr. Max. root length <1.5 m, diameter 0.15-0.2 m. Nr of seedlings, saplings: Medium
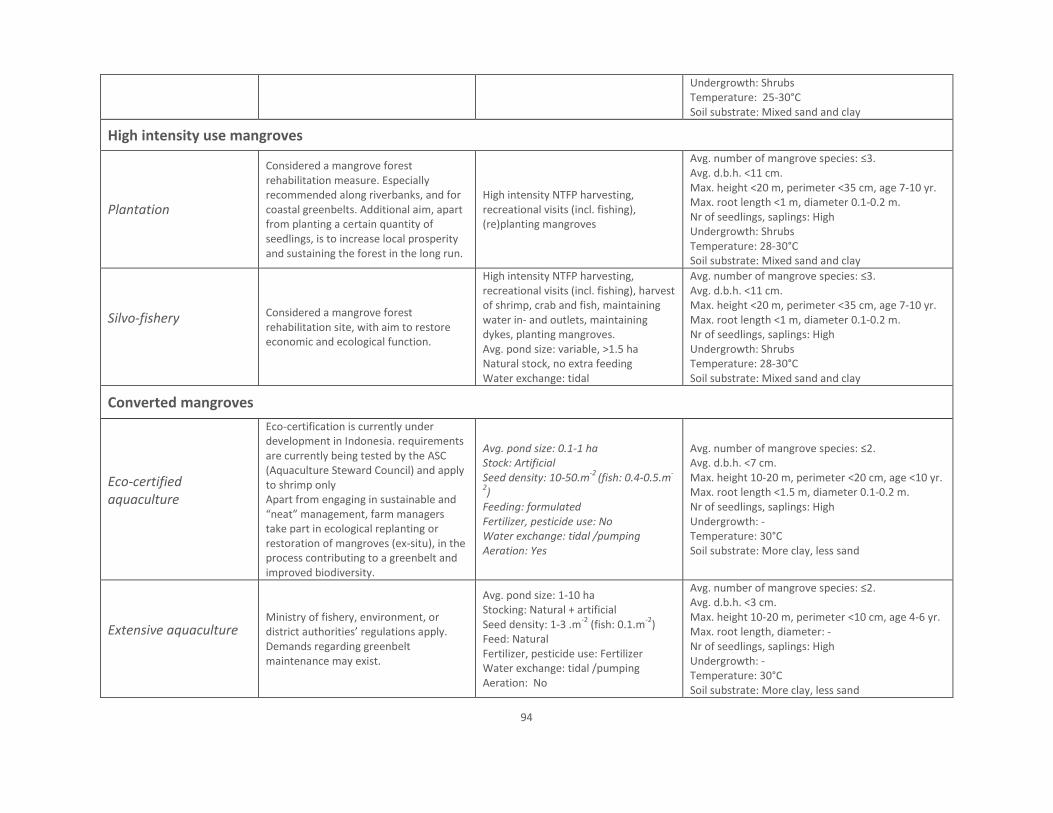
94
Undergrowth: Shrubs Temperature: 25-30°C Soil substrate: Mixed sand and clay
High intensity use mangroves
Plantation
Considered a mangrove forest rehabilitation measure. Especially recommended along riverbanks, and for coastal greenbelts. Additional aim, apart from planting a certain quantity of seedlings, is to increase local prosperity and sustaining the forest in the long run.
High intensity NTFP harvesting, recreational visits (incl. fishing), (re)planting mangroves
Avg. number of mangrove species: ≤3. Avg. d.b.h. <11 cm. Max. height <20 m, perimeter <35 cm, age 7-10 yr. Max. root length <1 m, diameter 0.1-0.2 m. Nr of seedlings, saplings: High Undergrowth: Shrubs Temperature: 28-30°C Soil substrate: Mixed sand and clay
Silvo-fishery
Considered a mangrove forest rehabilitation site, with aim to restore economic and ecological function.
High intensity NTFP harvesting, recreational visits (incl. fishing), harvest of shrimp, crab and fish, maintaining water in- and outlets, maintaining dykes, planting mangroves. Avg. pond size: variable, >1.5 ha Natural stock, no extra feeding Water exchange: tidal
Avg. number of mangrove species: ≤3. Avg. d.b.h. <11 cm. Max. height <20 m, perimeter <35 cm, age 7-10 yr. Max. root length <1 m, diameter 0.1-0.2 m. Nr of seedlings, saplings: High Undergrowth: Shrubs Temperature: 28-30°C Soil substrate: Mixed sand and clay
Converted mangroves
Eco-certified aquaculture
Eco-certification is currently under development in Indonesia. requirements are currently being tested by the ASC (Aquaculture Steward Council) and apply to shrimp only Apart from engaging in sustainable and “neat” management, farm managers take part in ecological replanting or restoration of mangroves (ex-situ), in the process contributing to a greenbelt and improved biodiversity.
Avg. pond size: 0.1-1 ha Stock: Artificial Seed density: 10-50.m
-2 (fish: 0.4-0.5.m
-
2)
Feeding: formulated Fertilizer, pesticide use: No Water exchange: tidal /pumping Aeration: Yes
Avg. number of mangrove species: ≤2. Avg. d.b.h. <7 cm. Max. height 10-20 m, perimeter <20 cm, age <10 yr. Max. root length <1.5 m, diameter 0.1-0.2 m. Nr of seedlings, saplings: High Undergrowth: - Temperature: 30°C Soil substrate: More clay, less sand
Extensive aquaculture
Ministry of fishery, environment, or district authorities’ regulations apply. Demands regarding greenbelt maintenance may exist.
Avg. pond size: 1-10 ha Stocking: Natural + artificial Seed density: 1-3 .m
-2 (fish: 0.1.m
-2)
Feed: Natural Fertilizer, pesticide use: Fertilizer Water exchange: tidal /pumping Aeration: No
Avg. number of mangrove species: ≤2. Avg. d.b.h. <3 cm. Max. height 10-20 m, perimeter <10 cm, age 4-6 yr. Max. root length, diameter: - Nr of seedlings, saplings: High Undergrowth: - Temperature: 30°C Soil substrate: More clay, less sand
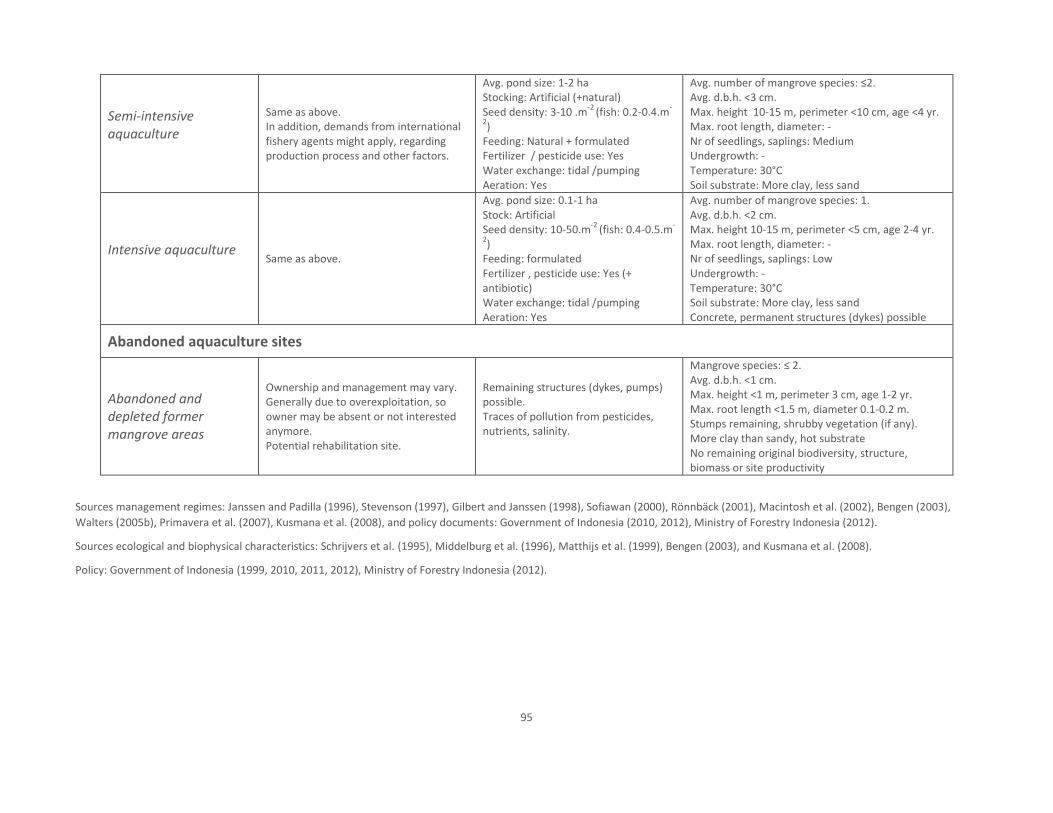
95
Semi-intensive aquaculture
Same as above. In addition, demands from international fishery agents might apply, regarding production process and other factors.
Avg. pond size: 1-2 ha Stocking: Artificial (+natural) Seed density: 3-10 .m
-2 (fish: 0.2-0.4.m
-
2)
Feeding: Natural + formulated Fertilizer / pesticide use: Yes Water exchange: tidal /pumping Aeration: Yes
Avg. number of mangrove species: ≤2. Avg. d.b.h. <3 cm. Max. height 10-15 m, perimeter <10 cm, age <4 yr. Max. root length, diameter: - Nr of seedlings, saplings: Medium Undergrowth: - Temperature: 30°C Soil substrate: More clay, less sand
Intensive aquaculture
Same as above.
Avg. pond size: 0.1-1 ha Stock: Artificial Seed density: 10-50.m
-2 (fish: 0.4-0.5.m
-
2)
Feeding: formulated Fertilizer , pesticide use: Yes (+ antibiotic) Water exchange: tidal /pumping Aeration: Yes
Avg. number of mangrove species: 1. Avg. d.b.h. <2 cm. Max. height 10-15 m, perimeter <5 cm, age 2-4 yr. Max. root length, diameter: - Nr of seedlings, saplings: Low Undergrowth: - Temperature: 30°C Soil substrate: More clay, less sand Concrete, permanent structures (dykes) possible
Abandoned aquaculture sites
Abandoned and depleted former mangrove areas
Ownership and management may vary. Generally due to overexploitation, so owner may be absent or not interested anymore. Potential rehabilitation site.
Remaining structures (dykes, pumps) possible. Traces of pollution from pesticides, nutrients, salinity.
Mangrove species: ≤ 2. Avg. d.b.h. <1 cm. Max. height <1 m, perimeter 3 cm, age 1-2 yr. Max. root length <1.5 m, diameter 0.1-0.2 m. Stumps remaining, shrubby vegetation (if any). More clay than sandy, hot substrate No remaining original biodiversity, structure, biomass or site productivity
Sources management regimes: Janssen and Padilla (1996), Stevenson (1997), Gilbert and Janssen (1998), Sofiawan (2000), Rönnbäck (2001), Macintosh et al. (2002), Bengen (2003),
Walters (2005b), Primavera et al. (2007), Kusmana et al. (2008), and policy documents: Government of Indonesia (2010, 2012), Ministry of Forestry Indonesia (2012).
Sources ecological and biophysical characteristics: Schrijvers et al. (1995), Middelburg et al. (1996), Matthijs et al. (1999), Bengen (2003), and Kusmana et al. (2008).
Policy: Government of Indonesia (1999, 2010, 2011, 2012), Ministry of Forestry Indonesia (2012).
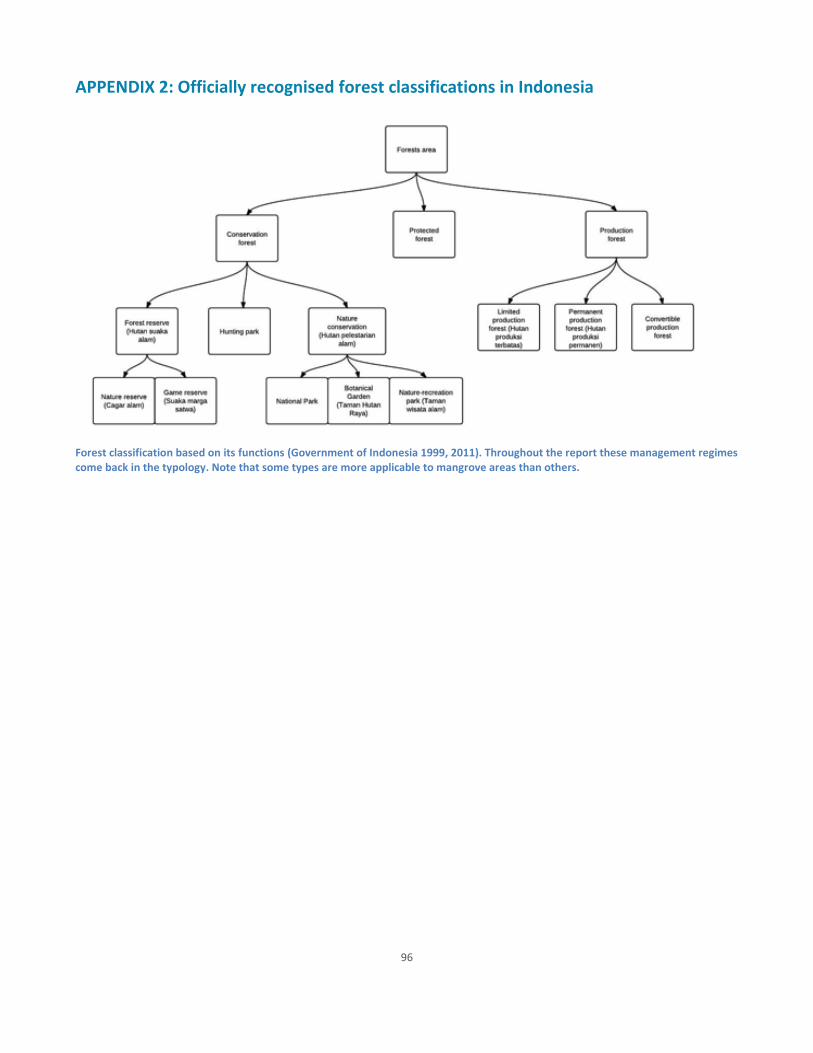
96
APPENDIX 2: Officially recognised forest classifications in Indonesia
Forest classification based on its functions (Government of Indonesia 1999, 2011). Throughout the report these management regimes come back in the typology. Note that some types are more applicable to mangrove areas than others.
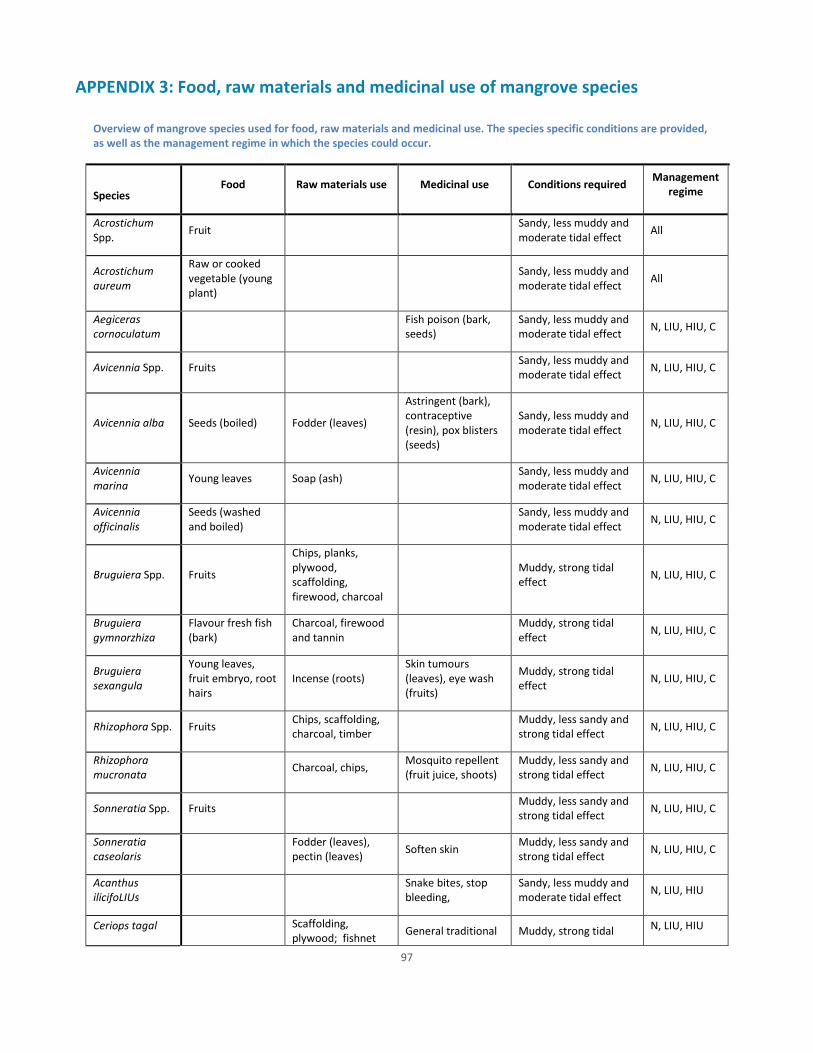
97
APPENDIX 3: Food, raw materials and medicinal use of mangrove species
Overview of mangrove species used for food, raw materials and medicinal use. The species specific conditions are provided, as well as the management regime in which the species could occur.
Species Food Raw materials use Medicinal use Conditions required
Management regime
Acrostichum Spp.
Fruit Sandy, less muddy and moderate tidal effect
All
Acrostichum aureum
Raw or cooked vegetable (young plant)
Sandy, less muddy and moderate tidal effect
All
Aegiceras cornoculatum
Fish poison (bark, seeds)
Sandy, less muddy and moderate tidal effect
N, LIU, HIU, C
Avicennia Spp. Fruits Sandy, less muddy and moderate tidal effect
N, LIU, HIU, C
Avicennia alba Seeds (boiled) Fodder (leaves)
Astringent (bark), contraceptive (resin), pox blisters (seeds)
Sandy, less muddy and moderate tidal effect
N, LIU, HIU, C
Avicennia marina
Young leaves Soap (ash) Sandy, less muddy and moderate tidal effect
N, LIU, HIU, C
Avicennia officinalis
Seeds (washed and boiled)
Sandy, less muddy and moderate tidal effect
N, LIU, HIU, C
Bruguiera Spp. Fruits
Chips, planks, plywood, scaffolding, firewood, charcoal
Muddy, strong tidal effect
N, LIU, HIU, C
Bruguiera gymnorzhiza
Flavour fresh fish (bark)
Charcoal, firewood and tannin
Muddy, strong tidal effect
N, LIU, HIU, C
Bruguiera sexangula
Young leaves, fruit embryo, root hairs
Incense (roots) Skin tumours (leaves), eye wash (fruits)
Muddy, strong tidal effect
N, LIU, HIU, C
Rhizophora Spp. Fruits Chips, scaffolding, charcoal, timber
Muddy, less sandy and strong tidal effect
N, LIU, HIU, C
Rhizophora mucronata
Charcoal, chips, Mosquito repellent (fruit juice, shoots)
Muddy, less sandy and strong tidal effect
N, LIU, HIU, C
Sonneratia Spp. Fruits Muddy, less sandy and strong tidal effect
N, LIU, HIU, C
Sonneratia caseolaris
Fodder (leaves), pectin (leaves)
Soften skin Muddy, less sandy and strong tidal effect
N, LIU, HIU, C
Acanthus ilicifoLIUs
Snake bites, stop bleeding,
Sandy, less muddy and moderate tidal effect
N, LIU, HIU
Ceriops tagal Scaffolding, plywood; fishnet
General traditional Muddy, strong tidal N, LIU, HIU
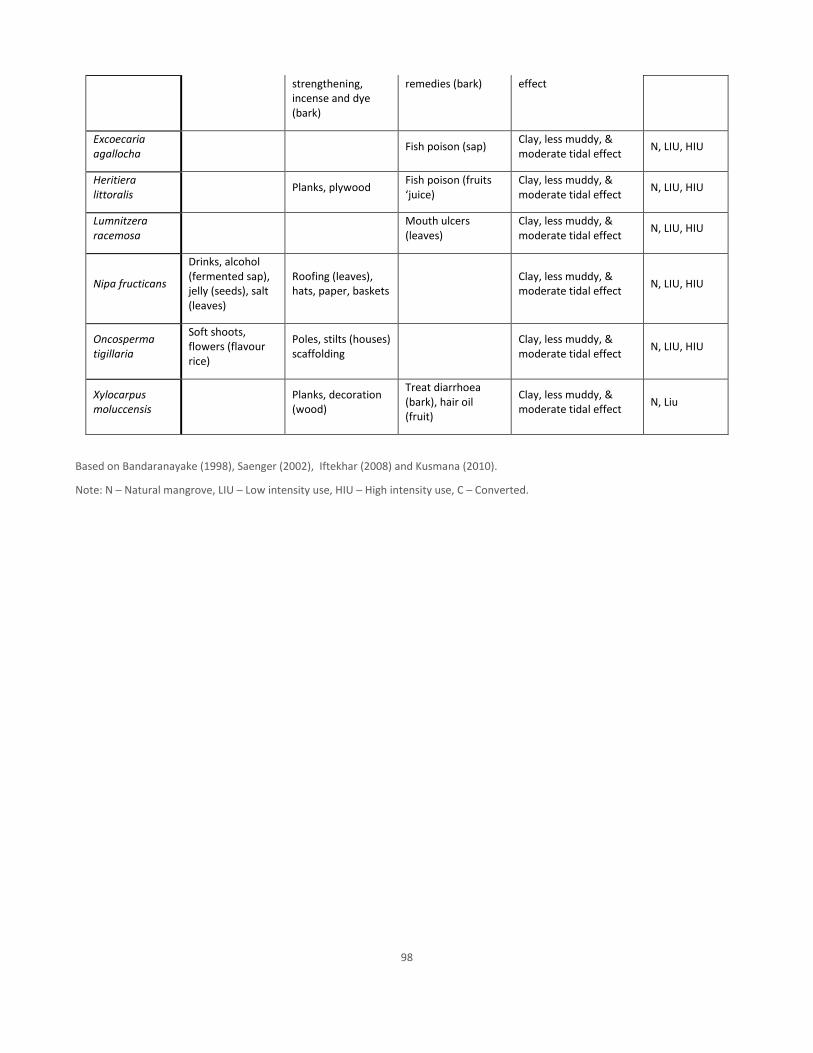
98
strengthening, incense and dye (bark)
remedies (bark) effect
Excoecaria agallocha
Fish poison (sap) Clay, less muddy, & moderate tidal effect
N, LIU, HIU
Heritiera littoralis
Planks, plywood Fish poison (fruits ‘juice)
Clay, less muddy, & moderate tidal effect
N, LIU, HIU
Lumnitzera racemosa
Mouth ulcers (leaves)
Clay, less muddy, & moderate tidal effect
N, LIU, HIU
Nipa fructicans
Drinks, alcohol (fermented sap), jelly (seeds), salt (leaves)
Roofing (leaves), hats, paper, baskets
Clay, less muddy, & moderate tidal effect
N, LIU, HIU
Oncosperma tigillaria
Soft shoots, flowers (flavour rice)
Poles, stilts (houses) scaffolding
Clay, less muddy, & moderate tidal effect
N, LIU, HIU
Xylocarpus moluccensis
Planks, decoration (wood)
Treat diarrhoea (bark), hair oil (fruit)
Clay, less muddy, & moderate tidal effect
N, Liu
Based on Bandaranayake (1998), Saenger (2002), Iftekhar (2008) and Kusmana (2010).
Note: N – Natural mangrove, LIU – Low intensity use, HIU – High intensity use, C – Converted.
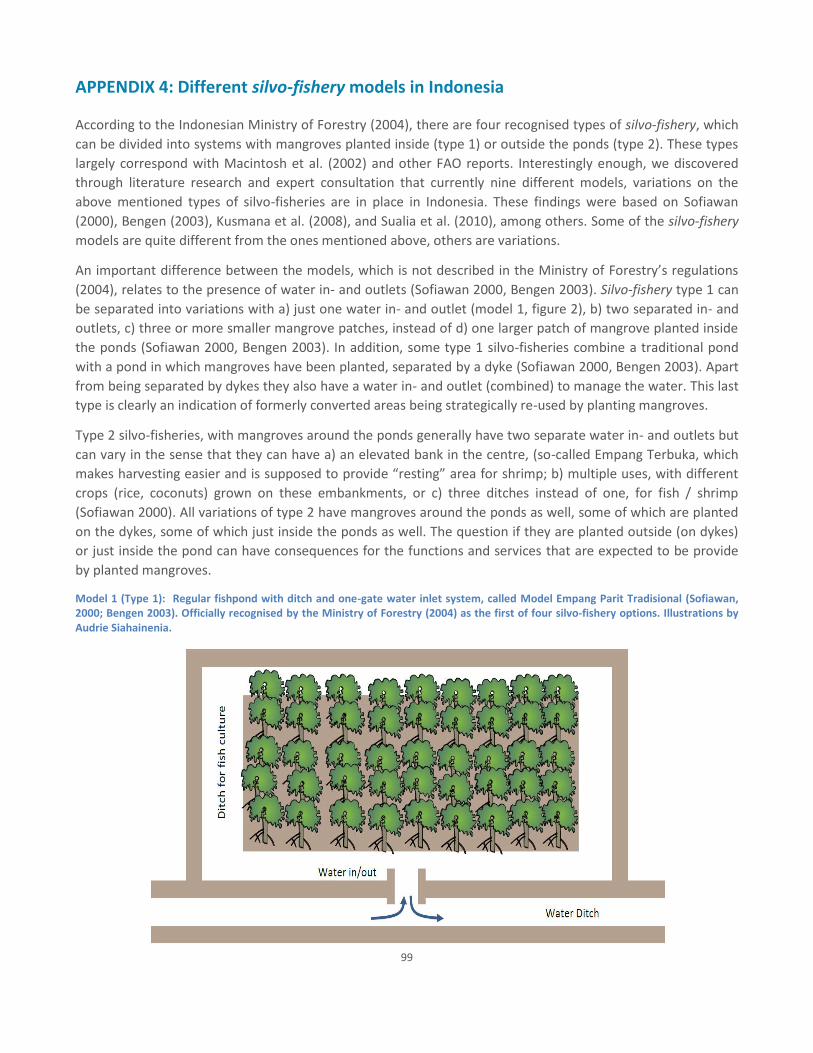
99
APPENDIX 4: Different silvo-fishery models in Indonesia
According to the Indonesian Ministry of Forestry (2004), there are four recognised types of silvo-fishery, which
can be divided into systems with mangroves planted inside (type 1) or outside the ponds (type 2). These types
largely correspond with Macintosh et al. (2002) and other FAO reports. Interestingly enough, we discovered
through literature research and expert consultation that currently nine different models, variations on the
above mentioned types of silvo-fisheries are in place in Indonesia. These findings were based on Sofiawan
(2000), Bengen (2003), Kusmana et al. (2008), and Sualia et al. (2010), among others. Some of the silvo-fishery
models are quite different from the ones mentioned above, others are variations.
An important difference between the models, which is not described in the Ministry of Forestry’s regulations
(2004), relates to the presence of water in- and outlets (Sofiawan 2000, Bengen 2003). Silvo-fishery type 1 can
be separated into variations with a) just one water in- and outlet (model 1, figure 2), b) two separated in- and
outlets, c) three or more smaller mangrove patches, instead of d) one larger patch of mangrove planted inside
the ponds (Sofiawan 2000, Bengen 2003). In addition, some type 1 silvo-fisheries combine a traditional pond
with a pond in which mangroves have been planted, separated by a dyke (Sofiawan 2000, Bengen 2003). Apart
from being separated by dykes they also have a water in- and outlet (combined) to manage the water. This last
type is clearly an indication of formerly converted areas being strategically re-used by planting mangroves.
Type 2 silvo-fisheries, with mangroves around the ponds generally have two separate water in- and outlets but
can vary in the sense that they can have a) an elevated bank in the centre, (so-called Empang Terbuka, which
makes harvesting easier and is supposed to provide “resting” area for shrimp; b) multiple uses, with different
crops (rice, coconuts) grown on these embankments, or c) three ditches instead of one, for fish / shrimp
(Sofiawan 2000). All variations of type 2 have mangroves around the ponds as well, some of which are planted
on the dykes, some of which just inside the ponds as well. The question if they are planted outside (on dykes)
or just inside the pond can have consequences for the functions and services that are expected to be provide
by planted mangroves.
Model 1 (Type 1): Regular fishpond with ditch and one-gate water inlet system, called Model Empang Parit Tradisional (Sofiawan, 2000; Bengen 2003). Officially recognised by the Ministry of Forestry (2004) as the first of four silvo-fishery options. Illustrations by Audrie Siahainenia.
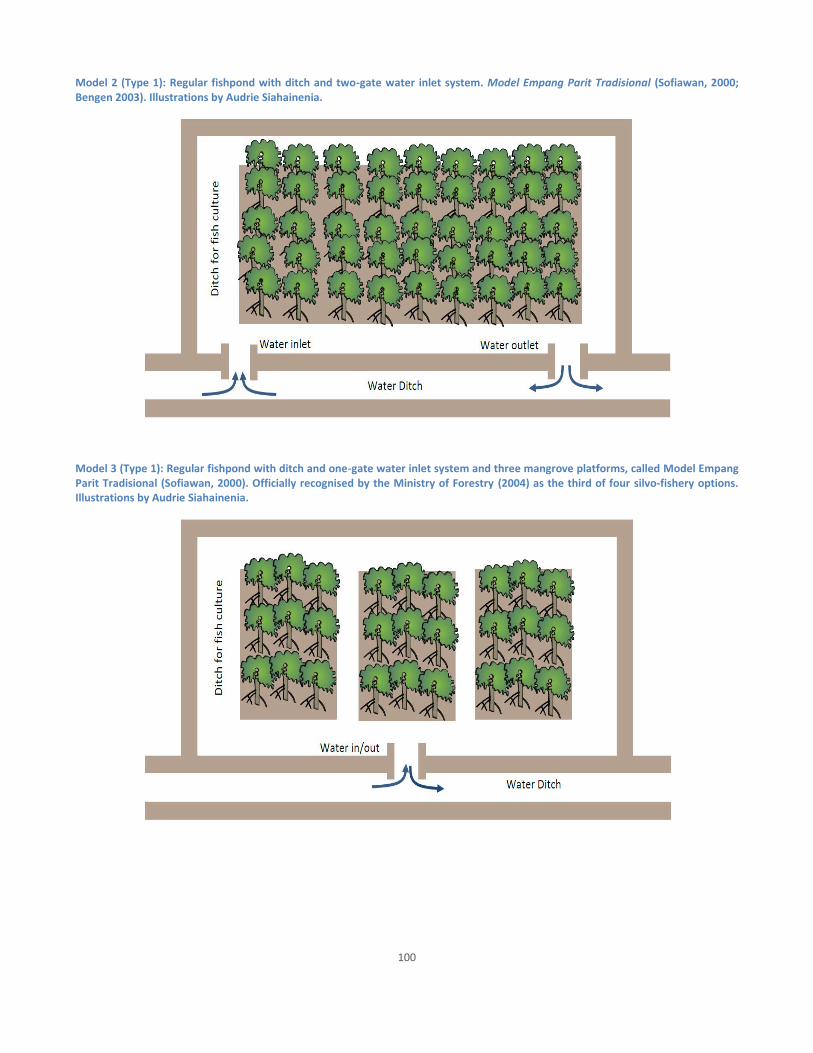
100
Model 2 (Type 1): Regular fishpond with ditch and two-gate water inlet system. Model Empang Parit Tradisional (Sofiawan, 2000; Bengen 2003). Illustrations by Audrie Siahainenia.
Model 3 (Type 1): Regular fishpond with ditch and one-gate water inlet system and three mangrove platforms, called Model Empang Parit Tradisional (Sofiawan, 2000). Officially recognised by the Ministry of Forestry (2004) as the third of four silvo-fishery options. Illustrations by Audrie Siahainenia.
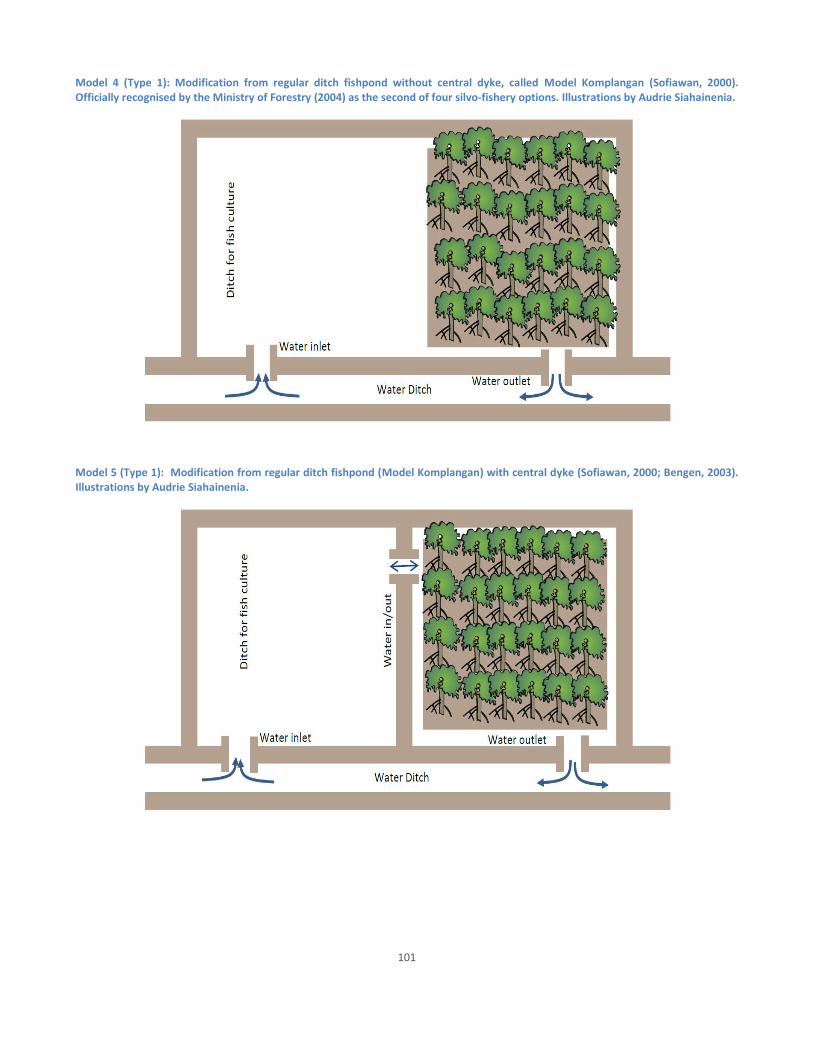
101
Model 4 (Type 1): Modification from regular ditch fishpond without central dyke, called Model Komplangan (Sofiawan, 2000). Officially recognised by the Ministry of Forestry (2004) as the second of four silvo-fishery options. Illustrations by Audrie Siahainenia.
Model 5 (Type 1): Modification from regular ditch fishpond (Model Komplangan) with central dyke (Sofiawan, 2000; Bengen, 2003). Illustrations by Audrie Siahainenia.
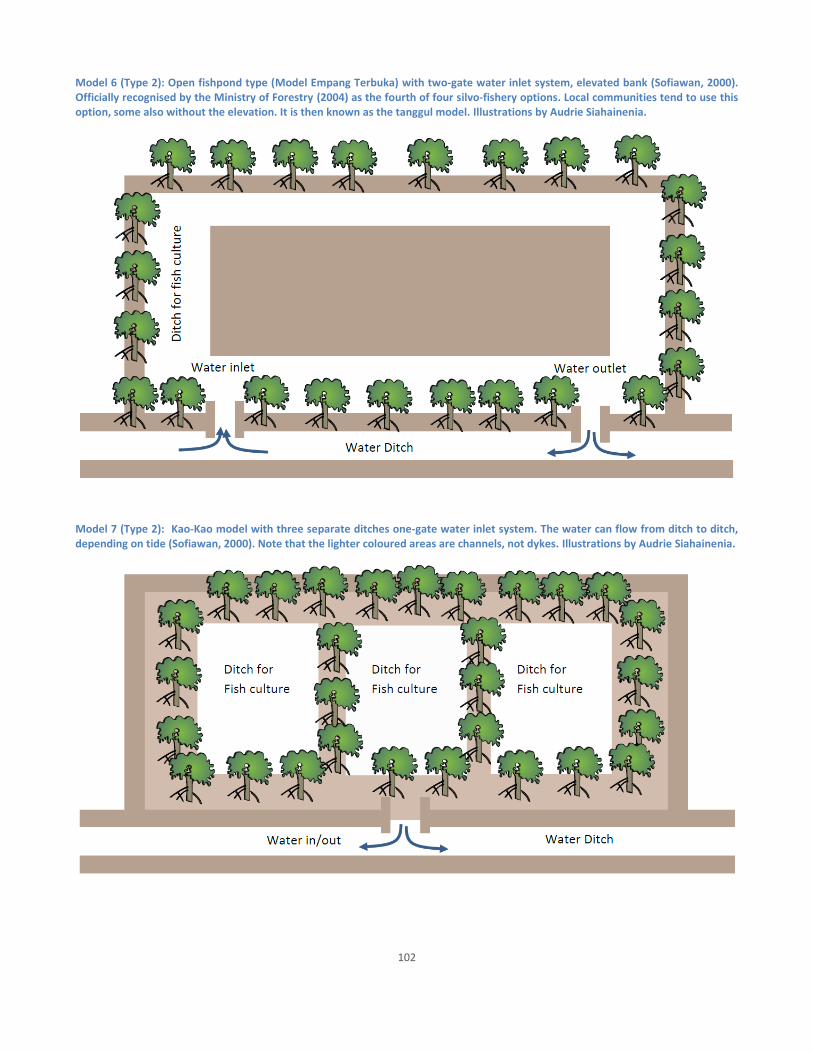
102
Model 6 (Type 2): Open fishpond type (Model Empang Terbuka) with two-gate water inlet system, elevated bank (Sofiawan, 2000). Officially recognised by the Ministry of Forestry (2004) as the fourth of four silvo-fishery options. Local communities tend to use this option, some also without the elevation. It is then known as the tanggul model. Illustrations by Audrie Siahainenia.
Model 7 (Type 2): Kao-Kao model with three separate ditches one-gate water inlet system. The water can flow from ditch to ditch, depending on tide (Sofiawan, 2000). Note that the lighter coloured areas are channels, not dykes. Illustrations by Audrie Siahainenia.
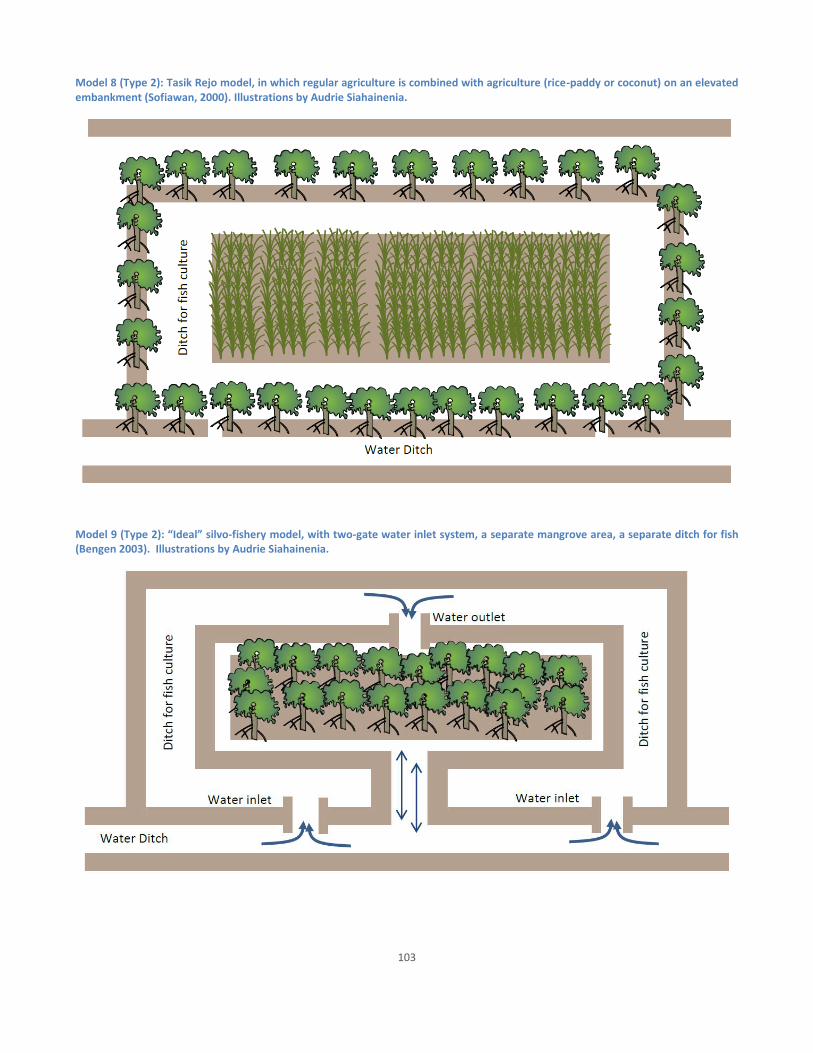
103
Model 8 (Type 2): Tasik Rejo model, in which regular agriculture is combined with agriculture (rice-paddy or coconut) on an elevated embankment (Sofiawan, 2000). Illustrations by Audrie Siahainenia.
Model 9 (Type 2): “Ideal” silvo-fishery model, with two-gate water inlet system, a separate mangrove area, a separate ditch for fish (Bengen 2003). Illustrations by Audrie Siahainenia.
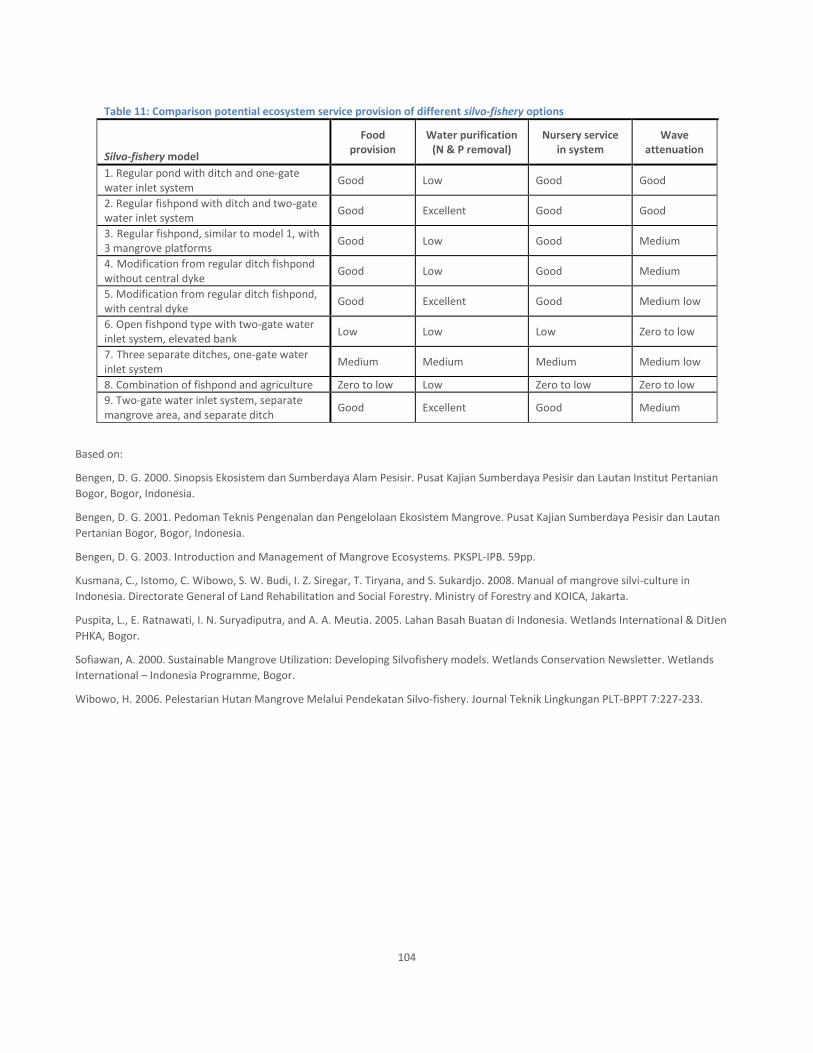
104
Table 11: Comparison potential ecosystem service provision of different silvo-fishery options
Silvo-fishery model
Food provision
Water purification (N & P removal)
Nursery service in system
Wave attenuation
1. Regular pond with ditch and one-gate water inlet system
Good Low Good Good
2. Regular fishpond with ditch and two-gate water inlet system
Good Excellent Good Good
3. Regular fishpond, similar to model 1, with 3 mangrove platforms
Good Low Good Medium
4. Modification from regular ditch fishpond without central dyke
Good Low Good Medium
5. Modification from regular ditch fishpond, with central dyke
Good Excellent Good Medium low
6. Open fishpond type with two-gate water inlet system, elevated bank
Low Low Low Zero to low
7. Three separate ditches, one-gate water inlet system
Medium Medium Medium Medium low
8. Combination of fishpond and agriculture Zero to low Low Zero to low Zero to low
9. Two-gate water inlet system, separate mangrove area, and separate ditch
Good Excellent Good Medium
Based on:
Bengen, D. G. 2000. Sinopsis Ekosistem dan Sumberdaya Alam Pesisir. Pusat Kajian Sumberdaya Pesisir dan Lautan Institut Pertanian
Bogor, Bogor, Indonesia.
Bengen, D. G. 2001. Pedoman Teknis Pengenalan dan Pengelolaan Ekosistem Mangrove. Pusat Kajian Sumberdaya Pesisir dan Lautan
Pertanian Bogor, Bogor, Indonesia.
Bengen, D. G. 2003. Introduction and Management of Mangrove Ecosystems. PKSPL-IPB. 59pp.
Kusmana, C., Istomo, C. Wibowo, S. W. Budi, I. Z. Siregar, T. Tiryana, and S. Sukardjo. 2008. Manual of mangrove silvi-culture in
Indonesia. Directorate General of Land Rehabilitation and Social Forestry. Ministry of Forestry and KOICA, Jakarta.
Puspita, L., E. Ratnawati, I. N. Suryadiputra, and A. A. Meutia. 2005. Lahan Basah Buatan di Indonesia. Wetlands International & DitJen
PHKA, Bogor.
Sofiawan, A. 2000. Sustainable Mangrove Utilization: Developing Silvofishery models. Wetlands Conservation Newsletter. Wetlands
International – Indonesia Programme, Bogor.
Wibowo, H. 2006. Pelestarian Hutan Mangrove Melalui Pendekatan Silvo-fishery. Journal Teknik Lingkungan PLT-BPPT 7:227-233.