Embed Size (px)
Citation preview
Supporting Information
A hexanuclear Cu(I) cluster supported by cuprophilic interaction:
Effects of aromatics on luminescence propertiesAnindita Chakraborty,a Ramachandran Krishna Kumar, a Sharma SRKC Yamijala,b Swapan K.
Pati b and Tapas K. Maji* a
These authors contributed equally
a Molecular Materials Laboratory, Chemistry and Physics of Materials Unit, Jawaharlal Nehru
Centre for Advanced Scientific Research, Jakkur, Bangalore – 560 064, India. *E-mail:
[email protected], Phone: +91 80 2208 2826, FAX: +91 80 2208 2766b Theoretical Science Unit, Jawaharlal Nehru Centre for Advanced Scientific research, Jakkur,
Bangalore – 560 064, India.
Materials required: All the reagents were purchased from Aldrich Chemical Co. Inc. and
Spectrochem Pvt. Ltd., Mumbai, India. All the chemicals were use without further purification.
Physical measurement:
Elemental analyses were carried out using a Perkin Elmer 2400 CHN analyzer. Powder X-ray
diffraction (PXRD) patterns were recorded on a Bruker D8 Discover instrument using Cu–K
radiation. IR spectra were recorded on a Bruker IFS 66v/S spectrophotometer using KBr pellets
in the region 4000400 cm−1. UV-Vis spectra were recorded on a Perkin Elmer Model Lambda
900 spectrophotometer and fluorescence spectra were recorded on a Perkin Elmer Model LS 55
spectrophotometer. The time drive option in the instrument has been used for time dependent
fluorescence study. The fluorescent quantum yields were measured using an absolute
photoluminescence quantum yield measurement system.
Single-crystal X-ray Diffraction:X-ray single-crystal structural data of 1 was collected on a Bruker Smart–CCD diffractometer
equipped with a normal focus, 2.4 kW sealed tube X-ray source with graphite monochromated
Electronic Supplementary Material (ESI) for RSC Advances.This journal is © The Royal Society of Chemistry 2014

Mo–Kα radiation (λ = 0.71073 Å) operating at 50 kV and 30 mA. The SAINT program1a was
used for integration of diffraction profiles and absorption correction was made with SADABS1b
program. All the structures were solved by SIR 921c and refined by full matrix least square
method using SHELXL 971d. All the non-hydrogen atoms were refined anisotropically and all
the hydrogen atoms were fixed by HFIX and placed in ideal positions. All calculations were
carried out using SHELXL 97, PLATON1e and WinGX system, Ver 1.70.01.1f
Crystal data of 1: empirical formula = C60H42Cu6O18, M = 1432.24, Triclinic, space group P-1,
a = 11.0572(17) Å, b = 11.7719(11) Å, c =12.2096(17) Å, α=69.518(11)°, β=67.483(14)°,
γ=65.832(12)°, V= 1303.8(3)Å3, T=293K, Z=1, Dcalcd = 1.824 g/cc, F(000)=720, Rint=0.0534, Rw
=0.1616 for 3451 reflections with I≥2σ(I) , GOF=1.05, Δρ max/min [e Å-3]= 0.61/-0.81.
Study of vapour sensing: To study the vapour sensing property, thin layers were prepared on
quartz slides. Double-sided tape was applied to lower part of a clean and dried quartz slide and
then peeled off after few minutes. The powder sample of compound 1 was then spread evenly
onto the glued surface of the slide and a thin continuous layer of sample was thus formed.
For the solid analytes (1,2-DNB, DNT and NM), 10 mmol of each were placed in open
glass vials (20 ml) which were placed into capped (500ml) glass bottles for ten days to ensure
that the equilibrated vapor pressure of each analytes was reached. Similarly for the liquid sample
(NB, toluene, o-xylene, p-xylene), 10 mmol of each was taken and the previous procedure was
followed. The emission spectrum of the thin layer of the parent compound (1) was collected
before placing the slide into the bottles containing the particular analyte. After definite exposure
time, the slide was taken out and immediately the emission spectrum was recorded. New slides
with a thin layer were used for each of the experiment.
Computational Details:
Geometry optimizations and UV-Visible spectra of all the molecules have been calculated using
density functional theory (DFT) and Time-dependent DFT (TDDFT) methods, respectively, as
implemented in Gaussian software2. We have used B3LYP exchange correlation functional, with
LANL2DZ basis-set for copper atoms and 6-31g(d) basis-set for other atoms, in all our

calculations. Previously, it has been shown that TDDFT at B3LYP/6-31g(d) level of theory will
give good results for low-energy excited states of larger molecules.3
Detailed discussion of computation results:
We have performed DFT/TDDFT calculations in order to understand both the nature of the
excited state emission and also to know the possible reasons for the luminescence
quenching/enhancing of the parent compound in the presence of analytes. First, hydrogen atoms
of the experimentally obtained structure have been optimized with a singlet multiplicity. Next,
absorption spectra (for first 50 singlet states) of this optimized structure have been calculated.
Fig. S7 shows both the experimental and the calculated UV-visible spectra and it is clear that the
calculated spectrum has captured the main features of the experimental spectrum. Calculated
spectrum is mainly spanned over 260-340 nm region (at this level of theory), with a large
number of high intense peaks being located mainly in the 260-310 nm region. Analyzing the
excitations (whose oscillator strength is more than 0.01) we found that the excitations have
ligand to metal charge-transfer (LMCT) character (see Table S2) as well as ligand to ligand
charge-transfer (LLCT) and metal-metal charge-transfer (MMCT) characteristics. These
preliminary calculations show that the transitions having high oscillator strengths (for example,
see transitions 8 and 19 of Table S2) are mainly of hybrid character (i.e. a mixture of LMCT,
MMCT and LLCT).
Next, we have followed Angelis et. al4a and Perruchas et. al4b to calculate the emission of
the parent-compound 1. We have optimized the H-atom positions of the experimental structure
and found it to exist in a singlet state. We then optimized this structure considering a triplet (T1)
spin state at B3LYP/6-31g(d) level of theory and found a single state (S1) is at a lower energy, in
the same geometry as the triplet state (T1). However, if we completely optimize the complex in
the singlet state then the system has the lowest energy (S0). Given the singlet and triplet state
energies, as shown in the Table S3, the calculated emission wavelength (~ 587 nm) (energy
difference between T1 and S1 states4) is very close to the experimental emission wavelength (~
560 nm). Considering that this emission corresponds to the experimental emission peak4, we
have calculated the electron density difference map (EDDM) between these triplet (T1) and
singlet states (S1) (Fig. 2 in main manuscript), to understand the nature of emission. Clearly, this
map established cluster centered emission in this compound.
Finally, to understand the reason for the fluorescence quenching and enhancing in the
presence of electron withdrawing and electron rich compounds respectively, we have calculated
the HOMO and LUMO levels of all the compounds optimized at the same level of theory
(B3LYP/6-31g(d)). The respective energy levels are plotted in Fig. S17. Clearly, the LUMO of
all compounds having electron donating groups lie above the LUMO of parent-compound while
for compounds with electron withdrawing groups, the LUMOs lie below the LUMO of 1. This
result is in accordance with the suggested donor-acceptor electron transfer mechanism in excited
state.
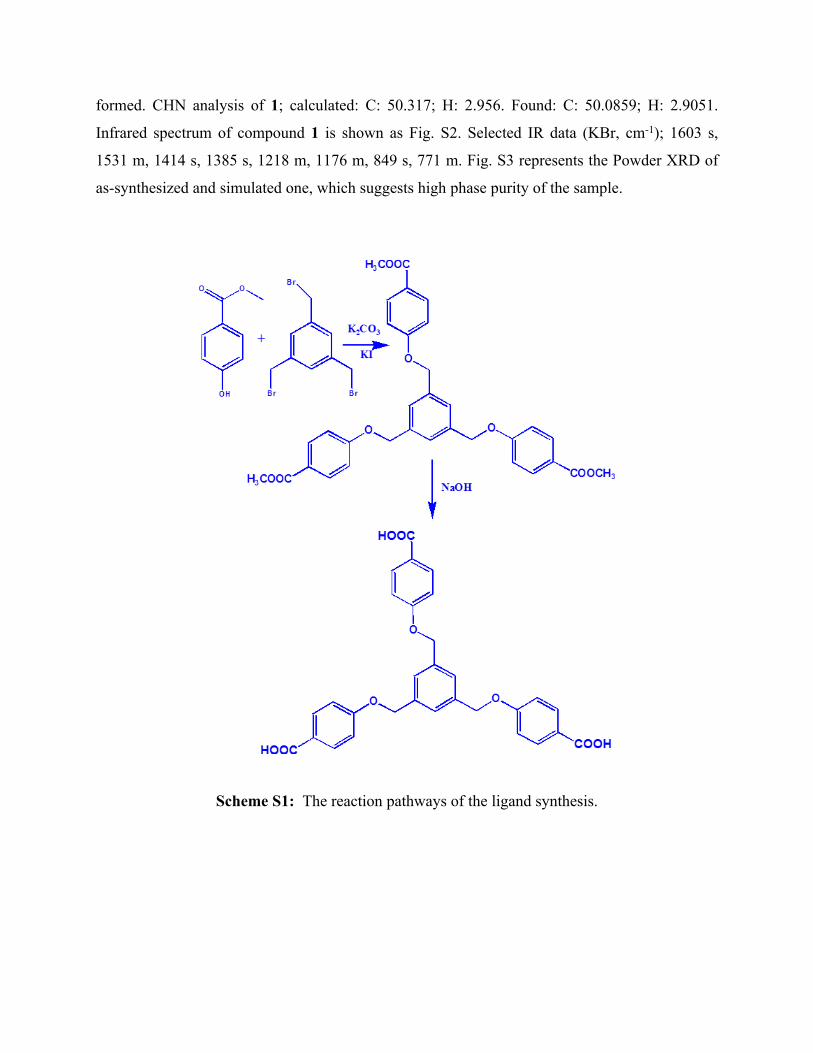
Synthesis of 4,4ʹ,4ʹʹ-[1,3,5-phenyl-tri(methoxy)]-tris-benzoic acid (L)
Methyl-4-hydroxy benzoate (1 g, 6.57 mmol), potassium carbonate (2.890 g, 20.1 mmol) and
potassium iodide (0.085 g, 0.51 mmol) were heated in 30 mL DMF at 100 C for 2 hours in
nitrogen atmosphere. Solution of 1,3,5-Tris(bromomethyl)benzene (0.500 g, 1.4 mmol) in 20 mL
DMF was then added dropwise to the above heated mixture and the mixture was heated for 4
hours at 100 C. After cooling to room temperature, 100 mL of distilled water was added to it.
The precipitate formed was filtered, washed with cold distilled water and air dried to get white
solid of the ester 4,4ʹ,4ʹʹ-[1,3,5-phenyl-tri(methoxy)]-tri-methyl benzoate (Scheme S1).
For the ester hydrolysis, to 4,4ʹ,4ʹʹ-[1,3,5-phenyl-tri(methoxy)]-tri-methyl benzoate (~500
mg), 40 mL of MeOH and 1 g of sodium hydroxide dissolved in 10 mL of water was added in a
round bottomed flask. The reaction mixture was then stirred at 50 C for 12 hours. After cooling
to room temperature, the solution was placed in an ice bath and acidified with 6N hydrochloric
acid. The precipitate formed was then filtered, washed with cold distilled water and dried. A
solid of 4,4ʹ,4ʹʹ-[1,3,5-phenyl-tri(methoxy)]-tris-benzoic acid ligand was obtained, which was
characterized by NMR (Fig. S1).
Synthesis of {Cu3(L)2}2 (1):
Compound 1 was synthesized by self-assembly between Cu(II) ion and the tripodal ligand L
employing solvothermal condition. Cu(NO3)2.2.5H2O (0.075 mmol) and L (0.05 mmol) in were
taken in a 23 ml Teflon bomb. To this solution 6 ml DMF was added and the solution was stirred
for 10 minutes. The Teflon bomb was kept at 120°C for 2 days. After completion of the reaction,
the bomb was cooled to RT for 12 hour. Colorless block shaped crystals along with powder were
formed. CHN analysis of 1; calculated: C: 50.317; H: 2.956. Found: C: 50.0859; H: 2.9051.
Infrared spectrum of compound 1 is shown as Fig. S2. Selected IR data (KBr, cm-1); 1603 s,
1531 m, 1414 s, 1385 s, 1218 m, 1176 m, 849 s, 771 m. Fig. S3 represents the Powder XRD of
as-synthesized and simulated one, which suggests high phase purity of the sample.
Scheme S1: The reaction pathways of the ligand synthesis.
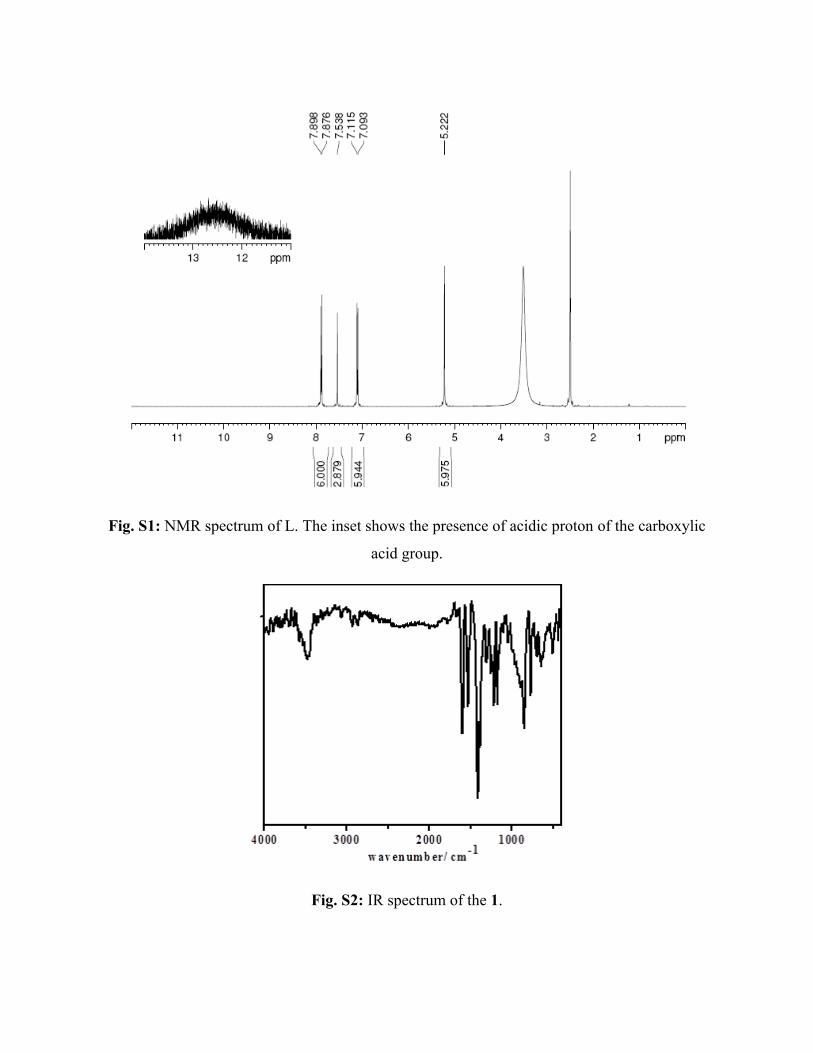
Fig. S1: NMR spectrum of L. The inset shows the presence of acidic proton of the carboxylic
acid group.
Fig. S2: IR spectrum of the 1.
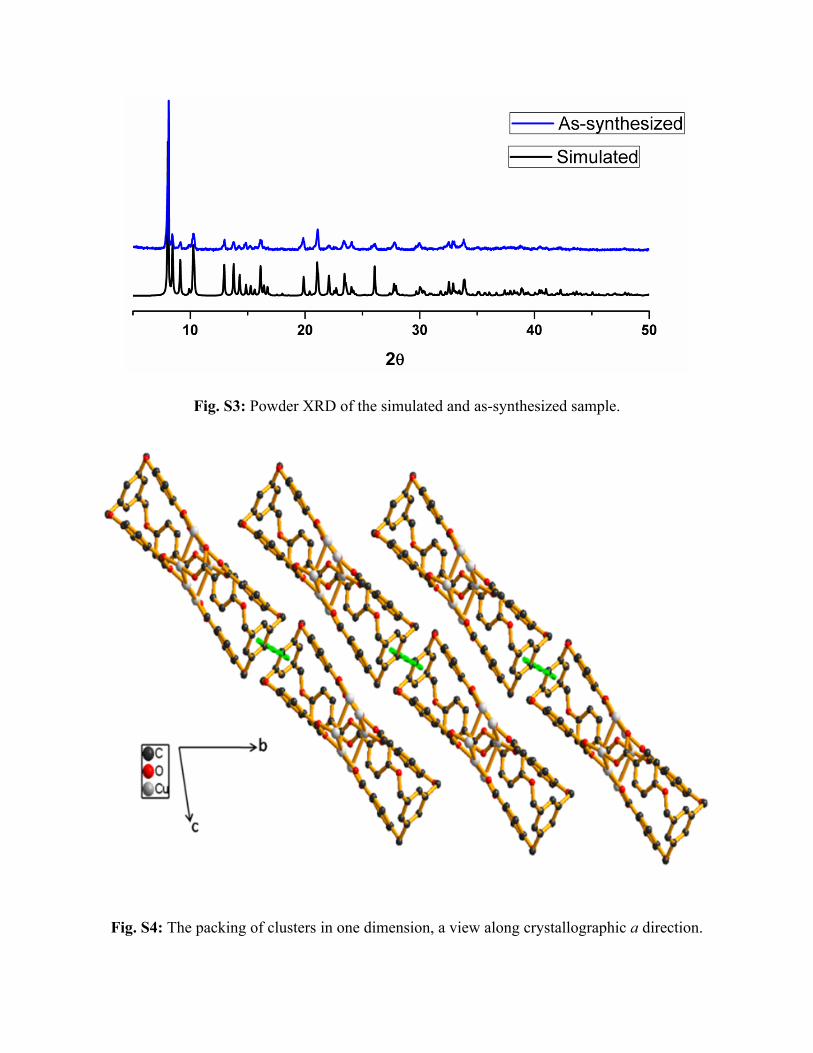
Fig. S3: Powder XRD of the simulated and as-synthesized sample.
Fig. S4: The packing of clusters in one dimension, a view along crystallographic a direction.
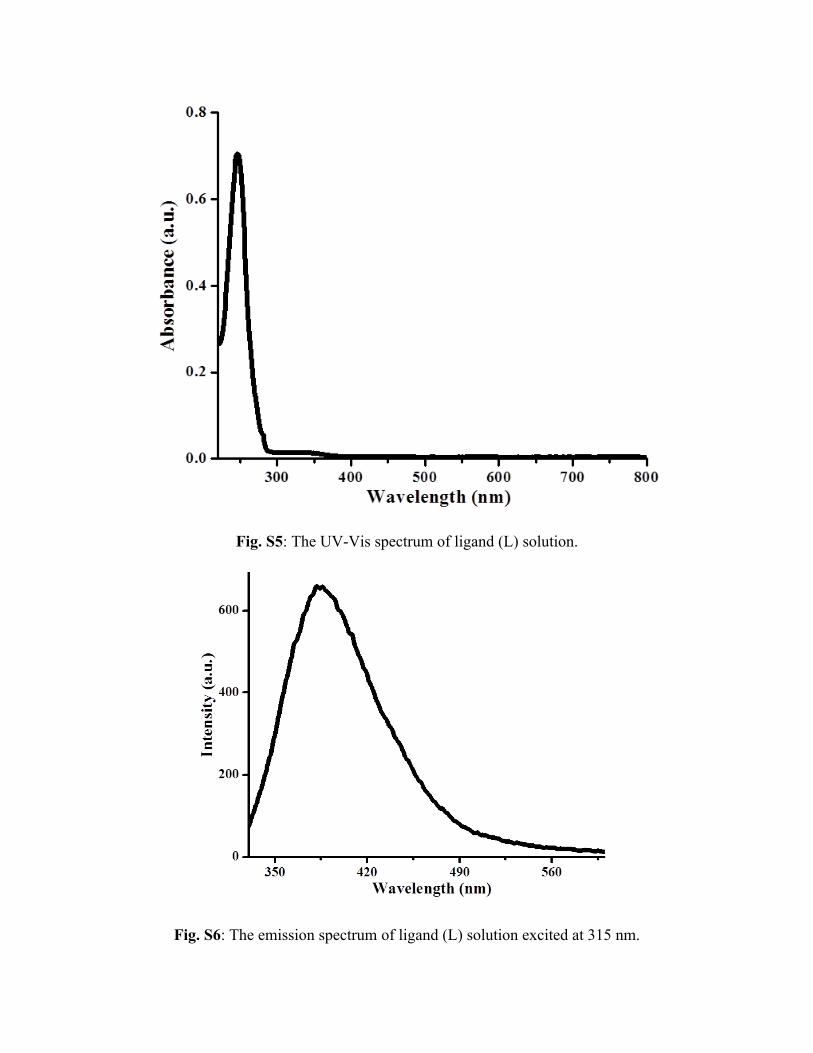
Fig. S5: The UV-Vis spectrum of ligand (L) solution.
Fig. S6: The emission spectrum of ligand (L) solution excited at 315 nm.
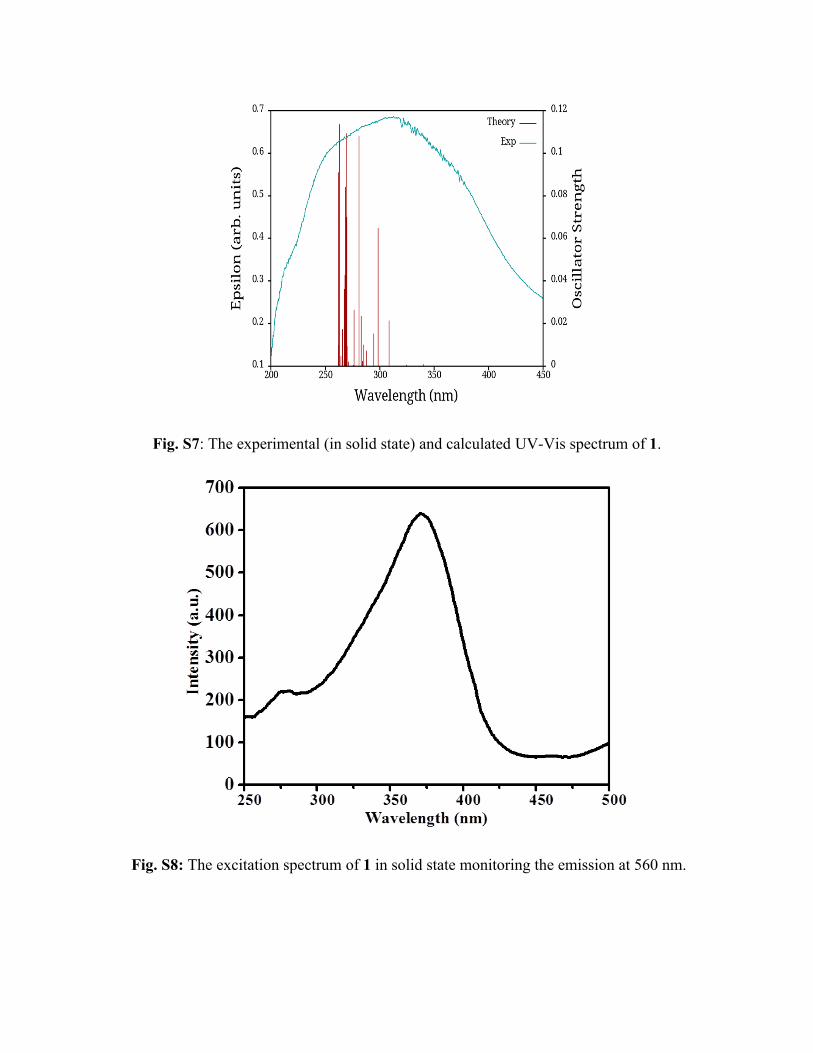
Fig. S7: The experimental (in solid state) and calculated UV-Vis spectrum of 1.
Fig. S8: The excitation spectrum of 1 in solid state monitoring the emission at 560 nm.
21
2211
adv
8097.021
11
AAA
1902.021
22
AAA
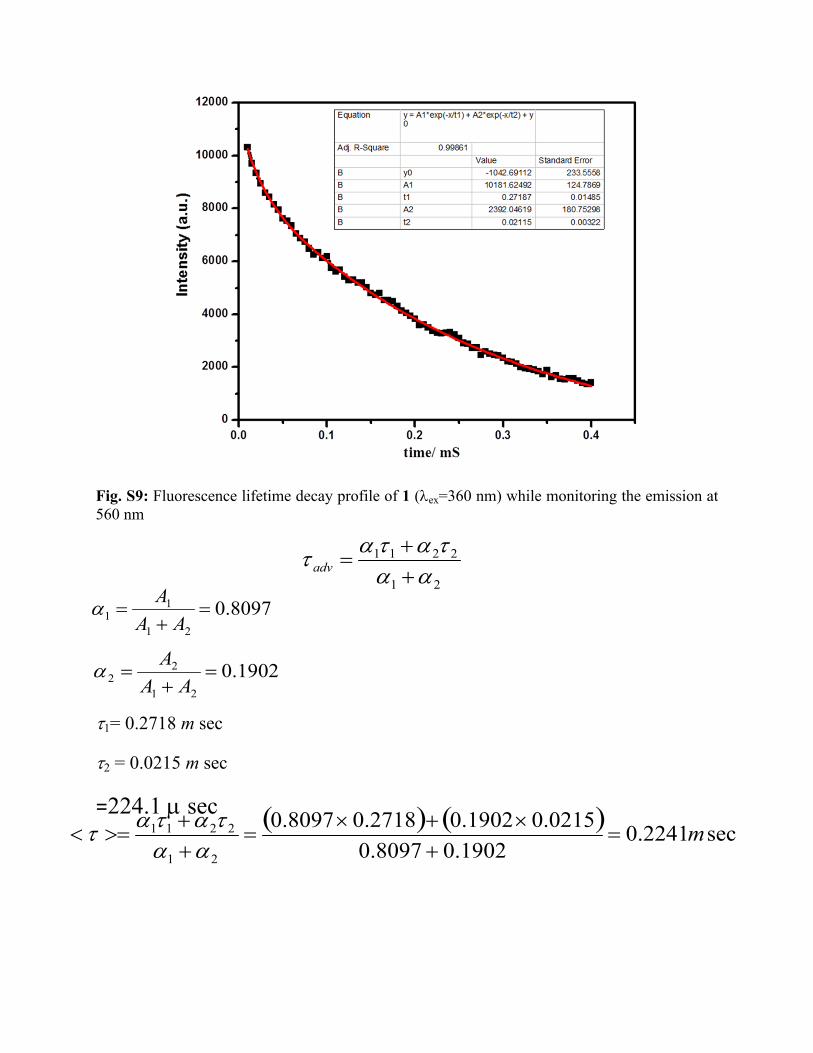
sec2241.01902.08097.0
0215.01902.02718.08097.0
21
2211 m
Fig. S9: Fluorescence lifetime decay profile of 1 (ex=360 nm) while monitoring the emission at 560 nm
1= 0.2718 m sec
2 = 0.0215 m sec
=224.1 sec
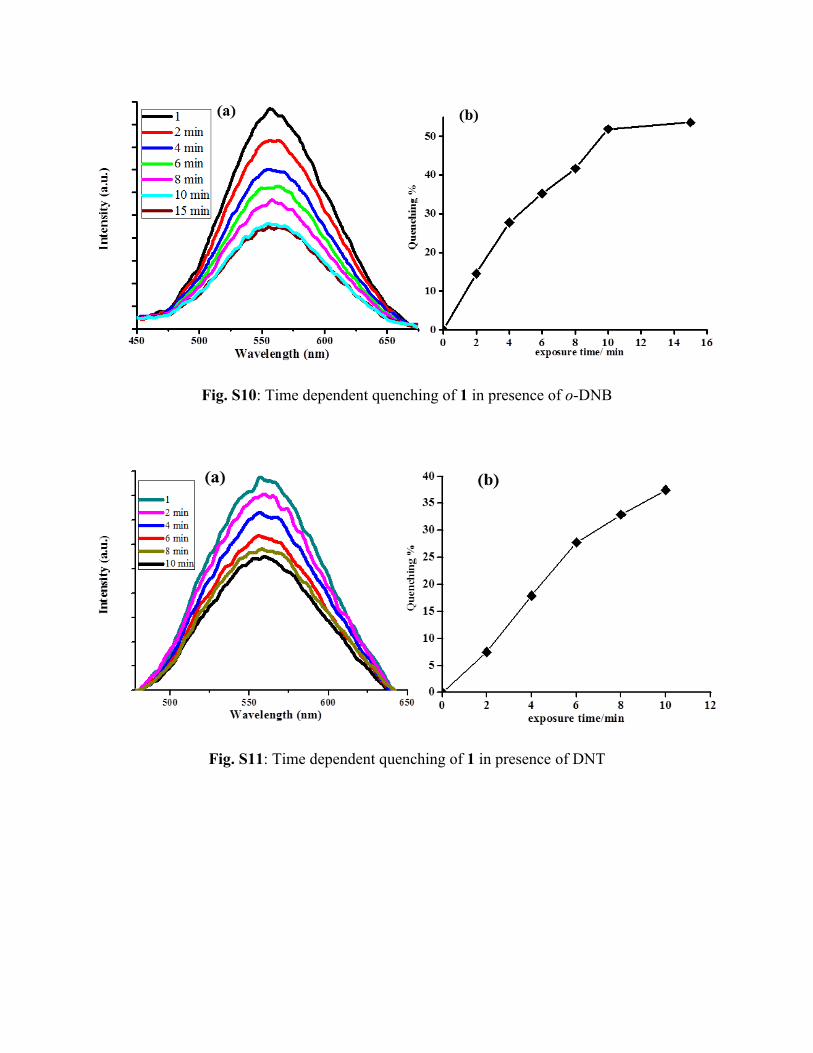
Fig. S10: Time dependent quenching of 1 in presence of o-DNB
Fig. S11: Time dependent quenching of 1 in presence of DNT
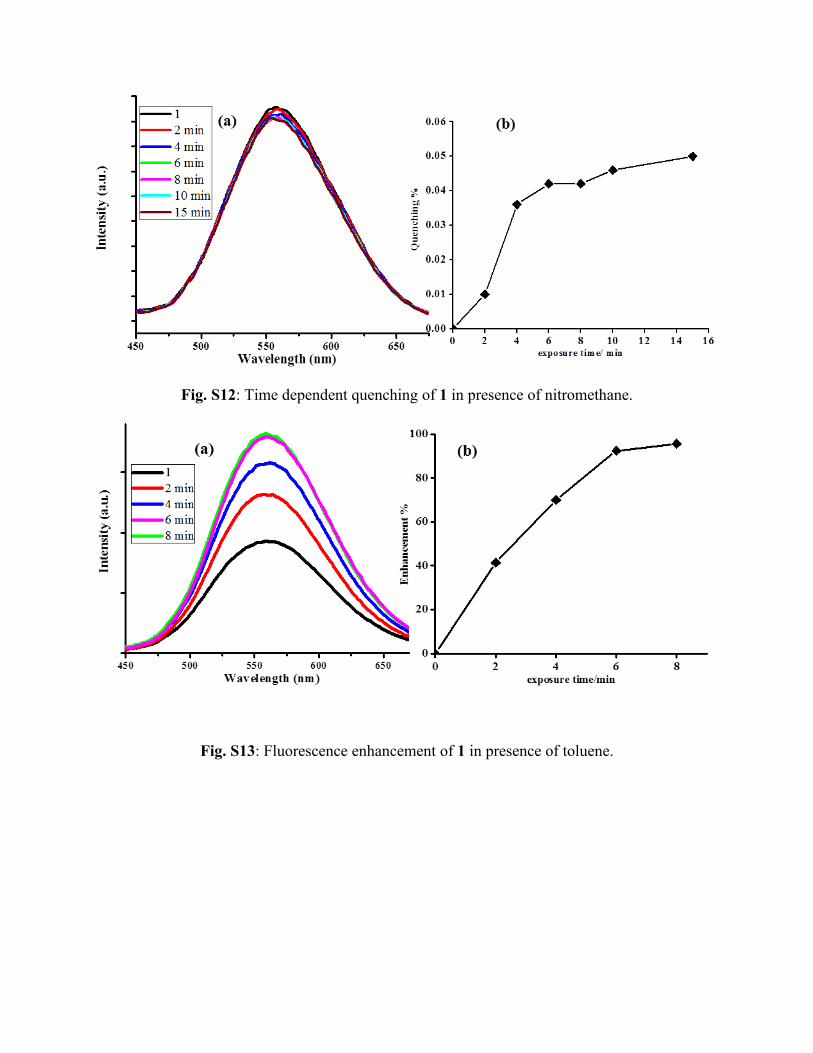
Fig. S12: Time dependent quenching of 1 in presence of nitromethane.
Fig. S13: Fluorescence enhancement of 1 in presence of toluene.
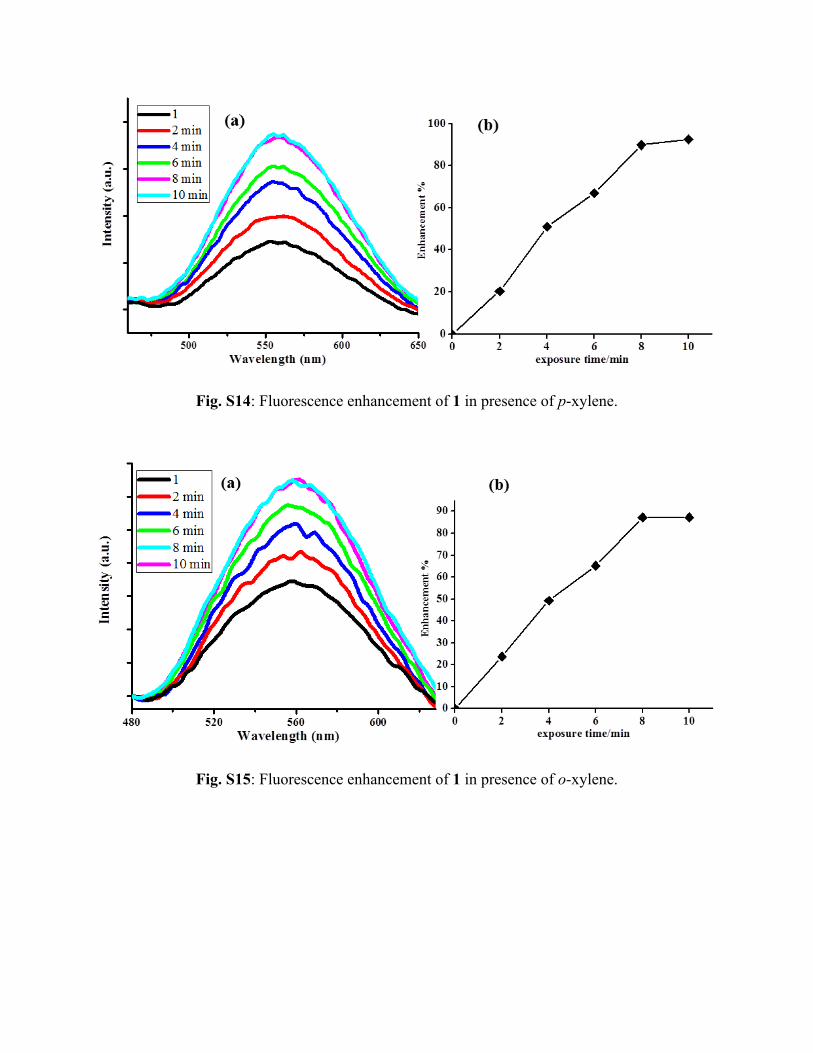
Fig. S14: Fluorescence enhancement of 1 in presence of p-xylene.
Fig. S15: Fluorescence enhancement of 1 in presence of o-xylene.
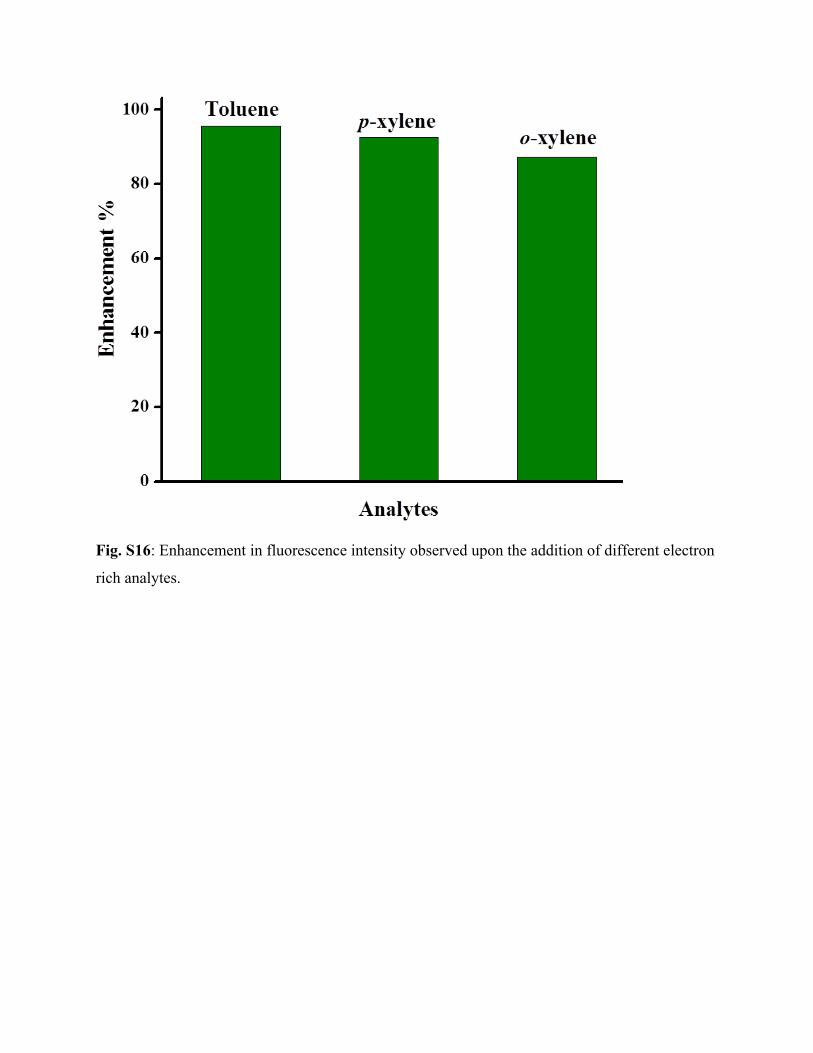
Fig. S16: Enhancement in fluorescence intensity observed upon the addition of different electron
rich analytes.
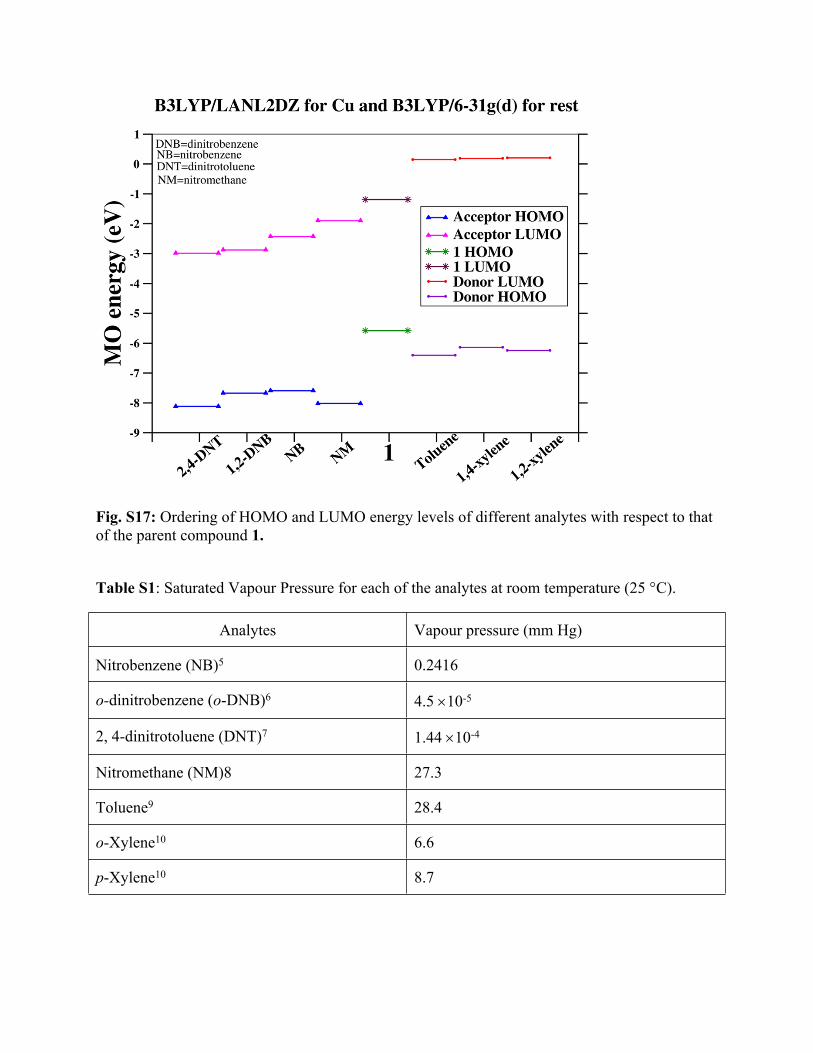
Fig. S17: Ordering of HOMO and LUMO energy levels of different analytes with respect to that of the parent compound 1.
Table S1: Saturated Vapour Pressure for each of the analytes at room temperature (25 °C).
Analytes Vapour pressure (mm Hg)
Nitrobenzene (NB)5 0.2416
o-dinitrobenzene (o-DNB)6 4.5 10-5
2, 4-dinitrotoluene (DNT)7 1.44 10-4
Nitromethane (NM)8 27.3
Toluene9 28.4
o-Xylene10 6.6
p-Xylene10 8.7
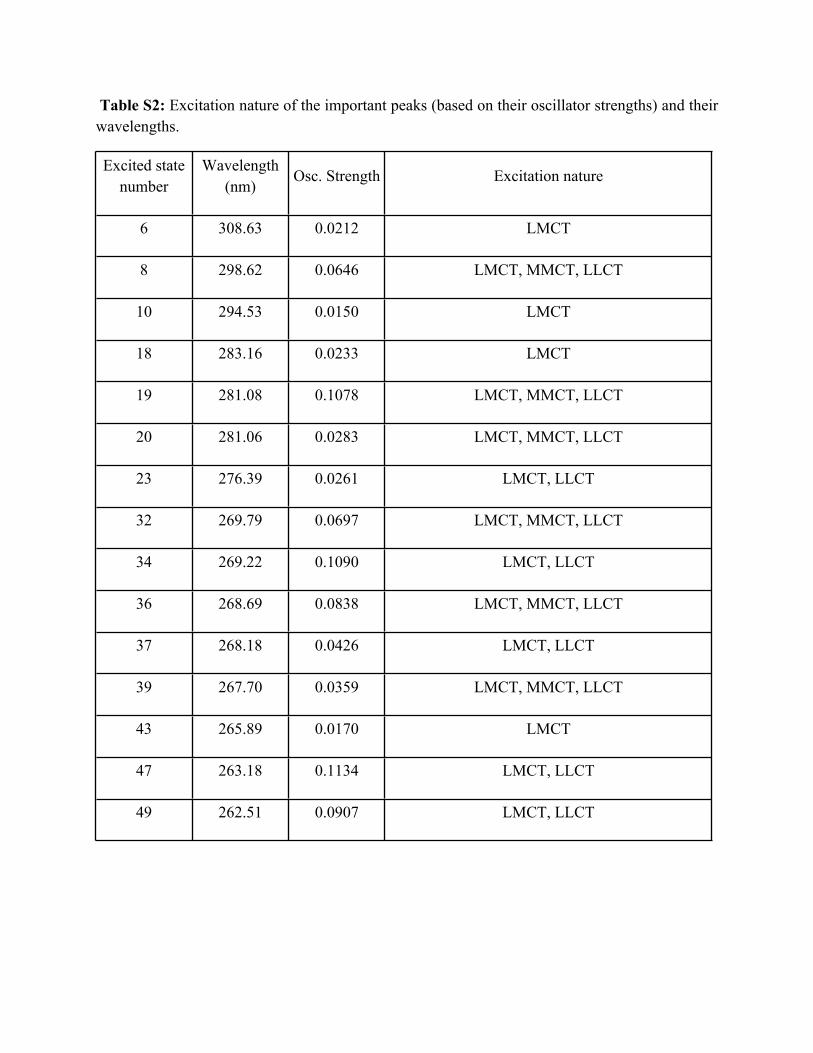
Table S2: Excitation nature of the important peaks (based on their oscillator strengths) and their wavelengths.
Excited state number
Wavelength (nm)
Osc. Strength Excitation nature
6 308.63 0.0212 LMCT
8 298.62 0.0646 LMCT, MMCT, LLCT
10 294.53 0.0150 LMCT
18 283.16 0.0233 LMCT
19 281.08 0.1078 LMCT, MMCT, LLCT
20 281.06 0.0283 LMCT, MMCT, LLCT
23 276.39 0.0261 LMCT, LLCT
32 269.79 0.0697 LMCT, MMCT, LLCT
34 269.22 0.1090 LMCT, LLCT
36 268.69 0.0838 LMCT, MMCT, LLCT
37 268.18 0.0426 LMCT, LLCT
39 267.70 0.0359 LMCT, MMCT, LLCT
43 265.89 0.0170 LMCT
47 263.18 0.1134 LMCT, LLCT
49 262.51 0.0907 LMCT, LLCT
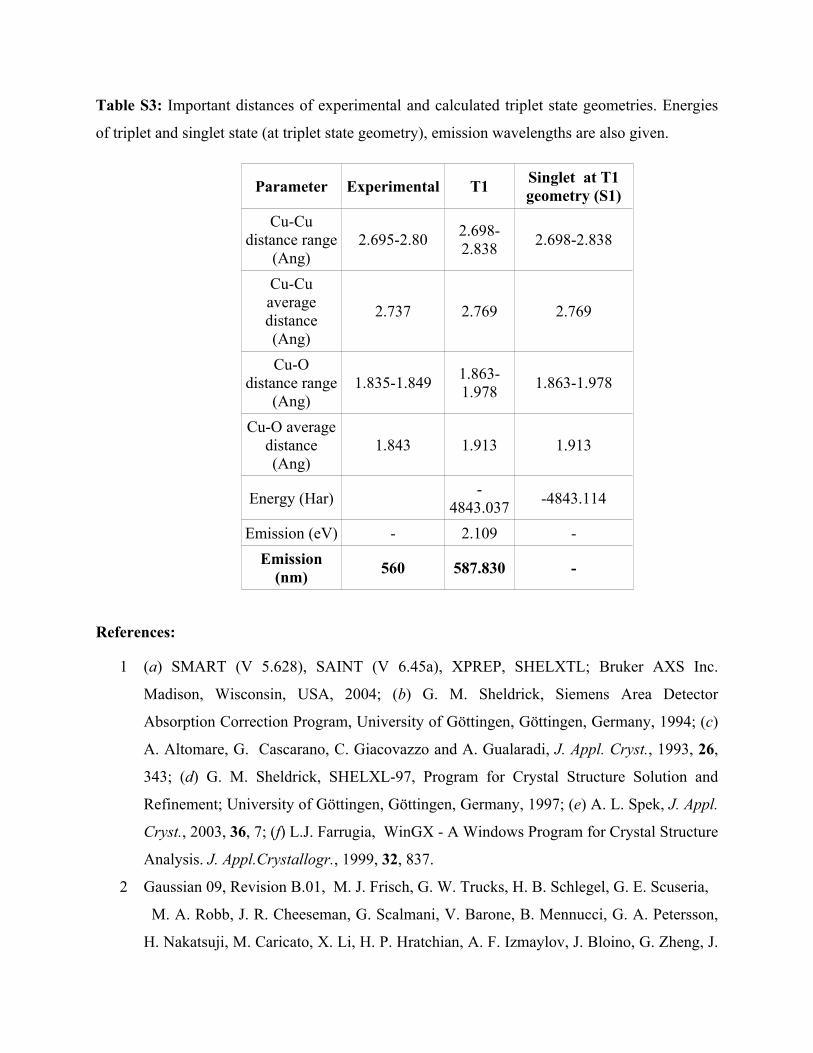
Table S3: Important distances of experimental and calculated triplet state geometries. Energies
of triplet and singlet state (at triplet state geometry), emission wavelengths are also given.
Parameter Experimental T1 Singlet at T1 geometry (S1)
Cu-Cu distance range
(Ang)2.695-2.80 2.698-
2.838 2.698-2.838
Cu-Cu average distance (Ang)
2.737 2.769 2.769
Cu-O distance range
(Ang)1.835-1.849 1.863-
1.978 1.863-1.978
Cu-O average distance (Ang)
1.843 1.913 1.913
Energy (Har) -4843.037 -4843.114
Emission (eV) - 2.109 -Emission
(nm) 560 587.830 -
References:
1 (a) SMART (V 5.628), SAINT (V 6.45a), XPREP, SHELXTL; Bruker AXS Inc.
Madison, Wisconsin, USA, 2004; (b) G. M. Sheldrick, Siemens Area Detector
Absorption Correction Program, University of Göttingen, Göttingen, Germany, 1994; (c)
A. Altomare, G. Cascarano, C. Giacovazzo and A. Gualaradi, J. Appl. Cryst., 1993, 26,
343; (d) G. M. Sheldrick, SHELXL-97, Program for Crystal Structure Solution and
Refinement; University of Göttingen, Göttingen, Germany, 1997; (e) A. L. Spek, J. Appl.
Cryst., 2003, 36, 7; (f) L.J. Farrugia, WinGX - A Windows Program for Crystal Structure
Analysis. J. Appl.Crystallogr., 1999, 32, 837.
2 Gaussian 09, Revision B.01, M. J. Frisch, G. W. Trucks, H. B. Schlegel, G. E. Scuseria,
M. A. Robb, J. R. Cheeseman, G. Scalmani, V. Barone, B. Mennucci, G. A. Petersson,
H. Nakatsuji, M. Caricato, X. Li, H. P. Hratchian, A. F. Izmaylov, J. Bloino, G. Zheng, J.

L. Sonnenberg, M. Hada, M. Ehara, K. Toyota, R. Fukuda, J. Hasegawa, M. Ishida, T.
Nakajima,Y. Honda, O. Kitao, H. Nakai, T. Vreven, J. A. Montgomery, Jr., J. E. Peralta,
F. Ogliaro, M. Bearpark, J. J. Heyd, E. Brothers, K. N. Kudin, V. N. Staroverov, T.
Keith, R. Kobayashi, J. Normand, K. Raghavachari, A. Rendell, J. C. Burant, S. S.
Iyengar, J. Tomasi, M. Cossi, N. Rega, J. M. Millam, M. Klene, J. E. Knox, J. B. Cross,
V. Bakken, C. Adamo, J. Jaramillo, R. Gomperts, R. E. Stratmann, O. Yazyev, A. J.
Austin, R. Cammi, C. Pomelli, J. W. Ochterski, R. L. Martin, K. Morokuma, V. G.
Zakrzewski, G. A. Voth, P. Salvador, J. J. Dannenberg, S. Dapprich, A. D. Daniels, O.
Farkas, J. B. Foresman, J. V. Ortiz, J. Cioslowski, and D. J. Fox, Gaussian, Inc.,
Wallingford CT, 2010.
3 R. E. Stratmann, G. E. Scuseria and M. J. Frisch, J. Chem. Phys., 1998, 109, 8218.
4 (a) F. D. Angelis, S. Fantacci, A. Sgamellotti, E. Cariati, R. Ugo and P. C. Ford Inorg.
Chem., 2006, 45, 10576; (b) S. Perruchas, C. Tard, X. F. L. Goff, A. Fargues, A. Garcia,
S. Kahlal, J.-Y. Saillard, T. Gacoin, and J.-P. Boilot Inorg. Chem., 2011, 50, 10682.
5 J.-S. Yang, T.M. Swager, J. Am. Chem. Soc., 1998, 120, 11864.
6 C.L. Yaws, Handbook of Vapor Pressure. Vol 2 C5-C7 Compounds. Houston, TX: Gulf
Publ Co, 1994, 391.
7 A. Lan, K. Li, H. Wu, D. H. Olson, T. J. Emge, W. Ki, M. Hong, J. Li, Angew.Chem. Int.
Ed., 2009, 48, 2334.
8 CRC Handbook of Chemistry and Physics 44th ed.
9 http://www.epa.gov/ttn/atw/hlthef/toluene.html.
10 http://scorecard.goodguide.com/chemical-profiles/html/xylenes.html.