Embed Size (px)
Citation preview
Effects of Airline Industry Changes on Small- and Non-Hub Airports
This presentation from the AAAE 2015 National Air Service Conference presents findings from ACRP Project 03-29.
Effects of Airline Industry Changes on Small- and Non-Hub Airports
AAAE National Air Service Conference March 9, 2015
GRA, IncorporatedDr. William Spitz
Headquarters: 115 West Avenue • Suite 201 • Jenkintown PA 19046 • USA 215-884-7500 • 215-884-1385 www.gra-inc.com [email protected]
Bowling Green State UniversityDr. Russell W. Mills
225 Troupe Ave • Bowling Green, OH 43403 • USA419-372-7329 [email protected]
GRA, Incorporated
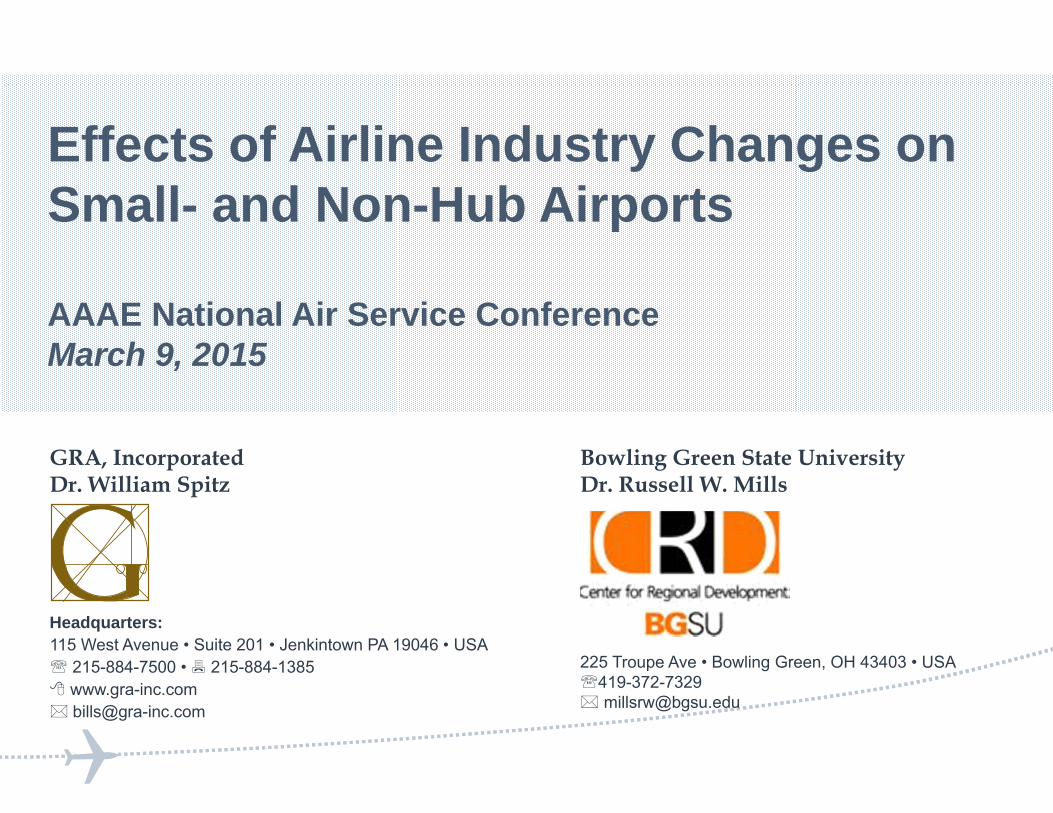
Outline
ACRP Projects Related to Air Service
Industry Trends Related to Studies
Introduction to ACRP 03-29 Project and Research Team
Changes in Air Service at Small and Non-Hub Airports (2001-2013)
Case Studies and Focus Groups
Preliminary Lessons Learned and Strategies
Products and Outcomes
March 9, 20151
GRA, Incorporated
Airport Cooperative Research Projects (ACRP)
ACRP 03-29 “Effects of Airline Industry Changes on Small and Non-Hub Airports”
ACRP Synthesis 56 “Understanding the Value of Social Media at Airports for Customer Engagement” Deals with using Social Media to make
customers more aware of the Airport in theircommunity
ACRP 03-31 “Aligning Community Expectations with Airport Roles”
Available at the TRB website (TRB.org)
2 March 9, 2015
GRA, Incorporated
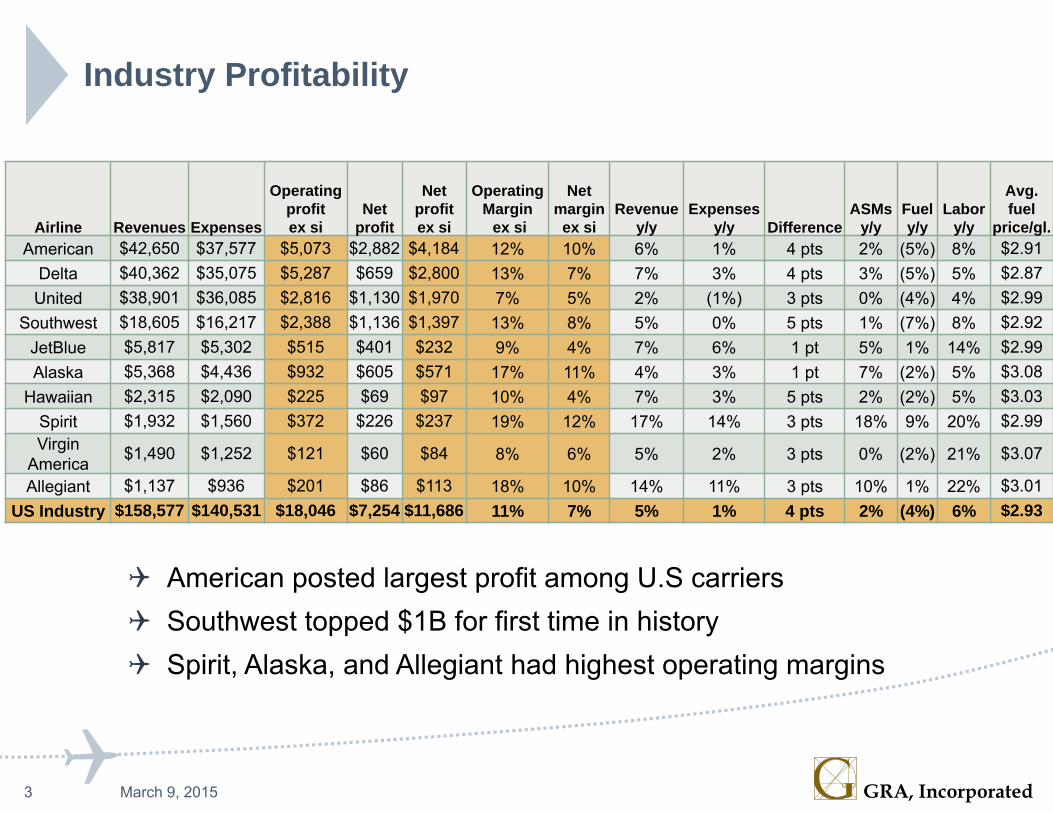
Industry Profitability
3 March 9, 2015
Airline Revenues Expenses
Operating profit ex si
Net profit
Net profit ex si
Operating Margin
ex si
Net margin
ex siRevenue
y/yExpenses
y/y DifferenceASMs
y/yFuel y/y
Labor y/y
Avg. fuel
price/gl.American $42,650 $37,577 $5,073 $2,882 $4,184 12% 10% 6% 1% 4 pts 2% (5%) 8% $2.91
Delta $40,362 $35,075 $5,287 $659 $2,800 13% 7% 7% 3% 4 pts 3% (5%) 5% $2.87 United $38,901 $36,085 $2,816 $1,130 $1,970 7% 5% 2% (1%) 3 pts 0% (4%) 4% $2.99
Southwest $18,605 $16,217 $2,388 $1,136 $1,397 13% 8% 5% 0% 5 pts 1% (7%) 8% $2.92 JetBlue $5,817 $5,302 $515 $401 $232 9% 4% 7% 6% 1 pt 5% 1% 14% $2.99 Alaska $5,368 $4,436 $932 $605 $571 17% 11% 4% 3% 1 pt 7% (2%) 5% $3.08
Hawaiian $2,315 $2,090 $225 $69 $97 10% 4% 7% 3% 5 pts 2% (2%) 5% $3.03 Spirit $1,932 $1,560 $372 $226 $237 19% 12% 17% 14% 3 pts 18% 9% 20% $2.99 Virgin
America $1,490 $1,252 $121 $60 $84 8% 6% 5% 2% 3 pts 0% (2%) 21% $3.07
Allegiant $1,137 $936 $201 $86 $113 18% 10% 14% 11% 3 pts 10% 1% 22% $3.01 US Industry $158,577 $140,531 $18,046 $7,254 $11,686 11% 7% 5% 1% 4 pts 2% (4%) 6% $2.93
American posted largest profit among U.S carriers Southwest topped $1B for first time in history Spirit, Alaska, and Allegiant had highest operating margins

GRA, Incorporated
Capacity Trends
4 March 9, 2015
Small hub and non-hub airports hurt by reduction in “regional hubs” with fewer options and fleet transition
GRA, Incorporated
Introduction to ACRP 03-29
Research Objectives Identify and quantify impacts on small- and non-hub airports
and the communities they serve, of changes in commercialairline service resulting from airline consolidation, fleetrealignment and other factors
Develop strategies for maintaining or achieving desired commercial service at these airports in response to changing market conditions and airline business plans
5 March 9, 2015
GRA, Incorporated
Project Team Leaders
GRA, Incorporated Rich Golaszewski, Project Manager William Spitz, Ph.D., Principal Investigator Primary responsibility for analysis and dissemination of air service changes across all small and
non-hub airports; overall project management
Bowling Green State University Center for Regional Development Russell Mills, Ph.D., Lead Investigator Primary responsibility for conducting case studies and focus groups of selected airports; analysis of
air service development strategies
Strategic Partners and Associates (SPA) Sonjia Murray, Lead Investigator Primary responsibility for conducting on-line surveys of airport managers and airline route planners
6 March 9, 2015
GRA, Incorporated
Airline Industry Changes
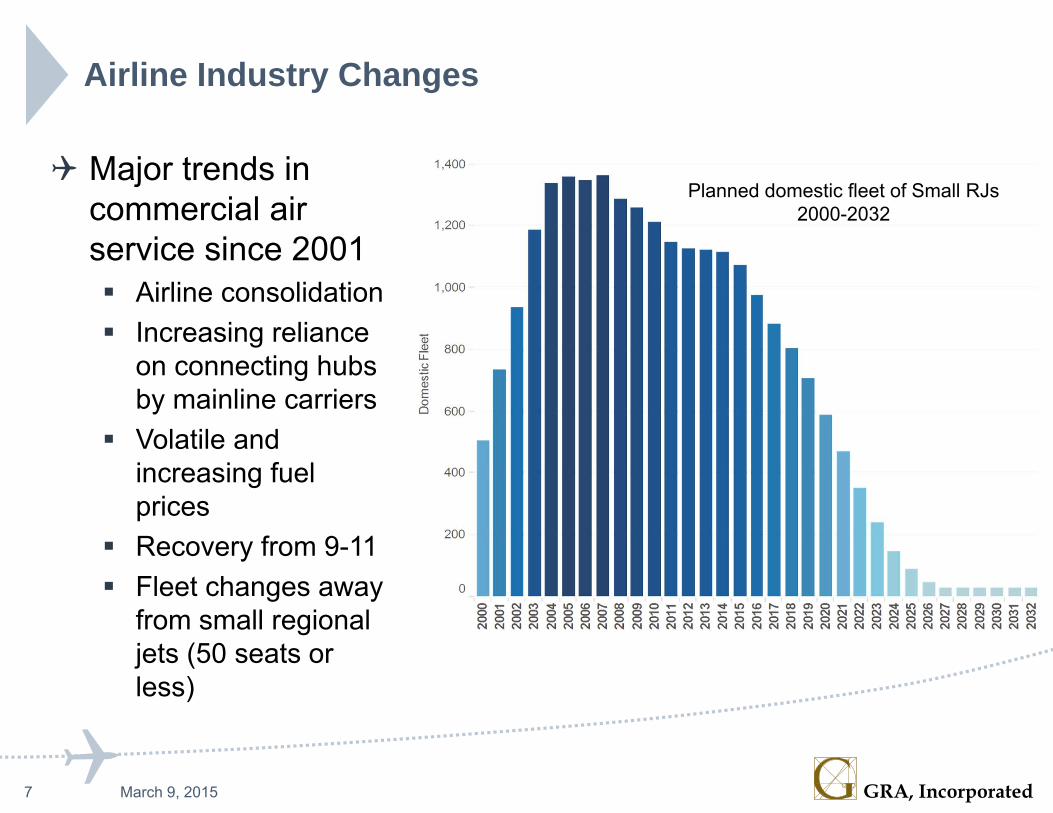
Major trends in commercial air service since 2001 Airline consolidation Increasing reliance
on connecting hubsby mainline carriers
Volatile andincreasing fuelprices
Recovery from 9-11 Fleet changes away
from small regionaljets (50 seats orless)
7 March 9, 2015
Planned domestic fleet of Small RJs2000-2032

GRA, Incorporated
Change in Small- and Non-Hub Flights, 2001-2013(Lower 48 States)
8 March 9, 2015

GRA, Incorporated
Change in Small- and Non-Hub Seats, 2001-2013(Lower 48 States)
9 March 9, 2015

GRA, Incorporated
Mainline/Regional Seat Shares at Small- and Non-Hubs, 2001-2013 (Lower 48 States)
10 March 9, 2015

GRA, Incorporated
Flight Shares at Small- and Non-Hubs by Aircraft Type, 2001-2013 (Lower 48 States)
11 March 9, 2015
Small Hubs Non-Hubs
GRA, Incorporated
Going Beyond Flight and Seat Counts:Access to the Air Transportation Network
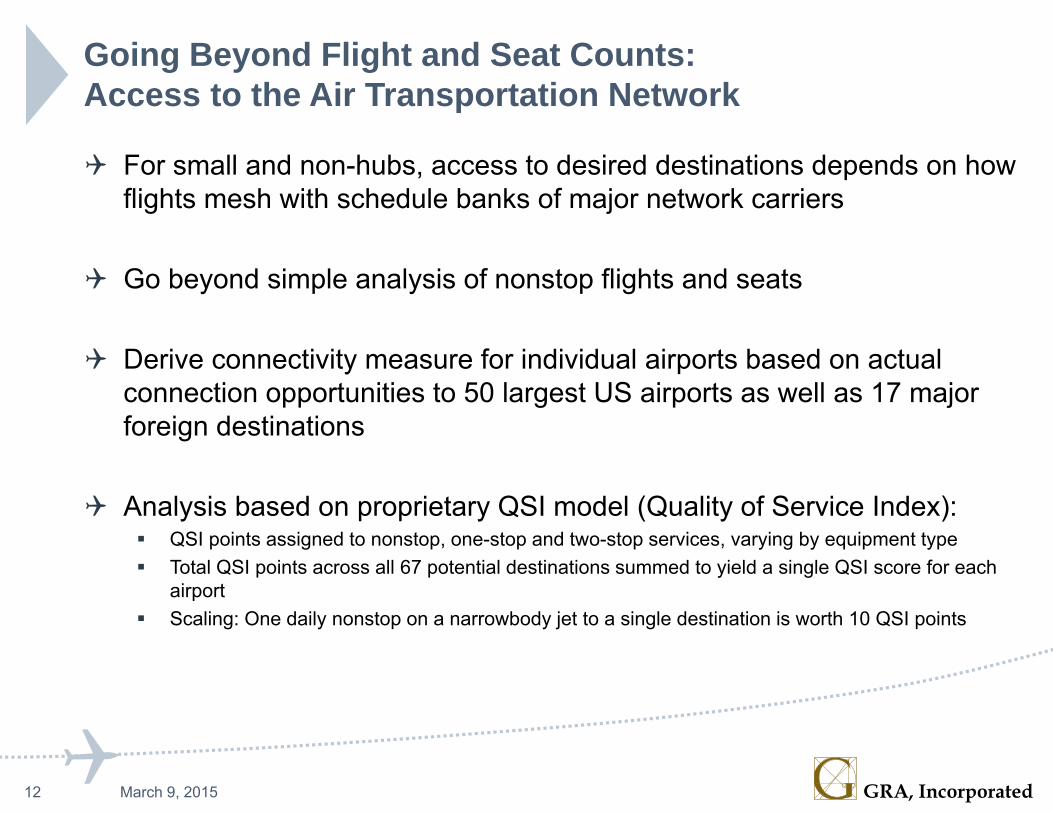
For small and non-hubs, access to desired destinations depends on how flights mesh with schedule banks of major network carriers
Go beyond simple analysis of nonstop flights and seats
Derive connectivity measure for individual airports based on actual connection opportunities to 50 largest US airports as well as 17 major foreign destinations
Analysis based on proprietary QSI model (Quality of Service Index): QSI points assigned to nonstop, one-stop and two-stop services, varying by equipment type Total QSI points across all 67 potential destinations summed to yield a single QSI score for each
airport Scaling: One daily nonstop on a narrowbody jet to a single destination is worth 10 QSI points
12 March 9, 2015

GRA, Incorporated
Change in Nonstop Seats vs. QSI at Small- and Non-Hub Airports, 2006-2013
13 March 9, 2015
TOL
RDD
BTVICT
MRY
FAR
AVL CAKBZN
AGS
‐100%
‐80%
‐60%
‐40%
‐20%
0%
20%
40%
60%
80%
100%
Pct C
hange 20
06 ‐20
13
Small- and Non-Hub Service to Major US and Foreign DestinationsPercent Change Nonstop Seats vs. QSI, 2006-2013
Nonstop Seats QSI ‐ Study Airports QSI ‐ Other

GRA, Incorporated
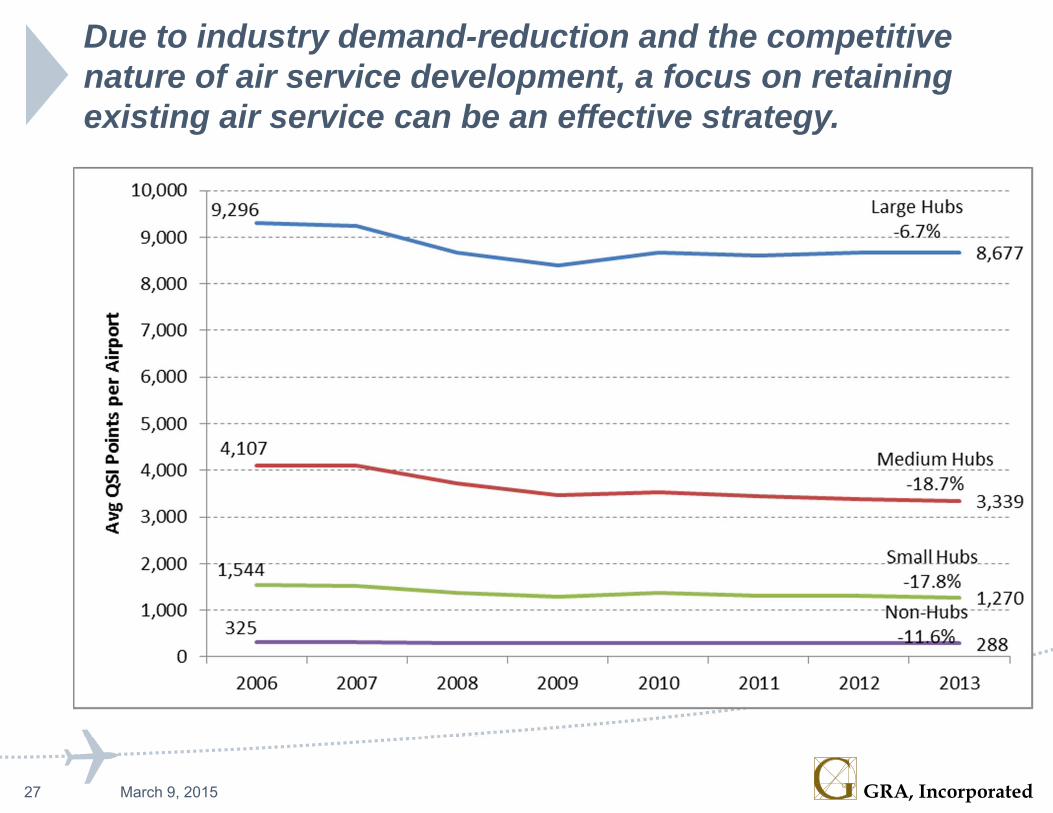
QSI Estimates by Hub Type, 2006-2013
14 March 9, 2015
9,296 Large Hubs‐6.7%
8,677
4,107Medium Hubs
‐18.7%3,339
1,544Small Hubs‐17.8%
1,270
325Non‐Hubs‐11.6%
2880
1,000
2,000
3,000
4,000
5,000
6,000
7,000
8,000
9,000
10,000
2006 2007 2008 2009 2010 2011 2012 2013
Avg QSI Points p
er Airp
ort
Average Airport QSI by Hub Group
GRA, Incorporated
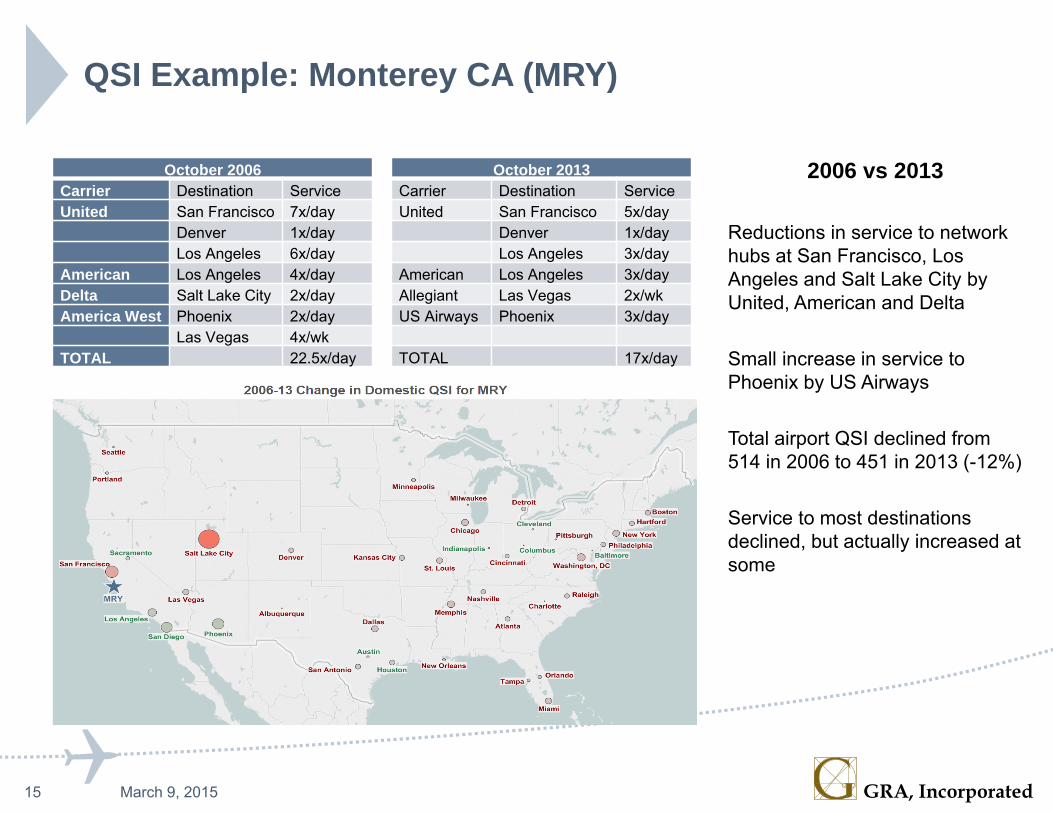
QSI Example: Monterey CA (MRY)
2006 vs 2013
Reductions in service to network hubs at San Francisco, Los Angeles and Salt Lake City by United, American and Delta
Small increase in service to Phoenix by US Airways
Total airport QSI declined from 514 in 2006 to 451 in 2013 (-12%)
Service to most destinations declined, but actually increased at some
15 March 9, 2015
October 2006 October 2013Carrier Destination Service Carrier Destination ServiceUnited San Francisco 7x/day United San Francisco 5x/day
Denver 1x/day Denver 1x/dayLos Angeles 6x/day Los Angeles 3x/day
American Los Angeles 4x/day American Los Angeles 3x/dayDelta Salt Lake City 2x/day Allegiant Las Vegas 2x/wkAmerica West Phoenix 2x/day US Airways Phoenix 3x/day
Las Vegas 4x/wkTOTAL 22.5x/day TOTAL 17x/day

GRA, Incorporated
Ongoing Analysis of Airport Access to the Air Transportation Network
www.gra-inc.com → Areas of Practice → Insights
Adjustments and improvements from current analysis:
Looks at domestic airports of all sizes, not just Small and Non-hubs
Considers economic importance of destinations
16 March 9, 2015
GRA, Incorporated
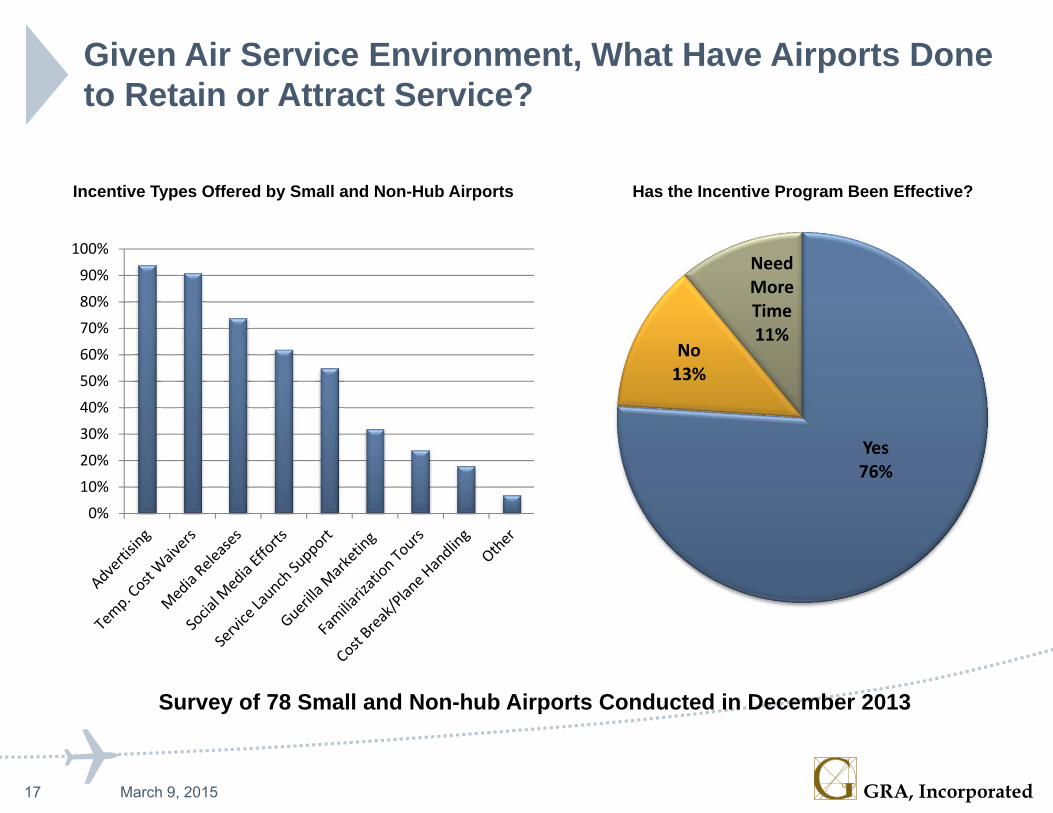
Given Air Service Environment, What Have Airports Done to Retain or Attract Service?
17 March 9, 2015
Yes76%
No13%
Need More Time11%
0%
10%
20%
30%
40%
50%
60%
70%
80%
90%
100%
Incentive Types Offered by Small and Non-Hub Airports
Survey of 78 Small and Non-hub Airports Conducted in December 2013
Has the Incentive Program Been Effective?
GRA, Incorporated
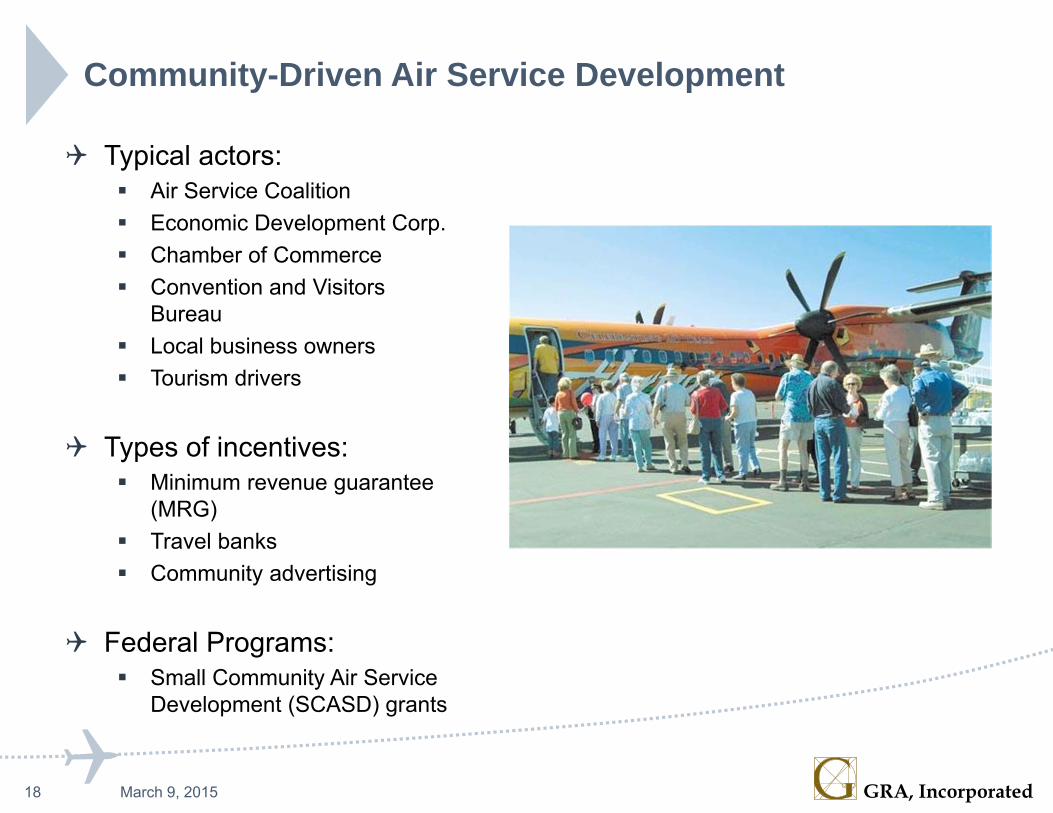
Community-Driven Air Service Development
Typical actors: Air Service Coalition Economic Development Corp. Chamber of Commerce Convention and Visitors
Bureau Local business owners Tourism drivers
Types of incentives: Minimum revenue guarantee
(MRG) Travel banks Community advertising
Federal Programs: Small Community Air Service
Development (SCASD) grants
18 March 9, 2015
GRA, Incorporated
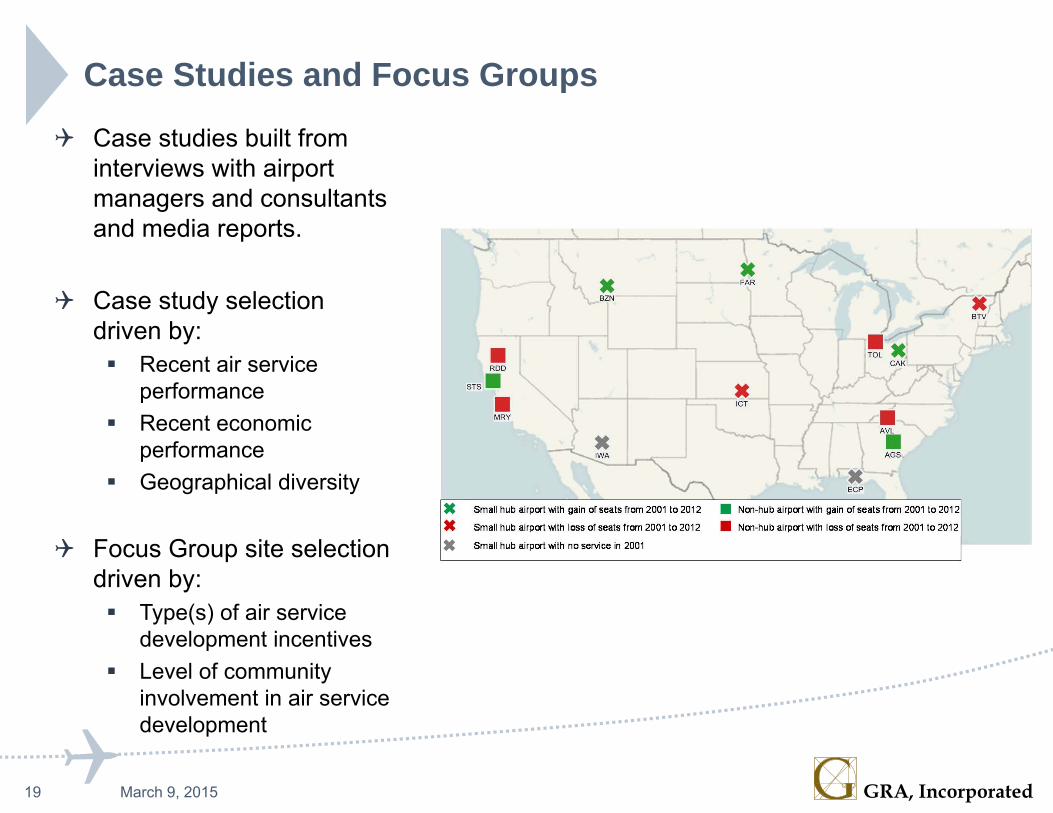
Case Studies and Focus Groups
Case studies built from interviews with airport managers and consultants and media reports.
Case study selection driven by: Recent air service
performance Recent economic
performance Geographical diversity
Focus Group site selection driven by: Type(s) of air service
development incentives Level of community
involvement in air servicedevelopment
19 March 9, 2015
GRA, Incorporated
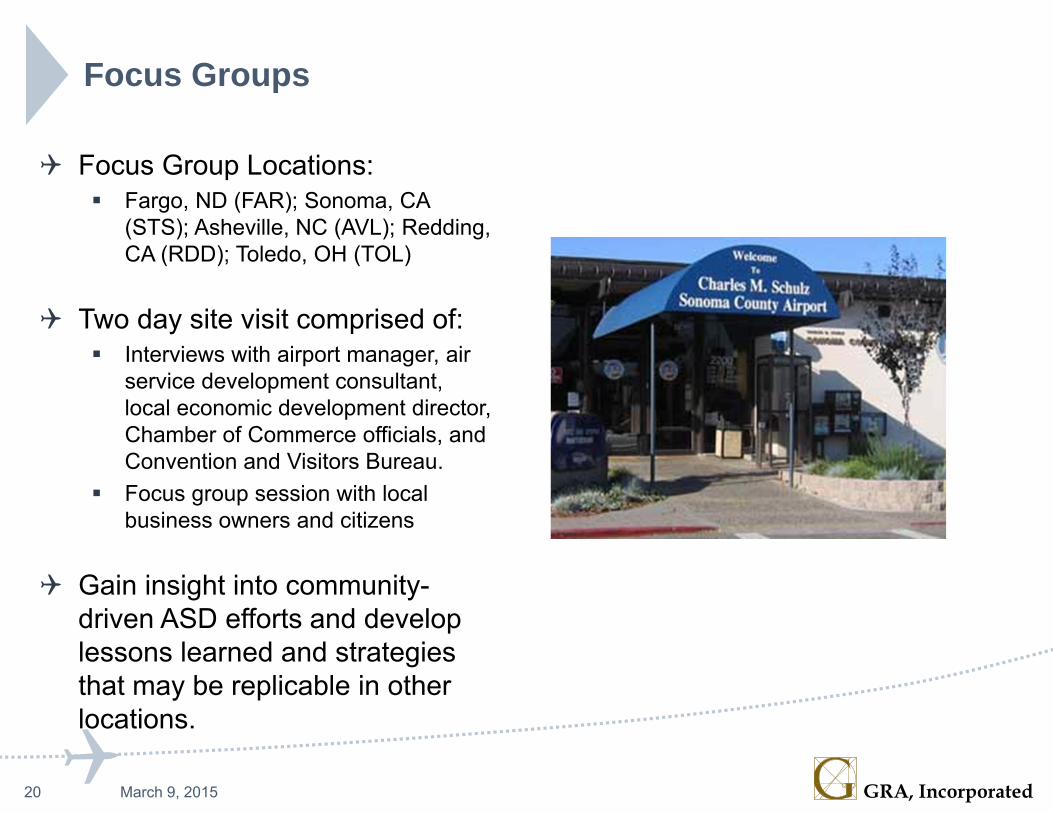
Focus Groups
Focus Group Locations: Fargo, ND (FAR); Sonoma, CA
(STS); Asheville, NC (AVL); Redding,CA (RDD); Toledo, OH (TOL)
Two day site visit comprised of: Interviews with airport manager, air
service development consultant,local economic development director,Chamber of Commerce officials, andConvention and Visitors Bureau.
Focus group session with localbusiness owners and citizens
Gain insight into community-driven ASD efforts and develop lessons learned and strategies that may be replicable in other locations.
20 March 9, 2015

GRA, Incorporated
Seats by Type of Carrier for Small Hub Case Study Airports, 2001 – 2013
21 March 9, 2015
GRA, Incorporated
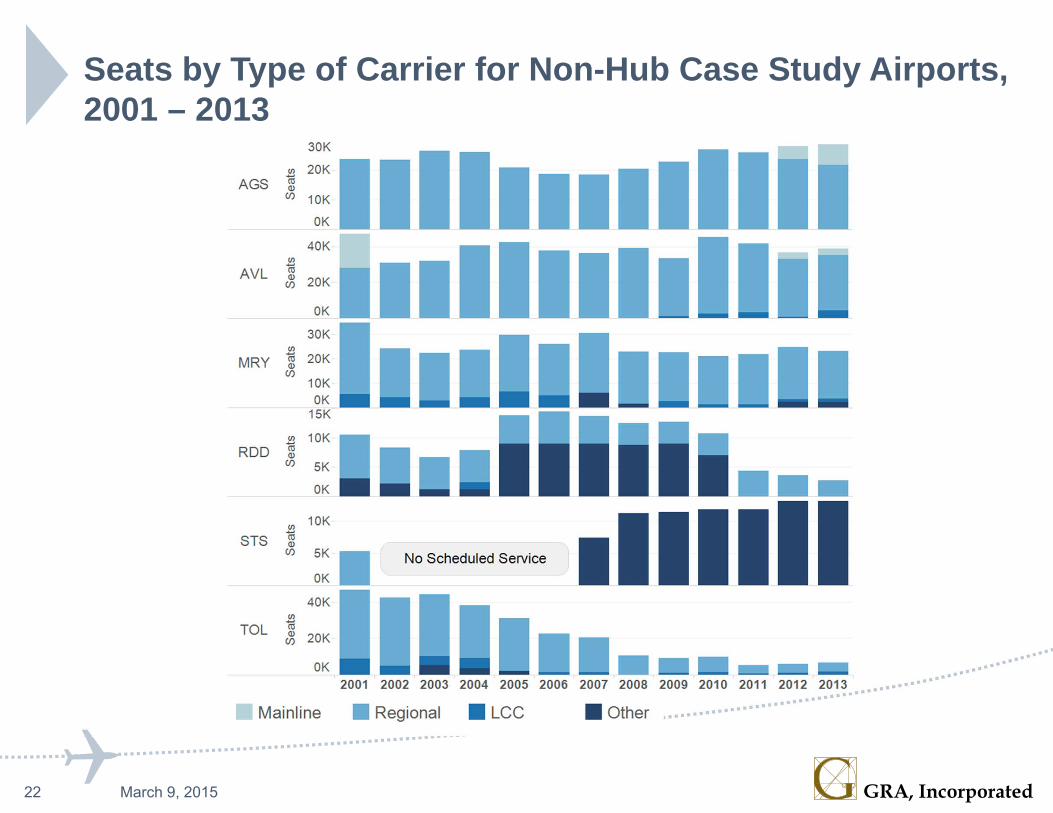
Seats by Type of Carrier for Non-Hub Case Study Airports, 2001 – 2013
22 March 9, 2015
GRA, Incorporated
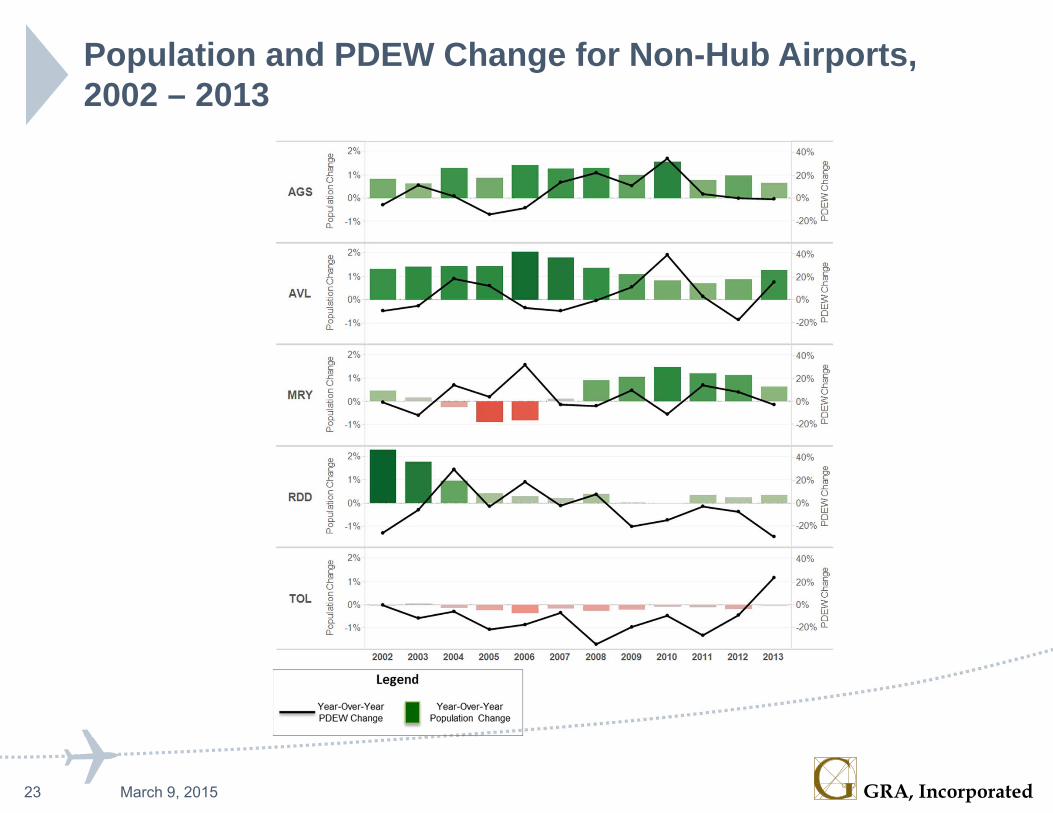
Population and PDEW Change for Non-Hub Airports, 2002 – 2013
23 March 9, 2015
GRA, Incorporated
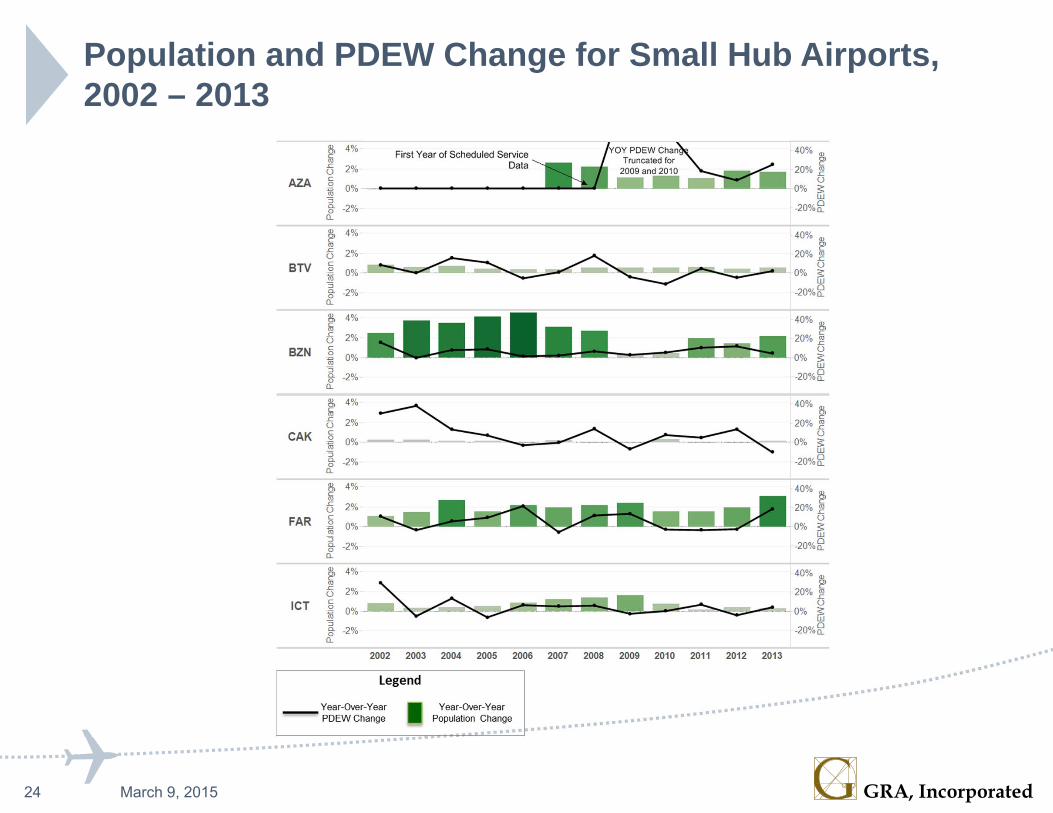
Population and PDEW Change for Small Hub Airports, 2002 – 2013
24 March 9, 2015
GRA, Incorporated
Lessons Learned Air service development is relative. Air carriers do not choose new routes in
a vacuum but through a comparative analysis of profitability across communities.
Many of the factors that determine whether an air carrier will start new service in a community are out of the hands of airport and community leaders.
When deciding whether to initiate an air service development program, communities must weigh the cost of the initial investment in incentives for new air service with the likelihood that their market can sustain the service once the incentives end.
As communities look to organize and develop air service development efforts, alternative modes of transportation that take passengers to larger hub airports are an effective way to build community support for the local airport.
25 March 9, 2015
GRA, Incorporated
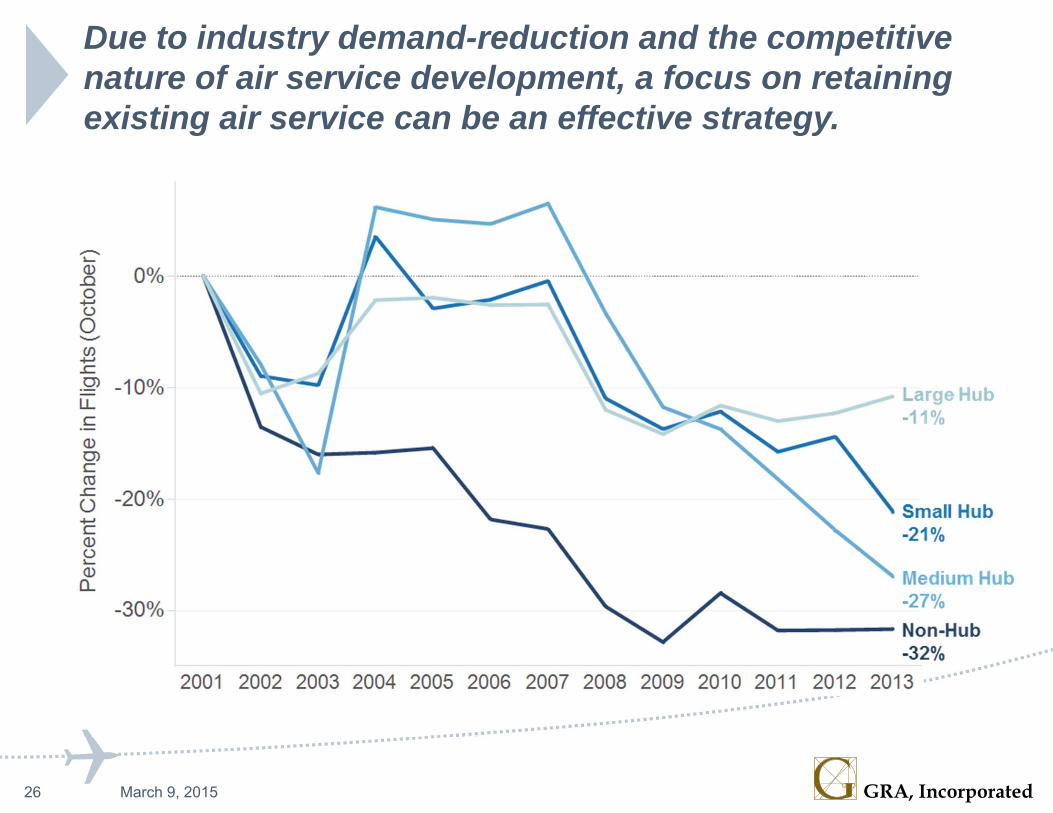
Due to industry demand-reduction and the competitive nature of air service development, a focus on retaining existing air service can be an effective strategy.
26 March 9, 2015
GRA, Incorporated
Due to industry demand-reduction and the competitive nature of air service development, a focus on retaining existing air service can be an effective strategy.
27 March 9, 2015

GRA, Incorporated
There is little connection between air service growth and population growth; however, there is a stronger connection between air service growth and regional employment change
28 March 9, 2015
-10% -5% 0% 5% 10% 15% 20% 25%Employment Change 2001-2013
-100%-80%
-60%
-40%
-20%
0%
20%
40%
60%
80%
100%
120%
140%
Sea
t Cha
nge
2001
-201
3TOL
RDD
MRY
AVL
ICTBZNAGS
FARCAK
ECP
STS
GRA, Incorporated
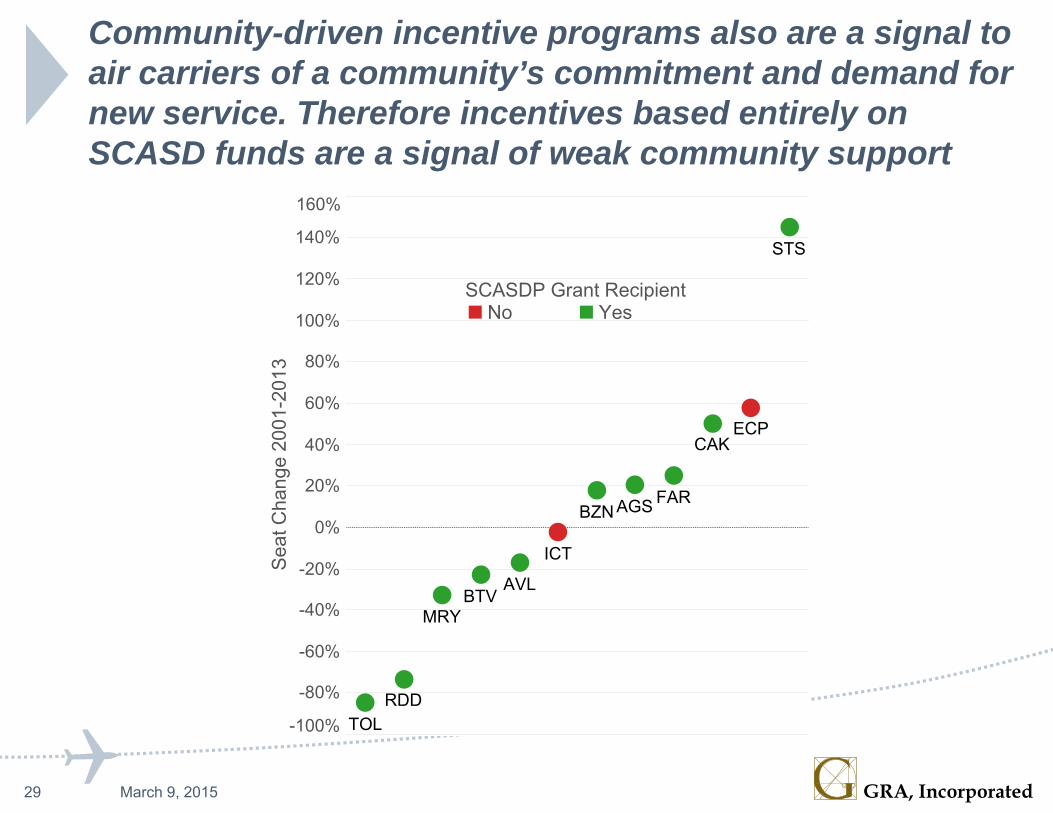
Community-driven incentive programs also are a signal to air carriers of a community’s commitment and demand for new service. Therefore incentives based entirely on SCASD funds are a signal of weak community support
29 March 9, 2015
-100%
-80%
-60%
-40%
-20%
0%
20%
40%
60%
80%
100%
120%
140%
160%
Sea
t Cha
nge
2001
-201
3
MRY
RDD
AGS
CAKECP
FAR
BTV
BZN
TOL
STS
AVL
ICT
SCASDP Grant RecipientNo Yes
GRA, Incorporated
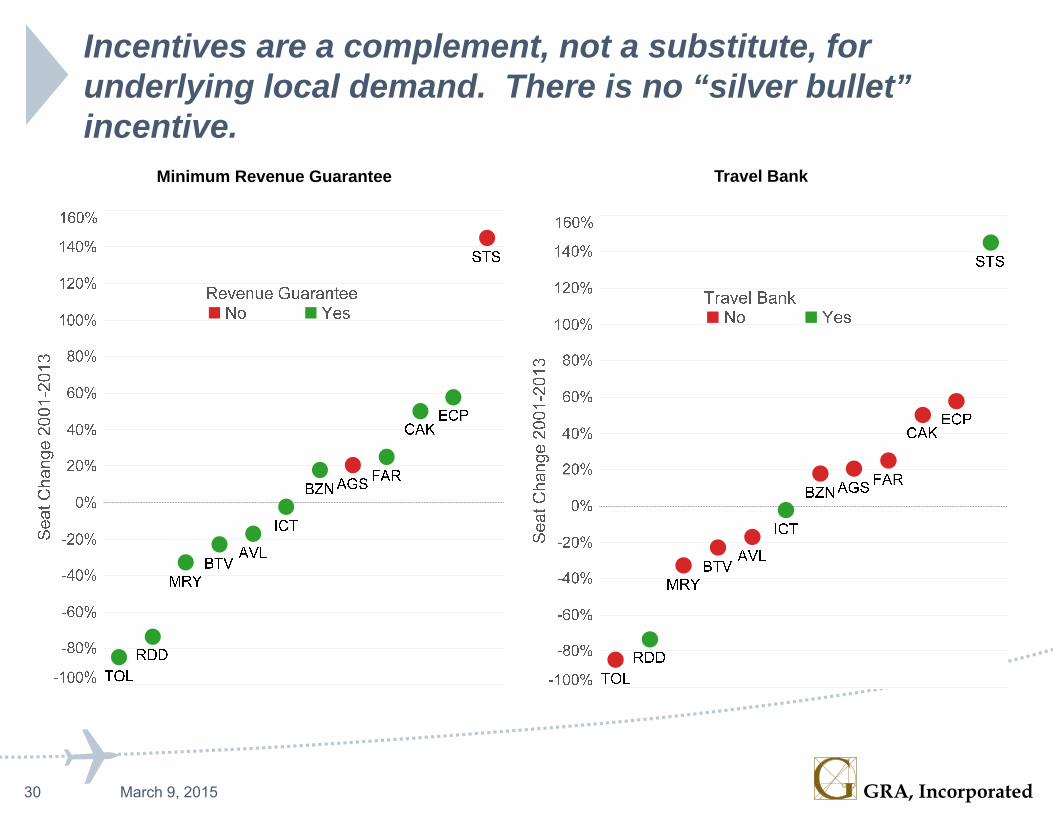
Incentives are a complement, not a substitute, for underlying local demand. There is no “silver bullet” incentive.
30 March 9, 2015
Minimum Revenue Guarantee Travel Bank
GRA, Incorporated
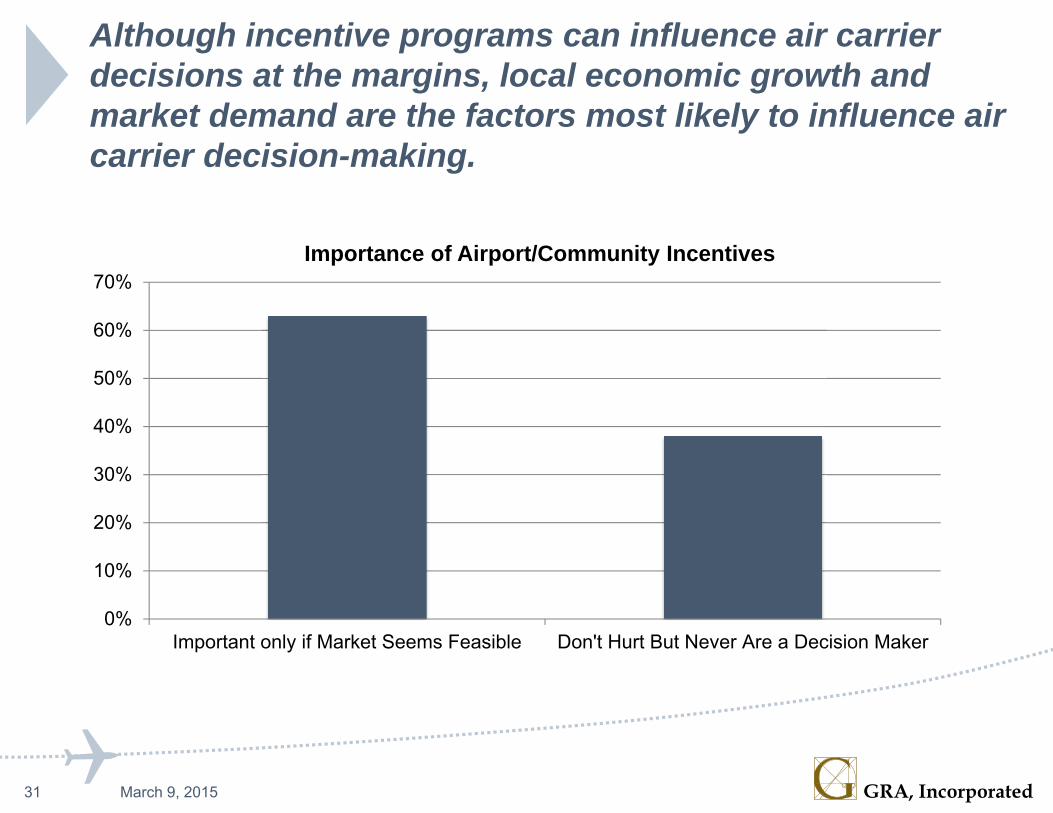
Although incentive programs can influence air carrier decisions at the margins, local economic growth and market demand are the factors most likely to influence air carrier decision-making.
31 March 9, 2015
0%
10%
20%
30%
40%
50%
60%
70%
Important only if Market Seems Feasible Don't Hurt But Never Are a Decision Maker
Importance of Airport/Community Incentives
GRA, Incorporated
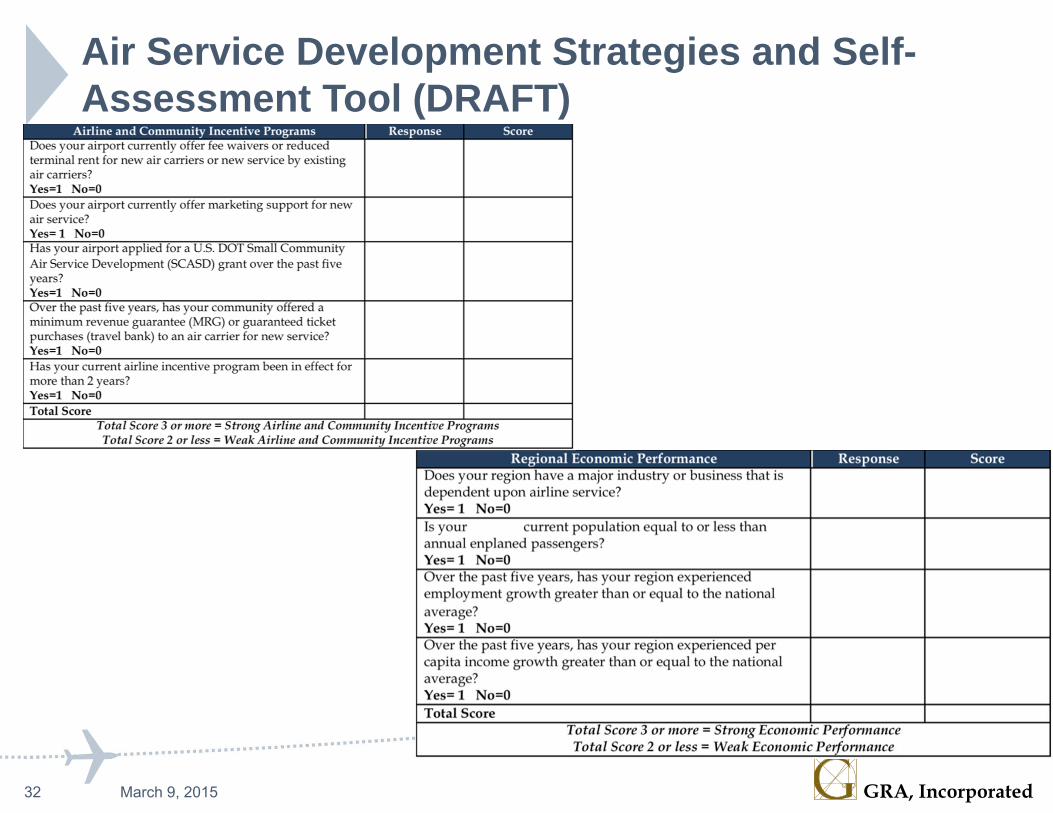
Air Service Development Strategies and Self-Assessment Tool (DRAFT)
32 March 9, 2015
GRA, Incorporated
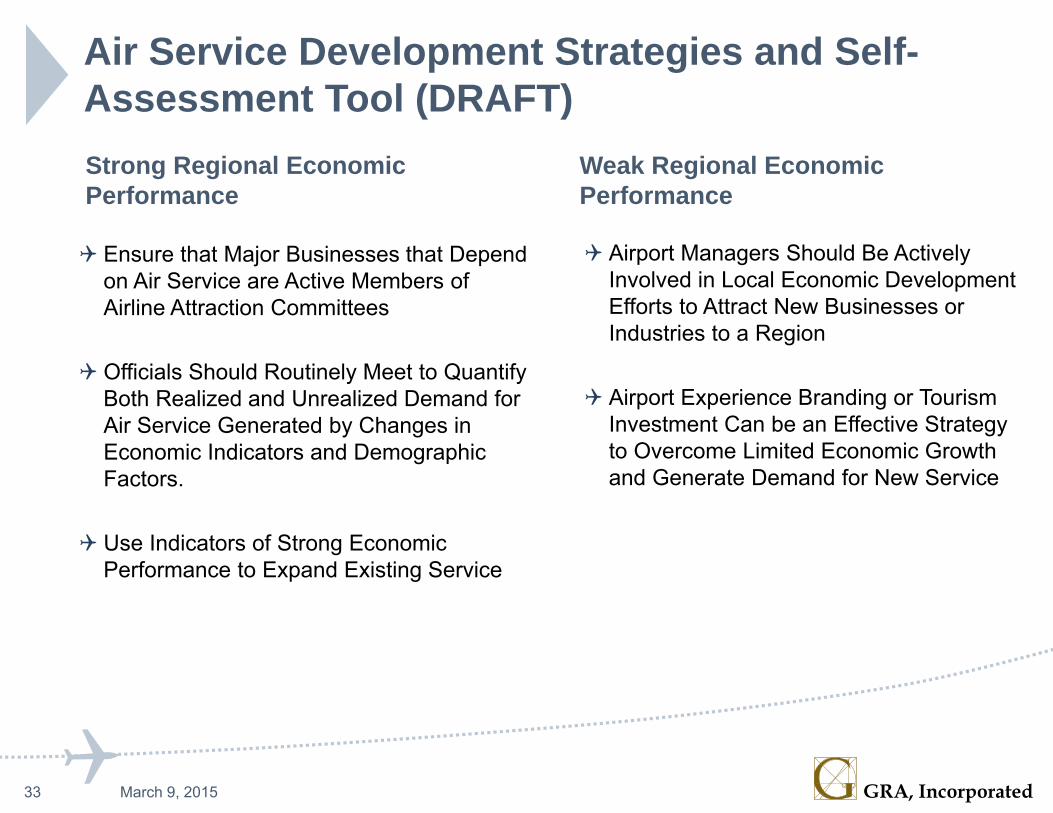
Air Service Development Strategies and Self-Assessment Tool (DRAFT)Strong Regional Economic Performance
Ensure that Major Businesses that Depend on Air Service are Active Members of Airline Attraction Committees
Officials Should Routinely Meet to Quantify Both Realized and Unrealized Demand for Air Service Generated by Changes in Economic Indicators and Demographic Factors.
Use Indicators of Strong Economic Performance to Expand Existing Service
Weak Regional Economic Performance
Airport Managers Should Be Actively Involved in Local Economic Development Efforts to Attract New Businesses or Industries to a Region
Airport Experience Branding or Tourism Investment Can be an Effective Strategy to Overcome Limited Economic Growth and Generate Demand for New Service
33 March 9, 2015
GRA, Incorporated
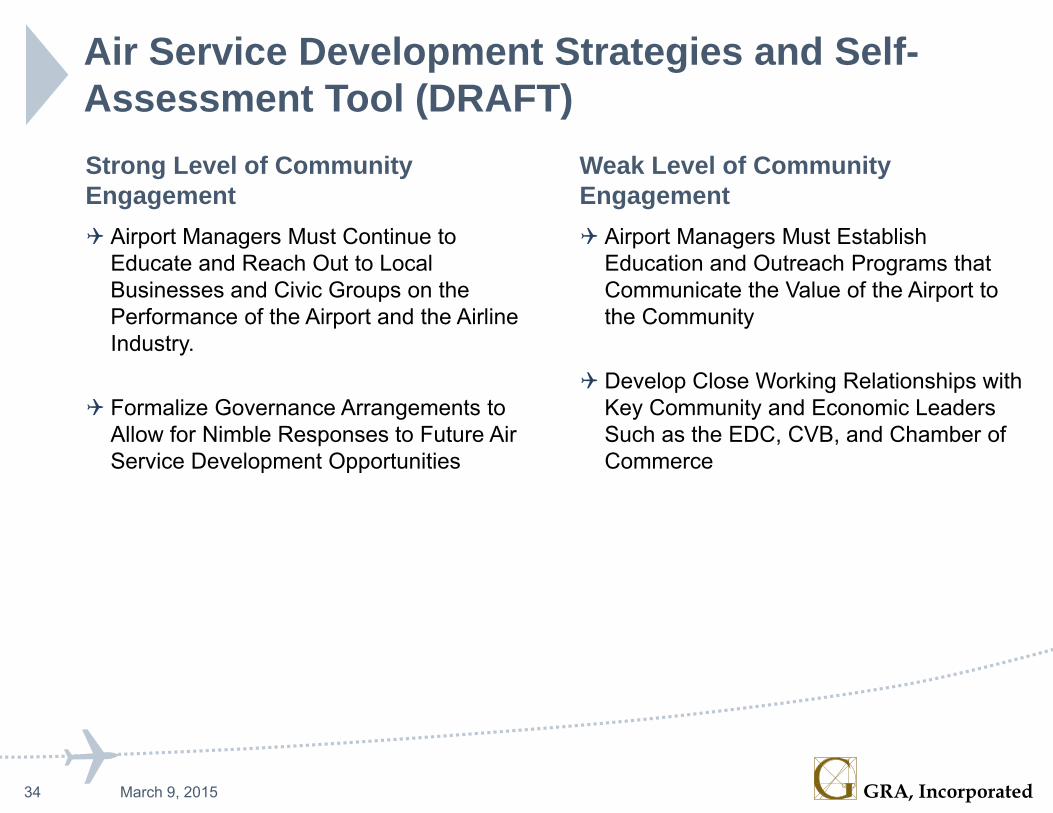
Air Service Development Strategies and Self-Assessment Tool (DRAFT)Strong Level of Community Engagement Airport Managers Must Continue to
Educate and Reach Out to Local Businesses and Civic Groups on the Performance of the Airport and the Airline Industry.
Formalize Governance Arrangements to Allow for Nimble Responses to Future Air Service Development Opportunities
Weak Level of Community Engagement Airport Managers Must Establish
Education and Outreach Programs that Communicate the Value of the Airport to the Community
Develop Close Working Relationships with Key Community and Economic Leaders Such as the EDC, CVB, and Chamber of Commerce
34 March 9, 2015

GRA, Incorporated
ACRP 03-29 Materials
Searchable database of airport-specific air service performance data from 2001-2013.
Guidebook that contains case studies, focus groups, lessons learned and strategies for airport managers and community leaders: Linking Economic Performance and Air Service Development Developing an Air Service Development Program Identifying an Air Carrier and a New Destination Developing an Effective Incentive Program Meeting with Air Carriers and Community Leaders Ensuring the Sustainability of New Service
Airport/Community Self-Assessment Tool and Customized Strategies for Air Service Development
35 March 9, 2015