Embed Size (px)
Citation preview
Effectiveness of Stress Balls in Reducing the Physiological
Symptoms of Stress
University of Wisconsin-Madison
Department of Physiology
Lab 603
Group 16
Joel Alvarez, Dani Day, Alyssa Gardner, Imaan Saeed, Courtney Schwebach & Ryan Valk
May 7, 2015
Key Words: stress ball, blood pressure, heart rate, GSR, stress, relaxation, skin conductance, stress response

Abstract:
The purpose of our study was to determine the effectiveness of stress balls in reducing the
physiological symptoms of stress. We measured changes in heart rate, blood pressure, and skin
conductance and compared the differences between an experimental group that received a stress
ball (n=15) and a control group that did not receive a stress ball (n=15). Stress was induced by a
two minute timed-test coupled with the anticipation of a second test. Baseline measurements were
taken before the first test, as well as immediately following the first test, and after a relaxation
period where the experimental group received a stress ball. Our results did not show a significant
difference between the experimental and control groups for heart rate (p-value=0.188), systolic
blood pressure (p-value=0.663), diastolic blood pressure (p-value=0.557), or galvanic skin response
(p-value=0.258). Our results suggest that stress balls are not effective in reducing heart rate, blood
pressure, or skin conductance following an episode of induced acute stress in college-aged
individuals.
Introduction:
As defined by the American Psychological Association, acute stress refers to the emotional and
physiological changes that result from the demands and pressures of the recent past and near future,
and it has been noted as the most common form of stress for college-aged individuals. When
experienced in small doses, acute stress can provide a sense of excitement as well as increased
vigilance. However, prolonged acute stress can have detrimental developmental effects that
negatively impact the cognitive processes associated with decision-making, working memory,
reasoning ability and other aspects of an individuals’ personality and character (Lieberman, et. al.
2015; Newcomer et al., 1999).

College students are at an especially high risk of suffering from adverse effects associated with
prolonged acute stress due to examinations and other external pressures. Academic exams provide
one of the best examples of a stimulus that activates the sympathetic nervous system during a
stressful situation. In response to this stressor, cortisol is released from the hypothalamic-pituitary-
adrenocortical (HPA) axis, which acts on the sympathetic nervous system, causing the release of
epinephrine and norepinephrine from the adrenal medulla (Kiecolt-Glaser et al., 2002). The release
of these catecholamines from the adrenal medulla has the effect of increasing heart rate and blood
pressure (Chrousos, 1998). Sweat gland activity has also been noted to increase in the presence of
epinephrine and norepinephrine. Through negative feedback, these elevated physiological markers
associated with acute stress are counteracted by the parasympathetic nervous system as well as the
intrinsic negative feedback of the HPA axis; however after prolonged episodes of acute stress, the
parasympathetic nervous system is reduced in its ability to return the body to homeostasis (Sun et al,
2010). Increased cortisol levels during aging have also been noted to predict atrophy in the
hippocampus and memory deficits (Lupien et al, 1998). Furthermore, if not addressed in a timely
manner, prolonged acute stress can manifest itself into more severe emotional disorders such as
anxiety and depression that can severely impair individuals during the most productive years of their
lives (Geslani & Gaebelein, 2015).
Due to the serious nature of the issue, a number of relief techniques and coping methods have
emerged to help decrease episodes of acute stress, spanning from meditation to moderate physical
exercise (Putai, 1992). While many of these stress-relief strategies have proved to be effective in
experimental studies, they are primarily preventative measures and often require extensive time
commitments from students. Currently, validated techniques to reduce immediate acute stress have
not been identified; however stress balls have often been cited by the general public as being

effective when it comes to lowering acute stress levels. While the effectiveness of stress balls in
lowering anxiety has been demonstrated by reducing negative emotions and improving general
well-being in the context of conscious surgery where only local anesthesia was administered
(Hudson, Ogden & Whiteley, 2015), conflicting views remain as to whether or not this stress-relief
technique serves merely as a distracting stimulus or acts directly by lowering physiological markers
of stress.
To address these shortcomings and lack of research on the effectiveness of stress balls, we
proposed an experimental design in which 30 female and male college-aged students enrolled in
Physiology 435 were exposed to a stressful situation mimicking an exam environment. Because
heart rate, blood pressure, and the galvanic skin response (GSR) have been shown to be elevated in
response to stressful situations, we compared the physiological changes in these variables between
an experimental group that received a stress ball and a control group that did not, immediately
following a stressful situation. We compared the difference between the post-relaxation
measurements (taken one minute after the participant either had access to a stress ball or did not)
and the post-stressor measurements (recorded immediately following the timed-test.) In doing so,
we aimed to determine whether or not the administration of a stress ball following a stressful exam
environment served as an effective method for relieving immediate acute stress. We hypothesized
that the experimental group would exhibit a larger decrease between their post-stressor and post-
relaxation physiological measurements relative to the control group. If the data were to support our
hypothesis, stress ball administration could become a more commonly practiced remediation
technique for reducing the negative side effects associated with acute stress.

Materials and Methods:
Participants and Experimental Design: 30 college students (22 females and 8 males) ages 19 to 25
were randomly selected from a larger cohort of students enrolled in physiology 435 at the University
of Wisconsin-Madison (n=137). All participants who agreed to partake in the study completed a
consent form, detailing any foreseeable risks that might have resulted from participant involvement.
Additionally, participants were asked to complete a brief survey inquiring about various social
habits, weekly fitness routines, and average stress levels prior to taking exams.
Figure 1 illustrates the timeline of events and measurements that were used throughout the
study. College-aged individuals selected to participate in this study were divided into either a control
group or an experimental group. Upon entering the experimentation room, the participant sat down
with both feet firmly planted on the ground. At that point, the participant was asked to read and
complete the consent form and the survey. While the participant was completing these forms, an
experimenter attached a blood pressure cuff and heart rate monitor (10 Series Plus BP791T) to the
non-dominant arm of the individual. The index and middle fingers of the non-dominant hand were
used to measure skin conductance throughout the experiment (Electrode GEL101, Finger electrodes
SS3LA, BIOPAC® Systems, software version #MP36). Measurements of heart rate, blood pressure,
and skin conductance were recorded once the participant completed the survey and consent form
(baseline measurements). The participants were told that they would be completing two timed
algebraic word problem tests (stressful stimulus) for the experiment and that if they achieved a score
of 80% on the second test, they would receive a $10.00 gift card to Starbucks. Prior to beginning the
test, each participant received the following instructions:

1. There are 10 word problems on this test and each one is worth 1 point.
2. You will receive 0 points for blank responses, 1 point for each correct answer and a deduction
of 1 point for each incorrect answer.
3. You will have 2 minutes to complete each test.
4. There will be a 3-minute break between finishing the first test and beginning the second test.
To induce an elevated level of stress, the participant was told that the average for all of the other
participants on the same test was a 70%. Once the participant was instructed to begin, the
experimenter kept track of the time, informing the participant when there was one minute remaining
and 30 seconds remaining.
Physiological Measurements. Immediately following the completion of the first test, the
participant’s heart rate, blood pressure (diastolic and systolic), and galvanic skin response were
Figure 1 outlines the sequence of events that the participant will partake in as a part of this study. The participant will first fill out the consent form and survey and then experimenters will record baseline measurements of heart rate, blood pressure and skin conductance. The instructions for the experiment are given followed by the administration of the timed test (stressful stimulus). Post-stressor measurements of heart rate, blood pressure and skin conductance are taken immediately following the two-minute testing interval. The participant is told that another similar timed test will be administered following a three-minute break. During this three-minute break, the participant receives either a stress ball (experimental group) or is instructed to sit quietly (control group). At approximately one minute into the three-minute break period, post-relaxation measurements of heart rate, blood pressure and skin conductance are taken. Following these measurements, the participant is informed that a second test will not be administered.

measured (post-stressor measurements). Depending on which group the participant belonged
to, they either remained seated quietly for the duration of the three-minute break (control
group) or received a stress ball with which they were able to use in any manner that was
preferred during the break (experimental group). At approximately one minute into the three-
minute break, heart rate, blood pressure, and galvanic skin response were again measured and
recorded in a spreadsheet (post-relaxation measurements). The participant was then told that
the experiment was finished and that there was not a second test. This “second test” was meant
to serve as an impending stressful stimulus for the participant. The initial testing coupled with
the prolonged anticipation of the hypothetical second test served as our singular paradigm for
stress induction.
We analyzed our data using a Welch Sample t-test to determine significance between the
experimental and control group with regard to change in heart rate, blood pressure, and GSR.
We used a confidence interval of 95% to determine if we could reject the null hypothesis. The
null hypothesis states that there is no significant difference between post-relaxation
measurements and post-stressor measurements between the experimental and control groups.
Results
Heart Rate: Figure 2 shows the differences between the post-relaxation measurements and the
post-stressor measurements for both the experimental group (n=15) and the control group (n=15).
The Welch Sample t-test showed no significant difference between the two groups (p-value=0.188).
The mean difference between the post-stressor and post-relaxation heart rate measurements of the
control group was an average decrease of 1.2 beats/minute, while the experimental group showed an

average increase in heart rate of 1.93 beats/minute. Figure 3 demonstrates the difference in
variability between male (n=8) and female (n=22) participants.
Diastolic Blood Pressure (DBP): Figure 4 shows the difference between post-relaxation
measurements and the post-stressor measurements for the control group participants (n=15) and
experimental group participants (n=15). After performing a Welch Sample t-test, it was found that
there was not a significant difference between the two groups (p-value=0.557). The mean difference
between post-relaxation DBP and post-stressor DBP of the control group was a decrease of 0.47
mmHg, while the experimental group showed an average increase of 0.867 mmHg.
Systolic Blood Pressure (SBP): Figure 5 compares the difference between post-relaxation
measurements and the post-stressor measurements for the control group participants (n=15) and
experimental group participants (n=15). After performing a Welch Sample t-test, it was found that
there was not a significant difference between the two groups (p-value=0.6633). The mean
difference between post-relaxation SBP and post-stressor SBP of the control group was a decrease of
3.73 mmHg, while the experimental group showed an average decrease of 5.2 mmHg.
Galvanic Skin Response (GSR): Figure 6 shows the average difference in GSR between the post-
relaxation measurements and the post stressor measurements for both the experimental group
participants (n=15) and the control group participants (n=15). After performing a Welch Sample t-
test, we found no significant difference between the two groups (p-value=0.258). The mean
difference between GSR post-relaxation and post-stressor measurements of the control group was a
decrease of 0.185 microsiemens, while the experimental group showed an average increase of 0.4
microsiemens.
Discussion:

Our results suggest that there is no significant difference in stress alleviation between groups
with or without a stress ball. We do acknowledge that there are a number of confounding variables
concerning the true effect of the stress ball. It is unclear whether the stress ball serves to increase
blood circulation, provides a moderate level of muscular exertion, or simply distract participants
from the impending task. However, we were simply seeking to determine whether or not the
administration of a stress ball following exposure to an exam-like situation, led to a larger decrease
in the specified physiological variables relative to a control group that received no direct method of
stress alleviation.
The data shows that although the mean change in heart rate, GSR, and DBP decreased for the
control group and increased for the experimental group, there was no significant difference between
the two groups (Figures 2, 4, 6). Additionally, although the mean change in SBP decreased for both
the control and experimental groups, there was no significant difference for SBP between the two
groups (Figure 5). One interesting observation can be seen in the heart rate variability between
males and females. Figure 3 implies that the difference in heart rate for females had a much greater
variability than the difference in heart rate for males. However, the low variability in males could be
due to the small sample size of males (n=8) relative to females (n=22). In summary, it can be
concluded that following episodes of acute stress, the use of stress balls to reduce the associated
physiological measurements has no significant effect, neither positive nor negative.
There are several sources of error that may have influenced our results, most notably, the
question of whether or not our stimulus induced an adequate level of stress. It is possible that the
idea of participating in an experiment was in itself, a stressful experience and thus, participants may
have began the experiment with elevated heart rate, blood pressure, and GSR relative to normal.
After analyzing the average difference for all the physiological measurements between the post-
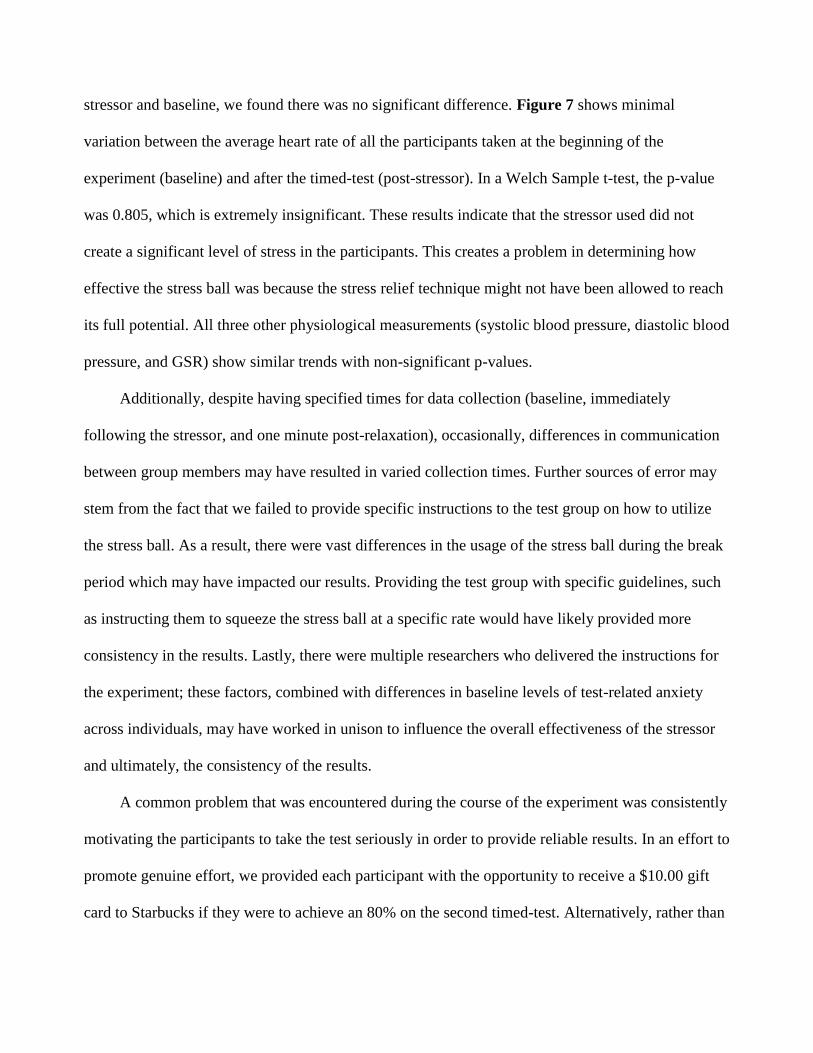
stressor and baseline, we found there was no significant difference. Figure 7 shows minimal
variation between the average heart rate of all the participants taken at the beginning of the
experiment (baseline) and after the timed-test (post-stressor). In a Welch Sample t-test, the p-value
was 0.805, which is extremely insignificant. These results indicate that the stressor used did not
create a significant level of stress in the participants. This creates a problem in determining how
effective the stress ball was because the stress relief technique might not have been allowed to reach
its full potential. All three other physiological measurements (systolic blood pressure, diastolic blood
pressure, and GSR) show similar trends with non-significant p-values.
Additionally, despite having specified times for data collection (baseline, immediately
following the stressor, and one minute post-relaxation), occasionally, differences in communication
between group members may have resulted in varied collection times. Further sources of error may
stem from the fact that we failed to provide specific instructions to the test group on how to utilize
the stress ball. As a result, there were vast differences in the usage of the stress ball during the break
period which may have impacted our results. Providing the test group with specific guidelines, such
as instructing them to squeeze the stress ball at a specific rate would have likely provided more
consistency in the results. Lastly, there were multiple researchers who delivered the instructions for
the experiment; these factors, combined with differences in baseline levels of test-related anxiety
across individuals, may have worked in unison to influence the overall effectiveness of the stressor
and ultimately, the consistency of the results.
A common problem that was encountered during the course of the experiment was consistently
motivating the participants to take the test seriously in order to provide reliable results. In an effort to
promote genuine effort, we provided each participant with the opportunity to receive a $10.00 gift
card to Starbucks if they were to achieve an 80% on the second timed-test. Alternatively, rather than

using positive reinforcement, we could have penalized participants for not putting forth genuine
effort by not agreeing to partake in their groups’ study. Future studies could be improved by utilizing
these same incentives/penalties in order to prevent a lack of effort from influencing the final results.
Similar studies could be improved upon by incorporating some of the following: first, the study
would benefit from increasing the number of participants, especially the number of male participants
in order to account for gender variability. It would also be interesting to explore the effectiveness of
stress balls with other demographics as we were only able to test college students who are a stressed
group to begin with. Another beneficial change would be the administration of a more definitive
stressor, which may provide more insight into the effectiveness of stress balls in reducing stress. In
addition, more consistent measurements and equipment application could be improved upon for
future studies, which would help decrease the possibility of error. Lastly, while we were unable to
test levels of cortisol, testing cortisol values could be a more accurate measurement of stress in an
individual. Based on our results, we found that stress balls are ineffective at lowering some of the
physiological measurements of stress; however, further studies of other stress-relief techniques
would be greatly beneficial.

Figure 2 a) Plots the difference in heart rate between the post-stressor and post-relaxation
measurements (x-axis) and the percentage as a decimal of participants that correspond to that
difference (y-axis). The dotted line represents the 15 participants in the experimental group
who received a stress ball. The solid line represents the 15 participants in the control group
who did not receive a stress ball. b) Compares the average heart rate between the experimental
group (stress ball) and the control group (no stress ball) for all three periods of measurements
(baseline, post-stressor, and post-relaxation).
Appendix:
A
B


Figure 4 a) Plots the difference in diastolic blood pressure between the post-stressor and post-
relaxation measurements (x-axis) and the percentage as a decimal of participants that
correspond to that difference (y-axis). The dotted line represents the 15 participants in the
experimental group who received a stress ball. The solid line represents the 15 participants in
the control group who did not receive a stress ball. b) Compares the average diastolic blood
pressure between the experimental group (stress ball) and the control group (no stress ball) for
all three periods of measurements (baseline, post-stressor, and post-relaxation).
A
B

Figure 5 a) Plots the difference in systolic blood pressure between the post-stressor and
post-relaxation measurements (x-axis) and the percentage as a decimal of participants that
correspond to that difference (y-axis). The dotted line represents the 15 participants in the
experimental group who received a stress ball. The solid line represents the 15 participants
in the control group who did not receive a stress ball. b) Compares the average systolic
blood pressure between the experimental group (stress ball) and the control group (no stress
ball) for all three periods of measurements (baseline, post-stressor, and post-relaxation).
A
B

Figure 6 a) Plots the difference in galvanic skin response between the post-stressor and post-
relaxation measurements (x-axis) and the percentage as a decimal of participants that
correspond to that difference (y-axis). The dotted line represents the 15 participants in the
experimental group who received a stress ball. The solid line represents the 15 participants in
the control group who did not receive a stress ball. b) Compares the average GSR between the
experimental group (stress ball) and the control group (no stress ball) for all three periods of
measurements (baseline, post-stressor, and post-relaxation).
A
B

References:
Chrousos, G (1998). Stressors, stress, and neuroendocrine integration of the adaptive response. The
1997 Hans Selye Memorial Lecture. Ann NY Acad Sci 851 311-335.
Cohen M & Khalaila R (2014). Saliva pH as a Biomarker of Exam Stress and a Predictor of Exam
Performance. Journal of Psychosomatic Research 77.5, 420-25.
Geslani GP & Gaebelein CJ (2013). Perceived Stress, Stressors, And Mental Distress Among Doctor
Of Pharmacy Students. Social Behavior And Personality 41.9, 1457-1468.
Hudson BF, Ogden J & Whiteley MS (2015). Randomized controlled trial to compare the effect of
simple distraction interventions on pain and anxiety experienced during conscious surgery.
European Journal of Pain, 1-9.
JK Kiecolt-Glaser, L McGuire, TF Robles, R Glaser (2002). Psychoneuroimmunology and
psychosomatic medicine: back to the future. Psychosom Med 64, 15–28
Lieberman HR, Thompson LA, Caruso CM, Philip JN, Mahoney CR, McClung JP, Caron GR
(2015). The catecholamine neurotransmitter precursor tyrosine increases anger during exposure to
severe psychological stress. Psychopharm 232, 943-951
Newcomer, JW, Selke, G, Melson, AK, Hershey, T, Craft, S, Richards, K & Alderson AL
(1999). Decreased memory performance in healthy humans induced by stress-level cortisol
treatment. Arch. Gen. Psychiatry 56, 527-533.
Putai J (1992). Efficacy of Tai Chi, brisk walking, meditation, and reading in reducing mental and
emotional stress. Journal of Psychosomatic Research 36, 361-370.
Sun FT, Kuo C, Cheng HT, Buthpitiya S, Collins P & Griss M (2010). Activity-Aware Mental
Stress Detection Using Physiological Sensors. Silicon Valley Campus 23, 1–20.