Embed Size (px)
DESCRIPTION
Effective Presentations. Dr. David R. Laube July 2014. Most Desirable Attributes Of Business School Graduates. Communication and Interpersonal Skills Ability To Work Well Within a Team Personal Ethics and Integrity Analytical and Problem Solving Skills. - PowerPoint PPT Presentation
Citation preview

Effective Presentations
Dr. David R. LaubeJuly 2014
1

Most Desirable AttributesOf Business School Graduates
1. Communication and Interpersonal Skills
2. Ability To Work Well Within a Team
3. Personal Ethics and Integrity
4. Analytical and Problem Solving SkillsSource: Wall Street Journal/Harris Interactive Survey of Recruiters
2

Presentation Skills
Can Make Your Career
OR
Break Your Career
3

Dave’s Top Ten ListFor Effective Presentations
1.Know Your Audience
• Who Is the Decision Maker?• Who Has the Power?• What Is the Hierarchy in the
Room?• What is the Key Person’s Social
Style?4

TellsAsks
Controlled
Emotes
Social Style Model
Much of the material in these charts is drawn from “People Styles at Work and Beyond”, Robert and Dorothy Grover Bolton, American Management Association, 1996 www.ridge.com
5

TellsAsks
Controlled
Emotes
Social Style Model
Analytical
6

TellsAsks
Controlled
Emotes
Social Style Model
Amiable
7

TellsAsks
Controlled
Emotes
Social Style Model
Expressive
8

TellsAsks
Controlled
Emotes
Social Style Model
Driving
9

TellsAsks
Controlled
Emotes
Social Style Model
Analytical Driving
Amiable Expressive
10

Social Style Model
Analytical Driving
Amiable Expressive
Detail Oriented
Exacting
Logical
Organized
Likes Consensus
Supportive
Team Player
Avoids Conflict
Big Picture
Forceful
Impulsive
Thrives on People
Milestone Oriented
Moves Quickly
Practical
Wants Control
11

Style DemographicsAnalytical Driving
Amiable Expressive
25% 25%
25% 25%
By Adolescence, Everyone Has Adopted Their Social Style and It Is Set For Life. The Population is Evenly Split.
12
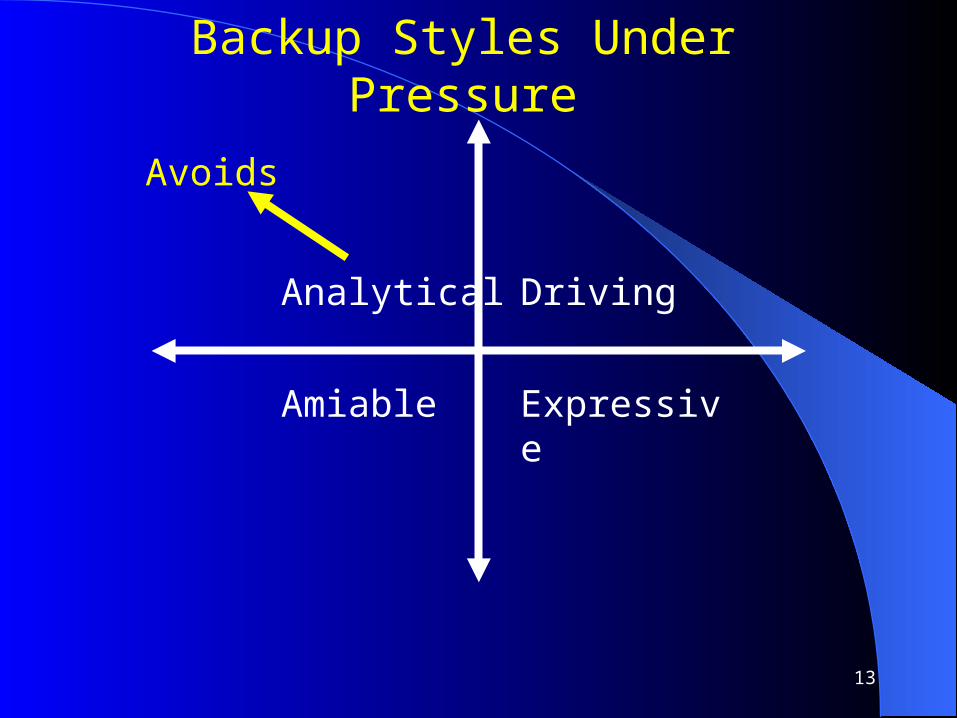
Analytical Driving
Amiable Expressive
Backup Styles Under Pressure
Avoids
13

Analytical Driving
Amiable Expressive
Backup Styles Under Pressure
Avoids
Acquiesces
14

Analytical Driving
Amiable Expressive
Backup Styles Under Pressure
Avoids
Acquiesces
Attacks
15

Analytical Driving
Amiable Expressive
Avoids Autocratic
Acquiesces
Attacks
Backup Styles Under Pressure
16

Analytical Driving
Amiable Expressive
Backup Styles Under Pressure
Avoids Autocratic
Acquiesces
Attacks
17

Social Style Model
Analytical Driving
Amiable Expressive
Detail Oriented
Exacting
Logical
Organized
Likes Consensus
Supportive
Team Player
Avoids Conflict
Big Picture
Forceful
Impulsive
Thrives on People
Milestone Oriented
Moves Quickly
Practical
Wants Control
18
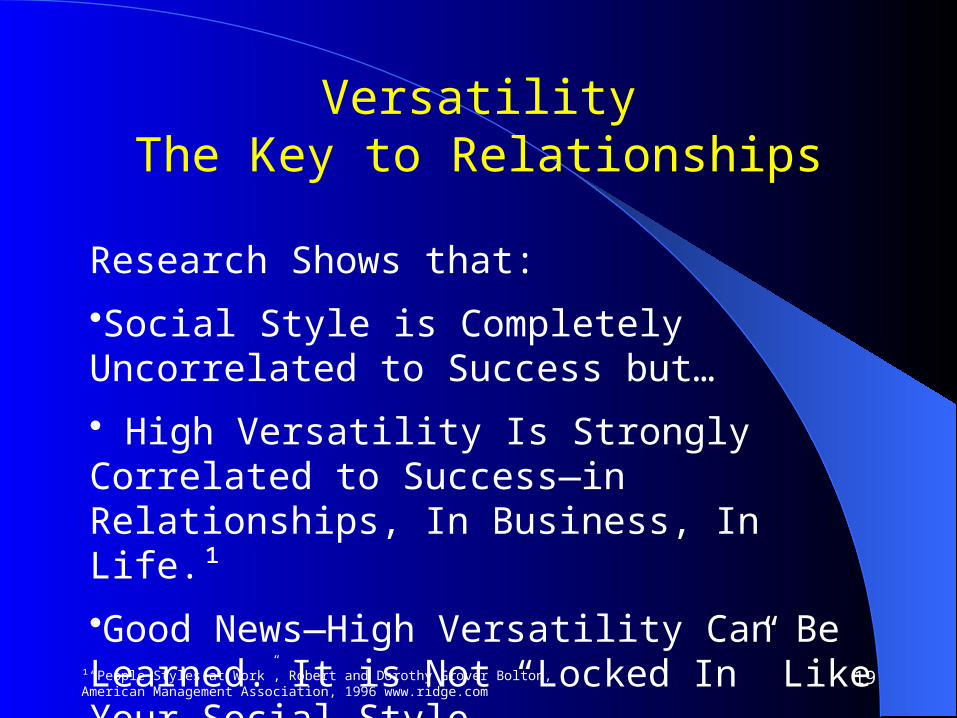
VersatilityThe Key to Relationships
Research Shows that:
•Social Style is Completely Uncorrelated to Success but…
• High Versatility Is Strongly Correlated to Success—in Relationships, In Business, In Life.¹
•Good News—High Versatility Can Be Learned. It is Not “Locked In” Like Your Social Style.¹“People Styles at Work”, Robert and Dorothy Grover Bolton, American
Management Association, 1996 www.ridge.com19

Versatility
The Ability To Meet, Or Match Your Social Style With the Style of Others…..And To Recognize When This is Absolutely Necessary.
20

Dave’s Top Ten List
2. What Is The Purpose of the Meeting
• To Inform?• To Sell Them on a Project or
Idea?• To Obtain a Decision?Make This Clear Up Front
21

2. Purpose
Use a PAL•Purpose•Agenda•Length
Consider Posting the PAL At the Front of the Room
22

3. Preparation
•How Much Time?•Stand Up vs. Sit Down?•Paper or PowerPoint?•Use Page Numbers•Bring Back Ups
23

3. Preparation
•Will the Material Be Sent Out In Advance?•Will They Read It?
•If So, the Charts Change Dramatically•They Become More Narrative• It Impacts the Live Presentation24

3. Preparation
•Accommodate Remote Attendees•Send Out Advance Connection Info•Distribute Charts In Advance
•“WebEx” Style or Audio Conference Call?• If “WebEx”, Use Colleague to Run the Charts. 25

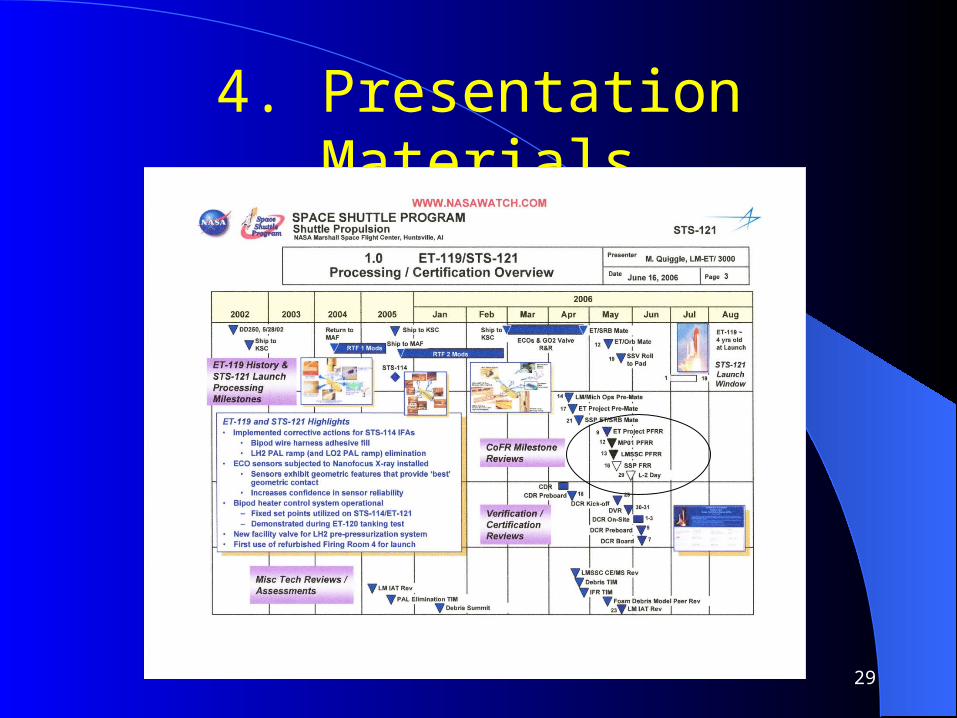
4. Presentation Materials
•Be Careful of “Data Rich” Charts
26

4. Presentation Materials
27

4. Presentation Materials
28
4. Presentation Materials
29

4. Presentation Materials
•Be Careful of “Data Rich” Charts•Use Sans-Serif Fonts•Arial or Tahoma or Corbel
30
4. Presentation Materials
•Be Careful of “Data Rich” Charts•Use Sans-Serif Fonts•Arial or Tahoma or Corbel
31

4. Presentation Materials
•Be Careful of “Data Rich” Charts•Use Sans-Serif Fonts•Arial or Tahoma or Corbel
•Blue Background with White and Yellow Text
32

4. Presentation Materials
•Be Careful of “Data Rich” Charts•Use Sans-Serif Fonts•Arial or Tahoma or Corbel
•Blue Background with White and Yellow Text.
33

4. Presentation Materials•Be Careful of “Data Rich” Charts
•Use Sans-Serif Fonts•Arial or Tahoma or Corbel
•Blue Background with White and Yellow Text

4. Presentation Materials
•Be Careful of “Data Rich” Charts•Use Sans-Serif Fonts
•Arial or Tahoma or Corbel•Blue Background with White and Yellow Text
Logo Goes Here

4. Presentation Materials
•Be Careful of “Data Rich” Charts•Use Sans-Serif Fonts•Arial or Tahoma or Corbel
•Blue Background with White and Yellow Text No Red•But Printed Copies—B&W
•No Smaller Than 18 Point Fonts36


4. Presentation Materials
38
•Don’t Overlay Text Onto Pictures


4. Presentation Materials
40
•Don’t Overlay Text Onto Pictures•Handle Financials Clearly

41
Three Months Ended
June 27, 2008 June 29, 2007
Cash and cash equivalents at beginning of period $ 44,246 $ 10,479
Cash flows from operating activities:
Net cash provided by (used in) operating activities (4,126) 1,432
Cash flows from investing activities:
Purchase of short-term investments (17,586) (20,898Proceeds from sales and maturities of short-term
investments 15,042 15,449
Payment for license and development arrangement — (1,250
Purchases of property and equipment (408) (1,310
Net cash used in investing activities (2,952) (8,009
Cash flows from financing activities:
Issuance of common stock 44 7,651
Repurchase of common stock (859) (136
Repurchase of 3¾ convertible senior notes (8,342) —
Excess tax benefit from stock-based compensation — 51
Net cash provided by (used in) financing activities (9,157) 7,566
Effect of exchange rate changes on cash 150 212
Net increase (decrease) in cash and cash equivalents (16,085) 1,201
Cash and cash equivalents at end of period $ 28,161 $ 11,680

42
Three Months Ended
June 27, 2008 June 29, 2007
Cash and cash equivalents at beginning of period $ 44,246 $ 10,479
Cash flows from operating activities:
Net cash provided by (used in) operating activities (4,126) 1,432
Cash flows from investing activities:
Purchase of short-term investments (17,586) (20,898Proceeds from sales and maturities of short-term
investments 15,042 15,449
Payment for license and development arrangement — (1,250
Purchases of property and equipment (408) (1,310
Net cash used in investing activities (2,952) (8,009
Cash flows from financing activities:
Issuance of common stock 44 7,651
Repurchase of common stock (859) (136
Repurchase of 3¾ convertible senior notes (8,342) —
Excess tax benefit from stock-based compensation — 51
Net cash provided by (used in) financing activities (9,157) 7,566
Effect of exchange rate changes on cash 150 212
Net increase (decrease) in cash and cash equivalents (16,085) 1,201
Cash and cash equivalents at end of period $ 28,161 $ 11,680

43
Three Months Ended
June 27, 2008 June 29, 2007
Cash and cash equivalents at beginning of period $ 44,246 $ 10,479
Cash flows from operating activities:
Net cash provided by (used in) operating activities (4,126) 1,432
Cash flows from investing activities:
Purchase of short-term investments (17,586) (20,898Proceeds from sales and maturities of short-term
investments 15,042 15,449
Payment for license and development arrangement — (1,250
Purchases of property and equipment (408) (1,310
Net cash used in investing activities (2,952) (8,009
Cash flows from financing activities:
Issuance of common stock 44 7,651
Repurchase of common stock (859) (136
Repurchase of 3¾ convertible senior notes (8,342) —
Excess tax benefit from stock-based compensation — 51
Net cash provided by (used in) financing activities (9,157) 7,566
Effect of exchange rate changes on cash 150 212
Net increase (decrease) in cash and cash equivalents (16,085) 1,201
Cash and cash equivalents at end of period $ 28,161 $ 11,680

4. Presentation Materials
44
•Use Video Appropriately
•But Keep It Short

4. Presentation Materials
•Assume 3 Minutes Per Chart•Assume 1/3 of the Time Is For Questions•Prepare “Back Up” Charts For Additional Detail
45

4. Presentation Materials
•An Ideal Structure:•Three or Four Points•Using partial sentences•Or Easy To Read Charts/Visuals
Using A Take-Away Box46

5. Set Expectations
•Introduce Yourself•Why Is Everyone Here? (the PAL)•Questions—During Or At End?•Reconfirm the Time Available•Give Ground Rules for Conference Calls
47

6. Presentation Skills
•Eye Contact With Audience•Don’t Overly Refer to Notes•Vary Voice, Tone, Pitch, Volume•Use Your Hands•Wear Appropriate Clothes
Touch, Turn, Then Talk48

7. Be Flexible
•Be Prepared to Jump Around•Be Prepared to Cut It Short•Skip Some Charts, If Necessary•Don’t Read the Charts•Don’t Make the Charts “Cute”
49

7. Be Flexible
•Be Prepared to Jump Around•Be Prepared to Cut It Short•Skip Some Charts, If Necessary•Don’t Read the Charts•Don’t Make the Charts “Cute”
50
7. Be Flexible
•Be Prepared to Jump Around•Be Prepared to Cut It Short•Skip Some Charts, If Necessary•Don’t Read the Charts•Don’t Make the Charts “Cute”•Use the “Blank” Button
51

8. Time Management
•Rehearse To Determine the Time•Have a Colleague Keep Time•Have a Visible Clock Or Watch•Start Within 3 Minutes of Schedule•Stay On Topic, If You Can•Be Careful About Questions•Use “Parking Lot” to Table Issues
52

9. Q&A – The Ultimate Test
•Q&A Will Demonstrate:•Your Knowledge of the Subject•Your Personality•Your Ability to Think on Your Feet
•Your Flexibility•Your Time Management
53
Q&A May Determine Success or Failure

9. Q&A – The Ultimate Test
•Anticipate Questions•Role Play in Rehearsal•Bring Backup Material•Watch the Time•Try to Address the Whole Audience
54

9. Q&A – The Ultimate Test
Three Useful Words
Don’t Be Afraid to Say—
“I Don’t Know”…..
“But I’ll Get You the Answer By _____”.
55

10. Do A Good Close
•Always Close
•Refer Back to the “Purpose”
•Use a One Slide Finish….
56

Next Steps?
57

Follow These Ten Rules……
And Your Presentations Will:
1. Improve Your Organization and
2. Improve Your Career
58

ResourcesSocial Styles
• “People Styles At Work and Beyond”, Robert Bolton and Dorothy Grover Bolton, Amacom
• http://www.tracomcorp.com many resources including assessments
Effective Presentations• “Beyond Bullet Points”, Cliff Atkinson, Microsoft• “The Exceptional Presenter, Timothy J. Koegel, Greenleaf
Book • “Knockout Presentations”, Diane DiResta, Chandler House
Press• “Maximize Your Presentation Skills”, Ellen A. Kaye, Three
River Press• “Solving the PowerPoint Predicament”, Tom Bunzel, Que
Publishing, includes CD• “Speaking Effectively”, John A. Kline, Prentice Hall • “Why Most PowerPoint Presentations Suck”, Rick Altman,
Harvest Books
Software• http://www.presentationpro.com For PowerPoint add-on
software
59