Embed Size (px)
DESCRIPTION
Effective Connectivity. Lee Harrison. Wellcome Department of Imaging Neuroscience, University College London, UK. SPM Short Course, May 2003. Outline. Motivation & concepts Models of effective connectivity An example. Outline. Motivation & concepts - PowerPoint PPT Presentation
Citation preview

Effective ConnectivityEffective Connectivity
Lee Harrison
Wellcome Department of Imaging Neuroscience, University College London, UK
SPM Short Course, May 2003

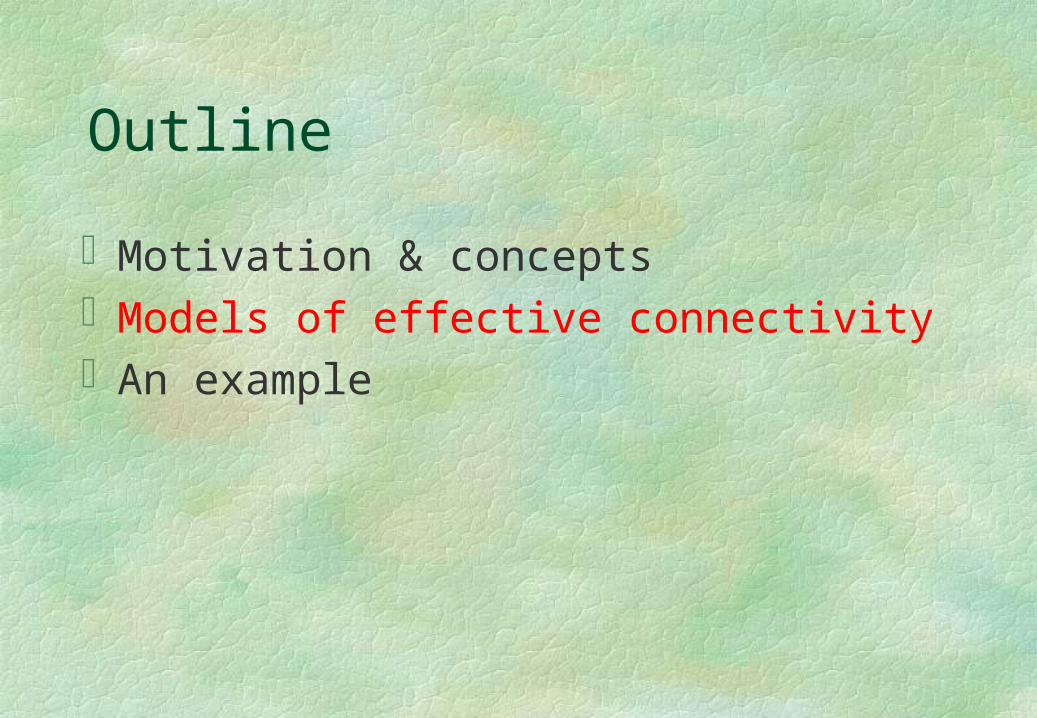
Outline
Motivation & conceptsModels of effective connectivityAn example

Outline
Motivation & conceptsModels of effective connectivityAn example

Q. In what areas does the ‘motion’ factor change activity ?
Univariate Analysis
Functional Specialization

Functional IntegrationTo estimate and make inferences about
(1)the influence that one neural system exerts over another
(2) how this is affected by the experimental context
Z2
Z4
Z3
Z5

Concepts
Brain as a physical system Evoked response to input
System identificationParameterised models
In terms of connectivity
Classification of models Black box & hidden states

Concepts (continued)
Linear vs nonlinear systems Balance mathematical tractability and biological plausibility
Generalization of General Linear Model Bilinear models
Inputs Perturbing & contextual Stochastic & deterministic
• use of design matrix
Experimental design 22 factorial design

Concepts (continued)
Linear vs nonlinear systems Balance mathematical tractability and biological plausibility
Generalization of General Linear Model Bilinear models
Inputs Perturbing & contextual Stochastic & deterministic
• use of design matrix
Experimental design 22 factorial design

Model of Neuronal Activity
),( uzfz
Z2Z1Z2
Z4
Z3
Z5
Stimuliu1
Setu2
Nonlinear,systems-levelmodel

Bilinear Dynamics
Z2Z1Z2
Z4
Z3
Z5
Stimuliu1
Setu2
Psycho-physiological interaction
CuuBzAzz

Bilinear Dynamics
Psycho-physiological interaction
CuuBzAzz
a53
Setu2
Stimuliu1
1111111 uczaz
5353333 zazaz
454353
5555
zaza
xaz
11c
21a
223b
23a
54a242b
2242242545
4444
)( zbuaza
zaz
3223223121
2222
)( zbuaza
zaz

Bilinear Dynamics: Positive transients
CuuBzAzz
-
Z2
Stimuliu1
Setu2
Z1
+
+
-
-
-+
u1
Z1
u2
Z2

Concepts (continued)
Linear vs nonlinear systems Balance mathematical tractability and biological plausibility
Generalization of General Linear Model Bilinear models
Inputs Perturbing & contextual Stochastic & deterministic
• use of design matrix
Experimental design 22 factorial design
Outline
Motivation & conceptsModels of effective connectivityAn example

1) Standard Analysis of fMRI Data
2) Statistical Parametric Maps
3) Anatomical model
4) Connectivity model
5) Estimation & inference of model parameters
Z2
Z4
Z3
Z5
Practical stepsDesign matrix
SPMs

Outline
Motivation & conceptsModels of effective connectivity
Linear regression Convolution State-Space
An example

Outline
Motivation & conceptsModels of effective connectivity
Linear regression Convolution State-Space
An example

), ,Σ0~N(zzΒyy tttt
32b
12b
13b
y1
y3
y2
3z
1z2z
321
32
1312321321
00
000
0
ttttttttt zzz
b
bb
yyyyyy
Structural Equation Modelling

A32bA
21b
V1 PPCV5
NA32bNA
21b
V1 PPCV5
V1 PPCV5
PPIV5xPFC
PFC
Attentionalset
NA32
A32
NA21
A210 bb,bb:H
21b
56b
35b
61b
34b2b3
46b
0b :H 350
A32bA
21b
V1 PPCV5
A32bA
21b
V1 PPCV5
vs
V1 PPCV5
PPIV5xPFC
PFC
Attentionalset
21b
56b61b
34b2b3
46b
vs
Inference in SEMs

Outline
Motivation & conceptsModels of effective connectivity
Linear regression Convolution State-Space
An example
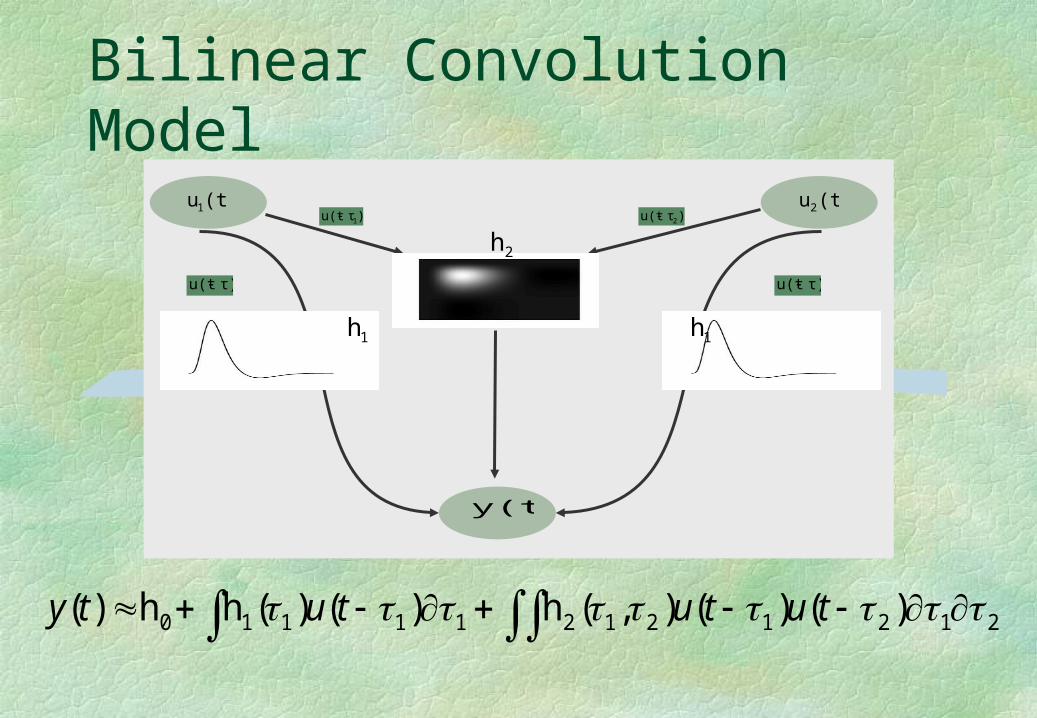
)τu(t 1 )τu(t 2(t)u1 (t)u 2
y(t)
τ)u(t τ)u(t
212121211110 )()(),(h)()(hh)( tutututy
2h
1h 1h
Bilinear Convolution Model

Outline
Motivation & conceptsModels of effective connectivity
Linear regression Convolution State-Space
An example

Outline
Motivation & conceptsModels of effective connectivity
Linear regression Convolution State-Space
• Dynamic Causal Modelling
An example

yy
y
Hemodynamic model
},,{ CBA
The DCM and its bilinear approximation
Inputu(t)
activityz1(t)
activityz3(t)
activityz2(t)
23b
12a
1c
The bilinear model
n
1
n
1
nnn1
1n11
nnn1
1n11
n
1
c
c
u
z
z
bb
bb
u
aa
aa
z
z
neuronalchanges
intrinsicconnectivity
inducedresponse
inducedconnectivity
CuzBuAzj
jj )(
h(z(t))y(t)

ssignal
infflow
qdHb
signal BOLD
qvty ,)( )(tz
activity s
0
,
vfout
0inf
00
0,
E
EfEf inin
vvolume
0
,
vq
vfout
f
inf
1
s
s
The hemodynamic model
Output function: a mixture of intra- and extra-vascular signal
λ(v,q)y(t)
Balloon component
The rate of change of volume
v The change in deoxyhemoglobin
q
Flow component
Activity-dependent signal
s Flow inducing signal
f
State Equations
y
)(tz

Constraints on•Connections
•Hemodynamic parameters
Models of•Hemodynamics in a single region
•Neuronal interactions
Bayesian estimation
)(p
)()|()|( pypyp
)|( yp
Overview

1) Standard Analysis of fMRI Data
2) Statistical Parametric Maps
3) Anatomical model
4) Connectivity model
5) Estimation & inference of model parameters
Z2
Z4
Z3
Z5
Practical stepsDesign matrix
SPMs

Outline
Motivation & conceptsModels of effective connectivity
Linear regression Convolution State-Space
An example DCM for visual motion processing

A fMRI study of attentional modulation
Stimuli 250 radially moving dots at 4.7 degrees/s
Pre-Scanning
5 x 30s trials with 5 speed changes (reducing to 1%)
Task - detect change in radial velocity
Scanning (no speed changes)
6 normal subjects, 4 100 scan sessions;
each session comprising 10 scans of 4 different condition
F A F N F A F N S .................
F - fixation point only
A - motion stimuli with attention (detect changes)
N - motion stimuli without attention
S - no motion
Buchel et al 1999
V5+
PPC

30
V1 IFG
V5
SPC
Motion
Photic
Attention
.92
.43
.62
.40
.53.35
.73
.49
.53
3) Attentional modulation of
prefrontal connections
That is sufficient to explain regionally specific attentional
effects2) Segregation
of motion information to
V5ju ju ju
1) Hierarchical architecture
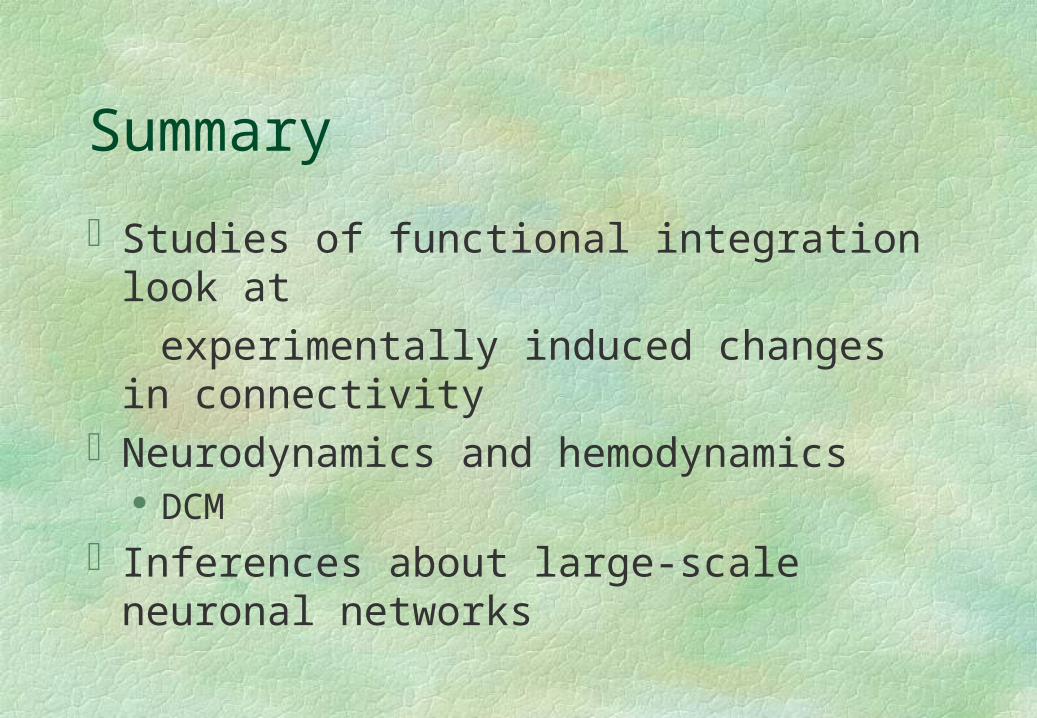
Summary
Studies of functional integration look at
experimentally induced changes in connectivityNeurodynamics and hemodynamics
DCM
Inferences about large-scale neuronal networks