Embed Size (px)
Citation preview
54 SMProceedings of the 13th Int. AMME Conference, 27-29 May, 2008
13th International Conference on Applied Mechanics and Mechanical Engineering.
Military Technical College Kobry El-Kobbah,
Cairo, Egypt.
EFFECT OF THE BARRIER GEOMETRY ON THE MITIGATION OF
BLAST WAVES
EL-SAYED* M.S., YOUNES* M.M. and EL-BEBLAWY* M.S. ABSTRACT In this paper, a numerical simulation using the commercially available AUTODYN 3D code is carried out to estimate the peak pressure behind a blast barrier. A 50 kg TNT charge source is employed to simulate the blast wave. Four different element geometries are used individually to model various shapes of barriers. These barrier models are constructed singly from plates, angle bars, I-beams or tubes. The pressure-time histories are recorded by using gauges located behind each barrier model. The obtained results are compared with the no-barrier case at the same locations. The influences of the boundary conditions, the cross-sectional dimensions, the spacing between elements and the amount of charge and its position are examined and evaluated. The outputs show that the peak pressure of the blast wave can be reduced depending on certain parameters chosen for the barrier design. KEY WORDS Blast loading; mitigation; peak pressure ------------------------------------------------------------------------------------------------------------------- * Egyptian Armed Forces.
55 SMProceedings of the 13th Int. AMME Conference, 27-29 May, 2008
INTRODUCTION It is well known that the blast wave produced by detonation of an explosive is characterized by extremely high peak pressure and short duration [1]. Investigation of the produced pressure waves can be carried out by using Hydro-code equations [2]. The obtained results are validated by experimental outcomes as shown in Fig.(1). Efficient analysis of high explosion on complex urban geometries was performed using empirical charts by Fairlie [3]. The list of blast absorbing materials including granular, particulate matter, porous material and foam were studied by Nesterenko [4]. Little research has been conducted to reduce the damage potential of blast waves, which mainly depends on its peak pressure. Pfannes et al. [5] investigated a tapered chain of elastic beads under impulse loading, however Edwards and Palmer [6] carried out experiments to determine the blast mitigation characteristics of particulate materials. Panczak et al. [7] studied the blast wave mitigation of aqueous foams. Li and Meng [8] investigated the blast mitigation behavior of cellular materials by using a one-dimensional mass–spring model. Gelfand and Silnikov [9] proposed an attenuation method that uses a liquid layer confined within an elastic envelop. Chong et al. [10] numerically simulated the blast mitigation process by water using a three dimensional model. The number of publications handling the effect of the barrier geometry on the mitigation of shock waves is limited in the available literature. In the present work, AUTODYN [11] is used to simulate different target geometries against blast loading. Several target geometries are selected in a careful manner to cover most of common shapes. Geometries of elements constituting targets are modeled using plates to express front face surfaces, angle bars to express inclines surfaces, I-beams to express stiffened flat surfaces or tubes to express curved surfaces. Various parameters as the cross-sectional dimensions, the spacing between elements, the amount of charge and its position are individually examined. The importance of this parametric study is to converge the compared parameters towards certain effective ones coupling with the shape factor parameter. MODELING Four different model geometries are simulated using AUTODYN code. The elements used in constructing each model are plates, I beams, angle bars or tubes. All models were built with equal projected areas and same weight for each element type. Equal spacing between elements are also considered. Two main parameters are required in the input file to define the model, which are the geometry and the material of the target. The media configuration is organized by (x,y,z) = (3,2,3) meters to ensure the symmetry condition with respect to the three perpendicular planes as shown in Fig.(2). The charge position is selected at the coordinate (0,0,0) to fulfill a symmetrical effect with respect to the two planes normal to the target elements as shown in Fig.(3). MATERIAL AND DIMENSIONS The subroutines of STEEL, ANFO and AIR were employed in AUTODYN to identify the material. All the element types of plates, angles, tubes and I-beams have same cross-sectional area of 1500 mm2, same projected area of 300 mm x 2000 mm and thickness of 5 mm, 3.536 mm, 1.591 mm and 1.667 mm, respectively. The spacing between
56 SMProceedings of the 13th Int. AMME Conference, 27-29 May, 2008
elements was studied in a range from 20 mm to 125 mm. An ANFO charge of 30 kg mass was employed in AUTODYN to produce an impulsive loading on the model. The peak-pressure was recorded at different locations by using the gauges shown in Fig.(4). The boundary conditions were fixed-fixed for all models. MAIN MODEL It is worth mentioning that, studying the variation of only one parameter and keeping the rest of variables constants is considered a weak point in any parametric study. In other words, different parameters must be changed together in parallel comparing during the present analysis to obtain an optimum model able to fulfill the required function. In the present work, several simulation trials were carried out to select a suitable model employs as a main model reference. The results obtained from changing of various model parameters are compared with the outcomes obtained from the main model. Main Model Set-up A clear description to the main model geometry and its material is explained below. Main model geometry The media surrounding the model has a dimension of (x,y,z) = (3,3,1) meters, however the program displays the model symmetric about the x-axis, therefore the dimensions will appear of (6,3,1) meters as seen in Fig.(5). The array of model elements is located at y=1m and the charge is positioned at the origin (0,0,0). All the tested elements have the same cross-sectional area of 4500 mm2, the same projected area of 300 mm x 1000 mm, the thicknesses of I-beam, angle, tube and plate are 5 mm, 15 mm, 10.61 mm and 4.773 mm, respectively and the spacing between the elements is 100 mm, the boundary conditions of all arrays are fixed-fixed. Different types of gauges have been set to capture various data as shown in Figs.(5, 6). Fixed gauges are positioned in the air to measure the pressure however the moving ones are located on the steel to capture the strain. Table (1) expresses the locations and types of all the thirteen gauges used in the present analysis. Main model material The materials used for the air and steel are similar to that stated in sec.(3), however, the charge material was changed to TNT with 50 kg rather than ANFO since TNT is considered a common reference of most explosions. Main model outcomes Two main parameters are required to capture. Firstly, detecting the value of the peak pressure after passing the blast wave through the model elements. Secondly, investigating the explosion effect on the behaviour of the model itself. Comparing is carried out between the models of various element shapes and the significant parameters affecting the solution are assessed.
57 SMProceedings of the 13th Int. AMME Conference, 27-29 May, 2008
Mitigation of the pressure wave The highest level of the pressure effect is observed at the locations of gauges 1, 2 and 3 as shown in Fig.(5). The pressure-time history obtained from the various shape models is recorded at each gauge position, and the values of the peak pressure are compared in Fig.(7). It is noted that, the peak pressures at gauge 1 is much pronounced than that obtained at gauge 3 since gauge 1 has a smaller distance from the charge position than gauge 3. Furthermore, the model of I-beam elements always mitigates the highest level of pressure waves in comparison with the other three models. The model of angle elements fails to mitigate the pressure wave with the same efficiency as models of plate or tube elements. Moreover, the model of the tube elements succeeded to mitigate the pressure wave with a higher percentage than the model of the plate elements at gauges 2 and 3, and vice versa at gauge 1. This variation in the pressure wave attenuation may be attributed to the method of passing the pressure wave from the spacing between the elements of different models. Changing of the element shapes causes a difference in the efficiency of the pressure wave mitigation for each model. It is worth mentioning that, the present comparison depicts a separate detailed result for each individual model, unlike the results obtained from the empirical chart method [3] which did not take the effect of the geometry factor into consideration. The energy absorption capacity is averaged at different gauges and its percentage is depicted for each model in Fig.(8). Deflection at the mid-span Gauges 10, 11, 12 and 13 shown in Fig.(6) are used to record the deflection at the mid-span of each model. At each gauge, the value of the maximum deflection are compared in Fig.(9) for all the different model shapes. It is noted that the model of plate elements has the highest deflection values followed by I-beams. This may be due to the moment of inertia of the plate cross section is lower than that of the I-beams. The deflections predicted from the angle model and the tube one have closed readings at the mid-span. Furthermore, flanges of the I-beam model have deformed with higher level than that recorded at the locations of the gauge points. In other words, the I-beam and the plate models which have flat faces opposite to the loading direction absorb most of the incident energy with minimum dispersion. However, the angle and tube models mainly reflect and disperse the applied pressure wave with low energy absorption. PARAMETRIC STUDY The effect of changing some parameters on the model behaviour is presented and the results are compared with that obtained from the main model. Effect of the Boundary Conditions Changing the boundary conditions of the main model from fixed-fixed elements to fixed-free elements has a significant effect on the predicted peak pressure and on the deflection at the mid-span of the model.
58 SMProceedings of the 13th Int. AMME Conference, 27-29 May, 2008
Peak pressure In case of the fixed-free boundary conditions, the peak pressure is predicted at the position of gauges 1 and 2 for all the main models of various elements and the results are presented in Fig.(10). It is observed that the peak pressure increased for all models with different percentages. The highest increasing in the peak pressure is noted at the tube model (10-11 %), however the lowest increasing is seen at the plate model (1-3 %). It means that changing the boundary conditions is significantly affected the magnitude of the predicted peak pressure. Mid-span deflection The mid-span deflection obtained from the present four models are compared at gauges 10 and 11 with that predicted from the corresponding main models as shown in Fig.(11). It is observed that, changing the boundary conditions of the angle model from fixed-fixed to fixed-free increases the mid-span deflection to more than 90 %. The minimum increasing in the mid-span deflection is noted in the model of I-beam elements. It is worth mentioning that, the effect of the pressure wave propagation on the angle elements is much pronounced than that obtained from the plate elements. This may be attributed to the geometry of the angle elements, which have a great capability to accumulate the blast wave between their inclined faces, and then high deformation effect is generated. However, in case of the plate elements the matter is totally different where the wave escapes directly with low deformation effect due to the angular deflection of the plate elements. Effect of Charge Source Position The effect of changing the distance between the charge source and the model is considered an important factor in the present study. Keeping the distance between the charge source position and the gauges locations is a condition in all comparing. Therefore, the examined model itself can be displaced such that the variation of the charge source position affects the distance between the charge and the model, and does not affect the distance between the charge and the gauges. The models were examined by moving them 1 m back and 0.2 m left to cover various ranges in different directions. The peak pressure is recorded at gauges 3 and 4 for all investigated models. The percentage of change in the peak pressure are compared with that obtained from the main models as shown in Figs.(12,13). The comparing shows a variation in the percentage of the peak pressure. The most important note is the closest values of the peak pressures recorded at the rear of the angle model independent of the model displacement (front, back, right or left). It means, a suitable factor of safety can be chosen to cover the slight difference in peak pressure recorded when changing the angle model position. Effect of Tracking of the Air Density The gauges no. 5, 6, 7, 8 and 9 are organized in a manner allows to record the variation of air density during its passing through the model elements. This investigation is useful in prediction how the incident blast wave is oriented when facing different model geometries. Schematic drawing of the gauges locations is presented in Fig.(14). Figure(15) shows a comparison of the maximum values of air density obtained from
59 SMProceedings of the 13th Int. AMME Conference, 27-29 May, 2008
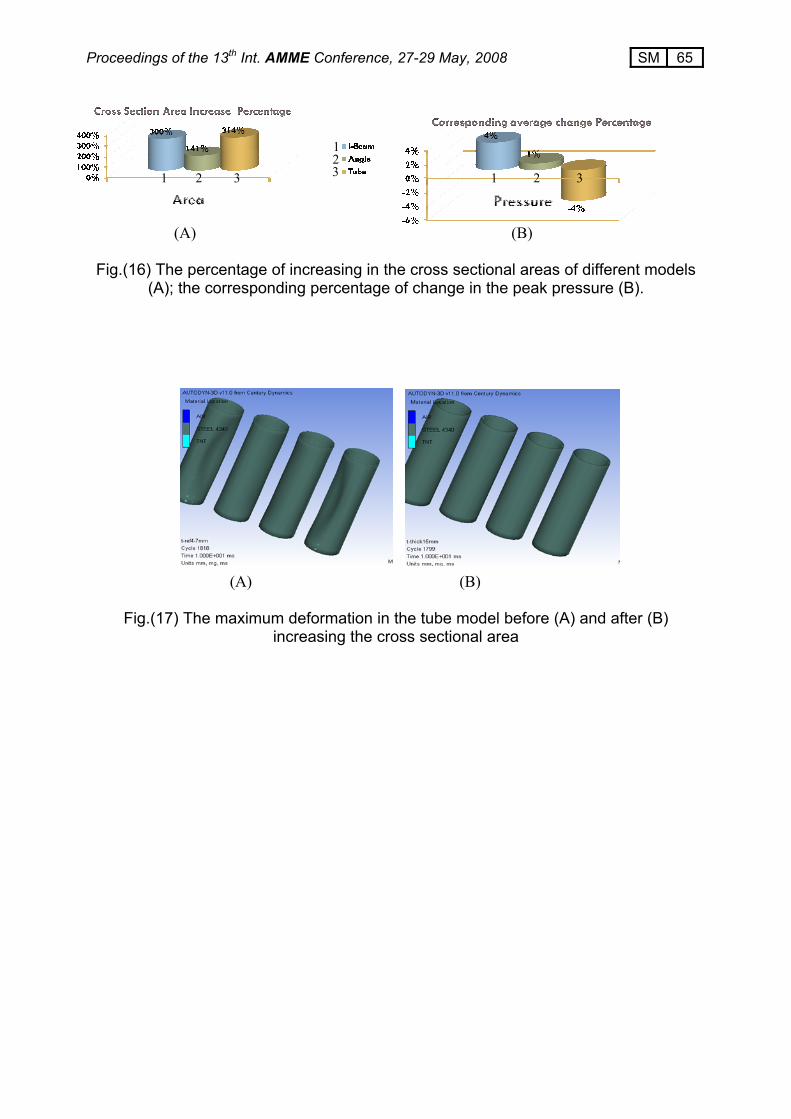
various model elements at different locations. It is noted at gauge 5 that the accumulation of air particles between the elements of the angle models is greater than that obtained in case of free air (no model exist). However, gauges no. 8 and 9 recorded lower air density when using the I-beam model. These results may be attributed to the reflection and the refraction of the blast wave which is significantly occurred by the inclined surfaces of the angle model. However, the matter is different in case of the plate and the I-beam models where most of the incident energy was absorbed via frontal faces of these models, and a little air particles are only succeeded to pass through the model elements. Effect of Change of Model Thickness As discussed before, all the models have the same weights and of equal projected areas which leads to creating a variation in the cross-sectional areas and a difference in the thicknesses. In the current study, the thickness of all models is selected to be equal 15mm thick as the plate model thickness. Figure (16) shows the increasing percentage in the cross-sectional areas of different model elements. It is noted that, the increasing in the cross-sectional area of the I-beam model by more than 300 % leads to a slight reduction in the peak pressure tends to 4 %. However, when increasing the cross-sectional area of the tube model by 314 % an astonished increasing instead of reduction in the peak pressure is observed. The latter result may be attributed to the increasing of the model stiffness which leads to a limited deformation in the tubes, unlike the thin ones which have a deformation shape closes the in between spacing as compared in Fig.(17). CONCLUSION Four different barrier geometries are simulated using AUTODYN to mitigate the blast effects generated by a charge source. The numerical code compares efficiently between plates, I-beams, angle bars and tubes elements used individually in constructing each model. The numerical simulation shows that changing of the element shapes causes a difference in the efficiency of the pressure wave mitigation for each model. Moreover, the deflections predicted from the angle model and the tube one have closed readings at the mid-span. However, the model of plate elements has the highest deflection values followed by I-beams. The I-beam and the plate models which have flat faces opposite to the loading direction absorb most of the incident energy with minimum wave dispersion. However, the angle and tube models mainly reflect and disperse the applied pressure wave with low energy absorption. A parametric study of the barrier model has been carried out. It is shown that changing the boundary conditions from fixed-fixed to fixed-free increases the mid-span deflection of all models with different increasing levels. The increasing in the cross-sectional area of the I-beam model leads to a slight reduction in the peak pressure, while an astonished increasing instead of reduction in the peak pressure is observed in case of the tube model.
60 SMProceedings of the 13th Int. AMME Conference, 27-29 May, 2008
REFERENCES [1] Kinney G F, Graham K J, “Explosive shocks in air”, 2nd ed. New York: Springer;
1985. [2] Clutter J K, Stahl M, "Hydrocode simulations of air and water shocks for facility
vulnerability assessments", Journal of Hazardus Materials, Vol. 106, No. 1, pp. 9-24, 2004.
[3] Fairlie G.E., “Efficient Analysis of High Explosive Air Blast in Complex Urban Geometries Using the AUTODYN-2D & 3D Hydrocodes”, Analytical & experimental methods, military aspects of blast and shock. Banff, Alberta, Canada; 1997.
[4] Nesterenko VF., “Shock mitigation by ‘soft’ condensed matter”, Mater Res Soc Sym Proc 2003;579:135–46.
[5] Pfannes J, Sen S, Chakravarti S, Surve FI., “Energy absorption and recovery in tapered granular chains: small chains and low tapering”, Mater Res Soc Sym Proc 2003;579:147–54.
[6] Edwards MR, Palmer ME, “Mitigation of comminution effects of explosives by particulate materials”, J App Phys 2003;93(5):2540–3.
[7] Panczak TD, Krier H, Butler PB, “Shock propagation and blast attenuation through aqueous foams”, J Hazard Mater 1987;14(3):321–36.
[8] Li QM, Meng H, “Attenuation or enhancement-a one-dimensional analysis on shock transmission in the solid phase of a cellular material”, Int J Impact Eng 2002;27(10):1049–65.
[9] Gelfand BE, Silnikov MV, “The selection of the effective blast reduction method when detonating explosives”, J Phys IV: JP 002; 12(7) Pr7/371–4.
[10] Chong WK, Lam KY, Yeo KS, Liu GR, Chong OY, “Comparison of simulation’s results with experiment on water mitigation of an explosion”, Shock Vib 1999;6(2):73–80.
[11] AUTODYN program documentations version 6.1, "Theory Manual", Century Dynamics Limited, 3 Horsham Gates, North Street, Horsham, West Sussex, UK.
61 SMProceedings of the 13th Int. AMME Conference, 27-29 May, 2008
Table (1) the gauges location.
Gauge
No. Type Part X-Coordinate Y-Coordinate Z-Coordinate
1 Fixed AirMedia 2.00E+02 2.90E+03 0.00E+00
2 Fixed AirMedia 1.20E+03 2.90E+03 0.00E+00
3 Fixed AirMedia 2.20E+03 2.90E+03 0.00E+00
4 Fixed AirMedia 2.94E+03 2.80E+03 4.38E+02
5 Fixed AirMedia 4.00E+02 1.15E+03 0.00E+00
6 Fixed AirMedia 4.00E+02 1.25E+03 0.00E+00
7 Fixed AirMedia 4.00E+02 1.35E+03 0.00E+00
8 Fixed AirMedia 3.00E+02 1.35E+03 0.00E+00
9 Fixed AirMedia 5.00E+02 1.35E+03 0.00E+00
10 Moving Steel 2.00E+02 1.00E+03 0.00E+00
11 Moving Steel 6.00E+02 1.00E+03 0.00E+00
12 Moving Steel 1.00E+03 1.00E+03 0.00E+00
13 Moving Steel 1.40E+03 1.00E+03 0.00E+00
Fig.(1) Similar characteristics for the pressure-time history of blast waves [2]. Fig.(2) 3D symmetrical tube model
62 SMProceedings of the 13th Int. AMME Conference, 27-29 May, 2008
Fig.(3) Location of the charge source relative to the model elements.
Fig.(6) Location of the moving gauges on the model elements
Fig.(4) Location of the fixed gauges in the air media
Fig.(5) Location of the fixed gauges in the air media and
directly behind the model
63 SMProceedings of the 13th Int. AMME Conference, 27-29 May, 2008
1 1 1
2 2 2
23
33 3
4 4
4 4
1
Fig.(7) Peak pressure values for different model shapes at gauges no. 1, 2 and 3
1 2 3 4
1 2 3 4
1 2 3 4
Fig.(8) Average percentage of the energy absorbed by the different model shapes
Fig.(9) The maximum mid-span deflection for different model shapes
at gauges no. 10, 11, 12 and 13
1
1
1 2
2
2 2
3 3 3
3
4 4 4
4
1
1
2
3 4
1 2 3 4
1
2
4
3
1
2
4
3
Fig.(10) Peak-pressure for different model shapes of fixed-free boundary conditions
at gauges no. 1 and 2.
1 2 3 4
1 2
4
3
1
2
4
3
Figure (11) Mid-span deflection for different model shapes of fixed-free boundary conditions
at gauges no.10 and 11.
Figure (12) Percentage of change in the peak pressure for different model shapes after moving 1 m back at gauges no.3 and 4.
1 2 3 4
1
2
4
3
1
2
4 3
64 SMProceedings of the 13th Int. AMME Conference, 27-29 May, 2008
Fig.(14) Schematic drawing for the location of gauges
no. 5, 6, 7, 8 and 9 relative to the angle model.
Fig.(15) Maximum values of air density obtained from various models
at gauges no. 5, 6, 7, 8 and 9.
Figure (13) Percentage of change in the peak pressure for different model shapes after moving 20 cm left at gauges no.3 and 4.
1 2 3 4
1 2 4
3
1
2
4
3
1
1
2
2 3
3 4 1 2 3 4 1 2 3 4
1 2 3 4
1 2 3 4
4
65 SMProceedings of the 13th Int. AMME Conference, 27-29 May, 2008
(A) (B)
Fig.(16) The percentage of increasing in the cross sectional areas of different models (A); the corresponding percentage of change in the peak pressure (B).
(A) (B)
Fig.(17) The maximum deformation in the tube model before (A) and after (B) increasing the cross sectional area
1 2 3 1 2 3
1 2 3