Embed Size (px)
DESCRIPTION
free
Citation preview
lable at ScienceDirect
Energy 93 (2015) 613e624
Contents lists avai
Energy
journal homepage: www.elsevier .com/locate/energy
Effect of temperature, suction head and flow velocity on cavitation in aFrancis turbine of small hydro power plant
Pankaj P. Gohil*, R.P. SainiAlternate Hydro Energy Centre, Indian Institute of Technology, Roorkee 247667, India
a r t i c l e i n f o
Article history:Received 13 January 2015Received in revised form3 September 2015Accepted 10 September 2015Available online xxx
Keywords:Cavitation rateEfficiency lossFrancis turbineCFX
* Corresponding author.E-mail address: [email protected] (P.P. Gohil)
http://dx.doi.org/10.1016/j.energy.2015.09.0420360-5442/© 2015 Elsevier Ltd. All rights reserved.
a b s t r a c t
Erosion due to cavitation in hydro turbines is one of the reasons for component failure that costs a lot tothe hydro power plants. Inception and development of cavitation depend upon different parameters suchas atmospheric pressure, suction head, velocity of flow, temperature, gas content in the liquid andoperating hours of the turbine. Parameters generally considered for design of a turbine and are used topredict cavitation could be different at actual site. The cavitation in hydro turbine is predicted duringmodel testing and correlated with specific speed. However the erosion and efficiency decay due tocavitation phenomena of turbines are too complex to stimulate which depends on other operatingconditions at site.
Under the present study, an attempt has been made to carry out a numerical analysis to investigate theeffect of temperature, suction head and flow velocity on cavitation in a Francis turbine by using CFX code.The experimental investigation has been carried out to validate the numerical method by visualizationtechnique. Using numerical data obtained during analysis for different considered parameters, correla-tions are developed for efficiency loss and cavitation rate in Francis turbine as a function of these pa-rameters i.e., temperature, suction head and flow velocity.
© 2015 Elsevier Ltd. All rights reserved.
1. Introduction
Francis and Kaplan turbines basically reaction turbines aresuitable formedium and lowhead hydro power sites. Application ofFrancis turbine has the higher percentile in all continents [1,2].Small hydro power projects have potential to meet power re-quirements of remote and isolated areas and these plants do notassociate the problems of deforestation and resettlement. Thesefactors make small hydro projects attractive renewable source ofpower generation [3]. In India, a hydro power plant having capacityup to 25 MW is classified as SHP (small hydro power). The man-agement of the large and small hydro power plants for achievingmaximum efficiency with time is an important factor, but the plantcomponents like turbine show the declining performance after afew years of operation as they get several damages due to manyreasons like as erosion due to silt, cavitation, corrosion and fatigue.
One of the significant reasons is cavitation. According to Ber-noulli's principles, an increase in velocity in a fluid is accompanied
.
by a decrease in pressure. If at any point liquid flows into a regionwhere the pressure is reduced to vapor pressure, the liquid boilsand bubble formation takes place locally and when these bubblesreach to areas of higher pressure, they suddenly a collapse. Thisprocess is called cavitation. It produces high pressure pulses, whensuch collapse takes place adjacent to solid walls continually and athigh frequency. The material in that area gets damaged due topitting of solid surfaces. It causes the problem of noise, vibration indraft tubes and trailing edge of turbine blades and drop in efficiency[4]. Leading edge cavitation, traveling bubble cavitation, von Kar-man vortex cavitation and draft tube swirl are the main forms ofcavitation that can arise in Francis turbines. The cavitation numberused for determining the region where cavitation takes place inreaction turbines is called the Thoma cavitation coefficient (s) orThoma plant factor (sp) and expressed as;
s ¼ (Ha e Hv � Hs)/H (1)
where Ha is the atmospheric pressure head, Hv is the vapor pres-sure in corresponding to the water temperature, Hs is the suctionpressure at the outlet of reaction turbine or height of the turbinerunner above the tail water surface, H is the working head of the
Nomenclature
A erosion factor [e]b number of blade [e]B value of atmospheric pressure less vapor pressure at
tail water [N/m2]Cf Plant use factor [e]D turbine throat diameter [m]E specific energy [m2/s2]g acceleration due to gravity [m/s2]H working head [m]Ha atmospheric head [m]Hs suction head [m]Hv vapor pressure head [m]I erosion depth [mm]Ic cavitation intensity [e]lc cavity length [m]P erosive power [W]p pressure [Pa]
pa atmospheric pressure [Pa]pv vapor pressure [Pa]R turbine revised runner factor [e]S submergence height [m]SE material strain energy [e]g specific weight of fluid [N/m3]St Strouhal number relating to vortex shedding [e]t operation time [s]U∞ upstream flow velocity [m/s]Um peripheral speed of model turbine [m/s]Ur peripheral speed of prototype turbine [m/s]V velocity [m/s]a guide vane opening position [degree]dij Kronecker number [e]m dynamic viscosity [m2/s]mt turbulent viscosity [m2/s]r density of fluid [kg/m3]rm mixture density [kg/m3]
P.P. Gohil, R.P. Saini / Energy 93 (2015) 613e624614
turbine. In order to have cavitation free operation of turbine, theparameter s should be greater than critical cavitation coefficient(sc) which is generally determined by the designer/manufacturingof the turbine. Cavitation is not possible to eliminate completely,however it should be minimized and reduced within acceptablelimits. The following empirical relationship is used for obtainingthe value of sc, for Francis turbine [5].
sc ¼ 0.625 � (Ns/380.78)2 (2)
where Ns is the specific speed of the turbine. The runner design hasa clear influence on the cavitation phenomena but there are twoother important parameters which influence its inception anddevelopment; the machine setting level and the operation at off-design conditions [6]. The cavitation is a complex flow phenome-non and it could not be avoided under off design condition.Traditionally, the studies for cavitation completely rely on experi-mental model testing, which usually is very difficult, timeconsuming and costly. The rapid development in the CFD(Computational Fluid Dynamics) with computing power along fullgraphics plays an important role in conducting inner flow filedanalyses in the early design process. CFD provides a cost effectiveand accurate alternative to model testing with variations on thesimulation being performed quickly, offering obvious advantages.Furthermore, it allows engineers to test systems in a virtualenvironment.
In advancement of CFD technology, CFX code employed Ray-leighePlesset (ReP) equation for cavitation analysis. It is widelyused for the numerical modeling of complex real cavitating flows.Researchers have validated the CFX code in hydro machinery anddifferent hydrofoils under cavitation and they presented a goodagreement of results compared with experimental data. Themethods of cavitation simulation based on NaviereStroke equationhave received increasing attention due to their superiority inphysical modeling and computational capabilities for cavitationproblem [7].
A number of studies were carried out on various aspects ofcavitation phenomena viz; cavitation erosion, efficiency prediction,vapor volume fraction, frequency in unstable hydraulic behavior,pressure pulsation, cavitation vibration, noise, rotating cavitationand cavitation bubble collapse [8e17,20e22]. Different types ofcavitation phenomena and their causes in hydro machines were
discussed under some studies [6,8]. Furthermore, visualization ofcavitation is becoming an important aspect of cavitation research inmodel testing [23e25].
A few studies were carried out on the development of erosionmodels [9,18,19] for hydraulic turbines and hydrofoils based oncertain assumptions and field study.
Maekawa et al. [9] developed the relationship between the in-tensity of cavitation and the progress of erosion. They conductedthe cavitation erosion acceleration test using special test equip-ment. The cavitation intensity was measured using impulse pres-sure sensors at three different points and found that relates tocavitation intensity is 6th power of peripheral speed, as expressedas;
I/t ¼ A � (Ic/SE) � (Ur/Um)6 (3)
The empirical equation of the erosive power produced by aleading edge cavity based on 2D hydrofoil proposed by Avellan et al.[18], is given below;
P ¼ 0.5 r � F(Cpmax þ s) � St � U3∞ � lc (4)
where F(Cpmaxþ s) is a characteristic function of hydrofoil withinfluence of s (cavitation number) and Cpmax is the maximumpressure coefficient. Gorden [19] suggested the correlationwhich isbased on analysis of turbine cavitation data obtained from 729numbers of hydro turbines. The cavitation erosion rate or weightloss in kg is an expressed as;
W ¼ 2.178m � d2 (5)
where m ¼ 0.45V2b � 0.56 þ 2.3Cf � S e B e R; V is velocity in m/s,b is the number of blades, Cf is plant use factor, S is submergenceheight in m, B is barometric pressure in m, R is turbine reviserunner factor. Further, Xavier et al. [26] developed a correlation forcavitation intensity, having an exponent value of velocity as 6.7.Meulen and J. H. J [27] found that the intensity of the emittedcavitation luminescence with the exponent value of velocity be-tween 3.9 and 7.2. Stinebring et al. [28] reported that the pittingrate scales with 6th power of velocity in the case of hydrofoil. Basedon some study [29] it is reported that cavitation erosion inspectionson a turbine may cost US $5000 in manpower and up to US $50 per
P.P. Gohil, R.P. Saini / Energy 93 (2015) 613e624 615
MWh as revenue loss in energy production due to machinedowntime. Energy production losses are much more for these longoutages.
The detailed knowledge about the existence, extent, behavior,correlation of cavitation and its effect with operating parametersare required during the initial design as well as operating stage ofturbine to avoid or minimize the cavitation. However, prediction ofparameters related to actual site condition and correlate to themwith the phenomena of cavitation erosion and efficiency decay istoo complex to stimulate.
In order to predict the efficiency loss and cavitation rate underthe effect of cavitation influencing critical parameters of tempera-ture, suction head and flow velocity, a prototype of Francis turbinehaving a rated capacity of 200 kW has been considered in thepresent investigation. It is a medium specific speed turbine and thespecification of the turbine is given in Table 1. Under this study, anumerical investigation has been carried out for unsteady (tran-sient) viscous flow, turbulence SST (Shear Stress Transport) modeland two phase cavitating flow model. The analysis is based on thehomogeneous mixture approach, with a RayleighePlesset equationusing ANSYS CFX code.
Based on the data generated by performing an extensive nu-merical study of different values of cavitation influencing criticalparameters, correlations have been developed for normalized ef-ficiency loss and cavitation rate of a Francis turbine. The developedcorrelations may be useful for the plant operators and designers.
2. Numerical methodology
In order to carry out the CFD analysis, mathematical equationsused are discussed under this part of the paper.
2.1. Governing equations
A homogeneous approximation to the two phases (water andvapor) flow is adopted, considering the cavitating flow behavior asa single on, where two phases allocate the same velocity andpressure fields. The governing equations for the turbulent mixtureflow are described by the following set of equations:
Continuity equation:
vrmvt
þ v�rmvj
�vxj
¼ 0 (6)
Momentum conservation equation:
vrmvivt
þ v�rmvivj
�vxj
¼� vpvxi
þ v
vxj
"ðmþ mtÞ
vvivxj
þ vvjvxi
� 23vukvxk
dij
!# (7)
The liquidevapor mass transfer due to cavitation governed by
Table 1Parameters of Francis turbine.
Sr. No. Parameter Value
1 Rated power [kW] 2002 Rated flow rate [m3/s] 0.8503 Rated head [m] 24.254 Rotational speed [rpm] 7505 Number of runner blade [e] 156 Number of guide vane [e] 127 Number of stay vane [e] 128 Diameter of runner [mm] 465
the vapor volume fraction transport is expressed by the followingequation:
vðavrvÞvt
þ v�avrvvj
�vxj
¼ Re � Rc (8)
where rv is the vapor density, av is the vapor volume fraction, Reand Rc are the mass transfer rates correspond to the evaporationand condensation during the cavitation process respectively.
The mixture density rm and the mixture dynamic viscosity m aredefined as;
rm ¼ rvav þ r1ð1� avÞ (9)
m ¼ mvav þ m1ð1� avÞ (10)
where r1 is the liquid density, and mv and m1 are the vapor viscosityand liquid viscosity respectively.
2.2. Turbulence model
Shear Stress model is one of the most accurate two equations(keε and keu) models for the separation prediction of flow. Theequation used in the SST model for the mixture can be given as;
mmT ¼ rma1km
maxða1um; SmF2Þ(11)
where k is the turbulent kinetic energy, u is the turbulent fre-quency, F2 is the blending function, mT is the turbulent viscosity andS is the shear stress.
2.3. Cavitation model
The RayleighePlesset model is implemented in the multiphaseframework as an inter-phase mass transfer model in CFX code. Forcavitating flow, typically the homogeneous multiphase model isused. The cavitation model based on the equation of Rayleighe-Plesset is applied to cavitation rate estimation. The Rayleighe-Plesset equation describing the growth of a gas bubble in a liquid isgiven by:
RBd2RB
dt2þ 32
�dRB
dt
�2
þ 2srfRB
¼ pv � prf
(12)
where RB represents the bubble radius, rf is the liquid density and sis the surface tension coefficient between the liquid and vapor. Thisis derived from amechanical balance, assuming no thermal barriersto bubble growth. Neglecting the second order terms (which isappropriate for low oscillation frequencies) and the surface tension,the final expression has been derived assuming bubble growth(vaporization). It can be generalized to include condensation asfollows:
_
_mcav ¼
8>>>>><>>>>>:
�Fe3 rnuc ð1 � aÞ rv
RB
ffiffiffiffiffiffiffiffiffiffiffiffiffiffiffiffiffiffi23Pv � Prl
sif P<Pv
Fc3a rvRB
ffiffiffiffiffiffiffiffiffiffiffiffiffiffiffiffiffiffi23P� Pvrl
sif P>Pv
(13)
where Pv is the liquid vapor pressure, rnuc is a nucleation site vol-ume fraction, RB is the radius of a nucleation site, F is an empiricalfactor depend on condensation and vaporization designed fordifferent rates. A detailed description of multiphase models and
P.P. Gohil, R.P. Saini / Energy 93 (2015) 613e624616
modeling of cavitation could be found in ANSYS CFX solver theory[30]. The RayleighePlesset cavitation model validation is used aspresented by various researchers [21,31e35].
3. Physical model and numerical analysis method
3.1. Physical model
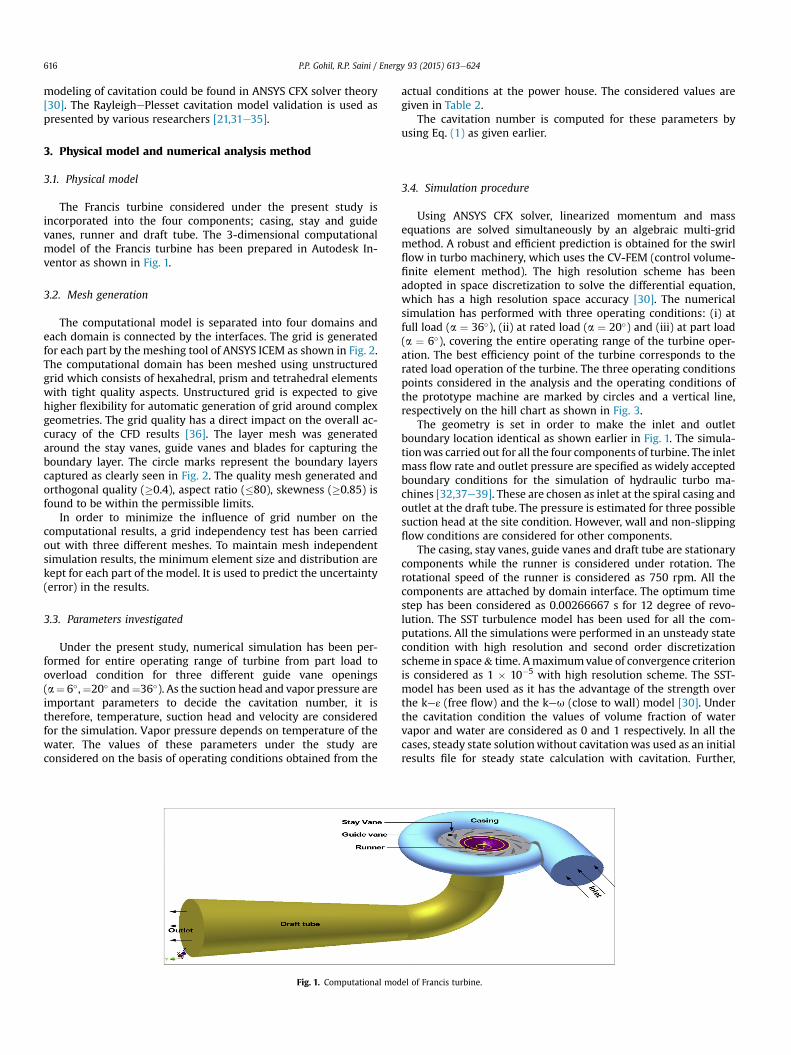
The Francis turbine considered under the present study isincorporated into the four components; casing, stay and guidevanes, runner and draft tube. The 3-dimensional computationalmodel of the Francis turbine has been prepared in Autodesk In-ventor as shown in Fig. 1.
3.2. Mesh generation
The computational model is separated into four domains andeach domain is connected by the interfaces. The grid is generatedfor each part by the meshing tool of ANSYS ICEM as shown in Fig. 2.The computational domain has been meshed using unstructuredgrid which consists of hexahedral, prism and tetrahedral elementswith tight quality aspects. Unstructured grid is expected to givehigher flexibility for automatic generation of grid around complexgeometries. The grid quality has a direct impact on the overall ac-curacy of the CFD results [36]. The layer mesh was generatedaround the stay vanes, guide vanes and blades for capturing theboundary layer. The circle marks represent the boundary layerscaptured as clearly seen in Fig. 2. The quality mesh generated andorthogonal quality (�0.4), aspect ratio (�80), skewness (�0.85) isfound to be within the permissible limits.
In order to minimize the influence of grid number on thecomputational results, a grid independency test has been carriedout with three different meshes. To maintain mesh independentsimulation results, the minimum element size and distribution arekept for each part of the model. It is used to predict the uncertainty(error) in the results.
3.3. Parameters investigated
Under the present study, numerical simulation has been per-formed for entire operating range of turbine from part load tooverload condition for three different guide vane openings(a¼ 6�,¼20� and¼36�). As the suction head and vapor pressure areimportant parameters to decide the cavitation number, it istherefore, temperature, suction head and velocity are consideredfor the simulation. Vapor pressure depends on temperature of thewater. The values of these parameters under the study areconsidered on the basis of operating conditions obtained from the
Fig. 1. Computational mod
actual conditions at the power house. The considered values aregiven in Table 2.
The cavitation number is computed for these parameters byusing Eq. (1) as given earlier.
3.4. Simulation procedure
Using ANSYS CFX solver, linearized momentum and massequations are solved simultaneously by an algebraic multi-gridmethod. A robust and efficient prediction is obtained for the swirlflow in turbo machinery, which uses the CV-FEM (control volume-finite element method). The high resolution scheme has beenadopted in space discretization to solve the differential equation,which has a high resolution space accuracy [30]. The numericalsimulation has performed with three operating conditions: (i) atfull load (a ¼ 36�), (ii) at rated load (a ¼ 20�) and (iii) at part load(a ¼ 6�), covering the entire operating range of the turbine oper-ation. The best efficiency point of the turbine corresponds to therated load operation of the turbine. The three operating conditionspoints considered in the analysis and the operating conditions ofthe prototype machine are marked by circles and a vertical line,respectively on the hill chart as shown in Fig. 3.
The geometry is set in order to make the inlet and outletboundary location identical as shown earlier in Fig. 1. The simula-tionwas carried out for all the four components of turbine. The inletmass flow rate and outlet pressure are specified as widely acceptedboundary conditions for the simulation of hydraulic turbo ma-chines [32,37e39]. These are chosen as inlet at the spiral casing andoutlet at the draft tube. The pressure is estimated for three possiblesuction head at the site condition. However, wall and non-slippingflow conditions are considered for other components.
The casing, stay vanes, guide vanes and draft tube are stationarycomponents while the runner is considered under rotation. Therotational speed of the runner is considered as 750 rpm. All thecomponents are attached by domain interface. The optimum timestep has been considered as 0.00266667 s for 12 degree of revo-lution. The SST turbulence model has been used for all the com-putations. All the simulations were performed in an unsteady statecondition with high resolution and second order discretizationscheme in space& time. Amaximumvalue of convergence criterionis considered as 1 � 10�5 with high resolution scheme. The SST-model has been used as it has the advantage of the strength overthe keε (free flow) and the keu (close to wall) model [30]. Underthe cavitation condition the values of volume fraction of watervapor and water are considered as 0 and 1 respectively. In all thecases, steady state solutionwithout cavitationwas used as an initialresults file for steady state calculation with cavitation. Further,
el of Francis turbine.
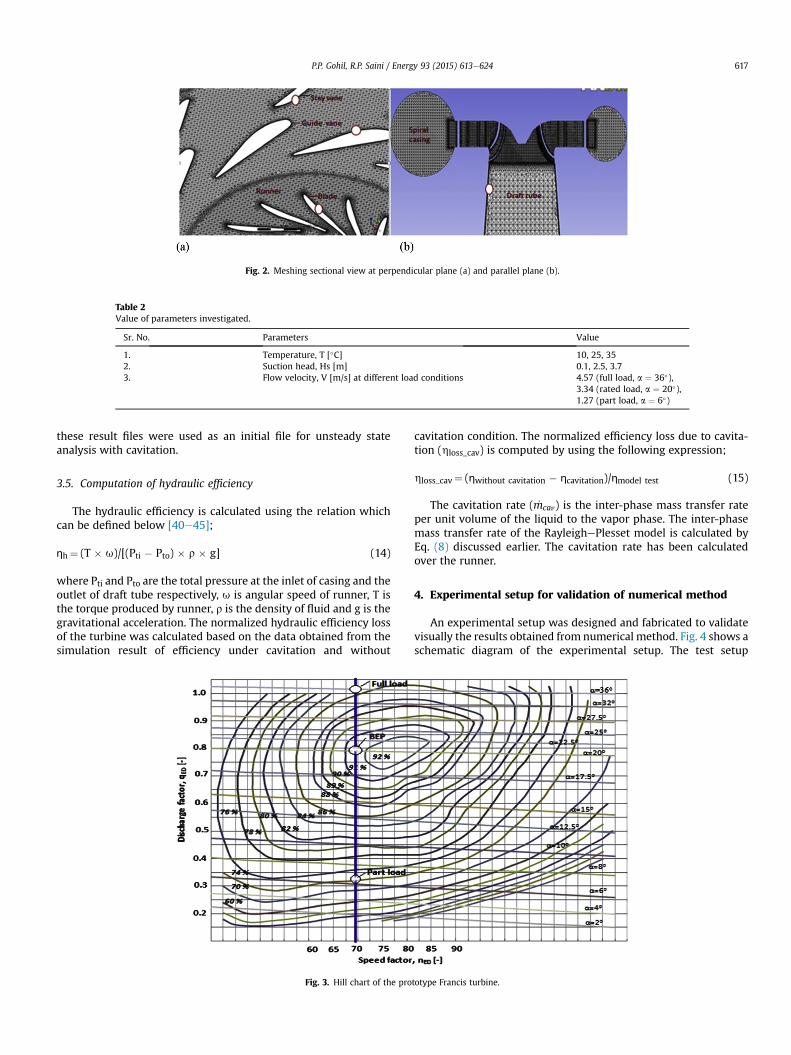
Fig. 2. Meshing sectional view at perpendicular plane (a) and parallel plane (b).
Table 2Value of parameters investigated.
Sr. No. Parameters Value
1. Temperature, T [�C] 10, 25, 352. Suction head, Hs [m] 0.1, 2.5, 3.73. Flow velocity, V [m/s] at different load conditions 4.57 (full load, a ¼ 36�),
3.34 (rated load, a ¼ 20�),1.27 (part load, a ¼ 6�)
P.P. Gohil, R.P. Saini / Energy 93 (2015) 613e624 617
these result files were used as an initial file for unsteady stateanalysis with cavitation.
3.5. Computation of hydraulic efficiency
The hydraulic efficiency is calculated using the relation whichcan be defined below [40e45];
ƞh¼ (T � u)/[(Pti � Pto) � r � g] (14)
where Pti and Pto are the total pressure at the inlet of casing and theoutlet of draft tube respectively, u is angular speed of runner, T isthe torque produced by runner, r is the density of fluid and g is thegravitational acceleration. The normalized hydraulic efficiency lossof the turbine was calculated based on the data obtained from thesimulation result of efficiency under cavitation and without
Fig. 3. Hill chart of the pro
cavitation condition. The normalized efficiency loss due to cavita-tion (hloss_cav) is computed by using the following expression;
hloss_cav¼ (ƞwithout cavitation � ƞcavitation)/ƞmodel test (15)
The cavitation rate ( _mcav) is the inter-phase mass transfer rateper unit volume of the liquid to the vapor phase. The inter-phasemass transfer rate of the RayleighePlesset model is calculated byEq. (8) discussed earlier. The cavitation rate has been calculatedover the runner.
4. Experimental setup for validation of numerical method
An experimental setup was designed and fabricated to validatevisually the results obtained from numerical method. Fig. 4 shows aschematic diagram of the experimental setup. The test setup
totype Francis turbine.
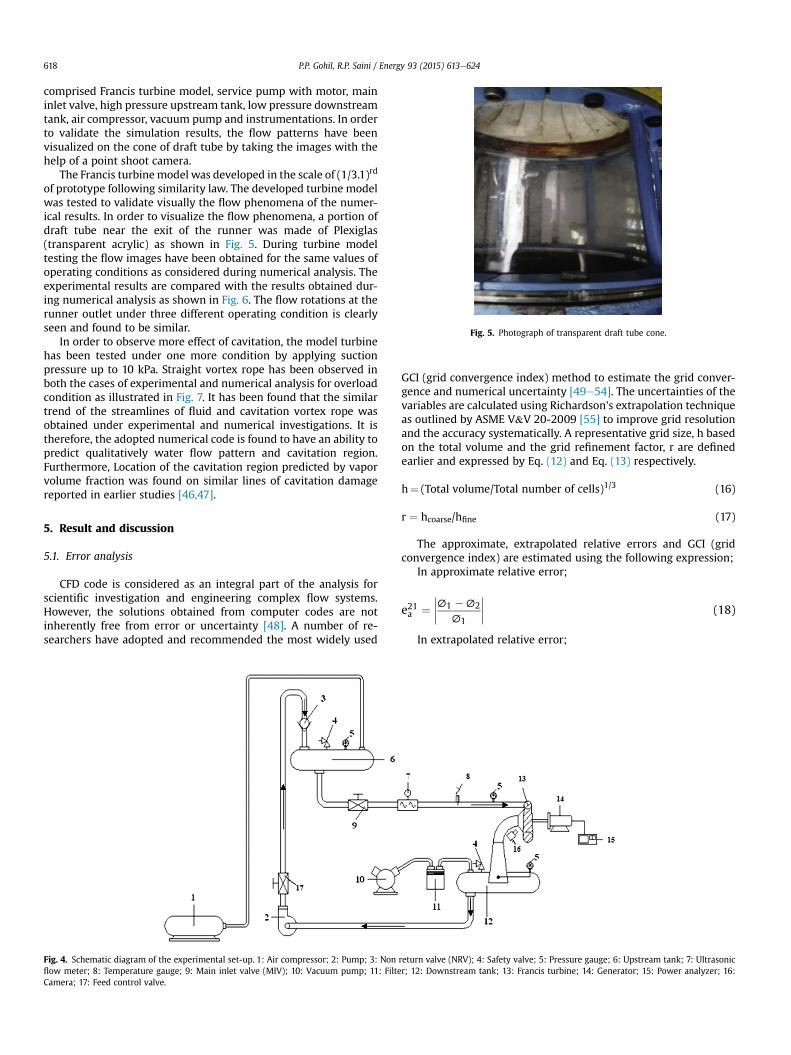
Fig. 5. Photograph of transparent draft tube cone.
P.P. Gohil, R.P. Saini / Energy 93 (2015) 613e624618
comprised Francis turbine model, service pump with motor, maininlet valve, high pressure upstream tank, low pressure downstreamtank, air compressor, vacuum pump and instrumentations. In orderto validate the simulation results, the flow patterns have beenvisualized on the cone of draft tube by taking the images with thehelp of a point shoot camera.
The Francis turbinemodel was developed in the scale of (1/3.1)rd
of prototype following similarity law. The developed turbine modelwas tested to validate visually the flow phenomena of the numer-ical results. In order to visualize the flow phenomena, a portion ofdraft tube near the exit of the runner was made of Plexiglas(transparent acrylic) as shown in Fig. 5. During turbine modeltesting the flow images have been obtained for the same values ofoperating conditions as considered during numerical analysis. Theexperimental results are compared with the results obtained dur-ing numerical analysis as shown in Fig. 6. The flow rotations at therunner outlet under three different operating condition is clearlyseen and found to be similar.
In order to observe more effect of cavitation, the model turbinehas been tested under one more condition by applying suctionpressure up to 10 kPa. Straight vortex rope has been observed inboth the cases of experimental and numerical analysis for overloadcondition as illustrated in Fig. 7. It has been found that the similartrend of the streamlines of fluid and cavitation vortex rope wasobtained under experimental and numerical investigations. It istherefore, the adopted numerical code is found to have an ability topredict qualitatively water flow pattern and cavitation region.Furthermore, Location of the cavitation region predicted by vaporvolume fraction was found on similar lines of cavitation damagereported in earlier studies [46,47].
5. Result and discussion
5.1. Error analysis
CFD code is considered as an integral part of the analysis forscientific investigation and engineering complex flow systems.However, the solutions obtained from computer codes are notinherently free from error or uncertainty [48]. A number of re-searchers have adopted and recommended the most widely used
Fig. 4. Schematic diagram of the experimental set-up. 1: Air compressor; 2: Pump; 3: Nonflow meter; 8: Temperature gauge; 9: Main inlet valve (MIV); 10: Vacuum pump; 11: FilteCamera; 17: Feed control valve.
GCI (grid convergence index) method to estimate the grid conver-gence and numerical uncertainty [49e54]. The uncertainties of thevariables are calculated using Richardson's extrapolation techniqueas outlined by ASME V&V 20-2009 [55] to improve grid resolutionand the accuracy systematically. A representative grid size, h basedon the total volume and the grid refinement factor, r are definedearlier and expressed by Eq. (12) and Eq. (13) respectively.
h¼ (Total volume/Total number of cells)1/3 (16)
r ¼ hcoarse/hfine (17)
The approximate, extrapolated relative errors and GCI (gridconvergence index) are estimated using the following expression;
In approximate relative error;
e21a ¼����∅1 �∅2
∅1
���� (18)
In extrapolated relative error;
return valve (NRV); 4: Safety valve; 5: Pressure gauge; 6: Upstream tank; 7: Ultrasonicr; 12: Downstream tank; 13: Francis turbine; 14: Generator; 15: Power analyzer; 16:
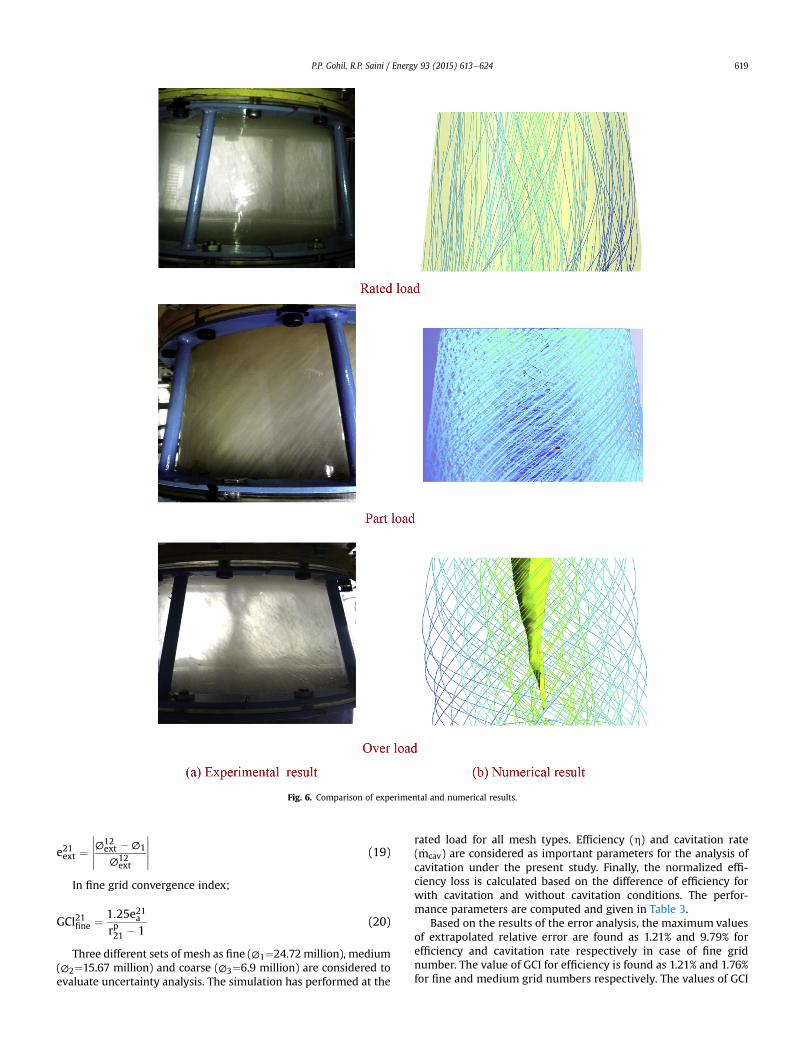
Fig. 6. Comparison of experimental and numerical results.
P.P. Gohil, R.P. Saini / Energy 93 (2015) 613e624 619
e21ext ¼����∅12
ext �∅112
���� (19)
� ∅ext�In fine grid convergence index;
GCI21fine ¼ 1:25e21arp21 � 1
(20)
Three different sets of mesh as fine (∅1¼24.72 million), medium(∅2¼15.67 million) and coarse (∅3¼6.9 million) are considered toevaluate uncertainty analysis. The simulation has performed at the
rated load for all mesh types. Efficiency (h) and cavitation rate( _mcav) are considered as important parameters for the analysis ofcavitation under the present study. Finally, the normalized effi-ciency loss is calculated based on the difference of efficiency forwith cavitation and without cavitation conditions. The perfor-mance parameters are computed and given in Table 3.
Based on the results of the error analysis, the maximum valuesof extrapolated relative error are found as 1.21% and 9.79% forefficiency and cavitation rate respectively in case of fine gridnumber. The value of GCI for efficiency is found as 1.21% and 1.76%for fine and medium grid numbers respectively. The values of GCI
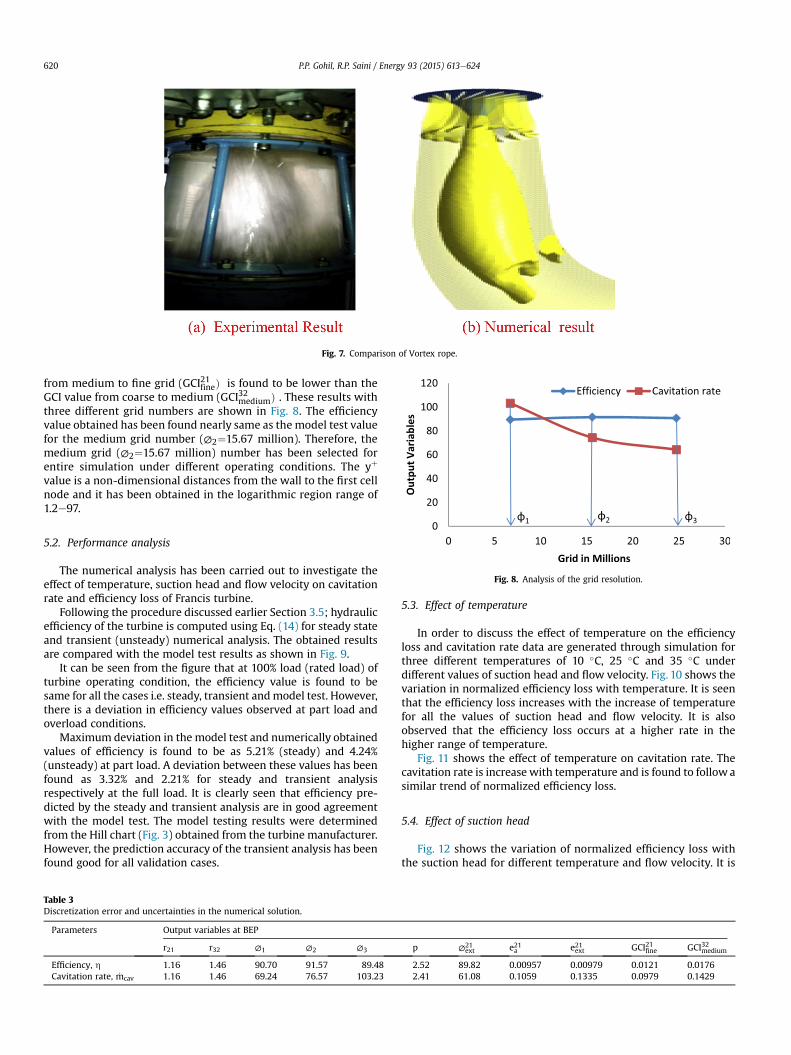
Fig. 7. Comparison of Vortex rope.
P.P. Gohil, R.P. Saini / Energy 93 (2015) 613e624620
from medium to fine grid (GCI21fineÞ is found to be lower than theGCI value from coarse to medium (GCI32mediumÞ . These results withthree different grid numbers are shown in Fig. 8. The efficiencyvalue obtained has been found nearly same as the model test valuefor the medium grid number (∅2¼15.67 million). Therefore, themedium grid (∅2¼15.67 million) number has been selected forentire simulation under different operating conditions. The yþ
value is a non-dimensional distances from the wall to the first cellnode and it has been obtained in the logarithmic region range of1.2e97.
Fig. 8. Analysis of the grid resolution.
5.2. Performance analysis
The numerical analysis has been carried out to investigate theeffect of temperature, suction head and flow velocity on cavitationrate and efficiency loss of Francis turbine.
Following the procedure discussed earlier Section 3.5; hydraulicefficiency of the turbine is computed using Eq. (14) for steady stateand transient (unsteady) numerical analysis. The obtained resultsare compared with the model test results as shown in Fig. 9.
It can be seen from the figure that at 100% load (rated load) ofturbine operating condition, the efficiency value is found to besame for all the cases i.e. steady, transient andmodel test. However,there is a deviation in efficiency values observed at part load andoverload conditions.
Maximum deviation in the model test and numerically obtainedvalues of efficiency is found to be as 5.21% (steady) and 4.24%(unsteady) at part load. A deviation between these values has beenfound as 3.32% and 2.21% for steady and transient analysisrespectively at the full load. It is clearly seen that efficiency pre-dicted by the steady and transient analysis are in good agreementwith the model test. The model testing results were determinedfrom the Hill chart (Fig. 3) obtained from the turbine manufacturer.However, the prediction accuracy of the transient analysis has beenfound good for all validation cases.
Table 3Discretization error and uncertainties in the numerical solution.
Parameters Output variables at BEP
r21 r32 ∅1 ∅2 ∅3
Efficiency, h 1.16 1.46 90.70 91.57 89.48Cavitation rate, _mcav 1.16 1.46 69.24 76.57 103.23
5.3. Effect of temperature
In order to discuss the effect of temperature on the efficiencyloss and cavitation rate data are generated through simulation forthree different temperatures of 10 �C, 25 �C and 35 �C underdifferent values of suction head and flow velocity. Fig. 10 shows thevariation in normalized efficiency loss with temperature. It is seenthat the efficiency loss increases with the increase of temperaturefor all the values of suction head and flow velocity. It is alsoobserved that the efficiency loss occurs at a higher rate in thehigher range of temperature.
Fig. 11 shows the effect of temperature on cavitation rate. Thecavitation rate is increase with temperature and is found to follow asimilar trend of normalized efficiency loss.
5.4. Effect of suction head
Fig. 12 shows the variation of normalized efficiency loss withthe suction head for different temperature and flow velocity. It is
p ∅21ext e21a e21ext GCI21fine GCI32medium
2.52 89.82 0.00957 0.00979 0.0121 0.01762.41 61.08 0.1059 0.1335 0.0979 0.1429
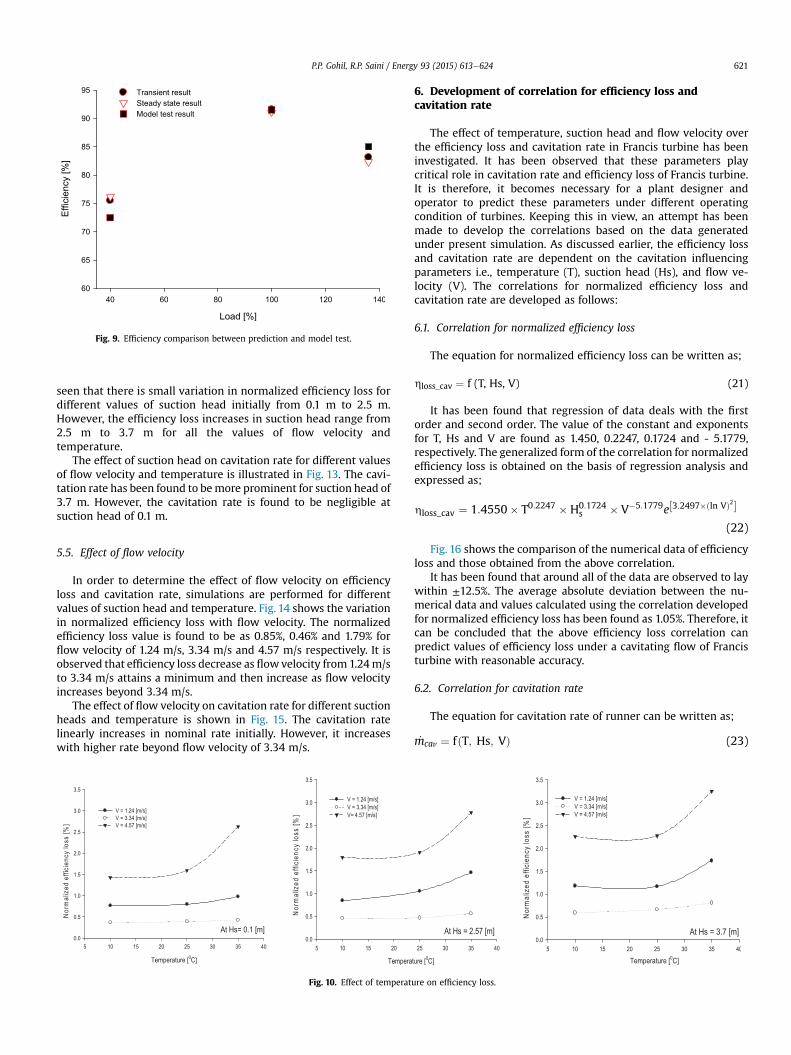
Fig. 9. Efficiency comparison between prediction and model test.
P.P. Gohil, R.P. Saini / Energy 93 (2015) 613e624 621
seen that there is small variation in normalized efficiency loss fordifferent values of suction head initially from 0.1 m to 2.5 m.However, the efficiency loss increases in suction head range from2.5 m to 3.7 m for all the values of flow velocity andtemperature.
The effect of suction head on cavitation rate for different valuesof flow velocity and temperature is illustrated in Fig. 13. The cavi-tation rate has been found to bemore prominent for suction head of3.7 m. However, the cavitation rate is found to be negligible atsuction head of 0.1 m.
5.5. Effect of flow velocity
In order to determine the effect of flow velocity on efficiencyloss and cavitation rate, simulations are performed for differentvalues of suction head and temperature. Fig. 14 shows the variationin normalized efficiency loss with flow velocity. The normalizedefficiency loss value is found to be as 0.85%, 0.46% and 1.79% forflow velocity of 1.24 m/s, 3.34 m/s and 4.57 m/s respectively. It isobserved that efficiency loss decrease as flow velocity from1.24m/sto 3.34 m/s attains a minimum and then increase as flow velocityincreases beyond 3.34 m/s.
The effect of flow velocity on cavitation rate for different suctionheads and temperature is shown in Fig. 15. The cavitation ratelinearly increases in nominal rate initially. However, it increaseswith higher rate beyond flow velocity of 3.34 m/s.
Fig. 10. Effect of temperat
6. Development of correlation for efficiency loss andcavitation rate
The effect of temperature, suction head and flow velocity overthe efficiency loss and cavitation rate in Francis turbine has beeninvestigated. It has been observed that these parameters playcritical role in cavitation rate and efficiency loss of Francis turbine.It is therefore, it becomes necessary for a plant designer andoperator to predict these parameters under different operatingcondition of turbines. Keeping this in view, an attempt has beenmade to develop the correlations based on the data generatedunder present simulation. As discussed earlier, the efficiency lossand cavitation rate are dependent on the cavitation influencingparameters i.e., temperature (T), suction head (Hs), and flow ve-locity (V). The correlations for normalized efficiency loss andcavitation rate are developed as follows:
6.1. Correlation for normalized efficiency loss
The equation for normalized efficiency loss can be written as;
hloss_cav ¼ f (T, Hs, V) (21)
It has been found that regression of data deals with the firstorder and second order. The value of the constant and exponentsfor T, Hs and V are found as 1.450, 0.2247, 0.1724 and - 5.1779,respectively. The generalized form of the correlation for normalizedefficiency loss is obtained on the basis of regression analysis andexpressed as;
hloss_cav ¼ 1:4550� T0:2247 � H0:1724s � V�5:1779e½3:2497�ðln VÞ2�
(22)
Fig. 16 shows the comparison of the numerical data of efficiencyloss and those obtained from the above correlation.
It has been found that around all of the data are observed to laywithin ±12.5%. The average absolute deviation between the nu-merical data and values calculated using the correlation developedfor normalized efficiency loss has been found as 1.05%. Therefore, itcan be concluded that the above efficiency loss correlation canpredict values of efficiency loss under a cavitating flow of Francisturbine with reasonable accuracy.
6.2. Correlation for cavitation rate
The equation for cavitation rate of runner can be written as;
_mcav ¼ fðT; Hs; VÞ (23)
ure on efficiency loss.
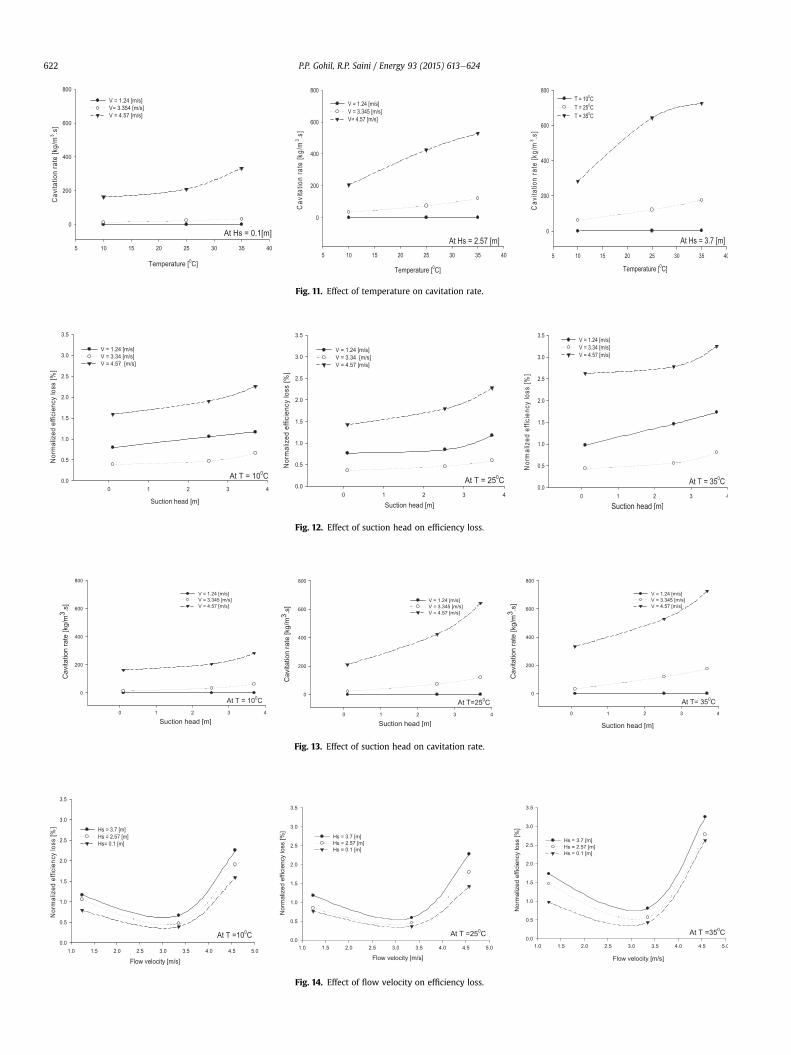
Fig. 11. Effect of temperature on cavitation rate.
Fig. 12. Effect of suction head on efficiency loss.
Fig. 13. Effect of suction head on cavitation rate.
Fig. 14. Effect of flow velocity on efficiency loss.
P.P. Gohil, R.P. Saini / Energy 93 (2015) 613e624622
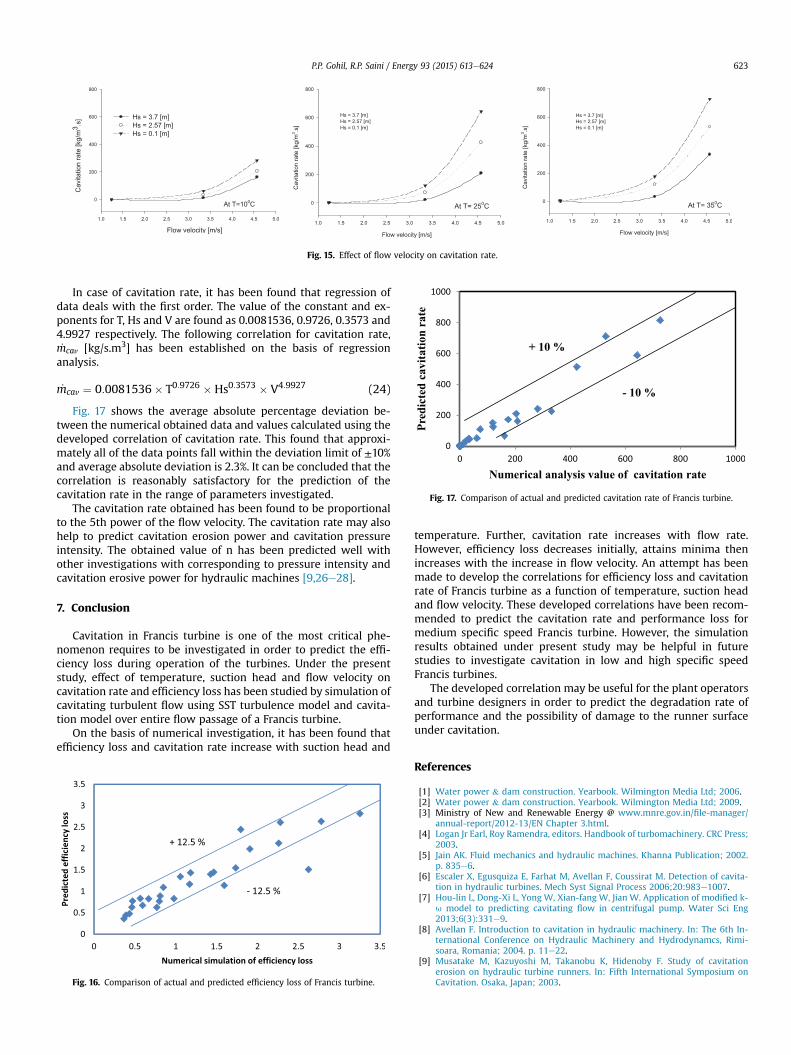
Fig. 15. Effect of flow velocity on cavitation rate.
Fig. 17. Comparison of actual and predicted cavitation rate of Francis turbine.
P.P. Gohil, R.P. Saini / Energy 93 (2015) 613e624 623
In case of cavitation rate, it has been found that regression ofdata deals with the first order. The value of the constant and ex-ponents for T, Hs and V are found as 0.0081536, 0.9726, 0.3573 and4.9927 respectively. The following correlation for cavitation rate,_mcav [kg/s.m3] has been established on the basis of regressionanalysis.
_mcav ¼ 0:0081536� T0:9726 � Hs0:3573 � V4:9927 (24)
Fig. 17 shows the average absolute percentage deviation be-tween the numerical obtained data and values calculated using thedeveloped correlation of cavitation rate. This found that approxi-mately all of the data points fall within the deviation limit of ±10%and average absolute deviation is 2.3%. It can be concluded that thecorrelation is reasonably satisfactory for the prediction of thecavitation rate in the range of parameters investigated.
The cavitation rate obtained has been found to be proportionalto the 5th power of the flow velocity. The cavitation rate may alsohelp to predict cavitation erosion power and cavitation pressureintensity. The obtained value of n has been predicted well withother investigations with corresponding to pressure intensity andcavitation erosive power for hydraulic machines [9,26e28].
7. Conclusion
Cavitation in Francis turbine is one of the most critical phe-nomenon requires to be investigated in order to predict the effi-ciency loss during operation of the turbines. Under the presentstudy, effect of temperature, suction head and flow velocity oncavitation rate and efficiency loss has been studied by simulation ofcavitating turbulent flow using SST turbulence model and cavita-tion model over entire flow passage of a Francis turbine.
On the basis of numerical investigation, it has been found thatefficiency loss and cavitation rate increase with suction head and
Fig. 16. Comparison of actual and predicted efficiency loss of Francis turbine.
temperature. Further, cavitation rate increases with flow rate.However, efficiency loss decreases initially, attains minima thenincreases with the increase in flow velocity. An attempt has beenmade to develop the correlations for efficiency loss and cavitationrate of Francis turbine as a function of temperature, suction headand flow velocity. These developed correlations have been recom-mended to predict the cavitation rate and performance loss formedium specific speed Francis turbine. However, the simulationresults obtained under present study may be helpful in futurestudies to investigate cavitation in low and high specific speedFrancis turbines.
The developed correlation may be useful for the plant operatorsand turbine designers in order to predict the degradation rate ofperformance and the possibility of damage to the runner surfaceunder cavitation.
References
[1] Water power & dam construction. Yearbook. Wilmington Media Ltd; 2006.[2] Water power & dam construction. Yearbook. Wilmington Media Ltd; 2009.[3] Ministry of New and Renewable Energy @ www.mnre.gov.in/file-manager/
annual-report/2012-13/EN Chapter 3.html.[4] Logan Jr Earl, Roy Ramendra, editors. Handbook of turbomachinery. CRC Press;
2003.[5] Jain AK. Fluid mechanics and hydraulic machines. Khanna Publication; 2002.
p. 835e6.[6] Escaler X, Egusquiza E, Farhat M, Avellan F, Coussirat M. Detection of cavita-
tion in hydraulic turbines. Mech Syst Signal Process 2006;20:983e1007.[7] Hou-lin L, Dong-Xi L, Yong W, Xian-fang W, Jian W. Application of modified k-
u model to predicting cavitating flow in centrifugal pump. Water Sci Eng2013;6(3):331e9.
[8] Avellan F. Introduction to cavitation in hydraulic machinery. In: The 6th In-ternational Conference on Hydraulic Machinery and Hydrodynamcs, Rimi-soara, Romania; 2004. p. 11e22.
[9] Musatake M, Kazuyoshi M, Takanobu K, Hidenoby F. Study of cavitationerosion on hydraulic turbine runners. In: Fifth International Symposium onCavitation. Osaka, Japan; 2003.
P.P. Gohil, R.P. Saini / Energy 93 (2015) 613e624624
[10] Dupont Ph, Caron J-F, Avellan F, Bourdon P, Lavigne P, Farhat M, et al. Cavi-tation erosion prediction on Francis turbines part 2: model tests and flowanalysis. In: Proceedings of the 18th IAHR Symposium on Hydraulic Ma-chinery and Cavitation, Valencia, Spain, vol. 1; 1996. p. 574e83.
[11] Ahmed A. Numerical prediction of cavitation free zone operation for Francisturbine. ASME; 2009. p. 1e5.
[12] Bernad S, Muntean S, Susan-Resiga RF, Anton I. Numerical simulation of two-phase cavitating flow in turbomachines. Int Conf Hydraul Mach Hydrodyn2004;4:439e46.
[13] Lipej A. Numerical prediction of cavitation in water turbines. 2002. p. 1e6.[14] Yexiang X, Zhengwei W, Zongguo Y, Mingan L, Ming X, Dingyou L. Numerical
analysis of unsteady flow under high-head operating conditions in Francisturbine. Eng Comput 2010;27:365e86.
[15] Wang F, Li X, Ma J, Yang M, Zhu Y. Experimental investigation of characteristicfrequency in unsteady hydraulic behaviour of a large hydraulic turbine.J Hydrodyn Ser B 2009;21:12e9.
[16] Wu Y, Liu S, Dou H-S, Zhang L. Simulations of unsteady cavitating turbulentflow in a Francis turbine using the RANS method and the improved mixturemodel of two-phase flows. Eng Comput 2010;27:235e50.
[17] Zhang H, Zhang L. Numerical simulation of cavitating turbulent flow in a highhead Francis turbine at part load operation with OpenFOAM. Proc Eng2012;31:156e65.
[18] Avellan F, Dupont Ph, Farhat M. Cavitation erosion power. In: 1st ASME-JSMEFluids Engineering Conference, Protland, USA; 1991.
[19] Gordon JL. Hydroturbine cavitation erosion. J Energy Eng 1993;118:194e208.[20] Christope A. Analysis and prediction of yield reduction francis turbine cavi-
tation bubble. Ph.D. Thesis. EPFL; 1998.[21] Wang, Brennen CE. Shock wave development in the collapse of a cloud of
bubbles. ASME FED; 1994. p. 15e9.[22] Tomaz R, Matevz D, Brane S, Marko H, Igo K. An investigation of the relation
between acoustic emission, vibration, noise and cavitation structures on aKaplan turbine. Trans ASME 2007;129:1112e22.
[23] Dular M, Bachert B, Stoffel B, Sirok B. Relationship between cavitation struc-tures and cavitation damage. Wear 2004;257(11):1176e84.
[24] Kern I, Rus T, Hocevar M, Djelic V, Sirok B. Study of topological structures ofcavitation with dynamical analysis and computer aided visualization. In: 20thIAHR WG1 Meeting, Brno; 1999.
[25] Pereira F, Avellan F, Dorey JM. Cavitation erosion: statistical analysis oftransient cavities. In: Int. Symp. on CavitationdCav'95, Deauville; 1995.
[26] Escaler X, Farhat M, Egusquiza E, Avellan F. Dynamics and intensity of erosivepartial cavitation. J Fluids Eng 2007;129:886.
[27] Van der Meulen JHJ. The relation between noise and luminescence fromcavitation on a hydrofoil. In: Arndt REA, Webb DR, editors. Proc. Joint ASCE/ASME Conf. on Cavitation in Hydraulic Structures and Turbomachinery (FED25). ASME; 1986. p. 149e59.
[28] Stinebring D, Holl JW, Arndt REA. Two aspects of cavitation damage in theincubation zone: scaling by energy considerations and leading edge damage.J Fluids Eng 1980;102:481e5.
[29] Bourdon P, Farhat M, Mossoba Y, Lavigne P. Hydro turbine profitability andcavitation erosion. In: ASCE Conference of Waterpower '99-Hydro's Future:Technology, Markets, and Policy; 1999.
[30] ANSYS Inc. ANSYS CFX-Solver theory guide. 2010.[31] Bakir F, Rey R, Gerber AG, Belamri T, Hutchinson B. Numerical and experi-
mental investigations of the cavitating behaviour of an inducer. Int J RotatMach 2004;10:15e25.
[32] Zhang R, Hong-xun C. Numerical analysis of cavitation within slanted axial-flow pump. J Hydrodyn Ser B 2013;25(5):663e72.
[33] Liu S, Zhang L, Nishi M, Wu Y. Cavitating turbulent flow simulation in a Francisturbine based on mixture model. J Fluids Eng 2009;131. 051302-1-6.
[34] Jost D, Lipej A. Numerical prediction of non-cavitating and cavitating vortexrope in a Francis turbine draft tube. Strojni�ski Vestn. J Mech Eng 2011;57:445e56.
[35] Liu JT, Wu YL, Liu SH. Study of unsteady cavitation flow of a pump-turbine atpump mode. IOP Conf Ser Mater Sci Eng 2013;52. 062021-1-8.
[36] Hirsch C. Numerical computation of internal and external flows: the funda-mentals of computational fluid dynamics. Butterworth-Heinemann; 2007.
[37] Sudsuansee T, Nontakaew U, Yodchai T. Simulation of leading edge cavitationon bulb turbine. Songklanakarin J Sci Technol 2011;33(1):51e60.
[38] Zhang L, Liu JT, Wu YL, Liu SH. Numerical simulation of cavitating turbulentflow through a Francis turbine. IOP Conf Ser Earth Environ Sci 2012;5(6).
[39] Gohil PP, Saini RP. CFD: numerical analysis and performance prediction inFrancis turbine. In: 1st International Conference on Non Conventional Energy(ICONCE 2014), vol. 1. Kelyani, West Bangle: IEEE; 2014. p. 94e7.
[40] IEC 60193. Standard. Hydraulic turbines, storage pumps and pump-turbines-model acceptance tests. Geneva: International Elecrotechnical Commission;1999.
[41] Liu S, Qingguang C. Unsteady cavitating turbulence flow simulation in aKaplan turbine, vol. 52(66); 2007.
[42] Yu-cheng P, Xi-yang C, Yan C, Guo-xiang H. Numerical study of cavitation onthe surface of the guide vane in three gorges hydropower unit. J Hydrodyn SerB 2010;22(5):703e8.
[43] Jain S, Saini RP, Kumar A. CFD approach for prediction of efficiency of Francisturbine, IGHEM. AHEC IIT Roorkee 2010;1:1e7.
[44] Derakhshan Sh, Mostafavi A. Optimization of GAMM Francis turbine runner.World Acad Sci Eng Technol 2011;59:717e23.
[45] Carija Z, Mrsa Z, Fucak S. Validation of Francis turbine CFD simulation. Stro-jarstvo 2008;50(1):5e14.
[46] Belxona @ Protects Francis turbine runners from cavitation @ http://khia.belzona.com/EN/view.aspx?id¼901.
[47] Brennan CE. Hydrodynamics of pumps. Oxford University Press; 1994.[48] Freitas CJ. The issue of numerical uncertainty. In: Second International Con-
ference on CFD in the Minerals and Process Industries CSIRO. Melbourne,Australia; 1999. p. 29e34.
[49] Richardson LF, Gaunt JA. The deferred approach to the limit. Philos. Trans. R.Soc. London, Ser A 1927;226:299e361.
[50] Roache PJ. Conservatism of the GCI in finite volume computations on steadystate fluid flow and heat transfer. ASME J Fluids Eng 2003;125(4):731e2.
[51] Broadhead BL, Rearden BT, Hopper CM, Wagschal JJ, Parks CV. Sensitivity- anduncertainty-based criticality safety validation techniques. Nucl Sci Eng2004;146:340e66.
[52] Eça L, Hoekstra M, Roache PJ. Verification of calculations: an overview of the2nd Lisbon Workshop, Second Workshop on CFD Uncertainty Analysis. In.AIAA Computational Fluid Dynamics Conference, Miami, FL, Jun., AIAA PaperNo. 2007-4089.
[53] Roache PJ. A method for uniform reporting of grid refinement studies. In:Celik, et al., editors. Proceedings of Quantification of Uncertainty in Compu-tation Fluid Dynamics. ASME Fluids Engineering Division Spring Meeting.Washington, D.C.: ASME; June 23e24, 1993. p. 158.
[54] Stem F, Wilson RV, Coleman HW. Comprehensive approach to verification andvalidation of CFD simulations e part 1: methodology and procedures. J FluidsEng 2001;123(4):793e802.
[55] An American National Standard. Standard for verification and validation incomputational fluid dynamics and heat transfer. The American Society ofMechanical Engineers; ASME V&V 20e2009.


![Visualization of Unsteady Behavior of Cavitation in ... · cavitation state, transition-cavitation state, and super-cavitation state in the orifice throat [5]. Under relative high](https://img.pdfslide.us/doc/110x75/5b4f673e7f8b9a166e8c4c74/visualization-of-unsteady-behavior-of-cavitation-in-cavitation-state-transition-cavitation.jpg)