Embed Size (px)
Citation preview
This is a repository copy of Effect of temperature on the bond behaviour of GFRP bars in concrete.
White Rose Research Online URL for this paper:https://eprints.whiterose.ac.uk/153991/
Version: Accepted Version
Article:
Solyom, S., Di Benedetti, M. orcid.org/0000-0001-7870-1323, Guadagnini, M. orcid.org/0000-0003-2551-2187 et al. (1 more author) (2020) Effect of temperature on the bond behaviour of GFRP bars in concrete. Composites Part B: Engineering, 183. 107602. ISSN 1359-8368
https://doi.org/10.1016/j.compositesb.2019.107602
Article available under the terms of the CC-BY-NC-ND licence (https://creativecommons.org/licenses/by-nc-nd/4.0/).
[email protected]://eprints.whiterose.ac.uk/
Reuse
This article is distributed under the terms of the Creative Commons Attribution-NonCommercial-NoDerivs (CC BY-NC-ND) licence. This licence only allows you to download this work and share it with others as long as you credit the authors, but you can’t change the article in any way or use it commercially. More information and the full terms of the licence here: https://creativecommons.org/licenses/
Takedown
If you consider content in White Rose Research Online to be in breach of UK law, please notify us by emailing [email protected] including the URL of the record and the reason for the withdrawal request.
1
1 EFFECT OF TEMPERATURE ON THE BOND BEHAVIOUR OF GFRP
2 BARS IN CONCRETE
3 Sandor Solyom a,*, Matteo Di Benedetti b, Maurizio Guadagnini c, György L. Balázs a
4 a Department of Construction Materials and Technologies, Budapest University of Technology and
5 Economics, Műegyetem rkp 3, 1111 Budapest, Hungary
6 b Multidisciplinary Engineering Education, The University of Sheffield, The Diamond, 32 Leavygreave
7 Road, Sheffield S3 7RD, UK
8 c Department of Civil and Structural Engineering, The University of Sheffield, Mappin Street, Sheffield, S1
9 3JD, UK
10 * Corresponding Author: email: [email protected]
11
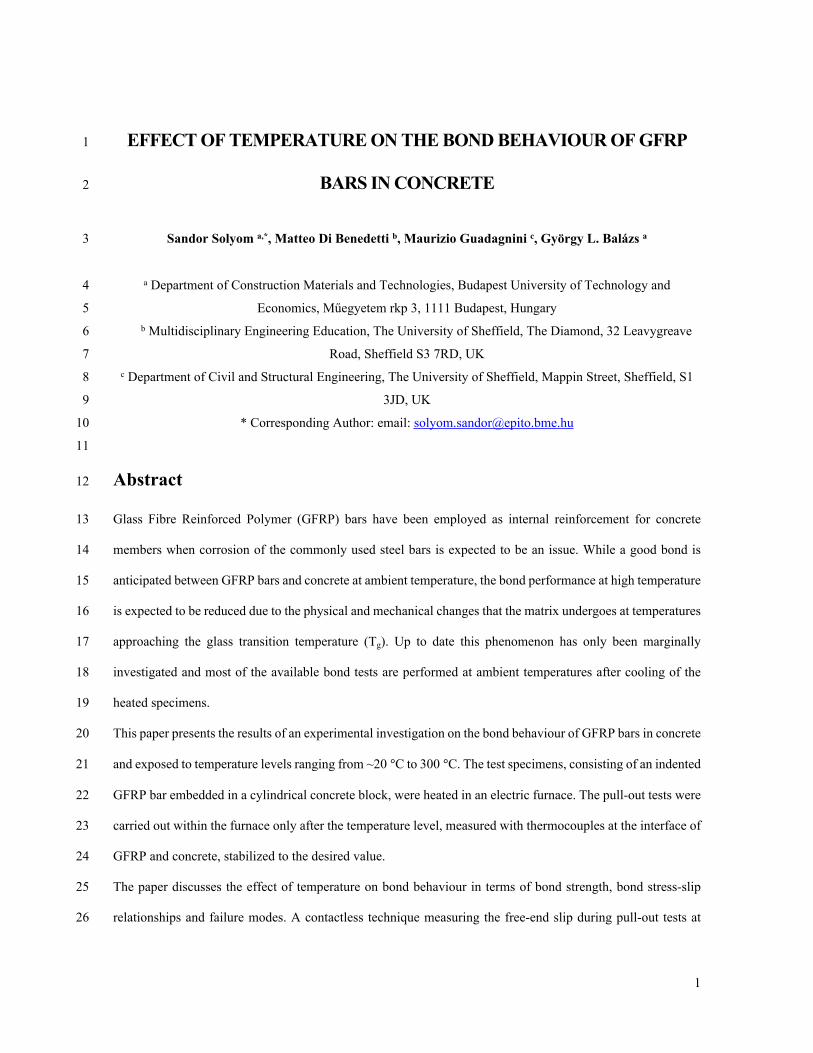
12 Abstract
13 Glass Fibre Reinforced Polymer (GFRP) bars have been employed as internal reinforcement for concrete
14 members when corrosion of the commonly used steel bars is expected to be an issue. While a good bond is
15 anticipated between GFRP bars and concrete at ambient temperature, the bond performance at high temperature
16 is expected to be reduced due to the physical and mechanical changes that the matrix undergoes at temperatures
17 approaching the glass transition temperature (Tg). Up to date this phenomenon has only been marginally
18 investigated and most of the available bond tests are performed at ambient temperatures after cooling of the
19 heated specimens.
20 This paper presents the results of an experimental investigation on the bond behaviour of GFRP bars in concrete
21 and exposed to temperature levels ranging from ~20 °C to 300 °C. The test specimens, consisting of an indented
22 GFRP bar embedded in a cylindrical concrete block, were heated in an electric furnace. The pull-out tests were
23 carried out within the furnace only after the temperature level, measured with thermocouples at the interface of
24 GFRP and concrete, stabilized to the desired value.
25 The paper discusses the effect of temperature on bond behaviour in terms of bond strength, bond stress-slip
26 relationships and failure modes. A contactless technique measuring the free-end slip during pull-out tests at

2
27 high temperatures was developed and its effectiveness demonstrated. Finally, the experimental results were
28 used to calibrate the parameters of the two most widely used analytical models: mBPE and CMR.
29
30 Keywords: A. Glass fibres, B. High-temperature properties, C. Analytical modelling, D. Mechanical testing,
31 Bond
32
33 1. INTRODUCTION
34 One of the key aspects of RC members design is the interaction between concrete and reinforcement [1].
35 Adequate bond between concrete and reinforcement is necessary to ensure that sufficient force transfer occurs
36 between the concrete and the reinforcement and composite action can be relied upon.
37 Steel bars are commonly used as reinforcement, however, in application where steel corrosion may be an issue,
38 Glass Fibre Reinforced Polymers (GFRP) have been increasingly used as an alternative [2–4]. The bond
39 mechanisms of GFRP bars in concrete are different than that of conventional steel bars due to different material
40 (i.e. coefficient of thermal expansion (CTE)) and mechanical properties (i.e. modulus of elasticity, lack of
41 yielding) as well as different surface profiles [5–7].
42 Numerous factors affecting the bond behaviour of GFRP bars to concrete have been extensively studied. In
43 particular, as concrete strength [6,8] and concrete cover [7,9] increase the bond strength increases, however
44 increasing the GFRP bar diameter [5,10] and the embedment length [11,12] of the bar decreases the mean bond
45 strength. In addition, studies have showed that the surface profile of the bars (i.e. indented, sand coated, etc.)
46 [13,14], the test methodology (i.e. pull-out, bending pull-out, direct tension pull-out or push-through bond
47 tests)[15–17] and the environmental conditions [18,19] also affect the bond performance.
48 The critical temperatures of GFRP bars are lower than those of steel, due to softening of the polymer matrix at
49 temperature levels close to their glass transition temperature (Tg) [20]. The bond mechanism of GFRP to
50 concrete relies on the shear transfer through the bar surface, thus greatly depending on the soundness of the bar
51 coating [13,21,22] which makes the bond susceptible to damage at elevated temperature. Nonetheless, to date,
52 the only few studies that investigated the effect of temperature on the bond behaviour [15,18,30,31,19,23–29]
53 of FRP bars present some limitations. In most cases, the investigated temperature levels were below or only
3
54 marginally higher than Tg [18,19,26–28] and some of the test were performed almost two decades ago results
55 for recently manufactures FRP bars are not available [23,24]. In addition, unexpected failure modes [28] were
56 recorded, possibly caused by the scant literature to draw upon leading to an inaccurate specimen design rather
57 than by the effects of pull-out at high temperature. This lack of an acknowledged and univocal test methodology,
58 including an effective strategy to measure slip at high temperature, had even wider repercussions. In fact, most
59 of the tests were performed after the heated specimens cooled down [18,19,25–27,29–31], thus investigating
60 the residual bond capacity, which can be greatly different than the bond strength at high temperature.
61
62 Bond stress-slip relationships
63 The relationship between bond stress and slip has proved to be the most effective way to study the bond
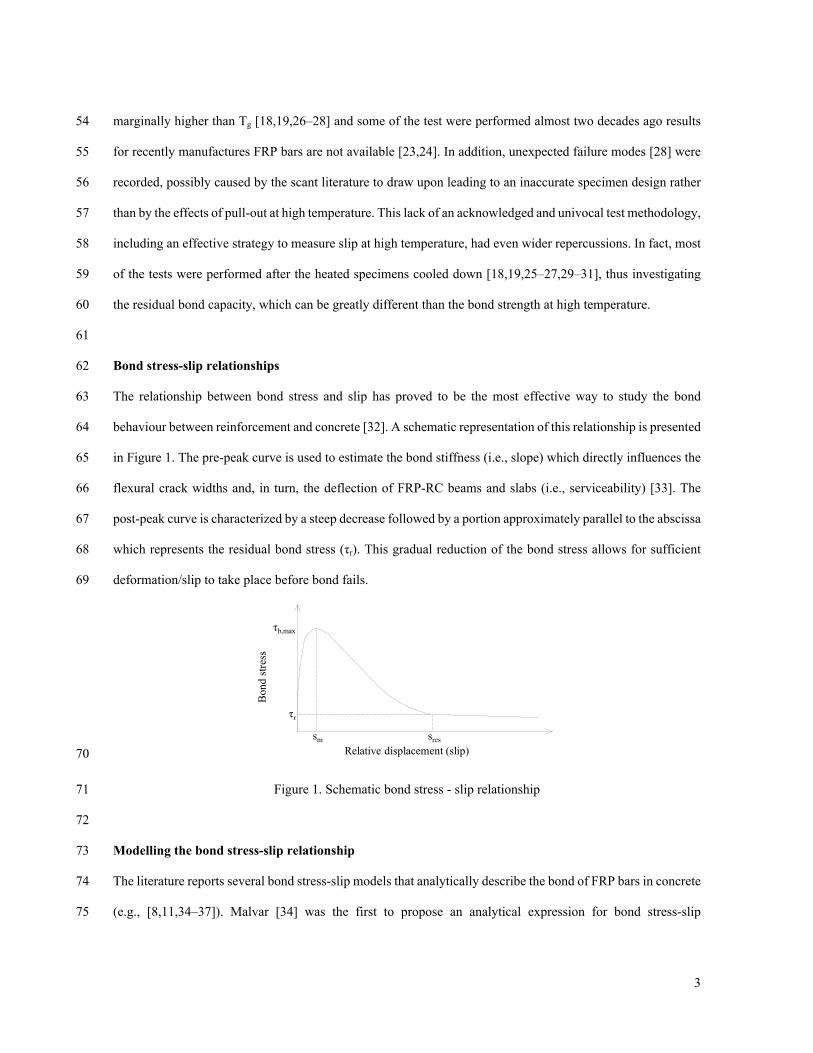
64 behaviour between reinforcement and concrete [32]. A schematic representation of this relationship is presented
65 in Figure 1. The pre-peak curve is used to estimate the bond stiffness (i.e., slope) which directly influences the
66 flexural crack widths and, in turn, the deflection of FRP-RC beams and slabs (i.e., serviceability) [33]. The
67 post-peak curve is characterized by a steep decrease followed by a portion approximately parallel to the abscissa
68 which represents the residual bond stress (τr). This gradual reduction of the bond stress allows for sufficient
69 deformation/slip to take place before bond fails.
70 Relative displacement (slip)
Bon
d st
ress
τb,max
τr
sm sres
71 Figure 1. Schematic bond stress - slip relationship
72
73 Modelling the bond stress-slip relationship
74 The literature reports several bond stress-slip models that analytically describe the bond of FRP bars in concrete
75 (e.g., [8,11,34–37]). Malvar [34] was the first to propose an analytical expression for bond stress-slip
4
76 relationship of FRP bars. However, due to the numerous parameters to be experimentally calibrated and the
77 inaccurate representation of bond when slip is zero [35], the model was soon replaced by more efficient and
78 effective alternatives. The BPE model, developed by Eligehausen et al. [38] for deformed steel bars, was
79 adjusted for FRP bars by Cosenza et al. [36] and is referred to as modified BPE (mBPE) model. The
80 modification consisted of accounting for the linear elastic behaviour of the GFRP bar, thus omitting the plateau
81 typical of the second portion of the BPE model corresponding to steel yielding. Cosenza et al. [35] also proposed
82 a refined model limited to the pre-peak branch of the bond stress-slip curve (CMR model), based on the
83 consideration that most bond related phenomena occur at service loads (before peak bond stress).
84 mBPE model
85 In this model the equations for estimating the bond stresses [36] are described by Equations 1 to 3.
86 ascending branch (0 ≤ s ≤ sm) (1)𝜏𝑏 = 𝜏𝑏,𝑚𝑎𝑥( 𝑠𝑠𝑚)𝛼
87 descending branch (sm ≤ s ≤ sres) (2)𝜏𝑏 = 𝜏𝑏, 𝑚𝑎𝑥[1 ‒ 𝑝( 𝑠𝑠𝑚 ‒ 1)]
88 along the third branch (s ≥ sres) (3) 𝜏𝑏 = 𝜏𝑟89 where τb is the bond stress, s is the slip, τb,max is the maximum bond stress, sm is the slip corresponding to τb,max,
90 τr is the residual bond stress and sres is the slip corresponding to τr. The parameters α and p are calibrated by
91 curve fitting of experimental data considering that α must not be greater than 1 to be physically meaningful (α
92 = 0.4 for steel bars).
93 CMR model
94 The CMR model [35] analytically describes the ascending branch of the bond stress-slip relationship by
95 Equation 4:
96 (4)𝜏𝑏 = 𝜏𝑏,𝑚𝑎𝑥[1 ‒ 𝑒( ‒ 𝑠𝑠𝑟)]𝛽
97 β and sr are experimental parameters, sr cannot be less than zero.
98 While research is available for calibrating the aforementioned parameters [6,13,39] at ambient temperature (~20
99 °C), the effect of high temperature has not yet been accounted for.
5
100
101 2. RESEARCH SIGNIFICANCE
102 The objective of this research is to develop a robust framework to study the bond behaviour of GFRP bars at
103 elevated temperatures. To achieve this goal, a bespoke non-contact measurement system has been developed
104 and integrated within a well-established pull-out test methodology to reliably monitor the behaviour of
105 specimens exposed to simultaneous mechanical and thermal loading. Furthermore, the experimental results will
106 become part of a data set augmented over time and used for the calibration of analytical models (i.e., mBPE
107 and CMR) to predict the bond stress-slip relationship. The calibrated parameters can be adopted by researchers
108 and engineers to account for the effect of temperature on the bond behaviour of GFRP bars embedded in
109 concrete.
110
111 3. EXPERIMENTAL STUDY
112 Small-scale pull-out test specimens were chosen to investigate the bond behaviour of GFRP bars at elevated
113 temperature. In fact, despite resulting in a bond stress higher than those in concrete elements in most practical
114 conditions [40], the pull-out test proved to be an effective method to study the effects of different factors on
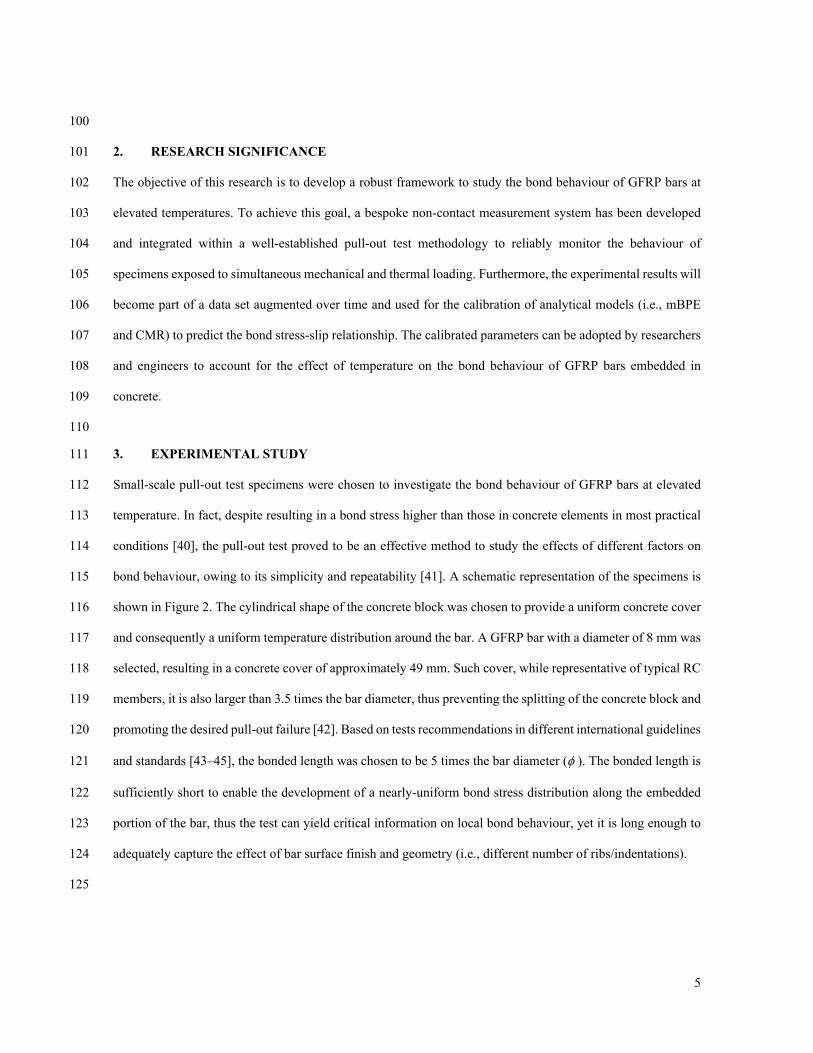
115 bond behaviour, owing to its simplicity and repeatability [41]. A schematic representation of the specimens is
116 shown in Figure 2. The cylindrical shape of the concrete block was chosen to provide a uniform concrete cover
117 and consequently a uniform temperature distribution around the bar. A GFRP bar with a diameter of 8 mm was
118 selected, resulting in a concrete cover of approximately 49 mm. Such cover, while representative of typical RC
119 members, it is also larger than 3.5 times the bar diameter, thus preventing the splitting of the concrete block and
120 promoting the desired pull-out failure [42]. Based on tests recommendations in different international guidelines
121 and standards [43–45], the bonded length was chosen to be 5 times the bar diameter ( ). The bonded length is
122 sufficiently short to enable the development of a nearly-uniform bond stress distribution along the embedded
123 portion of the bar, thus the test can yield critical information on local bond behaviour, yet it is long enough to
124 adequately capture the effect of bar surface finish and geometry (i.e., different number of ribs/indentations).
125
6
126100
5O
106
FRP bar
106
FRP bar
100-5O
Bon
ded
leng
thU
nbon
ded
leng
th
Section A-A
AA
O
Concreteblock
127 Figure 2. Schematic representation of pull-out test specimen (dimensions are in mm)
128
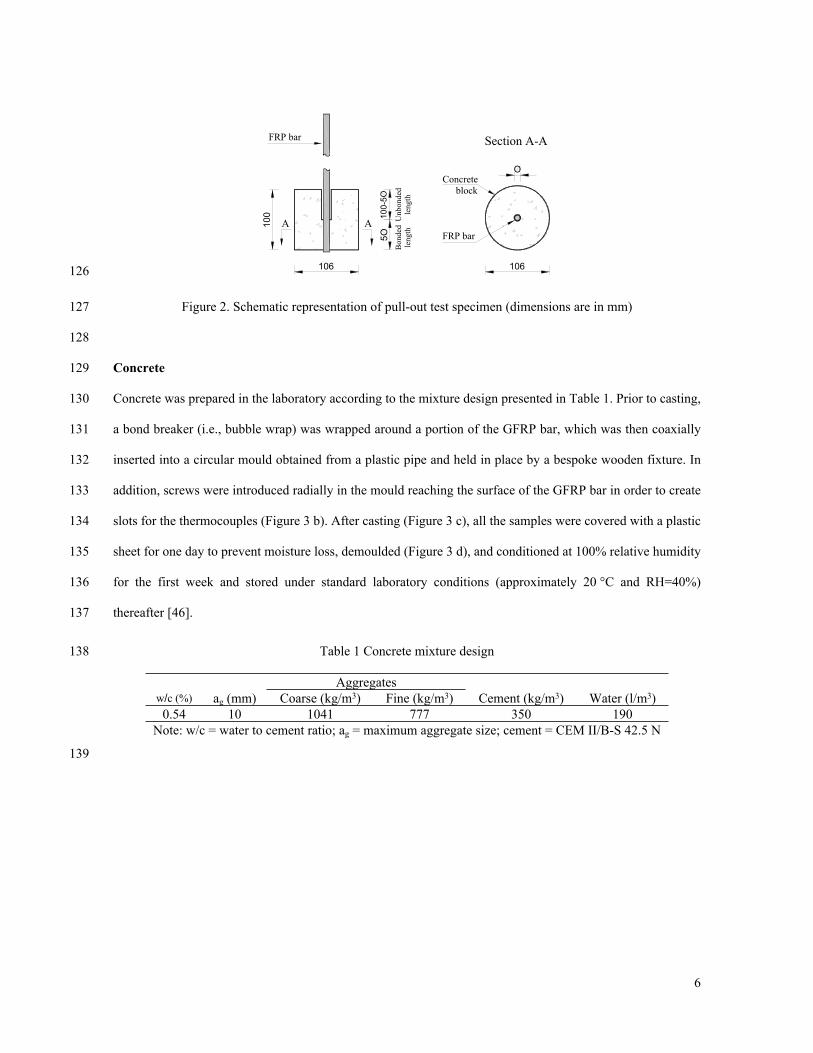
129 Concrete
130 Concrete was prepared in the laboratory according to the mixture design presented in Table 1. Prior to casting,
131 a bond breaker (i.e., bubble wrap) was wrapped around a portion of the GFRP bar, which was then coaxially
132 inserted into a circular mould obtained from a plastic pipe and held in place by a bespoke wooden fixture. In
133 addition, screws were introduced radially in the mould reaching the surface of the GFRP bar in order to create
134 slots for the thermocouples (Figure 3 b). After casting (Figure 3 c), all the samples were covered with a plastic
135 sheet for one day to prevent moisture loss, demoulded (Figure 3 d), and conditioned at 100% relative humidity
136 for the first week and stored under standard laboratory conditions (approximately 20 °C and RH=40%)
137 thereafter [46].
138 Table 1 Concrete mixture design
Aggregatesw/c (%) ag (mm) Coarse (kg/m3) Fine (kg/m3) Cement (kg/m3) Water (l/m3)0.54 10 1041 777 350 190
Note: w/c = water to cement ratio; ag = maximum aggregate size; cement = CEM II/B-S 42.5 N
139
7
140 (a) (b) (c) (d)
141 Figure 3. Details of pull-out test specimens: GFRP bar (a); moulds (b), before (c) and after (d) demoulding.
142
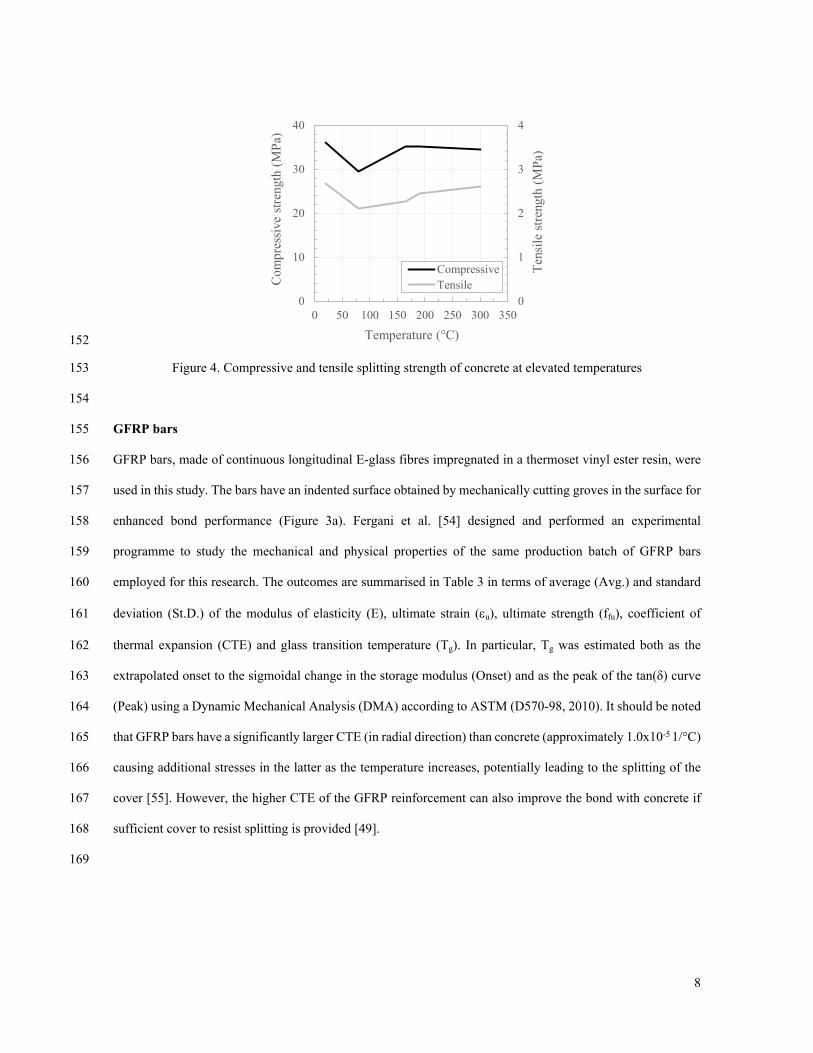
143 The concrete compressive strength (fc) and the tensile splitting strength (fct) of the specimens at the day of testing
144 were determined according to EN 12390-3:2009 [47] and EN 12390-6:2010 [48], respectively. The average
145 (Avg.) and the standard deviation (St.D.) of the mechanical properties at ambient temperature are presented in
146 Table 2. In addition, as the bond strength depends on the concrete strength [49,50], which, in turn, changes with
147 temperature [51,52], the concrete compressive and tensile splitting strengths were experimentally determined
148 for the same temperature levels as the pull-out tests. The results, plotted in Figure 4, are in line with those
149 available in the literature [23,51,53].
150 Table 2 Mechanical characteristics of concrete mixture at ambient temperature
fc fct
Type s N Avg. St.D. Type h d N Avg. St.D.(mm) (MPa) (MPa) (mm) (mm) (MPa) (MPa)
Cube 100 2 36.0 0.1 Cylinder 200 100 2 2.7 0.3Cube 150 3 38.7 0.4 Cylinder 300 150 3 3.6 -
Note: s = side; N = repetitions; h = height; d = diameter151
8
152
0
1
2
3
4
0
10
20
30
40
0 50 100 150 200 250 300 350
Ten
sile
str
engt
h (M
Pa)
Com
pres
sive
str
engt
h (M
Pa)
Temperature (°C)
CompressiveTensile
153 Figure 4. Compressive and tensile splitting strength of concrete at elevated temperatures
154
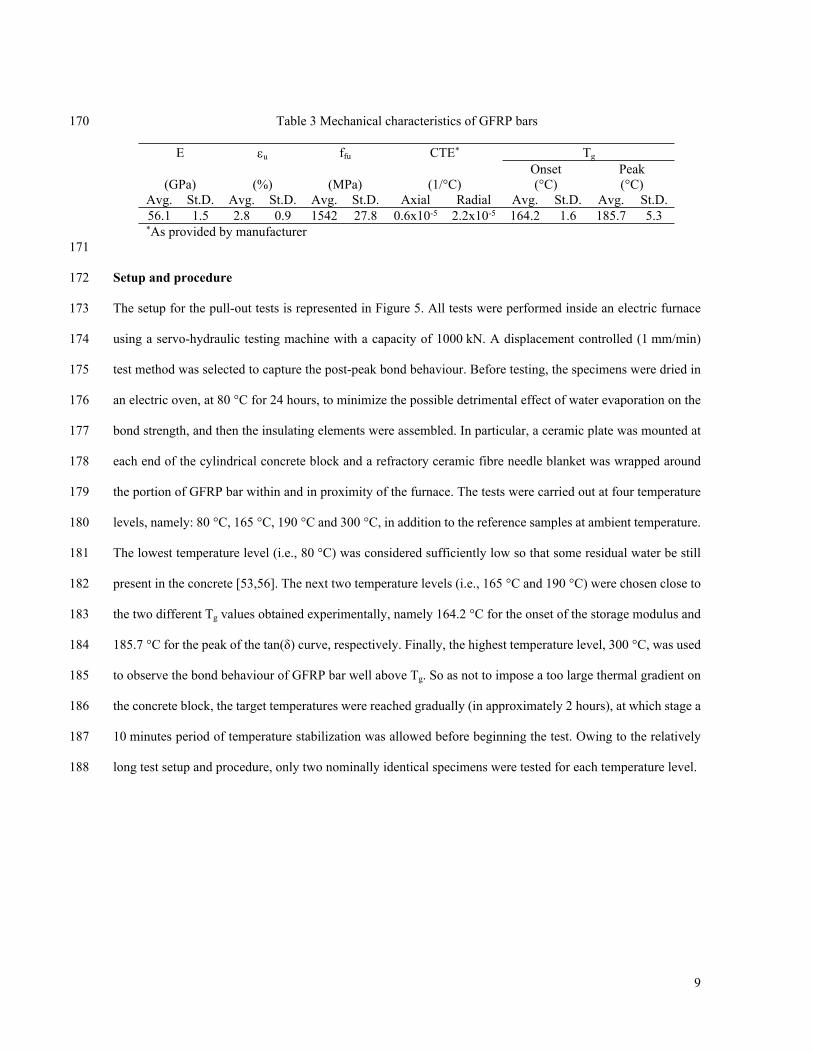
155 GFRP bars
156 GFRP bars, made of continuous longitudinal E-glass fibres impregnated in a thermoset vinyl ester resin, were
157 used in this study. The bars have an indented surface obtained by mechanically cutting groves in the surface for
158 enhanced bond performance (Figure 3a). Fergani et al. [54] designed and performed an experimental
159 programme to study the mechanical and physical properties of the same production batch of GFRP bars
160 employed for this research. The outcomes are summarised in Table 3 in terms of average (Avg.) and standard
161 deviation (St.D.) of the modulus of elasticity (E), ultimate strain (u), ultimate strength (ffu), coefficient of
162 thermal expansion (CTE) and glass transition temperature (Tg). In particular, Tg was estimated both as the
163 extrapolated onset to the sigmoidal change in the storage modulus (Onset) and as the peak of the tan(δ) curve
164 (Peak) using a Dynamic Mechanical Analysis (DMA) according to ASTM (D570-98, 2010). It should be noted
165 that GFRP bars have a significantly larger CTE (in radial direction) than concrete (approximately 1.0x10⁻⁵ 1/°C)
166 causing additional stresses in the latter as the temperature increases, potentially leading to the splitting of the
167 cover [55]. However, the higher CTE of the GFRP reinforcement can also improve the bond with concrete if
168 sufficient cover to resist splitting is provided [49].
169
9
170 Table 3 Mechanical characteristics of GFRP bars
E u ffu CTE* Tg
Onset Peak(GPa) (%) (MPa) (1/°C) (°C) (°C)
Avg. St.D. Avg. St.D. Avg. St.D. Axial Radial Avg. St.D. Avg. St.D.56.1 1.5 2.8 0.9 1542 27.8 0.6x10⁻⁵ 2.2x10⁻⁵ 164.2 1.6 185.7 5.3*As provided by manufacturer
171
172 Setup and procedure
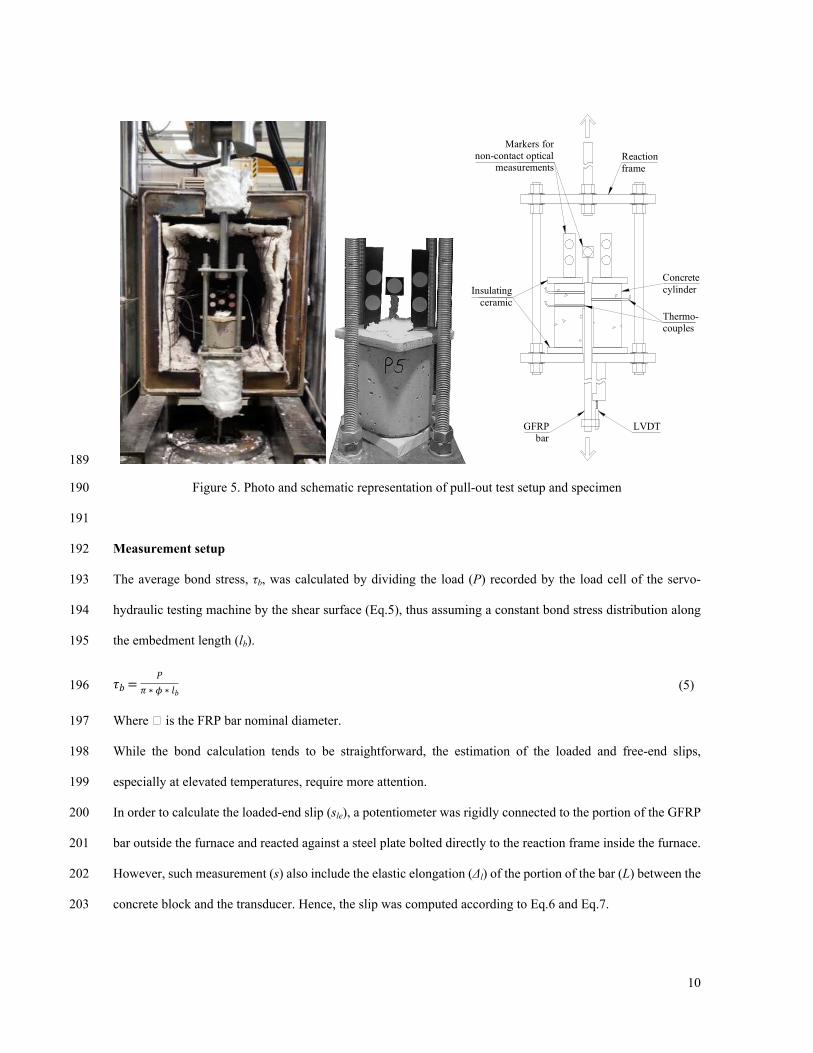
173 The setup for the pull-out tests is represented in Figure 5. All tests were performed inside an electric furnace
174 using a servo-hydraulic testing machine with a capacity of 1000 kN. A displacement controlled (1 mm/min)
175 test method was selected to capture the post-peak bond behaviour. Before testing, the specimens were dried in
176 an electric oven, at 80 °C for 24 hours, to minimize the possible detrimental effect of water evaporation on the
177 bond strength, and then the insulating elements were assembled. In particular, a ceramic plate was mounted at
178 each end of the cylindrical concrete block and a refractory ceramic fibre needle blanket was wrapped around
179 the portion of GFRP bar within and in proximity of the furnace. The tests were carried out at four temperature
180 levels, namely: 80 °C, 165 °C, 190 °C and 300 °C, in addition to the reference samples at ambient temperature.
181 The lowest temperature level (i.e., 80 °C) was considered sufficiently low so that some residual water be still
182 present in the concrete [53,56]. The next two temperature levels (i.e., 165 °C and 190 °C) were chosen close to
183 the two different Tg values obtained experimentally, namely 164.2 °C for the onset of the storage modulus and
184 185.7 °C for the peak of the tan(δ) curve, respectively. Finally, the highest temperature level, 300 °C, was used
185 to observe the bond behaviour of GFRP bar well above Tg. So as not to impose a too large thermal gradient on
186 the concrete block, the target temperatures were reached gradually (in approximately 2 hours), at which stage a
187 10 minutes period of temperature stabilization was allowed before beginning the test. Owing to the relatively
188 long test setup and procedure, only two nominally identical specimens were tested for each temperature level.
10
189
Reactionframe
Thermo-couples
Insulatingceramic
LVDTGFRPbar
Concretecylinder
Markers fornon-contact optical
measurements
190 Figure 5. Photo and schematic representation of pull-out test setup and specimen
191
192 Measurement setup
193 The average bond stress, τb, was calculated by dividing the load (P) recorded by the load cell of the servo-
194 hydraulic testing machine by the shear surface (Eq.5), thus assuming a constant bond stress distribution along
195 the embedment length (lb).
196 (5)𝜏𝑏 =𝑃𝜋 ∗ 𝜙 ∗ 𝑙𝑏
197 Where is the FRP bar nominal diameter.
198 While the bond calculation tends to be straightforward, the estimation of the loaded and free-end slips,
199 especially at elevated temperatures, require more attention.
200 In order to calculate the loaded-end slip (sle), a potentiometer was rigidly connected to the portion of the GFRP
201 bar outside the furnace and reacted against a steel plate bolted directly to the reaction frame inside the furnace.
202 However, such measurement (s) also include the elastic elongation (Δl) of the portion of the bar (L) between the
203 concrete block and the transducer. Hence, the slip was computed according to Eq.6 and Eq.7.

11
204 (6)𝑠𝑙𝑒 = 𝑠 ‒ Δ𝑙205 (7) Δ𝑙 =
𝑃 ∙ 𝐿𝐸 ∙ 𝐴𝑏206 Where P is the recorded load, E is the experimentally defined modulus of elasticity of the GFRP bar and Ab is
207 its nominal cross-sectional area.
208 As the slip of the free-end of the GFRP bar takes place within the furnace, a non-contact optical measurement
209 system was employed for its estimation. Steel brackets were rigidly connected to the top insulating ceramic
210 plate (left and right) as well as to the GFRP bar (in the centre) (Figure 5c). These brackets were coated with a
211 black, heat-resistant paint with the exception of circular markers of approximately 20 mm in diameter to create
212 a high contrast target, suitable for image analysis. The brackets on the two sides, acting as reference, had two
213 markers, while the central one, moving rigidly with the bar, had one. The optical system consisted of tracking
214 the centroid of each marker in consecutive images and measuring the free-end slip as the average relative
215 vertical displacement of the central marker with respect to the others. Images were acquired with a CMOS
216 digital camera having a 4272×2848 pixel resolution (Canon EOS 1100D) and equipped with zoom lenses with
217 F-number and focal length of 5.6 and 55 mm, respectively (Canon EF-S 18-55mm f/3.5-5.6 IS II). A light-
218 emitting diode (LED) lamp was used to illuminate the measurement surface. During the test, the shutter was
219 triggered remotely every 10 seconds by the data acquisition system.
220 Finally, the temperature at the bond interface was measured by using thermocouples inserted in the slots
221 prepared during casting. Three thermocouples were used in some of the samples to assess the temperature
222 distribution along the reinforcement. The variation of the recorded temperature at different locations within any
223 of these specimens was sufficiently small (i.e., less than 10 °C discrepancy during the pull-out test at 300 °C)
224 to consider that adequate insulation was provided.
225
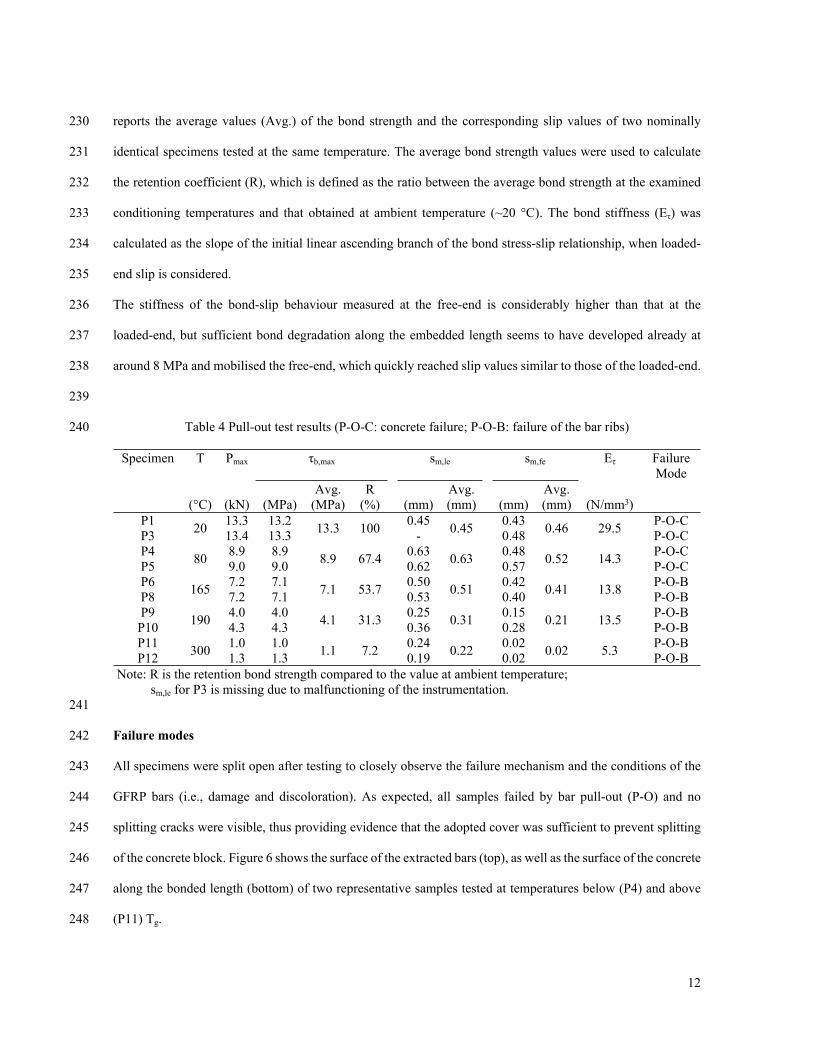
226 4. EXPERIMENTAL RESULTS
227 The experimental results are reported in Table 4, including the maximum pull-out load (Pmax) and the
228 corresponding values of average bond strength (τb,max, Eq.5), slip at loaded (sm,le, Eq.Error! Reference source
229 not found.) and free-ends (sm,fe), the initial bond stiffness (Eτ), and the observed failure mode. Table 4 also
12
230 reports the average values (Avg.) of the bond strength and the corresponding slip values of two nominally
231 identical specimens tested at the same temperature. The average bond strength values were used to calculate
232 the retention coefficient (R), which is defined as the ratio between the average bond strength at the examined
233 conditioning temperatures and that obtained at ambient temperature (~20 °C). The bond stiffness (Eτ) was
234 calculated as the slope of the initial linear ascending branch of the bond stress-slip relationship, when loaded-
235 end slip is considered.
236 The stiffness of the bond-slip behaviour measured at the free-end is considerably higher than that at the
237 loaded-end, but sufficient bond degradation along the embedded length seems to have developed already at
238 around 8 MPa and mobilised the free-end, which quickly reached slip values similar to those of the loaded-end.
239
240 Table 4 Pull-out test results (P-O-C: concrete failure; P-O-B: failure of the bar ribs)
T τb,max sm,le sm,fe Eτ FailureMode
Specimen Pmax
Avg. R Avg. Avg.(°C) (kN) (MPa) (MPa) (%) (mm) (mm) (mm) (mm) (N/mm3)
P1 13.3 13.2 0.45 0.43 P-O-CP3
2013.4 13.3
13.3 100-
0.450.48
0.46 29.5P-O-C
P4 8.9 8.9 0.63 0.48 P-O-CP5
809.0 9.0
8.9 67.40.62
0.630.57
0.52 14.3P-O-C
P6 7.2 7.1 0.50 0.42 P-O-BP8
1657.2 7.1
7.1 53.70.53
0.510.40
0.41 13.8P-O-B
P9 4.0 4.0 0.25 0.15 P-O-BP10
1904.3 4.3
4.1 31.30.36
0.310.28
0.21 13.5P-O-B
P11 1.0 1.0 0.24 0.02 P-O-BP12
3001.3 1.3
1.1 7.20.19
0.220.02
0.02 5.3P-O-B
Note: R is the retention bond strength compared to the value at ambient temperature;sm,le for P3 is missing due to malfunctioning of the instrumentation.
241
242 Failure modes
243 All specimens were split open after testing to closely observe the failure mechanism and the conditions of the
244 GFRP bars (i.e., damage and discoloration). As expected, all samples failed by bar pull-out (P-O) and no
245 splitting cracks were visible, thus providing evidence that the adopted cover was sufficient to prevent splitting
246 of the concrete block. Figure 6 shows the surface of the extracted bars (top), as well as the surface of the concrete
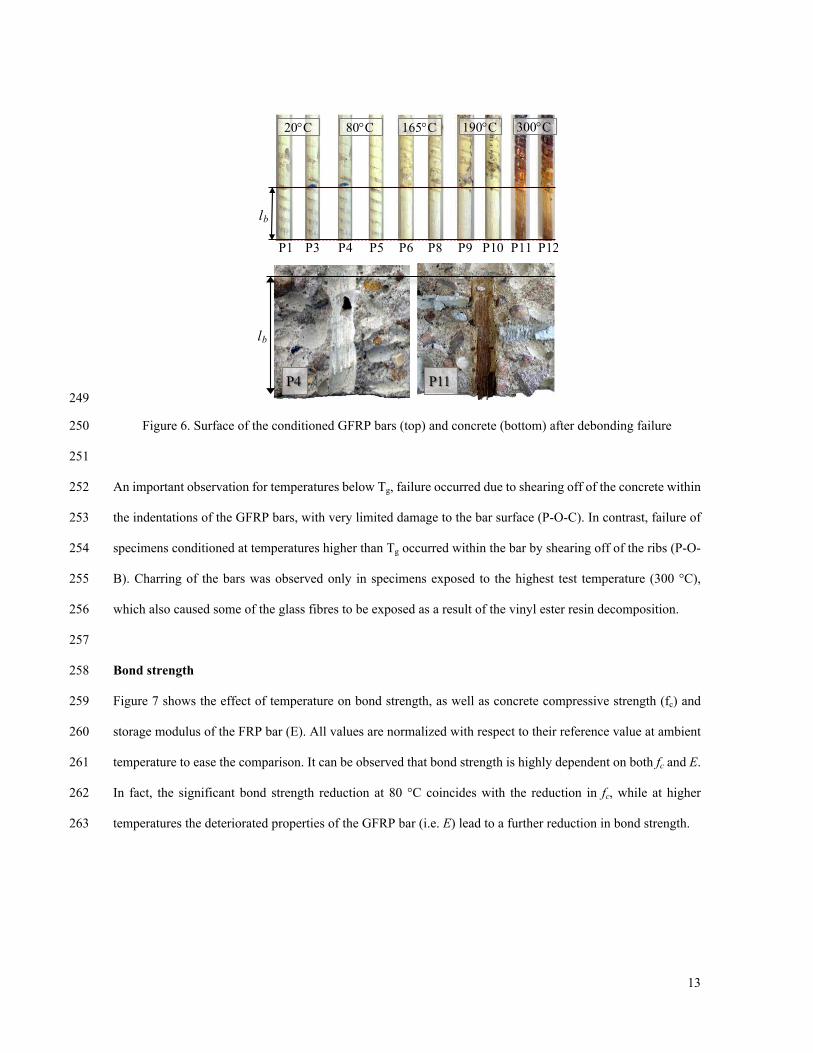
247 along the bonded length (bottom) of two representative samples tested at temperatures below (P4) and above
248 (P11) Tg.
13
249
P1
20C 80C 165C 190C 300C
P3 P4 P5 P6 P8 P9 P10 P11 P12
P4 P11
lb
lb
250 Figure 6. Surface of the conditioned GFRP bars (top) and concrete (bottom) after debonding failure
251
252 An important observation for temperatures below Tg, failure occurred due to shearing off of the concrete within
253 the indentations of the GFRP bars, with very limited damage to the bar surface (P-O-C). In contrast, failure of
254 specimens conditioned at temperatures higher than Tg occurred within the bar by shearing off of the ribs (P-O-
255 B). Charring of the bars was observed only in specimens exposed to the highest test temperature (300 °C),
256 which also caused some of the glass fibres to be exposed as a result of the vinyl ester resin decomposition.
257
258 Bond strength
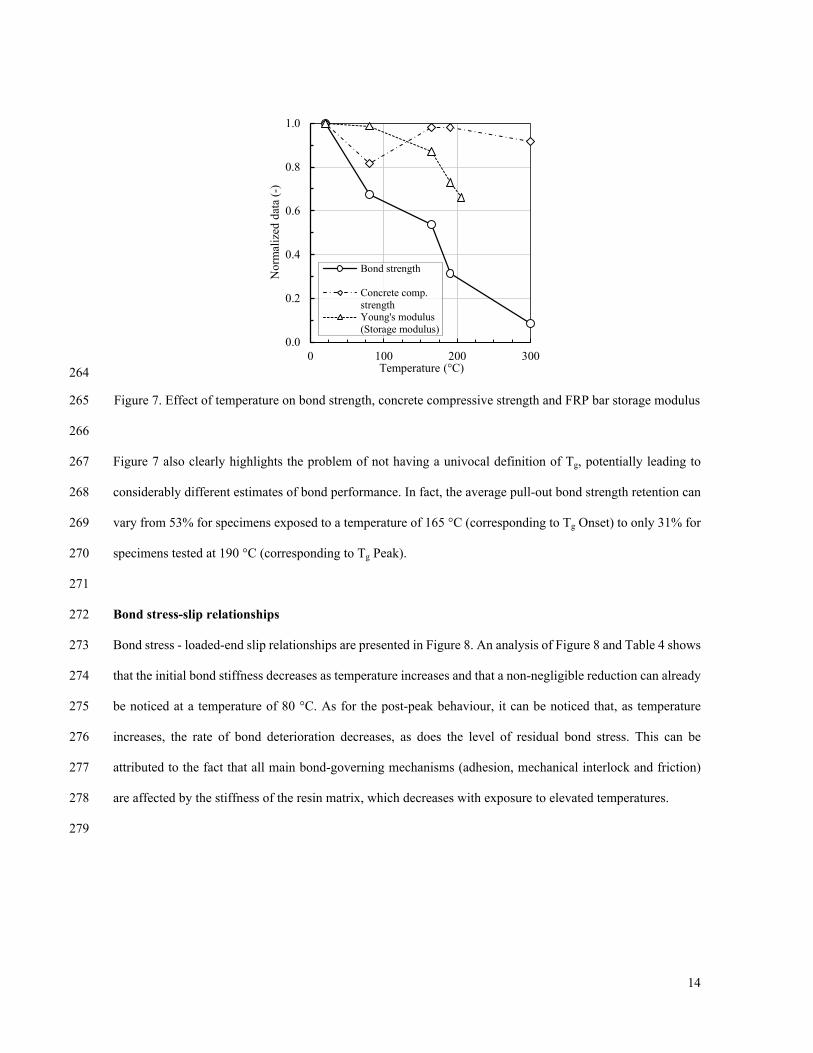
259 Figure 7 shows the effect of temperature on bond strength, as well as concrete compressive strength (fc) and
260 storage modulus of the FRP bar (E). All values are normalized with respect to their reference value at ambient
261 temperature to ease the comparison. It can be observed that bond strength is highly dependent on both fc and E.
262 In fact, the significant bond strength reduction at 80 °C coincides with the reduction in fc, while at higher
263 temperatures the deteriorated properties of the GFRP bar (i.e. E) lead to a further reduction in bond strength.
14
264
0.0
0.2
0.4
0.6
0.8
1.0
0 100 200 300
Nor
mal
ized
dat
a (-
)
Temperature (°C)
Bond strength
Concrete comp.strengthYoung's modulus(Storage modulus)
265 Figure 7. Effect of temperature on bond strength, concrete compressive strength and FRP bar storage modulus
266
267 Figure 7 also clearly highlights the problem of not having a univocal definition of Tg, potentially leading to
268 considerably different estimates of bond performance. In fact, the average pull-out bond strength retention can
269 vary from 53% for specimens exposed to a temperature of 165 °C (corresponding to Tg Onset) to only 31% for
270 specimens tested at 190 °C (corresponding to Tg Peak).
271
272 Bond stress-slip relationships
273 Bond stress - loaded-end slip relationships are presented in Figure 8. An analysis of Figure 8 and Table 4 shows
274 that the initial bond stiffness decreases as temperature increases and that a non-negligible reduction can already
275 be noticed at a temperature of 80 °C. As for the post-peak behaviour, it can be noticed that, as temperature
276 increases, the rate of bond deterioration decreases, as does the level of residual bond stress. This can be
277 attributed to the fact that all main bond-governing mechanisms (adhesion, mechanical interlock and friction)
278 are affected by the stiffness of the resin matrix, which decreases with exposure to elevated temperatures.
279

15
280
0
2
4
6
8
10
12
14
0 2 4 6 8 10 12 14 16
Bon
d st
ress
(M
Pa)
Loaded end slip (mm)
P1_20C
P4_80C
P5_80C
P6_165C
P8_165C
P9_190C
P10_190C
P11_300C
P12_300C
-
281 Figure 8. Bond stress-slip relationships at different temperatures (P3 is missing due to malfunctioning of the
282 instrumentation)
283
284 Comparison of loaded and free-end slip values
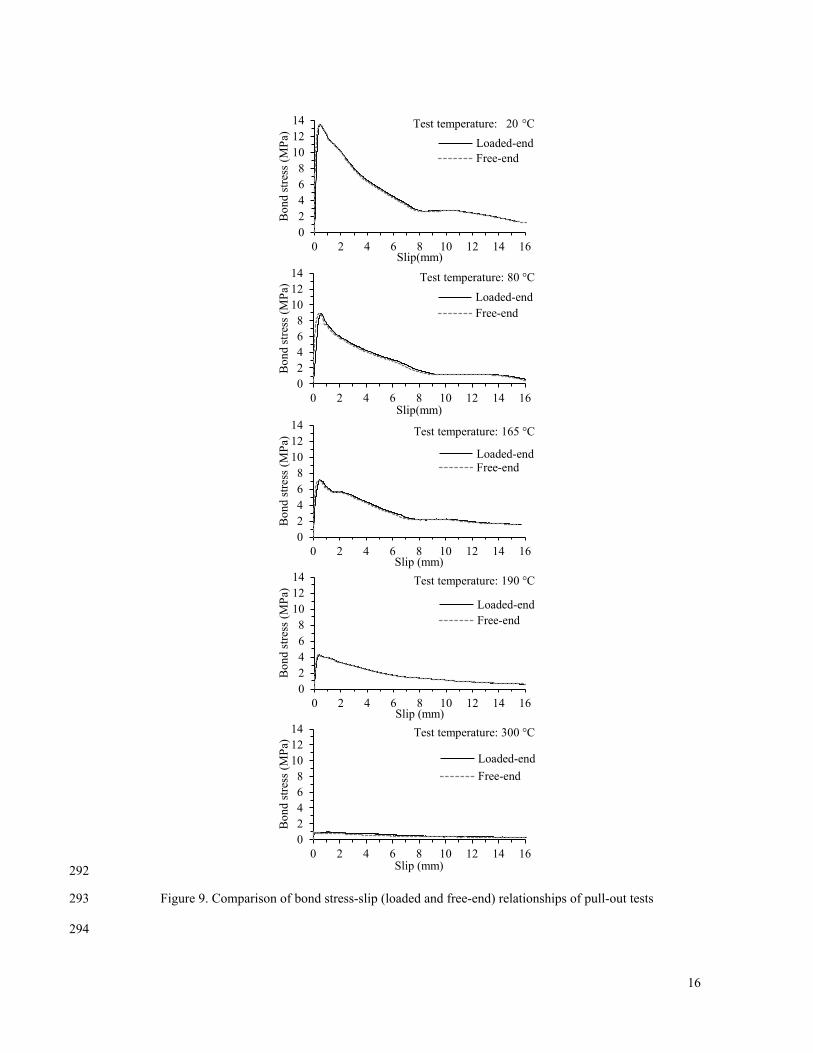
285 Bond stress-slip (both loaded and free-ends) curves are plotted for all the tested temperature levels (Figure 9).
286 It can be observed that in all cases the loaded-end slips are higher than the free-end ones (at same bond stress
287 level) and this difference decreases as the bond stress reduces after the peak bond stress (i.e. debonding along
288 the entire embedded length). These findings are in line with experimental data obtained at ambient temperature
289 and available in literature (i.e., [5,6,9]), thus confirming the reliability of the optical measurement technique
290 implemented by the authors to measure the free-end slip.
291
16
292
02468
101214
0 2 4 6 8 10 12 14 16
Bon
d st
ress
(M
Pa)
Slip(mm)
Test temperature: ~23 °C
Loaded-endFree-end
02468
101214
0 2 4 6 8 10 12 14 16
Bon
d st
ress
(M
Pa)
Slip(mm)
Test temperature: 80 °C
Loaded-endFree-end
02468
101214
0 2 4 6 8 10 12 14 16
Bon
d st
ress
(M
Pa)
Slip (mm)
Test temperature: 165 °C
Loaded-endFree-end
02468
101214
0 2 4 6 8 10 12 14 16
Bon
d st
ress
(M
Pa)
Slip (mm)
Test temperature: 190 °C
Loaded-endFree-end
02468
101214
0 2 4 6 8 10 12 14 16
Bon
d st
ress
(M
Pa)
Slip (mm)
Test temperature: 300 °C
Loaded-end
Free-end
20
293 Figure 9. Comparison of bond stress-slip (loaded and free-end) relationships of pull-out tests
294
17
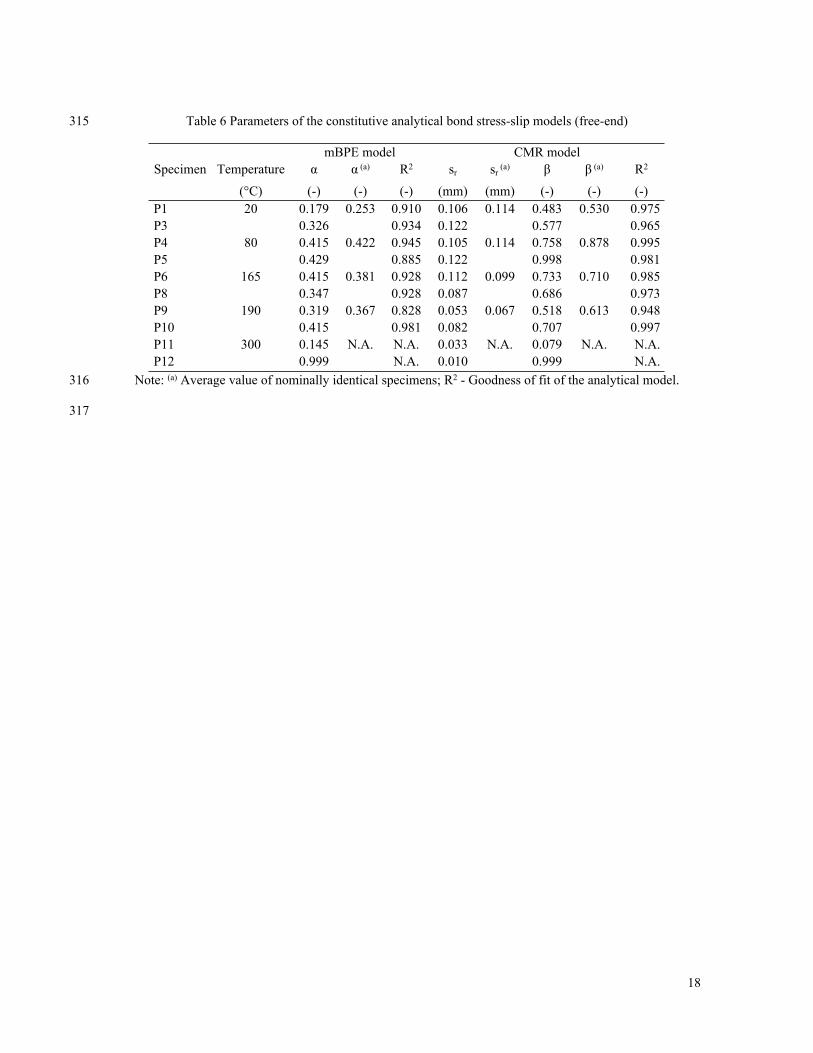
295 5. ANALYTICAL STUDY
296 Parameter calibration of the analytical models
297 In this section, the parameters required for the implementation of the CMR model (i.e., β and sr) and to describe
298 the ascending branch of the mBPE model (i.e., α) are estimated and discussed. The calibration of these
299 parameters was achieved by performing a regression analyses of the experimental bond strength and
300 corresponding slip values (Table 4) using the least-square error method. The results obtained for different
301 temperature levels and calibrated on the behaviour of the loaded or free-end are presented in Table 5 and Table
302 6, respectively. In addition to the calibrated values, the average values obtained for nominally identical
303 specimens ((a)), as well as the goodness of fit (R2), are reported. The calibration based on the free-end results at
304 300 °C could not be properly carried out. Finally, a graphical comparison of the experimental and calibrated
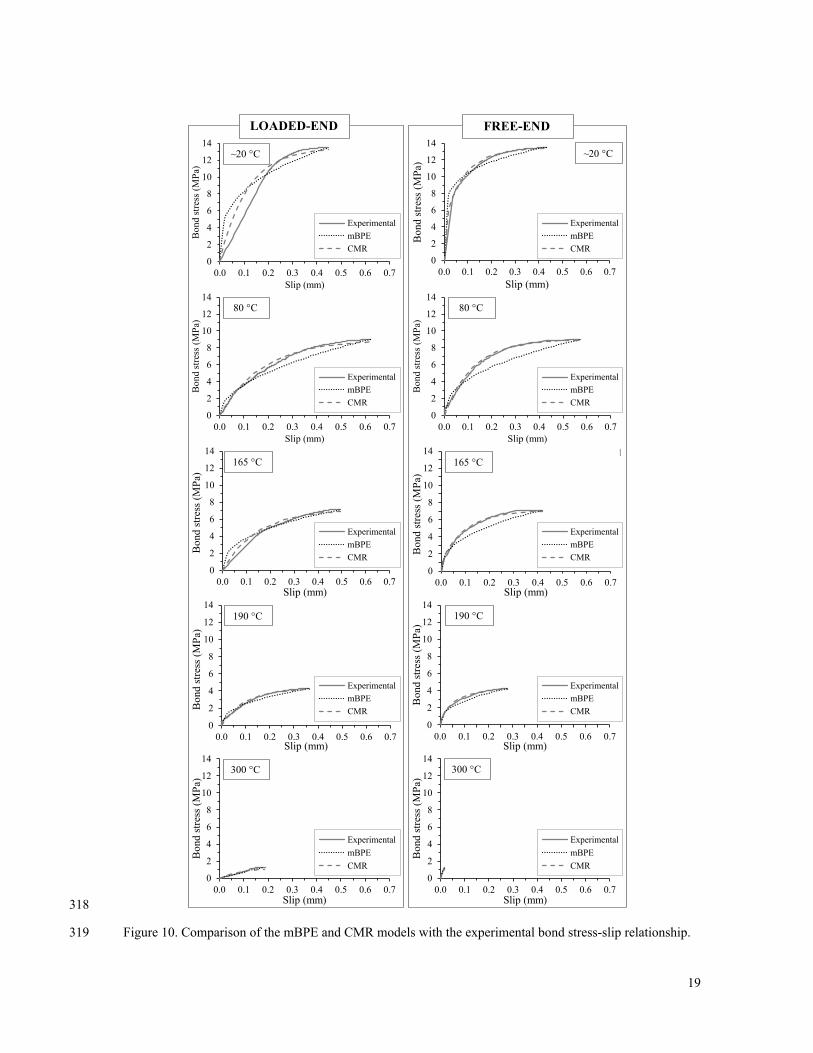
305 analytical bond stress-slip relationships is presented in Figure 10.
306 Both numerical and graphical results indicate that the CMR model is more accurate than the mBPE model. In
307 fact, when considering the behaviour of the free-end, the CMR model returns R2 values consistently above 0.95
308 and better approximates (dashed line) the experimental behaviour (solid line) throughout the initial stages of
309 loading. When the behaviour of the loaded-end is examined, a lower degree of accuracy is recorded in both
310 models. Nonetheless, the CMR model remains marginally more accurate.
311
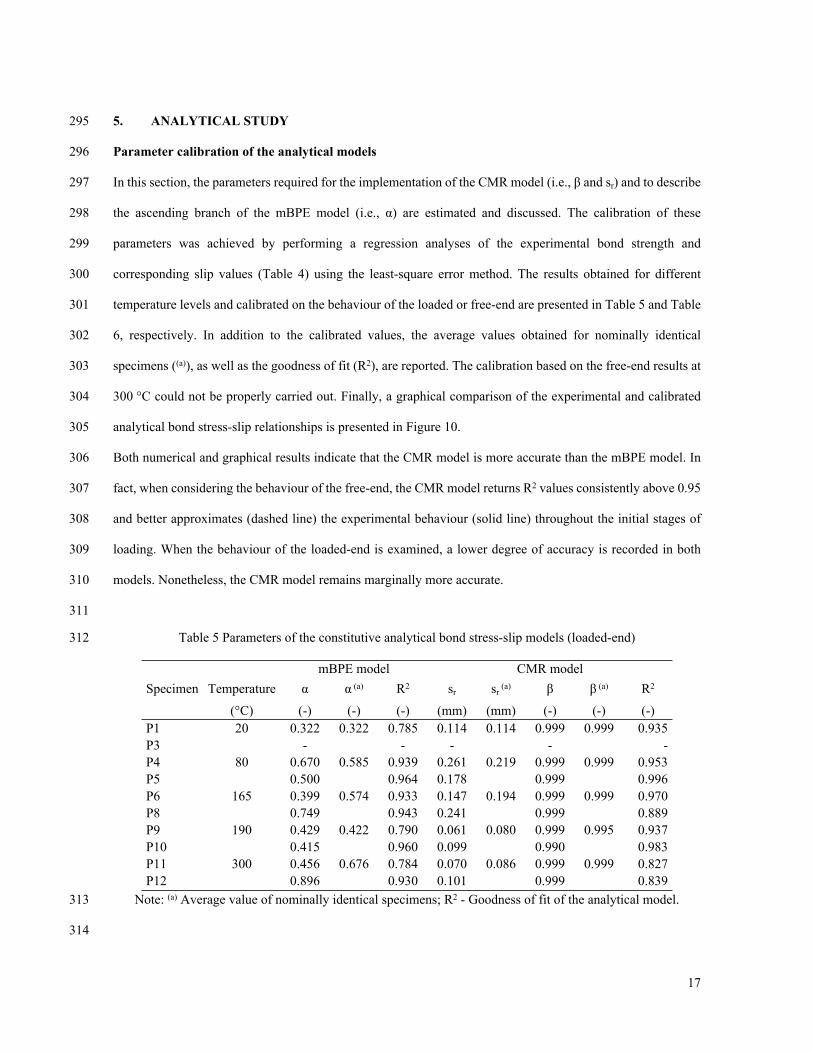
312 Table 5 Parameters of the constitutive analytical bond stress-slip models (loaded-end)
mBPE model CMR model
Temperature α α (a) R2 sr sr
(a) β β (a) R2Specimen
(°C) (-) (-) (-) (mm) (mm) (-) (-) (-)P1 0.322 0.785 0.114 0.999 0.935P3
20-
0.322- -
0.114-
0.999-
P4 0.670 0.939 0.261 0.999 0.953P5
800.500
0.5850.964 0.178
0.2190.999
0.9990.996
P6 0.399 0.933 0.147 0.999 0.970P8
1650.749
0.5740.943 0.241
0.1940.999
0.9990.889
P9 0.429 0.790 0.061 0.999 0.937P10
1900.415
0.4220.960 0.099
0.0800.990
0.9950.983
P11 0.456 0.784 0.070 0.999 0.827P12
3000.896
0.6760.930 0.101
0.0860.999
0.9990.839
313 Note: (a) Average value of nominally identical specimens; R2 - Goodness of fit of the analytical model.
314
18
315 Table 6 Parameters of the constitutive analytical bond stress-slip models (free-end)
mBPE model CMR modelTemperature α α
(a) R2 sr sr (a) β β
(a) R2Specimen
(°C) (-) (-) (-) (mm) (mm) (-) (-) (-)P1 0.179 0.910 0.106 0.483 0.975P3
200.326
0.2530.934 0.122
0.1140.577
0.5300.965
P4 0.415 0.945 0.105 0.758 0.995P5
800.429
0.4220.885 0.122
0.1140.998
0.8780.981
P6 0.415 0.928 0.112 0.733 0.985P8
1650.347
0.3810.928 0.087
0.0990.686
0.7100.973
P9 0.319 0.828 0.053 0.518 0.948P10
1900.415
0.3670.981 0.082
0.0670.707
0.6130.997
P11 0.145 N.A. 0.033 0.079 N.A.P12
3000.999
N.A.N.A. 0.010
N.A.0.999
N.A.N.A.
316 Note: (a) Average value of nominally identical specimens; R2 - Goodness of fit of the analytical model.
317
19
318
0
2
4
6
8
10
12
14
0.0 0.1 0.2 0.3 0.4 0.5 0.6 0.7
Bon
d st
ress
(M
Pa)
Slip (mm)
ExperimentalmBPECMR
0
2
4
6
8
10
12
14
0.0 0.1 0.2 0.3 0.4 0.5 0.6 0.7B
ond
stre
ss (
MP
a)
Slip (mm)
ExperimentalmBPECMR
0
2
4
6
8
10
12
14
0.0 0.1 0.2 0.3 0.4 0.5 0.6 0.7
Bon
d st
ress
(M
Pa)
Slip (mm)
ExperimentalmBPECMR
0
2
4
6
8
10
12
14
0.0 0.1 0.2 0.3 0.4 0.5 0.6 0.7
Bon
d st
ress
(M
Pa)
Slip (mm)
ExperimentalmBPECMR
0
2
4
6
8
10
12
14
0.0 0.1 0.2 0.3 0.4 0.5 0.6 0.7
Bon
d st
ress
(M
Pa)
Slip (mm)
ExperimentalmBPECMR
0
2
4
6
8
10
12
14
0.0 0.1 0.2 0.3 0.4 0.5 0.6 0.7
Bon
d st
ress
(M
Pa)
Slip (mm)
Experimental
mBPE
CMR
0
2
4
6
8
10
12
14
0.0 0.1 0.2 0.3 0.4 0.5 0.6 0.7
Bon
d st
ress
(M
Pa)
Slip (mm)
Experimental
mBPE
CMR
0
2
4
6
8
10
12
14
0.0 0.1 0.2 0.3 0.4 0.5 0.6 0.7
Bon
d st
ress
(M
Pa)
Slip (mm)
ExperimentalmBPECMR
0
2
4
6
8
10
12
14
0.0 0.1 0.2 0.3 0.4 0.5 0.6 0.7
Bon
d st
ress
(M
Pa)
Slip (mm)
ExperimentalmBPECMR
0
2
4
6
8
10
12
14
0.0 0.1 0.2 0.3 0.4 0.5 0.6 0.7
Bon
d st
ress
(M
Pa)
Slip (mm)
ExperimentalmBPECMR
0
2
4
6
8
10
12
14
0.0 0.1 0.2 0.3 0.4 0.5 0.6 0.7
Bon
d st
ress
(M
Pa)
Slip (mm)
Experimental
mBPE
CMR
0
2
4
6
8
10
12
14
0.0 0.1 0.2 0.3 0.4 0.5 0.6 0.7
Bon
d st
ress
(M
Pa)
Slip (mm)
Experimental
mBPE
CMR
0
2
4
6
8
10
12
14
0.0 0.1 0.2 0.3 0.4 0.5 0.6 0.7
Bon
d st
ress
(M
Pa)
Slip (mm)
ExperimentalmBPECMR
0
2
4
6
8
10
12
14
0.0 0.1 0.2 0.3 0.4 0.5 0.6 0.7
Bon
d st
ress
(M
Pa)
Slip (mm)
ExperimentalmBPECMR
Experimental
mBPE
CMR
Experimental
mBPE
CMR
Experimental
mBPE
CMR
Experimental
mBPE
CMR
Experimental
mBPE
CMR
Experimental
mBPE
CMR
Experimental
mBPE
CMR
Experimental
mBPE
CMR
Experimental
mBPE
CMR
Experimental
mBPE
CMR
LOADED-END FREE-END
~20 °C
80 °C 80 °C
~20 °C
165 °C 165 °C
190 °C 190 °C
300 °C 300 °C
319 Figure 10. Comparison of the mBPE and CMR models with the experimental bond stress-slip relationship.
20
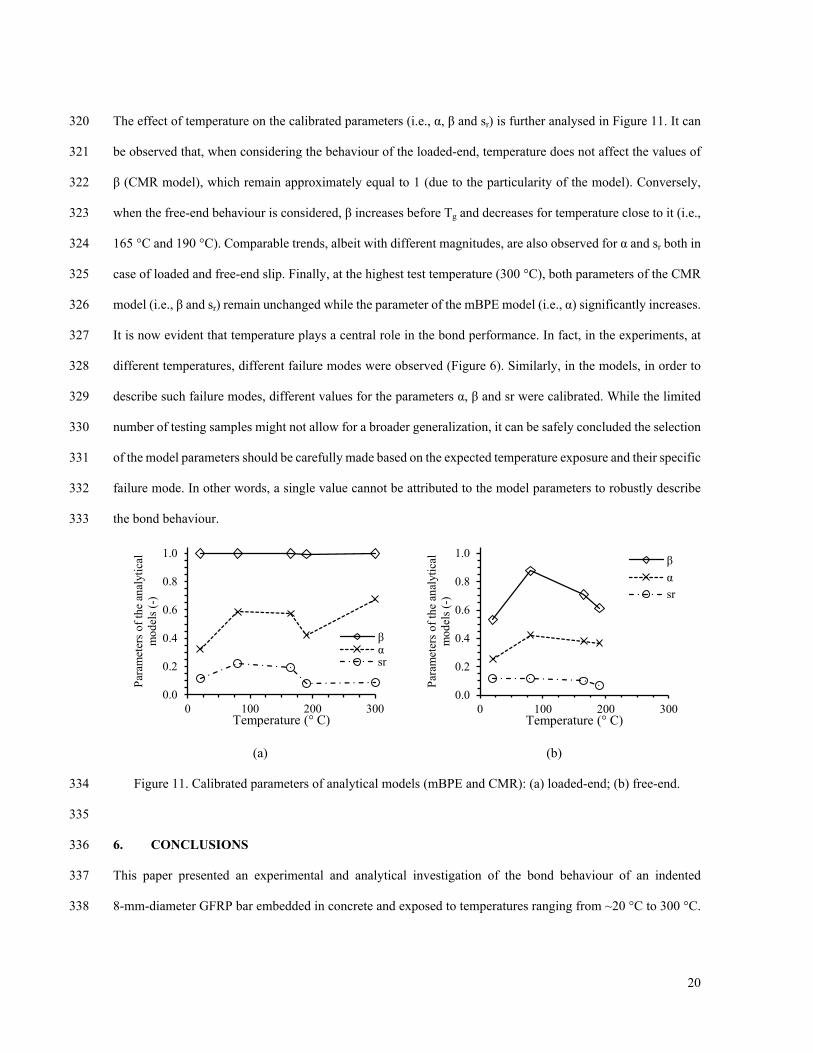
320 The effect of temperature on the calibrated parameters (i.e., α, β and sr) is further analysed in Figure 11. It can
321 be observed that, when considering the behaviour of the loaded-end, temperature does not affect the values of
322 β (CMR model), which remain approximately equal to 1 (due to the particularity of the model). Conversely,
323 when the free-end behaviour is considered, β increases before Tg and decreases for temperature close to it (i.e.,
324 165 °C and 190 °C). Comparable trends, albeit with different magnitudes, are also observed for α and sr both in
325 case of loaded and free-end slip. Finally, at the highest test temperature (300 °C), both parameters of the CMR
326 model (i.e., β and sr) remain unchanged while the parameter of the mBPE model (i.e., α) significantly increases.
327 It is now evident that temperature plays a central role in the bond performance. In fact, in the experiments, at
328 different temperatures, different failure modes were observed (Figure 6). Similarly, in the models, in order to
329 describe such failure modes, different values for the parameters α, β and sr were calibrated. While the limited
330 number of testing samples might not allow for a broader generalization, it can be safely concluded the selection
331 of the model parameters should be carefully made based on the expected temperature exposure and their specific
332 failure mode. In other words, a single value cannot be attributed to the model parameters to robustly describe
333 the bond behaviour.
0.0
0.2
0.4
0.6
0.8
1.0
0 100 200 300
Par
amet
ers
of th
e an
alyt
ical
m
odel
s (-
)
Temperature (° C)
βαsr
0.0
0.2
0.4
0.6
0.8
1.0
0 100 200 300
Par
amet
ers
of th
e an
alyt
ical
m
odel
s (-
)
Temperature (° C)
βαsr
(a) (b)
334 Figure 11. Calibrated parameters of analytical models (mBPE and CMR): (a) loaded-end; (b) free-end.
335
336 6. CONCLUSIONS
337 This paper presented an experimental and analytical investigation of the bond behaviour of an indented
338 8-mm-diameter GFRP bar embedded in concrete and exposed to temperatures ranging from ~20 °C to 300 °C.

21
339 The temperature variation at the GFRP bar and concrete interface was monitored with thermocouples, while
340 loaded and free-end slips were measured by a potentiometer and a bespoke optical technique, respectively. The
341 variation in bond behaviour at the tested temperatures was investigated based on observed failure mode, bond
342 strength, and bond stress-slip relationship. Finally, the mBPE and CMR models were calibrated based on the
343 experimental results. The main conclusions of this study are summarised below.
344 All samples failed by bar pull-out. Failure occurred through shearing off of the concrete lugs for
345 specimens tested at temperature levels lower than Tg, whilst failure developed within the GFRP bar at
346 higher temperatures.
347 An optical contactless measurement technique was developed and effectively implemented in this
348 study.
349 Bond strength decreases as the temperature increases. In particular, bond strength retention can be as
350 low as 30% for specimens exposed to temperatures close to Tg, and it further reduces to less than 10%
351 at 300 °C. The decrease in bond performance is affected by a reduction in concrete compressive
352 strength at a relatively low temperature level (80 °C) and in modulus of elasticity of the GFRP bar at
353 higher temperatures.
354 The calibration of the mBPE and CMR with the experimental results for increasing temperature levels
355 suggests that the latter provides better accuracy in predicting the bond stress-slip relationships and
356 highlights the temperature dependence of the key parameters (α, sr and β). In particular, when the
357 free-end behaviour is considered and for temperatures up to 190 °C, all parameters increase before Tg
358 and decrease afterwards. Similarly, when considering the loaded-end model and up to 300 °C, the same
359 trend is observed for α and sr, whilst β remains unchanged.
360 The current study provides a robust framework to run repeatable pull-out tests at high temperatures. However,
361 as bond strength at high temperatures is greatly influenced by the bar deformation, the presented experimental
362 results and conclusions cannot be generalized to FRP bars with different properties or surface profiles.
363 Additional research will focus on the optimization of the optical contactless measurement technique and will
364 seek to extend the available experimental data set to include bars of different materials and surface profiles.
365
22
366 ACKNOWLEDGEMENTS
367 Supported by the ÚNKP-18-3 New National Excellence Program of the Ministry of Human Capacities.
368 Authors gratefully acknowledge also the financial support of European Union by Marie Curie ITN: European
369 Network for Durable Reinforcement and Rehabilitation Solutions (endure, Grant: PITN-GA-2013-607851).
370 GFRP bars were provided by Schöck Germany, special thanks to Dr André Weber.
371
372 REFERENCES
373 [1] fib. Bulletin 10: Bond of reinforcement in concrete. State-of-the art report of task group: Bond Models. 374 International Federation for Structural Concrete (fib); 2000.
375 [2] Bank LC. Composites for Construction: Structural Design with FRP Materials. Hoboken, NJ: John 376 Wiley & Sons, Inc.; 2006.
377 [3] Nanni A, De Luca A, Zadeh H. Reinforced Concrete with FRP Bars. Boca Raton, FL: CRC Press - 378 Taylor & Francis Group; 2014. doi:10.1201/b16669.
379 [4] Gooranorimi O, Bradberry T, Nanni A. Durability of GFRP reinforcement in built structures: A 15-380 year old concrete bridge deck. In: Benmokrane B, El-Salakawy E, Ahmed E, editors. CDCC 2017 - 381 Fifth Int. Conf. Durab. Fiber Reinf. Polym. Compos. Constr. Rehabil. Struct., Sherbrooke, QC, Canada: 382 2017, p. 87–94.
383 [5] Achillides Z, Pilakoutas K. Bond behavior of FRP Bars under direct pullout conditions. J Compos 384 Constr 2004;8:173–81.
385 [6] Baena M, Torres L, Turon A, Barris C. Experimental study of bond behaviour between concrete and 386 FRP bars using a pull-out test. Compos Part B Eng 2009;40:784–97. 387 doi:10.1016/j.compositesb.2009.07.003.
388 [7] Yan F, Lin Z, Yang M. Bond mechanism and bond strength of GFRP bars to concrete: A review. 389 Compos Part B Eng 2016;98:56–69. doi:10.1016/j.compositesb.2016.04.068.
390 [8] Lee JY, Kim TY, Kim TJ, Yi CK, Park JS, You YC, et al. Interfacial bond strength of glass fiber 391 reinforced polymer bars in high-strength concrete. Compos Part B Eng 2008;39:258–70. 392 doi:10.1016/j.compositesb.2007.03.008.
393 [9] Veljkovic A, Carvelli V, Haffke MM, Pahn M. Concrete cover effect on the bond of GFRP bar and 394 concrete under static loading. Compos Part B Eng 2017;124:40–53. 395 doi:10.1016/j.compositesb.2017.05.054.
396 [10] Guadagnini M, Pilakoutas K, Waldron P, Achillides Z. Tests for the evaluation of bond properties of 397 FRP bars in concrete. In: Seracino R, Balkema AA, editors. 2nd Int. Conf. FRP Compos. Civ. Eng. 398 (CICE 2004), Adelaide: 2004, p. 343–50.
399 [11] Tighiouart B, Benmokrane B, Gao D. Investigation of bond in concrete member with fibre reinforced 400 polymer (FRP) bars. Constr Build Mater 1998;12:453–62. doi:10.1016/S0950-0618(98)00027-0.
23
401 [12] Mazaheripour H, Barros JAO, Sena-Cruz JM, Pepe M, Martinelli E. Experimental study on bond 402 performance of GFRP bars in self-compacting steel fiber reinforced concrete. Compos Struct 403 2013;95:202–12. doi:10.1016/j.compstruct.2012.07.009.
404 [13] Al-Mahmoud F, Castel A, François R, Tourneur C. Effect of surface pre-conditioning on bond of carbon 405 fibre reinforced polymer rods to concrete. Cem Concr Compos 2007;29:677–89. 406 doi:10.1016/j.cemconcomp.2007.04.010.
407 [14] Solyom S, Di Benedetti M, Szijártó A, Balázs GL. Non-metallic reinforcements with different moduli 408 of elasticity and surfaces for concrete structures. Architecture Civil Engineering Environment 409 2018;11:79–88.
410 [15] Weber A. Bond Properties of a Newly Developed Composite Rebar. Int. Symp. Bond Behav. FRP 411 Struct. - BBFS 2005, 2005, p. 379–84.
412 [16] Tastani SP, Pantazopoulou SJ. Design values of bond - slip law for FRP bars. FRPRCS-8, Patras, 413 Greece: 2007, p. 1–10.
414 [17] Gudonis E, Kacianauskas R, Gribniak V, Weber A, Jakubovskis R, Kaklauskas G. Mechanical 415 Properties of the Bond Between GFRP Reinforcing Bars and Concrete. Mech Compos Mater 416 2014;50:457–66. doi:10.1007/s11029-014-9432-0.
417 [18] Belarbi A, Wang H. Bond Durability of FRP Bars Embedded in Fiber-Reinforced Concrete. J Compos 418 Constr 2012;16:371–80. doi:10.1061/(ASCE)CC.1943-5614.0000270.
419 [19] Davalos JF, Chen Y, Ray I. Effect of FRP bar degradation on interface bond with high strength concrete. 420 Cem Concr Compos 2008;30:722–30. doi:10.1016/j.cemconcomp.2008.05.006.
421 [20] GangaRao HVS, Taly N, Vijay P V. Reinforced Concrete Design with FRP Composites. Boca Raton, 422 FL: CRC Press - Taylor & Francis Group; 2007.
423 [21] Sayed Ahmad F, Foret G, Le Roy R. Bond between carbon fibre-reinforced polymer (CFRP) bars and 424 ultra high performance fibre reinforced concrete (UHPFRC): Experimental study. Constr Build Mater 425 2011;25:479–85. doi:10.1016/j.conbuildmat.2010.02.006.
426 [22] Arias JPM, Vazquez A, Escobar MM. Use of sand coating to improve bonding between GFRP bars and 427 concrete. J Compos Mater 2012;46:2271–8. doi:10.1177/0021998311431994.
428 [23] Katz A, Berman N, Bank LC. Effect of high temperature on bond strength of FRP rebars. J Compos 429 Constr 1999;3:73–81.
430 [24] Katz A, Berman N. Modeling the effect of high temperature on the bond of FRP reinforcing bars to 431 concrete. Cem Concr Compos 2000;22:433–43.
432 [25] Lublóy É, Balázs GL, Borosnyói A, Nehme SG. Bond of CFRP wires under elevated temperature. Bond 433 Behav. FRP Struct., Hong Kong: 7-9 Dec. 2005; 2005, p. 163–7.
434 [26] Galati N, Nanni A, Dharani LR, Focacci F, Aiello MA. Thermal effects on bond between FRP rebars 435 and concrete. Compos Part A Appl Sci Manuf 2006;37:1223–30. 436 doi:10.1016/j.compositesa.2005.05.043.
437 [27] Masmoudi R, Masmoudi A, Ben Ouezdou M, Daoud A. Thermal effects on bond properties of GFRP 438 rebars embedded in concrete : Experimental study and analytical interpretation. FRPRCS-9, Sydney, 439 Australia: 2009, p. 1–4.
440 [28] McIntyre E, Bisby L, Stratford T. Bond Strength of FRP Reinforcement in Concrete at Elevated

24
441 Temperature. 7th Int. Conf. FRP Compos. Civ. Eng. (CICE 2014), Vancouver: 2014, p. 1–6.
442 [29] El-Gamal S. Bond strength of glass fiber-reinforced polymer bars in concrete after exposure to elevated 443 temperatures. J Reinf Plast Compos 2014;33:2151–63. doi:10.1177/0731684414555408.
444 [30] Hamad RJA, Johari MAM, Haddad RH. Mechanical properties and bond characteristics of different 445 fiber reinforced polymer rebars at elevated temperatures. Constr Build Mater 2017;142:521–35. 446 doi:10.1016/j.conbuildmat.2017.03.113.
447 [31] Ellis DS, Tabatabai H, Nabizadeh A. Residual tensile strength and bond properties of GFRP bars after 448 exposure to elevated temperatures. Materials (Basel) 2018;11:1–14. doi:10.3390/ma11030346.
449 [32] Haskett M, Oehlers DJ, Mohamed Ali MS. Local and global bond characteristics of steel reinforcing 450 bars. Eng Struct 2008;30:376–83. doi:10.1016/j.engstruct.2007.04.007.
451 [33] fib. Model Code for Concrete Structures 2010. Ernst & Sohn; 2013.
452 [34] Malvar LJ. Bond stress-slip characteristics of FRP rebars. Port Hueneme, California: 1994.
453 [35] Cosenza E, Manfredi G, Realfonzo R. Analytical modelling of bond between FRP reinforcing bars and 454 concrete. In: Taerwe L, editor. Non-metalic Reinf. Concr. Struct. Reinf. Concr. Struct., London: E & 455 FN Spon; 1995, p. 164–71. doi:10.1145/2505515.2507827.
456 [36] Cosenza E, Manfredi G, Realfonzo R. Bond characteristics and anchorage length of FRP rebars. In: EI-457 Badry M, editor. Proc., 2nd Int. Conf. Adv. Compos. Mat. Bridg. Struct., 1996.
458 [37] Zhang HX, Li J. Bond behavior and modeling of Fiber Reinforced Polymer bars to concrete under direct 459 pullout. In: Smith ST, editor. Asia-Pacific Conf. FRP Struct., 2007, p. 739–44.
460 [38] Eligehausen R, Popov EP, Bertero V V. Local bond stress-slip relationships of deformed bars under 461 generalized excitations: experimental results and analytical model. 1983.
462 [39] Pecce M, Manfredi G, Realfonzo R, Cosenza E. Experimental and analytical evaluation of bond 463 properties of GFRP bars. J Mater Civ Eng 2001:282–90.
464 [40] Muñoz MB. Study of bond behaviour between FRP reinforcement and concrete. University of Girona, 465 2010.
466 [41] Achillides Z. Bond behaviour of FRP bars in concrete. The University of Sheffield, 1998.
467 [42] ACI Committee 440. Guide for the design and construction of structural concrete reinforced with FRP 468 bars. Farmington Hills, MI: 2015. doi:10.1061/40753(171)158.
469 [43] RILEM. RC6: Bond test for reinforcement steel. 2. Pull-out test. Mater Struct 1983;6:218–21.
470 [44] ACI 440.3R. Guide test methods for Fiber-Reinforced Polymers (FRPs) for reinforcing or strengthening 471 concrete structures. ACI Committee 440; 2004.
472 [45] ASTM Standards D7913. Standard test method for bond strength of Fiber-Reinforced Polymer matrix 473 composite bars to concrete by pullout testing, 2014. doi:10.1520/D7913.
474 [46] Sólyom S, Balázs GL, Di Benedetti M, Guadagnini M, Zappa E. Bond Strength of GFRP Rebars In 475 Concrete at Elevated Temperature. ACIC 2017 - Adv. Compos. Constr., Sheffield, UK: 2017, p. 337–476 43.
477 [47] EN 12390-3. Testing hardened concrete. Part 3: Compressive strength of test specimens, 2009.
25
478 [48] EN 12390-6. Testing hardened concrete. Part 6: Tensile splitting strength of test specimens, 2009.
479 [49] Cosenza E, Manfredi G, Realfonzo R. Behavior and Modeling of Bond of FRP Rebars to Concrete. J 480 Compos Constr 1997:40–51. doi:10.1061/(ASCE)1090-0268(1997)1:2(40).
481 [50] CSA-S806-12. Design and construction of building structures with fibre-reinforced polymers. 482 Mississauga, Ontario, Canada: Canadian Standards Association; 2012.
483 [51] Lublóy É. The influence of concrete strength on the effect of synthetic fibres on fire resistance. Period 484 Polytech Eng 2018;62:136–42. doi:10.3311/PPci.10775.
485 [52] Viktor H, Lublóy É, Takács L. Load bearing capacity of anchors in thermally damaged reinforced 486 concrete. In: Nigro E, Bilotta A, editors. IFireSS 2017 2nd Int. Fire Saf. Symp., Naples, Italy: 2017, p. 487 349–56.
488 [53] Lublóy É, Viktor H. Bond after fire. Constr Build Mater 2017;132:210–8. 489 doi:10.1016/j.conbuildmat.2016.11.131.
490 [54] Fergani H, Di Benedetti M, Guadagnini M, Lynsdale C, Mias C. Long term performance of GFRP bars 491 under the combined effects of sustained load and severe environments. In: Teng JG, Dai JG, editors. 492 CICE 2016 - 8th Int. Conf. Fibre-Reinforced Polym. Compos. Civ. Eng., Hong Kong, China: 2016, p. 493 828–34.
494 [55] Ceroni F, Cosenza E, Gaetano M, Pecce M. Durability issues of FRP rebars in reinforced concrete 495 members. Cem Concr Compos 2006;28:857–68. doi:10.1016/j.cemconcomp.2006.07.004.
496