Embed Size (px)
Citation preview
Effect of Temperature on Silica and Silica Xerogels as
Measured by Low-Temperature (-1 96OC.) Nitrogen Adsorption
A. H. TAYLOR' and R. A. ROSS Department of Chemistry, College of Technology, Belfast, Northern Ireland
low-temperature (-1 96' C.) nitrogen adsorption-desorption isotherms have been measured on pure silica and a range of silica xerogels thermally modified from 240' to 1 1 0 0 O C. B.E.T. surface areas and pore distribution characteristics are reported for each material. Results indicate that thermal modification has a significant effect on the surface areas and distribution data, especially above 700OC. In the majority of cases, B.E.T. areas are greater than the equivalent cumulative data. A range of noncylindrical pores is indicated in each material. With the exception of Macroporous silica gel, both the adsorption and desorption branches of the isotherms can be used for pore volume and surface area distribution determinations. In the former case, the desorption branch of the isotherm seems to lead to more apt results.
S I L I C A gels and silicas are widely used in industry, and a close understanding of the surface and bulk properties of such materials is of practical importance in the technology of cracking catalysts, catalyst supports, mineral processing, ceramics, and adsorbents. Such an understanding is, in addition, directly involved in the manufacture and use of siliceous fillers and thickening agents in organic systems, including paints, inks, elastomers, and lubricating greases.
Recent studies have been reported of the sorption of ammonia ( 6 ) , ethylamine (23, 24) , and sulfur dioxide (14) on silicas and silica xerogels of high purity. Surface and structural modifications were achieved by thermal treat- ments, largely in the range 240" to 1100" C. T o characterize the materials, a large number of low-temperature (-196" C.) nitrogen adsorption-desorption isotherms were determined.
Low-temperature gas adsorption isotherms have been widely used in the past to evaluate the effects of heat treatment on silica gel and gel-like structures (1, 2, 3, 5, I O , 18, 21, 22), particularly by the application of the B.E.T. equations (5). The method was used here to charac- terize materials, with special regard to surface area. Additional detailed information on pore-size distributions has been obtained by applying the Cranston and Inkley method (7) to the isotherms. This method provides independent comparative surface area data (to the B.E.T. values) and can be applied to both the adsorption and desorption branches of the isotherms. The results were calculated on the assumption of a molecular cross-sectional area for nitrogen of 16.2 A.2 (the most frequently used figure). However, there have been suggestions that the quadrupole moment of nitrogen can interact with hydroxyl or other polar groups, leading to a change in cross-sectional area (19). In spite of this, nitrogen adsorption generally gives the most meaningful results in low-temperature adsorption studies.
Results from the adsorption measurements and from the isotherms were analyzed with the aid of an Elliott 803 computer .
EXPERIMENTAL
Materials. The major portion of the study was carried out with Davison 923 chromatographic grade silica gel (> 99.98% pure). I ts surface area was 630 meters' per gram (B.E.T.: X2, -196OC.) and lump density, 1.145 grams per cc. The particle size range was 75 to 150 microns. Before
' Present address: Tyco Laboratories, Inc., Waltham, Mass. 02154
use, it was heated in air a t 240°C. for three hours, cooled in a desiccator (P205), weighed, and transferred quickly to the sorption apparatus.
Additional materials with the following properties were presented by Joseph Crosfield and Sons, Ltd.
Microporous Sorbsil silica gel. Surface area (B.E.T.: N2, -196"C.), 730 meters' per gram; lump density, 1.217 grams per cc.; particle size range, 75 to 150 microns.
Macroporous silica gel. 215 meters' per gram, 0.336 gram per cc., 75 to 150 microns.
High Surface Area silica gel. 840 meters' per gram, 1.120 grams per cc., 500 to 2000 microns.
Neosyl F.X. pure silica. 690 meters' per gram, 0.258 gram per cc., 40 to 100 microns.
The first three materials were shown by chemical analysis to contain iron up to 25 p.p.m. as the principal impurity.
Apparatus. Lump densities were measured by immersion in mercury (13) after heat treatment a t 240°C. for three hours in air.
Mercury has a high surface tension and a large contact angle, and is thus unable to enter pores of radius below about 50,000 A., when a 1-atm. pressure exists across the meniscus. To measure this mercury density, an all-glass vacuum apparatus similar to that used by Jepson (13) was employed. Data were obtained on the out-gassed sample (90" C. for one hour) by measuring the volume of the sample container and the weight of mercury required to fill the container to a preset mark in the presence of the material under investigation. Measurements were made a t 20" C. The mercury density, D, was then calculated from the equation .
where W , = weight of material W, = weight of mercury in sample container
V = volume of sample contalner DT = density of mercury at 20" C.
Duplicate determinations were within an experimental error of lLC.
Important surface parameters such as surface area and pore-size distribution were measured here using the low- temperature gas adsorption technique (N?: -196" C.) devel- oped by Brunauer et al. (5). A brief review of the theory behind such measurements is given in a subsequent section.
VOL. 14, No. 3, JULY 1969 347
A constant-volume apparatus similar to that of Joyner (15) was used for the measurement of the low-temperature nitrogen adsorption isotherms. The essential features are described below.
The pumping system consisted of a two-stage mercury diffusion pump backed by a two-stage rotary oil pump. Mercury vapor was prevented from entering the low- pressure side of the apparatus by a liquid nitrogen trap. Vacuum was measured with a Pirani-type gage (Model S j 2 ) of range 2 x lo-’ to lo-‘ mm. of Hg and a McLeod gage mm. of Hg). The apparatus easily held a vacuum of lo-’ mm. of Hg over seven days.
Purified “white spot” cylinder nitrogen (99.9%) was sup- plied by the British Oxygen Company, Ltd. This was stored in pre-evacuated apparatus over two columns (35 cm. by 4 cm.) packed with alternate layers of self-indicating silica gel and calcium chloride. The gas admittance section consisted of the nitrogen purification and storage system and, in addition, a system of taps. These taps were arranged so that small quantities of nitrogen could be admitted to the measuring section as required. This was necessary to prevent sudden upsurges of gas forcing the large quantities of mercury enclosed in the apparatus into the adsorption system, and to obtain an even distribution of points on the isotherms.
Essential features of the measuring system included a small “dead space” (10.3 cc.) and a small plug of 0.001- inch gold foil (23.75 carat purity) to prevent mercury vapor contacting the adsorbate. The dead space was made as small as possible with the aid of capillary tubing and small- bore vacuum taps. I t was calculated from the ideal gas law for room and liquid nitrogen temperatures. The average temperature of the sample flask when immersed in liquid nitrogen and the saturation pressure of the adsorbate were determined with the aid of an incorporated vapor pressure thermometer (20) . To assist in the reduction of the dead space, a combined gas buret and manometer were employed. The buret was thermostatted (20” + 0.l.C.) and was pre- calibrated with mercury before use. The volumes of gas adsorbed and the corresponding pressure readings were taken with a cathetometer reading to &0.001 cm. A dif- ference of 1 cc. on the burette was equivalent to a differential reading of 1.105 cm. on the cathetometer. This relationship was obtained over the whole burette span. The zero level on the burette was kept constant with the aid of a mercury reservoir.
Isotherms measured with this equipment were reproduc- ible to better than +5%.
Hydroxyl group concentrations were determined gravi- metrically by direct calcination of the samples in air ( 2 4 ) .
THEORY
The most widely used method a t present to characterize materials with regard to surface area and pore size distribu- tion (up to 300-A. pore diameter) is that of low-temperature (usually -196” C.) gas adsorption. Brunauer et al. ( 5 ) devel- oped an expression for the adsorption of a gas on a solid. This was based on Langmuir’s original concept (1 1 ) of monolayer adsorption and was extended to take account of multilayer adsorption on the solid. Constant heats of adsorption in the first and subsequent layers were assumed, and were considered equal to the heat of liquefaction of the adsorbate. The most widely used form of their expression is
( 2 ) where
p / V(po - p ) = 1/ VmC + (C - l ) p VmCp,
V = volume of gas adsorbed a t equilibrium pressure p (cc.) p o = saturation vapor pressure of adsorbate (mm. of Hg)
Vm = the volume of gas contained in the monolayer (cc.) C = constant which is related t o the heats of adsorption and
liquefaction of the gas
Normally, a plot of p V (p , - p ) against p p . yields a straight line of slope (C - 1) / VmC and intercept 1 / VmC. Hence, values for Vm and C can be obtained. The equation usually holds over the range 0.05 < p p o < 0.35. These limits were not valid in the present study. The specific surface area is evaluated from Vm by means of the equation
n! V
S = V m - A ( 3 )
where
V = molar volume (22,400 cc. a t S.T.P.) N = Avogadro’s number ( N = 6.023 x 10‘’ molecules mole ‘1 A = area occupied per molecule in the adsorbed phase
The generally accepted value for nitrogen is A = 16.2 A.2, as derived from the density of liquid nitrogen. Hence, for nitrogen adsorption a t -196” C., the relationship becomes
S = 4.36 Vm (4) In spite of the generally accepted invalidity of many
of the original assumptions in the B.E.T. theory, it still remains the most widely used method for surface area determination and gives absolute values which are generally accurate to within +1O‘c.
In addition to surface area, low-temperature gas adsorp- tion can provide data on pore-size distributions. In this study, the method of Cranston and Inkley (7) has been used to derive such data. This is a development of the method of Barrett et al. ( 2 ) and has three novel features:
I t is more exact than that of Barrett et al., and provides an estimate of total specific surface which is almost independent of the BET value and may therefore be com- pared with it. A comparison of pore volumes calculated in two ways is also available.
The method may be applied to either the adsorption or desorption branch of the isotherm.
Such differences as exist between the cumulative and the B.E.T. surface areas, and also between the two estimates of pore volume, are not to be regarded purely as experimental errors. The differences provide a measure of the validity of the physical assumptions made, and therefore give an indication of the character of the pores in the materials.
In terms of pore diameters, the working equation is
where
t , and tr
an increment of pore diameter (A,) the volume of pores having diameters between (d - ]?Ad)
diameter of the largest pore volume of pores having diameters between dl and d, (cc.)
4(t> - t l )
are the adsorbed laver thicknesses corresponding
and (d + 1JAd)
(tl + t,)
to pressures PI and p? . RU includes terms such as r l , rr , and t.
Tables of values for R1?, k l? and the factor (d - 2 t ) / d 2 are provided in Cranston and Inkley’s original paper ( 7 ) .
The method is widely used a t present to obtain pore- size distribution data on porous materials. Complications arise from the variety of pore shapes found in these mate- rials, since the original assumption of cylindrical pores is invalidated. Also, the angle of contact is taken to be zero, and the density and surface tension of the adsorbate in the pores are both assumed to have the same values as the bulk liquid. In spite of this, the method is still one
348 JOURNAL OF CHEMICAL AND ENGINEERING DATA
of the best means of obtaining pore distribution data in the range 20- to 300-A. pore diameters. The average pore diameter in the material under investigation may also be calculated from the relevant data.
RESULTS
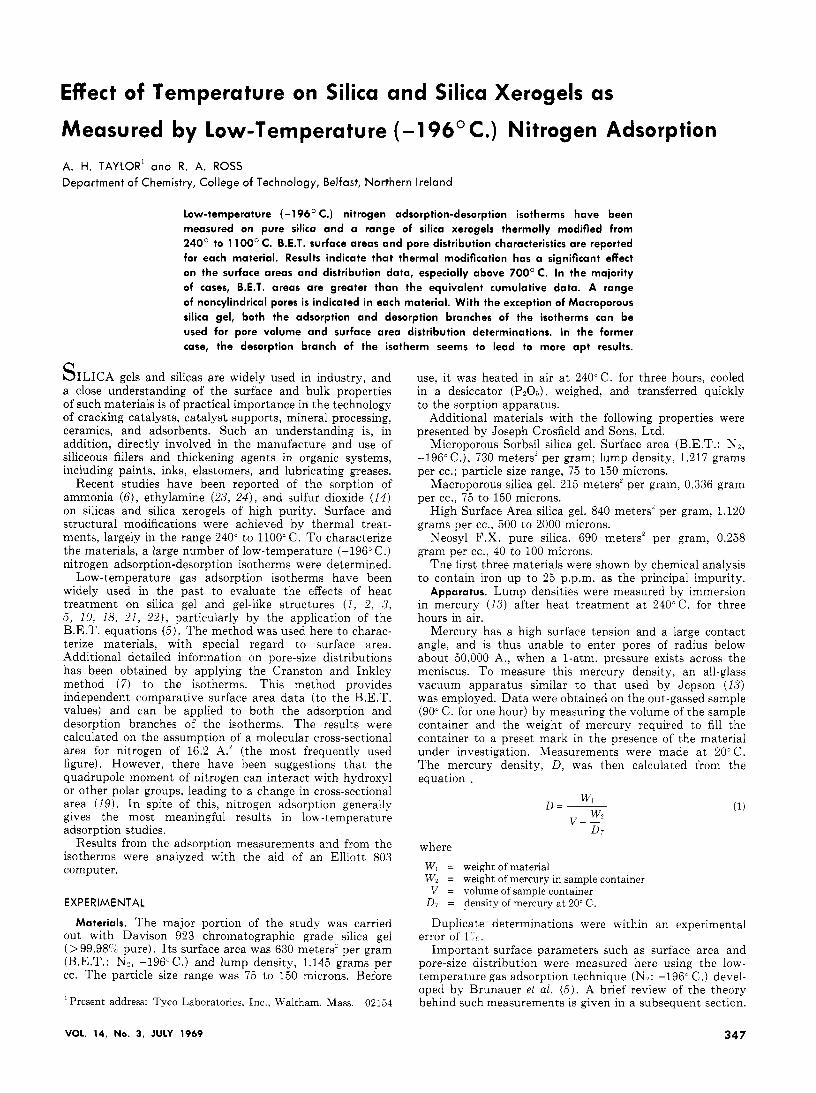
Davison Silica Xerogel. The adsorption-desorption iso- therms on Davison silica gel are shown in Figure 1 for samples treated in air a t 240°C. for three hours, and for 20 hours a t 500°, 600°, 700°, SOO", and 900°C. After treat- ment, each sample was placed in the adsorption apparatus and carefully evacuated to mm. of Hg. An additional out-gassing a t 90°C. for another hour under a vacuum of IO-' to mm. of Hg was then carried out.
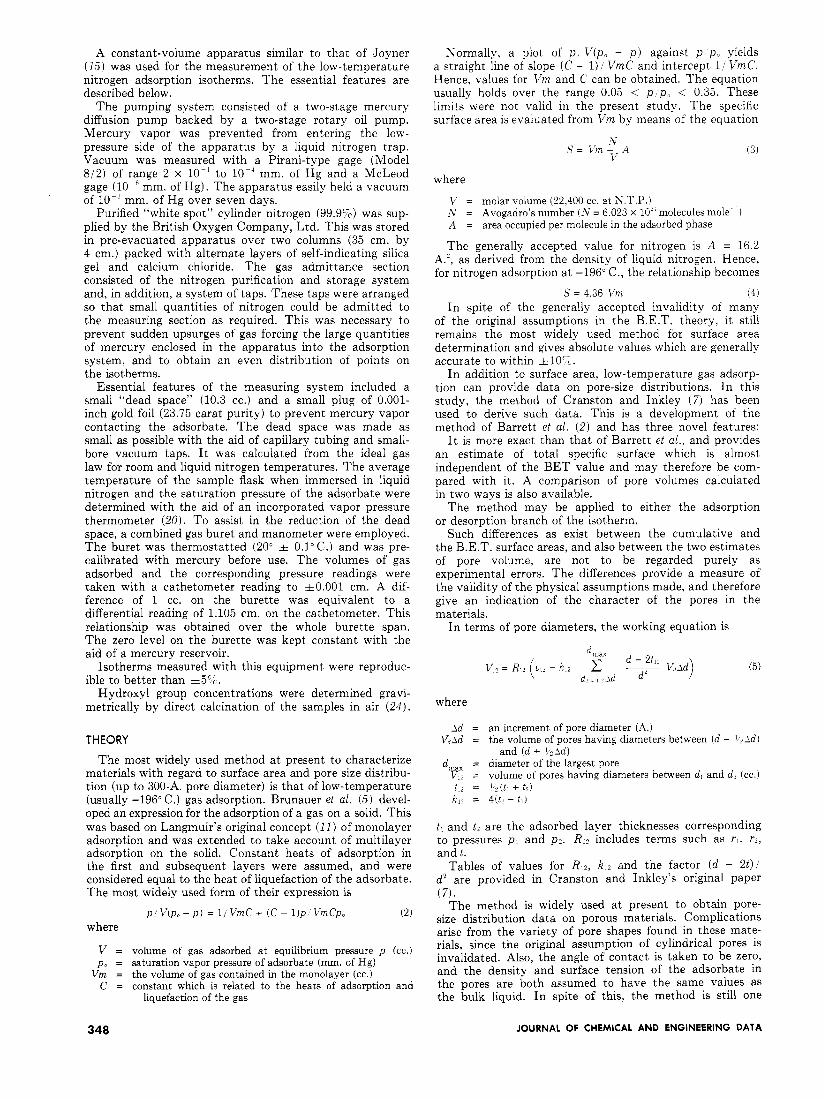
Each isotherm at -196" C. shows a relatively large initial adsorbed quantity of nitrogen. The monolayers appear to be complete a t p / p o = 0.085, 0.091, 0.091, 0.102, 0.103, and 0.109 for the samples treated a t 240", 500", 600", 700", SOO", and 900°C., respectively. B.E.T. plots of the adsorp- tion (Figure 2 ) are all straight lines holding over the relative pressure ranges noted in Table I.
0 I I I , , I 0 01 0 2 0 3 0 4 0 5 0 6 07 0 8 0 9 I O
P I P .
The decrease in the total adsorbed quantity of nitrogen ( p / p o = l . O ) , with increase in dehydration temperature, is most pronounced above 700°C. (Figure 1). A steady compression of the hysteresis loop with increasing dehydra- tion temperature is also apparent. Up to p / p o = 0.5, adsorp- tion equilibrium times of 30 minutes were required. From p i p o = 0.5 to 1.0, times of 60 minutes were necessary. On desorption, equilibrium was attained within 60 minutes from p / p o = 1.0 to 0.4. Below this point, 30 minutes sufficed.
Pore-size distribution data (both surface area and pore volume) were obtained from these isotherms using the method of Cranston and Inkley (7) (Figures 3 to 5 ) . Surface physical data calculated from this and the B.E.T. method are summarized in Tables I and 11.
Figure 3.shows that, as the temperature of heat treatment is increased from 240" to 900°C., there is no marked change in the distribution of pores. However, the number of pores having the same diameters decreases slowly up to 700" C.,
I I I , 0 900'
n 0000
Q 700'
i 600.
Figure 1 . Nitrogen adsorption-desorption isotherms (-1 96" C.) on Davison silica xerogel dehydrated from 240" to 900°C: a) 240°C.; b) 500°C.; c) 600°C.; d) 700°C.; e) 800°C.;
f) 900" C.
P I P .
Figure 2. B.E.T. plots of nitrogen adsorption on Davison silica xerogel dehydrated from 240" to 900" C.
a b
C
d e
f
g
h
i
j
Material
Microporous Gel Neosyl F.X. pure silica
Macroporous silica gel High Surface Area gel Davison 923 chromatographic
low iron silica
grade silica gel 100-200 mesh pre-treated a t 240' C.
pre-treated a t 500" C.
pre-treated a t 600; C.
pre-treated a t 700" C.
pre-treated a t 800" C.
pre-treated a t 900" C.
Davison 923 gel
Davison 923 gel
Davison 923 gel
Davison 923 gel
Davison 923 gel
Table I. B.E.T. Data for Silica Gels and Silica
B.E.T. Data S, specific
Linearity, B.E.T. surface, P P o Slope Intercept "C" value meter'lg.
0.05-0.15 5.934 x 1 0 ~ 3.5 x 10 170.6 730.0 0.05-0.15 6.320 x 10 4.5 x 1 0 ~ j 141.5 685.0
0.05-0.125 2.001 x lo- ' 2.75 x l o - - 53.78 215.0 0.05-0.15 5.177 x l o - ' 3.6 x 10.' 144.8 830.0 0.05-0.175 6.914 x 10." 5.5 x 10-j 126.7 630.0
0.05-0.175 7.020 x 10 5.2 x 10 136.0 615.0
0 05-0.20 5.929 x 10 7.8 x 10 102.6 545.0
0.05-020 8.909 x 10 1.06 x 10 ' 85.04 485.0
0.05-0.20 1.191 x 10 1.53 x 10 ' 78.81 360.0
0.05-0.20 2.694 x 10 ' 3.7 x 10 73.82 160.0
VOL. 14, No. 3, JULY 1969 349
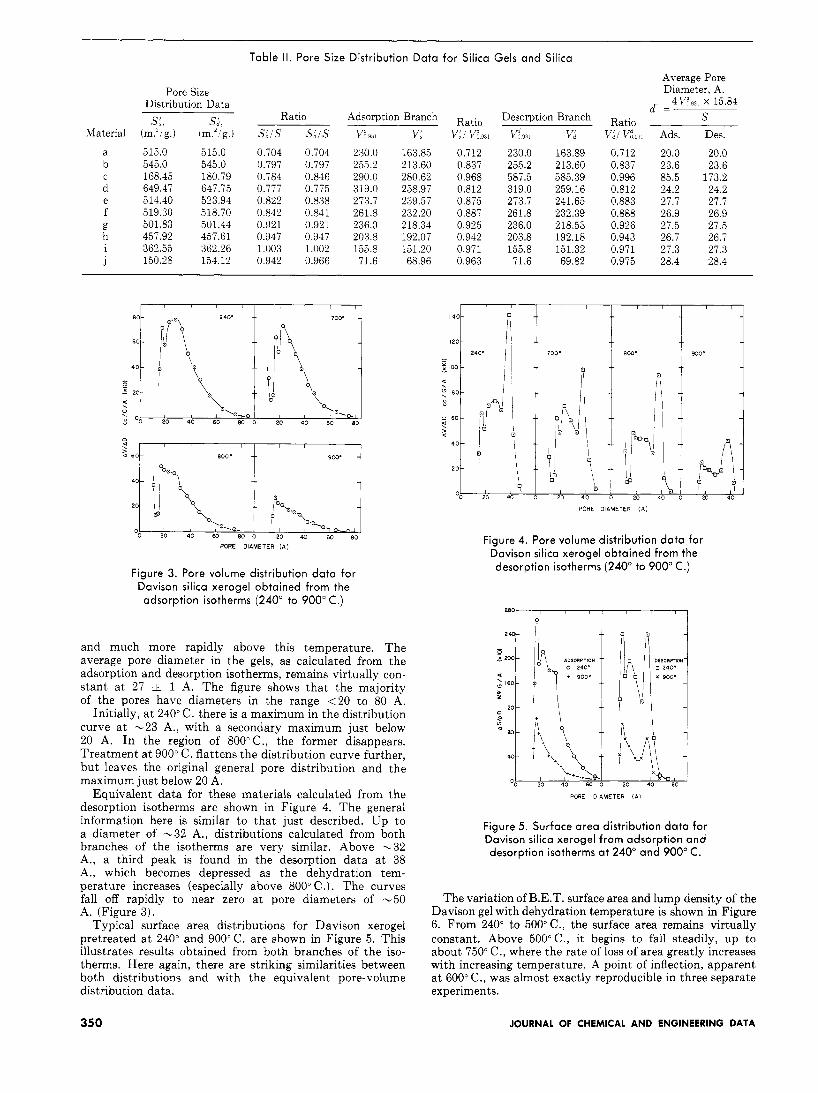
Table II. Pore Size Distribution Data for Silica Gels and Silica
Pore Size Distribution Data
Material
a b
d e f g h i
C
j
Si, Si, (m.'/g.) (m.'/ 9.)
515.0 515.0 545.0 545.0 168.45 180.79 649.47 647.75 514.40 523.94 519.30 518.70 501.83 501.44 457.92 457.61 362.55 362.26 150.28 154.12
Ratio SiIS SiIS
0.704 0.704 0.797 0.797 0.784 0.846 0.777 0.775 0.822 0.838 0.842 0.841 0.921 0.921 0.947 0.947 1.003 1.002 0.942 0.966
Adsorption Branch
K,%I V , 230.0 163.85 255.2 213.60 290.0 280.62 319.0 258.97 273.7 239.57 261.8 232.20 236.0 218.34 203.8 192.07 155.8 151.20 71.6 68.96
Ratio vi1 ED1
0.712 0.837 0.968 0.812 0.875 0.887 0.925 0.942 0.971 0.963
Desorption Branch
V:W, Vi 230.0 163.89 255.2 213.60 587.5 585.39 319.0 259.16 273.7 241.65 261.8 232.39 236.0 218.53 203.8 192.18 155.8 151.32 71.6 69.82
Ratio MI v;,,,
0.712 0.837 0.996 0.812 0.883 0.888 0.926 0.943 0.971 0.975
Average Pore Diameter, A.
4V;fm X 15.84 S
d =
Ads. Des.
20.0 20.0 23.6 23.6 85.5 173.2 24.2 24.2 27.7 27.7 26.9 26.9 27.5 27.5 26.7 26.7 27.3 27.3 28.4 28.4
PORE DIAMETER ( A i
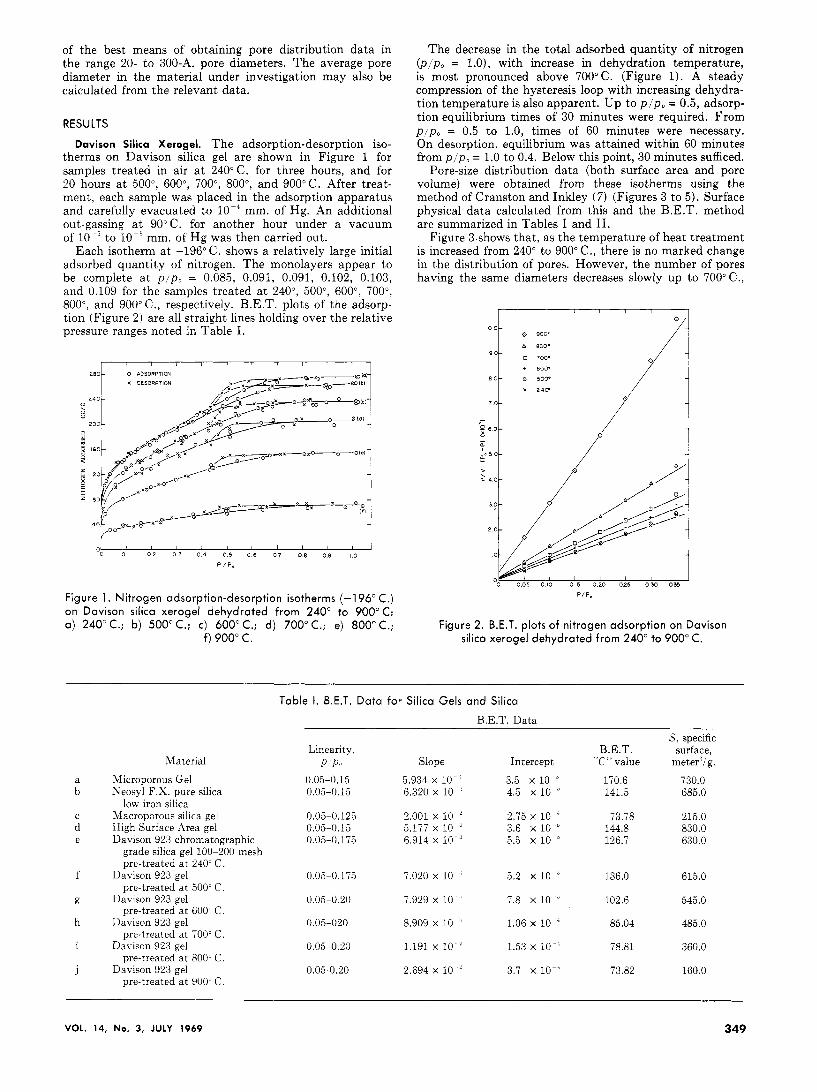
Figure 3. Pore volume distribution data for Davison silica xerogel obtained from the adsorption isotherms (240" to 900" C.)
and much more rapidly above this temperature. The average pore diameter in the gels, as calculated from the adsorption and desorption isotherms, remains virtually con- stant a t 27 * 1 A. The figure shows that the majority of the pores have diameters in the range <20 to 80 A.
Initially, a t 240" C. there is a maximum in the distribution curve a t -23 A. , with a secondary maximum just below 20 A. In the region of 800°C., the former disappears. Treatment a t 900" C. flattens the distribution curve further, but leaves the original general pore distribution and the maximum just below 20 A.
Equivalent data for these materials calculated from the desorption isotherms are shown in Figure 4. The general information here is similar to that just described. Up to a diameter of -32 A . , distributions calculated from both branches of the isotherms are very similar. Above -32 A,, a third peak is found in the desorption data a t 38 A., which becomes depressed as the dehydration tem- perature increases (especially above 800" (2.). The curves fall off rapidly to near zero a t pore diameters of -50 A. (Figure 3) .
Typical surface area distributions for Davison xerogel pretreated a t 240" and 900" C. are shown in Figure 5 . This illustrates results obtained from both branches of the iso- therms. Here again, there are striking similarities between both distributions and with the equivalent pore-volume distribution data.
PORE DIAMETER ( A I
Figure 4. Pore volume distribution data for Davison silica xerogel obtained from the desorption isotherms (240" to 900" C.)
280r , , , I
, I t
I I I / I
1 I
Figure 5. Surface area distribution data for Davison silica xerogel from adsorption and desorption isotherms at 240" and 900" C.
The variation of B.E.T. surface area and lump density of the Davison gel with dehydration temperature is shown in Figure 6. From 240" to 500" C., the surface area remains virtually constant. Above 5OO0C., it begins to fall steadily, up to about 750" C., where the rate of loss of area greatly increases with increasing temperature. A point of inflection, apparent a t 600" C., was almost exactly reproducible in three separate experiments.
350 JOURNAL OF CHEMICAL AND ENGINEERING DATA
360 , , , , , I , , , , 7001----23
I C ! l l l l
( 0 1 ( b l
"f0I 5 400
2 0 0 c
0 4RE4 0 DENSITY
1' <
-113
TEMPERATURE " C
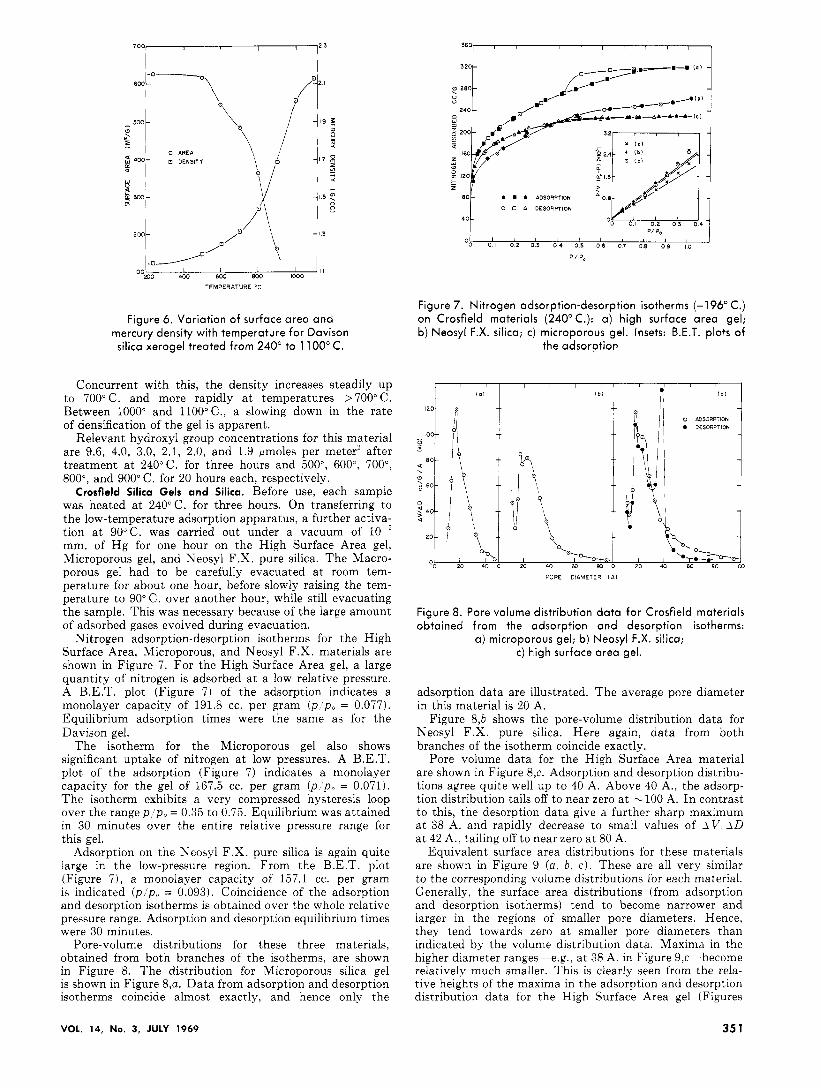
Figure 6. Variation of surface area and mercury density with temperature for Davison silica xerogel treated from 240" to 1 100" C.
Concurrent with this, the density increases steadily up to 700°C. and more rapidly a t temperatures >700°C. Between 1000" and llOO°C., a slowing down in the rate of densification of the gel is apparent.
Relevant hydroxyl group concentrations for this material are 9.6, 4.0, 3.0, 2.1, 2.0, and 1.9 lmoles per meter' after treatment a t 240°C. for three hours and 500", 600", 700", 800°, and 900" C. for 20 hours each, respectively.
Crosfield Silica Gels and Silica. Before use, each sample was heated at 240°C. for three hours. On transferring to the low-temperature adsorption apparatus, a further activa; tion a t 90°C. was carried out under a vacuum of lo-" mm. of Hg for one hour on the High Surface Area gel, Microporous gel, and Neosyl F.X. pure silica. The Macro- porous gel had to be carefully evacuated a t room tem- perature for about one hour, before slowly raising the tem- perature to 90" C. over another hour, while still evacuating the sample. This was necessary because of the large amount of adsorbed gases evolved during evacuation.
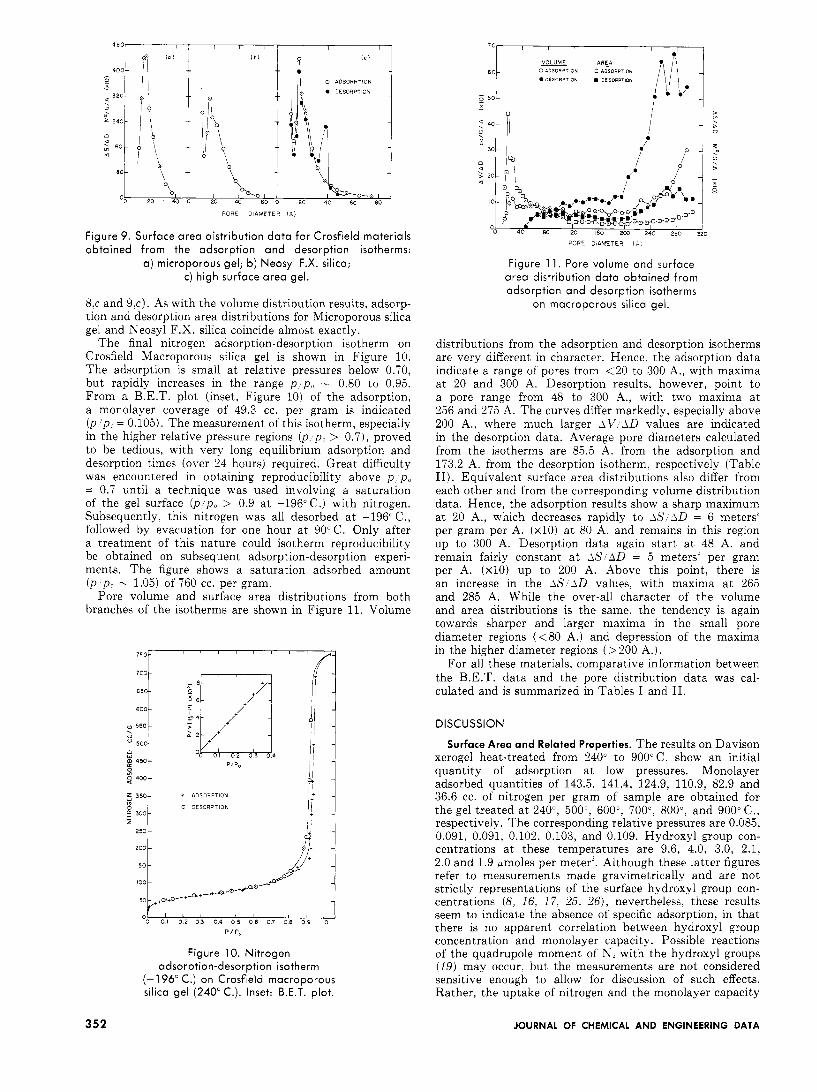
Nitrogen adsorption-desorption isotherms for the High Surface Area, Microporous, and Neosyl F.X. materials are shown in Figure 7. For the High Surface Area gel, a large quantity of nitrogen is adsorbed a t a low relative pressure. A B.E.T. plot (Figure 7) of the adsorption indicates a monolayer capacity of 191.8 cc. per gram ( p p . = 0.077). Equilibrium adsorption times were the same as for the Davison gel.
The isotherm for the Microporous gel also shows significant uptake of nitrogen a t low pressures. A B.E.T. plot of the adsorption (Figure 7 ) indicates a monolayer capacity for the gel of 167.5 cc. per gram ( p p o = 0.071). The isotherm exhibits a very compressed hysteresis loop over the range p i p . = 0.35 to 0.75. Equilibrium was attained in 30 minutes over the entire relative pressure range for this gel.
Adsorption on the Neosyl F.X. pure silica is again quite large in the low-pressure region. From the B.E.T. plot (Figure 7), a monolayer capacity of 157.1 cc. per gram is indicated (p p o = 0.093). Coincidence of the adsorption and desorption isotherms is obtained over the whole relative pressure range. Adsorption and desorption equilibrium times were 30 minutes.
Pore-volume distributions for these three materials, obtained from both branches of the isotherms, are shown in Figure 8. The distribution for Microporous silica gel is shown in Figure 8 4 . Data from adsorption and desorption isotherms coincide almost exactly, and hence only the
320r
I 0 0 I DESORPTION I kX ,Ot
Figure 7. Nitrogen adsorption-desorption isotherms (-1 96" C.) on Crosfield materials (240°C.): a) high surface area gel; b) Neosyl F.X. silica; c) microporous gel. Insets: B.E.T. plots of
the adsorption
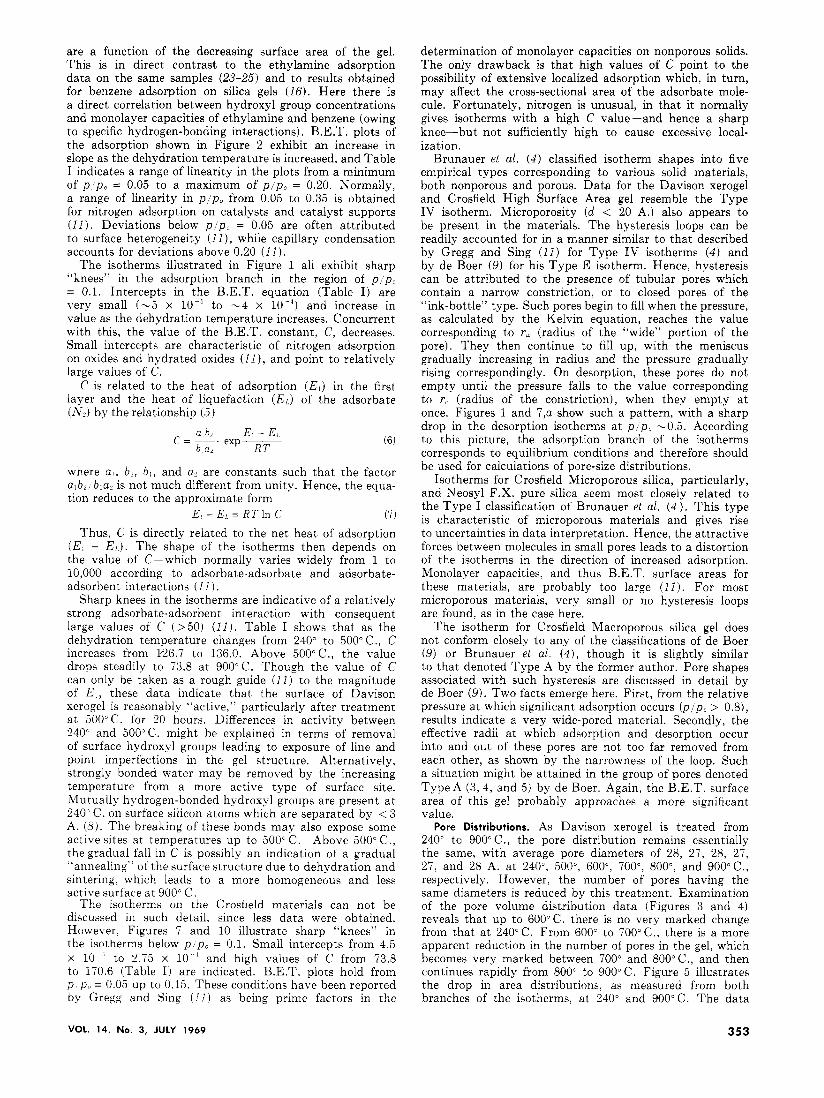
PORE DIAMETER I A )
Figure 8. Pore volume distribution data for Crosfield materials obtained from the adsorption and desorption isotherms:
a) microporous gel; b) Neosyl F.X. silica; c) high surface area gel.
adsorption data are illustrated. The average pore diameter in this material is 20 A.
Figure 8,b shows the pore-volume distribution data for Neosyl F.X. pure silica. Here again, data from both branches of the isotherm coincide exactly.
Pore volume data for the High Surface Area material are shown in Figure 8,c. Adsorption and desorption distribu- tions agree quite well up to 40 A. Above 40 A., the adsorp- tion distribution tails off to near zero at - 100 A. In contrast to this, the desorption data give a further sharp maximum at 38 A. and rapidly decrease to small values of AV AD a t 42 A., tailing off to near zero a t 80 A.
Equivalent surface area distributions for these materials are shown in Figure 9 ( u , b , e ) . These are all very similar to the corresponding volume distributions for each material. Generally, the surface area distributions (from adsorption and desorption isotherms) tend to become narrower and larger in the regions of smaller pore diameters. Hence, they tend towards zero a t smaller pore diameters than indicated by the volume distribution data. Maxima in the higher diameter ranges-e.g., a t 38 A. in Figure 9,c-become relatively much smaller. This is clearly seen from the rela- tive heights of the maxima in the adsorption and desorption distribution data for the High Surface Area gel (Figures
VOL. 14, No. 3, JULY 1969 35 1
70 I I I , I I
01 ' ' I 1 ' I ' 1 I ' I
\
PORE DIAMETER ( A I
250
2 0 0
150-
100
so
Figure 9. Surface area distribution data for Crosfield materials obtained from the adsorption and desorption isotherms:
a) microporous gel; b) Neosyl F.X. silica; c) high surface area gel.
8,c and 9,c). As with the volume distribution results, adsorp- tion and desorption area distributions for Microporous silica gel and Neosyl F.X. silica coincide almost exactly.
The final nitrogen adsorption-desorption isotherm on Crosfield Macroporous silica gel is shown in Figure 10. The adsorption is small a t relative pressures below 0.70, but rapidly increases in the range p p o - 0.80 to 0.95. From a B.E.T. plot (inset, Figure 10) of the adsorption, a monolayer coverage of 49.3 cc. per gram is indicated ( p p o = 0.105). The measurement of this isotherm, especially in the higher relative pressure regions ( p p . > 0.7), proved to be tedious, with very long equilibrium adsorption and desorption times (over 24 hours) required. Great difficulty was encountered in obtaining reproducibility above p p o = 0.7 until a technique was used involving a saturation of the gel surface ( p p . > 0.9 a t -196'C.) with nitrogen. Subsequently, this nitrogen was all desorbed a t -196" C., followed by evacuation for one hour a t 90'C. Only after a treatment of this nature could isotherm reproducibility be obtained on subsequent adsorption-desorption experi- ments. The figure shows a saturation adsorbed amount ( p p o - 1.05) of 760 cc. per gram.
Pore volume and surface area distributions from both branches of the isotherms are shown in Figure 11. Volume
- -
-
;++a+o-+ +-
#
5 3501 + ODSORPTION
0 JESORPTION f - 3001 z li
Figure 10. Nitrogen adsorption-desorption isotherm
(-196" C.) on Crosfield macroporous silica gel (240" C.). Inset: B.E.T. plot.
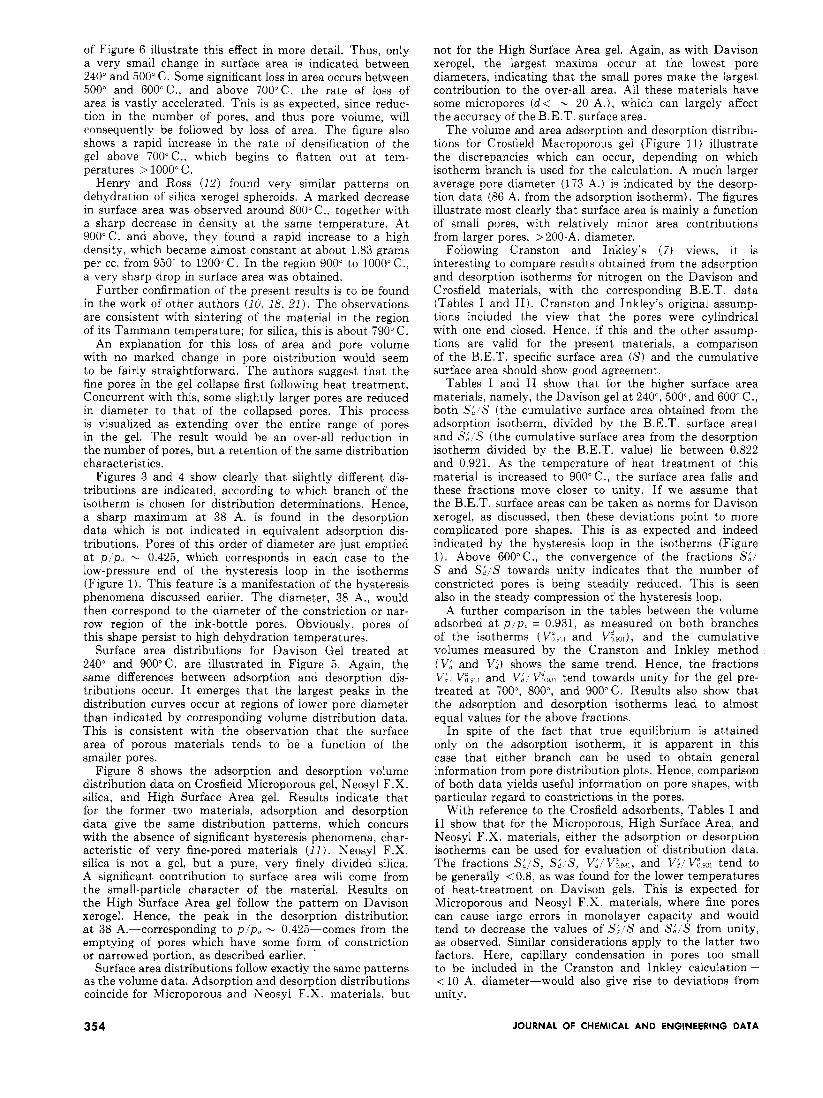
PORE DIAWETER lh
Figure 1 1 . Pore volume and surface area distribution data obtained from adsorption and desorption isotherms
on macroporous silica gel.
distributions from the adsorption and desorption isotherms are very different in character. Hence, the adsorption data indicate a range of pores from <20 to 300 A., with maxima a t 20 and 300 A. Desorption results, however, point to a pore range from 48 to 300 A., with two maxima at 256 and 275 A. The curves differ markedly, especially above 200 A., where much larger AV AD values are indicated in the desorption data. Average pore diameters calculated from the isotherms are 85.5 A. from the adsorption and 173.2 A. from the desorption isotherm, respectively (Table 11). Equivalent surface area distributions also differ from each other and from the corresponding volume distribution data. Hence, the adsorption results show a sharp maximum a t 20 A., which decreases rapidly to AS AD = 6 meters' per gram per A. ( ~ 1 0 ) a t 80 A. and remains in this region up to 300 A. Desorption data again start a t 48 A. and remain fairly constant a t AS AD = 5 meters' per gram per A. ( ~ 1 0 ) up to 200 A. Above this point, there is an increase in the AS AD values, with maxima a t 265 and 285 A. While the over-all character of the volume and area distributions is the same, the tendency is again towards sharper and larger maxima in the small pore diameter regions (<80 A.) and depression of the maxima in the higher diameter regions (> 200 A.).
For all these materials, comparative information between the B.E.T. data and the pore distribution data was cal- culated and is summarized in Tables I and 11.
DISCUSSION
Surface Area and Related Properties. The results on Davison xerogel heat-treated from 240" to 900°C. show an initial quantity of adsorption a t low pressures. Monolayer adsorbed quantities of 143.5, 141.4, 124.9, 110.9, 82.9 and 36.6 cc. of nitrogen per gram of sample are obtained for the gel treated a t 240", 500°, 600", 700°, 800°, and 900" C., respectively. The corresponding relative pressures are 0.085, 0.091, 0.091, 0.102, 0.103, and 0.109. Hydroxyl group con- centrations a t these temperatures are 9.6, 4.0, 3.0, 2.1, 2.0 and 1.9 pmoles per meter'. Although these latter figures refer to measurements made gravimetrically and are not strictly representations of the surface hydroxyl group con- centrations (8, 16, 17, 25, 26) , nevertheless, these results seem to indicate the absence of specific adsorption, in that there is no apparent correlation between hydroxyl group concentration and monolayer capacity. Possible reactions of the quadrupole moment of N j with the hydroxyl groups (19) may occur, but the measurements are not considered sensitive enough to allow for discussion of such effects. Rather, the uptake of nitrogen and the monolayer capacity
352 JOURNAL OF CHEMICAL AND ENGINEERING DATA
are a function of the decreasing surface area of the gel. This is in direct contrast to the ethylamine adsorption data on the same samples (23-25) and to results obtained for benzene adsorption on silica gels (16). Here there is a direct correlation between hydroxyl group concentrations and monolayer capacities of ethylamine and benzene (owing to specific hydrogen-bonding interactions). B.E.T. plots of the adsorption shown in Figure 2 exhibit an increase in slope as the dehydration temperature is increased, and Table I indicates a range of linearity in the plots from a minimum of p p o = 0.05 to a maximum of p ~ p . = 0.20. Normally, a range of linearity in p / p o from 0.05 to 0.35 is obtained for nitrogen adsorption on catalysts and catalyst supports (11). Deviations below p , p , = 0.05 are often attributed to surface heterogeneity ( I I), while capillary condensation accounts for deviations above 0.20 (11).
The isotherms illustrated in Figure 1 all exhibit sharp "knees" in the adsorption branch in the region of p p o = 0.1. Intercepts in the B.E.T. equation (Table I ) are very small (-5 x lo-' to -4 x and increase in value as the dehydration temperature increases. Concurrent with this, the value of the B.E.T. constant, C, decreases. Small intercepts are characteristic of nitrogen adsorption on oxides and hydrated oxides ( I l ) , and point to relatively large values of C.
C is related to the heat of adsorption ( E 1 ) in the first layer and the heat of liquefaction ( E L ) of the adsorbate (Nj ) by the relationship ( 5 )
where a , , bn, b l , and a? are constants such that the factor albr b lay is not much different from unity. Hence, the equa- tion reduces to the approximate form
El - E,, = RT In C ( 7 ) Thus, C is directly related to the net heat of adsorption
( E , - E L ) . The shape of the isotherms then depends on the value of C-which normally varies widely from 1 to 10,000 according to adsorbate-adsorbate and adsorbate- adsorbent interactions (11).
Sharp knees in the isotherms are indicative of a relatively strong adsorbate-adsorbent interaction with consequent large values of C (>50) ( 1 1 ) . Table I shows that as the dehydration temperature changes from 240" to 500"C., C increases from 1.26.7 to 136.0. Above 500"C., the value drops steadily to 73.8 a t 900°C. Though the value of C can only be taken as a rough guide (11) to the magnitude of E . , these data indicate that the surface of Davison xerogel is reasonably "active," particularly after treatment a t 500°C. for 20 hours. Differences in activity between 240" and 500'C. might be explained in terms of removal of surface hydroxyl groups leading to exposure of line and point imperfections in the gel structure. Alternatively, strongly bonded water may be removed by the increasing temperature from a more active type of surface site. Mutually hydrogen-bonded hydroxyl groups are present a t 240" C. on surface silicon atoms which are separated by < 3 A. (ti). The breaking of these bonds may also expose some active sites a t temperatures up to 500" C. Above 500" C., the gradual fall in C is possibly an indication of a gradual "annealing" of the surface structure due to dehydration and sintering, which leads to a more homogeneous and less active surface a t 900" C.
The isotherms on the Crosfield materials can not be discussed in such detail, since less data were obtained. However, Figures 7 and 10 illustrate sharp "knees" in the isotherms below p p o = 0.1. Small intercepts from 4.5 x 10 ' to 2.75 x 10 ' and high values of C from 73.8 to 170.6 (Table I ) are indicated. B.E.T. plots hold from p I p,, = 0.05 up to 0.15. These conditions have been reported by Gregg and Sing ( 1 2 ) as being prime factors in the
determination of monolayer capacities on nonporous solids. The only drawback is that high values of C point to the possibility of extensive localized adsorption which, in turn, may affect the cross-sectional area of the adsorbate mole- cule. Fortunately, nitrogen is unusual, in that it normally gives isotherms with a high C value-and hence a sharp knee-but not sufficiently high to cause excessive local- ization.
Brunauer et al. (4) classified isotherm shapes into five empirical types corresponding to various solid materials, both nonporous and porous. Data for the Davison xerogel and Crosfield High Surface Area gel resemble the Type IV isotherm. Microporosity (d < 20 A.) also appears to be present in the materials. The hysteresis loops can be readily accounted for in a manner similar to that described by Gregg and Sing (11) for Type IV isotherms (4) and by de Boer ( 9 ) for his Type E isotherm. Hence, hysteresis can be attributed to the presence of tubular pores which contain a narrow constriction, or to closed pores of the "ink-bottle" type. Such pores begin to fill when the pressure, as calculated by the Kelvin equation, reaches the value corresponding to r, (radius of the "wide" portion of the pore). They then continue to fill up, with the meniscus gradually increasing in radius and the pressure gradually rising correspondingly. On desorption, these pores do not empty until the pressure falls to the value corresponding to r, (radius of the constriction), when they empty a t once. Figures 1 and 7,a show such a pattern, with a sharp drop in the desorption isotherms a t p p o -0.5. According to this picture, the adsorption branch of the isotherms corresponds to equilibrium conditions and therefore should be used for calculations of pore-size distributions.
Isotherms for Crosfield Microporous silica, particularly, and Neosyl F.X. pure silica seem most closely related to the Type I classification of Brunauer et al. (4 ) . This type is characteristic of microporous materials and gives rise to uncertainties in data interpretation. Hence, the attractive forces between molecules in small pores leads to a distortion of the isotherms in the direction of increased adsorption. Monolayer capacities, and thus B.E.T. surface areas for these materials, are probably too large (11 ) . For most microporous materials, very small or no hysteresis loops are found, as in the case here.
The isotherm for Crosfield Macroporous silica gel does not conform closely to any of the classifications of de Boer (9) or Brunauer et al. ( 4 ) , though it is slightly similar to that denoted Type A by the former author. Pore shapes associated with such hysteresis are discussed in detail by de Boer ( 9 ) . Two facts emerge here. First, from the relative pressure a t which significant adsorption occurs ( p i p o > 0.8) , results indicate a very wide-pored material. Secondly, the effective radii a t which adsorption and desorption occur into and out of these pores are not too far removed from each other, as shown by the narrowness of the loop. Such a situation might be attained in the group of pores denoted Type A (3 ,4 , and 5) by de Boer. Again, the B.E.T. surface area of this gel probably approaches a more significant value.
Pore Distributions. As Davison xerogel is treated from 240" to 900" C., the pore distribution remains essentially the same, with average pore diameters of 28, 27, 28, 27, 27, and 28 A. a t 240", 500°, 600", 700", 800°, and 900"C., respectively. However. the number of pores having the same diameters is reduced by this treatment. Examination of the pore volume distribution data (Figures 3 and 4) reveals that up to 600°C. there is no very marked change from that a t 240°C. From 600" to 700"C., there is a more apparent reduction in the number of pores in the gel, which becomes very marked between 700" and 800°C., and then continues rapidly from 800" to 900°C. Figure 5 illustrates the drop in area distributions, as measured from both branches of the isotherms. a t 240" and 900°C. The data
VOL. 14, No. 3, JULY 1969 353
of Figure 6 illustrate this effect in more detail. Thus, only a very small change in surface area is indicated between 240" and 500" C . Some significant loss in area occurs between 500" and 600"C., and above 700°C. the rate ef loss of area is vastly accelerated. This is as expected, since reduc- tion in the number of pores, and thus pore volume, will consequently be followed by loss of area. The figure also shows a rapid increase in the rate of densification of the gel above 700°C., which begins to flatten out a t tem- peratures > 1000°C.
Henry and Ross (12) found very similar patterns on dehydration of silica xerogel spheroids. A marked decrease in surface area was observed around 800" C., together with a sharp decrease in density a t the same temperature. At 900'C. and above, they found a rapid increase to a high density, which became almost constant a t about 1.83 grams per cc. from 950" to 1200" C. In the region 900" to 1000" C., a very sharp drop in surface area was obtained.
Further confirmation of the present results is to be found in the work of other authors ( I O , 18, 21) . The observations are consistent with sintering of the material in the region of its Tammann temperature; for silica, this is about 790" C.
An explanation for this loss of area and pore volume with no marked change in pore distribution would seem to be fairly straightforward. The authors suggest that the fine pores in the gel collapse first following heat treatment. Concurrent with this, some slightly larger pores are reduced in diameter to that of the collapsed pores. This process is visualized as extending over the entire range of pores in the gel. The result would be an over-all reduction in the number of pores, but a retention of the same distribution characteristics.
Figures 3 and 4 show clearly that slightly different dis- tributions are indicated, according to which branch of the isotherm is chosen for distribution determinations. Hence, a sharp maximum a t 38 A. is found in the desorption data which is not indicated in equivalent adsorption dis- tributions. Pores of this order of diameter are just emptied a t p / p o - 0.425, which corresponds in each case to the low-pressure end of the hysteresis loop in the isotherms (Figure 1). This feature is a manifestation of the hysteresis phenomena discussed earlier. The diameter, 38 A., would then correspond to the diameter of the constriction or nar- row region of the ink-bottle pores. Obviously, pores of this shape persist to high dehydration temperatures.
Surface area distributions for Davison Gel treated a t 240" and 900°C. are illustrated in Figure 5. Again, the same differences between adsorption and desorption dis- tributions occur. I t emerges that the largest peaks in the distribution curves occur a t regions of lower pore diameter than indicated by corresponding volume distribution data. This is consistent with the observation that the surface area of porous materials tends to be a function of the smaller pores.
Figure 8 shows the adsorption and desorption volume distribution data on Crosfield Microporous gel, Neosyl F.X. silica, and High Surface Area gel. Results indicate that for the former two materials, adsorption and desorption data give the same distribution patterns, which concurs with the absence of significant hysteresis phenomena, char- acteristic of very fine-pored materials (11) . Neosyl F.X. silica is not a gel, but a pure, very finely divided silica. A significant contribution to surface area will come from the small-particle character of the material. Results on the High Surface Area gel follow the pattern on Davison xerogel. Hence, the peak in the desorption distribution a t 38 A.-corresponding to p / p o - 0.425-comes from the emptying of pores which have some form of constriction or narrowed portion, as described earlier. '
Surface area distributions follow exactly the same patterns as the volume data. Adsorption and desorption distributions coincide for Microporous and Xeosyl F.X. materials, but
not for the High Surface Area gel. Again, as with Davison xerogel, the largest maxima occur a t the lowest pore diameters, indicating that the small pores make the largest contribution to the over-all area. All these materials have some micropores (d< - 20 A.), which can largely affect the accuracy of the B.E.T. surface area.
The volume and area adsorption and desorption distribu- tions for Crosfield Macroporous gel (Figure 11) illustrate the discrepancies which can occur, depending on which isotherm branch is used for the calculation. A much larger average pore diameter (173 A.) is indicated by the desorp- tion data (86 A. from the adsorption isotherm). The figures illustrate most clearly that surface area is mainly a function of small pores, with relatively minor area contributions from larger pores, > 200-A. diameter.
Following Cranston and Inkley's (7) views, it is interesting to compare results obtained from the adsorption and desorption isotherms for nitrogen on the Davison and Crosfield materials, with the corresponding B.E.T. data (Tables I and 11). Cranston and Inkley's original assump- tions included the view that the pores were cylindrical with one end closed. Hence, if this and the other assump- tions are valid for the present materials, a comparison of the B.E.T. specific surface area ( S ) and the cumulative surface area should show good agreement.
Tables I and IT show that for the higher surface area materials, namely, the Davison gel a t 240°, 500°, and 600" C., both Si S (the cumulative surface area obtained from the adsorption isotherm, divided by the B.E.T. surface area) and Si S (the cumulative surface area from the desorption isotherm divided by the B.E.T. value) lie between 0.822 and 0.921. As the temperature of heat treatment of this material is increased to 9OO"C., the surface area falls and these fractions move closer to unity. If we assume that the B.E.T. surface areas can be taken as norms for Davison xerogel, as discussed, then these deviations point to more complicated pore shapes. This is as expected and indeed indicated by the hysteresis loop in the isotherms (Figure 1). Above 6OO0C., the convergence of the fractions SL/ S and S L S towards unity indicates that the number of constricted pores is being steadily reduced. This is seen also in the steady compression of the hysteresis loop.
A further comparison in the tables between the volume adsorbed a t p p a = 0.931, as measured on both branches of the isotherms (Vg93, and V,"93,), and the cumulative volumes measured by the Cranston and Inkley method (VL and Vi) shows the same trend. Hence, the fractions VL/ V:971 and Vi, Vgg3, tend towards unity for the gel pre- treated a t 700°, 800", and 900'C. Results also show that the adsorption and desorption isotherms lead to almost equal values for the above fractions.
In spite of the fact that true equilibrium is attained only on the adsorption isotherm, it is apparent in this case that either branch can be used to obtain general information from pore distribution plots. Hence, comparison of both data yields useful information on pore shapes, with particular regard to constrictions in the pores.
With reference to the Crosfield adsorbents, Tables I and I1 show that for the Microporous, High Surface Area, and Neosyl F.X. materials, either the adsorption or desorption isotherms can be used for evaluation of distribution data. The fractions SL/S, S $ / S , VL/ V ~ W , and V ~ / V $ W tend to be generally <0.8, as was found for the lower temperatures of heat-treatment on Davison gels. This is expected for Microporous and Neosyl F.X. materials, where fine pores can cause large errors in monolayer capacity and would tend to decrease the values of Si/S and S & S from unity, as observed. Similar considerations apply to the latter two factors. Here, capillary condensation in pores too small to be included in the Cranston and Inkley calculation- <10 A. diameter-would also give rise to deviations from unity.
354 JOURNAL OF CHEMICAL AND ENGINEERING DATA
For the Macroporous gel (Figure lo) , the desorption isotherm gives a much more significant picture of the pore structure. Hence, comparison between the B.E.T. surface area and cumulative area as determined from the adsorption isotherm leads to a figure of 0.784 for SL/S. On the other hand, SA/S = 0.846. Similarly, VL/V:931 = 0.968, whereas VA/Vig31 = 0.996. Calculations also reveal an average pore diameter for this material of 85.5 A., as measured from the adsorption data. Desorption data lead to a figure of 173.2 A. Analysis of the quantity of nitrogen adsorbed on this Macroporous material above and below p / p o - 0.9 shows that the latter figure is more likely to be correct, and substantiates the above view regarding the desorption isotherm.
Thus, both branches of the isotherms lead to similar results, with the exception of the Crosfield Macroporous gel, where the desorption data seem most apt. In most cases, comparison between volume distributions from both branches leads to useful insight into pore shapes. Cumulative surface areas (SL, SA) and volumes (VL, VA) are smaller than equivalent B.E.T. data ( S ) and saturation adsorbed volumes Vig3,) in all cases. This is particularly true for the Microporous mate- rials, where deviations are greatest (Table 11). As stated, all the present materials possess a degree of microporosity. Differences between the B.E.T. and cumulative results can then be attributed to two main factors. First, microporosity in porous solids leads to deviations in the B.E.T. monolayer capacities. Thus, in most cases, and especially with Micro- porous silica gel and Neosyl F.X. pure silica, the surface area (S) is undoubtedly too large. The second important factor is that differences in cumulative volumes and satura- tion adsorbed volumes can be attributed to capillary con- densation in pores too small to be included in the Cranston and Inkley calculation ( < l o A.). Thus, a certain fraction of the surface areas of these materials is not included in the cumulative area calculations, leading to the deviations noted in Table 11.
In addition to the factors outlined above, deviations from Cranston and Inkley’s original assumptions must be consid- ered. All the pores are not cylindrical with one end closed. This certainly changes the shapes of the pore distributions, but apparently does not affect the cumulative information obtained. Table I1 shows that similar values for all the fractions noted are found in calculations from both the adsorption and desorption isotherms. The exception to this is Crosfield Macroporous gel. Here, it seems more feasible to choose the desorption data for subsequent calculations. This material exhibits an isotherm characteristic of a porous solid having roughly spherical particles and large-diameter pores ( < 150 A.) approximately cylindrical in shape. Again, deviations between B.E.T. and cumulative data can only be attributed to the presence of microporosity in this gel.
NOMENCLATURE
S = specific surface areas from Table I SL = surface area obtained from the adsorption branch of the
isotherm (cumulative S A . )
SA =
E,,, =
V L =
surface area obtained from the desorption branch of the isotherm (cumulative S.A.)
volume of nitrogen adsorbed (cc. N.T.P. per gram) a t a relative pressure of 0.931 on the adsorption branch of the isotherm
volume of nitrogen adsorbed (cc. X.T.P. per gram) a t a relative pressure of 0.931 on the desorption branch of the isotherm
cumulative pore volume (cc . N.T.P. per gram) obtained from the adsorption branch of the isotherm
cumulative pore volume (cc. N.T.P. per gram) obtained from the desorption branch of the isotherm
an increment in pore volume (cc. N.T.P. per gram) an increment in surface area (meters2 per gram) an increment in pore diameter (A.)
LITERATURE CITED
(1) Barrer, R.M., McKenzie, N., Reay, J.S.S., J . Colloid Sei. 1 1 , 479 (1938).
(2) Barrett, E.P., Joyner L.G., Halenda, P.H., J . A m . Chern. SOC. 73, 373, (i95i) .
(3) Bartell, F.E., Almy, E.G., J Phys. Chern. 36, 375 (1932). (4) Brunauer. S.. Deming, L.S., Deming, W.E., Teller, E., J . , ,
Am. Chem. Soc. 62, 17n3 (1940). (5) Brunauer, S. Emmett, P.H., Teller, E., Ibid. 60, 309 (1938). (6) Boyle, T.W., Gaw, W.J., Ross, R.A., J . Chern. Sue. 1965,
p. 240. (7) Cranston, R.W., Inkley, F.A., Aduan. Catalysis 9, 143 (1957). (8) Davydov, V. Ya., Kiselev, A.V., Zhuravlev, L.T., Trans. Fura-
day Sue. 60, 2254 (1965). (9) de Boer, J.H., “The Structure and Properties of Porous
Materials,” D.H. Everett and F.S. Stone, E&., p. 68,, Butterworths, London, 1958.
(10) Goodman, J.F., Gregg, S.J., J . Chem. Sue. 1959, p. 694. (11) Gregg, S.J., Sing, K.S.W., “Adsorption, Surface Area and
Porosity,” Ch. 2, 3, 4, Academic Press, London, New York, 1967. Henry, K., Ross, R.A., J . Chem. Sue. 1965, p. 3854. Jepson, W.B., J . Sci. Instr. 36, 319 (1959). Jones, W.J., Ross, R.A., J . Chem. Soc. 1967, p. 1021. Joyner, L.G., Sei. Ind. Glassblouing 1944, p. 257. Kiselev, A.V., “Colston Papers,” p. 210, Buttenvorths, London, 1958. Kiselev, A.V., Lygin, V.I., Russ. Chem. Rec. (English Transl.)
(12) (13) (14) (15) (16)
(17) 31, 175 (1962). Malanchuk. M.. Stuart. E.B.. Ind. E m . Chem. 40. 1207 (1958). McClellan, A.L.’, Harnsberger, H.F., -J. Colloid InterjLe Sci. 23, 577 (1967). Melville, Sir H., Gowenlock, B.G., “Experimental Methods in Gas Reactions,” p. 123, MacMillan, New York, 1964. Milligan, W.O., Rachford, H.H., Jr . , J . Phys. Colloid Chem. 51, 333 (1947). Ries, H.E., Jr . , Aduan. Catalysis 4, 88 (1952). Ross, R.A., Taylor, A.H., J . Catalysis 9, 104 (1967). Ross R.A., Taylor, A.H., Proc. Brit. Ceram. SOC. 5 , 167 (1965). Taylor, A.H., PhD. thesis, The Queens University of Belfast, Belfast, Korthern Ireland, 1966. Zhuravlev, L.T., Kiselev, A.V., Kolloidn. Zh. 24, No. 1, 22-29, (1962) (Trans.).
RECEIVED for review July 19, 1968. Accepted April 14, 1969. The authors thank the Ministry of Education, Northern Ireland, for the award of post-graduate studentship (A.H.T.) and Queen’s Uni- versity, Belfast, for a Stirling studentship (A.H.T.).
VOL. 14, No. 3, JULY 1969 355