Embed Size (px)
Citation preview

Effect of Relative Humidity on theOptimum Flute Shape for Corrugated Fiberboard
Thomas J. UrbanikResearch Engineer
U.S. Department of AgricultureForest Service
Forest Products LaboratoryMadison, Wisconsin
Abstract
Container stacking strength is an important performance requirement of corrugatedfiberboard. The objective of this study is to examine theoretically how fluting geometry affectsfiberboard strength and stiffness under standard relative humidity (RH) and high RH conditions.The fluted medium in a corrugated fiberboard is modeled as a connection of curved arc and straightflank segments passing through the middle plane of the cross section. Flute pitch, flute height,flank length, arc radius, and angle of wrap are reduced to a set of non-dimensional parameters, twoof which can be chosen as independent. Thickness data on corrugated fiberboard in various fluteprofiles and weight grades are used to generate a set of representative flute profiles, which whencombined further with mechanistic models on fiberboard edgewise crush strength and bendingstiffness, enable strength and stiffness data from fiberboard to be used to predict average stress-strain properties of containerboard components. Using a standard set of papers as inputs, thestrength and stiffness models are extrapolated to examine theoretically how mechanical propertiesand material savings are predicted to change for other arbitrary flute profiles. Predictions based oncontainerboard stress-strain properties at a standard 50% RH are compared with predictions basedon stress-strain properties at 90% RH. The results quantify how an optimum flute profile strikes abalance among cost, runnability, strength, and stiffness considerations..
4th International Symposium on Moisture and Creep Effects on Paper, Board and Containers Page 27
E.F.P.G., France, March 99
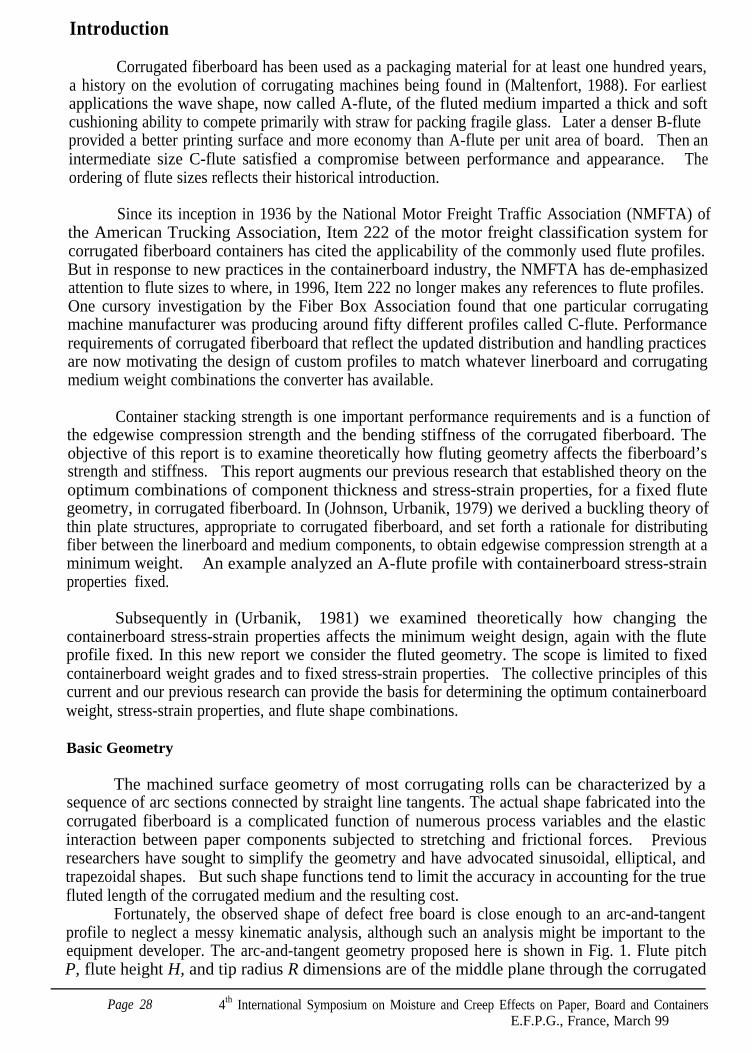
Introduction
Corrugated fiberboard has been used as a packaging material for at least one hundred years,a history on the evolution of corrugating machines being found in (Maltenfort, 1988). For earliestapplications the wave shape, now called A-flute, of the fluted medium imparted a thick and softcushioning ability to compete primarily with straw for packing fragile glass. Later a denser B-fluteprovided a better printing surface and more economy than A-flute per unit area of board. Then anintermediate size C-flute satisfied a compromise between performance and appearance. Theordering of flute sizes reflects their historical introduction.
Since its inception in 1936 by the National Motor Freight Traffic Association (NMFTA) ofthe American Trucking Association, Item 222 of the motor freight classification system forcorrugated fiberboard containers has cited the applicability of the commonly used flute profiles.But in response to new practices in the containerboard industry, the NMFTA has de-emphasizedattention to flute sizes to where, in 1996, Item 222 no longer makes any references to flute profiles.One cursory investigation by the Fiber Box Association found that one particular corrugatingmachine manufacturer was producing around fifty different profiles called C-flute. Performancerequirements of corrugated fiberboard that reflect the updated distribution and handling practicesare now motivating the design of custom profiles to match whatever linerboard and corrugatingmedium weight combinations the converter has available.
Container stacking strength is one important performance requirements and is a function ofthe edgewise compression strength and the bending stiffness of the corrugated fiberboard. Theobjective of this report is to examine theoretically how fluting geometry affects the fiberboard’sstrength and stiffness. This report augments our previous research that established theory on theoptimum combinations of component thickness and stress-strain properties, for a fixed flutegeometry, in corrugated fiberboard. In (Johnson, Urbanik, 1979) we derived a buckling theory ofthin plate structures, appropriate to corrugated fiberboard, and set forth a rationale for distributingfiber between the linerboard and medium components, to obtain edgewise compression strength at aminimum weight. An example analyzed an A-flute profile with containerboard stress-strainproperties fixed.
Subsequently in (Urbanik, 1981) we examined theoretically how changing thecontainerboard stress-strain properties affects the minimum weight design, again with the fluteprofile fixed. In this new report we consider the fluted geometry. The scope is limited to fixedcontainerboard weight grades and to fixed stress-strain properties. The collective principles of thiscurrent and our previous research can provide the basis for determining the optimum containerboardweight, stress-strain properties, and flute shape combinations.
Basic Geometry
The machined surface geometry of most corrugating rolls can be characterized by asequence of arc sections connected by straight line tangents. The actual shape fabricated into thecorrugated fiberboard is a complicated function of numerous process variables and the elasticinteraction between paper components subjected to stretching and frictional forces. Previousresearchers have sought to simplify the geometry and have advocated sinusoidal, elliptical, andtrapezoidal shapes. But such shape functions tend to limit the accuracy in accounting for the truefluted length of the corrugated medium and the resulting cost.
Fortunately, the observed shape of defect free board is close enough to an arc-and-tangentprofile to neglect a messy kinematic analysis, although such an analysis might be important to theequipment developer. The arc-and-tangent geometry proposed here is shown in Fig. 1. Flute pitchP, flute height H, and tip radius R dimensions are of the middle plane through the corrugated
Page 28 4th International Symposium on Moisture and Creep Effects on Paper, Board and ContainersE.F.P.G., France, March 99
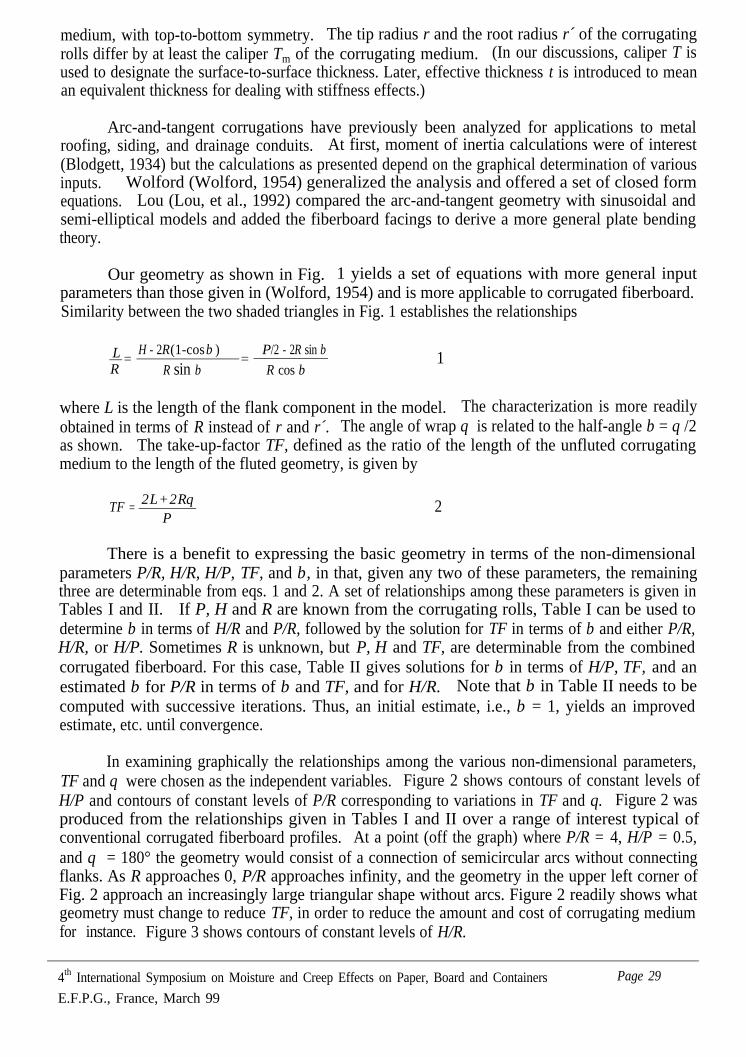
medium, with top-to-bottom symmetry. The tip radius r and the root radius r´ of the corrugatingrolls differ by at least the caliper Tm of the corrugating medium. (In our discussions, caliper T isused to designate the surface-to-surface thickness. Later, effective thickness t is introduced to meanan equivalent thickness for dealing with stiffness effects.)
Arc-and-tangent corrugations have previously been analyzed for applications to metalroofing, siding, and drainage conduits. At first, moment of inertia calculations were of interest(Blodgett, 1934) but the calculations as presented depend on the graphical determination of variousinputs. Wolford (Wolford, 1954) generalized the analysis and offered a set of closed formequations. Lou (Lou, et al., 1992) compared the arc-and-tangent geometry with sinusoidal andsemi-elliptical models and added the fiberboard facings to derive a more general plate bendingtheory.
Our geometry as shown in Fig. 1 yields a set of equations with more general inputparameters than those given in (Wolford, 1954) and is more applicable to corrugated fiberboard.Similarity between the two shaded triangles in Fig. 1 establishes the relationships
L =H - 2R(1-cosβ )
=P/2 - 2R sin β
R R sin β R cos β1
where L is the length of the flank component in the model. The characterization is more readilyobtained in terms of R instead of r and r´. The angle of wrap θ is related to the half-angle β = θ /2as shown. The take-up-factor TF, defined as the ratio of the length of the unfluted corrugatingmedium to the length of the fluted geometry, is given by
TF 2L+2Rθ=
P2
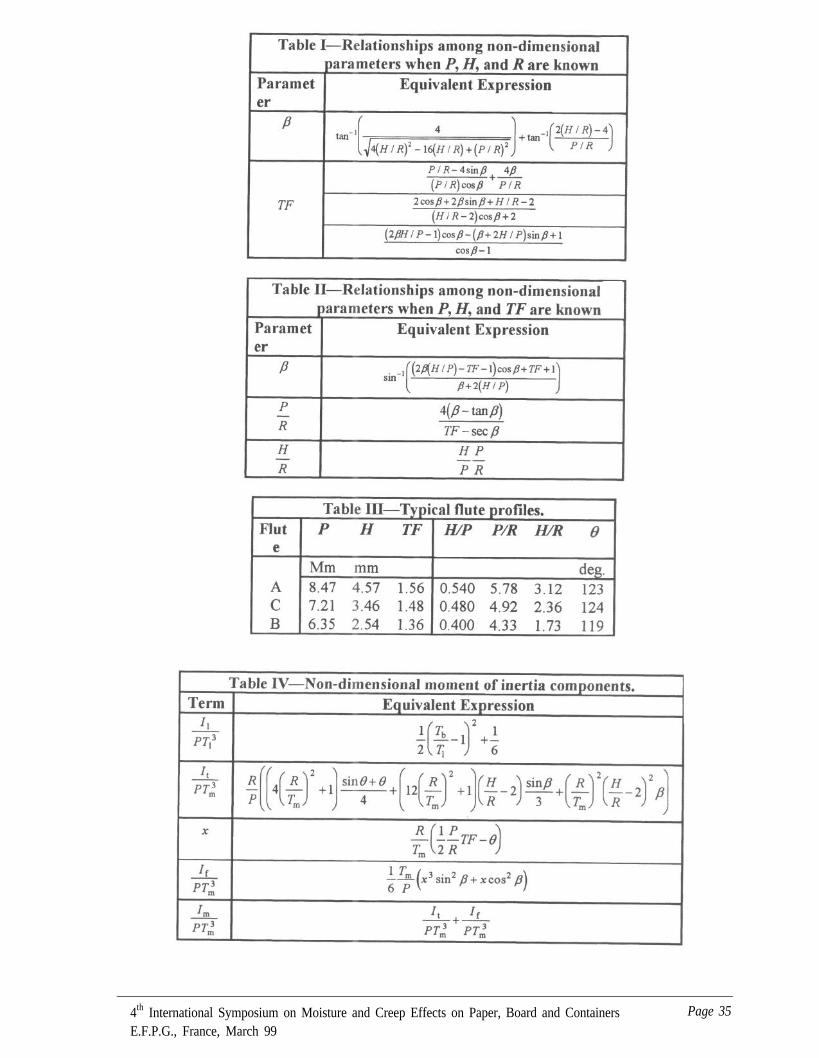
There is a benefit to expressing the basic geometry in terms of the non-dimensionalparameters P/R, H/R, H/P, TF, and β, in that, given any two of these parameters, the remainingthree are determinable from eqs. 1 and 2. A set of relationships among these parameters is given inTables I and II. If P, H and R are known from the corrugating rolls, Table I can be used todetermine β in terms of H/R and P/R, followed by the solution for TF in terms of β and either P/R,H/R, or H/P. Sometimes R is unknown, but P, H and TF, are determinable from the combinedcorrugated fiberboard. For this case, Table II gives solutions for β in terms of H/P, TF, and anestimated β for P/R in terms of β and TF, and for H/R. Note that β in Table II needs to becomputed with successive iterations. Thus, an initial estimate, i.e., β = 1, yields an improvedestimate, etc. until convergence.
In examining graphically the relationships among the various non-dimensional parameters,TF and θ were chosen as the independent variables. Figure 2 shows contours of constant levels ofH/P and contours of constant levels of P/R corresponding to variations in TF and θ. Figure 2 wasproduced from the relationships given in Tables I and II over a range of interest typical ofconventional corrugated fiberboard profiles. At a point (off the graph) where P/R = 4, H/P = 0.5,and θ = 180° the geometry would consist of a connection of semicircular arcs without connectingflanks. As R approaches 0, P/R approaches infinity, and the geometry in the upper left corner ofFig. 2 approach an increasingly large triangular shape without arcs. Figure 2 readily shows whatgeometry must change to reduce TF, in order to reduce the amount and cost of corrugating mediumfor instance. Figure 3 shows contours of constant levels of H/R.
4th International Symposium on Moisture and Creep Effects on Paper, Board and Containers Page 29
E.F.P.G., France, March 99
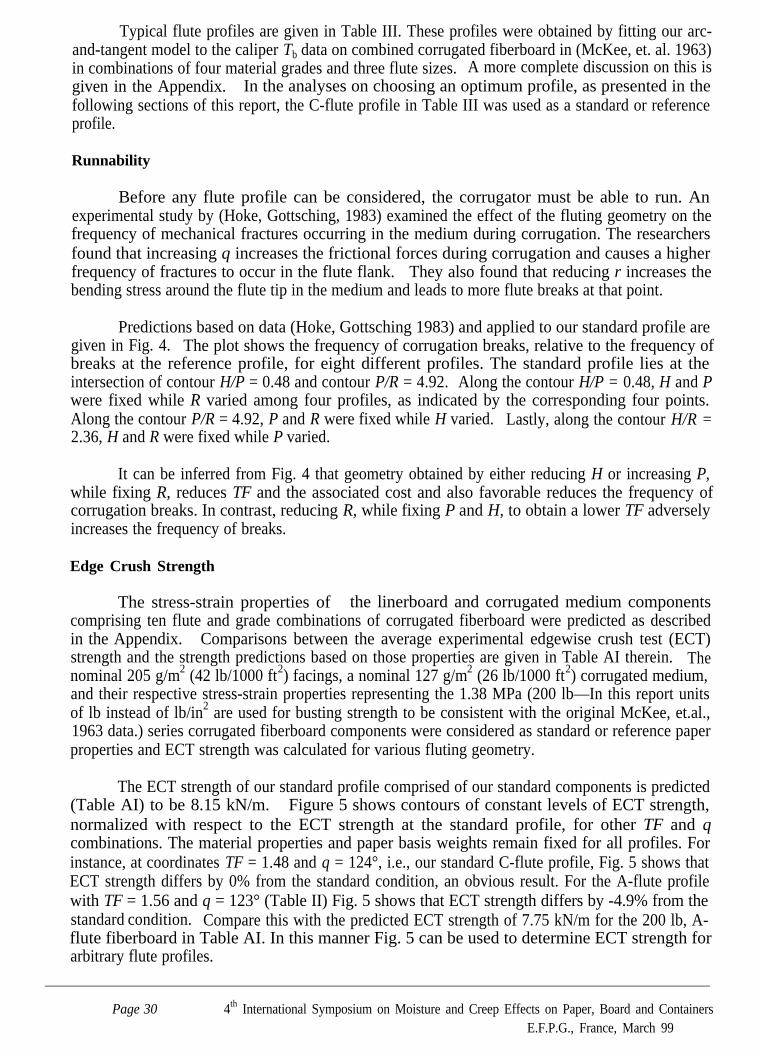
Typical flute profiles are given in Table III. These profiles were obtained by fitting our arc-and-tangent model to the caliper Tb data on combined corrugated fiberboard in (McKee, et. al. 1963)in combinations of four material grades and three flute sizes. A more complete discussion on this isgiven in the Appendix. In the analyses on choosing an optimum profile, as presented in thefollowing sections of this report, the C-flute profile in Table III was used as a standard or referenceprofile.
Runnability
Before any flute profile can be considered, the corrugator must be able to run. Anexperimental study by (Hoke, Gottsching, 1983) examined the effect of the fluting geometry on thefrequency of mechanical fractures occurring in the medium during corrugation. The researchersfound that increasing θ increases the frictional forces during corrugation and causes a higherfrequency of fractures to occur in the flute flank. They also found that reducing r increases thebending stress around the flute tip in the medium and leads to more flute breaks at that point.
Predictions based on data (Hoke, Gottsching 1983) and applied to our standard profile aregiven in Fig. 4. The plot shows the frequency of corrugation breaks, relative to the frequency ofbreaks at the reference profile, for eight different profiles. The standard profile lies at theintersection of contour H/P = 0.48 and contour P/R = 4.92. Along the contour H/P = 0.48, H and Pwere fixed while R varied among four profiles, as indicated by the corresponding four points.Along the contour P/R = 4.92, P and R were fixed while H varied. Lastly, along the contour H/R =2.36, H and R were fixed while P varied.
It can be inferred from Fig. 4 that geometry obtained by either reducing H or increasing P,while fixing R, reduces TF and the associated cost and also favorable reduces the frequency ofcorrugation breaks. In contrast, reducing R, while fixing P and H, to obtain a lower TF adverselyincreases the frequency of breaks.
Edge Crush Strength
The stress-strain properties of the linerboard and corrugated medium componentscomprising ten flute and grade combinations of corrugated fiberboard were predicted as describedin the Appendix. Comparisons between the average experimental edgewise crush test (ECT)strength and the strength predictions based on those properties are given in Table AI therein. Thenominal 205 g/m2 (42 lb/1000 ft2) facings, a nominal 127 g/m2 (26 lb/1000 ft2) corrugated medium,and their respective stress-strain properties representing the 1.38 MPa (200 lb—In this report unitsof lb instead of lb/in2 are used for busting strength to be consistent with the original McKee, et.al.,1963 data.) series corrugated fiberboard components were considered as standard or reference paperproperties and ECT strength was calculated for various fluting geometry.
The ECT strength of our standard profile comprised of our standard components is predicted(Table AI) to be 8.15 kN/m. Figure 5 shows contours of constant levels of ECT strength,normalized with respect to the ECT strength at the standard profile, for other TF and θcombinations. The material properties and paper basis weights remain fixed for all profiles. Forinstance, at coordinates TF = 1.48 and θ = 124°, i.e., our standard C-flute profile, Fig. 5 shows thatECT strength differs by 0% from the standard condition, an obvious result. For the A-flute profilewith TF = 1.56 and θ = 123° (Table II) Fig. 5 shows that ECT strength differs by -4.9% from thestandard condition. Compare this with the predicted ECT strength of 7.75 kN/m for the 200 lb, A-flute fiberboard in Table AI. In this manner Fig. 5 can be used to determine ECT strength forarbitrary flute profiles.
Page 30 4th International Symposium on Moisture and Creep Effects on Paper, Board and ContainersE.F.P.G., France, March 99
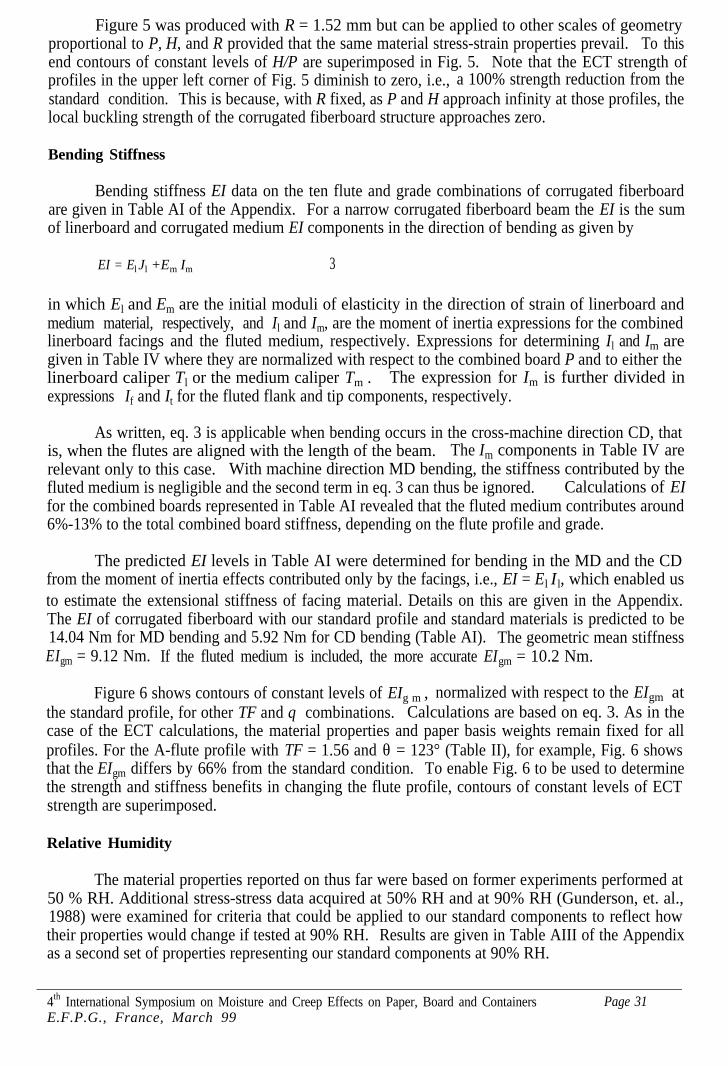
Figure 5 was produced with R = 1.52 mm but can be applied to other scales of geometryproportional to P, H, and R provided that the same material stress-strain properties prevail. To thisend contours of constant levels of H/P are superimposed in Fig. 5. Note that the ECT strength ofprofiles in the upper left corner of Fig. 5 diminish to zero, i.e., a 100% strength reduction from thestandard condition. This is because, with R fixed, as P and H approach infinity at those profiles, thelocal buckling strength of the corrugated fiberboard structure approaches zero.
Bending Stiffness
Bending stiffness EI data on the ten flute and grade combinations of corrugated fiberboardare given in Table AI of the Appendix. For a narrow corrugated fiberboard beam the EI is the sumof linerboard and corrugated medium EI components in the direction of bending as given by
EI = ElJl +Em Im 3
in which El and Em are the initial moduli of elasticity in the direction of strain of linerboard andmedium material, respectively, and Il and Im, are the moment of inertia expressions for the combinedlinerboard facings and the fluted medium, respectively. Expressions for determining Il and Im aregiven in Table IV where they are normalized with respect to the combined board P and to either thelinerboard caliper Tl or the medium caliper Tm . The expression for Im is further divided inexpressions If and It for the fluted flank and tip components, respectively.
As written, eq. 3 is applicable when bending occurs in the cross-machine direction CD, thatis, when the flutes are aligned with the length of the beam. The Im components in Table IV arerelevant only to this case. With machine direction MD bending, the stiffness contributed by thefluted medium is negligible and the second term in eq. 3 can thus be ignored. Calculations of EIfor the combined boards represented in Table AI revealed that the fluted medium contributes around6%-13% to the total combined board stiffness, depending on the flute profile and grade.
The predicted EI levels in Table AI were determined for bending in the MD and the CDfrom the moment of inertia effects contributed only by the facings, i.e., EI = El I l, which enabled usto estimate the extensional stiffness of facing material. Details on this are given in the Appendix.The EI of corrugated fiberboard with our standard profile and standard materials is predicted to be14.04 Nm for MD bending and 5.92 Nm for CD bending (Table AI). The geometric mean stiffnessEIgm = 9.12 Nm. If the fluted medium is included, the more accurate EIgm = 10.2 Nm.
Figure 6 shows contours of constant levels of EIg m , normalized with respect to the EIgm atthe standard profile, for other TF and θ combinations. Calculations are based on eq. 3. As in thecase of the ECT calculations, the material properties and paper basis weights remain fixed for allprofiles. For the A-flute profile with TF = 1.56 and θ = 123° (Table II), for example, Fig. 6 showsthat the EIgm differs by 66% from the standard condition. To enable Fig. 6 to be used to determinethe strength and stiffness benefits in changing the flute profile, contours of constant levels of ECTstrength are superimposed.
Relative Humidity
The material properties reported on thus far were based on former experiments performed at50 % RH. Additional stress-stress data acquired at 50% RH and at 90% RH (Gunderson, et. al.,1988) were examined for criteria that could be applied to our standard components to reflect howtheir properties would change if tested at 90% RH. Results are given in Table AIII of the Appendixas a second set of properties representing our standard components at 90% RH.
4th International Symposium on Moisture and Creep Effects on Paper, Board and ContainersE.F.P.G., France, March 99
Page 31
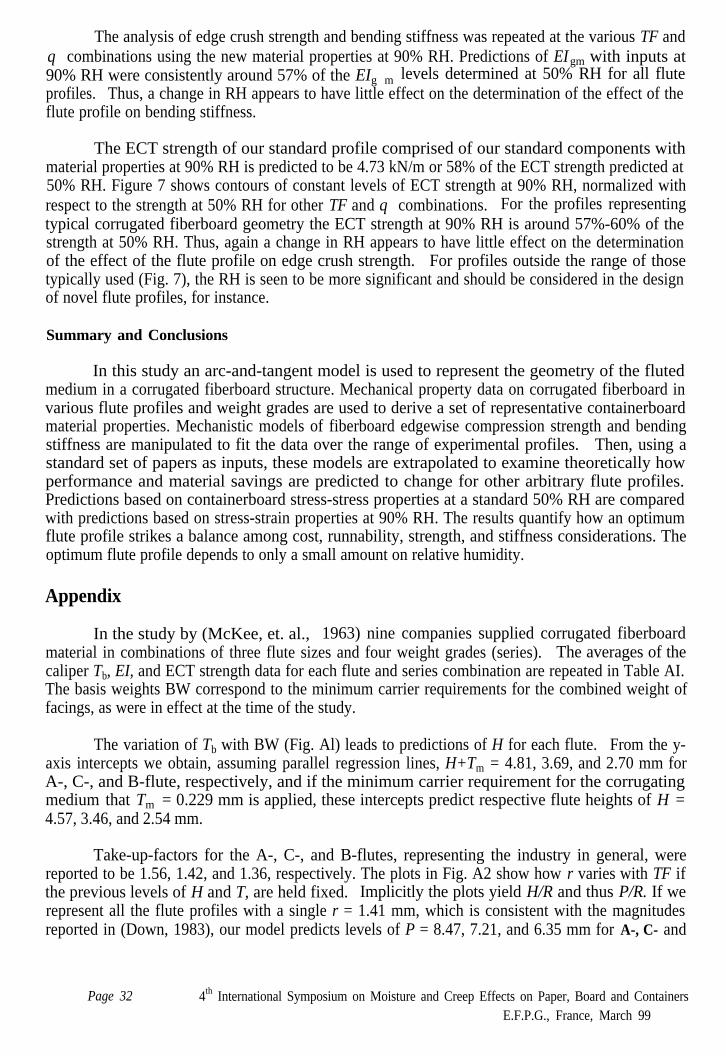
The analysis of edge crush strength and bending stiffness was repeated at the various TF andθ combinations using the new material properties at 90% RH. Predictions of EIgm with inputs at90% RH were consistently around 57% of the EIg m levels determined at 50% RH for all fluteprofiles. Thus, a change in RH appears to have little effect on the determination of the effect of theflute profile on bending stiffness.
The ECT strength of our standard profile comprised of our standard components withmaterial properties at 90% RH is predicted to be 4.73 kN/m or 58% of the ECT strength predicted at50% RH. Figure 7 shows contours of constant levels of ECT strength at 90% RH, normalized withrespect to the strength at 50% RH for other TF and θ combinations. For the profiles representingtypical corrugated fiberboard geometry the ECT strength at 90% RH is around 57%-60% of thestrength at 50% RH. Thus, again a change in RH appears to have little effect on the determinationof the effect of the flute profile on edge crush strength. For profiles outside the range of thosetypically used (Fig. 7), the RH is seen to be more significant and should be considered in the designof novel flute profiles, for instance.
Summary and Conclusions
In this study an arc-and-tangent model is used to represent the geometry of the flutedmedium in a corrugated fiberboard structure. Mechanical property data on corrugated fiberboard invarious flute profiles and weight grades are used to derive a set of representative containerboardmaterial properties. Mechanistic models of fiberboard edgewise compression strength and bendingstiffness are manipulated to fit the data over the range of experimental profiles. Then, using astandard set of papers as inputs, these models are extrapolated to examine theoretically howperformance and material savings are predicted to change for other arbitrary flute profiles.Predictions based on containerboard stress-stress properties at a standard 50% RH are comparedwith predictions based on stress-strain properties at 90% RH. The results quantify how an optimumflute profile strikes a balance among cost, runnability, strength, and stiffness considerations. Theoptimum flute profile depends to only a small amount on relative humidity.
Appendix
In the study by (McKee, et. al., 1963) nine companies supplied corrugated fiberboardmaterial in combinations of three flute sizes and four weight grades (series). The averages of thecaliper Tb, EI, and ECT strength data for each flute and series combination are repeated in Table AI.The basis weights BW correspond to the minimum carrier requirements for the combined weight offacings, as were in effect at the time of the study.
The variation of Tb with BW (Fig. Al) leads to predictions of H for each flute. From the y-axis intercepts we obtain, assuming parallel regression lines, H+Tm = 4.81, 3.69, and 2.70 mm forA-, C-, and B-flute, respectively, and if the minimum carrier requirement for the corrugatingmedium that Tm = 0.229 mm is applied, these intercepts predict respective flute heights of H =4.57, 3.46, and 2.54 mm.
Take-up-factors for the A-, C-, and B-flutes, representing the industry in general, werereported to be 1.56, 1.42, and 1.36, respectively. The plots in Fig. A2 show how r varies with TF ifthe previous levels of H and T, are held fixed. Implicitly the plots yield H/R and thus P/R. If werepresent all the flute profiles with a single r = 1.41 mm, which is consistent with the magnitudesreported in (Down, 1983), our model predicts levels of P = 8.47, 7.21, and 6.35 mm for A-, C- and
Page 32 4th International Symposium on Moisture and Creep Effects on Paper, Board and ContainersE.F.P.G., France, March 99
B-flutes, respectively, which are within the industry’s specified tolerances (Fiber Box Assoc.,1976). Flute geometry is summarized in Table III
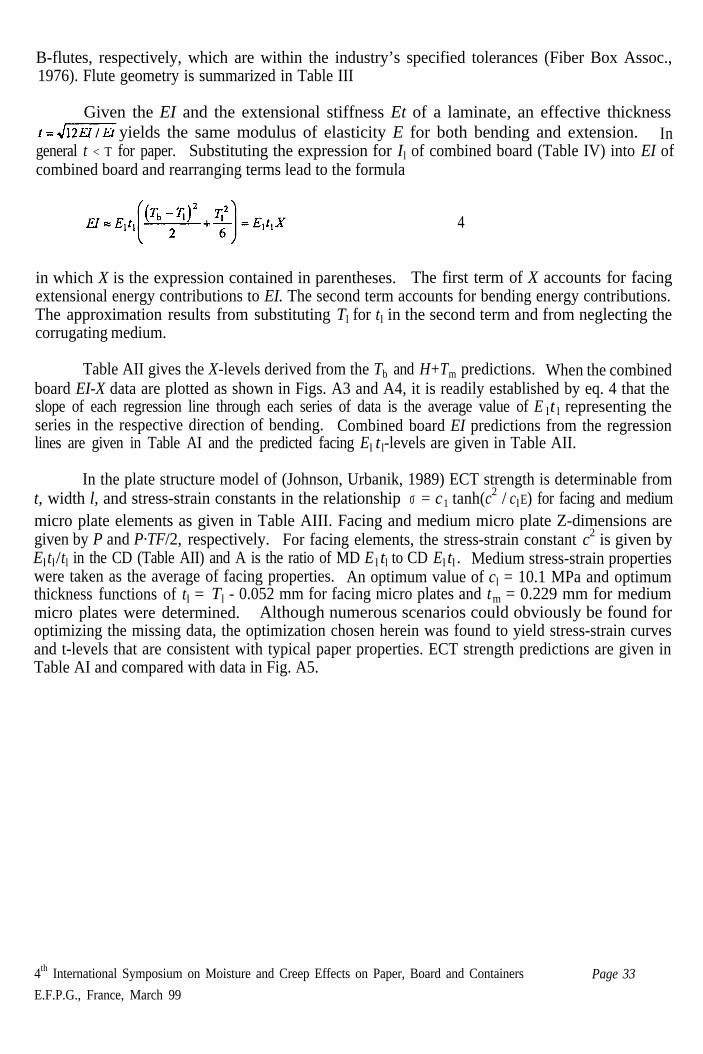
Given the EI and the extensional stiffness Et of a laminate, an effective thicknessyields the same modulus of elasticity E for both bending and extension. In
general t < T for paper. Substituting the expression for Il of combined board (Table IV) into EI ofcombined board and rearranging terms lead to the formula
4
in which X is the expression contained in parentheses. The first term of X accounts for facingextensional energy contributions to EI. The second term accounts for bending energy contributions.The approximation results from substituting Tl for tl in the second term and from neglecting thecorrugating medium.
Table AII gives the X-levels derived from the Tb and H+Tm predictions. When the combinedboard EI-X data are plotted as shown in Figs. A3 and A4, it is readily established by eq. 4 that theslope of each regression line through each series of data is the average value of E lt l representing theseries in the respective direction of bending. Combined board EI predictions from the regressionlines are given in Table AI and the predicted facing El t l-levels are given in Table AII.
In the plate structure model of (Johnson, Urbanik, 1989) ECT strength is determinable fromt, width l, and stress-strain constants in the relationship σ = c1 tanh(c2 / clE) for facing and mediummicro plate elements as given in Table AIII. Facing and medium micro plate Z-dimensions aregiven by P and P·TF/2, respectively. For facing elements, the stress-strain constant c2 is given byEl tl/tl in the CD (Table AII) and A is the ratio of MD E l tl to CD El tl. Medium stress-strain propertieswere taken as the average of facing properties. An optimum value of cl = 10.1 MPa and optimumthickness functions of tl = Tl - 0.052 mm for facing micro plates and tm = 0.229 mm for mediummicro plates were determined. Although numerous scenarios could obviously be found foroptimizing the missing data, the optimization chosen herein was found to yield stress-strain curvesand t-levels that are consistent with typical paper properties. ECT strength predictions are given inTable AI and compared with data in Fig. A5.
4th International Symposium on Moisture and Creep Effects on Paper, Board and Containers
E.F.P.G., France, March 99
Page 33

References
Blodgett, H.B. 1934. Moment of inertia of corrugated sheets. Civil Engr., 4(9): 492, 493, Sept.
Down, A.G. 1983. The effect of flute profile changes on take-up ratio & medium cost. CorrugatorRolls Workshop, Tappi Corrugated Containers Conference, Chicago, Oct.
Fiber Box Association. 1976. Fiber Box Handbook.
Gunderson, D.E., J.M. Considine, and C.T. Scott. 1988. The compressive load-strain curve ofpaperboard: rate of load and humidity effects. J. of Pulp and Paper Science, Vol. 14, No. 2, pp.J37-J41, March.
Hoke, U. and L. Gottsching. 1983. Physical technological characterization of the corrugatingprocess part IIIb: Forming of corrugations as a function of profile geometry-assumptions andinvestigations. Wochbl. Papierfabr. 111, no. 7: 207-208, 210-212, 214; no. 8: 251-256, 258, April.
Johnson, M.W., Jr, T. J. Urbanik, and W.E. Denniston. 1979. Optimum fiber distribution insinglewall corrugated fiberboard. USDA, For. Serv. Res. Pap. FPL 348.
Johnson, M.W., Jr, and T.J. Urbanik. 1989. Analysis of the localized buckling in composite platestructures with application to determining the strength of corrugated fiberboard. J. of CompositesTech. & Res., Vol. 11, No. 4, Winter, pp. 121-127.
Luo, S., J.C. Suhling, J.M. Considine, and T.L. Laufenberg. 1992. The bending stiffness ofcorrugated board. Mech. of Cellulosic Mtrls., ASME, AMD-Vol. 145/MD-Vol. 36, pp. 15-26, Nov.
Maltenfort, G.G. 1988. Corrugated Shipping Containers: An Engineering Approach. Jelmar Pub.Co., Inc., Plainview, NY.
McKee, R.C., J.W. Gander, and J.R. Wachuta. 1963. Compression strength formula for corrugatedboxes. Paperboard Packaging, 48(8): 149-159, August.
Urbanik, T.J. 1981. Effect of paperboard stress-strain characteristics on strength of singlewallcorrugated fiberboard: A theoretical approach. USDA, For. Serv. Res. Pap. FPL 409.
Wolford, D.S. 1954. Sectional properties of corrugated sheets determined by formula. Civil Engr.,pp. 59, 60, Feb.
Page 34 4th International Symposium on Moisture and Creep Effects on Paper, Board and ContainersE.F.P.G., France, March 99
4th International Symposium on Moisture and Creep Effects on Paper, Board and Containers Page 35E.F.P.G., France, March 99
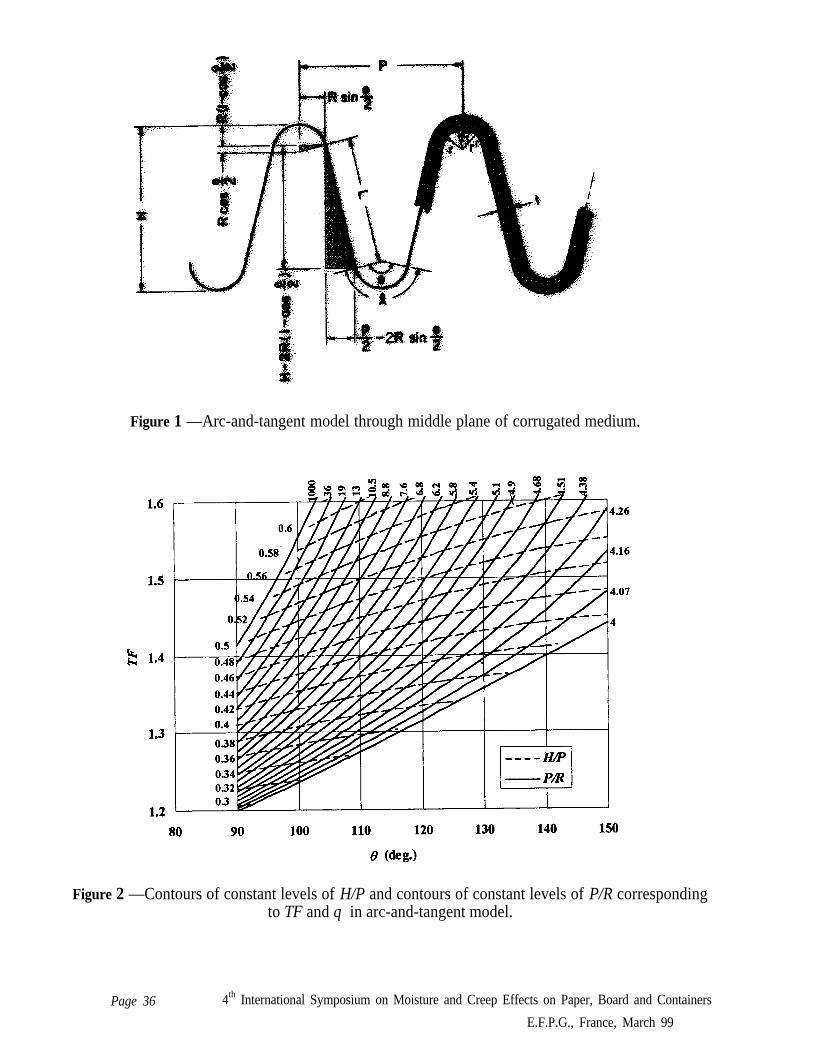
Figure 1 —Arc-and-tangent model through middle plane of corrugated medium.
Figure 2 —Contours of constant levels of H/P and contours of constant levels of P/R correspondingto TF and θ in arc-and-tangent model.
4th International Symposium on Moisture and Creep Effects on Paper, Board and Containers
E.F.P.G., France, March 99
Page 36

to TF and θ in arc-and-tangent model.Figure 3 — Contours of constant levels of H/P and contours of constant levels of H/R corresponding
Figure 4 — Frequency of fractures occurring in corrugating medium, relative to frequency offractures observed at a standard profile, for eight fluting profiles. Contours of constants levels ofH/P, P/R, and H/R specify the profile geometry. The points correspond to eight specific profilesand the numbers correspond to their relative fracture frequencies.
4th International Symposium on Moisture and Creep Effects on Paper, Board and Containers Page 37E.F.P.G., France, March 99

Figure 5 — Contours of constant levels of ECT strength (expressed as the % difference from astandard profile) and contours of constant levels of H/P. Linerboard and corrugated medium stress-
strain properties are fixed at standard conditions and R = 1.52 mm in all the ECT calculations.
Figure 6 — Contours of constant levels of ECT strength and contours of constant levels of EIg m
(ECT and EIgm are expressed as the % difference from a standard profile). Linerboard andcorrugated medium stress-strain properties are fixed at standard conditions and R = 1.52 mm in all
the calculations.
P a g e 3 8 4th International Symposium on Moisture and Creep Effects on Paper, Board and ContainersE.F.P.G., France, March 99

Figure 7 — Contours of constant levels of ECT strength (expressed as the percent of strength at 90%RH compared to the strength at 50% RH) and contours of constant levels of H/P. Linerboard andcorrugated medium stress-strain properties are fixed and represent standard conditions adjusted for90% RH. R = 1.52 mm in all the ECT calculations.
Page 394th International Symposium on Moisture and Creep Effects on Paper, Board and ContainersE.F.P.G- France. March 99

4th International Symposium on Moisture and Creep Effects on Paper, Board and Containers
E.F.P.G., France, March 99
Page 40
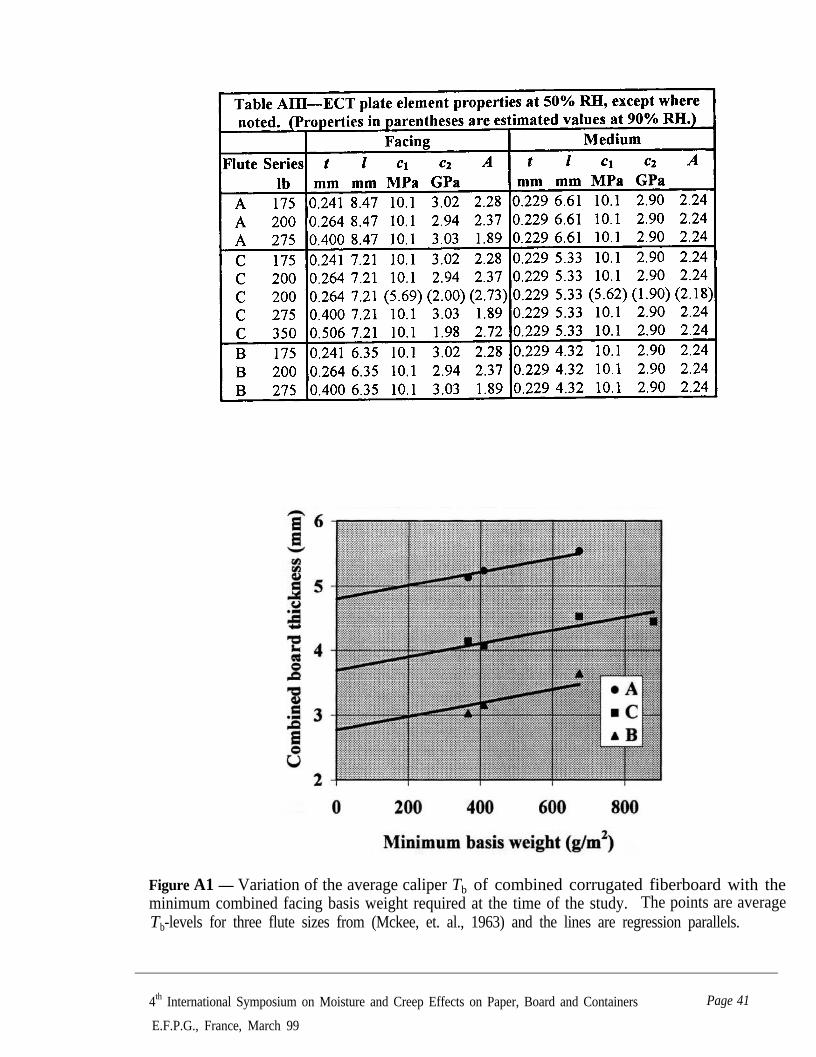
Figure A1 — Variation of the average caliper Tb of combined corrugated fiberboard with theminimum combined facing basis weight required at the time of the study. The points are averageTb-levels for three flute sizes from (Mckee, et. al., 1963) and the lines are regression parallels.
4th International Symposium on Moisture and Creep Effects on Paper, Board and Containers
E.F.P.G., France, March 99
Page 41

Figure A2 — Variation of the radius of curvature r of the fluting roll flute tip with the combinedboard take-up-factor TF when the flute height H = 4.57, 3.46, and 2.54 mm, corresponding to A-,C-, and B-flute profiles, respectively, and the corrugated medium caliper Tm = 0.229 mm.
Figure A3 — Variation of the bending stiffness of combined corrugated fiberboard in the machinedirection (MD) with parameter X from eq. 4. The points are data from 3 flute sizes and 4 combinedbasis weights (BW) of facing material in g/m2. The lines are regressions through the origin. Theslope of each line through data for each BW is the linerboard extensional stiffness in the MD.
Page 42 4th International Symposium on Moisture and Creep Effects on Paper, Board and Containers
E.F.P.G., France, March 99

Figure A4 — Variation of the bending stiffness of combined corrugated fiberboard in the crossmachine direction (CD) with parameter X from eq. 4. The points are data from 3 flute sizes and 4combined basis weights (BW) of facing material in g/m2. The lines are regressions through theorigin. The slope of each line through data for each BW is the linerboard extensional stiffness inthe CD.
Figure A5 — Comparison between ECT strength predictions, based on an optimum set ofcontainerboard stress-strain properties, and data for 3 flute sizes.
4th International Symposium on Moisture and Creep Effects on Paper, Board and Containers Page 43
E.F.P.G., France, March 99