Embed Size (px)
Citation preview
Effect of Polysaccharide Concentration on the
Membrane Filtration of Microbial Cells
Kuo-Jen Hwang1*, Pei-Chun Tsai1, Eiji Iritani2 and Nobuyuki Katagiri2
1Department of Chemical and Materials Engineering, Tamkang University,
Tamsui, Taiwan 251, R.O.C.2Department of Chemical Engineering, Nagoya University,
Furo-cho, Chikusa-ku, Nagoya 464-8603, Japan
Abstract
Polysaccharides are frequently produced by microbial metabolism or lysis in fermentation
broths or bioreactors. This substance often causes membrane filtration difficulty. The polysaccharide
concentration effects on the microfiltration characteristics of microbial cells are discussed in this
study. Yeast and dextran are used as typical microbial cell and polysaccharide samples. The results
show that polysaccharides play important roles in filtration performance. The filter cake exhibits a
more compact structure and much higher filtration resistance when more dextran molecules pack into
the yeast cake structure. Some dextran molecules also adsorb onto the walls in membrane pores,
reducing the pore size, resulting in membrane fouling. The filtration resistances due to filter cake and
membrane internal fouling are analyzed using filtrate volume versus time experimental data. These
resistances increase significantly with the filtration pressure and dextran concentration. The cake
properties in constant pressure microfiltration of yeast-dextran mixtures with different compositions
are also analyzed. An increase in dextran concentration leads to lower cake growth rate, lower cake
porosity and much higher average specific cake filtration resistance.
Key Words: Microfiltration, Membrane Filtration, Bio-Separation, Cake Properties
1. Introduction
Microfiltration has been widely used in the primary
product purification step in fermentation broths or bio-
reactors in recent years. In such biological mixture
microfiltration, microbial cells are retained by the filter
membrane to form a filter cake. Small components such
as polysaccharides, proteins, etc., are able to penetrate
through the membrane into the filtrate. The filtration re-
sistance may be markedly increased due to the packing
of polysaccharides or proteins into cake structures [1].
As a result, ignoring this effect will cause an extremely
low filtration rate as well as higher operating costs.
Although many methods have been proposed for an-
alyzing filtration data [2], the cake properties are usually
related to the filtration pressure using power-type em-
pirical equations for simplicity [3]. However, the cakes
formed by deformable or soft particles, such as bio-
logical particles, may exhibit viscoelastic behaviors
(creeping effects) during compression [4�6]. These lead
the filtration curve of dt/dv vs. v (the reciprocal of filtra-
tion rate versus filtrate volume) to deviate in a straight
line and the cake properties are therefore functions of the
filtration time [4,5]. The variations in cake properties,
such as cake porosity, specific cake filtration resistance
and cake compressibility, during a filtration are related to
the operating conditions but also the particle physical
properties, e.g., particle softness, relaxation time of par-
ticle compression, etc. [5,6]. Most cake compressions
occur in the early filtration periods, which lead to for-
ming a compact cake layer with high cake compres-
sibility and high cake filtration resistance. Because most
Journal of Applied Science and Engineering, Vol. 15, No. 4, pp. 323�332 (2012) 323
*Corresponding author. E-mail: [email protected]
hydraulic pressures are depleted in the compact cake
layer, the newly formed cake layers have loose structures
and low filtration resistances. Therefore, the cake com-
pressibility gradually decreases after reaching a maxi-
mum [5,6]. This phenomenon is also seen in microbial
cell filtration [1,7]. Because most biological materials
are highly compressible, a thin but compact and high re-
sistance cake layer is often formed next to the membrane
surface during microfiltration [7�11]. In the past, several
researchers focused on the operating condition effects on
microbial cell filtration performance. For example, the
microfiltration behavior of pseudomonas was studied by
Hwang et al. [7]. The formation of a compact cake layer
was simulated using a dynamic analysis method and ve-
rified by experimental data. McCarthy et al. [11] studied
the dead-end filtration of yeasts with different morpho-
logies. They found that the cake compressibility in-
creased with increasing the mean aspect ratio and de-
formability of yeast cells.
The cake structure and composition play important
roles in determining the cake filtration resistance. In
general, the biological suspensions in fermentation broths
or bioreactors contain multiple components. Polysac-
charides, proteins or enzymes disperse with microbial
cells due to metabolism, lysis or bio-reaction. The filtra-
tion performance may be significantly affected due to the
coexistence of these small components [1]. Hung and
Liu [12] studied the separation of green algae from water
using cross-flow microfiltration. The filtration flux de-
creased unexpectedly with increasing filtration pressure.
This phenomenon was attributed to the increase in sus-
pended polysaccharides. Hwang and Yang [1] studied
the influence of dextran on the dead-end microfiltration
of yeast cells. They indicated that the existence of dex-
tran in the cake structure resulted in more compressible
and much higher filtration resistance cakes. However,
the cake packing structure and filtration resistance may
also be significantly affected by the concentration of
small components. Devoting more effort to this subject
for further study is worthwhile.
When multiple components with a wide particle size
distribution are filtered in a microfiltration process, the
filtration resistances may be caused by the filter cake on
the membrane surface or by membrane pore blocking.
For instance, some researchers claimed that the main fil-
tration resistance was attributed to the cake formed by
the suspended particles in membrane bioreactors [13,
14]. Conversely, others indicated that internal fouling in
the membrane pores was the main source of filtration
resistance [15]. In fact, both resistances may occur in-
dividually or simultaneously depending on the operating
conditions, suspension characteristics and membrane
properties.
Dextran and yeast were used as typical samples in
this study to understand how the polysaccharide concen-
tration affected microbial cell microfiltration perfor-
mance. The filtration rate, cake porosity, specific cake
filtration resistance and dextran rejection under various
filtration pressures in a dead-end microfiltration process
is measured and discussed. The filtration curves were
analyzed to obtain the filtration resistances caused by the
filter cake and dextran adsorption in the membrane pores.
The analyzed results were compared with the available
experimental data.
2. Materials and Methods
Baker yeast was purchased from ICN Biomedicals
Inc. in Germany. Yeast cells were suspended in de-
ionized water and heated to 80 �C for 20 min to deactify
the cells. Dextran with a molecular weight of 2,000 kDa,
manufactured by Sigma Co. in USA, was used in these
experiments as the polysaccharide sample. Yeast and
dextran were suspended in a 10 mM buffer solution pre-
pared using sodium phosphate (Na2HPO3) and sodium
hypophosphite (NaH2PO2). The yeast concentration was
fixed at 1 kg/m3, while three dextran concentrations, 0.1,
0.3 and 0.5 kg/m3, were prepared. The bulk density and
mean size of the yeast cells were 1140 kg/m3 and 4.6 �m,
respectively. The filter membrane was made of mixed
cellulose ester manufactured by Millipore Co. in USA.
Its mean pore size was 0.025 �m.
Constant pressure dead-end microfiltration experi-
ments were carried out using a bomb filter. The detail
was shown in the authors’ previous studies [5,6]. The
filtration area in the filter chamber was 8.55 � 10-4 m2.
Suspensions with different concentrations were prepared
and agitated using a magnetic mixer to prevent particle
sedimentation. The pH and temperature of the suspen-
sion were 7.0 and 25 �C, respectively. The filtration pres-
sure was supplied using compressed air and adjusted
using a regulator. The filtrate was weighed using a load
324 Kuo-Jen Hwang et al.
cell. The filtrate volume data versus time were trans-
ferred to a personal computer for further analyses. The
dextran concentration in the filtrate was measured using
the phenol/sulfuric acid method. The filtrate sample was
colored using phenol and dewatered using sulfuric acid.
The dextran concentration was then measured using a
UNICAM UV/Visible spectrometer with a wavelength of
299 nm. When a filtration experiment was terminated,
the cake porosity was analyzed using an infrared-ray
moisture meter (AD-4714A, AND Co., Japan) [6].
The filtration resistances are the sum of the resis-
tance due to cake formation, the internal membrane foul-
ing and the virgin membrane. The virgin membrane re-
sistance was measured by penetrating the buffer solution
through the membrane before each experiment. The
overall filtration resistance was calculated using the fil-
tration rate data. When an experiment was terminated the
cake formed on the membrane surface was carefully re-
moved. The filtration resistance due to membrane inter-
nal fouling was then measured by flowing a buffer solu-
tion through the rinsed membrane. The cake resistance
was obtained by subtracting the others from the overall
resistance.
3. Results and Discussion
3.1 Filtration Characteristics
According to the resistance-in-series model, the ba-
sic filtration equation can be expressed as:
(1)
where q is the filtration flux, v is the received filtrate
volume per unit area, t is the filtration time, �P is the fil-
tration pressure, � is the fluid viscosity, and Rc, Rif and
Rm are the filtration resistances caused by the filter
cake, membrane internal fouling and virgin membrane,
respectively. When pure dextran was filtered most of
the dextran molecules penetrated through the mem-
brane pores because they are much smaller than the
pore size. In this condition no evident cake can be ob-
served and the measured cake resistance is negligible.
The main filtration resistance is therefore caused by
membrane internal fouling. The adsorption of dextran
molecules onto the membrane pore walls decreases the
effective membrane pore size and increases the filtra-
tion resistance. This is similar to that observed in pre-
vious studies [16,17]. In this condition Rc is negligible
and the reciprocal of Eq. (1) can be written as:
(2)
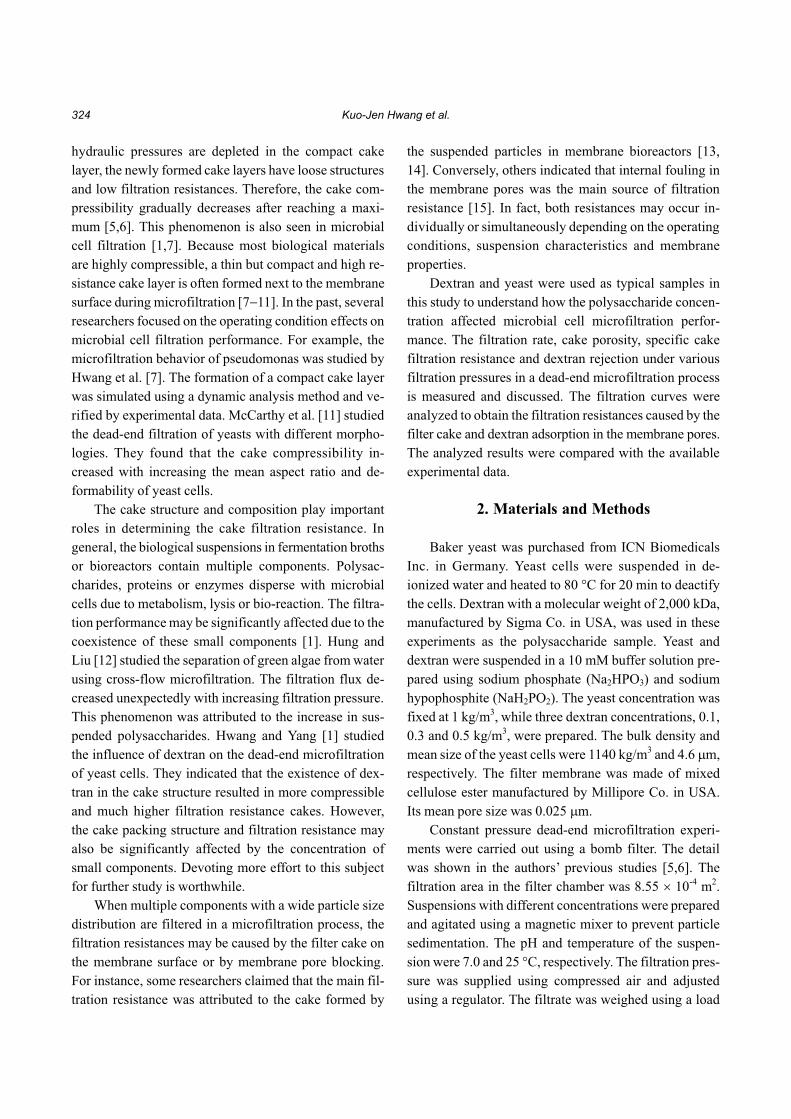
Typical plots for dt/dv vs. v during pure dextran filtra-
tion under various filtration pressures are shown in Fig-
ure 1. The dextran concentration is fixed at 0.5 kg/m3.
Because the second term on the right-hand-side of Eq.
(2) is constant under a given pressure, the increase in
dt/dv value along with v in Figure 1 is certainly due to
the increase in resistance caused by internal membrane
fouling, Rif. The membrane fouling resistance increases
with increasing received filtrate volume until a maxi-
mum value that depends on the filtration pressure. The
dt/dv value (or Rif) remains constant thereafter. This is
attributed to the dextran adsorption equilibrium in the
membrane pores. The membrane pore size reduces to a
certain value determined by the applied pressure [16�
18]. After that equilibrium is attained the dextran mole-
cules that arrive at the membrane surface will penetrate
through the membrane pores into filtrate. The filtration
resistance is therefore invariant. Comparing the data
shown in the figure, the dt/dv value for a given v is
smaller under higher filtration pressure. This reveals
that the filtration rate, which is the reciprocal of dt/dv, is
higher under higher filtration pressures. Furthermore,
Effect of Polysaccharide Concentration on the Membrane Filtration of Microbial Cells 325
Figure 1. Filtration curves of dt/dv vs. v of pure dextran undervarious filtration pressures.
more dextran adsorption in the membrane pores can be
expected under higher pressure since the maximum v
value is larger.
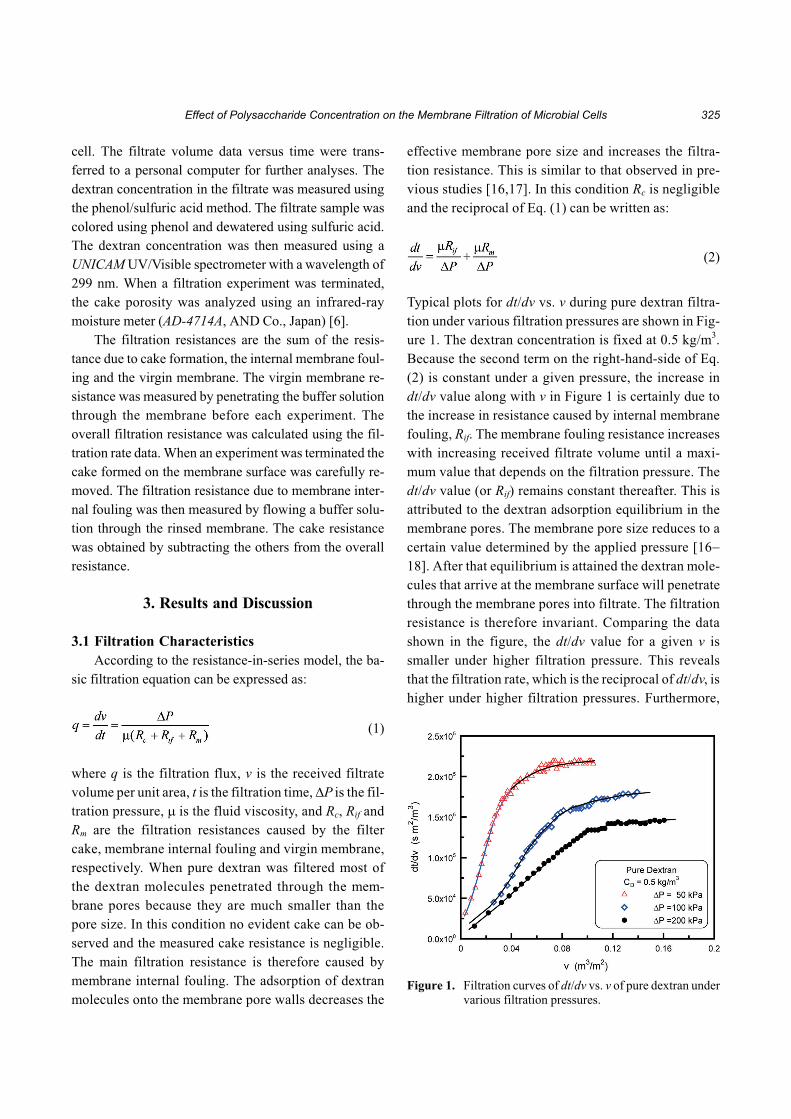
According to the previous analysis, the Rif value dur-
ing a constant pressure filtration can be calculated by
substituting experimental data of v vs. t into Eq. (2). For
a given dextran concentration of 0.5 kg/m3, the relation-
ships between Rif and v under three different filtration
pressures are shown in Figure 2. The Rif value increases
linearly with v until a maximum point is attained under a
given filtration pressure. It then remains constant there-
after. This is because the filtration resistance caused by
membrane fouling is proportional to the filtrate volume
flow through the membrane pores, and the dextran ad-
sorption (the foulant) reaches equilibrium at the maxi-
mum point. Because additional membrane fouling no
longer occurs, the membrane pore size is reduced no
more and the filtration resistance remains constant after
dextran equilibrium adsorption. The filtration rate there-
fore remains constant after reaching the equilibrium
fouling state [16,18]. It is interesting that the relationship
between Rif and v before the equilibrium adsorptions are
the same even under different filtration pressures. The
relationship for CD = 0.5 kg/m3, for example, can be re-
gressed to a unique function as follows:
(3)
The filtrate volume at dextran adsorption equilibrium
increases with increasing filtration pressure. This re-
veals that the membrane fouling becomes more severe
under higher applied pressures. This trend is similar to a
general adsorption isotherm or those occurring in pre-
vious studies [16�18].
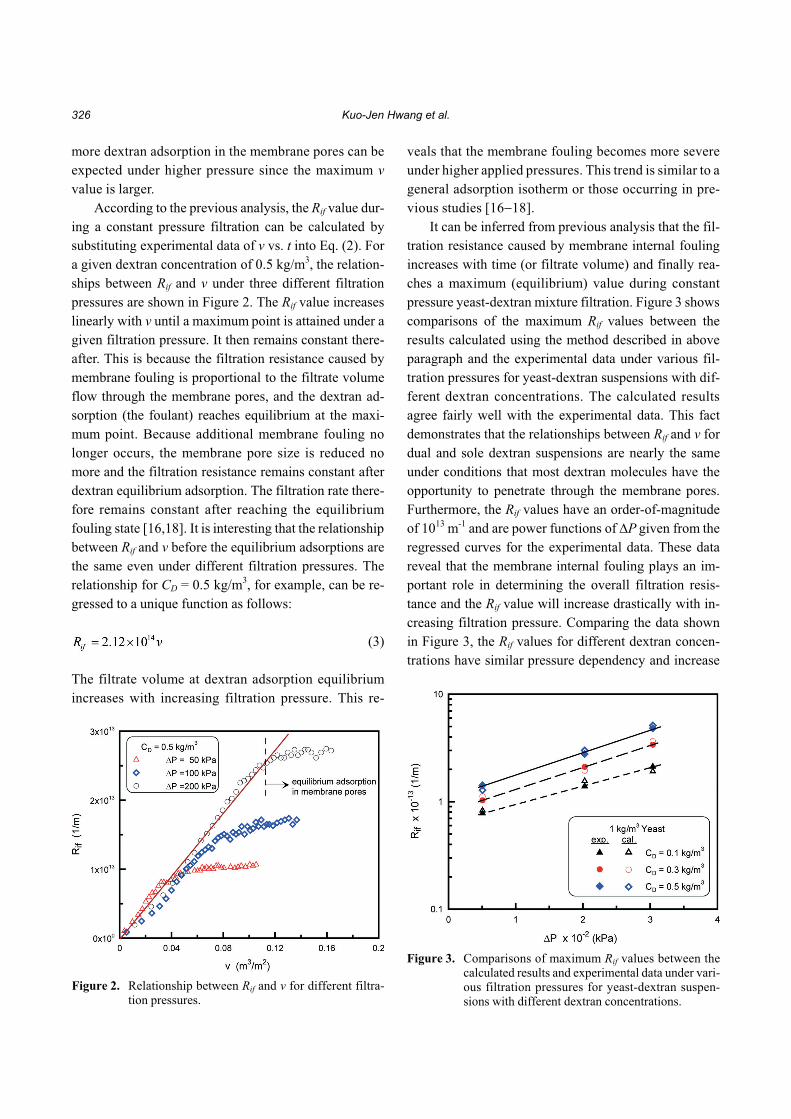
It can be inferred from previous analysis that the fil-
tration resistance caused by membrane internal fouling
increases with time (or filtrate volume) and finally rea-
ches a maximum (equilibrium) value during constant
pressure yeast-dextran mixture filtration. Figure 3 shows
comparisons of the maximum Rif values between the
results calculated using the method described in above
paragraph and the experimental data under various fil-
tration pressures for yeast-dextran suspensions with dif-
ferent dextran concentrations. The calculated results
agree fairly well with the experimental data. This fact
demonstrates that the relationships between Rif and v for
dual and sole dextran suspensions are nearly the same
under conditions that most dextran molecules have the
opportunity to penetrate through the membrane pores.
Furthermore, the Rif values have an order-of-magnitude
of 1013 m-1 and are power functions of �P given from the
regressed curves for the experimental data. These data
reveal that the membrane internal fouling plays an im-
portant role in determining the overall filtration resis-
tance and the Rif value will increase drastically with in-
creasing filtration pressure. Comparing the data shown
in Figure 3, the Rif values for different dextran concen-
trations have similar pressure dependency and increase
326 Kuo-Jen Hwang et al.
Figure 2. Relationship between Rif and v for different filtra-tion pressures.
Figure 3. Comparisons of maximum Rif values between thecalculated results and experimental data under vari-ous filtration pressures for yeast-dextran suspen-sions with different dextran concentrations.

with increasing dextran concentration. This can be ex-
pected because more dextran adsorption occurs in the
membrane pores under higher concentrations.
Figure 4 shows the filtration curves for dt/dv vs. v for
different suspensions under a constant pressure of 300
kPa. When yeast cells coexist with dextran in a suspen-
sion, the dt/dv value for a given v becomes much higher
than that for single component filtration. This is attri-
buted to the cake formation in which the dextran mole-
cules pack in the pores obstructed by yeast cells. Con-
sequently, the filtration resistance becomes much higher.
Since the filtration resistance caused by membrane inter-
nal fouling can be estimated using the method described
previously, the cake resistance can be given using the
difference between the dt/dv data of yeast-dextran and
sole dextran suspensions, as shown in Figure 4. In
yeast-dextran dual suspension filtration the membrane
internal fouling and cake growth occur simultaneously
before the filtrate volume reaches a critical value vc at
which the dextran adsorption attains equilibrium. After
that, the increase in dt/dv value (or the increase in filtra-
tion resistance) is solely due to the cake formation and
cake compression. The filtration resistance is much
lower and the filtration rate is much higher in the filtra-
tion of sole yeast suspension compared to the others.
This implies that the polysaccharides or extracellular
polymer substances produced by microbial metabolism
will play major roles in determining the filtration per-
formance.
The filtration curves, which deduct the contributions
of membrane internal fouling from experimental dt/dv
data, for the suspensions containing different dextran
concentrations during constant pressure filtration are
shown in Figure 5. The curves show the cake formation
and compression effects on the filtration rate since the
virgin membrane resistance affects only the intercept at
the beginning. The curve trend is similar to those in pre-
vious studies on the filtration of soft or deformable par-
ticles [5,6]. Each curve can be divided into three distinct
regions. A gradual increase in dt/dv is given in the early
filtration periods due to yeast cell deposition. The filtra-
tion curve depicts a Ruth-type relation, i.e., linear rela-
tionship between dt/dv and v [2,3]. In the second region
the tangent slope of each curve increases drastically be-
cause of significant cell and cake compression. This ef-
fect is mitigated after an inflection point. The curve trend
in the third region changes back to that in the first region.
This is because most solid compressive pressures are
depleted by the compact cake constructed in the second
region. Therefore, the newly-formed cake has a looser
packing structure and the increase in dt/dv values or the
cake growth becomes much slower. The comparison of
those curves shown in Figure 5 clearly indicates that the
increase in dextran concentration leads to a higher dt/dv
value, lower filtration rate and higher cake resistance.
The dextran rejection coefficient, Rrej, is defined as:
(4)
Effect of Polysaccharide Concentration on the Membrane Filtration of Microbial Cells 327
Figure 4. Filtration curves of dt/dv vs. v for suspensions withdifferent components under a constant pressure of300 kPa.
Figure 5. The filtration curves of (dt/dv � �Rif/�P) vs. v forsuspensions containing different dextran concen-trations during constant pressure filtration.
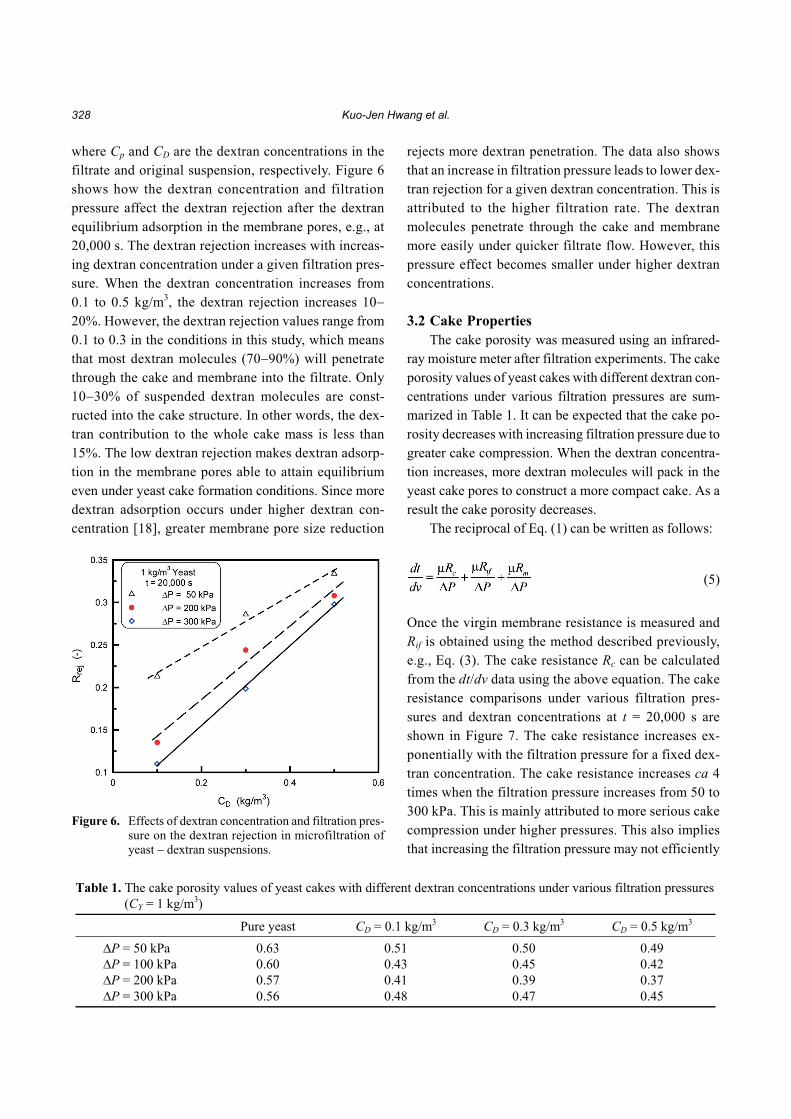
where Cp and CD are the dextran concentrations in the
filtrate and original suspension, respectively. Figure 6
shows how the dextran concentration and filtration
pressure affect the dextran rejection after the dextran
equilibrium adsorption in the membrane pores, e.g., at
20,000 s. The dextran rejection increases with increas-
ing dextran concentration under a given filtration pres-
sure. When the dextran concentration increases from
0.1 to 0.5 kg/m3, the dextran rejection increases 10�
20%. However, the dextran rejection values range from
0.1 to 0.3 in the conditions in this study, which means
that most dextran molecules (70�90%) will penetrate
through the cake and membrane into the filtrate. Only
10�30% of suspended dextran molecules are const-
ructed into the cake structure. In other words, the dex-
tran contribution to the whole cake mass is less than
15%. The low dextran rejection makes dextran adsorp-
tion in the membrane pores able to attain equilibrium
even under yeast cake formation conditions. Since more
dextran adsorption occurs under higher dextran con-
centration [18], greater membrane pore size reduction
rejects more dextran penetration. The data also shows
that an increase in filtration pressure leads to lower dex-
tran rejection for a given dextran concentration. This is
attributed to the higher filtration rate. The dextran
molecules penetrate through the cake and membrane
more easily under quicker filtrate flow. However, this
pressure effect becomes smaller under higher dextran
concentrations.
3.2 Cake Properties
The cake porosity was measured using an infrared-
ray moisture meter after filtration experiments. The cake
porosity values of yeast cakes with different dextran con-
centrations under various filtration pressures are sum-
marized in Table 1. It can be expected that the cake po-
rosity decreases with increasing filtration pressure due to
greater cake compression. When the dextran concentra-
tion increases, more dextran molecules will pack in the
yeast cake pores to construct a more compact cake. As a
result the cake porosity decreases.
The reciprocal of Eq. (1) can be written as follows:
(5)
Once the virgin membrane resistance is measured and
Rif is obtained using the method described previously,
e.g., Eq. (3). The cake resistance Rc can be calculated
from the dt/dv data using the above equation. The cake
resistance comparisons under various filtration pres-
sures and dextran concentrations at t = 20,000 s are
shown in Figure 7. The cake resistance increases ex-
ponentially with the filtration pressure for a fixed dex-
tran concentration. The cake resistance increases ca 4
times when the filtration pressure increases from 50 to
300 kPa. This is mainly attributed to more serious cake
compression under higher pressures. This also implies
that increasing the filtration pressure may not efficiently
328 Kuo-Jen Hwang et al.
Figure 6. Effects of dextran concentration and filtration pres-sure on the dextran rejection in microfiltration ofyeast � dextran suspensions.
Table 1. The cake porosity values of yeast cakes with different dextran concentrations under various filtration pressures
(CY = 1 kg/m3)
Pure yeast CD = 0.1 kg/m3 CD = 0.3 kg/m3 CD = 0.5 kg/m3
�P = 50 kPa0 0.63 0.51 0.50 0.49
�P = 100 kPa 0.60 0.43 0.45 0.42
�P = 200 kPa 0.57 0.41 0.39 0.37
�P = 300 kPa 0.56 0.48 0.47 0.45
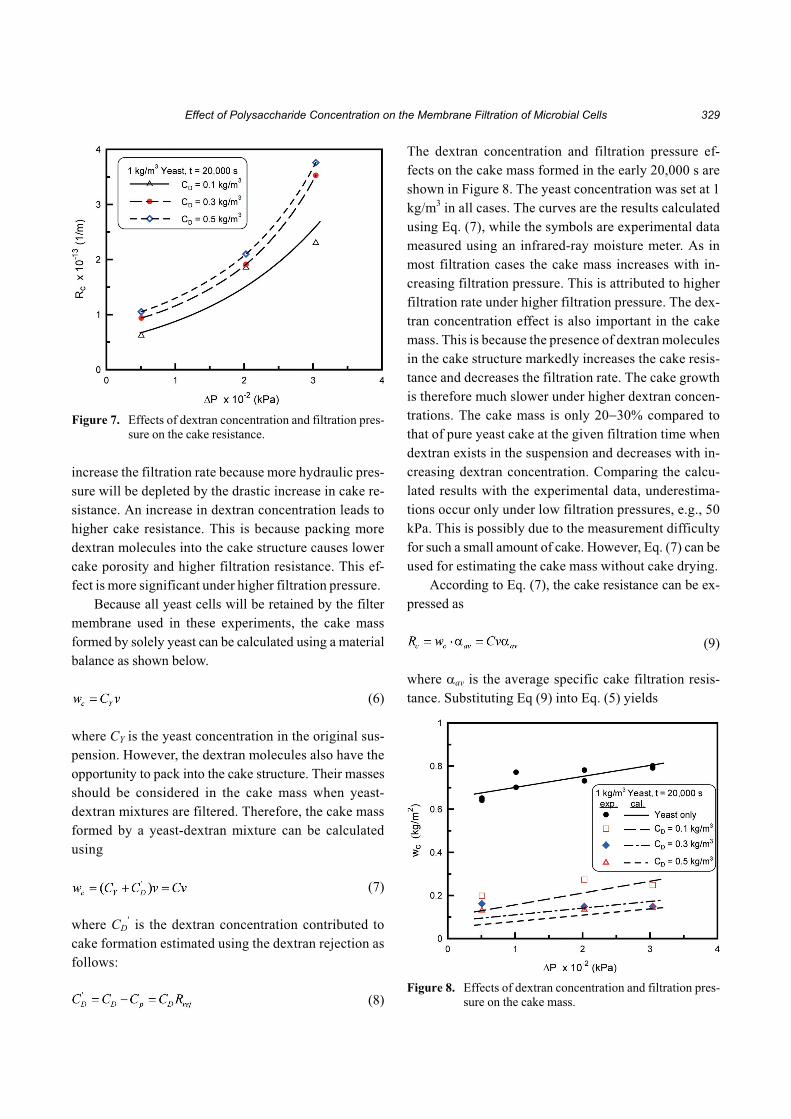
increase the filtration rate because more hydraulic pres-
sure will be depleted by the drastic increase in cake re-
sistance. An increase in dextran concentration leads to
higher cake resistance. This is because packing more
dextran molecules into the cake structure causes lower
cake porosity and higher filtration resistance. This ef-
fect is more significant under higher filtration pressure.
Because all yeast cells will be retained by the filter
membrane used in these experiments, the cake mass
formed by solely yeast can be calculated using a material
balance as shown below.
(6)
where CY is the yeast concentration in the original sus-
pension. However, the dextran molecules also have the
opportunity to pack into the cake structure. Their masses
should be considered in the cake mass when yeast-
dextran mixtures are filtered. Therefore, the cake mass
formed by a yeast-dextran mixture can be calculated
using
(7)
where CD� is the dextran concentration contributed to
cake formation estimated using the dextran rejection as
follows:
(8)
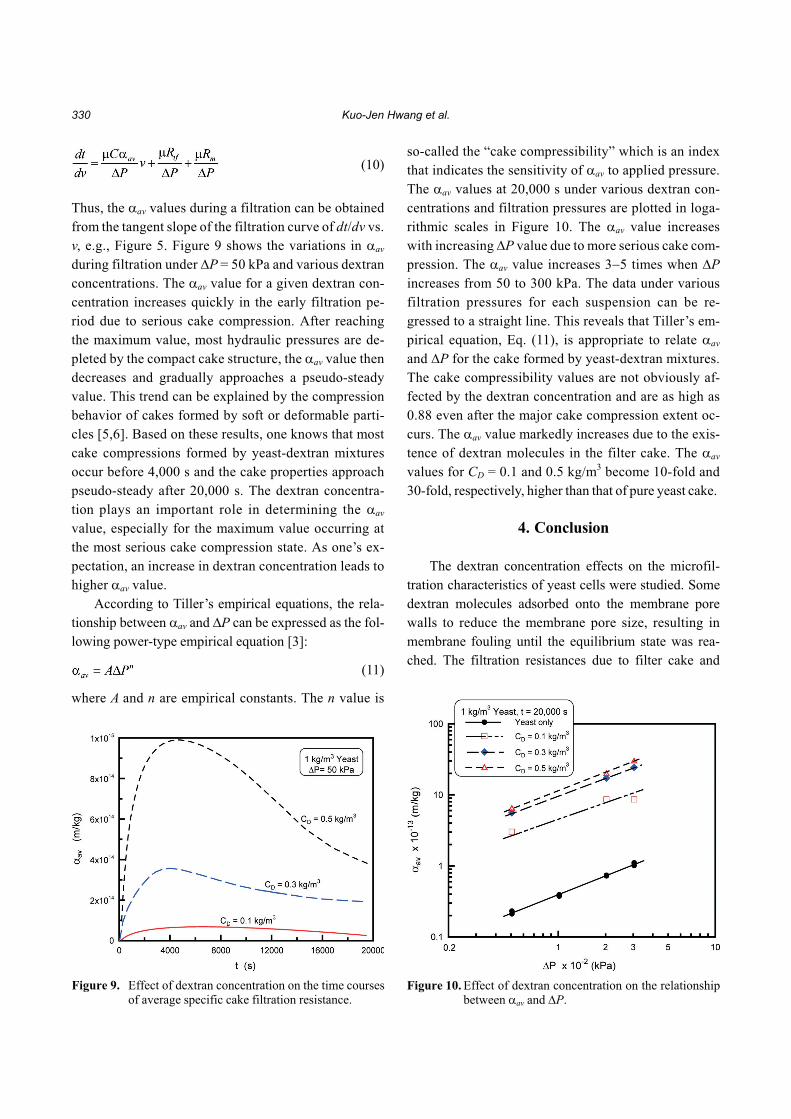
The dextran concentration and filtration pressure ef-
fects on the cake mass formed in the early 20,000 s are
shown in Figure 8. The yeast concentration was set at 1
kg/m3 in all cases. The curves are the results calculated
using Eq. (7), while the symbols are experimental data
measured using an infrared-ray moisture meter. As in
most filtration cases the cake mass increases with in-
creasing filtration pressure. This is attributed to higher
filtration rate under higher filtration pressure. The dex-
tran concentration effect is also important in the cake
mass. This is because the presence of dextran molecules
in the cake structure markedly increases the cake resis-
tance and decreases the filtration rate. The cake growth
is therefore much slower under higher dextran concen-
trations. The cake mass is only 20�30% compared to
that of pure yeast cake at the given filtration time when
dextran exists in the suspension and decreases with in-
creasing dextran concentration. Comparing the calcu-
lated results with the experimental data, underestima-
tions occur only under low filtration pressures, e.g., 50
kPa. This is possibly due to the measurement difficulty
for such a small amount of cake. However, Eq. (7) can be
used for estimating the cake mass without cake drying.
According to Eq. (7), the cake resistance can be ex-
pressed as
(9)
where �av is the average specific cake filtration resis-
tance. Substituting Eq (9) into Eq. (5) yields
Effect of Polysaccharide Concentration on the Membrane Filtration of Microbial Cells 329
Figure 7. Effects of dextran concentration and filtration pres-sure on the cake resistance.
Figure 8. Effects of dextran concentration and filtration pres-sure on the cake mass.
(10)
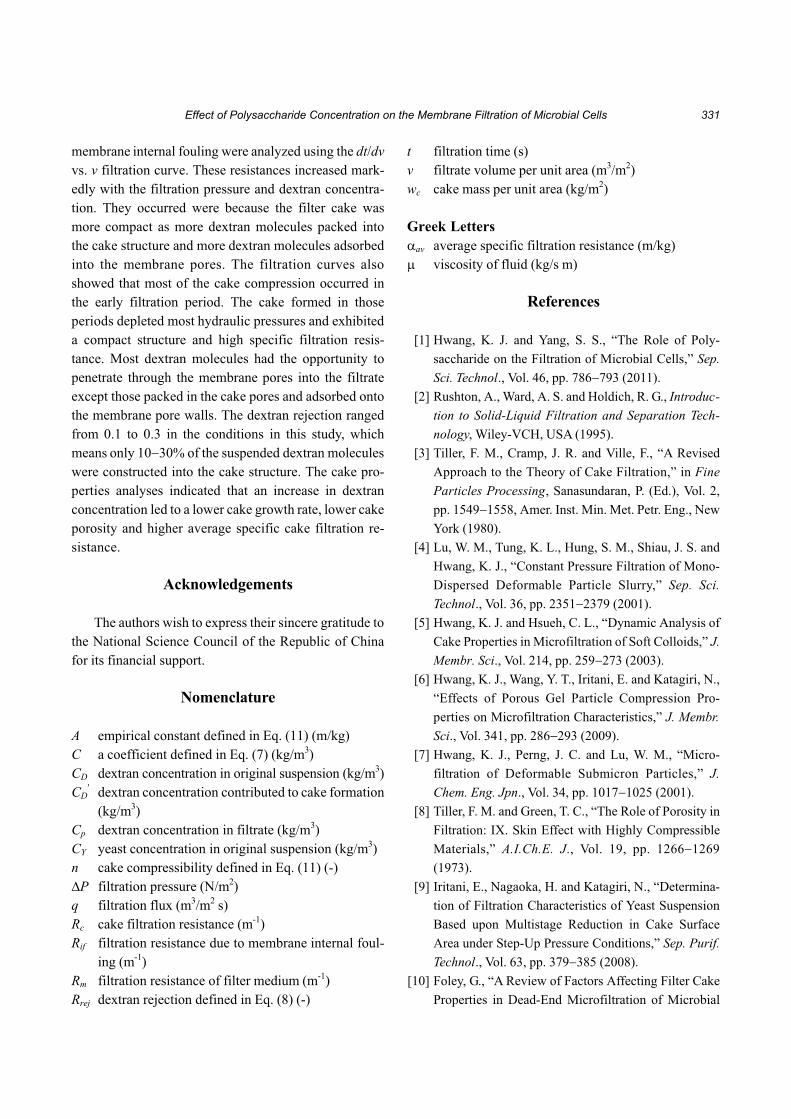
Thus, the �av values during a filtration can be obtained
from the tangent slope of the filtration curve of dt/dv vs.
v, e.g., Figure 5. Figure 9 shows the variations in �av
during filtration under �P = 50 kPa and various dextran
concentrations. The �av value for a given dextran con-
centration increases quickly in the early filtration pe-
riod due to serious cake compression. After reaching
the maximum value, most hydraulic pressures are de-
pleted by the compact cake structure, the �av value then
decreases and gradually approaches a pseudo-steady
value. This trend can be explained by the compression
behavior of cakes formed by soft or deformable parti-
cles [5,6]. Based on these results, one knows that most
cake compressions formed by yeast-dextran mixtures
occur before 4,000 s and the cake properties approach
pseudo-steady after 20,000 s. The dextran concentra-
tion plays an important role in determining the �av
value, especially for the maximum value occurring at
the most serious cake compression state. As one’s ex-
pectation, an increase in dextran concentration leads to
higher �av value.
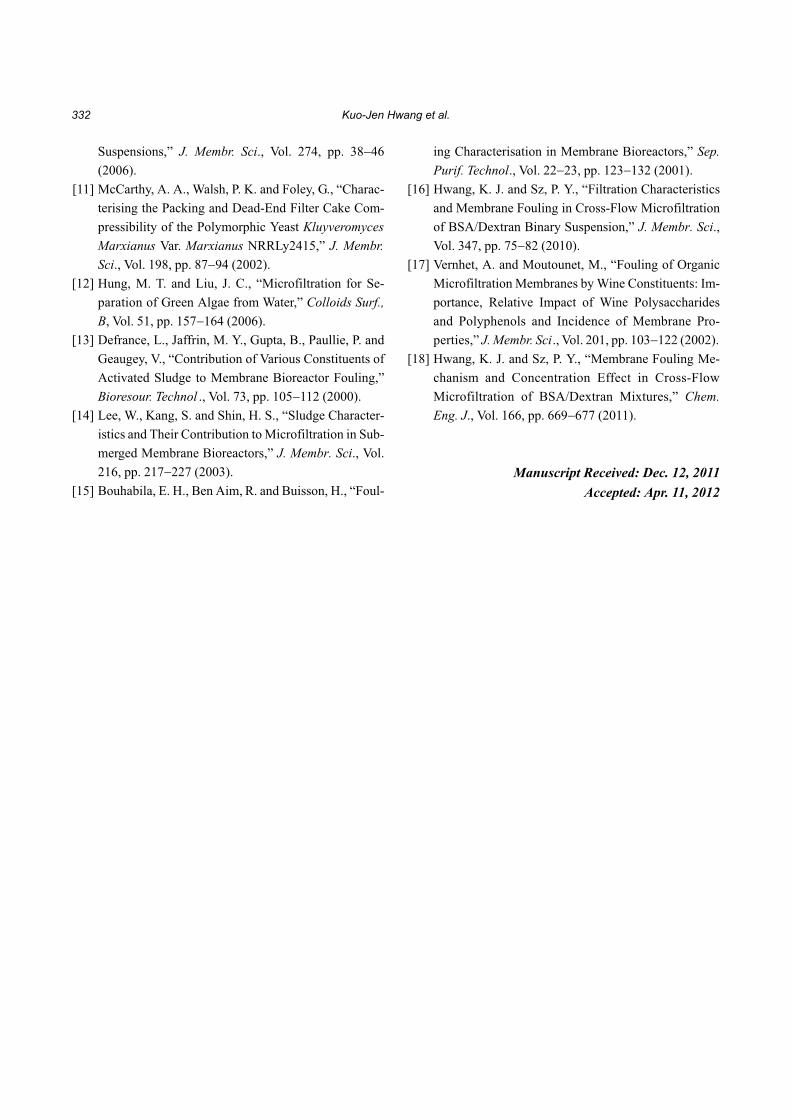
According to Tiller’s empirical equations, the rela-
tionship between �av and �P can be expressed as the fol-
lowing power-type empirical equation [3]:
(11)
where A and n are empirical constants. The n value is
so-called the “cake compressibility” which is an index
that indicates the sensitivity of �av to applied pressure.
The �av values at 20,000 s under various dextran con-
centrations and filtration pressures are plotted in loga-
rithmic scales in Figure 10. The �av value increases
with increasing �P value due to more serious cake com-
pression. The �av value increases 3�5 times when �P
increases from 50 to 300 kPa. The data under various
filtration pressures for each suspension can be re-
gressed to a straight line. This reveals that Tiller’s em-
pirical equation, Eq. (11), is appropriate to relate �av
and �P for the cake formed by yeast-dextran mixtures.
The cake compressibility values are not obviously af-
fected by the dextran concentration and are as high as
0.88 even after the major cake compression extent oc-
curs. The �av value markedly increases due to the exis-
tence of dextran molecules in the filter cake. The �av
values for CD = 0.1 and 0.5 kg/m3 become 10-fold and
30-fold, respectively, higher than that of pure yeast cake.
4. Conclusion
The dextran concentration effects on the microfil-
tration characteristics of yeast cells were studied. Some
dextran molecules adsorbed onto the membrane pore
walls to reduce the membrane pore size, resulting in
membrane fouling until the equilibrium state was rea-
ched. The filtration resistances due to filter cake and
330 Kuo-Jen Hwang et al.
Figure 9. Effect of dextran concentration on the time coursesof average specific cake filtration resistance.
Figure 10. Effect of dextran concentration on the relationshipbetween �av and �P.
membrane internal fouling were analyzed using the dt/dv
vs. v filtration curve. These resistances increased mark-
edly with the filtration pressure and dextran concentra-
tion. They occurred were because the filter cake was
more compact as more dextran molecules packed into
the cake structure and more dextran molecules adsorbed
into the membrane pores. The filtration curves also
showed that most of the cake compression occurred in
the early filtration period. The cake formed in those
periods depleted most hydraulic pressures and exhibited
a compact structure and high specific filtration resis-
tance. Most dextran molecules had the opportunity to
penetrate through the membrane pores into the filtrate
except those packed in the cake pores and adsorbed onto
the membrane pore walls. The dextran rejection ranged
from 0.1 to 0.3 in the conditions in this study, which
means only 10�30% of the suspended dextran molecules
were constructed into the cake structure. The cake pro-
perties analyses indicated that an increase in dextran
concentration led to a lower cake growth rate, lower cake
porosity and higher average specific cake filtration re-
sistance.
Acknowledgements
The authors wish to express their sincere gratitude to
the National Science Council of the Republic of China
for its financial support.
Nomenclature
A empirical constant defined in Eq. (11) (m/kg)
C a coefficient defined in Eq. (7) (kg/m3)
CD dextran concentration in original suspension (kg/m3)
CD� dextran concentration contributed to cake formation
(kg/m3)
Cp dextran concentration in filtrate (kg/m3)
CY yeast concentration in original suspension (kg/m3)
n cake compressibility defined in Eq. (11) (-)
�P filtration pressure (N/m2)
q filtration flux (m3/m2 s)
Rc cake filtration resistance (m-1)
Rif filtration resistance due to membrane internal foul-
ing (m-1)
Rm filtration resistance of filter medium (m-1)
Rrej dextran rejection defined in Eq. (8) (-)
t filtration time (s)
v filtrate volume per unit area (m3/m2)
wc cake mass per unit area (kg/m2)
Greek Letters
�av average specific filtration resistance (m/kg)
� viscosity of fluid (kg/s m)
References
[1] Hwang, K. J. and Yang, S. S., “The Role of Poly-
saccharide on the Filtration of Microbial Cells,” Sep.
Sci. Technol., Vol. 46, pp. 786�793 (2011).
[2] Rushton, A., Ward, A. S. and Holdich, R. G., Introduc-
tion to Solid-Liquid Filtration and Separation Tech-
nology, Wiley-VCH, USA (1995).
[3] Tiller, F. M., Cramp, J. R. and Ville, F., “A Revised
Approach to the Theory of Cake Filtration,” in Fine
Particles Processing, Sanasundaran, P. (Ed.), Vol. 2,
pp. 1549�1558, Amer. Inst. Min. Met. Petr. Eng., New
York (1980).
[4] Lu, W. M., Tung, K. L., Hung, S. M., Shiau, J. S. and
Hwang, K. J., “Constant Pressure Filtration of Mono-
Dispersed Deformable Particle Slurry,” Sep. Sci.
Technol., Vol. 36, pp. 2351�2379 (2001).
[5] Hwang, K. J. and Hsueh, C. L., “Dynamic Analysis of
Cake Properties in Microfiltration of Soft Colloids,” J.
Membr. Sci., Vol. 214, pp. 259�273 (2003).
[6] Hwang, K. J., Wang, Y. T., Iritani, E. and Katagiri, N.,
“Effects of Porous Gel Particle Compression Pro-
perties on Microfiltration Characteristics,” J. Membr.
Sci., Vol. 341, pp. 286�293 (2009).
[7] Hwang, K. J., Perng, J. C. and Lu, W. M., “Micro-
filtration of Deformable Submicron Particles,” J.
Chem. Eng. Jpn., Vol. 34, pp. 1017�1025 (2001).
[8] Tiller, F. M. and Green, T. C., “The Role of Porosity in
Filtration: IX. Skin Effect with Highly Compressible
Materials,” A.I.Ch.E. J., Vol. 19, pp. 1266�1269
(1973).
[9] Iritani, E., Nagaoka, H. and Katagiri, N., “Determina-
tion of Filtration Characteristics of Yeast Suspension
Based upon Multistage Reduction in Cake Surface
Area under Step-Up Pressure Conditions,” Sep. Purif.
Technol., Vol. 63, pp. 379�385 (2008).
[10] Foley, G., “A Review of Factors Affecting Filter Cake
Properties in Dead-End Microfiltration of Microbial
Effect of Polysaccharide Concentration on the Membrane Filtration of Microbial Cells 331
Suspensions,” J. Membr. Sci., Vol. 274, pp. 38�46
(2006).
[11] McCarthy, A. A., Walsh, P. K. and Foley, G., “Charac-
terising the Packing and Dead-End Filter Cake Com-
pressibility of the Polymorphic Yeast Kluyveromyces
Marxianus Var. Marxianus NRRLy2415,” J. Membr.
Sci., Vol. 198, pp. 87�94 (2002).
[12] Hung, M. T. and Liu, J. C., “Microfiltration for Se-
paration of Green Algae from Water,” Colloids Surf.,
B, Vol. 51, pp. 157�164 (2006).
[13] Defrance, L., Jaffrin, M. Y., Gupta, B., Paullie, P. and
Geaugey, V., “Contribution of Various Constituents of
Activated Sludge to Membrane Bioreactor Fouling,”
Bioresour. Technol ., Vol. 73, pp. 105�112 (2000).
[14] Lee, W., Kang, S. and Shin, H. S., “Sludge Character-
istics and Their Contribution to Microfiltration in Sub-
merged Membrane Bioreactors,” J. Membr. Sci., Vol.
216, pp. 217�227 (2003).
[15] Bouhabila, E. H., Ben Aim, R. and Buisson, H., “Foul-
ing Characterisation in Membrane Bioreactors,” Sep.
Purif. Technol., Vol. 22�23, pp. 123�132 (2001).
[16] Hwang, K. J. and Sz, P. Y., “Filtration Characteristics
and Membrane Fouling in Cross-Flow Microfiltration
of BSA/Dextran Binary Suspension,” J. Membr. Sci.,
Vol. 347, pp. 75�82 (2010).
[17] Vernhet, A. and Moutounet, M., “Fouling of Organic
Microfiltration Membranes by Wine Constituents: Im-
portance, Relative Impact of Wine Polysaccharides
and Polyphenols and Incidence of Membrane Pro-
perties,” J. Membr. Sci., Vol. 201, pp. 103�122 (2002).
[18] Hwang, K. J. and Sz, P. Y., “Membrane Fouling Me-
chanism and Concentration Effect in Cross-Flow
Microfiltration of BSA/Dextran Mixtures,” Chem.
Eng. J., Vol. 166, pp. 669�677 (2011).
Manuscript Received: Dec. 12, 2011
Accepted: Apr. 11, 2012
332 Kuo-Jen Hwang et al.