Embed Size (px)
DESCRIPTION
Effect of Organic Additive Peg 600 on Ultrafiltration Performance of Pes Membranes
Citation preview
International Journal of Advanced Research in Engineering and Technology (IJARET), ISSN 0976 – 6480(Print), ISSN 0976 – 6499(Online), Volume 5, Issue 11, November (2014), pp. 26-36 © IAEME
26
EFFECT OF ORGANIC ADDITIVE (PEG 600) ON ULTRAFILTRATION PERFORMANCE OF PES
MEMBRANES
T. BALAMURALI, B. PREETHA
Department of Chemical Engineering, Annamalai University, Annamalai Nagar, Chidambaram -608002, Tamil Nadu, India
ABSTRACT The polyethersulfone (PES) is fabricated with presence of PEG in 15 to 20 wt % of composition The pure water flux increased on addition of 2.5 wt % of PEG in all composition of PES. The increase in flux is attributed to the surface hydrophilicity of PES and it also clearly signifies the impact of pore architecture on PES. The mass transfer coefficient was also investigated by using protein solutions. The average pore size, number of pores and porosity enhanced, when 2.5wt of PEG in PES. However, the average pore size, number of pores and porosity suppressed when higher concentration PEG dded from 19 and 20 wt%. Sugar solution concentration studies were performed wherein 27-30 % rejection, much higher than that of PES without PEG was observed. Keywords: Polyethersulfone; Sugar Solution Concentration; Hydrophilicity; Porosity; Water Flux 1. INTRODUCTION The development of polymer membranes advances in the field of materials science has created great opportunities for major progress in the field of membrane science. Polymer membranes composed of hydrophilic materials are developing due to their higher durability and performance in many separation applications [1, 2]. Hydrophlic materials blended or architecturally position in the membrane matrix, are attractive because of their enhanced properties, such as high perm-selectivity, higher hydrophilicity, and enhanced fouling resistance [3,4]. These advances have motivated for large number of studies to explore novel membrane in the fabrication of tailor-designed polymer properties. Inspite of high research activity in the area of blending their application in membrane science is only slowly developing. PES is the material of choice for numerous membrane applications due to its outstanding mechanical strength, thermal stability, and formability [5,6]. The
INTERNATIONAL JOURNAL OF ADVANCED RESEARCH IN ENGINEERING AND TECHNOLOGY (IJARET)
ISSN 0976 - 6480 (Print) ISSN 0976 - 6499 (Online) Volume 5, Issue 11, November (2014), pp. 26-36
© IAEME: www.iaeme.com/ IJARET.asp Journal Impact Factor (2014): 7.8273 (Calculated by GISI) www.jifactor.com
IJARET
© I A E M E
International Journal of Advanced Research in Engineering and Technology (IJARET), ISSN 0976 6480(Print), ISSN 0976 – 6499(Online), Volume 5, Issue 11, November (2014), pp.
main disadvantage is its low hydrophilicity and permeability leading to increased membrane fouling. Hence, blending of PEG 600 was investigated to fabricate better membranes by increasing the permeability by increasing the weightsuitable for liquid state separations. and PEG 20,000 on the morphology and performanceDMAc as solvent separately. From this work, they concluded that solvents and molecular weights of PEG play a significant role on flux propertiesNMP as solvent and PVP as an additive in the foshowed that PVP suppresses the formation of demixing in presence of NMP/PVP.various compositions on membrane performance and morphology was investigated by Rahimpour et al [10] In the current study, PEG has been were added by varying PES/DMF ratio in membrane casting solution followed by phase inversion method. The addition of PEG was leading to alter properties and change in pore structure in casting solution that eventually affects membrane formation and permeability properties. 2. EXPERIMENTAL SECTION
2.1. Materials PES (Veradale 3000) was supplied by Solvay Solexis (India) limited.
dimethylformamide was purchased from Qualigens fine chemicals, Glaxo India limited. All chemicals used were of analytical grade. Ultrapure water was produced in the laboratory using Millipore pilot plant. The effluent was obtained from Seshasayee paper mills, Erode
Figure 1
2.2. Preparation of PES/PEG membrane The 15 to 20 wt % of composition of PES were dissolved in 85 to 80 wt % of N, N’dimethylformamide (DMF) solvent. Further the 2.5 wt % ofThe solution was mixed with PES using mechanical stirring for 3 h. The detailed composition of casting solution is described in Table 1. The homogenous casting solutions were then made into a thin film of 400 µm thickness on a finely levelled glass plate by using a thin film applicator (Elcometer) made of stainless steel. After leaving for partial evaporation for 30 s, the film was then immersed rapidly into the non-solvent phase (water) maintained at 10ºC. Phase invermembrane formation occurs at this stage and for the complete solvent exchange, the film was kept immersed in water bath for 24 h. Later, the formed PES membranes were preserved in 1 % formalin solution.
International Journal of Advanced Research in Engineering and Technology (IJARET), ISSN 0976 99(Online), Volume 5, Issue 11, November (2014), pp. 26
27
main disadvantage is its low hydrophilicity and permeability leading to increased membrane fouling. was investigated to fabricate better membranes by increasing the
increasing the weight. Barth et al. [7] has emphasised that PES, which is more le for liquid state separations. Chakrabarty et al [8] reported the effect of PEG 400,PEG 6000
and PEG 20,000 on the morphology and performance of PSf membranes prepared weparately. From this work, they concluded that solvents and molecular weights of
PEG play a significant role on flux properties of the membranes. The work of Boom et al. NMP as solvent and PVP as an additive in the formation poly(ethersulfone) (PES) membrane showed that PVP suppresses the formation of macro voids by reducing the possibility of delayed demixing in presence of NMP/PVP. The blend of PES/cellulose acetate phthalate (CAP) with
ane performance and morphology was investigated by Rahimpour et
In the current study, PEG has been were added by varying PES/DMF ratio in membrane casting solution followed by phase inversion method. The addition of PEG was leading to alter
roperties and change in pore structure in casting solution that eventually affects membrane formation and permeability properties.
2. EXPERIMENTAL SECTION
PES (Veradale 3000) was supplied by Solvay Solexis (India) limited. ormamide was purchased from Qualigens fine chemicals, Glaxo India limited. All
chemicals used were of analytical grade. Ultrapure water was produced in the laboratory using Millipore pilot plant. The effluent was obtained from Seshasayee paper mills, Erode
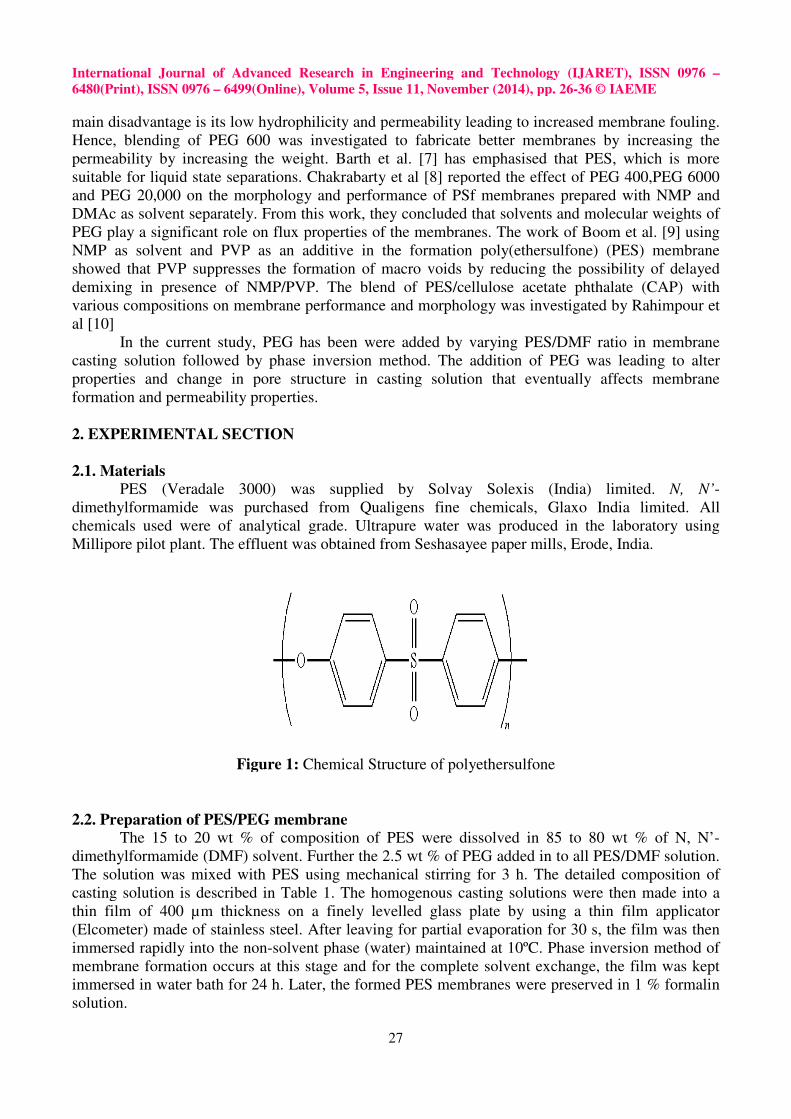
Figure 1: Chemical Structure of polyethersulfone
. Preparation of PES/PEG membrane composition of PES were dissolved in 85 to 80 wt % of N, N’
dimethylformamide (DMF) solvent. Further the 2.5 wt % of PEG added in to all PES/DMF solution. The solution was mixed with PES using mechanical stirring for 3 h. The detailed composition of casting solution is described in Table 1. The homogenous casting solutions were then made into a
ness on a finely levelled glass plate by using a thin film applicator (Elcometer) made of stainless steel. After leaving for partial evaporation for 30 s, the film was then
solvent phase (water) maintained at 10ºC. Phase invermembrane formation occurs at this stage and for the complete solvent exchange, the film was kept immersed in water bath for 24 h. Later, the formed PES membranes were preserved in 1 % formalin
International Journal of Advanced Research in Engineering and Technology (IJARET), ISSN 0976 – 6-36 © IAEME
main disadvantage is its low hydrophilicity and permeability leading to increased membrane fouling. was investigated to fabricate better membranes by increasing the
] has emphasised that PES, which is more reported the effect of PEG 400,PEG 6000 PSf membranes prepared with NMP and
eparately. From this work, they concluded that solvents and molecular weights of The work of Boom et al. [9] using
sulfone) (PES) membrane by reducing the possibility of delayed
The blend of PES/cellulose acetate phthalate (CAP) with ane performance and morphology was investigated by Rahimpour et
In the current study, PEG has been were added by varying PES/DMF ratio in membrane casting solution followed by phase inversion method. The addition of PEG was leading to alter
roperties and change in pore structure in casting solution that eventually affects membrane
PES (Veradale 3000) was supplied by Solvay Solexis (India) limited. N, N’-ormamide was purchased from Qualigens fine chemicals, Glaxo India limited. All
chemicals used were of analytical grade. Ultrapure water was produced in the laboratory using Millipore pilot plant. The effluent was obtained from Seshasayee paper mills, Erode, India.
composition of PES were dissolved in 85 to 80 wt % of N, N’- PEG added in to all PES/DMF solution.
The solution was mixed with PES using mechanical stirring for 3 h. The detailed composition of casting solution is described in Table 1. The homogenous casting solutions were then made into a
ness on a finely levelled glass plate by using a thin film applicator (Elcometer) made of stainless steel. After leaving for partial evaporation for 30 s, the film was then
solvent phase (water) maintained at 10ºC. Phase inversion method of membrane formation occurs at this stage and for the complete solvent exchange, the film was kept immersed in water bath for 24 h. Later, the formed PES membranes were preserved in 1 % formalin
International Journal of Advanced Research in Engineering and Technology (IJARET), ISSN 0976 – 6480(Print), ISSN 0976 – 6499(Online), Volume 5, Issue 11, November (2014), pp. 26-36 © IAEME
28
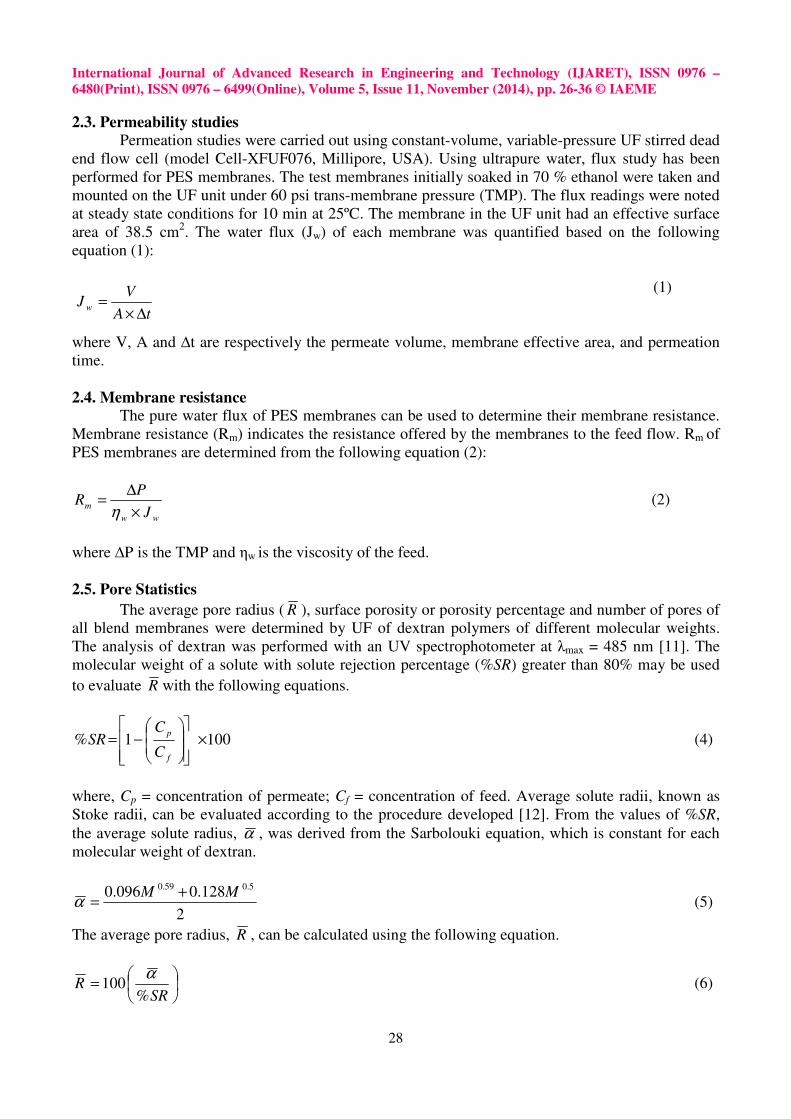
2.3. Permeability studies Permeation studies were carried out using constant-volume, variable-pressure UF stirred dead end flow cell (model Cell-XFUF076, Millipore, USA). Using ultrapure water, flux study has been performed for PES membranes. The test membranes initially soaked in 70 % ethanol were taken and mounted on the UF unit under 60 psi trans-membrane pressure (TMP). The flux readings were noted at steady state conditions for 10 min at 25ºC. The membrane in the UF unit had an effective surface area of 38.5 cm2. The water flux (Jw) of each membrane was quantified based on the following equation (1):
(1)
where V, A and ∆t are respectively the permeate volume, membrane effective area, and permeation time. 2.4. Membrane resistance The pure water flux of PES membranes can be used to determine their membrane resistance. Membrane resistance (Rm) indicates the resistance offered by the membranes to the feed flow. Rm of PES membranes are determined from the following equation (2):
ww
mJ
PR
×
∆=
η (2)
where ∆P is the TMP and ηw is the viscosity of the feed. 2.5. Pore Statistics
The average pore radius ( R ), surface porosity or porosity percentage and number of pores of all blend membranes were determined by UF of dextran polymers of different molecular weights. The analysis of dextran was performed with an UV spectrophotometer at λmax = 485 nm [11]. The molecular weight of a solute with solute rejection percentage (%SR) greater than 80% may be used to evaluate R with the following equations.
1001% ×
−=
f
p
C
CSR (4)
where, Cp = concentration of permeate; Cf = concentration of feed. Average solute radii, known as Stoke radii, can be evaluated according to the procedure developed [12]. From the values of %SR, the average solute radius, α , was derived from the Sarbolouki equation, which is constant for each molecular weight of dextran.
2
128.0096.0 5.059.0MM +
=α (5)
The average pore radius, R , can be calculated using the following equation.
=
SRR
%100
α (6)
tA
VJ w
∆×=
International Journal of Advanced Research in Engineering and Technology (IJARET), ISSN 0976 – 6480(Print), ISSN 0976 – 6499(Online), Volume 5, Issue 11, November (2014), pp. 26-36 © IAEME
29
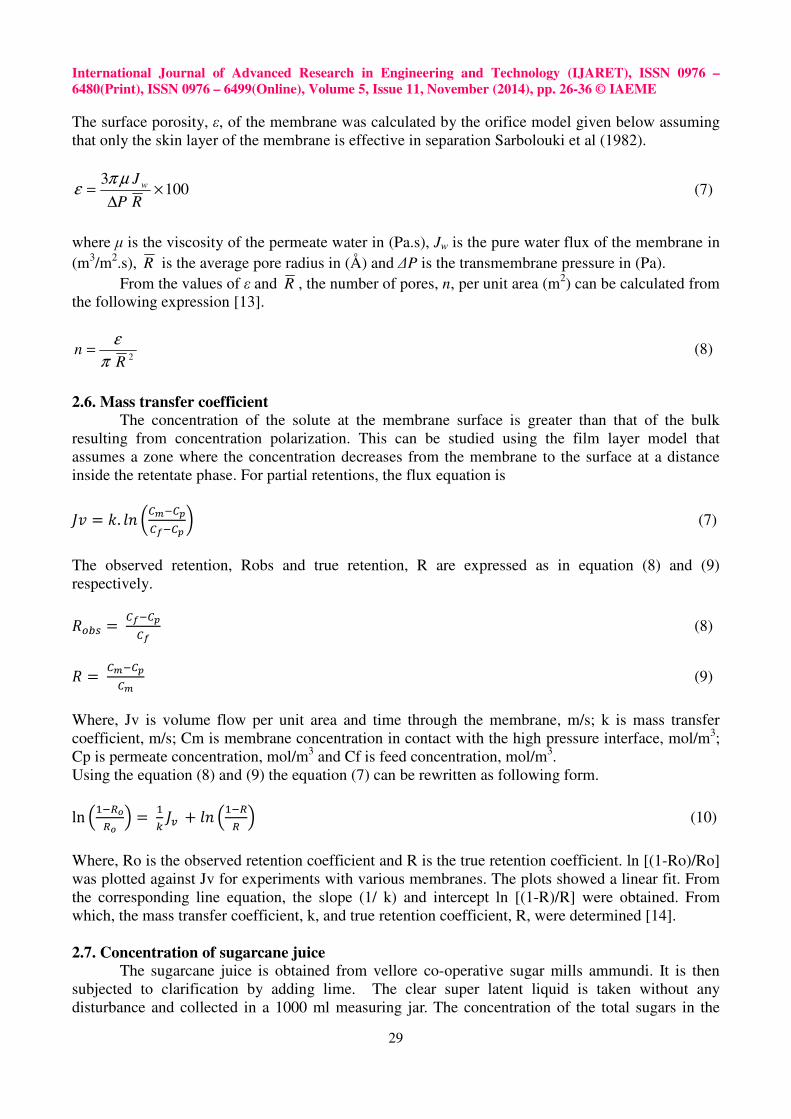
The surface porosity, ε, of the membrane was calculated by the orifice model given below assuming that only the skin layer of the membrane is effective in separation Sarbolouki et al (1982).
1003
×∆
=RP
J wµπε (7)
where µ is the viscosity of the permeate water in (Pa.s), Jw is the pure water flux of the membrane in (m3/m2.s), R is the average pore radius in (Å) and ∆P is the transmembrane pressure in (Pa). From the values of ε and R , the number of pores, n, per unit area (m2) can be calculated from the following expression [13].
2R
nπ
ε= (8)
2.6. Mass transfer coefficient
The concentration of the solute at the membrane surface is greater than that of the bulk resulting from concentration polarization. This can be studied using the film layer model that assumes a zone where the concentration decreases from the membrane to the surface at a distance inside the retentate phase. For partial retentions, the flux equation is
�� = �. �� ��� ��� (7)
The observed retention, Robs and true retention, R are expressed as in equation (8) and (9) respectively.
���� = �� (8)
� = �� (9)
Where, Jv is volume flow per unit area and time through the membrane, m/s; k is mass transfer coefficient, m/s; Cm is membrane concentration in contact with the high pressure interface, mol/m3; Cp is permeate concentration, mol/m3 and Cf is feed concentration, mol/m3. Using the equation (8) and (9) the equation (7) can be rewritten as following form.
ln ������� � = �� �� + �� ����� � (10)
Where, Ro is the observed retention coefficient and R is the true retention coefficient. ln [(1-Ro)/Ro] was plotted against Jv for experiments with various membranes. The plots showed a linear fit. From the corresponding line equation, the slope (1/ k) and intercept ln [(1-R)/R] were obtained. From which, the mass transfer coefficient, k, and true retention coefficient, R, were determined [14]. 2.7. Concentration of sugarcane juice The sugarcane juice is obtained from vellore co-operative sugar mills ammundi. It is then subjected to clarification by adding lime. The clear super latent liquid is taken without any disturbance and collected in a 1000 ml measuring jar. The concentration of the total sugars in the
International Journal of Advanced Research in Engineering and Technology (IJARET), ISSN 0976 – 6480(Print), ISSN 0976 – 6499(Online), Volume 5, Issue 11, November (2014), pp. 26-36 © IAEME
30
feed and permeate streams were determined by collecting samples and analyzing through pol measurement [15]. It may also be noted that on a dry basis, the total concentration of sucrose and dextrose exceed 85 % of the total dissolved solids. The raw juice is treated with milk of lime under constant stirring to raise the pH from around 5.0 to 8.0. The liming was carried out at room temperature (~ 30 °C) .experiments revealed that 2.3 gram of lime was required to raise the pH to 8.0. The treated juice was then kept undisturbed for around 2 hours to facilitate the settling of solids. The observed retention for total dissolved solids (R°TDS) and sugars(R°s) were calculated by following equation.
�°�� = 1 −�# � (9)
�°� = 1 − �#�$�#�$ � (10)
%&'()* = +�,-./0 × 100 (11)
%456 = 7 × 78 × 4569:;<=>?@@. @AB × CD. ?9
3. RESULTS AND DISCUSSION
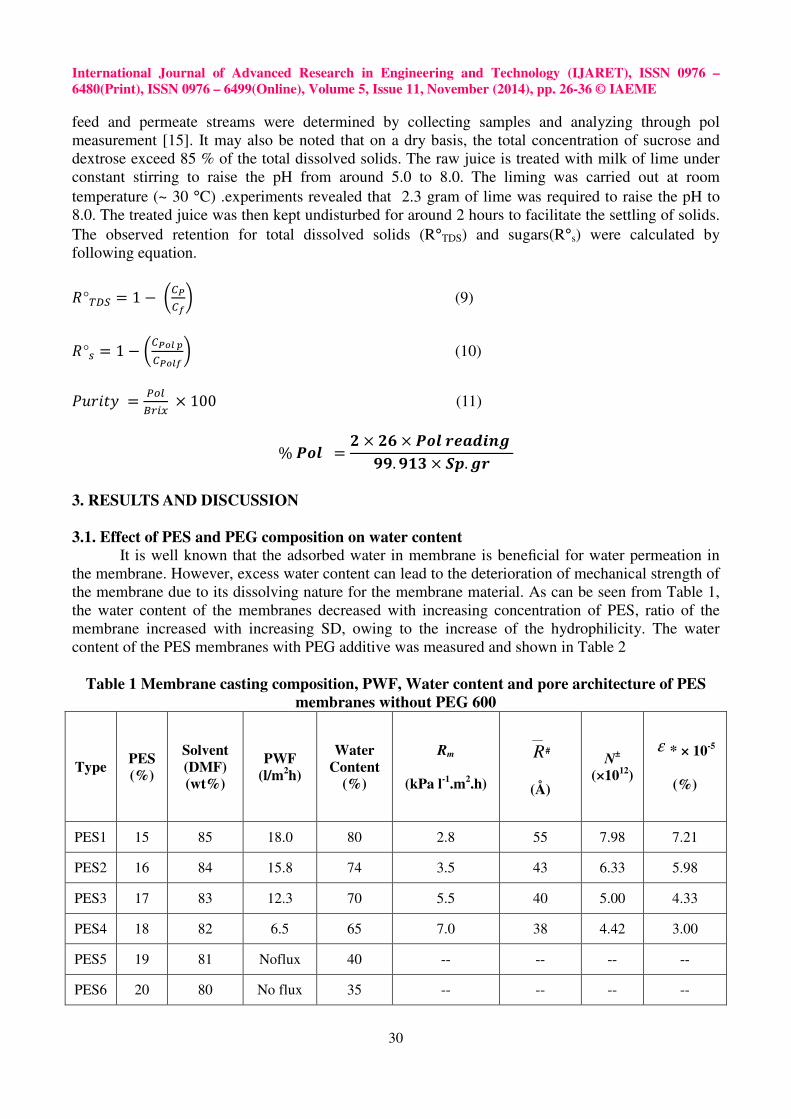
3.1. Effect of PES and PEG composition on water content It is well known that the adsorbed water in membrane is beneficial for water permeation in
the membrane. However, excess water content can lead to the deterioration of mechanical strength of the membrane due to its dissolving nature for the membrane material. As can be seen from Table 1, the water content of the membranes decreased with increasing concentration of PES, ratio of the membrane increased with increasing SD, owing to the increase of the hydrophilicity. The water content of the PES membranes with PEG additive was measured and shown in Table 2
Table 1 Membrane casting composition, PWF, Water content and pore architecture of PES
membranes without PEG 600
Type PES (%)
Solvent (DMF) (wt%)
PWF (l/m2h)
Water Content
(%)
Rm
(kPa l-1.m2.h)
R#
(Å)
N±
(×1012)
ε * × 10-5
(%)
PES1 15 85 18.0 80 2.8 55 7.98 7.21
PES2 16 84 15.8 74 3.5 43 6.33 5.98
PES3 17 83 12.3 70 5.5 40 5.00 4.33
PES4 18 82 6.5 65 7.0 38 4.42 3.00
PES5 19 81 Noflux 40 -- -- -- --
PES6 20 80 No flux 35 -- -- -- --
International Journal of Advanced Research in Engineering and Technology (IJARET), ISSN 0976 – 6480(Print), ISSN 0976 – 6499(Online), Volume 5, Issue 11, November (2014), pp. 26-36 © IAEME
31
It was evidently seen that the water content increased with an increase of PEG amount, the water content of all modified PES membranes was higher than that of the PES virgin membrane. It was realized that the addition of PEG increased the porosity of the modified PES membranes, which might be due to the addition of PEG into casting solution would be leached out to coagulation bath and result in formation of pores, the formed pores would be filled with water. However, all the values of PES modified membranes were lowest value when compared with CA modified membranes
3.2. Effect of PES and PEG composition on pore architecture of membranes
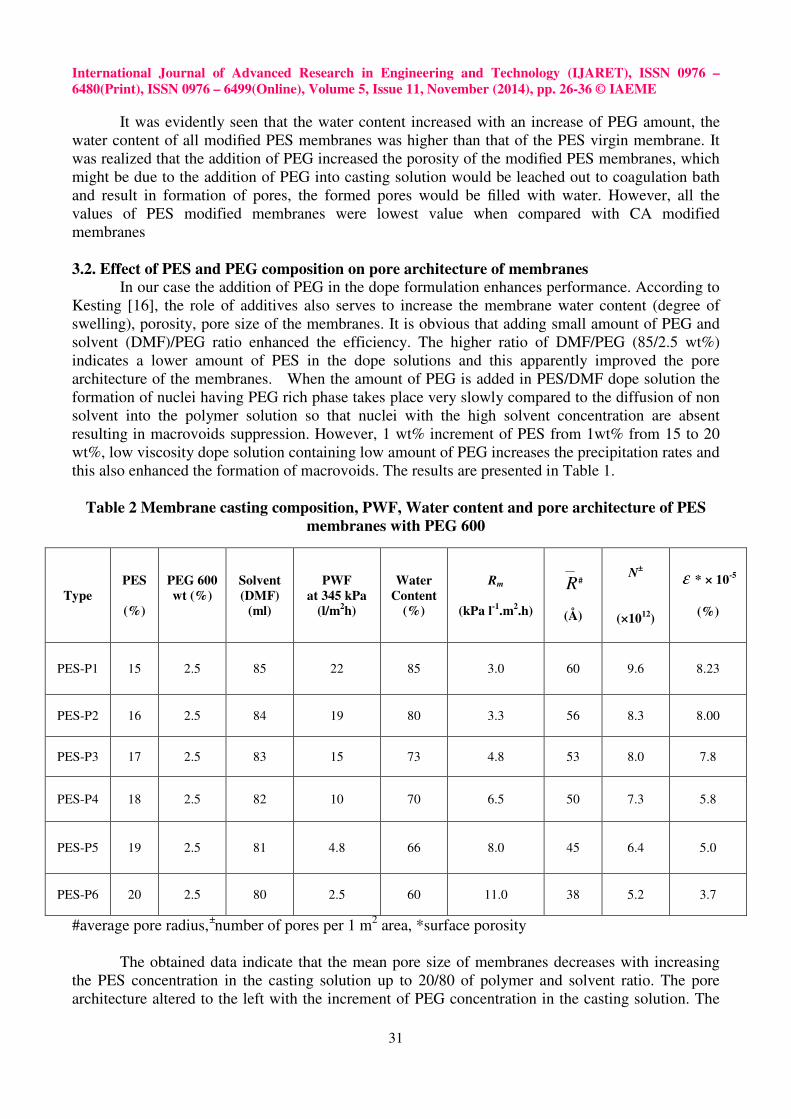
In our case the addition of PEG in the dope formulation enhances performance. According to Kesting [16], the role of additives also serves to increase the membrane water content (degree of swelling), porosity, pore size of the membranes. It is obvious that adding small amount of PEG and solvent (DMF)/PEG ratio enhanced the efficiency. The higher ratio of DMF/PEG (85/2.5 wt%) indicates a lower amount of PES in the dope solutions and this apparently improved the pore architecture of the membranes. When the amount of PEG is added in PES/DMF dope solution the formation of nuclei having PEG rich phase takes place very slowly compared to the diffusion of non solvent into the polymer solution so that nuclei with the high solvent concentration are absent resulting in macrovoids suppression. However, 1 wt% increment of PES from 1wt% from 15 to 20 wt%, low viscosity dope solution containing low amount of PEG increases the precipitation rates and this also enhanced the formation of macrovoids. The results are presented in Table 1.
Table 2 Membrane casting composition, PWF, Water content and pore architecture of PES membranes with PEG 600
#average pore radius,±number of pores per 1 m2 area, *surface porosity
The obtained data indicate that the mean pore size of membranes decreases with increasing the PES concentration in the casting solution up to 20/80 of polymer and solvent ratio. The pore architecture altered to the left with the increment of PEG concentration in the casting solution. The
Type PES
(%)
PEG 600 wt (%)
Solvent (DMF)
(ml)
PWF at 345 kPa
(l/m2h)
Water Content
(%)
Rm
(kPa l-1.m2.h)
R#
(Å)
N±
(×1012)
ε * × 10-5
(%)
PES-P1 15 2.5 85 22 85 3.0 60 9.6 8.23
PES-P2 16 2.5 84 19 80 3.3 56 8.3 8.00
PES-P3 17 2.5 83 15 73 4.8 53 8.0 7.8
PES-P4 18 2.5 82 10 70 6.5 50 7.3 5.8
PES-P5 19 2.5 81 4.8 66 8.0 45 6.4 5.0
PES-P6 20 2.5 80 2.5 60 11.0 38 5.2 3.7
International Journal of Advanced Research in Engineering and Technology (IJARET), ISSN 0976 – 6480(Print), ISSN 0976 – 6499(Online), Volume 5, Issue 11, November (2014), pp. 26-36 © IAEME
32
calculated results of pore density and surface porosity of the membranes are improved by adding PEG into the PES.
3.3. Effect of PEG 600 on mass transfer coefficient of PES membranes
In ultrafiltration membranes preparation, PEG is highly soluble with DMF and PES solution, and therefore, it can be washed out together with the solvent from the membrane film to the coagulation bath or vice versa. The rates of diffusivity of PEG is much slower than the solvent (DMF). Therefore, the PEG in solvent (DMF) take more time to reach the surface and this will give ample time for the polymer aggregates on t op of it to form a thicker and denser layer. Hence, mass transfer value differ from 9.6 to 10.1 X10⁶ m/s, in case of PES membranes without PEG and with PEG (Table 3).
Table 3.Mass transfer coefficient and true retention of the membranes
Membrane No Mass transfer Coefficient X106 m/s True retention % PES1 9.6 90.4 PES2 8.5 88.0 PES3 8.0 86.1 PES4 7.1 85.9 PES5 6.6 81.0 PES6 5.6 68.0
PES-P1 10.1 89.3 PES-P2 9.7 90.6 PES-P3 9.0 89.8 PES-P4 8.0 86.3
6PES-P5 7.3 78.1 PES-P6 6.1 70
The mass transfer associated is obviously very important to gain knowledge of the phase-
separation mechanism during membrane formation because the mass transfer behavior plays important roles in determining the pore formation on inside and surface of membranes. 3.4. Effect of PEG composition on pure water flux of PES membranes
The water flux of PES membranes without PEG 600 showed lower water flux than that of PES membranes with PEG 600 (Table 4 and 5). The water flux for membrane PES-1 with 15 wt5 and 85wt% solvent combination was highest, followed by flux decreased for PES2 to PES-6 The flux for PES-6 was on the lower value. Although the percent variation in flux looks on a higher side for PES membranes with PEG 600, due to addition of PEG 600 in PES casting solution (17.4 times). The difference in flux values of membrane by making with PES with PEG 600 and PES without PEG 600 could be attributed to the larger pore size variations in the latter cases. This is evident from the pore size architecture on surface of the membranes. This is further supported by rejection studies 3.5. Concentration of sugarcane juice
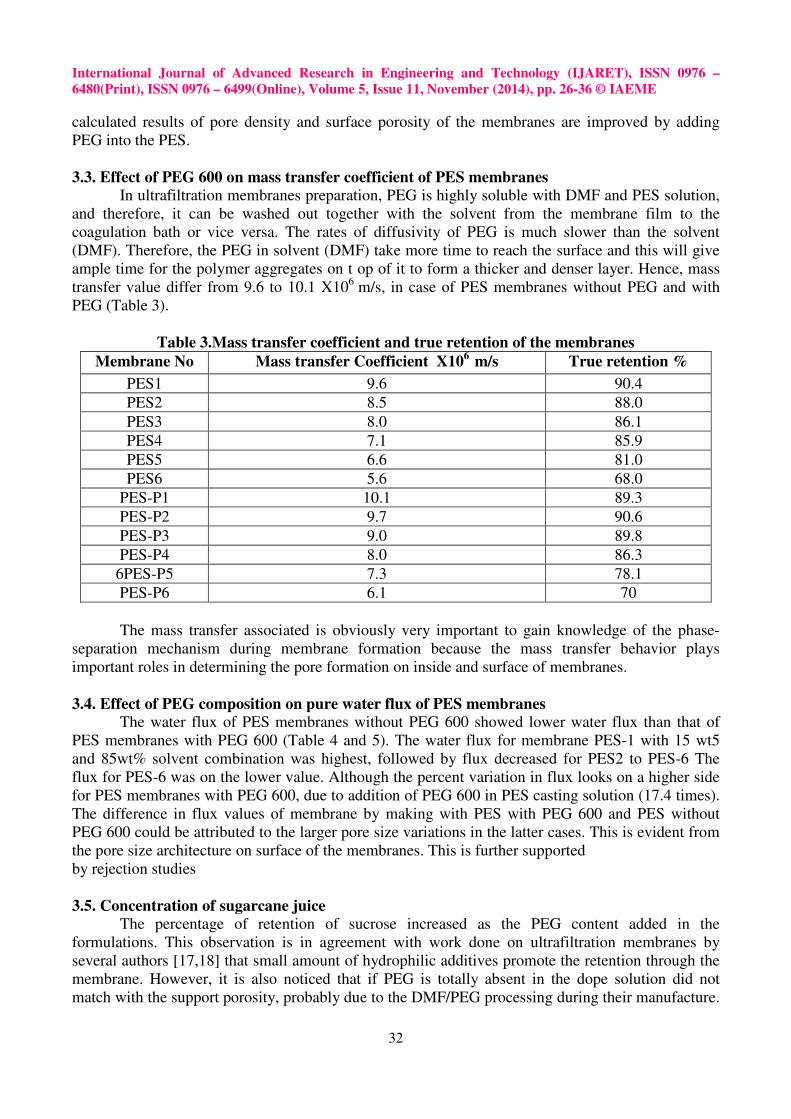
The percentage of retention of sucrose increased as the PEG content added in the formulations. This observation is in agreement with work done on ultrafiltration membranes by several authors [17,18] that small amount of hydrophilic additives promote the retention through the membrane. However, it is also noticed that if PEG is totally absent in the dope solution did not match with the support porosity, probably due to the DMF/PEG processing during their manufacture.

International Journal of Advanced Research in Engineering and Technology (IJARET), ISSN 0976 – 6480(Print), ISSN 0976 – 6499(Online), Volume 5, Issue 11, November (2014), pp. 26-36 © IAEME
33
Further, It is possible that the presence of low amounts of PEG probably caused rapid formation of nuclei having PEG rich phase compared to the diffusion of non solvent into the polymer solution. It can be seen from Table 4.14, retention of solids and sucrose from 17 and 15.8% to 29 to 24%, when PEG added in PES/DMF dope solution. In addition, lower amount of hydrophilic additives in ultrafiltration membrane caused the polymer particle at the surface to swell mainly in the vertical direction thus creating spaces between the polymer structures, allowing solutes to pass through easily.
Table 4. Retention of sucrose and solids of PES membranes with PEG 600
Type Feed of sugar solution Permeate of sugar solution Retention of
solids (%)
Retention of Sucrose (%)
Brix (%)
Pol Pol (%)
Purity (%)
Brix (%)
Pol Pol (%)
Purity (%)
PES1 14.5 46 11.3 78.27 10.5 35 8.5 79 11 6.21
PES2 14.5 43 10.6 73.3 11 36 9.4 68.5 12 8.8
PES3 14.5 46 11.3 78.27 13 36.8 7.8 70 13.0 11.0
PES4 14.5 43 10.6 73.3 14.5 37.2 10.0 86.8 17.2 14.11
PES5 -- -- -- -- -- -- -- -- -- --
PES6 -- -- -- -- -- -- -- -- -- --
In this study, the effect of PEG on PES membranes for sugar solution concentration is
observed the increasing sugars solids percentage with addition of additives results in horizontal polymer swelling and this is a hindrance of the solute passage thus solids percentage increased. These results show that the formulated UF membrane produced in PES, is capable to concentrate sugar from solution and are comparable to the with PEG and without PEG membrane found (Table 4.15). Moreover, feed solution purity and permeate solution purity shows small change during ultrafiltration. Further, sugar industry, generally needs to be higher purity in dilute solution by the UF membrane produced. The results achieved showed that the UF membrane produced in our study was useful for commercialized PES membrane. 3.6. Effect of PES and PEG composition in transmembrane pressure (TMP)
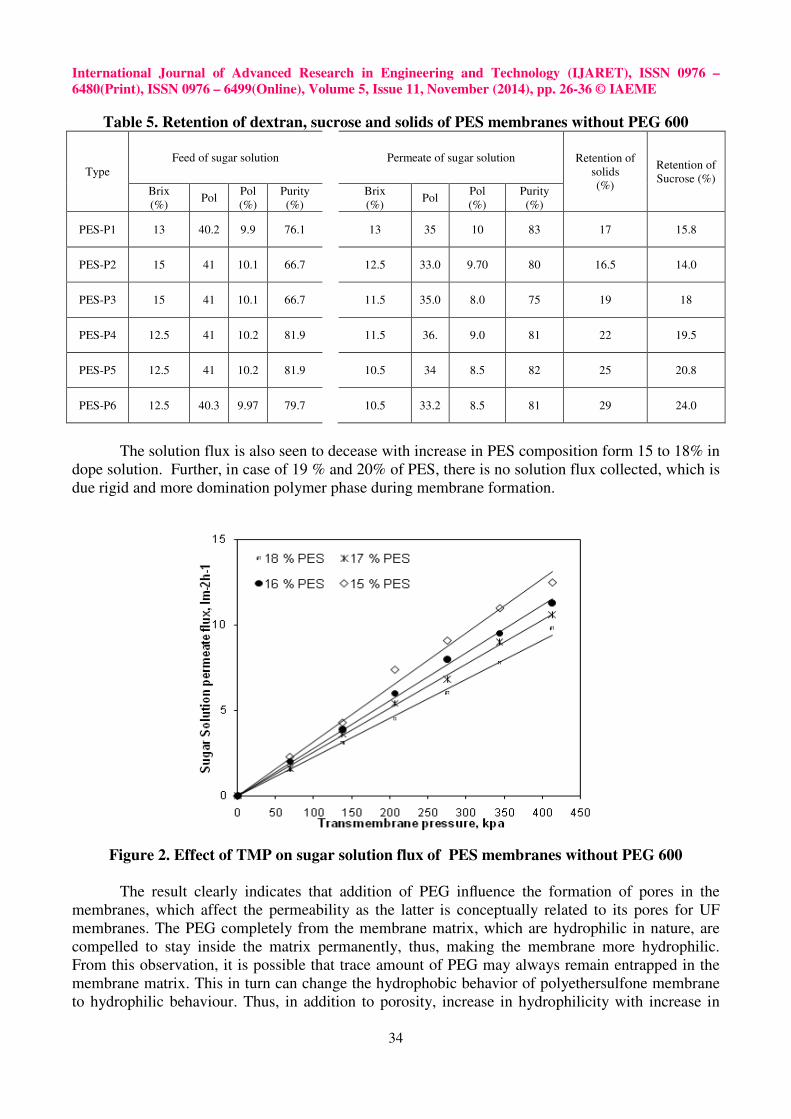
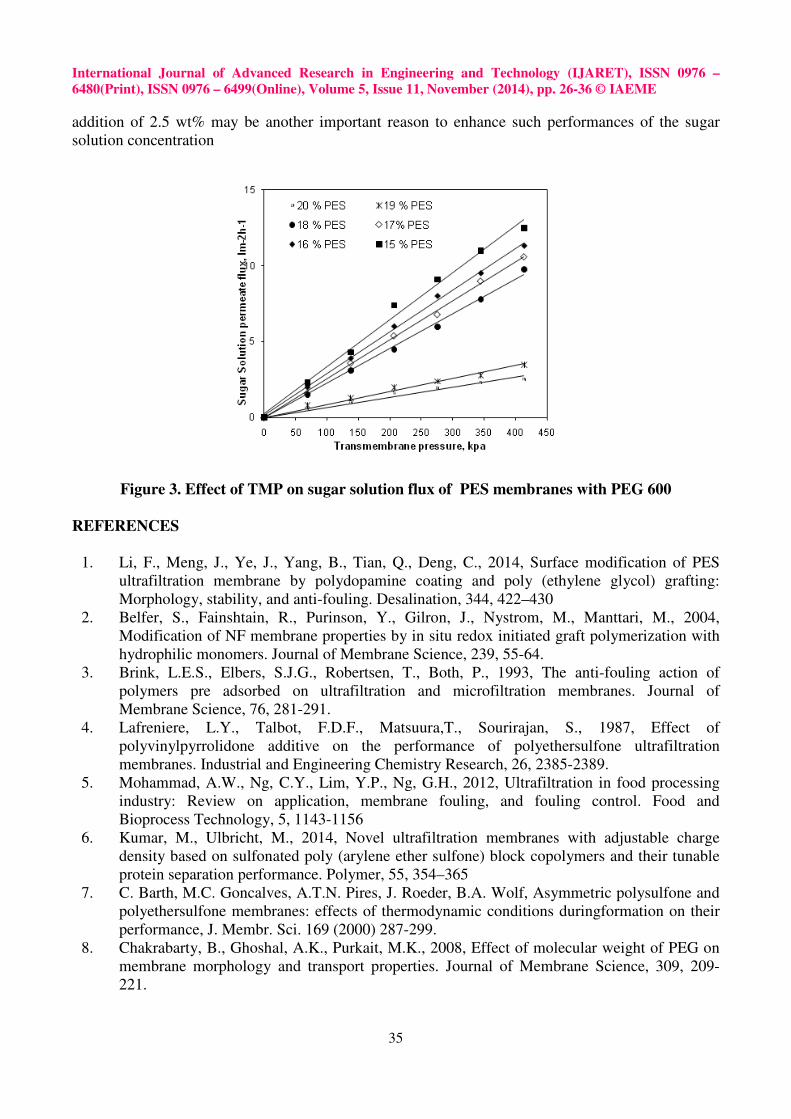
The effect of PES composition and PEG on sugar solution flux at various transmembrane pressures is shown in the Figures. 2 and 3. It is seen that within the range of 0 to 414 kPa, with increase in transmembrane pressure, solution increases almost linearly for all the membranes. This is due to the increase in effective driving force (transmembrane pressure) required for permeation dilute solution through membarnes.
International Journal of Advanced Research in Engineering and Technology (IJARET), ISSN 0976 – 6480(Print), ISSN 0976 – 6499(Online), Volume 5, Issue 11, November (2014), pp. 26-36 © IAEME
34
Table 5. Retention of dextran, sucrose and solids of PES membranes without PEG 600
Type Feed of sugar solution Permeate of sugar solution Retention of
solids (%)
Retention of Sucrose (%)
Brix (%)
Pol Pol (%)
Purity (%)
Brix (%)
Pol Pol (%)
Purity (%)
PES-P1 13 40.2 9.9 76.1 13 35 10 83 17 15.8
PES-P2 15 41 10.1 66.7 12.5 33.0 9.70 80 16.5 14.0
PES-P3 15 41 10.1 66.7 11.5 35.0 8.0 75 19 18
PES-P4 12.5 41 10.2 81.9 11.5 36. 9.0 81 22 19.5
PES-P5 12.5 41 10.2 81.9 10.5 34 8.5 82 25 20.8
PES-P6 12.5 40.3 9.97 79.7 10.5 33.2 8.5 81 29 24.0
The solution flux is also seen to decease with increase in PES composition form 15 to 18% in
dope solution. Further, in case of 19 % and 20% of PES, there is no solution flux collected, which is due rigid and more domination polymer phase during membrane formation.
Figure 2. Effect of TMP on sugar solution flux of PES membranes without PEG 600
The result clearly indicates that addition of PEG influence the formation of pores in the membranes, which affect the permeability as the latter is conceptually related to its pores for UF membranes. The PEG completely from the membrane matrix, which are hydrophilic in nature, are compelled to stay inside the matrix permanently, thus, making the membrane more hydrophilic. From this observation, it is possible that trace amount of PEG may always remain entrapped in the membrane matrix. This in turn can change the hydrophobic behavior of polyethersulfone membrane to hydrophilic behaviour. Thus, in addition to porosity, increase in hydrophilicity with increase in
International Journal of Advanced Research in Engineering and Technology (IJARET), ISSN 0976 – 6480(Print), ISSN 0976 – 6499(Online), Volume 5, Issue 11, November (2014), pp. 26-36 © IAEME
35
addition of 2.5 wt% may be another important reason to enhance such performances of the sugar solution concentration
Figure 3. Effect of TMP on sugar solution flux of PES membranes with PEG 600 REFERENCES
1. Li, F., Meng, J., Ye, J., Yang, B., Tian, Q., Deng, C., 2014, Surface modification of PES ultrafiltration membrane by polydopamine coating and poly (ethylene glycol) grafting: Morphology, stability, and anti-fouling. Desalination, 344, 422–430
2. Belfer, S., Fainshtain, R., Purinson, Y., Gilron, J., Nystrom, M., Manttari, M., 2004, Modification of NF membrane properties by in situ redox initiated graft polymerization with hydrophilic monomers. Journal of Membrane Science, 239, 55-64.
3. Brink, L.E.S., Elbers, S.J.G., Robertsen, T., Both, P., 1993, The anti-fouling action of polymers pre adsorbed on ultrafiltration and microfiltration membranes. Journal of Membrane Science, 76, 281-291.
4. Lafreniere, L.Y., Talbot, F.D.F., Matsuura,T., Sourirajan, S., 1987, Effect of polyvinylpyrrolidone additive on the performance of polyethersulfone ultrafiltration membranes. Industrial and Engineering Chemistry Research, 26, 2385-2389.
5. Mohammad, A.W., Ng, C.Y., Lim, Y.P., Ng, G.H., 2012, Ultrafiltration in food processing industry: Review on application, membrane fouling, and fouling control. Food and Bioprocess Technology, 5, 1143-1156
6. Kumar, M., Ulbricht, M., 2014, Novel ultrafiltration membranes with adjustable charge density based on sulfonated poly (arylene ether sulfone) block copolymers and their tunable protein separation performance. Polymer, 55, 354–365
7. C. Barth, M.C. Goncalves, A.T.N. Pires, J. Roeder, B.A. Wolf, Asymmetric polysulfone and polyethersulfone membranes: effects of thermodynamic conditions duringformation on their performance, J. Membr. Sci. 169 (2000) 287-299.
8. Chakrabarty, B., Ghoshal, A.K., Purkait, M.K., 2008, Effect of molecular weight of PEG on membrane morphology and transport properties. Journal of Membrane Science, 309, 209-221.
International Journal of Advanced Research in Engineering and Technology (IJARET), ISSN 0976 – 6480(Print), ISSN 0976 – 6499(Online), Volume 5, Issue 11, November (2014), pp. 26-36 © IAEME
36
9. Boom, R.M., Wienk, I.M., Boomgaard T.V.M., Smolders, C.A., 1992, Microstructures in phase inversion membranes. Part 2. The role of a polymeric additive. Journal of Membrane Science, 73, 277-292.
10. Rahimpour, A., Madaeni, S.S., 2007, Polyethersulfone (PES)/ cellulose acetate phthalate (CAP) blend ultrafiltration membranes: Preparation, morphology, performance and antifouling properties. Journal of Membrane Science, 305, 299-312.
11. Sivakumar M, A K Mohanasundaram, D Mohan, K Balu, R Rangarajan, (1998), Modification of cellulose acetate: Its characterization and application as an ultrafiltration membrane. Journal of Applied Polymer Science, 67, 1939-1946.
12. Sarbolouki, M.N., 1982, A General Diagram for Estimating Pore Size of Ultrafiltration and Reverse Osmosis Membranes. Separation Science and Technology, 17, 381-395.
13. Malaisamy, R., Mohan, D., 2002, Polyurethane and sulfonated polysulfone blend ultrafiltration membranes. Part. I. Preparation and characterizations. Journal of Colloid and Interface Science, 254, 129-140.
14. Khan, S., Ghosh, A.K., Ramachandhran, V., Bellare, J., Hanra, M.S., Trivedi, M.K., Misra, B.M., 2000, Synthesis and characterization of low molecular weight Cutoff off ultrafiltration membranes from cellulose propionate polymer. Desalination, 128, 5746-5752.
15. Bhattacharya, P.K., Agarwal S .S.D., Gopal, U.V.S.R., 2001, Ultrafiltration of sugar cane juice for recovery of sugar: analysis of flux and retention. Separation and Purification Technology, 21, 247-259.
16. Kesting R.E. (1985), ‘Synthetic Polymeric Membranes’, 2nd edition, Wiley and Sons Publication, New York, pp. 1-50
17. Kim, H.J., Tyagi, R.K., Fouda, A.E., Ionasson, K., 1996, The kinetic study for asymmetric membrane formation via phase-inversion process. Journal of Applied Polymer Science, 62, 621- 629.
18. Han, M.J.. Nam, S.T. 2002, Thermodynamic and rheological variation in polysulfone solution by PVP and its effect in the preparation of phase inversion membrane, Journal of Membrane Science, 202, 55–61
19. B. Chirsabesan and M.Vijay, “Performance of Integrated Process using Fungal Strain Corialus Versicalor (Mtcc-138) in Microbial Dyes Degradation”, International Journal of Advanced Research in Engineering & Technology (IJARET), Volume 4, Issue 6, 2013, pp. 27 - 39, ISSN Print: 0976-6480, ISSN Online: 0976-6499.
20. V.C.Padmanaban, Soumya.S.Prakash, Sherildas P, John Paul Jacob and Kishore Nelliparambil, “Biodegradation of Anthraquinone Based Compounds: Review”, International Journal of Advanced Research in Engineering & Technology (IJARET), Volume 4, Issue 4, 2013, pp. 74 - 83, ISSN Print: 0976-6480, ISSN Online: 0976-6499.
21. Abubakar Alkali and Edward Gobina, “Hydrogen Permeation Behavior and Annealing in Composite Palladium Membranes at High Temperature”, International Journal of Advanced Research in Engineering & Technology (IJARET), Volume 5, Issue 4, 2014, pp. 205 - 212, ISSN Print: 0976-6480, ISSN Online: 0976-6499.
22. B.Chirsabesan and M.Vijay, “Membrane Assisted Electro Chemical Degradation for Quinoline Yellow, Eosin B and Rose Bengal Dyes Degradation”, International Journal of Design and Manufacturing Technology (IJDMT), Volume 4, Issue 2, 2013, pp. 21 - 41, ISSN Print: 0976 – 6995, ISSN Online: 0976 – 7002.
23. T. Balamurali and B. Preetha, “The Separation of Copper, Nickel and Chromium Metal Ions Using With Ultrafiltration Membrane: Effect of Polymer Membrane Compositions”, International Journal of Advanced Research in Engineering & Technology (IJARET), Volume 5, Issue 6, 2014, pp. 144 - 162, ISSN Print: 0976-6480, ISSN Online: 0976-6499.