Embed Size (px)
Citation preview
EFFECT OF MECHANICAL DEPULPING ON THE BIOCHEMICAL,
PHYSICOCHEMICALAND POLYPHENOLIC CONSTITUENTS DURING
FERMENTATION AND DRYING OF GHANAIAN COCOA BEANS
BY
DANIEL TETTEH OTU AMANQUAH
(10220709)
THIS THESIS IS SUBMITTED TO THE UNIVERSITY OF GHANA, LEGON
IN PARTIAL FULFILLMENT OF THE REQUIRMENT FOR THE AWARD
OF MPHIL FOOD SCIENCE DEGREE
JULY 2013
University of Ghana http://ugspace.ug.edu.gh

i
DECLARATION
I declare that this thesis presented herein was conducted by me under supervision at
the Department of Nutrition and Food Science, University of Ghana, Legon in Accra,
Ghana. All references have been duly cited and listed.
Daniel Tetteh Otu Amanquah
(Student)
Supervisory Committee
Prof. Emmanuel Ohene Afoakwa
(Principal Supervisor)
Dr. Agnes Budu
(Co-supervisor)
University of Ghana http://ugspace.ug.edu.gh

ii
DEDICATION
This treatise is dedicated to God Almighty for His protection and grace, to my parents
Dr. Seth Amanquah and Mrs. Margaret Amanquah for their continuous commitment
and faithfulness towards my education and the last but not the least to my siblings
Richard Amanquah and Margaret Corquaye for their support and prayers.
University of Ghana http://ugspace.ug.edu.gh

iii
ACKNOWLEDGEMENT
I am greatly indebted to my supervisor Prof. Emmanuel Ohene Afoakwa
under whose supervision, diligence, patience, constructive criticisms, technical and
financial support, this project was made a success.My sincere gratitude also goes to
my co-supervisor Dr. Agnes Budu for her constant advise, motherly care and support
and Dr. F. K. Saalia for his expert advice.
I also owe a great deal of gratitude to the staff of the Cocoa Research Institute
(CRIG) especially to Dr Jemmy Takrama, Dr. S. T. Lowor, Laboratory Technicians
Mrs. Rafiatu Kotei, Mr. Dankyi. Mr. Asare and Mr. Sethat the cocoa fermentary and
not forgetting the National Service Personnel Messrs. Majeed Bakari and Silas
Boateng who in times of need rose to the occasion. My sincere appreciation also goes
to Mr. John Edem Kongor for proof reading my work.
To my family, colleagues and friendsI say a big thank you for their immense
support.Above all I give thanks and honour to God Almighty for the gift of life and
his mercies.
University of Ghana http://ugspace.ug.edu.gh
iv
ABSTRACT
This work investigated the effects of mechanical depulping (asa means of pulp
pre-conditioning) on thechemical, physicochemical and polyphenolic constituents
during fermentation and drying of Ghanaian cocoa beans. The fermentation study and
the drying study were conducted using a 5x4 factorial experiment with the principal
factors being;(a) concentration of depulped beans (0, 25, 50, 75 and 100%),(b)
fermentation time (0, 2, 4 and 6 days) and(a) concentration of depulped beans (0, 25,
50, 75 and 100%), (b) drying time (0, 2, 4 and 6 days) respectively. Ripe cocoa pods
were depulped using a mechanical depulper and the depulped beans mixed with
undepulped beans in a pre-determined ratio prior to fermentation. All parameters were
studied using standard methods.
Mechanical depulping and fermentation influenced all the studied
parameters.Protein content decreased from 16.23% at the beginning of fermentation
to 13.64% by the sixth day of fermentation in undepulped beans.Potassium was the
dominant mineral and iron the least.Depulping caused a decrease in the potassium (K)
content from 1000.43 mg/100g at the start of fermentation to 718.18 mg/100g at the
end of fermentation in undepulped beans. Changes in biochemical composition and
physicochemical properties were variable during fermentation of the depulped beans.
The pH decreased from 6.5 to 6.3 for samples containing 0% to 100% respectively at
the beginning of fermentation.Depulping caused slight increases in pH from 5.7 at the
end of fermentation in 0% depulped beans to 6.02 at the end of fermentation in
samples containing 100% depulped beans. Reducing sugar increased from 157.33
mg/g at the start of fermentation to 304.95 mg/gbythe sixth day of fermentation in 0%
depulped beans.Depulping caused slight decreases in reducing sugar content.
Increasing fermentation and depulping resulted in an increase in FFA. The FFA
University of Ghana http://ugspace.ug.edu.gh

v
content increased from 0.89% in 0% depulping to 0.94% in samples containing 25%
depulped beans.All thetreatments (0%, 25%, 50%, 75% and 100%) depulped
beansobtainedfermentation index of one (1) by the forth (4th
) day of
fermentation.Total polyphenols and o-diphenols reduced with respect to depulping
and fermentation time.Total polyphenols decreased from 31.29 mg/gat the start of
fermentation to 22.23 mg/gat the end of the fermentation process in undepulped
beans.Depulping caused a reduction in total polyphenols from 22.23 mg/g in
undepulped beans to 19.9 mg/gin 25% depulped beans.
Depulping of cocoa beans caused an increase in pHfrom 5 to 6 during drying.
Depulping caused a slight increase in pH from 5.46 by the fourth day of fermentation
in undepulped beans to 5.78 by the fourth day of fermentation in samples containing
100% depulped beans, however the FFA content after drying was far below the
stipulated 1.75%.The anthocyanins content of the beans varied significantly with
increasing dryingtime and depulping. It decreased from 7.60 mg/gat the start of
drying to 5.35 mg/gby the fourth day of drying in undepulped beans.
Drying of cocoa beans showed no distinct trendfor lightness (L), redness (a)
and yellowness (b) for all levels of depulped beans.
Cut test on the samples showed that percentage of purple beans generally
reduced with increasing depulping.
These findings suggest that mechanical depulping influenced to a varying
degree the chemical, biochemical and polyphenolic content of fermented and dried
Ghanaian cocoa beans.
University of Ghana http://ugspace.ug.edu.gh

vi
TABLE OF CONTENTS
DECLARATION........................................................................................................... i
DEDICATION............................................................................................................. ii
ACKNOWLEDGEMENT ......................................................................................... iii
ABSTRACT ................................................................................................................. iv
LIST OF TABLES .................................................................................................... xii
CHAPTER ONE .......................................................................................................... 1
1.0 INTRODUCTION ................................................................................................ 1
1.1 Background information ......................................................................................................... 1
1.2 Rationale ........................................................................................................................................ 3
1.2 Main objective .............................................................................................................................. 4
1.3 Specific objectives ...................................................................................................................... 4
CHAPTER TWO ......................................................................................................... 6
2.0 LITERATURE REVIEW .................................................................................... 6
2.1 Origin and classification of cocoa......................................................................................... 6
2.2 Cocoa cultivation ........................................................................................................................ 7
2.3 Cocoa production, supply and consumption ................................................................... 8
2.3.1 Global production of cocoa ..................................................................... 8
2.3.2 Cocoa production in Ghana ................................................................... 10
2.3.4 Cocoa supply chain in Ghana ............................................................... 11
2.2.4 Cocoa Commerce: demand, consumption and market for cocoa.......... 13
2.3.1 Pulp composition................................................................................... 15
2.3.2 Bean composition ................................................................................. 16
2.3.3 Chemical composition of unfermented cocoa beans ............................. 18
University of Ghana http://ugspace.ug.edu.gh

vii
2.3.3.1 Fat ................................................................................................... 18
2.3.3.2 Proteins ........................................................................................... 18
2.3.3.3 Sugars ............................................................................................. 19
2.3.3.4 Polyphenols .................................................................................... 20
2.3.3.5 Organic acids .................................................................................. 21
2.4 Primary processing of cocoa beans .................................................................................. 21
2.4.1 Harvesting ............................................................................................. 21
2.4.2 Pulp-preconditioning ............................................................................. 22
2.4.3 Pod-breaking ......................................................................................... 23
2.4.4 Fermentation ......................................................................................... 23
2.4.5 Fermentation systems ............................................................................ 25
2.4.5.1 Heap fermentation .......................................................................... 25
2.4.5.2 Tray fermentation ........................................................................... 26
2.4.5.3 Box fermentation ............................................................................ 26
2.4.5.4 Other fermentation types ................................................................ 27
2.4.5.5 Drying platform fermentation and Basket fermentation ................ 27
2.4.6 Drying ................................................................................................... 28
2.4.6.1 Natural drying ................................................................................. 28
2.4.6.2 Artificial Drying ............................................................................. 29
2.5 Microbiology of cocoa fermentation ................................................................................ 29
2.6 Biochemical and chemical changes during fermentation ....................................... 33
2.6.1 Enzymology of cocoa beans ................................................................. 34
2.6.2.1 Hydrolytic enzyme reactions .......................................................... 35
2.6.2.2 Oxidative enzyme reactions ........................................................... 36
2.7 Quality indices of fermented and dried cocoa beans ................................................ 37
2.7.1 Cut-test .................................................................................................. 37
University of Ghana http://ugspace.ug.edu.gh
viii
2.7.2 Free fatty acid levels ............................................................................. 38
2.8 Storage and Transportation of cocoa beans ................................................................. 39
2.8.1 Storage of cocoa beans .......................................................................... 39
2.9 Summary ..................................................................................................................................... 39
CHAPTER THREE ................................................................................................... 40
3.0 MATERIALS AND METHODS ....................................................................... 40
3.1 Materials ...................................................................................................................................... 40
3. 2 Sample Preparation ................................................................................................................ 41
3. 2.1 Mechanical depulping (pulp preconditioning) .................................... 41
3.2.1.1 Description of the mechanical depulper ......................................... 41
3.2.1.2 Pulp pre-conditioning process ........................................................ 41
3.2.2 Fermentation and drying ...................................................................... 43
3.2.3 Samples for analysis.............................................................................. 43
3.3 Experimental Design .............................................................................................................. 44
3.4 Analytical methods ................................................................................................................. 46
3.4.1 Chemical analyses ................................................................................ 46
3.4.1.1 Proximate analysis ........................................................................... 46
3.4.2 Mineral analysis ................................................................................... 46
3.4.2.1 Wet digestion .................................................................................. 46
3.4.2.2 Determination of Ca, Mg, Zn, Fe, Cu and K ................................... 47
3.4.2.3 Phosphorus determination ................................................................ 47
3.4.3 Biochemical and physicochemical analyses ......................................... 48
3.4.3.1 pH and titratable acidity ................................................................. 48
3.4.3.2 Total sugars .................................................................................... 48
3.4.3.3 Reducing sugars.............................................................................. 49
University of Ghana http://ugspace.ug.edu.gh

ix
3.4.3.4 Non-reducing sugars ....................................................................... 50
3.4.3.5 Free fatty acids (FFAs) ................................................................... 50
3.4.3.6 Colour determination ....................................................................... 50
3.4.4 Polyphenolic constituents ..................................................................... 51
3.4.4.1 Total polyphenols ........................................................................... 51
3.4.4.2 Anthocyanins .................................................................................. 51
3.4.4.3 O-diphenols .................................................................................... 52
3.4.5 Fermentative quality ............................................................................. 52
3.4.5.1 Fermentation index (FI) .................................................................. 52
3.4.5.2 Cut test ............................................................................................. 53
3.6 Statistical analyses .................................................................................................................. 53
CHAPTER FOUR ...................................................................................................... 55
4.0 RESULTS AND DISCUSSION ......................................................................... 55
4.1 Effect of mechanical depulping on the chemical composition of fermented
Ghanaian cocoa beans ....................................................................................................................... 55
4.1.1 Proximate composition ......................................................................... 55
4.1.1.1 Moisture .......................................................................................... 55
4.1.1.2 Ash .................................................................................................. 56
4.1.1.3 Protein .............................................................................................. 57
4.1.1.4 Fat .................................................................................................... 59
4.1.1.5 Carbohydrate .................................................................................. 60
4.1.2 Mineral content of depulped and fermented cocoa beans ..................... 61
4.1.2.1 Potassium (K) ................................................................................. 61
4.1.2.2 Magnesium (Mg) ............................................................................ 62
4.1.2.3 Calcium (Ca) .................................................................................. 63
University of Ghana http://ugspace.ug.edu.gh

x
4.1.2.4 Phosphorus (P)................................................................................ 64
4.1.2.5 Copper (Cu) ..................................................................................... 65
4.1.2.6 Zinc (Zn) ......................................................................................... 66
4.1.2.7 Iron (Fe) ........................................................................................... 68
4.2.1 Pulp volume .......................................................................................... 70
4.2.2 pH .......................................................................................................... 71
4.2.3 Titratable acidity ................................................................................... 73
4.2.5 Changes in non-reducing sugars ........................................................... 78
4.2.6 Reducing sugars ................................................................................... 80
4.2.7 Free fatty acid........................................................................................ 82
4.3 Effect of Mechanical Depulping on the Polyphenolic Compounds
Concentration, Degree of Fermentation and Appearance Properties of Cocoa
Bean.………………………………………………………………………………………………………………..85
4.3.1 Total polyphenols .................................................................................. 85
4.3.2 O-diphenols ........................................................................................... 87
4.3.3 Fermentation index ............................................................................... 89
4.3.4 Colour.................................................................................................... 92
4.4 Influence of Mechanical Depulping on the Acidification, Browning index,
Anthocyanins, Colour and FFA during Drying of Fermented Ghanaian Cocoa
Beans……………………………………………………………………………………………………………….95
4.4.0 Introduction ........................................................................................... 95
4.4.1 Acidification.......................................................................................... 95
4.4.1.1 pH ................................................................................................... 95
4.4.1.2 Titratable acidity ............................................................................. 97
4.4.2 Anthocyanins ........................................................................................ 99
4.4.3 Free fatty acid...................................................................................... 101
University of Ghana http://ugspace.ug.edu.gh

xi
4.4.4 Browning index ................................................................................... 103
4.4.5 Colour.................................................................................................. 105
4.4.6 Cut Test ............................................................................................... 108
CHAPTER FIVE ..................................................................................................... 111
5.0 CONCLUSIONS AND RECOMMENDATIONS ........................................... 111
5.1 CONCLUSIONS ......................................................................................................................... 111
5.2 RECOMMENDATIONS .......................................................................................................... 113
CHAPTER SIX ........................................................................................................ 114
6.0 REFERENCES ................................................................................................. 114
University of Ghana http://ugspace.ug.edu.gh

xii
LIST OF TABLES
Table: 1. Global production of cocoa beans(tonnes) from 2009 to 2012 ...................... 9
Table: 2. Grindings of cocoa beans in thousand tonnes from 2009 to 2012 ................ 15
Table:3. Typical composition of the unfermented Forastero cocoa beans .................. 19
Table: 4. Proximate composition of whole and mechanically depulped beans ........... 58
Table: 5. ANOVA summary table showing F-ratios for variations in proximate
composition of depulped and fermented cocoa beans………………………………..60
Table: 6. Mineral content of depulped fermented cocoa beans (mg/100g) ................. 67
Table: 7. ANOVA summary table showing F-ratios for variations in mineral
composition of depulped and fermented cocoa beans ................................................. 69
Table: 8. Regression coefficients and their R2 values in the models for pH, Titratable
acidity, pulp volume, free fatty acids, total, non-reducing and reducing sugars of
cocoa beans .................................................................................................................. 75
Table: 9. Regression coefficients and their R2 values in the models for total
polyphenols, o-diphenols and fermentation index of cocoa beans .............................. 89
Table: 10. Effect of depulping and fermentation time on the colour fractions
absorbance and fermentation index…………………………………………………..91
Table: 11. Colour of cocoa beans with respect to depulping and fermentation time ... 93
Table: 12. ANOVA summary table showing F-ratios for variations in colour of
depulped and fermented cocoa beans .......................................................................... 94
Table: 13. Effect of depulping and drying time on the colour fractions absorbance and
browning index .......................................................................................................... 104
University of Ghana http://ugspace.ug.edu.gh

xiii
Table: 14. Regression coefficients and their R2 values in the models for pH, titratable
acidity, free fatty acids, anthocyanins and browning index of dried cocoa beans ..... 105
Table: 15. Colour of cocoa beans with respect to depulping and drying time ........... 106
Table: 16. ANOVA summary table showing F-ratios for variations in colour of
depulped and dried cocoa beans ................................................................................ 107
Table: 17. Effect of depulping and fermentation time on the dried cocoa beans cut
surface colour and cut test score ................................................................................ 109
University of Ghana http://ugspace.ug.edu.gh

xiv
LIST OF FIGURES
Figure 1: Value Chain of Ghana cocoa………………………………………………12
Figure 2. Anatomy of the cocoa seed........................................................................... 17
Figure 3: Mechanical depulper .................................................................................... 42
Figure 4: (A) Pulp extract (B) Depulped beans……………………………………....42
Figure 5: (A) Uncovered and (B) Covered heap mixture of depulped and undepulped
cocoa beans and ........................................................................................................... 43
Figure 6: Percentage (%) pulp reduction of cocoa beans…………………………….71
Figure 7: Response surface plot showing the effects of depulping and fermentation
time on the pH of cocoa beans……………………………………………………….73
Figure 8: Response surface plot showing the effects of depulping and fermentation
time on the titratable acidity (mg/g) of cocoa beans ………………………………..74
Figure 9: Response surface plot showing the effects of depulping and fermentation
time on the total sugar (mg/g) content of cocoa beans……………………………...77
Figure 10: Response surface plot showing the effects of depulping and fermentation
time on non-reducing sugars (mg/g) of cocoa beans………………………………..79
Figure 11: Response surface plot showing the effects of depulping and fermentation
time on the reducing sugars (mg/g) of cocoa beans………………………………….81
Figure 12: Response surface plot showing the effects of depulping and fermentation
time on the free fatty acid (%) content of cocoa beans………………………………83
University of Ghana http://ugspace.ug.edu.gh

xv
Figure 13: Response surface plot showing the effects of depulping and fermentation
time on total polyphenolic (mg/g) contents of cocoa beans…………………………86
Figure 14: Response surface plot showing the effects of depulping and fermentation
time on the o-diphenol (mg/g) content of cocoa beans……………………………..88
Figure 15: Response surface plot showing the effect of depulping and fermentation
time on the fermentation index of cocoa beans……………………………………...90
Figure 16: Response surface plot showing the effect of depulping and drying time on
the pH of
cocoabeans…………..…………………………………………………………………
…...96
Figure 17: Response surface plot showing the effect of depulping and drying time on
the titratable acidity (mg/g) of cocoa beans. ................................................................ 98
Figure 18: Response surface plot showing the effect of depulping and drying time on
the anthocyanin content of cocoa beans ..................................................................... 100
Figure 19: Response surface plot showing the effects of depulping and drying time on
the free fatty acid (%) content of cocoa beans ........................................................... 101
Figure 20:Response surface plot showing the effect of depulping and drying time on
browning index of cocoa beans…………………………..…………………………103
University of Ghana http://ugspace.ug.edu.gh

xvi
LIST OF APPENDICES
Appendix 1: Analysis of variance of proximate composition of depulped and
fermented cocoa beans ............................................................................................... 124
Appendix 2: Analysis of variance of mineral composition of depulped and fermented
cocoa beans. ............................................................................................................... 125
Appendix 3: The Physicochemical and Biochemical Composition of Depulped and
Fermented Ghanaian Cocoa Beans ............................................................................ 126
Appendix 4: Effect of Mechanical Depulping on the Polyphenolic Compounds
Concentration, Degree of Fermentation and Appearance Properties of Cocoa Beans
.................................................................................................................................... 128
Appendix 5: Influence of Mechanical Depulping on the Acidification, Browning
index, Anthocyanins, Colour and FFA during Drying of Fermented Ghanaian Cocoa
Beans .......................................................................................................................... 129
University of Ghana http://ugspace.ug.edu.gh

1
CHAPTER ONE
1.0 INTRODUCTION
1.1 Background information
Cocoa beans (Theobroma cacao), which are the primary raw material for the
manufacture of chocolate and other confectionary products depend predominantly on
fermentation as a critical step as well as other important processes such as drying and
roasting to develop its unique flavour (Beckett, 2009; Afoakwa, 2010). Cocoa is noted for its
flavour properties due to aroma precursors inherent in the beans, which are formed during
fermentation and drying and are transformed during roasting into various flavour
characteristics. Cocoa is processed into other semi-finished products such as cocoa butter,
cocoa liquor, cocoa cake and cocoa powder for further processing into a wide variety of
products such as chocolate, sweetened cocoa powder, cakes, alcoholic beverages, wines,
soaps and cosmetics (Amoa-Awua et al., 2006; Afoakwa and Paterson, 2010).
Cocoa is the main cash crop in Ghana and also the major economic crop in most West
African countries. Currently, Africa is the world‟s largest producer of cocoa with an
estimated 71% of the world‟s production, and accounted for 2.826 of 4.0 million tonnes of
cocoa in 2011/2012 projections (ICCO, 2012a). Ghana however, continues to maintain its
position as the second largest exporter of cocoa after Ivory Coast with a record high of
1,004,190 tonnes in 2010/2011 (Ashitey, 2012).Chocolate manufacturers recognize the
Ghanaian cocoa beanas the standard for bulk cocoa with respect to chocolate flavour and due
to this, it commands a premium price on the international market (Fowler, 2009; Afoakwa
and Paterson, 2010).
In Ghana,cocoa is usually cultivated by smallholder farmers and some individuals on
small to large scale;mainly in the Eastern, Western, Ashanti, Brong Ahafo, Central and Volta
University of Ghana http://ugspace.ug.edu.gh

2
regions (Baker et al., 1994). There are two main harvesting seasons in Ghana, the main crop
is harvested in October to December and the mid crop is harvested in March (Afoakwa,
2010). The predominant cultivars of cocoa grown in Ghana include Amelonado,Upper
Amazon (Amazonica) selections and Hybrid (Amelonado and Amazoinca) cocoa (Amoa-
Awua et al., 2006; Afoakwa, 2010).
Fermentation is a major postharvest treatment, which involves a series of chemical,
biochemical, physicochemical and polyphenolic changes due to the breakdown of sugars,
proteins and polyphenols. These changes are due to various activities of microorganisms such
as yeasts, lactic acid bacteria and acetic acid bacteria and also a myriad of enzymatic
reactions by proteases, invertase and polyphenol oxidases (Thompson et al., 2001; Schwan
and Wheals, 2004;Nielsenet al., 2007).The pulp of the cocoa bean acts as a substrate for
microorganismsduring fermentation due to its high sugar content. In a sequential order of
yeasts and bacteria they consume the pulp and produce acids and heat in the process, and
consequently leading to the eventual death of the bean (Nielsen et al., 2007; Beckett, 2009;
Afoakwa, 2010). The changes that occur during fermentation as observed by Afoakwa et al.
(2012a) has consequential effect on the nib acidification, reduction in bitterness and
astringency, colour development and flavour precursor formation as compared to
unfermented cocoa beans.
Drying of cocoa beans is imperative to prevent postharvest losses such as the growth
of mould and infestation from insects (Thompson et al., 2001; Afoakwa, 2010). In Ghana the
common method used is the drying of cocoa beans on raised platforms covered with mats
made of bamboo (Tomlins et al., 1993). Moisture content of the beans rise to about 40 - 50%
during fermentation (Thompson et al., 2001), and therefore needs to be reduced to about 7 -
8% during drying as the higher moisture content presents great economic and safety issues to
the beans (Beckett, 2009; Afoakwa and Paterson, 2010). The beans are usually fully dried
University of Ghana http://ugspace.ug.edu.gh

3
within a week with regular sunshine, but this can be protracted to about two or more weeks
with cloudy and rainy weather. Drying also plays an all-important role in flavour formation.
Afoakwa (2010) stated that during drying majorpolyphenol oxidizing reactions are catalyzed
by polyphenol oxidases giving rise to newflavour components. Sun drying allows for slow
migration of moisture throughout the bean, which transports flavour precursors that has been
formed during fermentation (Thompson et al., 2001).
Prior to the fermentation process, harvested cocoa pods areusually stored for a few
days before they are opened, and this is referred to as pod storage. This practice is performed
by farmers unknowingly of its importance. The technique of pod storage has been identified
as a means of pulp pre-conditioning of cocoa beans prior to fermentation and has been
reported to have beneficial effect on the cocoa bean colour and flavour (Nazaruddinet al.,
2006; Afoakwa et al., 2011a; Afoakwa et al., 2012a). Pulp pre-conditioning can also be done
by either depulping (mechanical or enzymatic) or bean spreading (Rohan, 1963; Schwan and
Wheals, 2004; Afoakwa et al., 2011a) and these techniques might have important bearing on
the chemical, biochemical and polyphenolic constituents of fermented Ghanaian cocoa beans.
However, the use of mechanical depulping as means of pulp preconditioning of Ghanaian
cocoa beans is yet to be fully exploited
1.2 Rationale
Cocoa fermentation and drying are critical to the development of quality beans and
these are influenced by factors such as pulp pre-conditioning, fermentation method and
drying conditions.Several works have been done on pod storage as a means of pulp pre-
conditioning cocoa beans. Findings from these works have established that pod storage as a
means of pulp pre-conditioning prior to fermentation lead to reduction in pulp volume, bean
acidity and fermentation time; resulting in enhanced cocoa bean flavours(Nazaruddinet al.,
2006; Afoakwa et al., 2011ab; Afoakwa et al., 2012ab).
University of Ghana http://ugspace.ug.edu.gh

4
Excessive pulp covering the beans leads to high acid production that is sometimes
detrimental to the quality of the cocoa beans (Afoakwa and Paterson, 2010). Mechanical
depulping is one of three ways of pulp pre-conditioning cocoa beans prior to fermentation
and is employed to separate a portion of the pulp content of the fresh beans to reduce the
amount of pulp available as fermentation substrate.The process causes bruising of the beans
and its inherent cell structures leading to activation of enzymes, which might influence
various biochemical processes during fermentation.However, the extent to which this
technique of pulp pre-conditioning would influence the chemical, biochemical,
physicochemical and polyphenolic constituents of the cocoa bean during fermentationis yet to
be fully exploited and comprehended. To date,no workhas been done to investigate the use of
mechanical depulping as a form of pulp pre-conditioning and the extent to which this
techniquewould influence the quality of Ghanaian cocoas.
1.2 Main objective
To investigate the effect of mechanical depulping on the biochemical,
physicochemical and polyphenolic constituents of Ghanaian cocoa beans during fermentation
and drying.
1.3 Specific objectives
The specific objectives of the study were:
i. To evaluate the effect of mechanical depulping on the chemical composition of
fermented Ghanaian cocoa beans.
ii. To investigatethe influence of mechanical depulping on the biochemical and
physicochemical composition during the fermentation process of Ghanaian cocoa
beans.
University of Ghana http://ugspace.ug.edu.gh
5
iii. To determine the effect of mechanical depulping on the polyphenolic compounds
concentration, fermentation index and appearance properties of Ghanaian cocoa
beansduring fermentation.
iv. To determine the influence of mechanical depulping on the acidification, browning
index, anthocyanins, colour and free fatty acids (FFA)levels during drying of
fermented Ghanaian cocoa beans.
University of Ghana http://ugspace.ug.edu.gh

6
CHAPTER TWO
2.0 LITERATURE REVIEW
2.1 Origin and classification of cocoa
Cocoa (Theobroma cacao) is known to have originated from Southern and Central
America and is native to the Amazon and Orinoco valleys of South America (Thompson et
al.,2001, Beckett, 2009; Afoakwa, 2010). History has it that about 600 AD ago the Maya and
Aztecs were the first to grow and consume cacao, what is now widely known as cocoa
(Beckett, 2009). The word Theobroma means food of the gods thus theosmeaning „god‟ and
broma meaning „food‟ (Afoakwa, 2010;Nair, 2010). The Spanish introduced cocoa to Europe
and also to Fernando Po now called Bioko, an island in Equatorial Guinea in 1840 and by
1897 Tetteh Quarshie a Ghanaian, brought cocoa from Bioko and successfully cultivated it in
Ghana. Cocoa grown in other West African countries such as Nigeria, Togo, Ivory Coast and
others originated from Ghana (Nair, 2010).
There are about twenty-two (22) species of the genus Theobroma (Nair, 2010), out of
which only one, Theobroma cacao, a member of the family Sterculiaceae is of economic
importance (Thompson et al.,2001, Afoakwa, 2010;Nair, 2010). Other species according to
Nair (2010), including Theobroma bicolor, Theobroma angustifolium and Theobroma
grandiflorum are usually cultivated and consumed because of their sweet edible pulp and
used as drinks in some parts of Brazil.Currently, there are four (4) types of commercial cocoa
(Theobroma cacao) belonging to the family Sterculiaceae that are cultivated and these
include;Forastero, Criollo, Nacional and Trinitario (Fowler, 2009; Afoakwa, 2010;Nair,
2010). The cocoa of commerce are grouped under two (2) broad umbrellas; the “bulk”and
“fine” cocoa, which according to Lopez and Dimick (1995), the Forastero-Amelonado variety
make up the “bulk” cocoa because of their strong cocoa flavour and “fine” cocoa constitutes
Criollos, Nacional and Trinitarios which have mild and floral flavours.
University of Ghana http://ugspace.ug.edu.gh

7
The Criollovariety has a mild nutty cocoa flavour but is highly susceptible to diseases
while Trinitario, a hybrid of ForasteroandCriollo is more disease resistant (Beckett, 2009).
The Forastero cocoa and its varieties are ubiquitous and widely grown,accounting for
approximately 95% of the world cocoa production (Thompson et al.,2001;Afoakwa, 2010).
The Forastero variety is also referred to as Amelonado because of the melon shape of its
seeds. The cultivation of the Nacionalcocoa variety is restricted to Ecuador. It is noted for its
fine “Arriba” flavour (Beckett, 2009;Afoakwa and Paterson, 2010).
2.2 Cocoa cultivation
Prior to planting, certain environmental and edaphic conditions must be at their
optimum for a successful growth of the cocoa plant. Temperature, rainfall and humidity are
the three most important environmental factors that affect growth. According to Afoakwa
(2010) and Fowler (2009), cultivation of cocoa requires temperatures ranging between 18–
32˚C andrainfall within 1500 and 2500 mm well distributed throughout the year. During dry
seasons or rainfall below 100 mm other sources for replenishing water lost via transpiration
of the plant such as irrigation must be seriously considered to prevent the cocoa plant from
wilting and from rapid senescence. During the early stages of the growth of cocoa plants they
are mostly intercropped with other food crops such as plantain and oil palm to act as
windshields and also for shade provision. The cocoa trees are grown to cover a total density
of 600–1200 trees/acre (1500–3000 trees/ha), this ensures that humidity is typically
maintained between the ranges of 70–80% duringthe day and 90–100% at night (Fowler
(2009; Afoakwa, 2010).
Cocoa can grow in a vast array of soils, however edaphic factors such as pH must be
neutral to partially acidic with a range of 5–7.5, and the soil must also possess a good
drainage and well aerated system(Fowler, 2009; Afoakwa, 2010). The rooting of cocoa is that
of the tap root system with few lateral roots hence the soil must be approximately 1.5 m deep
University of Ghana http://ugspace.ug.edu.gh

8
or more to facilitate the uptake of water and nutrients (Fowler, 2009; Nair, 2010). Cocoa
husbandry, pest and disease control should be done meticulously to achieve substantial yield
(Fowler, 2009; Afoakwa, 2010). Some pests and diseases include black pod, witches‟ broom,
frosty pod rot, swollen shoot, capsids and mirids, and the cocoa pod borer.Squirrels, rats and
monkeys also consume and destroy a chuck of ripe pods (Fowler, 2009; Nair, 2010).
The cocoa tree comes into fruition after two to three years of maturity and reach their
full yield potential when it‟s six to seven years old (Fowler, 2009). With a growing height of
approximately 10 m at maturity, harvesting is usually difficult especially with fruits growing
at its apex. Afoakwa (2010) stated that“modern breeding methodshave led to the
development of trees to a standard of approximately 3 m tall to allow for easy harvesting”.
The cocoa plant is said to have an economic viable life span of about 25 – 30 years (Fowler,
2009).After a successful pollination and fertilization, the pods reaching maximum and fully
matureabout 140 days. The fruits are then allowed to ripen for about 10 days and the pods are
harvested (Afoakwa, 2010; Fowler, 2009).The matured cocoa fruits measure between 100
and 350 mm long and have awet weight of approximately 200 g to 1 kg (Fowler, 2009).
Colour change is a major factor in determining the ripeness of cocoa pods. However, due to
genotypic differences there areconsiderable variations in the shape, surface texture and
colour. Cocoa colour generally varies from green or purple to various shades of red, orange
or yellow pods (Afoakwa, 2010).
2.3 Cocoa production, supply and consumption
2.3.1 Global production of cocoa
Global production of cocoa beans was reported to be 3.6 million tonnes in the
2009/2010 fiscal years, a marginal increase compared with the previous seasons (ICCO,
2012). Production also increased to about 4.3 million tonnes in 2010/2011 and a marginal
decline in 2011/2012 with 3.9 million tonnes (Table 1). According to statistics from ICCO
University of Ghana http://ugspace.ug.edu.gh

9
(2012), cocoa beans from smallholder farms account for approximately 90–95% globally. In
Ghana, mainly smallholder farmers undertake production of cocoa with only about 5% from
large plantations such as those owned by the Government subsidiary, Ghana Cocoa Board
(COCOBOD) via its institutions and some private investors. It is estimated that Ghana has a
market share of about 28 - 31% second to the Ivory Coast which, has a market share of over
46.8% and thus Africa produces about 70 - 75% of the worlds cocoa (ICCO, 2012).
FromTable 1 below, productionof cocoa declined by 400,000 tonnes from 2010/2011
to 2.826 million tonnes in 2011/2012 in Africa, but increased by 15,000 tonnes in the
Americas amounting to 574,000 tonnes while in Asia and Oceania, there was a drastic
increase by66,000 tonnes to 590,000 tonnes.Nonetheless, Africa still remainsthe largest
cocoa-producing region, accounting for 70.8% of world cocoa output in 2011 - 2012,
followed by Asia and Oceania at 14.8% and the Americas at 14.4%.
While several factors affect cocoa production worldwide, drastic changes in the
production of cocoa are largely affected by changes in weather conditionssuch as duration
and intensity ofsunshine and rainfall as well as soil moisture and temperature (ICCO, 1997).
One of such weather changes is known as the Southern Oscillation often referred to as ENSO
(El Niño/La Niña-Southern Oscillation). It originates from the tropical Pacific and occurs on
average every four years. El Niño and La Niña events are the extremes in a vast repeating
cycle of large-scale fluctuationsin air pressure with El Niño being the warm extreme and La
Niña the cold extreme (IRI, 2009).
Table 1: Global productionof cocoa beans in thousand tonnes from 2009 to 2012
Production 2009/2010 Estimates Forecasts
University of Ghana http://ugspace.ug.edu.gh

10
Regions 2010/2011 2011/2012
Africa 2486 68.4% 3226 74.9% 2826 70.8%
Cameroon 209 229 210
Côte d'Ivoire 1242 1511 1410
Ghana 632 1025 890
Nigeria 235 240 220
Others 168 221 96
America 516 14.2% 559 13.0% 574 14.4%
Brazil 161 200 190
Ecuador 150 161 175
Others 205 199 209
Asia &
Oceania
633 17.4% 524 12.2% 590 14.8%
Indonesia 550 440 500
Papua New
Guinea
39 47 48
Others 44 37 42
World total 3635 100.0% 4309 100.0% 3990 100.0%
Source: ICCO (2012). Note: Totals may differ from sum of constituents due to rounding.
ICCO(1997) stated that the El Niño weather events reduced cocoa production, on
average, by 2.4% at world level however due to this reduction, world cocoa prices increased
by 1.66% on average. Theimpact of the El Niño event is not homogenous across cocoa
producing countries. Cocoa production in Ghana, Nigeria and Cameroon are not
systematically affected byEl Niño events (IRI, 2009).
2.3.2 Cocoa production in Ghana
Cocoa is produced in Ghana mainly in the forest areas, thus, Western, Ashanti,
Brong-Ahafo, Central, Eastern, and Volta regions, where the rainfall is usually between 1,000
and 1,500 mm per year (Ashitey, 2012).In a bid to establish sustainable ways to increase
yield and improvequality of cocoa beans, the government of Ghana via concerted effortshas
empowered its institutions such as COCOBODand its subsidiaries including Cocoa Research
Institute of Ghana (CRIG) and major stakeholders including farmers and some private bodies
University of Ghana http://ugspace.ug.edu.gh
11
to provide extension services to the farmers (Ashitey, 2012).The purpose of these extension
services is to improve agronomic practices, provide fertilizer and chemicals for pest and
disease control.The Government is also committed to higher remuneration for farmers as an
incentive for high productionand also providing funds for the rehabilitation and replanting of
old farms. As well, institutions such as CRIG and other research stations have the mandate to
develop hybrid cocoa seedlings with higher yields.
2.3.4 Cocoa supply chain in Ghana
Despite several interventions by the government of Ghana, cocoa farmers in Ghana
continue to rely on the traditional methods such as the use of hoes and cutlasses for farming.
Mohammed et al. (2012) reported that competition among farmers is non-existent
becausegovernment of Ghana is the sole exporter of cocoa. Ghana cocoa value chain consists
of three (3) main players; farmers, license buying companies (LBCs) and COCOBOD. Like
most cocoa producing nations in Africa and Asia, cocoa is a major contributor to Ghana‟s
gross domestic product (GDP) and foreign exchange earner for the country.
Cocoa production in Ghana and most West African countries is mainly on
smallholder or family farms usinglabour-intensive methods.The vast majority of labour
employed oncocoa farms in Ghana is adult and it can be either fulltime or casual basis
(Beckett, 2009). During busy harvest periods children are made to help with farm work such
as plucking of cocoa pods and carrying baskets of cocoa pods to breaking sites. In as much as
cocoa growing provides significant benefits to the Ghanaian rural economies and the national
economy at large, much can be done to improve the conditions and livelihood of cocoa
farmers since majority of these farmers continue to use primitive farming methods
(Mohammed et al., 2012).
University of Ghana http://ugspace.ug.edu.gh

12
Figure 1: Value Chain of Ghana cocoa
Source: Mohammed et al. (2012)
From the detailed map of Ghana‟s cocoa value chain (Figure 1), the smallholder
farmers after fermentation and drying of their cocoa beans sell their dried cocoa beans to the
cocoamarketing company (CMC) via the license buying companies (LBCs). However there
University of Ghana http://ugspace.ug.edu.gh

13
are some individuals (middle men) who are not aligned to any institution who buy from the
farmers when they need money and they intend sell to the LBCs.Quality control checks are
conducted on all cocoa by the Quality Control Division of COCOBOD.
2.2.4 Cocoa Commerce: demand, consumption and market for cocoa
Grindings of cocoa beans serves as a proxy for the estimation of the demand for the
commodity across the world. Cocoa processing, or grinding, entails the transformation of
dried cocoa beans into a variety of processed products including cocoa paste or liquor, cake,
powder and butter (Afoakwa, 2010).The foregoing discussion gives a view that two-thirds of
the world total grindings and consumption of cocoa beans occurs outside the production
zones, demand is highest in Europe with 39.1% and the Americas with 21.8%
(www.worldcocoafoundation.com). Nonetheless due to the increase in demand and
consumption, grindings has also increased in some producing countries such as Ghana and
Ivory Coast of which has necessitated the expansion of Cargill Cocoa and Chocolate
processing factory in the later (www.cargill.com).
Due to a growing number of Fairtrade and organic crop organizations around the
world especially in Europe and America, there has been a marked increase in the demand and
consumption of specialty cocoa products. Current market trend shows that Fairtrade cocoa
commands a very small share of the cocoa market (0.5%). The typical significance of
Fairtrade cocoa is that the farmers via their respective organizations receive a higher price for
their cocoa beans.It is calculated on the basis of world market prices, plus
Fairtradepremiums. The Fairtrade premium for standard quality cocoa is US$ 150 per tonne.
The minimum price for Fairtradestandard quality cocoa, including the premium, is US$ 1,750
per tonne. However, based on the steady growth of Fairtrade and support from activists and
the general public, some Fairtradeparticipants claim that the idea were eventually grown from
a niche market and become more mainstream (ICCO, 2013).
University of Ghana http://ugspace.ug.edu.gh

14
The organic cocoa market represents a very small share of the total cocoa market,
estimated at less than 0.5% of totalproduction. ICCO (2012) projectionsfor production of
certified organic cocoa at 15,500 tonnes, mainly from the following countries:Madagascar,
Tanzania, Uganda, Belize, Bolivia, Brazil, Costa Rica, Dominican Republic, El Salvador,
Mexico, Nicaragua,Panama, Peru, Venezuela, Fiji, India, Sri Lanka and Vanuatu.
However, similar to Fairtrade cocoa, the demand for organic cocoa products is
growing at a very strong pace, as consumers are increasingly concernedabout the safety of
their food supply along with other environmental issues chiefly global warming. Certified
organic cocoa producers must comply with all requirements associated with the legislation of
importing countries onproduction of organic products. The benefit for cocoa farmers is that
organic cocoa commands a higher price thanconventional cocoa, usually ranging from US$
100 to US$ 300 per tonne. It is inspiring to note that originating countries with smaller
volumescan fetch much higher premiums. This premium should cover both the cost of
fulfilling organic cocoa production requirementsand certification fees paid to certification
bodies (ICCO, 2012).
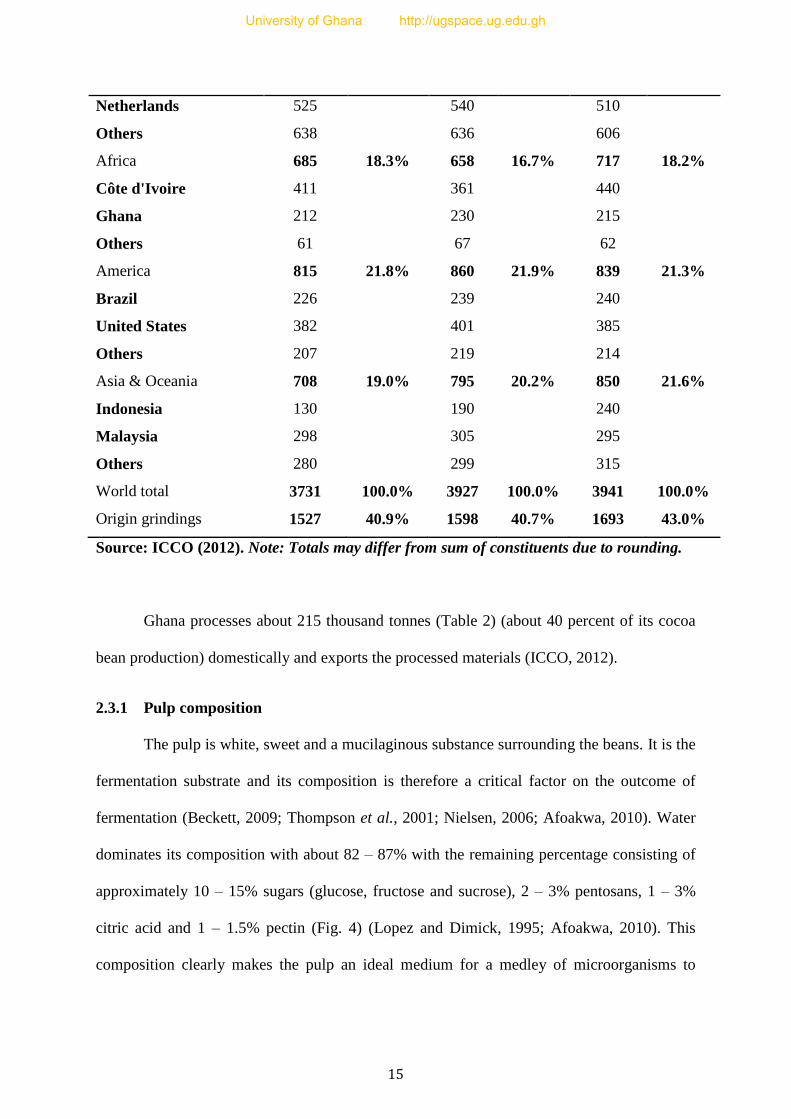
Table 2: Grindingsof cocoa beans in thousand tonnes from 2009 to 2012
Grinding Regions 2009/ 2010 Estimates
2010/2011
Forecasts 2011/2012
Europe 1524 40.8% 1615 41.1% 1536 39.0%
Germany 361 439 420
University of Ghana http://ugspace.ug.edu.gh
15
Netherlands 525 540 510
Others 638 636 606
Africa 685 18.3% 658 16.7% 717 18.2%
Côte d'Ivoire 411 361 440
Ghana 212 230 215
Others 61 67 62
America 815 21.8% 860 21.9% 839 21.3%
Brazil 226 239 240
United States 382 401 385
Others 207 219 214
Asia & Oceania 708 19.0% 795 20.2% 850 21.6%
Indonesia 130 190 240
Malaysia 298 305 295
Others 280 299 315
World total 3731 100.0% 3927 100.0% 3941 100.0%
Origin grindings 1527 40.9% 1598 40.7% 1693 43.0%
Source: ICCO (2012). Note: Totals may differ from sum of constituents due to rounding.
Ghana processes about 215 thousand tonnes (Table 2) (about 40 percent of its cocoa
bean production) domestically and exports the processed materials (ICCO, 2012).
2.3.1 Pulp composition
The pulp is white, sweet and a mucilaginous substance surrounding the beans. It is the
fermentation substrate and its composition is therefore a critical factor on the outcome of
fermentation (Beckett, 2009; Thompson et al., 2001; Nielsen, 2006; Afoakwa, 2010). Water
dominates its composition with about 82 – 87% with the remaining percentage consisting of
approximately 10 – 15% sugars (glucose, fructose and sucrose), 2 – 3% pentosans, 1 – 3%
citric acid and 1 – 1.5% pectin (Fig. 4) (Lopez and Dimick, 1995; Afoakwa, 2010). This
composition clearly makes the pulp an ideal medium for a medley of microorganisms to
University of Ghana http://ugspace.ug.edu.gh

16
proliferate. Proteins, amino acids, vitamins (predominantly vitamin C) and minerals are in the
minority.
Earlier research conducted on Ghanaian Forastero cocoa by Nielsen (2006) noted that
the main sugars of the fresh pulp were glucose (5.4 – 6.6%) and fructose (6.3 – 7.4%) with
only small amounts of sucrose (less than 0.3%) present.The glucose and fructose
(monosaccharide‟s) to sucrose ratio is a function of the maturity of the cocoa fruit thus
changes with the degree of maturity withunripe pods containing a higher proportion of
sucrose and ripe pods containing mainlyfructose and glucose. This clearly suggests that pulp
preconditioning (pod storage) plays a central role in the permutation of pulp composition
(Afoakwa et al., 2012). The pulp is not only viscous due to its sugar content but also a
relatively high content of pectin and other polysaccharides 1 – 2% (Nielsen, 2006 and
Afoakwa, 2010).
With a relatively low pH of the fresh pulp of about 3.94 – 4.12, which might be due to
the citric acid content, approximately 0.6 – 0.7% and absent or only low amounts (less
than0.2 %) of acetic acid, lactic acid and ethanol were detected in the fresh pulp (Nielsen,
2006).
2.3.2 Bean composition
The size of cocoa beans is of practical significance as flat beans are not viable. The
minimum average bean size is 1 g (Nair, 2010). A transverse section via a cocoa
beanrevealstwo cotyledons (nibs) and a small germ or embryo,all enclosed in a leathery seed
coat or testa (shell) (Figure 2), which is impermeable to large molecules however, small
molecules such ethanol and acetic acid are capable of diffusing into the bean.The cotyledons
have two main functions, as thestorage organs containing nutrients for the development of the
seedling and as the premier leaves of the plant when the seed germinates (Nielsen, 2006; Nair
2010; Afoakwa, 2010).
University of Ghana http://ugspace.ug.edu.gh

17
Figure: 2.Anatomy of the cocoa seed
Source:Lopez and Dimick(1995)
Fresh Forastero beans are violet in cross-section but upon proper fermentation attain
the deep brown colour, which give chocolate its colour and produces a strong cocoa flavour
uponproper processing (Lopez and Dimick1995; Nielsen, 2006; Afoakwa,
2010).Thecotyledons are basically made up of different types of storage cells, polyphenolic
cells contain a single large vacuole filled with polyphenols and alkaloids and on the other
hand, cells tightly packed with multiple small protein and lipidvacuoles and other
components such as starch granules (Figure 2). All these components serve as a harbinger for
cocoa flavour and aroma characters (Nazaruddin et al., 2001; Afoakwa, 2010).
University of Ghana http://ugspace.ug.edu.gh

18
2.3.3 Chemical composition of unfermented cocoa beans
2.3.3.1 Fat
Cocoa butter or fat constitutes about half the weight of the cocoa bean and its quantity
and quality are critical to chocolate manufacture. Ranging from 45 – 55% the majority of the
lipid profile exists as triacylglycerides (95%) with a minute amount of approximately 5%
existing as mono- and di-glycerides, glycolipids, sterols and phospholipids (Belitz et al.,
2009). From previous researches it has been established that the general fat content ranges
from 50.40 – 53.35%and 52.27 – 55.21% respectively for the pulp preconditionedfermented
and unfermented beans (Afoakwa et al., 2011a).
2.3.3.2 Proteins
Researchers over the decades have ascribed cocoa flavour during roasting to proteins
as a flavour precursor. Proteins are very important for quality chocolate products and also for
flavour development, with about 1.5 – 2% of the dried beans (Belitz et al., 2009; Afoakwa,
2010). The storage proteins found in the cotyledon of the cocoa bean are globulins and
albumins.
During fermentation, the degradation of proteins occurs partly by proteolysis to
peptides andamino acids and partly by conversion to insoluble forms by the actions of
polyphenols. The globulins are degraded in the fermentation process whiles the albumin is
unaffected (Spencer and Hodge, 1992; Voigt et al., 1993). Free amino acids in fermented
beans originate from those present natively in the unfermented bean and from proteolysis of
proteins during fermentation (Kirchhoffet al. 1989).
Table 3: Typical composition of the unfermented Forastero cocoa beans
Constituents Dried beans (%) Fat-free material
Cotyledons 89.60 -
University of Ghana http://ugspace.ug.edu.gh

19
Shell 9.63 -
Germ 0.77 -
Fat 53.05 -
Water 3.65 -
Ash (Total) 2.63 6.07
Nitrogen
Total nitrogen 2.28 5.27
Protein nitrogen 1.50 3.46
Theobromine 1.71 3.95
Caffeine 0.085 0.196
Carbohydrate
Glucose 0.30 0.69
Sucrose 1.58 3.86
Starch 6.10 14.09
Pectins 2.25 5.20
Fibre 2.09 4.83
Pentosans 1.27 2.93
Mucilage and gums 0.38 0.88
Polyphenols 7.54 17.43
Acids
Acetic (free) 0.014 0.032
Oxalic 0.29 0.67
Sourcedfrom: Rohan (1963); Reineccius et al. (1972) and Afoakwa 2010
2.3.3.3 Sugars
Earlier research by Reineccius et al. (1972) revealed that fresh unfermented cocoa
beans contained15.8 mg/g sucrose and trace amounts of fructose, sorbose, mannitol and
inositol. During fermentation, most or all sucrose are hydrolysed by invertase, which is native
to the cocoa bean to glucose and fructose. Afoakwa et al. 2011b noted that during
fermentation, both the non-reducing andtotal sugars decreased significantly to 2.03 and
5.02mg/g (89 and 75%) reduction respectively. The decreases are an indication of the
productionof reducing sugars however, therate of decrease in both the total and non-
reducingsugars slowed down towards the end of day six (6) of fermentation.The reducing
University of Ghana http://ugspace.ug.edu.gh

20
sugars, fructose and glucose form about 0.9 and 0.7 mg/g, respectively and others (including
mannitol and inositol) at less than 0.50 mg/g.Differences have been attributed to method and
time of harvesting, type and origin of cocoabeans (Afoakwa and Paterson, 2010).
2.3.3.4 Polyphenols
Depending on its anthocyanincontent, the colour of the cocoa bean ranges from white
to deep purple prior to fermentation (Belitz et al., 2009; Afoakwa, 2010). Osman et al.(2004)
ascribed that catechins (flavan-3-ols) and procyanidins are the predominant polyphenols
stored inpigment cells within the cotyledon of the cocoa bean they have antioxidant
properties that help protect the seed from damage and disease. Polyphenols account averagely
for 14–20% of bean weight and play a pivotal role in flavour development as higher amounts
may lead to astringent and bitter cocoa products (Belitzet al., 2009; Afoakwa, 2010; Afoakwa
and Paterson, 2010).
During fermentation, proteolysis occurs partly by conversion to insoluble forms by
the actions of polyphenols. The enzyme polyphenol oxidase (PPO) promotes oxidative
browning to give the characteristic chocolate brown colour, there is also the further reactions
with sugar and amino acids that imparts flavour and colour while alkaloids contributes
bitterness to the cocoa bean (Nazaruddin et al., 2006; Afoakwa, 2010).
Constituents of the polyphenols include; catechins (flavan-3-ols) accounts for
approximately 37%, anthocyanins and proanthocyanidins with approximately 4% and 58%
respectively. The predominant catechin is (−) epicatechin, up to 35% of total polyphenols.
Occurring in a rather less quantity is (+) catechin with traces of (+) gallocatechin and (−)
epigallocatechin (Afoakwa, 2010; Afoakwa et al., 2012b).Afoakwa (2010) stated that fat-
soluble polyphenols in dried fat-free fresh Forastero cocoa form 15–20%, which falls to
approximately 5% after fermentation. Contents of 10% or greater are considered a sign of
poor fermentation.
University of Ghana http://ugspace.ug.edu.gh

21
2.3.3.5 Organic acids
A medley of the organic acids totaling 1.2 – 1.6% of the bean is dominated by citric,
acetic,succinic and malic acid that contribute to the taste of cocoa. They are formed during
fermentation and citric acid is predominant in fresh cocoa beans with 0.3 – 2.0% (Belitz et
al., 2009). The amount of acetic acid released bythe pulp and partly retained by the bean
cotyledonsdepends on the duration of fermentation andon the drying method used. Belitz et
al. 2009 noted that eight brands of cocoawere found to contain 1.22 – 1.64% total acids,0.79
– 1.25% volatile acids and 0.19 – 0.71% aceticacid.
2.4 Primary processing of cocoa beans
Before cocoa beans attain its commercial viability it must have gone through some
major post harvest processes that have a profound impact on the quality of the cocoa beans.
Harvesting, pulp pre-conditioning, fermentation and drying and the major and most critical
primary processing that must be done meticulously to avert under fermented and astringent
beans.
2.4.1 Harvesting
The transformation from raw cocoa beans into dried cocoa beans begins with the
primary process of harvestingwhich is normally carried out over aperiod of 3 to 4 days, at
intervals of 3 to 6weeks. This practice will vary according to thesize of the farm and pod
yield (Lopez and Dimick, 1995). Ripe pods, which the farmer must assess via the external
colour, are detached from the bark of the tree using sharp knives, secateurs and machetes.
Those out of armsreach are harvested with special long-handledtools with a sharp edge. Care
is taken to avoid damage to theflower cushions that would reduce futureyields.
The harvested pods are transported to the a fermentary where they are broken most
often in Ghana with machetes to open and reveal theseeds for removal (Knight, 2001) In
University of Ghana http://ugspace.ug.edu.gh

22
Ghana, harvesting is done in two main batches with October to February being the main crop
and from May to August which is the mid crop (Amoa-Awua et al., 2006).
Ripeness of the pods is a very important factor for proper fermentation as a lack of
control thus poor judgment of the maturity and ripeness of the pods will lead to the
harvesting of immature and not fully ripen will cause variations in the quality of cocoa beans
after fermentation and drying.
2.4.2 Pulp-preconditioning
There are three basic treatments that have been evaluated for the post harvest
treatment of cocoa beans prior to fermentation. This includes pod storage, mechanical
depulping and enzymatic depulping (Schwan and Wheals, 2004). Due to high acidity of
beans from some producing areas such as Malaysia these treatment methods were developed
in an attempt to reduce the problem of acidity in dried fermented cocoa beans. This problem
of high acidity has been linked to the excessive production of lactic and acetic acid resulting
from fermentation (Rohan, 1963). From earlier research conducted, the removal of a portion
of the pulp thus the fermentable sugar content of the bean results in the production of less
acids during fermentation and subsequently less acidic beans after drying (Rohan, 1963;
Wood and Lass, 1985).
Pod storage is quite different from mechanical depulping and enzymatic depulping
and the chemistry of the outcomes of the three different forms of pulp preconditioning are
highly different. While stored pods for 5 – 7 days as shown by earlier researchers enhances
pre-fermentation activity inside the pods during this dormant stage helps to facilitate rapid
rise in temperature during fermentation, reduces acidity, and imparts stronger chocolate
flavour (Schwan and Wheals, 2004; Nazaruddin, 2006; Afoakwa 2010; Afoakwa et al.,
2011ab; Afoakwa et al., 2012ab) that cannot be said for mechanical depulping.
University of Ghana http://ugspace.ug.edu.gh

23
The principle for mechanical depulping is to separate pulp from fresh beans via the
action of a depulper and this might cause bruising of the beans and its inherent cell structures
leading to activation of enzymes that might influence the biochemical processes during
fermentation. Apart from reducing acidity, depulping also shortens fermentation time and
makes available excess pulp in the manufacture of jams and cocoa liquor (Buamah et al.,
1997; Dias et al., 2007).
2.4.3 Pod-breaking
Pods are usually split open with a sharp machete to reveal and remove the seeds. In
Ghana most of the farmers crack open the pods with the machete by making a sharp incision
on the longitudinal section of the pod is made then a second on the opposite side of the pod
and a third incision made at the base for easy removal of the husk (Quao, 2010). The beans
are then scooped out with fingers or the cutlass and this is an important process as there is the
transfer of microorganisms from the farmer‟s hands or tools to the beans. The beans are
extracted without placenta and fermentation follows immediately (Afoakwa, 2010). Only
mature, well-developed pods contain good beans. The colour of the pulp is a good indication
of suitability as damaged pods show discoloration but pods showing symptoms of damage
from black pod on the surface need not be discarded if the beans inside are unaffected
(Knapp, 1937;Nair, 2010).
2.4.4 Fermentation
Fermentation plays a pivotal role in the formation of flavour harbingers, colour and
aroma due to biochemical and chemical changes that occur during the process. However
these are also affected not just by fermentation but also by genetic variation of the cocoa
varieties (Lopez and Dimick, 1995; Afoakwa and Paterson, 2010). During and after opening
of the cocoa pods the cocoa beans are spontaneously inoculated with a variety of
microorganisms from the farmer‟s hands and the tools involved (Nielsen, 2006; Thompson et
University of Ghana http://ugspace.ug.edu.gh

24
al., 2001). The usual recommendation for fermentation is to start immediately following pod
breaking. It is the norm but in exceptional cases such as to reduce acidity, seeds may
bespread out for several hours before being fermented (Biehl et al., 1990); another method
also recommends partial removal of theseed mucilage prior to fermentation (Lopez and
Dimick, 1995).
Typically fermentation involves the confinement of freshly scooped out beans be it in
a heap or any of the other fermentation systems for a duration of 3 to 6 day with a maximum
of 8 days depending on the variety of the cocoa (Lopez and Dimick, 1995). As fermentation
continues, various yeasts, lactic acid bacteria, acetic acid bacteria and other microorganisms
such as Bacillus spp. (Nielsen, 2005) develop in a form of succession which is not entirely
distinct but rather overlap with other microorganisms occurring throughout the fermentation
process (Thompson et al., 2001; Ardhana and Fleet, 2003; Schwan and Wheals,2004).
The fermentation process involves microorganisms catabolizing fermentable pulp
sugars to alcohols (ethanol) and through exothermal reactions some of the alcohols are
oxidized to acetic acid resulting in the liberation of pulp juices known as sweatings
(Thompson et al., 2001). The penetration of the ethanol and acetic acid into the core of the
beans and its associated heat emanating fromthe reaction causes the beans to swell up and
destroy the embryo or the germ. The heat generated can reach a high of 45 – 50˚C from an
initial of 25˚C and is very typical of heap fermentations (Senanayake et al., 1995). This leads
to a loss of germinating ability of the seed. This process also brings about the destruction of
cellular integrity and break down of the cell walls within the bean allowing the interactions of
enzymes and substrates freely. This continued process leading to well fermented beans
(Roelofsen, 1958;Thompson et al., 2001; Beckett, 2009; Afoakwa, 2010). The production of
acids and alcohols by various yeasts, lactic acid bacteria, acetic acid bacteria and other
University of Ghana http://ugspace.ug.edu.gh

25
microorganisms causes the pH of the beans to decrease from about 7.0 to 5.0 – 5.5 (Beihl et
al., 1985; Thompson et al., 2001).
Other metabolic processes occurring simultaneously within the bean will cause the
increase in flavour precursors such as amino acids and reducing sugars as well as the
reduction on total polyphenols leading to a less bitter and astringent beans and other complex
chemical processes will also take place. The fermentation process produces typicalalcoholic,
lactic and acetic acids in the external pulp enveloping the seed. These changes take place
within the tissue,resulting in the formation of flavorprecursors(Lopez and Dimick, 1995).
2.4.5 Fermentation systems
Various cocoa fermentation systems have been developed. These methods of
fermentation vary considerably from producing region to region,and in some instances even
different farmers practice different fermentation techniques depending on the quantity of
beans and what system is available to them (Lopez and Dimick, 1995; Afoakwa et al., 2010).
The generalmethods involve the seeds being placed in some kind of receptacle, confined and
weighed down. Most of the world‟s cocoa is fermented on banana leaves covered heaps, in
boxes, trays, and baskets and on dry platforms (Lopez and Dimick, 1995; Beckett, 2009;
Afoakwa, 2010).
2.4.5.1 Heap fermentation
In this system, beans are piled or heaped on and coveredwith plantain or banana
leaves. Cocoa seeds varying inquantities from 25 to 1000 kg are heaped ona floor covered
with plantain leaves and perforated for easy drainage of sweatings. The heap is subsequently
covered with the leaves, which are weighed down, by branches or other materials (Lopez and
Dimick, 1995). This is done not only to protect the fermentingmass against insects and
conserve heat but also to prevent the entry of rainwater, dust and other foreign matter (Wood
and Lass, 1985). The heap ideally must be turned every 72 hours during the fermentation to
University of Ghana http://ugspace.ug.edu.gh

26
ensurea uniform fermentation (Baker et al., 1994), enhance growth of beneficial
microorganisms and limit the growth ofunwanted microorganisms (Nielsen, 2006).
According to Baker et al. (1994) stated that about 57 % of the Ghanaian farmers do not turn
the heaps. This is due to its laborious nature. The duration for this type of fermentation
ranges between 4 and 7 days. The heap fermentation systemdominates in Ghana and other
West African countries (Wood and Lass, 1985; Baker et al.,1994).
2.4.5.2 Tray fermentation
Due to the laborious nature of turning heap fermentations the tray method was
developed based on the early observation that when the beans are heaped to ferment, a
change in color of the beans occurs up to a depth of about 10 cm when beans are not mixed
(Nair, 2010). Based on this, in trays fermentation, reasonable quantities of beans of 10 cm
heightholding are held in trays stacked one over the other for sufficient development and
conservation of heat and there is no mixing (Thompson et al., 2001).
A typical size of wooden trays is 90 cm x 60 cm x 13 cm. Battens or reapers are fixed
at the bottom of the trays with small gaps in between to avert a situation where beans might
falling through and also allow for free flow of sweatings (Nair, 2010).
When filled, the trays are stacked one over the other with the last being empty allow
for drainage of the sweatings. With the minimum number of trays required for a stack being
six the beans of the topmost tray are covered with banana leaves but after 24 hours, the stack
of trays is covered with gunnysacks to conserve the heat that develops. Tray fermentation
will normally be completed in day 4 and dried on day 5 (Nair, 2010).
2.4.5.3 Box fermentation
This type fermentation requires relatively large, fixed volume of cocoa and it is
usually used on larger farms. A wooden box is subdivided by eitherfixed or movable internal
partitions intocompartments measuring approximately1 x 1 x I m. The containersvary in size
University of Ghana http://ugspace.ug.edu.gh

27
from country to countryandhave a holding capacity of 600 to 700 kg of fresh cocoa beans
(Lopez and Dimick, 1995). The boxes are arranged in a series of steps raised above ground
levelto take advantageof gravity to facilitate turning, which is effectedby simply removing a
movable walland shoveling the seeds into the box below. The boxes are raised over a drain
that holds sweatings. The floor of the box is usually solid and contains holes for drainage and
aeration (Lehrian and Patterson, 1983).The beans are covered with banana leaves or
jutesacking to maintain the heat and prevent thesurface seeds from drying and turning is done
every 48 hours.
2.4.5.4 Other fermentation types
2.4.5.5 Drying platform fermentationand Basket fermentation
Fresh cocoa seeds are spread directly on drying platforms to allow for mild
aerobicfermentation while drying and an anaerobicfermentation when the seeds are heaped
intopiles each night. This type of fermentation is practicedin Ecuador and parts of Central
America where the Criollo cocoa is usually grown (Lopez and Dimick, 1995). Though this
type of fermentation is adequate for Criollo varieties it is insufficient for Forastero varieties
that require longer fermentation times (Rohan, 1963).
Baskets fermentation is mainly practiced in Nigeria, smallholder farmers in the
Philippinesand some parts of Ghana (Lopez and Dimick, 1995; Afoakwa, 2010). Small
quantities of fresh cocoa beans are placed in baskets lined with plantainleaves with tiny
perforations to allow for seepage of sweatings and the surface is covered with plantainleaves
and the mass is weighed down. Fermentation usually spans 4 to 6 days and the beans are
mixed regularly (Rohan, 1963).
University of Ghana http://ugspace.ug.edu.gh

28
2.4.6 Drying
Drying is an all-important process after fermentation. After fermenting the beans for
the required duration, the beans are removed from their respective types of fermentation
systems employed for drying. Drying can be done in two ways thus natural or sun drying and
artificial drying. Drying is done to ensure to removal of moisture and also some major
biochemical processes such as flavour development, reduction in bitterness and astringency
occur and also develop the chocolate brown colour of well fermented cocoa beans (Fowler,
2009; Afoakwa 2010). During drying a considerable amount of moisture is lost and has been
estimated that moisture is reduced from approximately 50% to about 7 – 8%. This is
important as moisture content above 8% might yield mould growth during prolonged storage
and moisture of below 5% is very brittle (Lopez and Dimick, 1995). Regions or countries
where the weather is hot and dry the fermented beans are spread on flat surfaces dried in the
sun. In countries where the weather is humid and makes natural drying difficult, mechanical
drying is employed (McDonaldet al.,1981; Lopez and Dimick, 1995; Nair, 2010).
2.4.6.1 Natural drying
Sun drying is the most widely used and accepted method for several reasons: First is
that sun dryingis cheap and it allows for slower and uniform migration of moisture. This
method over the years yields quality beans in traditional areas of cocoa production such as
Ghana where the weather is sufficiently sunny. In Ghana, the beans are spread in a thin layer
on bamboo mats in the sun raised off the ground (Afoakwa et al., 2011ab) and the mats can
be rolled upto protect the beans when it rains. The beans are stirred regularly and added
advantage is that foreign materials are easily identified and hand picked and there is also a
lesser risk of contamination. Some attempts to improve the efficiency of sun drying have
been made by using solar drying cabinets (Nair, 2010).
University of Ghana http://ugspace.ug.edu.gh

29
Sun drying of cocoa beans takes about a 6 – 7 days to dry but under cloudy or rainy
conditions drying may take up to about 4 weeks which might increase the risk of
mouldgrowth and spoilage (Wood and Lass, 1985; Thompson et al., 2001).
2.4.6.2 Artificial Drying
Artificial drying is achieved via mechanical hot air dryers fuelled by wood or any
petroleum source. Many designs have been developed, but usually indirect heating using
heatexchangers are preferred. However, when employed, the temperaturesshould be such that
the inside of thebean remains below 60°C so that enzymes arenot deactivated before
browning occurs to prevent off-flavours. Rapid drying alsotends to make the beans retain
excessive amounts of acetic acid, which is deleterious toflavour (Lopez and Dimick, 1995).
When wood is used, as a source ofheating fuel, there is the danger that the smoke produced if
not well controlled will cause smoky beansleading to off-flavours severely affecting the value
of the beans (Wood and Lass, 1985; Thompson et al., 2001).
2.5 Microbiology of cocoa fermentation
Fermentation of cocoa is a spontaneous microbiological process. The undamaged and
healthy beans are sterile butsoon as they are removed,they become inoculated with a variety
of microorganismsfrom the pod walls, the laborer‟shands, the containers used
fortransportingthe beans to the plant, the dried mucilageof the previous fermentation that
coats thesweat-boxes, and by insects especially fruit fly (Drosophila melanogaster)(Lopez
and Dimick, 1995; Thompson et al., 2001; Nair, 2010; Nielsen, 2005; Nazaruddin, 2006;
Nielsen, 2007; Afoakwa, 2010).
Fresh cocoa pulpcontains sugars (mainly sucrose) and citric acid, which makes itan
excellent medium for the growth of microorganisms.During the initial phase of fermentation
the low pulp pH of about 3.4 – 4.0 (due to the relatively high content of citric acid), high
sugar content(8 – 24%) and the low oxygen tension are most (Lopez and Dimick,
University of Ghana http://ugspace.ug.edu.gh

30
1995)suitable for the growth of anaerobic yeasts, which initially dominate the
fermentationduring the first 24 to 36 hours (Thompson et al., 2001) and it has been recorded
that yeast population increases rapidly to 107-108 CFU/g and it is followed by a steady
decline throughout the rest of the fermentation (Ardhana and Fleet, 2003; Nielsen, 2006).
Previous research conducted by Nielsen, (2006) shown that Ghanaian cocoa pods
have wide range of yeasts and it includes:Hanseniaspora guilliermondii (53%),Pichia
guilliermondii (22%), Candia intermedia (7%), Candida parapsilosis (6%),Cryptococcus
laurentii (4%), Candida silvicola (2%), P. membranifaciens (2%),Rhodotorula glutinis (2%)
and Cryptococcus humicola (2%). Some strains of yeasts produce pectinaseswhich break
down the pulp cells so that the juices drains carrying away flakes of pulp however, primarily
yeasts are known to produce ethanol from sugars thus sucrose Carbon dioxide and
metabolizing citric acid. This leads to a sharp increase in the ethanol concentration and a
decrease in the concentrationof fermentable sugars (Lopez and Dimick, 1995; Thompson et
al, 2001; Ardhana and Fleet,2003; Nielsen, 2006).
Fermentations investigated by Nielsen (2006) revealed that approximately 80% of the
sugars(glucose, fructose and sucrose) were metabolized within the first 24 hours but the
researcher noted an exception wherethe centre of the large heap fermentation were slowerand
this corroborated similar observations reported by Carr et al. (1979). The conversion of
glucose and fructose to ethanol causes a moderate rise in temperature at the initial phases of
fermentation due to its exothermic nature.
Thompson et al. (2001) noted that the decline in yeast population could be attributed
to rapidly metabolizing sugars in the pulp to form carbon dioxide and ethanol. Secondly,the
production of ethanol creates a toxic environment that represses yeast growth and lastly
aceticacid, which is produced from ethanol by the acetic acidbacteria, is also toxic to yeasts
(Thompson et al., 2001; Nielsen, 2006). Coupled with the above mentioned processes, the
University of Ghana http://ugspace.ug.edu.gh

31
breakdown of pulp parenchymacells culminates into pockets of gaps which encourages air
flow this is corroborated by the research findings of Ardhana and Fleet (2003) that highly
pectinolytic filamentous fungi flourished during first 36 hours of fermentation and loss of
citric acid by drainage andthrough microbial metabolism causes a rise in pH these now
favoursthe proliferation of lactic acid bacteria (Lopez and Dimick, 1995; Thompson et al.,
2001; Gálvez, 2007; Afoakwa, 2010).
Counts of lactic acid bacteria increases rapidly, but may be present for only a brief
period, because they prefer a low oxygen concentration or high concentration of carbon
dioxide (Thompson et al., 2001)their population has been observed to reach 106 to 107
CFU/g in a typical fermentation. The lacticacid bacteria population is usually at its peak for
about 3 days then decreased to less than 10% of the totalmicro flora (Thompson et al., 2001).
Both homofermentative and heterofermentative lacticacid bacteria are present in cocoa
fermentations with the former being the majority. Some of the homofermentative species
included Lactobacillus plantarum,Lactobacillus casei, Lactobacillus
delbrueckii,Lactobacillus acidophilus, Pediococcus cerevisiae, Pediococcusacidilactici, and
The heterofermentative species included Leuconostocmesenteroides and Lactobacillus brevis
(Thompson et al., 2001). In a recent study by Nielson et al. (2007), the following lactic acid
bacteria were isolated in Ghanaian cocoa beans;Lactobacillus plantarum,
Leuconostocpseudomesenteroides, Leuconostoc pseudoficulneum and Pediocococcus
acidilactici.With increase in aeration the lactic acid bacteria decrease, which causes a rise in
acetic acid bacteria.
Acetic acid bacteria reach around 108 CFU/g during Ghanaian heap fermentations
according to Nielsen (2006). Aeration of the fermenting mass by turningclearly influenced
acetic acid bacteria growth in the large heap fermentation (Carr et al., 1979). According to
Nielson (2006), following turning of the heap the acetic acid bacteria counts decreased in the
University of Ghana http://ugspace.ug.edu.gh

32
outer portions the heap followed by renewed acetic acid bacteria growth while the opposite
was observed in the centre ofthe fermenting mass and this was corroborated by Carr et
al.(1979) as it was observed that the growth of acetic acid bacteria in the centre of the
fermenting beans are positively correlated with turning. Acetobacter syzygii, Acetobacter
pasteurianus and Acetobacter tropicalis were the predominant acetic acid bacteria isolated by
Nielsen et al. (2007). The aerobic conditions within the fermenting mass make conditions
favourable for acetic acid and other aerophilic sporeformingbacteria and fungi (Thompson et
al., 2001). This results in exothermicoxidation of alcohol culminating in an increasein
temperature to about 45 to 50°C.The rise in temperature makes it unfavorable for the survival
of acetic acid bacteria (Lopez and Dimick, 1995; Thompson et al., 2001).
These high temperaturescoupled with the ethanol and acetic present serves as the final
phase of fermentation as this phase is characterised by a high stressfactor limiting the growth
of many microorganisms (Lehrian and Patterson, 1983; Thompson et al., 2001; Nielsen,
2006; Gálvez, 2007; Afoakwa, 2010; Afoakwa et al., 2011a). Also occurring simultaneously
in the later phases offermentation increasing pH and aeration becomes favourable for growth
of filamentous fungi which are responsible for off flavours and increased free fatty acids
levels and sporeforming Bacillus spp. often reaching about 108 CFU/g in the later stages of
thefermentation (Carr et al., 1979; Schwan et al., 1995; Ardhana and Fleet, 2003). However,
investigations by Nielsen (2006)showed that small heap and tray fermentations had no or
limited growth ofBacillus spp. and these observations were because fermentations were
completed after 4 rather than 6 days. Bacillus spp. has been shown to have high enzymatic
activity (Schwan et al., 1986). They are also responsible for the production of short chain
fatty acids (< C14) such as butyric acid and others that produces off flavours, pyrazinesand
2,3-butanediol (Schieberle, 2000; Thompson et al., 2001; Nielsen, 2006; Quao, 2010).
University of Ghana http://ugspace.ug.edu.gh

33
2.6 Biochemical and chemical changes during fermentation
The development of chocolate flavour begins with the chemical and biochemical
changes occurring within the bean during fermentation and drying. From previous researches,
it is imperative to note that pulp pre-conditioning (pod storage, mechanical and enzymatic
depulping and bean spreading), mode of fermentation and its microbial conditions and drying
provide the necessary conditionsfor complex biochemical reactions to occur (Hodge, 1953;
Lopez and Dimick, 1995; Thompson et al., 2001; Nazaruddin, 2006; Nielsen, 2007; Afoakwa
et al., 2012ab). However similar cannot be mentioned of immature and unfermented beans as
they tend to develop little or nochocolateflavour when roasted while excessive fermentation
yields hammy and putridflavours which are not ideal (Zaibunnisa et al., 2000; Reineccius,
2006; Afoakwa, 2010).
Thompson et al. (2001) noted that although lactic and acetic acids produced
externally by microbial activity affect flavour,chocolate flavour development is
predominantly dependent on enzymatic formation of flavour harbingers withinthe cotyledon
and it is highly peculiar to cocoa. These compounds include free amino acids,
peptides,reducing sugars, and polyphenols (Kirchhoffet al. 1989; Hansen et al., 2000; Leeet
al., 2003; Hiiet al., 2009).The structure of testahas semi permeable and acts as a natural
barrier between microbialfermentation activities outside the bean and chemicalreactions
within the bean. But with a progression in fermentation there is a migrationof ethanol, acetic
acid, and water which are metabolites from fermentation from the outside to the inside of the
bean (Thompson et al., 2001).
Death of the cocoa bean is a very important process as there is breakdown of cellular
integrity which leads to the free interaction of enzymes and substrates also, soluble bean
components are usually lost by leaching via the testa and lost by drainage (Hansen et al.,
1998; Thompson et al., 2001; Afoakwa, 2010). These biochemical reactions responsiblefor
University of Ghana http://ugspace.ug.edu.gh

34
flavour development occur within the cocoabean on the onset of bean death. Its long been
known that rising temperatures and increasing aceticacid concentrations during fermentation
cause seed death but Lehrian (1989) stipulated that the ethanol produced via anaerobic yeast
growth phase correlates more withdeath of the seed. This usually occurs 24 hour after
maximum concentrationsof ethanol are attained within the cotyledon (Thompson et al.,
2001). This averts problems associated with germination, which utilizes a chunk of cocoa
butter and other stored nutrients leading to a more stable and desirable product.
Afoakwa (2010) explained that enzymes exhibit differentstabilities during
fermentation and may be inactivated by heat, acids, polyphenols and proteases. The enzymes
associated with cocoa fermentation includes; amino-peptidase, cotyledon invertase, pulp
invertase and polyphenol oxidase aresignificantly inactivated, carboxypeptidase is partly
inactivated, whereas endoprotease andglycosidases remain active during fermentation
(Hansen et al., 2000; Thompson et al., 2002; Afoakwa, 2010).
Research by Kirchhoffet al., (1989) revealed that there is significant difference in
composition of the free amino acids releasedduring fermentation as compared with the
composition in total seedhydrolysates (reflecting predominantly the protein-bound amino
acids) is astriking feature of cocoa fermentation and this is in agreement with findings from
other researchers (Forsyth and Quesnel, 1957; Forsyth and Quesnel, 1963; Biehlet al., 1985;
Thompson et al., 2001; Afoakwa, 2010).This is suggestive that there is a fine balance
between fermentation times, microbialactivity that influences enzyme activity within
thecotyledon.
2.6.1 Enzymology of cocoa beans
The immediate surroundings of the fermenting mass forms a biocenosis which is
affected by pH and temperature, in the fermenting mass thatinfluence cocoa bean enzyme
reactions. Enzymes are proteins with powerful catalyticactivity, which work over a range of
University of Ghana http://ugspace.ug.edu.gh

35
pH and have an optimum pH at which it is most active. Increasing temperatures also
accelerates their activation energy (Belitzet al., 2009).
Additionally, enzymes have high specificity for both thecompound to be converted
(substrate specificity)and for the type of reaction to be catalysed (reaction specificity such as
hydrolytic and enzymatic reactions in cocoa). Apart from the aforementioned specific factors;
moisture is also necessary to allow for enzyme and substrate interaction (Belitz et al., 2009),
but with the gradual loss of water during drying, enzyme activity is reduced and finally
ceased at about6 to 8% (Thompson et al., 2001). Temperatureof the fermenting mass rises
froman ambient of 25°C at the initial stages of fermentation to about 50°C by the 3rd
day
(Lopez and Dimick, 1995). Increasein temperature of more than 20°C may impact negative or
positively on enzyme activityresulting in fewer flavour precursors and poorchocolate flavour
(Thompson et al., 2001). Finally, if appropriate amounts of organicacids are not produced
during fermentation, thepH of the cotyledon will not be suitable for optimal enzymeactivity,
and the flavour profile of the resulting cocoa will be affected but excessive acid will lead to
heightened sourness that can mask the chocolate flavour.
2.6.2.1 Hydrolytic enzyme reactions
During the anaerobic phase of fermentation hydrolytic enzymes namely invertase,
glycosidases, and proteases have highest activity (Lopez and Dimick, 1995; Thompson et al.,
2001; Afoakwa, 2010). The activity of invertase yields reducing monosaccharides (glucose
and fructose) from sucrose that natively cannot partake in non-enzymatic browning reactions
that occurduring roasting to contribute to chocolate flavour.These reducingsugars represent
more than 95% of the total reducing monosaccharides in cocoa beans (Forsyth and Quesnel,
1957; Hansen et al., 2000).
In addition to the minuscule amounts of amino acids existing in the unfermented
bean, proteases (endo- and exoproteases)account for the hydrolysis of proteins to amino acids
University of Ghana http://ugspace.ug.edu.gh

36
and peptides and their activity is dependent on pHand temperature. Proteins in cocoa are
vicilin-like globular in nature and are the main target of the proteases. According to
Kirchhoffet al. (1989) the types and ratio of free amino acids and peptides sequences are
unique to cocoa. These amino acids and peptides participatein non-enzymatic browning
reactions by forming complexes with reducing sugars during roasting toform important
chocolate flavour precursors and also colour formation (Kirchhoffet al. 1989; Afoakwa et al.,
2011a)
Glycosidase is a unique enzyme that hydrolyses anthocyanins to cyanidins and sugars
(galactose and arabinose)and has more impact on colour developmentand some minor flavour
components (Lee, 1975; Biehlet al., 1985; Lopez and Dimick, 1995; Thompson et al., 2001;
Afoakwa, 2010). Anthocyanins locatedin specialized vacuoles within the cotyledon andare
responsible for the characteristic deep purple colorof the unfermented bean. These
compounds are highly affected by the pH of the medium. The colours range from purple in a
neutral state, violet in weak alkaline solutions and pink in acidic conditions (Lee, 1975;
Konczak and Zhang, 2004).
2.6.2.2 Oxidative enzyme reactions
Polyphenoloxidase (PPO) is the major oxidase occurring in the aerobic phase of
fermentationbut continuing well into the drying of cocoa beans and is responsiblefor some
flavour modifications (Thompson et al., 2001). Oxygen facilitates the activity of PPO
however; rising temperatures and insufficientmoisture become inhibiting factors for the
polyphenol oxidase enzyme during drying.Catechins of which epicatechin makes up more
than 90% and leucocyanidins are the major classes ofpolyphenols that is subject to oxidation
in cocoa beans.Oxidation of epicatechin during the aerobicphase of fermentation and drying
is largely responsiblefor the characteristic brown color of fermented cocoabeans.
University of Ghana http://ugspace.ug.edu.gh
37
The dihydroxy configuration of polyphenols areoxidized to form quinones which in
turn can polymerizewith other polyphenols or complex with amino acidsand proteins to yield
characteristic colored compoundsand high-molecular-weight insoluble material (Thompson et
al., 2001) that result in the reduction in astringency and bitterness.
2.7 Quality indices of fermented and dried cocoa beans
Generally to develop good quality cocoa products such as chocolates, cocoa butter,
cocoa powder and other confectionaries cocoa must be free from mould, well fermented,
must be low in free fatty acids and less bitterness and astringency and also less acidic.
Quality appraisals also rely heavily on the experience of farmers and may lead to a good deal
of variation in quality. Since fermentation is a critical step in the development of flavor, it is
essential that farmers be trained on the principles of fermentation. The quality of cocoa can
be assessed via a number of quantitative and qualitative tests. The most important and easy to
assess include cut test to ascertain to some extent the fermentative quality, free fatty acids to
assess the level of lipolysis(Thompson et al., 2001).
2.7.1 Cut-test
The cut test is simple, and still the most widely used method is to assess the quality of
a random sample of beans from a batch by visual evaluation of the cut surfaces of cocoa
beans. Although to some extent the cut testreveals certain defects that are likely to cause off-
flavours and degree of fermentation it is extremely subjective and at best is limited to the
measurement of bean defects (Wood and Lass, 1985; Lopez and Dimick, 1995). Results from
a cut test assumes that beans showing the least amount of the prescribed defects are in good
standing and can produce good chocolate flavour. A standard of 300 beans sampled randomly
longitudinally sectioned to expose the surface of the cotyledons, observations are usually
made during the day with the aid of the sunlight and sometimes under bright visible light.
The defects most commonly looked for are:
University of Ghana http://ugspace.ug.edu.gh

38
a. Slaty beans –occurrence is due to dried beans without fermentation and it is
characterised by a greyish to ash colour;
b. Purple beans - a combination of the intensity and occurrence gives an indication of
the degree of under fermentation;
c. Mouldy beans - indicator of poor quality of the product usually;
d. Germinated beans – presence suggest under fermentation and high moisture content;
e. Other physical defects such as flat beans, insect infestation and broken beans relate
more to the yield rather than flavor quality (Wood and Lass, 1985; Lopez and Dimick,
1995; Thompson et al., 2001).
The cut test is not a guarantee of good flavour, and attempts have been made to
development a more precise means of flavour or quality determinations.
2.7.2 Free fatty acid levels
During fermentation, drying and storage of cocoa beans some free fatty acidare
produced. The extent of lipolysis is determined bythe free fatty acid content (FFA). FFA
level affects the fatstructure and thus the shelf life of the cocoa butter and other products
manufacture from such liquor. If severe,it will cause rancidity of the cocoa butter (EEC,
1990; Belitzet al., 2009).
Oils with FFA content exceeding 1% are commonlydesignated as crude oils and
cocoa butter is no exception.Recommendations of the Codex Alimentarius Commission
stipulate that FFA should not exceed 1.75% in cocoa butter. There is a relationship between
the sensoryperception of quality deterioration and the levelsof FFA in fats, which contain
thesensory-relevant compounds thus (C number <14)low-molecular free fatty acids
(Shieberle, 2000; Thompson et al., 2001; Stark et al., 2006; Belitzet al., 2009).
University of Ghana http://ugspace.ug.edu.gh

39
2.8 Storage and Transportation of cocoa beans
2.8.1 Storage of cocoa beans
Traditionally cocoa beans are packedinto jute bags of 60 to 65 kg and subject to
sanitary certification in warehouses prior to shipment. During longer storage periods, the
quality of the cocoa beans can seriously be affected if proper care is not taken. Some bagged
cocoa beans undergo a brief periodof storage in warehouses on the farms, at the buying
agencies and on the dockyardsbefore and after shipping and at the factories before processing
into cocoa products (Jonfia-Essien, 2004). In Ghana the Produce Buying Company (PBC) is
the sole agent licensed to buy, store and sell cocoa (Mohammedet al., 2012).
During prolonged storage relative humidity of 65 – 70% will generally maintain the
moisture content of the beans about 7 – 8% this prevents insect and mold attacks and also
averts possibly the problem of excessive fumigation. According to earlier literature by
Thompson et al. (2001), during the initial storage period slow oxidation and loss of volatile
acids may improve flavour but prolonged periods will eventually lead to stalingof the beans.
The quality of cocoa beans can change during storage depending on temperature, relative
humidity and ventilation (Lopez and Dimick, 1995; Thompson et al., 2001; Jonfia-Essien,
2004).
2.9 Summary
As aforementioned mechanical depulping is a method for pulp pre-conditioning cocoa
beans prior to fermentation. This method separates a portion of the pulp of fresh beans to
reduce the amounts available as fermentation substrate. This is geared towards reduction of
cocoa bean acidity. However, the extent to which the technique of mechanical depulping
influences the chemical, biochemical, physicochemical and polyphenolic constituents of
Ghanaian cocoa beansduring fermentationto date, has not been investigated. Hence this study
seeks to bring to light the effects of mechanical depulping as a method of pulp pre-
University of Ghana http://ugspace.ug.edu.gh

40
conditioning on fermented and dried Ghanaian cocoa beans to add to existing knowledge and
also to enhance the productivity in the cocoa production sector and also to the chocolate and
confectionary producers at large.
CHAPTER THREE
3.0 MATERIALS AND METHODS
3.1 Materials
Ripe cocoa pods (Theobroma cacaomixed hybridsvarieties)were harvested from the
plantations of Cocoa Research Institute of Ghana (CRIG), Tafo in the Eastern Region of
Ghana.
University of Ghana http://ugspace.ug.edu.gh

41
3.2 Sample Preparation
3.2.1 Mechanical depulping (pulp preconditioning)
3.2.1.1 Description of the mechanical depulper
The stainless steel mechanical depulper used in this research comprisesof a perforated
(approximately 2–7mm) static cylindrical screen that is positioned horizontally on its
longitudinal axis. Inside the screen are two (2) paddles or scraper system, which is adapted to
rotate. When the paddles are in motionthe mass of cocoa beans are rotated and the friction
removes the pulp.The depulper is equipped with a hopper (inlet), a means for feeding the
fresh cocoa beans, a means for removing the depulped cocoa beans at the front end of the
cylindrical screen (outlet) and also beneath the cylindrical screen a means to discharge pulp
(Figure 4).
3.2.1.2 Pulp pre-conditioning process
The cocoa pods were transported immediatelyafter harvest and open arrival at the
fermentary they were split and the cocoa beans were scooped out of the pods to be subjected
to fermentation. Cocoa beans allotted for depulping weredepulped (pulp preconditioned)
using the stainless steel mechanical depulper (Figure 3)at CRIG.
University of Ghana http://ugspace.ug.edu.gh

42
Figure 3: Mechanical depulper
Figure 4: (A) Pulp extract and (B) Depulped cocoa beans
A B
University of Ghana http://ugspace.ug.edu.gh

43
The concentration of depulped beans were mixed with the undepulped beans at different
levels of 0, 25, 50, 75 and 100% of the total weight of fresh cocoa beans (50kg) to be used for
the heap fermentation. The different ratio of depulped and undepulped cocoa beans,0:100,
25:75, 50:50, 75:25 and 100:0 respectively was formed into a 50kg heap,fermented and dried
independently for subsequent analysis.
3.2.2 Fermentation and drying
The heap fermentation technique was employed for this research. The fermentation
heap was made according to a ratio of mechanically depulped beans to whole beans as
follows (0:100, 25:75, 50:50, 75:25 and 100:0%) respectively. Fermentation heap of about 50
kg was made on and covered with plantain leaves (Figure 5). Fermentation was allowed to
proceed with a regular interval (2 days) of turnings for six (6) days.
3.2.3 Samples for analysis
Approximately one (1) kg were taken at predetermined fermentation times (0, 2, 4 and
6 days) and placed into sterile polythene bags and taken to the laboratory for drying.
Figure 5: (A) Uncovered heap mixture of depulped and undepulped cocoa beans and
(B) Covered heap mixture of depulped and undepulped cocoa beans
B A
University of Ghana http://ugspace.ug.edu.gh

44
The sampled cocoa beans were placed on drying trays, well spaced and dried in an air
oven at a temperature of 45 – 50 °C until moisture content wasbetween 7 – 8%. The dried
beans were bagged and sealed airtight and stored in a dark room free from strong odour until
ready for use. After the 6th
day of fermentation (end of fermentation) samples to be used for
the drying study were sundried immediately on raised bamboo mats for six (6) days. Samples
(1kg) of the fermented cocoa beans were taken at regular intervals of 0, 2, 4 and 6 days of
drying and kept in sterile polythene bags in a cool and dark area.
Samples used for biochemical, physicochemical and polyphenolic analyses for both
fermentation and drying studies were milled into fine liquor of average particle size of about
0.45 mm using a Warring Blender (Christison Particles technologies – Albany, UK.).The
resultant cocoa liquor was stored in an airtight polythene sample bag and well labeled.
3.3 Experimental Design
Specific objectives 1 – 3 were conducted using a 5 x 4 full factorial
design.Theprincipal factors investigated were:
i. Mechanically depulped beans (0, 25, 50, 75 and 100%)
ii. Fermentation time (0, 2, 4 and 6 days).
For specific objective 4, the experiment was conducted using a 5 x 4 full factorial
design. The principal factors were:
i. Mechanically depulped beans (0, 25, 50, 75 and 100%)
ii. Drying time (0, 2, 4 and 6 days).
University of Ghana http://ugspace.ug.edu.gh

45
Specific objective 1: To evaluate the effect of mechanical depulping on the
chemicalcomposition of fermented Ghanaian cocoa beans
The following parameters were measured:
i. Proximate analysis – moisture, ash, protein, fat and carbohydrate (AOAC, 2005).
ii. Mineral analysis – mineral content was analyzed using the Atomic Absorption
Spectrophotometer (AAS).
Specific objective 2: To determine the effect of mechanical depulping on the
biochemical and physicochemical constituents of Ghanaian cocoa beans
The following indices weremeasured:
i. pH (AOAC, 2005)
ii. Titratable acidity (AOAC, 2005)
iii. Total sugars(Brummer and Cui, 2005)
iv. Reducing sugars using Luff Schoorl method (Egan et al. 1990)
v. Non-reducing sugars by Luff Schoorl method
vi. Free fatty acids (IOCCC, 1996)
vii. Percent pulp volume (Depulping).
Specific objective 3: To establish the effect of mechanical depulping on the polyphenol
concentration, degree of fermentation and appearance properties of Ghanaian cocoa
beans
The following indices were measured:
i. O-diphenols
ii. Total polyphenols(EEC, 1990).
iii. Cut test (Guehi et al. 2008)
iv. Fermentation index (Gourieva and Tserrevitinov, 1979)
v. Colour (Hunter Lab, Minolta)
University of Ghana http://ugspace.ug.edu.gh

46
Specific objective 4: To determine the influence of mechanical depulping on the
acidification, browning index, anthocyanin content, colourand free fatty acids (FFAs)
during drying of fermented Ghanaian cocoa beans
The samples were evaluated for the following:
i. Acidification (pH and Titratable acidity)
ii. Browning index (Gourieva and Tserrevitinov (1979)
iii. Anthocyanin content (Misnawi et al., 2002)
iv. Colour
v. Free Fatty Acids(IOCCC, 1996).
3.4 Analytical methods
3.4.1 Chemical analyses
3.4.1.1 Proximate analysis
The proximate composition of the dried fermented samples was evaluated for
moisture, ash, protein, fat and carbohydrate using AOAC (2005) methods 931.04, 972.15,
970.22 and 963.15 respectively and carbohydrate was calculated by difference. All analyses
were conducted in duplicate and the mean values reported.
3.4.2 Mineral analysis
3.4.2.1 Wet digestion
About 0.5 g of thesample was weighed into a round bottom digestion vessel.
Digestion was done with Aqua Regia 3:1 HCL + HNO3 (15 ml of concentrated HCl and 5 ml
of concentrated nitric acid HNO3). The samples were digested with great care in a block
digester at 150˚Cfor 2 to 3 hours in a fume chamberuntil the solution was pale yellow.
Thedigestion was continued until the solution was colourlessor nearly so (the evolution of
University of Ghana http://ugspace.ug.edu.gh

47
dense white fumes wasregarded to be indicative of the removal of nitric acid).After digestion
was completed, the solution was cooled and distilled water added. The mixturewas filtered
hot into a 200 ml volumetric flask using a Whatman No. 4 filterpaper. The solution was then
made to the mark withdistilled water.
3.4.2.2 Determination of Ca, Mg, Zn, Fe, Cu and K
One (1)ml aliquots of the digest was used to determine the concentration of Ca, Mg,
Zn, Fe, Cu and K using Atomic Absorption Spectrophotometer (AAS) (SpectrAA 220FS,
Varian Co., Mulgrave, Australia) with flame from acetylene and nitrous oxide gases. The
following formula was used to compute the total concentration of the elements in the sample:
Conc (mg/g) = Conc read from AAS x Final volume after digestion (ml)
Weight of sample (g)
3.4.2.3 Phosphorus determination
Two (2) ml aliquot of the digest was reacted with 5.0 mlmolybdic acid. The molybdic
acid was prepared bydissolving 25 ml of ammonium molybdate in 300 mldistilled water; with
75 ml of concentrated sulphuric acidin125 ml of water to get 0.5 L of molybdic acid. One (1)
mleach of 1% hydroquinone and 20% sodium sulphite wasadded in that sequence, and the
solution was made up to100 ml and allowed to stand for 30 min in order to developcolour
after which the absorption was measured at 882 nm with a Cecil Spectrophotometer (CE
7400).A standard curve of colorimetric readings versus concentrationof phosphorus using
portions of standard phosphorussolutions (1 ml, 2 ml and 3 ml) subjected to reactionswith
molybdic acid, hydroquinone and sodium sulphatesolutions were drawn. All readings were
corrected using ablank to eliminate the effect of any colour produced by thereagents.The total
concentrationof phosphorus content in the sample was estimated from the standard
phosphorus graph. Analyses were conducted in duplicate and the mean reported.
University of Ghana http://ugspace.ug.edu.gh

48
3.4.3 Biochemical and physicochemical analyses
3.4.3.1 pH and titratable acidity
The pH and titratable acidity of the cocoa beans were determined using the method
described by AOAC (2005). For the determination of pH, 10 gof powdered cocoa beans were
homogenized for 30 s in 100ml of hotdistilled water and vacuum filtered through
Whatmanfilter paper No. 4. A 25 ml aliquot was pipetted into abeaker and the pH measured
using a pH meter (Model MP230 Mettler Toledo, Mettler Company Limited, Geneva,
Switzerland).Titratable acidity wasdetermined by titrating juice with 0.1M NaOH and
expressed as the percentage of acetic acid. Twenty five(25) ml aliquot was titrated to an end
point pH of 8.02 with 0.1M NaOH and the values reported as molesof sodium hydroxide per
100 g dry nibs. The analysis was conducted in duplicates and the mean values are reported.
3.4.3.2 Total sugars
Total sugars weredetermined using phenol sulphuric acid method(Brummer and Cui,
2005) with slight modifications. The sample (powdered cocoa beans) was refluxed in 80%
ethanol for 30 mins and the supernatant was separated from residue. Reflux continued until
the solution was clear. This was followed by the addition of 25ml of 1.5N H2SO4 to the
residue remaining after evaporation of 80% ethanol and refluxed for 1 hour. It was then
filtered through Whatman No. 41 filterpaper and wash residue several times with water. The
acidic filtrate was neutralized by theaddition of BaCO3powder and confirmed by a litmus
paper. The resultant filtrate was labeled as acid extract.
To the soluble extract, ethanol was evaporated under reducedpressure in a rotary
evaporator. Some water was addedto make sure that the sugar was present in solution. After
evaporation of alcohol, alcohol-soluble and waterinsolublesubstances were precipitated. The
extract was clarified by adding 5ml of ZnSO4solution to the extract followed by 4.94 ml of
Ba(OH)2solution. The solution was allowed to stand for about5 min and filtered through
University of Ghana http://ugspace.ug.edu.gh

49
Whatman No. 41 filterpaper; the filter paper was washed with distilled waterto remove any
sugar still trapped in the precipitatethis was labelled as soluble extract.
To acid and soluble extracts, a mixture of Amberjet 1200 (H+), a cation exchange
resin and Amberlite IRA-402 (Cl-), an anion exchangeresin were added in stepwise, agitated
for 1–2 mins to allow for reaction then filtered. To 1ml of each extract,1ml phenol reagent
and 5ml H2SO4 were added with caution andallowed to stand for an hour to develop colour
(orange to red) and to cool. Theabsorbance of the samples was read at 490nm and theresults
were reported. The analysis was conducted in duplicates and the mean values were reported.
3.4.3.3 Reducing sugars
Estimation of reducing sugars was determined using the Luff-Schoorlf method(Egan
et al. 1990). Three grams of fine powderedsample were weighed into a wide-necked 250-ml
volumetric flask. Water-soluble matterwas extracted by agitating the sample with 150 ml
hotdistilled water(approximately 30 minutes). The solution was clarified by theaddition of
5ml Carrez I solution followed by 5mlCarrez II solution. The volume was made up to 200 ml
with distilled water and allowed to stand for about 5 minutes, then filtered.Twenty five (25)
ml of copper reagent (Copper II pentahydrate, citric acid and sodium carbonate) was
measured into each of the two 250 ml Quickfit round bottom flasks. To another flask, a blank
was also prepared by the addition of 25 ml of distilled water to make up to 250 ml. A
fewanti-bumping granules were added and transferred to heating mantleand refluxed gently
for 10mins and then transferred with tongs to acooling bath for 5 mins. About 3.0 g of
potassiumiodide was added to the cooled flask, with constantswirling; 20 ml of 6N HCl was
added through ameasuring cylinder.
The content of the flask wastitrated with 0.1N sodium thiosulphate until the iodine
colour turnedbeige or very light brown. To the resultant solution, 1.0 ml starch indicatorwas
added, and titration continued until the bluecolour changed to give a white precipitate of
University of Ghana http://ugspace.ug.edu.gh

50
cuprousiodide with no trace of blue colour. Sample titrationwas subtracted from the blank to
obtain the quantity ofsodium thiosulphate used, and the results were calculated and the mean
reported. Analyses were conducted in duplicate.
3.4.3.4 Non-reducing sugars
The non-reducingsugars were determined using the Luff-Schoorlfmethod (Egan et al.
1990). Non-reducing sugarswere completely hydrolyzed to reducing sugars byrefluxing with
1N HCl. Six (6) ml of clarified sample was measured into a 250 ml quickfit round bottom
flask and 2ml of 1N HCl was added andmade up to 20ml using distilled water. Refluxing
wasdone for 10mins on a hot plate. The flask and itscontent were allowed to cool and 2ml of
NaOH and3ml of water added. The protocol for reducing sugars was then followed. The
analysis was conducted in duplicate and the mean values reported.
3.4.3.5 Free fatty acids (FFAs)
Fat from the samples wasextracted with petroleum ether (40–60oC) in a
Soxhletapparatus using the AOAC (2005) method 963.15.FFA of the oils extracted was
determined using theIOCCC (1996) method 42-1993. Five grams of the oil was weighed into
a dry 250 ml stoppered conicalflask and 25ml of 95% ethanol/diethyl ether (1:1) and few
drops of phenolphthalein indicator were added. The solutionwas titrated with 0.1N NaOH by
swelling constantlyuntil pink colour persisted for 30 seconds. The percentageFFA was
determined. The analysis was conducted in duplicates and the mean values reported.
3.4.3.6 Colour determination
The colour of all the different sample treatments wasanalyzed with aMinolta CR-310
Tristimulus Colorimeter (MinoltaCamera Co. Ltd, Tokyo, Japan). The colour meter is based
on the L* a* b* colour system. The colour parameters are; L* (Ls-L0) for lightness thus (100
= brightness to 0 = blackness); a* (as-a0) for the extent of green colour (-a =green to +a =
University of Ghana http://ugspace.ug.edu.gh
51
redness); b* (bs-bo) quantifies the colour blue in the range of (–b = blue to +b = yellow).A
reference white porcelain tile with the followingreadings: L0 = 98.01, a0 = +4.98 and b0 = -
3.77 was used to calibrate the colour meter.
3.4.4 Polyphenolic constituents
3.4.4.1 Total polyphenols
The Soxhlet apparatus was used to defat the dried cocoa nibs by extracting the fat
with petroleum ether (40-60°C). The Folin Ciocalteau procedure (EEC, 1990) was followed
to determine the total polyphenolic constituents of the defatted cocoa beans. About 0.2 g of
dry defatted cocoa powder was extracted with Methanolic: HCl (80% MeOH containing 1%
HCl) on an orbital shaker for 2 hours at room temperature. The mixture was allowed to settle
and decanted.Five (5.0) ml Folin-Ciocalteau reagentwas added to about 1.0 ml of supernatant
for colour development. Four (4.0) ml of Na2CO3 was subsequently added to the supernatant
and allowed to stand for 1 hour at room temperature (30˚C), then another 1 hour at 0°C in a
refrigerator. The absorbance was read at a wavelength of 760 nm using a spectrophotometer
(Beckman CoulterDU 730 Life Science, UV/VIS Spectrophotometer).The mean value for the
duplicate measurements was calculated and reported. Standard cathechin concentrations of
blank (0), 0.2, 0.4, 0.6, 0.8 and 1 μg/ml was prepared. After the colour development, the
absorbance was read at 760 nm and a standard curve drawn from plotted points. The total
polyphenolic content in the sample was estimated from the standard cathechin graph.
3.4.4.2 Anthocyanins
The determination of anthocyanin content was conducted using the method described
by Misnawi et al.(2002). The extract obtained from total polyphenol analysis was filtered
using Whatman No.4 filter paper, and the resultant filtrate was read with the
spectrophotometer (Beckman CoulterDU 730 Life Science, UV/VIS Spectrophotometer) for
University of Ghana http://ugspace.ug.edu.gh

52
total absorbance (TOD) at 535nm. Total anthocyanin was calculated with the following
formula:
Total Anthocyanin (mg/kg) =TOD x 1000
(AvE530)1cm /10
Where TOD is the total optical density (absorbance) and (AvE530)1cm is the average
extinction coefficient for total anthocyanin when a 1 cm cuvette and 1% (10 mg/ml)
standards are used; the value is 982. The analysis was conducted in duplicates and the mean
values reported.
3.4.4.3 O-diphenols
O-diphenols content was determined with Arnow‟s reagent (10 g NaNO2, 10g
Na2MoO4 in 100 ml H2O). To 1 ml of extract (ethanol or methanol extract), 1 ml 0.5N HCl, 1
ml Arnow‟s reagent, 10 ml H2O and 2 ml 1N NaOH was added. The solution was mixed and
the absorbance was read at 520 nm after 30 sec. The analysis was conducted in duplicates and
the mean values reported. A working standard cathechol solution of blank (0), 0.2, 0.4, 0.6,
0.8 and 1 μg/ml was prepared. The colour was developed, the absorbance read at 520nm with
a spectrophotometer (Beckman CoulterDU 730 Life Science, UV/VIS Spectrophotometer)
and a standard curve drawn. From the standard graph, the amount of o-diphenol present in the
sample preparation was calculated. Means of duplicates were reported.
3.4.5 Fermentative quality
3.4.5.1 Fermentation index (FI)
The fermentation index (FI) was determined according to the methoddescribed by
Gourieva and Tserrevitinov (1979). About 0.1g of comminuted cocoa nibs was extractedwith
10 ml of a 97:3 mixture of methanol and HCl respectively. The homogenate was allowed to
stand in a cold room at 5°C for 20 hours and then vacuum filtered. The absorbance of the
University of Ghana http://ugspace.ug.edu.gh

53
filtrate was read with a Spectrophotometer(Beckman CoulterDU 730 Life Science, UV/VIS
Spectrophotometer)at 460 nm and 530 nm respectively. The fermentation index was derived
by calculating the ratio of absorbance at460 nm to the absorbance at 530 nm. The mean value
of the duplicates was reported.
3.4.5.2 Cut test
The International method described by Guehi et al.(2008) was used. By the use of a
scalpel, a total of 300 beans were cut lengthwise via the mid-section to expose the
maximumcut surface of the cotyledons. The exposed cotyledons were examined under ultra
violet (UV) light of the sun during the day at approximately 12 noon when sunlight is
presumed to be at its peak and placed in one of thefollowing categories: purple, partly brown
or partly purple, brown, slaty, germinated and mouldy.
3.6 Statistical analyses
The data were analyzed using STATGRAPHICS Centurion XV version 15.2.14
(STSC, Inc., Rockville, MD, USA) foranalysis of variance (ANOVA). Least
significantdifference (LSD) was used to separate and comparethe means, and significance
was accepted at 5% level (P<0.05). Furthermore, analyses were conducted toevaluate the
combined effect of mechanically depulped beans and fermentation time on the studied
parameters using the responsesurface methodology. Minitab version 16.0.0.1 was used to
conduct a stepwise multiple regression procedures.Models were developed to relate
mechanical depulping and fermentation time on the chemical, biochemical, polyphenolic and
degree of fermentation indices of the cocoa beans. Thecoefficients of the variables in the
models and theircontribution to the model‟s variation were reported. The R2 values were used
to judge the adequacy of the models. The R2 of a model refers to the proportion ofvariation in
the response attributed to the model ratherthan random error. For a good fit of a model, an R2
University of Ghana http://ugspace.ug.edu.gh

54
ofat least 60% was used. All treatments and analyses were conducted in duplicates and the
mean computed and reported.
University of Ghana http://ugspace.ug.edu.gh

55
CHAPTER FOUR
4.0 RESULTS AND DISCUSSION
4.1 Effect of mechanical depulping on the chemical composition of fermented
Ghanaian cocoa beans
4.1.1 Proximate composition
4.1.1.1 Moisture
During fermentationof cocoa beans there was an increase in the moisture contentof
samples containing 50, 75 and 100% depulped beans (Table 4). For the treatment containing
50% depulped beans moisture increasedfrom 4.97 to 9.55%. Similar trends of increases were
observed for treatments containing 75 and 100% depulped beans. However, the moisture
content of the undepulped cocoa beans and the 25% depulped beans decreased from 5.60%
and 6.24% at the start of fermentation to 5.09% and 5.29% at the end of
fermentationrespectively (Table 4). With the exception of cocoa beans depulped at 50%
which recorded high moisture content of 9.55% at the end of fermentation, all the depulped
samples however, recorded moisture content within acceptable limits (6 to 7 %) for safe
keeping during storage (Wood and Lass, 1985; Dand, 1997).
Depulping caused a marginal increase in the moisture content of freshly harvested
unfermented cocoa beans. It increased from 5.60% for the undepulped beans to 5.90% for the
100% depulped beans.All levels of depulped beans (0, 25, 50, 75 and 100%) recorded
moisture content within acceptable limits (7 to 8 %) for safe keeping during storage. The
moisture content of 7 to 8% is necessary to avert possible spoilage when beans are stored for
a protracted period (Wood and Lass, 1985; Dand, 1997).Findings from this work suggest that
increasing depulping and fermentation had an increasing effect on moisture
content.Analysisof the data revealed that both depulping and fermentation time
University of Ghana http://ugspace.ug.edu.gh

56
significantly(p<0.05) affectedthe moisture content. However, there was no statistical
significance at p>0.05 between samples containing 25 - 0% and 100 –75% depulped beans
(Table 5).
Moisture content increase at the initial stages of fermentation is due to the break down
of the cell wall which increases permeability and facilitates enzymatic processes however, the
apparent increases in moisture with respect to increasing depulping might have been due to
the absorption of moistureby semi dried beans from the humid fermenting mass as by the end
of fermentation 50, 75 and 100% depulped beans werealmost dried.
4.1.1.2 Ash
Depulping of cocoa beans caused a slight increase in the ash content of the cocoa
beans.With the exception of samples containing 50% depulped beans, which decreased in
ash, depulping generally, increased the ash content.It increased from 2.60% in samples
containing 0% depulped beans to 2.92% in samples containing 75% depulped beans by the
sixth (6th
) day of fermentation.Fermentation time had a decreasing effect on the ash content.
Samples containing 0% depulped beans had their ash content decrease from 3.10% at the start
of fermentation to 2.60% at the end of fermentation. Similar decreases occurred in samples
containing 50% and 100% depulped beans. The decrease in the ash content was consistent for
all levels of depulped beans at the end of fermentation (Table 4).
Both fermentation time and depulping had significant(p<0.05)effecton the ash content
(Table 5). ANOVA showedsignificant differences between the 0% depulped beans and all the
other levels of depulped beans. However, there was no statistical significance (p>0.05)
between samples containing 25, 50 and 100% depulped beans.
The ash content shows that depulping does not adversely affect the mineral content
and it is comparable to that of the other pulp pre-conditioning process. It is important to note
that the minerals contained in chocolates contribute to good cardiac health.
University of Ghana http://ugspace.ug.edu.gh

57
4.1.1.3 Protein
Protein content decreased consistently with fermentation time. The protein content
decreased drastically from 16.23% at the beginning of fermentation to 13.64% by the sixth
(6th) day of fermentation for the 0% depulped beans. Protein reduction was consistent with
increasing fermentation time in samples containing 25 to 100% depulped beans (Table 4).
Depulping of cocoa beans causes a slight increase in protein content. Protein content for 0%
depulped beans was 13.64% while samples containing 25, 50, 75 and 100% had 13.79, 15.08,
14.11 and 15.04% respectively at the end of fermentation (Table 4). The observed decrease in
protein content with depulping and fermentation time might be as a result of protein
hydrolysis or deamination by native proteases to amino acids and peptides and partly by
conversion to insoluble forms by the action of polyphenols (Minifie, 1970; Afoakwa and
Paterson 2010).Biochemically, the formation of melanoidins via maillard reactions could also
have caused a reduction in the protein content. According to Lopez and Dimick (1995),
although proteolysis generates peptides and amino acids, usually there is a net decrease
intotal nitrogen due to the loss of soluble nitrogencompounds by exudation through thetesta
(Spencer and Hodge, 1992; Voigt et al., 1993) and this could have been exacerbated via the
agitation of the seeds through the action of the mechanical depulper hence the lower protein
content reported.
Fisher‟s LSD conducted showed that there were significant differences between
samples containing 0 – 25% and 0 – 100% depulped beans. There was also a significant
(p<0.05) interaction between fermentation time and the depulping on the protein content
(Table 5). This means that the combined effect ofdepulping and fermentation had a greater
effect on protein break down than depulping alone.
University of Ghana http://ugspace.ug.edu.gh

58
Table 4: Proximate composition of whole and mechanically depulped beans
Depulped Beans
(%)
Fermentation
Time (Days) Moisture (%) Ash (%) Fat (%) Protein (%) Carbohydrate (%)
0
0 5.60 ± 0.13 3.10 ± 0.07 53.63 ± 1.46 16.23 ± 0.16 27.03 ± 1.23
2 6.73 ± 0.24 2.34 ± 0.31 40.75 ± 2.53 16.43 ± 0.19 40.48 ± 2.65
4 6.66 ± 0.17 1.86 ± 0.36 42.74 ± 0.91 15.77 ± 0.33 39.64 ± 0.88
6 5.09 ± 0.02 2.60 ± 0.02 48.86 ± 3.67 13.64 ± 0.19 34.91 ± 3.84
25
0 6.24 ± 0.12 2.85 ± 0.39 45.39 ± 0.99 16.21 ± 0.27 35.56 ± 0.33
2 6.55± 0.01 3.92 ± 0.45 41.35 ± 1.97 16.12 ± 0.21 38.61 ± 2.63
4 5.99 ± 0.33 2.63 ± 0.00 40.03 ± 3.79 14.44 ± 0.18 42.90 ± 3.61
6 5.29 ± 0.03 2.88 ± 0.38 47.16 ± 0.92 13.79 ± 0.18 36.17 ± 1.11
50
0 4.97 ± 0.40 4.18 ± 0.03 32.72 ± 1.03 15.85 ± 0.26 47.25 ± 0.80
2 7.79 ± 0.06 3.75 ± 0.02 36.30 ± 2.23 15.99 ± 0.10 43.95 ± 2.31
4 6.85 ± 0.06 2.93 ± 0.37 39.64 ± 0.97 15.23 ± 0.42 42.20 ± 0.93
6 9.55 ± 0.57 2.48 ± 0.42 36.19 ± 5.71 15.08 ± 0.08 46.26 ± 5.37
75
0 5.97 ± 0.16 2.92 ± 0.39 49.09 ± 1.15 15.97 ± 0.20 32.02 ± 0.56
2 7.82 ± 0.01 3.78 ± 0.00 29.31 ± 0.53 16.10 ± 0.01 50.81 ± 0.52
4 6.68 ± 0.14 2.93 ± 0.39 51.49 ± 2.93 15.53 ± 0.52 30.05 ± 2.02
6 6.65 ± 0.11 2.92 ± 0.38 37.07 ± 0.74 14.11 ± 0.32 45.89 ± 1.44
100
0 5.90 ± 0.15 3.42 ± 0.37 41.90 ± 0.99 15.90 ± 0.07 38.78 ± 0.69
2 6.32 ± 0.20 3.46 ± 0.37 30.82 ± 3.31 15.45 ± 0.00 50.27 ± 3.68
4 6.42 ± 0.16 2.67 ± 0.01 55.13 ± 1.40 14.90 ± 0.02 27.31 ± 1.39
6 8.17 ± 0.22 2.70 ± 0.00 33.01 ± 3.28 15.04 ± 0.27 49.26 ± 3.55
*Protein (N x 6.25) and **Carbohydrate was calculated by difference.
The results presented above are on dry matter basis and mean values of duplicate analyses ± standard deviations
University of Ghana http://ugspace.ug.edu.gh

59
4.1.1.4 Fat
The fat content of the cocoa beans showed varied composition with both
increasing fermentation time and depulping. It decreased from 53.63% at the start of
fermentation to 48.86% at the end of fermentation for the undepulped beans (Table 4).
Similar trends of decreases were observed for treatments depulped by 75% and 100%.
Fat content however increased slightly at the start of fermentation from 45.39–47.16%
and 32.72–36.19% at the end of fermentation for 25% and 50% depulped samples
respectively (Table 4).
Increasing depulping caused a reduction in the fat content of the unfermented
cocoa beans. It decreased from 53.63% (freshly harvested undepulped beans) to
41.90% in the 100% depulped beans. The fat content also decreased from 48.86% in
0% depulped beans to 33.01% for samples containing 100% depulped beans at the
end of fermentation (Table 4). Presumably,there was someinterplay existing between
fat and carbohydrate as the two chemical variants are inversely related. Most
microorganisms especially bacteria convert fat/lipids to carbohydrate via
gluconeogenesis (Nelson and Cox, 2004).It has also been reported by earlier
researchers that pod stored beans with smaller bean sizes and weights usually have
lower fat composition (Wood and Las, 1985; Dand, 1997).
Analysis of the data showed that both fermentation time and level of
depulping as well as the interaction between fermentation time and depulping
significantly affected (p<0.05) the fat content of the cocoa beans (Table 5). Further
analysis using Fisher‟s LSD revealed that samples containing 25 – 75% and 75 –
100% depulped beans had no significant difference.
University of Ghana http://ugspace.ug.edu.gh

60
Table 5: ANOVA summary table showing F-ratios for variations in proximate
composition of depulped and fermented cocoa beans
Variables Protein Fat Carbohydrate Ash Moisture
Main Effects
A: Depulped Beans
B: Fermentation Time
2.65
121.63*
22.30*
37.86*
15.43*
30.28*
8.90*
20.40*
52.56*
78.80*
Interaction
A x B
5.00*
15.65*
15.82*
4.36*
48.78*
* Significant at P<0.05
4.1.1.5 Carbohydrate
Depulping of cocoa beans caused an increase in total carbohydrates. Samples
containing higher levels of depulped beans recordedhigher carbohydrate content. At
the end of the fermentation period, samples containing 0 to 100% depulped beans
increased from 34.91 to 49.26% respectively and this was consistent for all other
levels of depulping. Increasing fermentation timealso increased the carbohydrate
content of the cocoa beans. Carbohydrate content ranged from 27.03% at the start of
fermentation to 34.91% by the sixth (6th
) day of fermentation with 0% depulped
beans. Similar trends were observed with samples containing 25 to 100% depulped
beans.
Theapparentinverse relationship between the levels offat and total
carbohydrate in fermenting cocoa might be as a result of conversion of fat to
carbohydrate via gluconeogenesis. Gluconeogenesis is an aerobicprocess with starting
points of amino acids, Krebs cycle intermediates, or fattyacids (Nelson and Cox,
2004; Afoakwa et al., 2011a). Depulping of cocoa beans acts to reduce pulp content
University of Ghana http://ugspace.ug.edu.gh

61
and thus leads to the creation of easy airflow, which might have increased the rate of
gluconeogenesis during the later part of fermentation (i.e. days 4 and 6). This pathway
normally operatesin microorganisms especially in bacteria (Lee, 1975; Nelson and
Cox, 2004).
ANOVA results showed that fermentation time and depulping caused
significant (p<0.05) increasein carbohydrate content of the beans (Table 5). Fisher‟s
LSD revealed thatsamples containing 25 – 75% and 75 – 100% depulped beans were
not statistically significant at p>0.05 (Table 4).
Overall the chemical changes due to mechanical depulping might have a
positive impact on cocoa bean quality as the moisture, proteins and ash were within
acceptable limits however the fat content were much lower and might affect the
quantity and quality of cocoa liquor hence chocolate production.
4.1.2 Mineral content of depulped and fermented cocoa beans
The effects of mechanical depulping as a means of pulp preconditioning and
fermentation on the mineral composition of cocoa beans are shown in Tables 6 and 8.
Generally, there were decreases in some of the micronutrients with depulping and
fermentation time but there were slight increases in others.
4.1.2.1 Potassium (K)
Fermentation time caused decreases in the potassium (K) content of the
depulped cocoa beans.Potassium decreased from 1000.43 mg/100g at the start of
fermentation to 718.18 mg/100g at the end of fermentation of the 0% depulped beans.
Similar decreasing trends were observed for samples containing 25, 50, 75 and 100%
depulped beans (Table 6). Depulping hadonly marginal effect on the potassium
content. Potassium remained fairly constant with increasing levels of depulping.
Samples containing 50, 75 and 100% depulped beans recorded 765.77, 761.94 and
University of Ghana http://ugspace.ug.edu.gh

62
763.33 mg/100g of potassium at the end of fermentation (Table 6). This suggests that
the mineral content for that matter potassium is located within the cotyledon of the
cocoa beans hence depulping had marginal effect.
These high values suggest that the cocoa might have been planted in soils with
high potassium that translated into the cocoa beans and this corroborates findings by
Afoakwa et al. (2011a) where potassium was the highest mineral in pod stored and
fermented cocoa beans. Potassium plays a vital role in human nutrition. It helps to
maintain electrolyte balance and also regulate heart rhythms, stabilize blood pressure
and reduce the occurrence of strokes (Nelson and Cox, 2004).
Analysis of variance on the data showedthat fermentation time decreased the
potassium content significantly(p<0.05) (Table 8).Fishers LSD showed that sample
containing 0 – 25%, 25 – 50%, 25 – 75% and 25 – 100% depulped beans were
statistically different.Enzymatic activity within the cotyledon of the cocoa beans must
have accounted for the reduction in potassium content with the progression of
fermentation.
4.1.2.2 Magnesium (Mg)
Magnesium content decreased with increasing fermentation time. Magnesium
decreased from 387.33 and 391.28 mg/100g from day 0 to 281.86 and 292.04
mg/100g in samples containing 0% and 100% depulped beans respectively at the end
of fermentation (Table 6).
Depulping had marginal effect on the magnesium content. Magnesium
remained fairly constant with increasing levels of depulping. Samples containing 0,
50 and 100% depulped beans had 281.86, 296.80 and 292.04 mg/100g respectively at
the end of fermentation. Magnesium content showed no increase or decrease with
increasing depulping.
University of Ghana http://ugspace.ug.edu.gh

63
It is generally known in medical and nutritional literature that magnesium is a
vital anti-stress mineral, which also promotes cardio-protective properties, bone and
tooth integrity (Nelson and Cox, 2004; Belitzet al., 2009). Magnesium and potassium
are known to have synergistic effect on human health. Its depletion causes a decrease
in both cellular and extracellular potassium(Belitzet al., 2009).
ANOVA revealed that fermentation time caused a significant (p<0.05)
decrease in magnesium content (Table 8). Post hoc ANOVA analyses showed that
samples containing 0 – 25%, 25 – 50%, 25 – 75% and 25 – 100% depulped beans
were statistically similar.
4.1.2.3 Calcium (Ca)
Calcium increased with the progression of fermentation (Table 6). As
fermentation timeincreased, calcium increased drastically from 640 mg/100g to
1657.76 mg/100g in samples containing 25% depulped beans at the end of
fermentation. Similar to the other minerals the enzymatic activities with the cotyledon
might have contributed to the increment. Similar trends of increment were observed in
calcium for samples containing 50 to 75% depulped beans. Calcium increased from
1704.40 mg/100g at the beginning of fermentation to 1839.53 mg/100g in samples
containing 50% depulped beans. Similar increases from 1903.86 mg/100g to 2145.34
mg/100g were observed in samples containing 75% depulped beans.
Depulping generally caused increases in calcium composition. There were
general increases in calcium content for samples containing 0 to 100% depulped
beans.Increasing levels of depulped beans from 0% to 25% caused increases in
calcium from 412.38 mg/100g to 1657.76 mg/gby the end of fermentation.Agitation
of the depulper might have facilitated the disruption of the cellular integrity that
caused enzyme substrate interaction therefore leading to the increase in calcium
University of Ghana http://ugspace.ug.edu.gh

64
content. Calcium is essential in bone formation and in maintaining the structure of the
osseous tissues.
ANOVA showed that fermentation time and depulping significantly (p<0.05)
increased the calcium content of the beans (Table 8). LSD post hoc analysis showed
that only 0 and 100% depulped beans were similar but the others were different.
4.1.2.4 Phosphorus (P)
Phosphorus content of the cocoa beans decreased marginally with depulping.
Phosphorus levels decreased from 4.20 mg/100g to 3.41mg/100g in samples
containing 0% and 50% depulped beans respectively by the end of fermentation
(Table 6).
Fermentation time caused marginal decreases in phosphorus content.
Increasing fermentation time resulted in decreases in phosphorus content. Phosphorus
decreased from 4.61 mg/100g at the beginning of fermentation to 4.20 mg/100g at the
end of fermentation for 0% depulping. Similar marginal decreases were observed for
samples containing 25, 50 and 100% depulped beans. Phosphorus decreased from
3.58 mg/100g at the start of fermentation to 3.24 mg/100g by the end of fermentation
in samples containing 25% depulped beans.
Phosphorus is one of the abundant macro-minerals in our bodies. Nutritionally
phosphorus and calcium have a synergistic effect on human health. Calcium is
essential in bone formation and in maintaining the structure of the osseous tissues in
combination with phosphorus. It is also imperative to note that the mineral content of
the cocoa beans might vary according to that of the soils in which the cocoa was
grown(Belitz et al., 2009).
ANOVA analysis shows revealed that both fermentation time and depulping
significantly (p<0.05) decreased the phosphorus content (Table 8). However LSD was
University of Ghana http://ugspace.ug.edu.gh

65
used to separate the means and 25–50% and 100–75% depulped beans were
statistically similar.
4.1.2.5 Copper (Cu)
Depulping caused slight increasesin copper content (Table 6).Samples
containing 0% depulped beans had relatively lower copper content of 8.23mg/100g.
However, those with 25% depulped beans had higher copper content of 16.90
mg/100g by the sixth day of fermentation. Similarly, samples containing 75%
depulped beans had comparatively lower copper content of 13.75 mg/100g than in
samples containing 100% depulped beanswhich had 20.95 mg/100g in samples.
Fermentation time caused both increases and decreases in copper content.
Copper increased from 9.83 mg/100g to 16.90 mg/g in samples containing 25%
depulped beans. Similar increment with fermentation time was observed for samples
containing 75 and 100% depulped beans. However, copper content decreased with
fermentation time for samples containing 0 and 50% depulped beans. At the end of
fermentation copper decreased from 18.02 mg/100g in samples containing 50%
depulped beans.
Copper is a component of a number of oxidoreductaseenzymes (tyrosinase,
phenolase, uricase, amine oxidase) of which polyphenol oxidase (PPO) is a part.
Copper ionsas a prosthetic group of PPO participate in several redox reactions
(Chazarra et al., 1999). Polyphenoloxidase of Neurospora crassa containstwo copper
atoms, each of which is ligandedto three histidine residues. Copper acts as an
activator for the polyphenoloxidase activity and is requiredin oxygen binding during
polyphenol oxidation. Reduction in polyphenols due to enzymatic degradation of
polyphenols during fermentation might have cause a slight increase in copper content
with increasing depulping and fermentation time. Copper is also known to be less
University of Ghana http://ugspace.ug.edu.gh

66
desirable during food processing and storage since it catalyzesmany unwanted
reactions (Belitzet al., 2009).
ANOVA analysis showed that both depulped beans and fermentation time at
had significant (p<0.05) increasing or decreasing effect on copper content (Table 8).
However LSD analysis revealed that 25–75 – 50% depulped beans were the same.
4.1.2.6 Zinc (Zn)
Fermentation caused marginal decreases in zinc content (Table 6) as duration
of fermentation period inceased. Zinc reduced from 7.97 mg/100g at the start of
fermentation to 7.18 mg/100g at the end of fermentation in samples containing 25%
depulped beans. Similar trends in reduction were observed for samples containing 50
to 100% depulped beans with increasing fermentation time.
Depulping caused both marginal increases and decreases zinc content. Zinc
increased slightly from 7.06 mg/100g in 0% depulped beans to 7.18 mg/100g in
samples containing 25 % depulped beans (Table 6). There was a reduction in zinc
from 8.02 mg/100g in samples containing 75% depulped beans to 6.98 mg/g in
samples containing 100% depulped beans. Since zinc is also a common component of
a number of enzymes the low values obtained might have been as a result of the
utilization of zinc by numerous enzymes.Depulping of cocoa beans caused both
significant (p<0.05) increase and decrease in zinc content (Table 8). LSD analysis
revealed that there were statistical differences between samples containing 0 – 75%,
25 – 75% and 50 – 75% depulped beans.
University of Ghana http://ugspace.ug.edu.gh

67
Table: 6. Mineral content of depulped fermented cocoa beans (mg/100g)
Depulped
beans
(%)
Fermentation
time
(Days)
K Ca Mg P Cu Zn Fe
0
0
2
4
6
1000.43 ± 53.03
956.19 ± 15.57
784.66 ± 61.96
718.18 ± 10.75
310.58 ± 84.42
414.04 ± 104.47
365.61 ± 149.53
412.38 ± 111.22
387.33 ± 1.86
388.39 ± 5.38
325.55 ± 31.98
281.86 ± 1.14
4.61 ± 0.23
4.72 ± 0.08
4.82 ± 0.20
4.20 ± 0.06
9.52 ± 0.34
5.44 ± 1.72
2.07 ± 1.66
8.23 ± 1.01
7.03 ± 0.09
6.57 ± 0.11
8.03 ± 0.92
7.06 ± 0.66
5.12 ± 0.82
5.32 ± 0.31
6.18 ± 2.05
4.99 ± 0.33
25
0
2
4
6
943.09 ± 1.95
920.34 ± 29.81
717.67 ± 44.98
631.71 ± 3.99
640.30 ± 35.32
759.72 ± 63.86
933.64 ± 153.00
1657.76 ± 29.09
365.81 ± 9.02
339.82 ± 1.78
286.29 ± 19.78
262.23 ± 1.74
3.58 ± 0.08
4.31 ± 0.13
3.40 ± 0.12
3.24 ± 0.02
9.83 ± 0.18
7.83 ± 6.22
7.91 ± 2.59
16.90 ± 0.43
7.97 ± 0.41
6.89 ± 0.54
6.82 ± 0.25
7.18 ± 0.35
7.47 ± 2.97
6.78 ± 2.50
6.34 ± 0.87
8.25 ± 0.55
50
0
2
4
6
1013.27 ± 14.62
947.66 ± 10.61
805.94 ± 77.08
765.77 ± 46.07
1704.40 ± 125.97
1247.59 ± 85.13
1642.21 ± 102.68
1839.53 ± 119.00
356.66 ± 9.83
360.73 ± 8.84
328.08 ± 25.91
296.80 ± 15.25
3.74 ± 0.31
4.16 ± 0.32
3.75 ± 0.13
3.41 ± 0.23
18.02 ± 0.91
9.74 ± 3.13
6.12 ± 0.16
13.02 ± 1.18
7.85 ± 0.06
7.92 ± 0.56
7.27 ± 0.67
6.86 ± 0.20
8.66 ± 1.20
7.17 ± 2.75
7.49 ± 0.59
5.54 ± 1.24
75
0
2
4
6
971.97 ± 6.02
975.68 ± 21.65
839.96 ± 12.93
761.94 ± 1.87
1903.86 ± 146.60
2223.55 ± 155.27
1952.50 ± 55.06
2145.34 ± 56.95
363.31 ± 0.63
369.52 ± 6.90
319 66 ± 3.59
288.05 ± 0.08
3.49 ± 0.03
4.07 ± 0.46
4.23 ± 0.04
4.65 ± 0.18
13.64 ± 7.63
10.06 ± 4.19
8.58 ± 2.67
13.75 ± 7.57
10.70 ± 1.64
9.08 ± 0.05
7.67 ± 0.03
8.02 ± 1.17
5.10 ± 0.55
10.20 ± 5.63
5.39 ± 0.39
5.98 ± 1.71
100
0
2
4
6
978.34 ± 3.47
908.93 ± 28.16
773.29 ± 76.62
763.33 ± 29.14
146.55 ± 4.88
227.58 ± 79.08
402.25 ± 1.94
495.08 ± 102.25
391.28 ± 23.21
370.40 ± 7.99
311.52 ± 13.88
292.04 ± 7.02
4.36 ± 0.10
4.12 ± 0.01
4.07 ± 0.48
3.85 ± 0.08
16.86 ± 3.66
17.04 ± 2.67
15.35 ± 0.91
20.95 ± 0.61
7.77 ± 0.39
11.06 ± 5.00
7.73 ± 0.25
6.98 ± 0.12
9.10 ± 0.01
10.83 ± 0.71
9.03 ± 1.30
10.02 ± 1.18
University of Ghana http://ugspace.ug.edu.gh

68
4.1.2.7 Iron (Fe)
Irongenerally increasedwith depulping of cocoa beans. At the end of
fermentation, iron increased from 4.99 mg/100g in 0% depulped beans to 8.25
mg/100g in samples containing 25% depulped beans (Table 6). A similar increasing
trend occurred in samples containing 50, 75 and 100% depulped beans.
Fermentation time caused slight fluctuations iron content. Increasing
fermentation time caused an increase in iron content from 7.47 mg/100g at the
beginning of fermentation to 8.25 mg/100g at the end of fermentation for samples
containing 25% depulped beans. There were also increases in iron content with
increasing fermentation time occurring in samples containing 75 and 100% depulped
beans (Table 6).
Theiron contentsby day 6 of 0, 25, 50, 50, 75 and 100% were 4.99, 8.25, 5.54,
5.98 and 10.02 mg/100g respectively (Table 6).Iron metals are also present in a
number of enzymes (peroxidase, catalase and hydroxylases).
ANOVA revealed that depulping caused significant (p<0.05) increase in the
iron content. Fishers LSD showed that there were statistical differences between
samples containing 0 – 100%, 25 – 100%, 50 – 100% and 75 – 100% depulped beans.
University of Ghana http://ugspace.ug.edu.gh

69
Table: 7. ANOVA summary table showing F-ratios for variations in mineral composition of depulped and fermented cocoa beans
Variables K Ca Mg P Cu Zn Fe
Main Effects
A: Depulped Beans
B: Fermentation Time
6.85*
111.89*
465.99*
27.99*
6.98*
102.14*
24.63*
6.77*
11.36*
8.28*
2.90*
1.85
5.65*
0.85
Interaction
A x B
1.13
9.29*
1.52
5.73*
0.90
1.43
1.07
*Significant at P<0.05
University of Ghana http://ugspace.ug.edu.gh

70
4.2 Effect of mechanical depulping on Physico-chemical and biochemical
composition of Ghanaian cocoa beans during fermentation
4.2.1 Pulp volume
The cocoa pulpis a substrate rich in nutrients, which apart from serving as
substrate for microbial activity, can be used inindustrial processes for by-product
manufacture (Schwan and Wheals, 2004; Afoakwa, 2010).Microorganisms can readily
ferment cocoa pulp within 4 to 6 days of fermentation and thus results in a successive
reduction in pulp volume. Pulp volume decreased from 44.89% at the start of
fermentation to 20.82% at the end of fermentation in undepulped beans (figure 6). The
decrease in pulp volume was consistent for samples containing 25, 50, 75 and 100%
depulped beans.With increasing fermentation time, pulp volume decreased in samples
containing 25% depulped beans from 39.60% at the beginning of fermentation to
17.89% at the end of fermentation.
Depulping of cocoa beans caused drastic reduction in pulp volume (Figure 6).
Pulp volume decreased from 20.82% in undepulped beans to 8.35% in samples
containing 100%depulped beans at the end of fermentation.The reduction in pulp
volume during fermentation can be attributed to the higher level of pulp reduction by
the action of the depulper hence the remainder of the pulp might have been depleted at
a faster rate due to the proliferation of microorganisms.
University of Ghana http://ugspace.ug.edu.gh

71
Figure 6:Percentage (%) pulp reduction of cocoa beans
Regression analysis on the data showedsignificant (p<0.05) influence of the
linear factors of depulped beans and fermentation time on the pulp volume. Also the
quadratic effect of depulping had a significant effect on the pulp volume. The model
developed could explain approximately 92% of the variations in pulp volume (Table
9).
4.2.2 pH
Depulping of cocoa beans causes marginal decrease in pH as showed in the
response plot (Figure 7). The pH decreased from 6.5 to 6.3 for samples containing 0%
to 100% respectively at the beginning of fermentation.Depulping caused a slight
increase in pH from 5.7 at the end of fermentation in 0% depulped beans to 6.02 at the
0
5
10
15
20
25
30
35
40
45
50
0 2 4 6
PU
LP
RE
DU
CT
ION
(%
)
FERMENTATION TIME (DAYS)
0%
25%
50%
75%
100%
University of Ghana http://ugspace.ug.edu.gh

72
end of fermentation in samples containing 100% depulped beans. This explains
thatincreasing depulping ratios reduces the levels of acidity in the beans.
As fermentation progressed the pH of the fermenting cocoa beans decreased.
The pH decreased from 6.5 the start of fermentation to 5.7 at the end of fermentation in
samples containing 100% depulped beans (Figure 7). The pH also decreased from 6.4
at the beginning of fermentation to 5.4 at the end of fermentation in samples containing
50% depulped beans. Decreases in pH were consistent for the samples containing 25,
75 and 100% depulped beans.
These observations are inagreement with previous report, which considered pod
storage as a means of pulp pre-conditioning by Biehl et al. (1985). Henoted that there
was diffusion of acids (predominantlyacetic acid) in the fermenting bean leading to
decreasein the pH of the cotyledon from 6.5 to 4.6 within thefirst 3 days of
fermentation and then increased to5.2 by the sixth day of fermentation.
Several authors have reported the reductions in pH during cocoa fermentation.
Volatileacids (acetic, propionic, butyric, isobutyric andisovaleric) and non-volatile
acids (citric, lactic, malic,succinic, oxalic and tartaric) develop in the pulp by
microorganisms, which diffuse into the cotyledon, andresult in the reduction in the pH
of the beans (Schwan and Wheals 2004; Afoakwa 2010; Afoakwa 2011b).The problem
of acid beans might be effectively resolved by influencing microbial activity through
mechanical depulpingof pulp prior to fermentation.
University of Ghana http://ugspace.ug.edu.gh

73
Figure 7: Response surface plot showing the effects of depulping and
fermentation time on the pH of cocoa beans
Regression analysis showedthat the linear and quadratic factors of depulped
beans and fermentation time caused significant (p<0.05) reductionin pH (Table 9). The
model developed could explain over 85% of the variations in pH (Table 9).
4.2.3 Titratable acidity
Organic acids have a pronounced impact on food flavourand quality. Usually,
in acetic acid fermentations such as cocoa fermentation systems, it is important to
know how much acidity comes from the acetic acidand how much is contributed
naturally by other acids in the system (Nielsen, 2010).
5.5
6.0
025
5075
6.5
2
0100
4
2
6
pH
Fermentation Time (Days)
Depulped Beans (%)
University of Ghana http://ugspace.ug.edu.gh

74
Figure 8: Response surface plot showing the effects of depulping and
fermentation time on the titratable acidity (mg/g) of cocoa beans
Fermentation caused increases in titratable levels.The Titratable acidity
increased from 0.37 mg/g at the start of fermentation to 2.98 mg/g by the fourth (4th
)
day of fermentation in samples containing 0% depulped beans. Titratable acidity also
increasedfrom 1.79 mg/g from the beginning of fermentation to 3.49 mg/g by the
fourth (4th
)day of fermentation in samples containing 75% depulped beans. The
increases in titratable acidity were consistent with all samples containing 0 to 100%
depulped beans as shown in the response surface plot (Figure 8).
However therewere slight decreases in titratable acidity from the forth day
(2.98 mg/g) to the end of fermentation to(2.59 mg/g) in undepulped beans. Titratable
acidity also reduced from 2.88 mg/g on the fourth day of fermentation to 1.06 mg/g at
the end of fermentation in samples containing 100% depulped beans.
0
1
2
025
5075
0
3
6
4
2
0100
Titratable acidity (mg/g)
Fermentation Time (Days)
Depulped Beans (%)
University of Ghana http://ugspace.ug.edu.gh

75
Table: 8. Regression coefficients and their R2 values in the models for pH, Titratable acidity, pulp volume, free fatty acids, total, non-
reducing and reducing sugars of cocoa beans
Variables pH Titratable acidity Pulp volume FFA Total sugars Non-reducing sugars Reducing sugars
Constant 6.55998* -0.30184 45.1738* 1.92991* 1071.86* 881.143* 190.722*
X1 -0.01092* 0.05021* -0.2259* -0.06619* 6.37* 5.284* 1.088*
X2 -0.58348* 1.44344* -3.9627* -0.96403* 119.74* 90.352* 29.392*
X12 0.00008* -0.00033* 0.0012* 0.00053* -0.06* -0.057* -0.004
X22 0.07269* -0.16868* -0.0798 0.12035* -26.75* -24.554* -2.192*
X1 x X2 0.00087* -0.00437* -0.0074 0.01641* -0.28 -0.074 -0.208*
R2 0.8533 0.8469 0.9216 0.8686 0.7317 0.712 0.6083
X1: Depulped Beans and X2: Fermentation Time
*Significant at P<0.05.
University of Ghana http://ugspace.ug.edu.gh

76
The surface plot also revealed that depulping of cocoa beans causes increases
in titratable acidity up to the fourth day of fermentation then a decrease till the end of
fermentation (Figure 8).Several authors have reported that during cocoa fermentation,
total acidity (volatile and non-volatile acids) develops as a result of microbial activity
(Schwan and Wheals 2004; Afoakwa 2010; Afoakwa 2011b).
Titratable acidity (total acidity) provides an estimate ofthe total acid content of
a food because food systems often contain many acidsthat cannot be differentiated
through titration (Nielsen, 2010).The regression analysis showed that both the
quadratic effects of depulped beans and fermentation time hadsignificant (p<0.05)
influence on titratable acidity (Table 9). The regression model explained about 85%
of the variations in pH.
4.2.4 Changes in total sugars
The response surface plot revealed that fermentation caused a reduction in
total sugar content. Total sugar content decreased with increasing fermentation time
(Figure 9). At the start of fermentation total sugars increased from 1139.37mg/g at the
beginning of fermentation in 0% depulped beans to 1268.94 mg/g by the fourth day of
fermentation. However there was a decrease from 1268.94 mg/g by the fourth day to
715.57mg/g in 0% depulped beans at the end of fermentation (Figure 9). Similar
trends were observed for all samples containing 25%, 50%, 75% and 100% depulped
beans.
University of Ghana http://ugspace.ug.edu.gh

77
Figure 9: Response surface plot showing the effects of depulping and
fermentation time on the total sugar (mg/g) content of cocoa beans
Depulping of cocoa beans led to an increase in total sugar content during
fermentation. The decreasing effect of fermentation of total sugars was as a result
ofreduction in non-reducing sugars by theaction of native cocoa seed invertase, which
hydrolyzessucrose into glucose and fructose during fermentation (Lopez and Dimick,
1995; Hansen et al., 2000; Thompson et al., 2001).
Samples containing 0% to 75% depulped beans had an increase in total sugar
content at the end of fermentation. Total sugar increased from 715.57 mg/g in 0%
depulped beans to 929.96 mg/g in samples containing 25% depulped beans at the end
of fermentation. The increasing trend was similar to samples containing 50 and 75%
depulped beans, which increased from 965.97 mg/g to 1020.50 mg/g at the end of
800
1000
025
5075
100
1200
1400
2
0100
4
6
Total Sugars (mg/g)
Fermentation Time (Days)
Depulped Beans (%)
University of Ghana http://ugspace.ug.edu.gh

78
fermentation respectively. However samples containing 100% depulped beans
decreased at the end of fermentation (Figure 9).
The trends observed are similar to previous findings by Afoakwa et al.
(2011b), howevertheir investigations were based on pod storage as pulp pre-
conditioning.The sucrose concentrationin the unfermented beans generally
comprisedabout 90% of the total sugars, whereas both fructose and glucose made up
about 6% (Thompson et al., 2001). Total sugar content apart from being produced
from carbohydrate,glucose, arabinose and galactose in the fermentingseed, they may
also arise by hydrolysisof the anthocyanins and polymeric phenolicglycosides (Lee,
1975; Thompson et al., 2001; Afoakwa et al., 2011b). Form the plot it is evident that
the rate of total sugars degradation in the cocoa beans is largely affected by
fermentation than depulping.
The regression analysis showed that the linear factors of depulped beans and
fermentation time had significant (p<0.05) influence on thetotal sugar content (Table
9). Both the quadratic effects of depulped beans andfermentation time had significant
influence on total sugars. The regression model explained 73% of the variations in the
total sugar content caused by depulping and fermentation time (Table 9).
4.2.5 Changes in non-reducing sugars
Fermentation caused a drastic decrease in non-reducing sugar content of the
cocoa beans. At the start of fermentation non-reducing sugars increased from 982.04
mg/g at the beginning of fermentation in 0% depulped beans to 1000.30 mg/g by the
fourth day of fermentation. However there was a decreased from 1000.30 mg/g by the
fourth day to 410.62 mg/g in 0% depulped beans at the end of fermentation (Figure
10). Similar trends were observed for all samples containing 25%, 50%, 75% and
100% depulped beans (Figure 10).
University of Ghana http://ugspace.ug.edu.gh

79
Figure 10: Response surface plot showing the effects of depulping and
fermentation time on non-reducing sugars (mg/g) of cocoa beans
Depulping of cocoa beans caused an increase in non-reducing sugar content.
Samples containing 0% to 75% depulped beans had increases in non-reducing sugar
content at the end of fermentation. The non-reducingsugarcontent increased from
410.62 mg/g in 0% depulped beans to 756.25 mg/g in samples containing 75%
depulped beans at the end of fermentation.However there was a decrease in non-
reducing sugar from 756.25 mg/g in samples containing 75% depulped beans to
162.39 mg/g in samples containing 100% depulped beans at the end of fermentation
(Figure 10).
Theresponse surface plot shows the combined effects of depulping and
fermentation on the non-reducing sugar content in cocoa beans. Increase in DB
resulted in marginal increase intotal sugar concentrations form 0 to 100%. It was also
400
600
800
025
5075
10001000
2
0
100
6
4
2
Non reducing sugars (mg/g)
Fermentation Time (Days)
Depulped Beans (%)
University of Ghana http://ugspace.ug.edu.gh

80
observed that within the first 2 days of fermentation however there was a sharp
increase in non-reducing sugars but followed with a consistent decrease from day 4 to
day 6 of fermentation. This decrease in non-reducing sugars with increasing
fermentation time can be associated with hydrolyses of non-reducing sugars (sucrose)
by the enzyme invertase (Thompson et al., 2001).
Regression analysis of the data showed that both thelinear effects of depulped
beans and fermentation time significantly(p<0.05) influenced the non-reducing
sugars. The quadratic effect of fermentation time also had a significant effect on the
non-reducing sugars (Table 9). The R2 obtained was 71%, indicating that depulped
beansand fermentation could have contributed to 71% of the changes in non-
reducingsugars and 29% of the variation was due to other factors not included in the
model.
4.2.6 Reducing sugars
In contrast to total and non-reducing sugars, reducing sugars usually increase
after the death of the beans and attains its maximum concentrationsafter 4 days of
fermentation, and remains fairly constant until the end of thefermentation (Thompson
et al., 2001). The response surface plot (Figure 11) showed that fermentation
generally caused an increase in reducing sugars. The reducing sugars increasedwith
increasing fermentation time. Reducing sugar increased from 157.33 mg/g at the start
of fermentation to 304.95 mg/gbysixth day of fermentation in 0% depulped beans
while there was also an increase from 225.89 mg/g at the beginning of fermentation to
274.11 mg/g at the end of fermentation in samples containing 25% depulped beans.
Depulping caused a slight decrease in reducing sugar content as shown in the
response plot (Figure 11). The reducing sugars decreased from 304.95 mg/g in the 0%
depulped beans to 274.11 mg/g in samples containing 25% depulped beans. There
University of Ghana http://ugspace.ug.edu.gh

81
was a similar decrease in reducing sugar from 264.25 mg/g in samples containing
75% depulped beans to 250.22 mg/g in samples containing 100% depulped beans.
This is however the normal trend with cocoa fermentation systems. During
fermentation of thecocoa beans there is the hydrolysis of non-reducing sugars to yield
reducing sugars, which are flavour precursors (Lopez and Dimick, 1995; Afoakwa,
2010).
Figure 11: Response surface plot showing the effects of depulping and
fermentation time on the reducing sugars (mg/g) of cocoa beans
Regression analysis of the data showed that thelinear effects of depulped
beans and fermentation time were significant atp<0.05 (Table 9). The model could
explain 61% (R2) of the variations in reducing sugars.
200
225
250
025
5075
200
225
250
275
6
4
2
0100
Reducing sugars (mg/g)
Fermentation T ime (Days)
Depulped Beans (%)
University of Ghana http://ugspace.ug.edu.gh
82
4.2.7 Free fatty acid
Free fatty acids (FFA) are significant forthe quality of the oil because they
increase the oils susceptibility to oxidation, contribute bitter and soapy off-flavours in
chocolate and cocoa butter (Dand, 1997; Wrolstadet al., 2005).
The response surface plot (Figure 12) showed that fermentation caused an
increase in FFA content. As fermentation increased there was an increase in FFA.
FFA content increased from 0.26% at start of fermentation to 0.89% at the end of
fermentation in 0% depulped beans. Similar increasing trends were observed for all
samples containing 25 to 100% depulped beans. The highest FFA increased from
0.56% at the beginning of fermentation to 10.66% at the end of fermentation in
samples containing 100% depulped beans.
Depulping also caused an increase in FFA content. The increase in FFA with
increasing depulping might be as a result of the cellular disruption that allowed free
enzyme substrate interaction during the agitation of the cocoa beans via the depulper.
The FFA content increased from 0.89% in 0% depulping to 0.94% in samples
containing 25% depulped beans. FFA also increased from 1.55% in samples
containing 50% to 10.66% in samples containing 100% depulped beans.Free fatty
acids indicate the breakage of theester bond between the fatty acid and the
glycerolbackbone, releasing the fatty acid. The increase of FFA observedcan be
attributed to the presence of lipases during fermentation. Lipases are not only native
to the cocoa bean but also introduced by microorganisms.
University of Ghana http://ugspace.ug.edu.gh

83
Figure 12: Response surface plot showing the effects of depulping and
fermentation time on the free fatty acid (%) content of cocoa beans
Increasing trends of FFA observed for samples containing 50%, 75% and
100% depulped beans from the second (2nd
) day through to the end of fermentation,
could also be associated with the development of Bacillus species that accounts for
80% of the microbial population during the later stages of fermentation (Thompson et
al., 2001) is favouredby an increased aeration (largely due to the break down and
liquefaction of pulp by microorganisms and also the facilitation of the process by
mechanical depulping), increased pH (3.5 to 5.0)of the pulp, and an increase in
temperature to 45 to 50°C all of which are very characteristic of the fermenting mass
from the 2nd
to the 6th
day of fermentation. According to Thompson et al. (2001)short
chain (C3, C4, and C5) free fatty acids, which are predominant in the fermenting mass
0.0
2.5
5.0
025
5075
7.5
2
0100
4
2
6
1.75FFA (%)
Fermentation Time (Days)
Depulped Beans (%)
University of Ghana http://ugspace.ug.edu.gh

84
during the aerobic phase, may contribute to the development of some of the off-
flavours.
Regression analysis also showed thatthe linear and quadratic factors of
depulped bean and fermentation time had significant (p<0.05) influence on the FFA
content (Table 9). The R2 could explain 87% of the variations in FFA content while
the remaining 13% were not included in the model.
University of Ghana http://ugspace.ug.edu.gh

85
4.3 Effect of Mechanical Depulping on the Polyphenolic Compounds
Concentration, Degree of Fermentation and Appearance Properties of Cocoa
Beans
4.3.1 Total polyphenols
Total polyphenols decreased with increasing fermentation for all levels of
depulping as shown in the response surface plot (Figure 13). Total polyphenolic
content decreased from 31.29 mg/gat the start of fermentation to 22.23 mg/gat the end
of the fermentation process in undepulped beans.The polyphenolic content also
decreased from 28.98 mg/g to 19. 9 mg/g in samples containing 50% depulped beans.
There was consistent decrease from 33.02 mg/gto 21.47 mg/g in samples containing
100% depulped beans at the end of fermentation.Results from this study suggested
that fermentation of cocoa beans leads to loss of total polyphenols in fermented cocoa
beans.Due to the bitter and astringency of cocoa beans, fermentation is necessary to
reduce it to appreciable contents.
Depulping on the other hand caused a marginal reduction in total polyphenols.
It reduced from 22.23 mg/g in 0% depulped beans to 19.9 mg/g in samples containing
25% depulped beans at the end of fermentation. There was also a decrease from 15.47
mg/g in samples containing 50% depulped beans to 8.76 mg/g in samples containing
75% depulped beans. But there was a sharp increase from 8.76 mg/g in samples
containing 75% depulping to 21.47 mg/g in samples containing 100% depulped beans
at the end of fermentation.
University of Ghana http://ugspace.ug.edu.gh

86
Figure 13: Response surface plot showing the effects of depulping and
fermentation time on total polyphenolic (mg/g) contents of cocoa beans
Hydrolysis of polyphenols is important during fermentation since there is an
inverse relationshipbetween the flavour development andthe purple color retained
after fermentation (Lopez and Dimick, 1995; Nazaruddin, 2006; Afoakwa et al.,
2012b). Polyphenol oxidase (PPO) becomes active during the aerobic phase of
fermentationas a result of oxygen permeating the beans.
This cannotonly be attributed to the oxidation process but also caused by
diffusingof polyphenols into fermentation sweatings (Kimand Keeney, 1984). The
reduction will drastically lower the level ofastringency in the cocoa bean. The
changes in total polyphenols during fermentation as shown in Figure 13, the reduction
in pulp volumemight have facilitated the oxidation and polymerization of polyphenols
to high molecular compounds such as insoluble tannins.
15
20
25
025
5075
15
20
30
2
0100
6
4
2
6
Total Polyphenols (mg/g)
Fermentation Time (Days)
Depulped Beans (%)
University of Ghana http://ugspace.ug.edu.gh

87
Regression analysis also showed thatthe linear and quadratic factors of
depulped beans and fermentation time had significant (p<0.05) influence on the
polyphenolic content of the cocoa beans (Table 10). The R2 could explain 77% of the
variations in total polyphenol content.This study indicates that samples containing
25%, 50% and possibly 75% depulped beans(pulp pre-conditioning) could create
optimum conditions for the degradation of total polyphenols.
4.3.2 O-diphenols
O-diphenols decreased with increasing fermentation for all levels of depulping
as shown in the response surface plot (Figure 14). O-diphenols content decreased
from 59.92 mg/gat the start of fermentation to 47.95 mg/gat the end of the
fermentation process in 0% depulped beans.O-diphenols content also decreased from
49.94 mg/g to 32.68 mg/g in samples containing 50% depulped beans; there was
consistent decrease from 51.55 mg/g to 28.64 mg/g in samples containing 100%
depulped beans at the end of fermentation.Results from this study suggested that
fermentation of cocoa beans leads to loss in O-diphenols in fermented cocoa beans.
Depulping on the other hand caused a slight reduction in O-diphenols. O-
diphenols reduced from47.95 mg/g in 0% depulped beans to 44.46 mg/g in samples
containing 25% depulped beans at the end of fermentation. There were also decreases
from 32.68 mg/g in samples containing 50% depulped beans to 28.64 mg/g in samples
containing 100% depulped beans
University of Ghana http://ugspace.ug.edu.gh

88
Figure 14: Response surface plot showing the effects of depulping and
fermentation time on the o-diphenol (mg/g) content of cocoa beans
Due to the anaerobic nature of the polyphenol oxidase (PPO) reaction, oxygen
requiredfor the catalytic processes that lead to hydroxylationof monophenol to o-
diphenoland oxidation ofo-diphenol to highly reactive o-quinone is highly favoured
among the depulped beans due to the reduction of pulp volume via the action of the
depulper and the oxidation is further exacerbated by the liquefaction of pulp by the
action of microorganisms with the progression of fermentation. This allows more air
current flow within the fermenting mass, which aids the reaction of PPO, which in
turn non-enzymatically polymerise into brown pigments. The PPO is also affected by
the pH of the medium, with an optimum pH of 6 at about 31.5 – 34.5˚C (Chazarra et
al., 1999), the pH of the fermenting bean was between 5.7 at the end of fermentation
in undepulped beans to 6.02 at the end of fermentation in samples containing 100%
depulped beans.
30
40
50
025
5075
30
40
50
60
2
0100
6
4
2
6
O-diphenols (mg/g)
Fermentation Time (Days)
Depulped Beans (%)
University of Ghana http://ugspace.ug.edu.gh
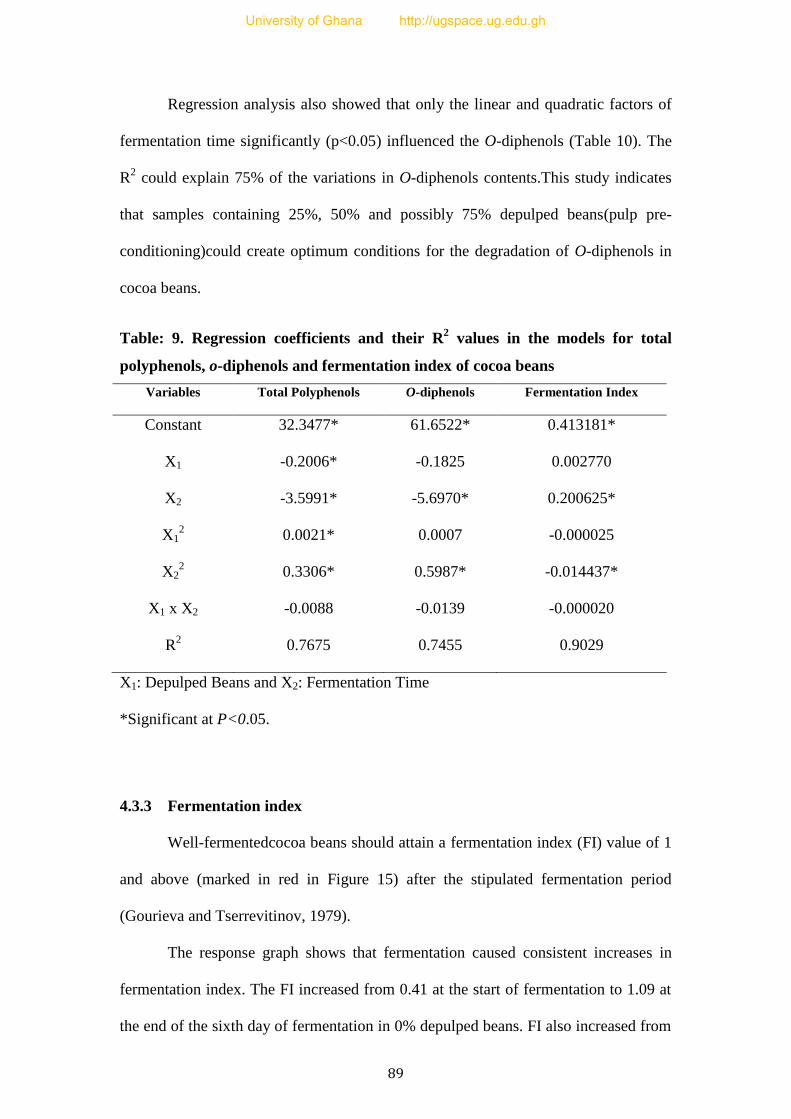
89
Regression analysis also showed that only the linear and quadratic factors of
fermentation time significantly (p<0.05) influenced the O-diphenols (Table 10). The
R2 could explain 75% of the variations in O-diphenols contents.This study indicates
that samples containing 25%, 50% and possibly 75% depulped beans(pulp pre-
conditioning)could create optimum conditions for the degradation of O-diphenols in
cocoa beans.
Table: 9. Regression coefficients and their R2 values in the models for total
polyphenols, o-diphenols and fermentation index of cocoa beans
Variables Total Polyphenols O-diphenols Fermentation Index
Constant 32.3477* 61.6522* 0.413181*
X1 -0.2006* -0.1825 0.002770
X2 -3.5991* -5.6970* 0.200625*
X12 0.0021* 0.0007 -0.000025
X22 0.3306* 0.5987* -0.014437*
X1 x X2 -0.0088 -0.0139 -0.000020
R2 0.7675 0.7455 0.9029
X1: Depulped Beans and X2: Fermentation Time
*Significant at P<0.05.
4.3.3 Fermentation index
Well-fermentedcocoa beans should attain a fermentation index (FI) value of 1
and above (marked in red in Figure 15) after the stipulated fermentation period
(Gourieva and Tserrevitinov, 1979).
The response graph shows that fermentation caused consistent increases in
fermentation index. The FI increased from 0.41 at the start of fermentation to 1.09 at
the end of the sixth day of fermentation in 0% depulped beans. FI also increased from
University of Ghana http://ugspace.ug.edu.gh

90
0.46 at the beginning of fermentation to 1.22 at the end of fermentation in samples
containing 25% depulped beans. These increases in FI were consistent for all levels of
depulped beans (Figure 15).
Figure 15: Response surface plot showing the effect of depulping and
fermentation time on the fermentation index of cocoa beans
Depulping of cocoa beans had marginal effect on fermentation index. FI was
fairly constant with an increase from 1.09 in 0% depulped beans to 1.22 in samples
containing 25% depulped beans at the end of fermentation. The FI also reduced from
1.24 in samples containing 50% depulped beans to 0.98 in samples containing 75% of
depulped beans. To a large extent all depulped beans but especially 0%, 25%, 50%
and 100% depulped beansobtained FI of one (1) by the forth (4th
) day of fermentation
(Table 11).This could be attributed to the rapid degradation of polyphenols during the
0.50
0.75
025
5075
0.50
0.75
1.00
1.25
2
0100
6
4
2
6
1
Fermentation Index
Fermentation Time (Days)
Depulped Beans (%)
University of Ghana http://ugspace.ug.edu.gh
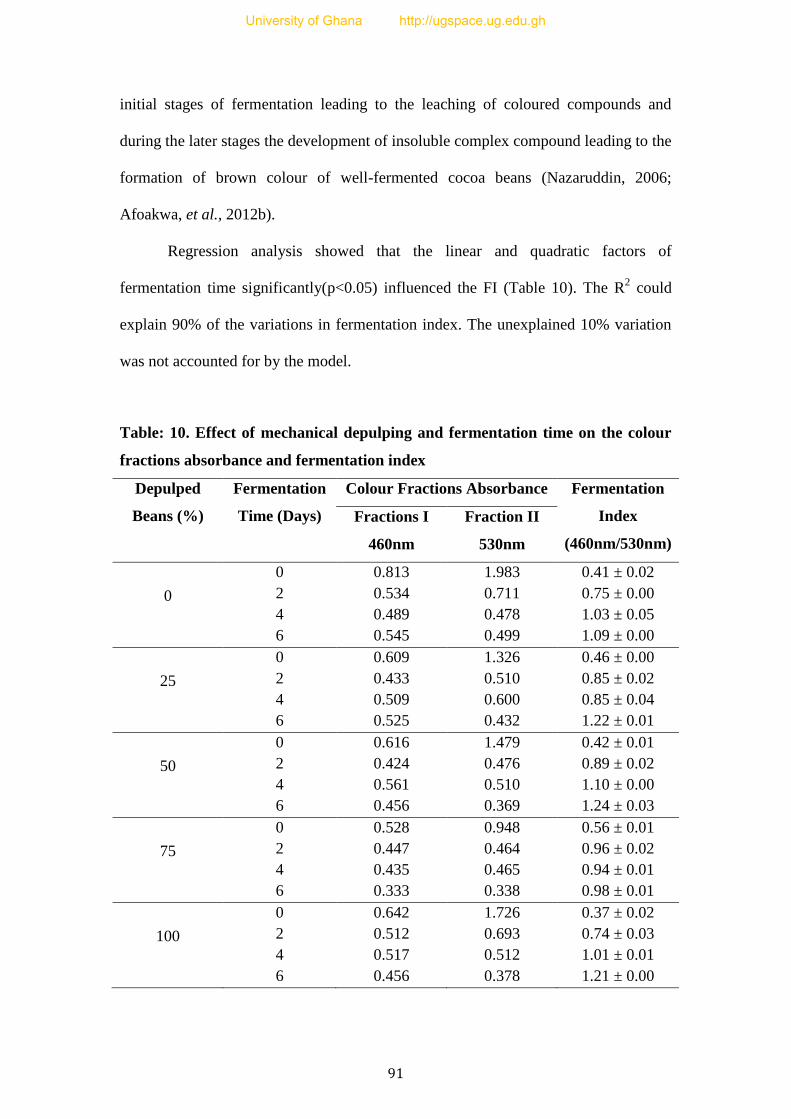
91
initial stages of fermentation leading to the leaching of coloured compounds and
during the later stages the development of insoluble complex compound leading to the
formation of brown colour of well-fermented cocoa beans (Nazaruddin, 2006;
Afoakwa, et al., 2012b).
Regression analysis showed that the linear and quadratic factors of
fermentation time significantly(p<0.05) influenced the FI (Table 10). The R2 could
explain 90% of the variations in fermentation index. The unexplained 10% variation
was not accounted for by the model.
Table: 10. Effect of mechanical depulping and fermentation time on the colour
fractions absorbance and fermentation index
Depulped
Beans (%)
Fermentation
Time (Days)
Colour Fractions Absorbance Fermentation
Index
(460nm/530nm)
Fractions I
460nm
Fraction II
530nm
0
0
2
4
6
0.813
0.534
0.489
0.545
1.983
0.711
0.478
0.499
0.41 ± 0.02
0.75 ± 0.00
1.03 ± 0.05
1.09 ± 0.00
25
0
2
4
6
0.609
0.433
0.509
0.525
1.326
0.510
0.600
0.432
0.46 ± 0.00
0.85 ± 0.02
0.85 ± 0.04
1.22 ± 0.01
50
0
2
4
6
0.616
0.424
0.561
0.456
1.479
0.476
0.510
0.369
0.42 ± 0.01
0.89 ± 0.02
1.10 ± 0.00
1.24 ± 0.03
75
0
2
4
6
0.528
0.447
0.435
0.333
0.948
0.464
0.465
0.338
0.56 ± 0.01
0.96 ± 0.02
0.94 ± 0.01
0.98 ± 0.01
100
0
2
4
6
0.642
0.512
0.517
0.456
1.726
0.693
0.512
0.378
0.37 ± 0.02
0.74 ± 0.03
1.01 ± 0.01
1.21 ± 0.00
University of Ghana http://ugspace.ug.edu.gh

92
4.3.4 Colour
Increasing fermentation caused a decrease in lightness (L).The lightness
decreased from 24.00 at the beginning of fermentation to 21.71 at the end of
fermentation in 0% depulped (undepulped) beans. There was also a decrease from
23.81 at the start of fermentation to 22.22 after fermentation in samples containing
50% depulped beans (Table 12). Generally, the cocoa samples became darker with
increasing fermentation time.
Depulping also caused slight decreasein the lightness (L) of the cocoa beans.
The L reduced from 24.05 in samples containing 25% depulped beans to 23.81 in
samples containing 50% depulped beans at the start of fermentation (Table 12).
Fermentation caused slight increase in the a-value of the cocoa beans (Table
12) with the exception of sixth day of fermentation which decreased. The a-value
increased from 7.37 at the start of fermentation to 8.12 by the fourth day of
fermentation in 0% depulped beans. The increment was consistent for all levels of
depulped beans.
Depulping had a varied influence on the a-value of cocoa beans. The a-value
remained fairly constant for all levels of depulped beans. Depulping caused an
increase in redness from 7.68 in 0% depulped beans (undepulped) to 8.10 in samples
containing 25% depulped beans at the end of fermentation. It also decreased from
8.47 in samples containing 75% depulped beans to 7.07 in samples containing 100%
depulped beans at the end of fermentation (Table 12).
This might be due to the hydrolysis of anthocyanins by Glycosidases (β-
gaiactosidase) to 3-β-D galactosidyl cyanidin and 3-α-L-arabinosidyl cyaniding
causing a reduction in purplish colour.
University of Ghana http://ugspace.ug.edu.gh

93
Table: 11. Colour of cocoa beans with respect to depulping and fermentation
time
Depulped
Beans (%)
Fermentation Time
(Days) L* a* b*
0
0
2
4
6
24.00 ± 0.05
21.90 ± 0.02
21.56 ± 0.02
21.71 ± 0.02
7.37 ± 0.06
8.67 ± 0.08
8.12 ± 0.14
7.68 ± 0.06
2.56 ± 0.11
2.55 ± 0.09
3.28 ± 0.14
2.59 ± 0.14
25
0
2
4
6
24.05 ± 0.05
21.94 ± 0.02
21.18 ± 0.02
21.32 ± 0.00
7.85 ± 0.18
9.45 ± 0.12
8.01 ± 0.02
8.10 ± 0.04
2.23 ± 0.13
2.51 ± 0.14
2.06 ± 0.09
2.88 ±0.06
50
0
2
4
6
23.81 ± 0.06
23.11 ± 0.02
23.05 ± 0.03
22.22 ± 0.04
7.64 ± 0.04
9.63 ± 0.07
9.58 ± 0.08
7.62 ± 0.07
2.28 ± 0.12
3.61 ± 0.09
3.41 ± 0.13
3.66 ± 0.07
75
0
2
4
6
21.37 ± 0.08
23.34 ± 0.00
21.06 ± 0.05
23.49 ± 0.02
8.86 ± 0.05
9.08 ± 0.14
7.87 ± 0.09
8.47 ± 0.09
2.59 ± 0.11
3.96 ± 0.16
2.27 ± 0.20
3.76 ± 0.11
100
0
2
4
6
23.91 ± 0.02
22.47 ± 0.04
22.44 ± 0.02
22.44 ± 0.03
7.30 ± 0.07
8.72 ± 0.30
8.73 ± 0.07
7.07 ± 0.14
1.68 ± 0.09
2.77 ± 0.17
3.11 ± 0.15
3.90 ± 0.18
Increasing fermentation caused an increase in the b-value of the cocoa beans.
The b-value increased from 2.56 at the start of fermentation to 2.59 at the end of
fermentation in 0% depulping (undepuled). Similar increasing b-value with
fermentation time was observed for all samples containing 25%, 50%, 75% and 100%
depulped beans.
This can be attributed to excessive loss of polyphenols via diffusing via
exudates and also enzymatic oxidation by polyphenoloxidase in the beans. It is
evident that at the end of fermentation, cocoa beans became darker, less reddish and
less yellowish.
University of Ghana http://ugspace.ug.edu.gh

94
Colour of the cocoa beans come as result of complex chemical reactions
which can only take place at the end of a carefully and well-conductedfermentation
process. The different precursor molecules in the nib of the cocoa bean oxidize and
condense to form insoluble compounds called tannins that provide the brown colour
of a well-fermented bean.
Bleaching andsubsequent browning of the beans has also been reported by
earlier researches (Lopez and Dimick, 1995; Thompson et al., 2001; Nazaruddin,
2006; Afoakwa et al., 2012a). However, the values obtained were far lower than that
of pod stored beans as pulp pre-conditioning as illustrated by Afoakwa (2012a). The
breakdown of the flavonoids (anthocyanins), which normally imparts the purple
colour to under-fermented cocoa beans leads to a rather darker colour since
anthocyanins are highly affected by pH. The colours range from purple in a neutral
state, violet in weak alkaline solutions and pink in acidic conditions (Lee, 1975;
Konczak and Zhang, 2004).
Analysis of variance (Table 13) revealed that all factors (depulping and
fermentation) significantly (p<0.05) influenced the lightness (L), redness (a) and
yellowness (b).
Table: 12. ANOVA summary table showing F-ratios for variations in colour of
depulped and fermented cocoa beans
Variables L* a* b*
Main Effects
A: Depulped Beans
B: Fermentation Time
1601.07*
5803.57*
105.05*
504.57*
79.40*
199.06*
Interaction
A x B
2214.11*
80.23*
53.26*
* Significant at P<0.05
University of Ghana http://ugspace.ug.edu.gh

95
4.4 Influence of Mechanical Depulping on the Acidification, Browning index,
Anthocyanins, Colour and FFA during Drying of Fermented Ghanaian Cocoa
Beans
4.4.0 Introduction
After fermenting the depulped cocoa beans,on the sixth day, the depulped beans were
transferred from the heap onto raised bamboo mats. The beans were spread thinly on
the mats under sufficient sunlight for six day with regular mixing to ensure uniform
drying.
4.4.1 Acidification
4.4.1.1 pH
Dryingcaused a slight increase in pH from 5.46 by the fourth (4th
) day of
fermentation in 0% depulped beans to 5.78by the fourth (4th
) day of fermentation in
samples containing 100% depulped beans. The pH also increasedfrom 5.46in 0%
depulped beans to 5.77 in samples containing 100% depulped beans at the end of
drying.This explains thatincreasing levels of depulping reduces the levels of acidity in
the beans.
Drying had a varying influence on the pH of the cocoa beans. The pH
decreased from 5.69 atthe start of drying to 5.46 at the end of drying in 0% depulped
(undepulped) beans (Figure 16).The decrease in pH was consistent for samples
containing 25 and 100% depulped beans with the exception of samples containing
75% depulped beans which remained constantat the beginning and at the end of
drying with a pH of 5.59. Also there was a slight increase in pH from 5.43at the
beginning of drying to 5.52 at the end of drying in samples containing 50% depulped
beans.
University of Ghana http://ugspace.ug.edu.gh

96
Figure 16: Response surface plot showing the effect of depulping and drying time
on the pH of cocoa beans
The pH of the dried cotyledon is between 5 and 6 (Thompson et al., 2001;
Becket, 2009; Afoakwa, 2010). During drying of fermented cocoa beans, moisture
content gradually decreases, making it increasinglydifficult for enzymes and
substrates to react. Enzymatic activity ceases when amoisture content of 6to 8% is
achieved (Thompson et al., 2001; Belitz et al., 2009). The drying processfavours
aerobic microorganisms, which proliferate due to high initial moisture but decreases
with moisture loss. According to Afoakwa (2010), drying reduces levels of acidity
and astringencyin cocoa nibs by decreasing the volatile acids and total polyphenols.
During dryingcell liquids move across cell walls, which is aided great by the
movement of water and leads to a rapidutilization of the surface acetic acid brings
thepH to between 5 and 6 (Thompson et al., 2001). Also due to higher air current flow
5.5
6.0
025
5075
6.5
2
0100
4
2
6
pH
Drying Time (Days)
Depulped beans (%)
University of Ghana http://ugspace.ug.edu.gh

97
with increasing level of depulping, most volatile acids might have been lost, thus
causing an increase in pH.
Regression analysis also showed thatonly the quadratic factors of drying time
and depulping significantly (p<0.05) influenced the pH of the dried beans (Table 15).
The R2 could explain half (50%) of the variations in pH. This means that other 50% of
the variation was not included in model.
4.4.1.2 Titratable acidity
Changes in titratable acidity (TA) follow anincreasing trendfor all depulped
beans (Figure 17). The total acidity of the dried beans increased with drying time. The
surface plot (Figure 17) showed titratable acidity increased from 0.77mg/g at the
beginning of drying to 0.78 mg/g at the end of drying in 0% depulped (undepulped)
beans. Also titratable acidity increased from 0.48 mg/g at the start of drying to 2.89
mg/g after drying. The increase in titratable acidity was consistent for all levels of
depulped beans.
Depulping had varied influence on the titratable acidity of the dried cocoa
beans. There was consistent increase in titratable acidity from 0.78 mg/g in 0%
depulped beans to 2.28 mg/g in samples containing 100% depulped beans at the end
of drying. But depulping increased the titratable acidity from 1.02 mg/g in 0%
depulped beans to 2.52 in samples containing 25% depulped beans. Titratable acidity
also increased from 2.15 mg/g in samples containing 50% depulped beans to 2.72
mg/g in samples containing 75% depulped beans.
This observed trend might be due to an increased aeration and high moisture
content at the initial stages of drying growth of Bacillus species (over 80% of the
microbial population) which proliferate at the later stages of fermentation and
continue during first three days of drying due to more air flow within the bean mass
University of Ghana http://ugspace.ug.edu.gh

98
and also an increased pH (averagely 5) causes an increment of several compounds
that may contribute to the total acidity of the dried cocoa.
Figure 17: Response surface plot showing the effect of depulping and drying time
on the titratable acidity (mg/g) of cocoa beans.
Reports by Wood and Lass (1985) revealed the rate of drying has animportant
bearing on the flavour and quality of the dried beans. When drying is tooslow, there is
the danger that moulds will develop and penetrate the testa whiles rapid drying may
prevent the oxidative changes being completed and this might result in excessive
build up of acidity.This is suggestive that drying must be done by day 4 to prevent
high acidity of the depulped and fermented cocoa beans.
Regression analysis (Table 15) also showed that linear and quadratic factors
for depulped beans significantly(p<0.05) influenced the titratable acidity of the dried
beans (Table 15). The R2 could explain 72% of the variations due to depulping and
fermentation time.
0
1
2
025
5075
0
2
3
2
0100
6
4
2
6
Titratable acidity (mg/g)
Drying Time (Days)
Depulped beans (%)
University of Ghana http://ugspace.ug.edu.gh

99
4.4.2 Anthocyanins
Condensationproducts of anthocyanins are usually formed during fermentation
and continue during drying. The response surface plot (Figure 18) showed that the
anthocyanins content of the beans varied significantly (p<0.05) with increasing
dryingtime for all depulped beans. It decreased from 7.60 mg/gat the start of drying to
5.35 mg/gby the fourth day of drying in 0% (undepulped) beans. It also decreased
from 6.35 at the start of drying to 6.16 mg /g by the fourth day of drying in samples
containing 25% depulped beans. However there was a slight increase in anthocyanin
content from the fourth day to the last day of drying. Anthocyanin content slightly
increased from 5.35 mg/g by the fourth day of drying to 6.19 mg/g at the end of
drying in 0% depulped beans. Similar increasing trends were also observed in samples
containing 25, 50, 75 and 100% depulped beans.
Depulping also had a varying effect on the anthocyanin content. The
anthocyanin content decreased from 6.19 mg/g in 0% depulped beans to 5.55 mg/g in
samples containing 50% depulped beans at the end of the drying period (Figure 18).
However, anthocyanin also increased from 6.74 mg/g in samples containing 75%
depulped beans to 7.48 mg/g in samples containing 100% depulped beans at the end
of the drying period.
University of Ghana http://ugspace.ug.edu.gh

100
Figure 18: Response surface plot showing the effect of depulping and drying time
on the anthocyanin content of cocoa beans
One of themost important aspects of drying is the browning of cocoa beans to
appreciable amounts. Thompson et al. (2001) noted that the anthocyanin pigment
themselves do not possess any marked flavour potential but its hydrolysis is important
to formation of desirable brown colour and the reduction of the purple colour. It also
contributes reducing sugars (galactose and arabinose) by the action of the enzyme
glycosidases. Pettipher (1985) observed that drying could reduce an
existinganthocyanin content of the beans by 13 – 44% depending on the time
offermentation.
Regression analysis (Table 15) also showed that all the factors; linear,
quadratic and interaction effects for both depulped beans and drying time significantly
(p<0.05)influenced the anthocyanin content (Table 15). However the R2 could explain
52% of the variations in the anthocyanin content.
4
5
6
025
5075
4
5
7
2
0100
6
4
2
6
Anthocyanins (mg/kg)
Drying Time (Days)
Depulped Beans (%)
University of Ghana http://ugspace.ug.edu.gh

101
4.4.3 Free fatty acid
Free fatty acid (FFA)level affects the fatstructure and thus the shelf life of
cocoa butter and other products manufactured from cocoa liquor. If severe,it causes
rancidity of the cocoa butter (EEC, 1990; Belitzet al., 2009). In dried cocoa beansFFA
should not exceed 1.75% (marked red inFigure 19).
Figure 19: Response surface plot showing the effects of depulping and drying
time on the free fatty acid (%) content of cocoa beans
The response surface plot (Figure 19) revealed that during drying there was a
marginal increase in the FFA levels. As drying progressed, there was an increase in
FFA. The FFA content increased from 0.66% at start of drying to 0.82% at the end of
drying in samples containing 25% depulped beans. Similar increasing trends were
observed for all samples containing 50% to 100% depulped beans. The highest FFA
0.5
1.0
025
5075
1.5
2
0100
4
2
6
1.75
FFA (%)
Drying Time (Days)
Depulped Beans (%)
University of Ghana http://ugspace.ug.edu.gh

102
increased from 0.42% at the beginning of dryingto 1.30% at the end of drying in
samples containing 75% depulped beans.
Depulping also caused an increase in FFA content. Increasing depulping
caused an increase in FFA. The FFA content increased from 0.70% in 0% depulping
to 0.89% in samples containing 100% depulped beans at the beginning of drying. FFA
also increased from 0.54% in 0% depulped beans to 1.12% in samples containing
100% depulped beans at the end of drying. This increasing trend was consistent with
all the levels of depulped beans (Figure 19).
The FFA content after drying was far below the stipulated 1.75% (marked red
in Figure 8) this can be attributed to short chain (C3, C4, and C5) fatty acids, which
might be predominant duringthe aerobic phase of fermentation but reduced during the
drying stages. The reduction of the short chain fatty acid might be due to their
volatility that might have been exacerbated by the heat from drying also according to
Belitz et al. (2009) carboxylic acids usually (C1 – C5) are polar hence can be
dissolved in water suggesting that majority of theses free fatty acids produced could
have been within a carbon 1 to carbon 5 (C1 – C5) range which were lost via the
reduction in moisture content during drying but higher (C6 and above) are less soluble
due to the hydrophobic nature of the alkyl chain. This also suggests that depulping
and fermentation might not cause a surge in FFA after drying hence can be employed
as an effective mechanism of pulp pre-conditioning.
Regression analysis also showed thatonly the linear and quadratic factors of
drying time and the interaction effect significantly (p<0.05) influenced the free fatty
acid content of the dried beans (Table 15) and the R2 could explain 52% of the
variations in free fatty acid content.
University of Ghana http://ugspace.ug.edu.gh

103
4.4.4 Browning index
The response plot (Figure 20) shows that drying caused a decrease in
browning index (BI). The BI decreased from 1.23 at the start of drying to 1.09 at the
end of the sixth day of drying in samples containing 25% depulped beans. BI also
decreased from 1.09at the beginning of drying to 0.88 at the end of drying in samples
containing 50% depulped beans. The increase in FI was consistent for all levels of
depulped beans (Figure 20) with the exception of 0% depulping which had a small
increase of BI from 1.02 at the start of drying to 1.05 at the end of drying (Table 14).
Figure 20: Response surface plot showing the effect of depulping and drying time
on browning index of cocoa beans
Depulping of cocoa beans had varied effect on the browning index. BI
increased from 1.05 in 0% depulped beans to 1.09 in samples containing 25%
depulped beans at the end of drying.
0.9
1.0
025
5075
100
1.1
1.2
2
0
4
6
Browning Index
1
Drying Time (Days)Depulped beans (%)
University of Ghana http://ugspace.ug.edu.gh

104
Table: 13. Effect of fermented depulped beans and drying time on the colour
fractions absorbance and browning index
Depulped
Beans (%)
Drying Time
(Days)
Colour Fractions Absorbance Browning
Index
(460nm/530nm) Fractions I
460nm
Fraction II
530nm
0
0
2
4
6
0.578
0.509
0.637
0.584
0.565
0.415
0.547
0.555
1.02 ± 0.00
1.23 ± 0.00
1.17 ± 0.00
1.05 ± 0.03
25
0
2
4
6
0.622
0.495
0.584
0.541
0.507
0.368
0.491
0.497
1.23 ± 0.01
1.35 ± 0.01
1.19 ± 0.12
1.09 ± 0.05
50
0
2
4
6
0.618
0.569
0.608
0.555
0.569
0.445
0.679
0.634
1.09 ± 0.02
1.28 ± 0.02
0.90 ± 0.03
0.88 ± 0.02
75
0
2
4
6
0.549
0.385
0.523
0.523
0.542
0.295
0.580
0.574
1.01 ± 0.03
1.31 ± 0.00
0.90 ± 0.00
0.91 ± 0.01
100
0
2
4
6
0.601
0.382
0.514
0.485
0.567
0.314
0.514
0.497
1.06 ± 0.01
1.21 ± 0.04
0.99 ± 0.00
0.97 ± 0.03
The BI also increased from 0.88 in samples containing 50% depulped beans to 0.91 in
samples containing 75% of depulped beans at the end of drying. Samples containing
0% and 25% had BI of one (1) by the forth (4th
) day of drying (Table 14).
The observed increase of BI (day 0 to 3) might have occurred as result of
continued fermentation in the early stages of drying but however this was
immediately curtailed by day 4 of drying with diminishing moisture content and
rising heat and air current flow (Table 14 and Figure 8) which culminated in the
drastic reduction of browning index. To a large extent all depulped beans were
observed to have browning index (BI) of more than 1 (one) by the forth (4th
) day of
fermentation but reduced averagely to 1 or slightly below 1 by day 4 to day 6 of
University of Ghana http://ugspace.ug.edu.gh

105
drying (Table 14). This means drying can conveniently be done for four (4) days to
achieve an average browning index of 1 (one).
Regression analysis also showed thatonly the linear and quadratic factors of
drying time and the interaction effect significantly (p<0.05) affected the browning
index of the dried cocoa beans(Table 15) and the R2 could explain only 46% of the
variations of the browning index.
Table: 14. Regression coefficients and their R2 values in the models for pH,
titratable acidity, free fatty acids, anthocyanins and browning index of dried
cocoa beans
Variables pH Titratable
acidity
Free fatty
acids
Anthocyanins Browning
Index
Constant 5.72389* 0.227709 0.698365* 7.47898* 1.14174*
X1 -0.00484 0.020883* -0.003121 -0.06690* -0.00092
X2 0.24455 0.123321 -0.110694* -1.11507* 0.07505*
X12 0.00010* -0.000211* 0.000029 0.00052* 0.00000
X22 -0.04788* 0.017366 0.019649* 0.16930* -0.01514*
X1 x X2 -0.04788 0.002126 0.000819* 0.00381* -0.00023*
R2 0.4985 0.7180 0.5184 0.5239 0.4567
X1: Depulped Beans and X2: Fermentation Time. *Significant at P<0.05.
4.4.5 Colour
Most prominent amongthe flavonoids are the anthocyanins. They are universal
plant colorantsresponsible for the red, purple, and blue hues evidentin many fruits,
vegetables, cereal grains, and flowers (Konczak and Zhang, 2004).Drying of cocoa
beans showed no distinct trendfor lightness (L), a-value and b-value for all levels of
depulped beans; 0%, 25%, 50%, 75% and 100% (Table 16).
University of Ghana http://ugspace.ug.edu.gh

106
Generally, the samples became darker (Lightness)with increasing drying time
and similar decrease was also recorded for increasing depulped beans. Lightness (L)
decreased from 22.29 in 0% depulped beans to 21.55 in samples containing 100%
depulped beans at the end of the drying period.
Table: 15. Colour of cocoa beans with respect to depulping and drying time
Depulped
Beans (%)
Drying Time
(Days) L* a* b*
0
0
2
4
6
21.15± 0.01
26.62 ± 0.01
22.16 ± 0.04
22.29 ± 0.03
7.74 ± 0.06
8.15 ± 0.08
8.02 ± 0.06
7.46 ± 0.21
2.7 ± 0.17
7.56 ± 0.09
4.16 ± 0.13
3.55 ± 0.14
25
0
2
4
6
20.39 ± 0.33
25.32 ± 0.03
21.98 ± 0.02
21.73 ± 0.01
7.29 ± 0.06
8.19 ± 0.17
8.16 ± 0.08
8.41 ± 0.11
2.41± 0.19
6.98 ± 0.19
3.87 ± 0.06
3.56 ± 0.17
50
0
2
4
6
23.44 ± 0.01
22.65 ± 0.02
23.63 ± 0.02
24.48 ± 0.01
8.68 ± 0.11
7.09 ± 0.05
8.66 ± 0.13
8.22 ± 0.05
4.13 ± 0.12
5.64 ± 2.77
3.86 ± 0.13
3.42 ± 0.01
75
0
2
4
6
23.52 ± 0.01
21.30 ± 0.01
22.66 ± 0.01
23.09 ± 0.01
8.60 ± 0.11
5.70 ± 0.10
7.88 ± 0.10
8.29 ± 0.08
4.11 ± 0.15
3.68 ± 0.18
3.82 ± 0.17
3.60 ± 0.07
100
0
2
4
6
22.82 ± 0.02
22.00 ± 0.04
22.59 ± 0.03
21.55 ± 0.03
6.93 ± 0.07
6.40 ± 0.17
7.12 ± 0.12
7.40 ± 0.06
3.56 ± 0.06
4.33 ± 0.06
3.85 ± 0.10
3.56 ± 0.01
The a-valueremained fairly constant during drying for all levels of depulped
beans. A-value marginally reduced from 7.46 in 0% depulped beans to 7.40 in
samples containing 100% depulped beans by the end of drying. This might be due
anthocyaninsthat normally imparts the purple colour to underfermented beans.
University of Ghana http://ugspace.ug.edu.gh

107
The b-value of the cocoa beans remained fairly constant with increasing
drying time and increasing depulped beans. The b-value remain constant with 3.56 in
samples containing 25% and 100% depulped beans at the end of drying.
Colour may providean indication of chemical changes in a food and food
materials,such as browning. The colour of cocoa beans at the end of drying translates
into cocoa powder, and is one of the criteria by which cocoa powder is selected is the
required colour of the endproduct. However, colour of the cocoa beans come as result
of complex chemical reactions which can only take place at the end of a carefully and
well-conductedfermentation and drying process.
Analysis of variance (Table 17) revealed that all factors (depulping and
drying) significantly (p<0.05) influenced all the colour parameters; lightness (L),
redness (a) and yellowness (b).
Table: 16. ANOVA summary table showing F-ratios for variations in colour of
depulped and dried cocoa beans
* Significant at P<0.05
Variables Browning Index L* a* b*
Main Effects
A: Depulped Beans
B: Drying Time
39.75*
141.68*
296.24*
1015.23*
229.99*
221.31*
2.67*
40.51*
Interaction
A x B
8.91*
1266.63*
125.97*
7.67*
University of Ghana http://ugspace.ug.edu.gh

108
4.4.6 Cut Test
The cut test is a qualitative standard test used to assess the suitability of cocoa
beans purchase and also for processing. Different categories: purple, purple/brown,
brown, slaty, germinated and mouldy are used in the assessment (Table 18).
Purple beans generally reduced with increasing fermentation time. Reduction
was more prominent in 0% depulped beans which decreased from 70 at the start of
fermentation to 0 at the end of fermentation. Samples containing 25%, 50% and 75%
depulped beans also recorded reduction in purple colour from 50 to 15, 17 to 19 and
31 to 12 respectively (Table 18). Samples containing 100% depulped beans reduced
from 42 at the start of fermentation to 25 purple beans at the end of fermentation
(Table 18).
Purple/brown beans, according to Minifie (1970) should make up at least 20%
of the beans with an upper limit of 50%. Samples containing 25% and 50% had no
purple beans at the end of fermentation. But samples containing 0%, 75% and 100%
depulped beans had values below 30% (Table 18). This gives a good indication that
the beans wereadequately fermented and will not give rise to bitter and astringency
since an increase in purple beans over brown beans causes an increase in astringency
(Minifie, 1970).
Brown beans were noted toincrease with increasing fermentation time from
the4th to the 6th day. Theincrement of brown beans from 0 to 90, 0 to 80, 41 to 76, 36
to 70 and 7 to 34for samples containing 0%, 25%, 50%, 75% and 100% depulped
beans respectively from start of fermentation (day 0) to the end of fermentation (Table
18). Increase inbrown beans with fermentation time can be associated with changes in
anthocyanin and oxidationproducts of the polyphenol oxidase activities which, form
brown pigments during the fermentation period.The brown pigments might also be
produced from non-enzymatic browning.
University of Ghana http://ugspace.ug.edu.gh

109
Table: 17. Effect of depulping and fermentation time on the dried cocoa beans
cut surface colour and cut test score
Depulped
Beans
(%)
Fermentation
Time
(Days)
Purple
(%)
Purple/Brown
(%)
Brown
(%)
Slaty
(%)
Germinated
(%)
Mouldy
(%)
0
0
2
4
6
70
79
9
0
0
21
18
5
0
0
73
90
30
0
0
5
0
0
0
0
0
0
0
0
25
0
2
4
6
80
11
11
15
10
6
7
0
0
68
76
80
10
15
6
5
0
0
0
0
0
0
0
0
50
0
2
4
6
17
13
11
19
8
0
7
0
41
84
77
76
34
3
5
5
0
0
0
0
0
0
0
0
75
0
2
4
6
31
11
12
12
24
10
18
17
36
76
67
70
9
3
1
1
0
0
2
0
0
0
0
0
100
0
2
4
6
42
33
30
25
20
28
27
32
7
21
33
34
31
18
8
6
0
0
2
3
0
0
0
0
Germination occurred in 75% depulped beans on day 4 and 100% depulped
beans on day 4 and 6 of fermentation (Table 18). However germination was not
recorded in any other depulped beans. This occurrence might have been to a failure of
bean death in 75 and 100% depulped beans since the pulp was insufficient to have
caused an increase in temperature and or to produce the required amounts of ethanol
to ensure killing of the beans. This suggests that higher depulping levels could lead
under-fermentation causing germination to occur.
Slaty beans decreased with both depulping and drying time. It reduced from
30 to 6, 10 to 5, 34 to 5, 9 to 1 and 31 to 6 (Table 18) from the start of fermentation to
University of Ghana http://ugspace.ug.edu.gh

110
the sixth (6th
)day of fermentation for samples containing 0%, 25%, 50%, 75% and
100% depulped beans respectively.
Mouldy beans are the most serious defects of dried cocoa beans. However
mouldy beans werenot detected in all the depulped and fermented cocoa beans (Table
18). Wood and Lass (1985) explains that moulds cause the development of off-
flavours by increasing the free fatty acid (FFA) content of the beans.
University of Ghana http://ugspace.ug.edu.gh

111
CHAPTER FIVE
5.0 CONCLUSIONS AND RECOMMENDATIONS
5.1 CONCLUSIONS
Mechanical depulping and fermentation influenced all the studied
parameters.Results from the proximate analysisshowed that protein, ash and fat
content decreased with increasing fermentation time whilst depulping did not have
any significant effects on these components. Mineral analysis showed that potassium
was the dominant mineral followed by calcium, magnesium, phosphorus, copper, zinc
and iron being the least. Fermentation progression caused a decrease in the potassium
(K) content of the depulped cocoa beans.
Changes in biochemical composition and physicochemical properties were
variable during fermentation of the depulped beans. The pH decreased from 6.5 to 6.3
for samples containing 0% to 100% respectively at the beginning of
fermentation.Depulping caused slight increases in pH from 5.7 at the end of
fermentation in 0% depulped beans to 6.02 at the end of fermentation in samples
containing 100% depulped beans. Fermentation generally caused increases in
reducing sugars. Reducing sugar increased from 157.33 mg/g at the start of
fermentation to 304.95 mg/gbythe sixth day of fermentation in 0% depulped beans.
Depulping caused slight decreases in reducing sugar content. FFA content increased
from 0.26% at start of fermentation to 0.89% at the end of fermentation in 0%
depulped beans. All the treatments (0%, 25%, 50%, 75% and 100% depulped
beans)obtainedfermentation index of one (1) by the forth (4th
) day of fermentation.
Polyphenolic compositions including total polyphenols and o-diphenols
reduced with respect to depulping and fermentation time.Total polyphenolic content
decreased from 31.29 mg/gat the start of fermentation to 22.23 mg/gat the end of the
University of Ghana http://ugspace.ug.edu.gh

112
fermentation process in 0% depulped beans.Depulping on the other hand caused a
marginal reduction in total polyphenols. It reduced from 22.23 mg/g in 0% depulped
beans to 19.9 mg/gin samples containing 25% depulped beans.
Mechanical depulping and drying had variable influence onall the studied
parameters. Depulping of cocoa beans caused an increase in pH in the fermented
beans which reduced to 5-6 during drying. Depulping caused a slight increase in pH
from 5.46 by the fourth day of fermentation in 0% depulped beans to 5.78 by the
fourth day of fermentation in samples containing 100% depulped beans. Drying had a
varying influence on the pH of the cocoa beans.
Depulping caused an increase in FFA content however the FFA content after
drying was far below the stipulated 1.75%. The anthocyanins content of the beans
varied significantly with increasing dryingtime and depulping. Drying of cocoa beans
showed no distinct trendfor lightness (L), redness (a) and yellowness (b) for all levels
of depulped beans; 0%, 25%, 50%, 75% and 100%.Both, the a-value and b-
valueremained fairly constant during drying for all levels of depulped beans.
Cut test on the samples showed that purple beans generally reduced with
increasing fermentation time. Brown beans were noted toincrease with increasing
fermentation time from the fourth to the sixth day. These findings suggest that
mechanical depulping influenced to a varying degree the chemical, biochemical and
polyphenolic content of fermented and dried Ghanaian cocoa beans.
University of Ghana http://ugspace.ug.edu.gh

113
5.2 RECOMMENDATIONS
The following proposals are being made for further research:
i. Mechanical depulping must be considered as a way of reducing acidity of
cocoa beans but must not exceed 50% level of depulping to achieve good
results.
ii. Change in flavour profile resulting from the effects of mechanical depulping
and fermentation time.
iii. Characterization of various enzymes associated with mechanical depulping
and fermentation.
iv. Microbial succession must be studied to evaluate how depulping affects their
activity during fermentation.
v. Optimization of the mechanical depulping process and its effect on chocolate
flavour quality.
University of Ghana http://ugspace.ug.edu.gh

114
CHAPTER SIX
6.0 REFERENCES
Adomako, D. (1983). Cocoa. Outlook on Agriculture, 12, 83-9.
Afoakwa, E. O. (2010). Chocolate Science and Technology.Wiley-Blackwell
Publishers, Oxford, UK. Pp 1-22.
Afoakwa, E. O. and Paterson, A. (2010).Cocoa Fermentation: Chocolate Flavor
Quality.Encyclopedia of Biotechnology in Agriculture and Food,1:1, 171 – 173.
Afoakwa, E. O., Quao, J.,Takrama, J., Budu, A. S. and Saalia, F. K. (2011a).Chemical
composition and physical quality characteristicsof Ghanaian cocoa beans as
affected by pulppre-conditioning and fermentation. Journal of Food Science
Technology,47, (1), 1 – 11.
Afoakwa, E. O., Quao, J., Budu, A. S., Takrama, J. and Saalia, F. K. (2011b).Effect of
pulp preconditioning on acidification, proteolysis, sugarsand free fatty acids
concentration during fermentation of cocoa(Theobroma cacao)
beans.International Journal of Food Sciences and Nutrition 1-10.
Afoakwa, E. O., Quao, J., Budu, A. S., Takrama, J. and Saalia, F. K.
(2012a).Influence of pulp-preconditioning and fermentation on
fermentativequality and appearance of Ghanaian cocoa (Theobroma cacao)
beans.International Food Research Journal,19, 59-66.
Afoakwa, E. O., Quao, J., Takrama, F. S., Budu, A. S. and Saalia, F. K.
(2012b).Changes in total polyphenols, o-diphenols and anthocyanin
concentrations during fermentation of pulp pre-conditioned cocoa (Theobroma
cacao) beans.International Food Research Journal, 19,(3).1071-1077.
University of Ghana http://ugspace.ug.edu.gh

115
Amoa-Awua, W., Madsen, M., Takrama, J., Olaila, A. O., Ban-Koffi, L. and
Jakobsen, M. (2006).Quality Manual for Production & Primary Processing of
Cocoa. Pp. 2 – 18.
AOAC (2005) Official methods of analysis, 18th edn. Association ofOfficial
Analytical Chemists, Washington, D.C USA
Ardhana, M. and Fleet, G. H.(2003).The microbial ecology of cocoa fermentationsin
Indonesia.International Journalof Food Microbiology,86, 87–99.
Aremu C. Y., Agiang M. A., and Ayatse J. O. I. (1995) Nutrient and anti-
nutrientprofiles of raw and fermented cocoa beans.Plant Foods Human
Nutrition, 48, 221–223.
Ashitey, E. (2012). Cocoa Report Annual – Accra. Grain Report Number GH1202
United States Department of Agriculture.
Baker, M. D., Tomlins, K. I. and Gay, C. (1994).Survey of Ghanaian cocoa farmer
fermentationpractices and their influence on cocoa flavour.Food Chemistry,51,
425-431.
Beckett, S. T. (2009). Industrial Chocolate Manufacture and Use.4TH
Ed. Blackwell
Publishing Ltd, UK. Pp. 10 – 12, 20 – 28.
Buamah, R., Dzogbefia, V. P. and Oldham, J. H. (1997). Pure yeast culture
fermentation of cocoa (Theobroma cacao L): effect on yield of sweatings and
cocoa bean quality. World Journal of Microbiology and Biotechnology,13, 457
– 462.
Biehl, B., Brunner, E., Passern, D., Quesnel, V. C. and Adomako D. (1985).
Acidification, proteolysisand flavor potential in fermenting cocoabeans, Journal
of the Science ofFood and Agriculture,36,583-598.
University of Ghana http://ugspace.ug.edu.gh

116
Biehl, B., Meyer, B., Said, M. B. & Samarakoddy, R. J. (1990). Bean spreading: a
method for pulp preconditioning to impair strong nib acidification during cocoa
fermentation in Malaysia. Journal of the Science ofFood and Agriculture,51,
35-45.
Belitz, H. D., Grosch, W., and Schieberle, P. (2009).Food Chemistry.4th Ed.
Springer-Verlag, Berlin. Pp. 173, 959 – 966.
Brummer, Y., & Cui, S. W. (2005).Understanding carbohydrate analysis. In: Food
carbohydrates: chemistry, physical properties and applications. Chapter
2.Cui, S. W. (Ed.). Taylor & Francis Group, LLC, Boca Raton pp. 1–38.
Carr, J.G., Davies, P.A. and Dougan, J. (1979).Cocoa Fermentation in Ghana
andMalaysia. Tropical Products Institute, London.
Chazarra, S., Garcia-Carmona, F. and Cabanes, J. (1999).Characterization ofmono-
phenolase activity of polyphenoloxidase from Iceberg Lettuce.Journal of
Agricultural and FoodChemistry,47, 1422-1426.
Dand, R. (1997). The international Cocoa Trade. Oxford, UK: Wiley. Pp. 25 – 51,
185 – 203.
Dias, D. R., Schwan, R. F., Freire, E. S. and dos Sandos Serodio, R.
(2007).Elaboration of a fruit wine from cocoa (Theobroma cacao L.)
pulp.International journal of Food science &Technology,42, 319 – 329.
EEC, (1990).Folin-Ciocalteu index.Official Journal of European Communities, Ch.
41. Pp. 178–179.
Egan, H., Kirk, R. S., Sawyer, R. (1990). Pearson‟s chemical analysis of foods. 8th
ed., Oxford: Churchill Livingstone.
Forsyth, W. G. C. and Quesnel, V. C. (1957), Cocoaglycosidase and colour changes
during fermentation,Journal of the Science ofFood and Agriculture,8,505-509.
University of Ghana http://ugspace.ug.edu.gh

117
Forsyrh, W. G. C. and Quesnel, V. C. (1963). Mechanismsof cocoa curing, Advance.
Enzymology,25,457-492.
Fowler, M. S. (2009). Cocoa beans: From Tree to Factory. In: Industrial Chocolate
manufacture and use.Fourth Edition.Beckett ST (eds) Wiley-Blackwell Science,
Oxford, UK. Pp 137-152.
Gálvez, S. L., Loiseau, G., Paredes, J. L., Barel, M. and Guiraud, J. P. (2007).A Study
on the microflora and biochemistry of cocoa fermentationin the Dominican
Republic.International Journal of Food Microbiology, 114,124–130.
Gourieva, K.B. and Tserrevitinov, O.B. (1979).Method ofevaluating the degree of
fermentation of cocoa beans.USSR Patent no. 646254.
Guehi, T.S., Yao, N.D., Manizan, N.P., Nevry, K.R., Koffi,L.B. and Konan, Y.M.
(2008). Comparison of the degreeof fermentation and fungal profiles of raw
cocoa beanssourced from three Ivorian main producing regions.African Journal
of Food Science,2, 112-118.
Hansen, C. E., del Olmo, M. and Burri, C. (1998). Enzyme activities in cocoa beans
during fermentation.Journal of the Science of Food and Agriculture, 77, 273–
281.
Hansen, C. E., Manez, A., Burri, C. and Bousbaine, A. (2000).Comparison of enzyme
activities involved inflavour precursor formation in unfermented beans of
different cocoa genotypes.Journal of the Science ofFood and Agriculture, 80,
1193–1198.
Hii, C. L., Law C. L., Suzannah, S., Misnawi and Cloke, M. (2009). Polyphenols in
cocoa (Theobroma cacao L.).Asian Journal of Food and Agro-Industry,2, (04),
702 – 722.
Hodge, J. (1953). Chemistry of browning reactions in model systems.Agriculture and
Food Chemistry,1,928-943.
University of Ghana http://ugspace.ug.edu.gh

118
Huber, M., Hintermann, G. and Lerch, K.(1985).Primary structure of tyrosinasefrom
Streptomyces glaucescens.Biochemistry,24, 6038-6044.
ICCO (1997).El Niño and cocoa production: an exploration of the influence of El
Niño on world cocoaproduction. A presentation by the ICCO secretariat, Cocoa
Newsletter, London: International CocoaOrganization, No.15
ICCO (2010). ICCO document: Annual report. International Cocoa Organization,
London U.K
ICCO (2012). ICCO document: ICCO Quarterly Bulletin of Cocoa Statistics, Vol.
XXXVIII, No. 2, Cocoa year 2011/12 Published: 30-05-2012.International
Cocoa Organization, London U.K
ICCO (2013). ICCO document: ICCO Quarterly Bulletin of Cocoa Statistics, Vol.
XXXVIII, No. 3, Cocoa year 2011/12 Published: 28-08-2012. International
Cocoa Organization, London U.K
IOCCC(1996).Determination of free fatty acids (FFA) contentof cocoa fat as a
measure of cocoa nib acidity.International Office of Cocoa, Chocolate and
Sugar Confectionery.Analytical Method, 42,130–136.
IRI (2009).El Niño tele-connections in Africa, Latin America and Caribbean, and
Asia Pacific: Overviewof current socio-economics and enhanced odds of
anomalous seasonal precipitation”.International Research Institute for Climate
and Society Earth Institute, Columbia.
Jonfia-Essien, W. A.(2004). Cocoa storage in Ghana. In: Hodges R. J. and Farrell G.
(Eds) Crop Post-harvest.Durables.Blackwell Science Ltd.Science and
Technology,2.
Knapp, A. W. (1937), Cocoa Fermentation: A Critical Survey of its Scientific
Aspects.Curnow,John Bale.
University of Ghana http://ugspace.ug.edu.gh

119
Knight, I. (ed). (2001). Chocolate and Cocoa: Health and Nutrition. Blackwell
Science, Oxford, UK. Pp. 10 – 40.
Konczak, I. and Zhang, W. (2004). Anthocyanins - More Than Nature‟s Colours.
Journal of Biomedicine and Biotechnology,2004, (5), 239–240.
Kim, H. and Keeney, P. G.(1984). (−)Epicatechin content in fermented
andunfermented cocoa beans.Journal of Food Science,49, 1090–1092.
Kirchhoff, P. M., Biehl, B. and Crone, G. (1989).Peculiarity of the Accumulation of
Free Amino Acids during Cocoa Fermentation.Food Chemistry,31, 295 – 311.
Lee, F. (1975).Basic Food Chemistry. The AVI publishing company, Inc.
Connecticut. Pp. 328 – 347.
Lee, K.W., Kim, Y.J., Lee, H. J. and Lee, C. Y. (2003). Cocoa hasmore phenolic
phytochemicals and a higher antioxidantcapacity than teas and red wine.
Journal of Agriculture and Food Chemistry,51, 7292.
Lehrian, D. W. and Patterson G. R. (1983). Cocoa fermentation, In: Biotechnology,
Comprehensive Treatise, vol 5, ed. by Reed G. Verlag Chemie, Basel, pp. 529–
575.
Lehrian, D. W. (1989). Recent developments in the chemistry and technology of
cocoa processing.In:Che-Man Y. B., Abdul Karim M. N. B., and Amabi, B. A.
(ed.), FoodProcessing Issues and Prospects.Faculty of Food Scienceand
Biotechnology, Universiti Pertanian Malaysia. Pp. 22-33.
Lopez, A.S., and Dimick, P. S. (1995). Cocoa fermentation In:Reed,
G.,Nagodawithana, T.W.(Eds.), Enzymes, Biomass, Food and Feed. VCH,
Weinheim, Pp. 561–577.
McDonald, C.R., Lass, R. A. and Lopez, A. S.(1981).Cocoa drying - a review.Cocoa
Growers’Bulletin,31,5-39.
University of Ghana http://ugspace.ug.edu.gh

120
Minifie, W. B. (1970). Chocolate, Cocoa and Confectionary: Science and
Technology. AVI publishing company, Inc. Pp. 1 – 25.
Misnawi, Jinap S., Jamilah, B. and Nazamid, S. (2002). Effectsof incubation and
polyphenol oxydase, enrichmenton colour, fermentation index, procyanidins
andastringency of unfermented and partly unfermentedand partly fermented
cocoa beans.International Journal of Food Science and Technology,38, 285-
295.
Mohammed, D., Asamoah, D. and Asiedu-Appiah, F.(2012).Cocoa Value Chain -
Implication for the Smallholder Farmer in Ghana.Southwest Decision Science
Institute Conference. Pp. 1041 – 1049.
Nair, K. P. P. (2010). The Agronomy and Economy of Important Tree Crops of the
Developing World.Elsevier Inc., Burlington, USA. Pp. 131, 133-136.
Nazaruddin, R., Ayub, M. Y., Mamot, S. and Heng, C. H. (2001). HPLC
determination of methylxanthinesand polyphenols levels in cocoa and chocolate
products, Malaysian Journal Analytical Science,7, 377–386.
Nazaruddin, R., Seng, L. K., Hassan, O. and Said, M. (2006).Effect of pulp
preconditioning on the content of polyphenols incocoa beans (Theobroma
Cacao) during fermentation.Industrial Crops and Products,24, 87–94.
Nelson, D. L. and Cox, M. M. (2004).Lehninger Principles of Biochemistry.4th
Ed.
W. H. Freeman & Co. Pp. 521 – 530, 544.
Nielsen, D.S., Hønholt, S., Tano-Debrah, K., Jespersen, L.(2005). Yeastpopulations
associated with Ghanaian cocoa fermentations investigatedusing Denaturing
Gradient Gel Electrophoresis (DGGE). Yeast,22, 271.
Nielsen, D. S. (2006).The microbiology of Ghanaiancocoa fermentations.PhD Thesis.
Department of Food Science, Food MicrobiologyThe Royal Veterinary and
Agricultural University, Denmark. Pp. 5, 6, 7
University of Ghana http://ugspace.ug.edu.gh

121
Nielsen, D. S., Teniola, O. D., Ban-Koffi, L., Owusu, M., Andersson, T. S. and
Holzapfel, W. H. (2007).The microbiology of Ghanaian cocoa fermentations
analysed usingculture-dependent and culture-independent methods.
International Journal of Food Microbiology,114, 168–186.
Nielsen, S. S. (2010). Food Analysis. 4th
Ed. Springer, New York. Pp. 221 – 230, 233,
235.
Osman, H., Nazaruddin, R. and Lee, S. L. (2004).Extracts of cocoa (Theobroma
cacao L.) leaves and theirantioxidation potential.Food Chemistry, 86, 41–45.
Quao, J. (2010). Effect of Pulp Pre-Conditioning on the Biochemical Quality and
Flavour Precursor Formation During Fermentation of Ghanaian Cocoa Beans.
MPhil thesis.Department of Nutrition and Food Science.Pp. 18 – 31, 37 – 41.
Rohan, T. A. (1963). Processing of raw cocoa for the market.FAO Agricultural
Studies Report, Number 60.Rome, Italy: FAO Press.
Roelofsen, P. A.(1958). Fermentation, drying, and storage of cacao beans.Advancesin
Food Research,8, 225–296.
Reineccius, G. A., Andersen, D. A., Kavanagh, T. E. & Keeney, P. G.
(1972).Identification and quantificationof the free sugars in cocoa beans.Journal
of Agriculture and Food Chemistry, 20, 199–202.
Reineccius, G. (2006). Flavour Chemistry and Technology, 2nd Ed. CRC Press.Boca
Raton, FL.
Scharbert, S., Holzmann, N. and Hofmann, T. (2004). Identificationof astringent taste
compounds by combining instrumentalanalysis and human bioresponse. Journal
of Agriculture and Food Chemistry,52, 3498.
Schieberle, P. (2000). The chemistry and technology of cocoa.In: Caffeinated
beverages. ACS Symposium Series754, 262.
University of Ghana http://ugspace.ug.edu.gh

122
Schwan, R.F., Rose, A.H., Board, R. G.(1995). Microbial fermentation of cocoabeans,
with emphasis on enzymatic degradation of the pulp.Journal of Applied
Bacteriology,79, 96S–107S (Suppl).
Schwan, R. F. and Wheals, A. E. (2004).The microbiology of cocoa fermentation and
its role in Chocolate quality.Critical Reviews in Food Science and Nutrition,44,
205 – 221.
Senenayake, M., Jansz, E. R. and Buckle, K. A.(1995). Effect of variety and
locationon optimum fermentation requirements of cocoa beans: an aid
tofermentation on a cottage scale. Journal Science of Food and Agriculture,69,
461–465.
Spencer, M. E. and Hodge, R. (1992). Cloning and sequencing of a cDNA encoding
the major storage proteinsof Theobroma cacao. Identification of the proteins as
members of the vicilin class of storage proteins.Planta,186, 567–576.
Stark, T., Bareuther, S. and Hofmann, T. (2006).Moleculardefinition of the taste of
roasted cocoa nibs (Theobroma cocoa) by means of quantitative studies
andsensory experiments.Journal of Agriculture and Food Chemistry,54,5530.
Thompson, S.S., Miller, K. B.and Lopez, A. S. (2001). Cocoa and coffee In: Doyle,
M.P., Beuchat, L.R. and Montville, T.J. (Eds.), FoodMicrobiology
Fundamentals and Frontiers. ASM Press, Washington, DC, Pp. 837-850.
Tomlins, K. I., Baker, D. M., Daplyn, P. and Adomako, D. (1993).Effect of
fermentation and drying practices on the chemical and physical profiles of
Ghana cocoa.Food Chemistry,46,257-263.
United Nations Conference on Trade and Development (2008). Cocoa Study: Industry
Structures and Competition. Prepared by Irene Musselli, associate expert,
UNCTAD, under the supervision of Olivier
Combe.UNCTAD/DITC/COM/2008/1 United Nations, Geneva.
University of Ghana http://ugspace.ug.edu.gh

123
Voigt, J., Biehl, B. and Kamaruddin, S. (1993). The major seed proteins of
Theobroma cacao L. Food Chemistry,47, 145–171.
Wood, G.A.R. and Lass, R.A. 1985. Cocoa (4th ed).Longman Group, London.
Wong, D.W.S. (1995). Food Enzymes: Structure and Mechanism.Chapman&Hall,
New York.
Wrolstad, R. E., Acree, T. E., Decker, E. A., Penner, M. H., Reid, D. S., Schwartz, S.
J., Shoemaker, C. F., Smith, D. and Sporns, P. (2005). Handbook of Food
Analytical Chemistry: Water, Proteins, Enzymes, Lipids, and Carbohydrates.
John Wiley & Sons, Inc. Pp. 475, 477 – 482.
www.goldentreeghana.com/thecompany.htm
www.cargill.com
www.adm.com/en-US/worldwide/ghana/Page/default.aspx
www.worldcocoafoundation.com
Zaibunnisa, A. H., Russly, A. R., Jinap, S., Jamilah, B. and Wahyudi, T. (2000).
Quality characteristics ofcocoa beans from mechanical fermentation.Abstracts
of 13th International cocoa Research Conference,Kota Kinabalu, Malaysia.Pp.
131.
APPENDICES
University of Ghana http://ugspace.ug.edu.gh

124
Appendix 1: Analysis of variance of proximate composition of depulped and
fermented cocoa beans
Analysis of Variance for PROTEIN - Type III Sums of Squares
Source Sum of Squares Df Mean Square F-Ratio P-Value
MAIN EFFECTS
A:Depulped Beans 0.566477 4 0.141619 2.65 0.0637
B:Fermentation Time 19.5223 3 6.50743 121.63 0.0000
INTERACTIONS
AB 3.2078 12 0.267317 5.00 0.0008
RESIDUAL 1.07 20 0.0534998
TOTAL (CORRECTED) 24.3666 39
Analysis of Variance for FAT - Type III Sums of Squares
Source Sum of Squares Df Mean Square F-Ratio P-Value
MAIN EFFECTS
A:Depulped Beans 460.083 4 115.021 22.30 0.0000
B:Fermentation Time 585.762 3 195.254 37.86 0.0000
INTERACTIONS
AB 968.673 12 80.7228 15.65 0.0000
RESIDUAL 103.158 20 5.15792
TOTAL (CORRECTED) 2117.68 39
Analysis of Variance for ASH - Type III Sums of Squares
Source Sum of Squares Df Mean Square F-Ratio P-Value
MAIN EFFECTS
A:Depulped Beans 2.7064 4 0.6766 8.90 0.0003
B:Fermentation Time 4.65457 3 1.55152 20.40 0.0000
INTERACTIONS
AB 3.98228 12 0.331857 4.36 0.0019
RESIDUAL 1.52076 20 0.0760378
TOTAL (CORRECTED) 12.864 39
Analysis of Variance for CARBOHYDRATE - Type III Sums of Squares
Source Sum of Squares Df Mean Square F-Ratio P-Value
MAIN EFFECTS
A:Depulped Beans 303.298 4 75.8245 15.43 0.0000
B:Fermentation Time 446.471 3 148.824 30.28 0.0000
INTERACTIONS
AB 933.08 12 77.7566 15.82 0.0000
RESIDUAL 98.2909 20 4.91455
TOTAL (CORRECTED) 1781.14 39
Analysis of Variance for MOISTURE - Type III Sums of Squares
Source Sum of Squares Df Mean Square F-Ratio P-Value
MAIN EFFECTS
A:Depulped Beans 9.49133 4 2.37283 52.56 0.0000
B:Fermentation Time 10.6734 3 3.5578 78.80 0.0000
INTERACTIONS
AB 26.4269 12 2.20224 48.78 0.0000
RESIDUAL 0.902942 20 0.0451471
TOTAL (CORRECTED) 47.4945 39
University of Ghana http://ugspace.ug.edu.gh

125
Appendix 2: Analysis of variance of mineral composition of depulped and
fermented cocoa beans.
Analysis of Variance for K - Type III Sums of Squares
Source Sum of Squares Df Mean Square F-Ratio P-Value
MAIN EFFECTS
A:Depulped Beans 36372.8 4 9093.2 6.85 0.0012
B:Fermentation Time 445274. 3 148425. 111.89 0.0000
INTERACTIONS
AB 18022.4 12 1501.87 1.13 0.3893
RESIDUAL 26530.8 20 1326.54
TOTAL (CORRECTED) 526200. 39
Analysis of Variance for Mg - Type III Sums of Squares
Source Sum of Squares Df Mean Square F-Ratio P-Value
MAIN EFFECTS
A:Depulped Beans 4915.24 4 1228.81 6.98 0.0011
B:Fermentation Time 53919.3 3 17973.1 102.14 0.0000
INTERACTIONS
AB 3201.97 12 266.831 1.52 0.1982
RESIDUAL 3519.26 20 175.963
TOTAL (CORRECTED) 65555.8 39
Analysis of Variance for Ca - Type III Sums of Squares
Source Sum of Squares Df Mean Square F-Ratio P-Value
MAIN EFFECTS
A:Depulped Beans 1.8526E7 4 4.63149E6 465.99 0.0000
B:Fermentation Time 834448. 3 278149. 27.99 0.0000
INTERACTIONS
AB 1.10797E6 12 92331.2 9.29 0.0000
RESIDUAL 198780. 20 9938.99
TOTAL (CORRECTED) 2.06672E7 39
Analysis of Variance for Cu - Type III Sums of Squares
Source Sum of Squares Df Mean Square F-Ratio P-Value
MAIN EFFECTS
A:Depulped Beans 514.467 4 128.617 11.36 0.0001
B:Fermentation Time 281.31 3 93.77 8.28 0.0009
INTERACTIONS
AB 122.462 12 10.2052 0.90 0.5610
RESIDUAL 226.424 20 11.3212
TOTAL (CORRECTED) 1144.66 39
Analysis of Variance for Zn - Type III Sums of Squares
Source Sum of Squares Df Mean Square F-Ratio P-Value
MAIN EFFECTS
A:Depulped Beans 18.5682 4 4.64204 2.90 0.0482
B:Fermentation Time 8.90764 3 2.96921 1.85 0.1699
INTERACTIONS
AB 27.4927 12 2.29106 1.43 0.2313
RESIDUAL 32.026 20 1.6013
TOTAL (CORRECTED) 86.9945 39
University of Ghana http://ugspace.ug.edu.gh

126
Analysis of Variance for Fe - Type III Sums of Squares
Source Sum of Squares Df Mean Square F-Ratio P-Value
MAIN EFFECTS
A:Depulped Beans 79.8863 4 19.9716 5.65 0.0033
B:Fermentation Time 9.00833 3 3.00278 0.85 0.4833
INTERACTIONS
AB 45.3197 12 3.77664 1.07 0.4328
RESIDUAL 70.7207 20 3.53604
TOTAL (CORRECTED) 204.935 39
Analysis of Variance for P - Type III Sums of Squares
Source Sum of Squares Df Mean Square F-Ratio P-Value
MAIN EFFECTS
A:Depulped Beans 4.41355 4 1.10339 24.63 0.0000
B:Fermentation Time 0.910194 3 0.303398 6.77 0.0025
INTERACTIONS
AB 3.08148 12 0.25679 5.73 0.0003
RESIDUAL 0.896036 20 0.0448018
TOTAL (CORRECTED) 9.30126 39
Appendix 3: The Physicochemical and Biochemical Composition of Depulped
and Fermented Ghanaian Cocoa Beans
Analysis of Variance for Pulp volume - Type III Sums of Squares
Source Sum of Squares Df Mean Square F-Ratio P-Value
MAIN EFFECTS
A:Depulped Beans 835.25 4 208.813 32.22 0.0000
B:Fementation Time 4653.97 3 1551.32 239.40 0.0000
INTERACTIONS
AB 323.768 12 26.9807 4.16 0.0025
RESIDUAL 129.603 20 6.48017
TOTAL (CORRECTED) 5942.6 39
Analysis of Variance for FFA - Type III Sums of Squares
Source Sum of Squares Df Mean Square F-Ratio P-Value
MAIN EFFECTS
A:Percent Depulped 76.3396 4 19.0849 2079.98 0.0000
B:Fermentation Time 76.1753 3 25.3918 2767.34 0.0000
INTERACTIONS
AB 99.0175 12 8.25146 899.29 0.0000
RESIDUAL 0.18351 20 0.0091755
TOTAL (CORRECTED) 251.716 39
All F-ratios are based on the residual mean square error.
Analysis of Variance for F pH - Type III Sums of Squares
Source Sum of Squares Df Mean Square F-Ratio P-Value
MAIN EFFECTS
A:pH.Percent Depulped Beans 0.390435 4 0.0976088 796.81 0.0000
B:pH.Fermentation Time 5.96715 3 1.98905 16237.14 0.0000
INTERACTIONS
AB 0.687265 12 0.0572721 467.53 0.0000
RESIDUAL 0.00245 20 0.0001225
TOTAL (CORRECTED) 7.0473 39
University of Ghana http://ugspace.ug.edu.gh

127
Analysis of Variance for F TA - Type III Sums of Squares
Source Sum of Squares Df Mean Square F-Ratio P-Value
MAIN EFFECTS
A:Depulped Beans 6.37225 4 1.59306 115.62 0.0000
B:Fermentation Time 27.6385 3 9.21283 668.66 0.0000
INTERACTIONS
AB 10.2037 12 0.850304 61.71 0.0000
RESIDUAL 0.275562 20 0.0137781
TOTAL (CORRECTED) 44.4899 39
Analysis of Variance for Total Sugar - Type III Sums of Squares
Source Sum of Squares Df Mean Square F-Ratio P-Value
MAIN EFFECTS
A:Percent Depulped Beans 192168. 4 48042.0 157.43 0.0000
B:Fermentation Time 1.16304E6 3 387679. 1270.43 0.0000
INTERACTIONS
AB 362432. 12 30202.7 98.97 0.0000
RESIDUAL 6103.11 20 305.155
TOTAL (CORRECTED) 1.72374E6 39
Analysis of Variance for Non Reducing - Type III Sums of Squares
Analysis of Variance for Reducing - Type III Sums of Squares
Source Sum of Squares Df Mean Square F-Ratio P-Value
MAIN EFFECTS
A:Depulped Beans 3156.18 4 789.044 26.64 0.0000
B:Fermentation Time 10489.3 3 3496.44 118.04 0.0000
INTERACTIONS
AB 21281.8 12 1773.48 59.87 0.0000
RESIDUAL 592.414 20 29.6207
TOTAL (CORRECTED) 35519.7 39
Analysis of Variance for Lightness - Type III Sums of Squares
Source Sum of Squares Df Mean Square F-Ratio P-Value
MAIN EFFECTS
A:Depulped Beans 7.42898 4 1.85724 1601.07 0.0000
B:Fermentation Time 20.1964 3 6.73214 5803.57 0.0000
INTERACTIONS
AB 30.8204 12 2.56837 2214.11 0.0000
RESIDUAL 0.0464 40 0.00116
TOTAL (CORRECTED) 58.4922 59
Source Sum of Squares Df Mean Square F-Ratio P-Value
MAIN EFFECTS
A:Depulped Beans 180233. 4 45058.3 174.46 0.0000
B Fermentation Time 1.24239E6 3 414131. 1603.44 0.0000
INTERACTIONS
AB 381970. 12 31830.8 123.24 0.0000
RESIDUAL 5165.51 20 258.276
TOTAL (CORRECTED) 1.80976E6 39
University of Ghana http://ugspace.ug.edu.gh

128
Analysis of Variance for greeness - Type III Sums of Squares
Source Sum of Squares Df Mean Square F-Ratio P-Value
MAIN EFFECTS
A:Depulped Beans 4.95228 4 1.23807 105.05 0.0000
B:Fermentation Time 17.8389 3 5.94631 504.57 0.0000
INTERACTIONS
AB 11.3464 12 0.945531 80.23 0.0000
RESIDUAL 0.4714 40 0.011785
TOTAL (CORRECTED) 34.609 59
Analysis of Variance for blueness - Type III Sums of Squares
Source Sum of Squares Df Mean Square F-Ratio P-Value
MAIN EFFECTS
A:Depulped Beans 5.14771 4 1.28693 79.40 0.0000
B:Fermentation Time 9.67912 3 3.22637 199.06 0.0000
INTERACTIONS
AB 10.36 12 0.863333 53.26 0.0000
RESIDUAL 0.648333 40 0.0162083
TOTAL (CORRECTED) 25.8352 59
Appendix 4: Effect of Mechanical Depulping on the Polyphenolic Compounds
Concentration, Degree of Fermentation and Appearance Properties of Cocoa
Beans
Analysis of Variance for Total Polyphenols - Type III Sums of Squares
Source Sum of Squares Df Mean Square F-Ratio P-Value
MAIN EFFECTS
A:Depulped Beans 250.258 4 62.5644 7.57 0.0007
B:Fermentation Time 935.132 3 311.711 37.70 0.0000
INTERACTIONS
AB 133.77 12 11.1475 1.35 0.2679
RESIDUAL 165.343 20 8.26717
TOTAL (CORRECTED) 1484.5 39
Analysis of Variance for O Diphenols - Type III Sums of Squares
Source Sum of Squares Df Mean Square F-Ratio P-Value
MAIN EFFECTS
A:Depulped Beans 1284.23 4 321.058 12.61 0.0000
B:Fermentation Time 1933.17 3 644.389 25.31 0.0000
INTERACTIONS
AB 273.313 12 22.7761 0.89 0.5665
RESIDUAL 509.106 20 25.4553
TOTAL (CORRECTED) 3999.82 39
Analysis of Variance for Fermentation Index - Type III Sums of Squares
Source Sum of Squares Df Mean Square F-Ratio P-Value
MAIN EFFECTS
A:Depulped Beans 0.0407172 4 0.0101793 23.50 0.0000
B:Fermentation Time 2.72315 3 0.907717 2095.73 0.0000
INTERACTIONS
AB 0.237594 12 0.0197995 45.71 0.0000
RESIDUAL 0.00866254 20 0.000433127
TOTAL (CORRECTED) 3.01012 39
University of Ghana http://ugspace.ug.edu.gh

129
Appendix 5: Influence of Mechanical Depulping on the Acidification, Browning
index, Anthocyanins, Colour and FFA during Drying of Fermented Ghanaian
Cocoa Beans
Analysis of Variance for Anthocyanins - Type III Sums of Squares
Source Sum of Squares Df Mean Square F-Ratio P-Value
MAIN EFFECTS
A:SP3.Depulped Beans 19.1125 4 4.77814 9.87 0.0001
B:Drying Time 24.357 3 8.119 16.77 0.0000
INTERACTIONS
AB 15.7869 12 1.31558 2.72 0.0233
RESIDUAL 9.6816 20 0.48408
TOTAL (CORRECTED) 68.9381 39
Analysis of Variance for Browning Index - Type III Sums of Squares
Source Sum of Squares Df Mean Square F-Ratio P-Value
MAIN EFFECTS
A:Depulped Beans 0.184255 4 0.0460637 39.75 0.0000
B:Drying Time 0.492611 3 0.164204 141.68 0.0000
INTERACTIONS
AB 0.123889 12 0.0103241 8.91 0.0000
RESIDUAL 0.023179 20 0.00115895
TOTAL (CORRECTED) 0.823935 39
Analysis of Variance for L - Type III Sums of Squares
Source Sum of Squares Df Mean Square F-Ratio P-Value
MAIN EFFECTS
A:Depulped Beans 6.94972 4 1.73743 296.24 0.0000
B:Drying Time 17.8629 3 5.95431 1015.23 0.0000
INTERACTIONS
AB 89.1451 12 7.42876 1266.63 0.0000
RESIDUAL 0.2346 40 0.005865
TOTAL (CORRECTED) 114.192 59
Analysis of Variance for a - Type III Sums of Squares
Source Sum of Squares Df Mean Square F-Ratio P-Value
MAIN EFFECTS
A:Depulped Beans 10.598 4 2.64951 229.99 0.0000
B:Drying Time 7.64838 3 2.54946 221.31 0.0000
INTERACTIONS
AB 17.4139 12 1.45116 125.97 0.0000
RESIDUAL 0.4608 40 0.01152
TOTAL (CORRECTED) 36.1211 59
Analysis of Variance for b - Type III Sums of Squares
Source Sum of Squares Df Mean Square F-Ratio P-Value
MAIN EFFECTS
A:Depulped Beans 4.26919 4 1.0673 2.67 0.0456
B:Drying Time 48.4937 3 16.1646 40.51 0.0000
INTERACTIONS
AB 36.711 12 3.05925 7.67 0.0000
RESIDUAL 15.9607 40 0.399018
TOTAL (CORRECTED) 105.435 59
University of Ghana http://ugspace.ug.edu.gh