Embed Size (px)
Citation preview

International Journal of Lean Thinking Volume 2, Issue 1 (June 2011)
Lean Thinkingjournal homepage: www.thinkinglean.com/ijlt
Effect of Marketing Strategy on Customer Loyalty Bajapuik Savings at PT. BPR Berok Gunung Pangilun Padang
Hery Heryanto Faculty of Economic,
Department of Managemen, West Sumatra, Indonesia Email Adres: [email protected]
A B S T R A C T K E Y W O R D S
A R T I C L E I N F O
Strategy, Marketing, Loyalty, Customer, Bajapuik Savings & BPR Gunung Pangilun.
Received 20 April 2011 Received in revised form 23 April 2011 Accepted 24 April 2011 Available online 26 April 2011
This study attempts to look and see if the marketing strategy of product, price, and location and upon promotion will affect customer loyalty bajapuik savings on PT.BPR Berok Gunung Pangilun Padang. This study uses primary data, where the object under study here is PT. BPR Berok Gunung Pangilun Padang. Total sample was 100 people taken from the 5750 population of people who gathered from 3 cash offices and 1 center office at PT. BPR Berok Gunung Pangilun Padang. The approach used to test the hypothesis of this study is multiple regression analysis, t-test f-test and anova. From the results showed that a significant difference between variables Marketing Strategies with Customer Loyalty.
1. Introduction
Developing country like Indonesia needs a stable economic situation, which will help
expedite the government's efforts in making the calculation of development planning. Stable
economic conditions that facilitate the conduct of evaluation and prediction in the development
plan. With the stable economic conditions are expected within the planning calculations will not
experience a lot of irregularities in its execution, to the world of banking is required in order to
help the national economy.
In the current banking plays a very strong in promoting and enhancing economic growth in
the country, considering the need for the role of banks in the life of modern society, not
surprisingly, many banks with a variety of genres and types of emerging surface. The increasing
population and increasing public awareness of the importance of banks in life makes the
potential development of the national banking world, the better. The main obstacle faced by
almost every banking institution is related to funding issues, considering that banking institutions
are institutions that favor the acquisition of operational funds that they use from the depositor
customer, and company policy.

A good strategy for the company's strategy is formulated through a planning process that sets
the policies together. Strategic planning can be made if the company is marketing oriented.
Marketing-oriented company, and then try to apply the marketing concept as an effort to satisfy
consumer needs and generate profits.
Marketing program is a combination of a number of marketing plans into a comprehensive
plan for the company which is the responsibility of each department to implement. Marketing plan
is a written statement from a marketing strategy that is equipped with details about the timing and
control procedures to carry out such marketing. Then a marketing plan should bring the company's
resources to be used, selecting media campaign, budgeted costs, and to determine the level of
expected sales and profits.
From the start the establishment until the present moment, PT. BPR Berok Gunung Pangilun
Padang continues to experience positive growth in both the amount of funds collected and the
amount of funds distributed to communities in need. The data below shows the development of
collector of funds (savings) community by BPR Berok Gunung Pangilun Padang.
Table 1. Savings Development PT. BPR Berok Gunung Pangilun Padang
Years Saving Deposit Total
2003 2.573.466 9.895.450 12.468.916
2004 3.851.287 13.518.000 17.369.287
2005 3.929.481 14.069.150 17.998.631
2006 4.832.234 15.280.950 20.113.184
2007 5.639.077 18.479.970 24.413.047
As an alternative placement option for consumers, PT. BPR Berok Gunung Pangilun provide
placement of funds in savings BAJAPUIK with the following conditions:
1. The process is easy and fast account opening
2. Initial deposit of at least Rp. 25.000,
3. Interest rate of 4% per year.
4. Interest is calculated based on daily balances.
5. Deposits and withdrawals can be made every working day.
6. Can be used as loan collateral.
7. Every depositor in the Include in life insurance for free.
8. Funds are guaranteed by the Deposit Insurance Agency (DIA).
H. HERYANTO/International Journal of Lean Thinking Volume 2, Issue 1 (June 2011)
60

9. Special Savings BAJAPUIK, PT. BPR Berok Gunung Pangilun provide Door to door service by
shuttle to the location of client funds.
10. The administrative fees collected 2 times a year that is per-six months (the end of each June and
December) by the amount of Rp. 5.000, - per-six month.
11. Withdrawal of savings is not charged.
12. Closure of account administration fee amounting to 5,000.
From the above table can be seen that the development of savings and deposits, especially
bajapuik savings at. BPR Berok Gunung Pangilun Padang, has increased from year to year.
Increasing both the amount of funds collected and disbursed cannot be separated from society
participation savers and users of the fund itself, which have benefited from services offered by BPR.
Table 2. Asset & Profit Development PT. BPR Berok Gunung Pangilun Padang
Year Asset Profit
2003 22.600.262 615.109
2004 28.726.686 764.624
2005 26.617.085 512.690
2006 28.444.021 467.786
2007 31.772.132 681.295
Further From table 2 above shows that the asset and profit growth period from 2003 to 2007
has fluctuated. During the period 2005 and 2006 profit decline, while assets increased. The increase
in assets during that period is the contribution from the profits derived from the current year.
Based on the description above, the problem can be formulated as follows:
1. Is there any influence on the product marketing strategy on customer loyalty bajapuik savings at.
BPR Berok Gunung Pangilun Padang?
2. Are there marketing strategies influence over the price of customer loyalty bajapuik savings at.
BPR Berok Gunung Pangilun Padang?
3. Is there any influence of the marketing strategy for the location of the customer loyalty bajapuik
savings at. BPR Berok Gunung Pangilun Padang?
4. Is there any influence of the marketing strategy for promotion of customer loyalty bajapuik
savings at. BPR Berok Gunung Pangilun Padang?
H. HERYANTO/International Journal of Lean Thinking Volume 2, Issue 1 (June 2011)
61

Research Objectives
In accordance with the formulation of the problems mentioned above, the objectives of this
research are to investigate and analyze:
1. To obtain empirical evidence about the influence of product marketing strategy on customer
loyalty savings PT. BPR Berok Gunung Pangilun Padang.
2. To obtain empirical evidence about the influence of marketing strategies on customer loyalty
savings price PT. BPR Berok Gunung Pangilun Padang.
3. To obtain empirical evidence about the influence of marketing strategies for the location of the
customer loyalty savings PT. BPR Berok Gunung Pangilun Padang.
4. To obtain empirical evidence about the influence of marketing strategy for promotion of
customer loyalty savings PT. BPR Berok Gunung Pangilun Padang.
Literature Review
Acccording Yenti (2010) student of management master program, Padang State University.
Title of the thesis is the effect of customer satisfaction on service marketing mix to saving customer
loyalty Bank Nagari branch in Bukittingg. Where is the satisfaction in his research on products,
promotions, personnel significant impact on customer loyalty savings while satisfaction over the
price, location, process, and physical facilities does not significantly influence customer loyalty Bank
Nagari Branch Bukittinggi.
Hariadi (2010), Bung Hatta University students majoring in Management Faculty of Economics.
Title of the thesis is the influence of consumer satisfaction on brand loyalty (nokia mobile phone
case study in Kerinci district). Based on the results of hypothesis testing found that consumers
satisfaction posititively and no significant effect on brand loyalty, perceived consumer in using
mobile phones nokia in Kerinci district. Moreover Aldila (2008), students at the University of Bung
Hatta, Faculty of Economics. Title of the thesis is the effect of customer satisfaction on brand loyalty
in using the pepsodent product. Based on the results of hypothesis testing found that customer
satisfaction significantly influence brand loyalty in using the pepsodent product.
H. HERYANTO/International Journal of Lean Thinking Volume 2, Issue 1 (June 2011)
62

Marketing Activities
Understanding Marketing
The success of a company is determined by the marketing ability to determine and implement
appropriate marketing policy in the right circumstances as well. The notion of marketing according
to Kotler translation of Nirwono and Taufik (1995:26) is an activity that is directed to meet the
needs and desires of human beings through the exchange process.
Marketing Strategy Top Products
Product Definition
Product is the most attention in the marketing mix to another. While the notion of products
by Stanton, (1995: 165) translation Swasta and Irawan that the product is anything that is offered
into the market for attention, used or consumed in order to satisfy consumers' desires or needs
which includes physical objects, services, people, places, organizations and ideas. Products can be
goods and services consumed by final consumers or industrial consumers. Classification of goods
according to the purpose of use by consumers can be divided into two groups, namely:
a. Consumer goods, namely the final consumer of goods bought for consumption. There are three
sections of consumer goods:
1) Convinien Goods
2) Shopping Goods
3) Speciality Goods
b. Industrial goods, ie goods that are purchased to be processed again or for the benefit of the
industry. Industrial goods can be grouped into:
1) Raw materials
2) Equipment operation
3) Components and semi-finished goods
4) Installation
5) Extra Equipment
Relations Strategy For Products With Customer Loyalty Bajapuik Savings
Loyal customers for a product that is owned by PT. BPR Berok Gunung Pangilun Padang is
crucial for the survival of these firms. As financial services company that manage customer, the Bank
should be able to create products to meet customer needs. This is in accordance with the opinion
H. HERYANTO/International Journal of Lean Thinking Volume 2, Issue 1 (June 2011)
63

of Kotler (2000: 428) that the service product is everything that can be offered by manufacturers to
note, requested, purchased, or consumed by the market as the fulfillment of needs or desires the
relevant market. Products offered include physical goods, services, people or individuals, places,
organizations and ideas. So the product can be tangible and intangible benefits that may satisfy the
customer.
According to Cravens (1998: 25) performance and the excellence of a product is very
important in influencing the level of customer loyalty. This means that if the product offered in a
response from customers and meet customer demands and in line with their expectations.
Conversely, if customers disappointed with what is given then they will not repeat it again.
Marketing Strategies For Price
Understanding Price
After the creation of the product then the price is the second element, because if the pricing is
right for the product will affect the continuation of the development of these products target
market. The definition of the price by Swastha (1995: 147) is the amount of money (plus a few
things if possible) required to obtain a number of combinations of goods and services.
In setting policy prices there are several methods that guided the formulation:
1) The price, based on the orientation of the manufacturer to request that set the selling price in
accordance with a predetermined price. Policy is usually well above considerations of price
discrimination among other subscriptions differences, differences over the place and
differences over time.
2) Determination of cost-oriented pricing that is setting the selling price based on costs incurred
to produce a product so that the goods to consumer. In this case the price is a way for sellers to
distinguish one offering from competitor. Meanwhile pricing goods considered as a function of
differentiation in marketing.
Several kinds of pricing objectives, namely:
1. Pricing to grab market share
2. Pricing for the purpose of maximum revenue
3. Pricing for promotional purposes
4. Pricing for profit targets
H. HERYANTO/International Journal of Lean Thinking Volume 2, Issue 1 (June 2011)
64

Furthermore Cravens (2003: 143) states set prices for goods and services is a key strategy for
the company as a consequence of deregulation of increasingly fierce global competition, low
growth in many markets and opportunities for companies to establish market positions.
The cost factors in the product is in the form of bank profit (interest/services) obtained from
customer on deposits money in an account managed by banks, interest / services specified may be
greater, lower or equal to competitors. Customers feel satisfied with the price set according to the
value or benefits and meet customer expectations.
Marketing Strategy For Location
Understanding Location
The location is an industrial product distribution channel services. The location is a place that
is used in supplying services to the customer. The location associated with the decisions made
about where the operating company and its staff will be involved. For the type of interaction where
the customer came to service providers are like the Bank, where the location is very important.
Besides that, according to Hurriyati (2005: 57): in choice place or location requires careful
consideration of several factors:
1. Access, such as location, easily accessible public transportation
2. Visibility, such as the location which can be seen clearly from the roadside
3. Traffic, where there are two things to consider, which is the number of people passing by can
be a member a great chance of impulse buying, density and traffic congestion can also be a
barrier
4. The parking lot is spacious and safe
5. Expansion, available space in which to expand business in the future
6. Environment, namely the area around the support
7. Competition, was the location of competitors
8. Government Regulation
Factors affecting the company in determining the alternative distribution channels, among others:
a. Market Considerations
b. Consideration Goods
c. Company Considerations
d. Consideration Broker
e. Promotional Consideration
H. HERYANTO/International Journal of Lean Thinking Volume 2, Issue 1 (June 2011)
65

Top Promotional Marketing Strategy
Understanding Promotion
Promotion is a way to influence consumers prefer to buy directly for certain goods and
services. In addition, promotions are also driving purchases act fast so as a whole will determine the
success of the campaign, because of its attraction gets the message delivered. According to Alma
(2004: 179) campaign is a form of marketing communication is a marketing activity that tries to
spread information, influence, persuade, and / or remind the target market or company and its
products to willing to accept, buy and loyal to the products offered by the company concerned.
According to George (1991: 53) which be interpreted by Asri, the nature of sales promotion are:
1. Sales promotions generate faster response than ads.
2. Sales promotion tends to attract a new buyer is not a long-term interest only been established,
because the promotion only to attract consumers, who are always moving between various kinds
of brand depends on the special offers available.
3. The buyers of certain brands that each tends to not change the pattern of the buyers, although
there is a competitive campaign.
Based on the above definition means that the promotion is a to communicate and convey
information to consumers or prospective purchaser of a marketed product. Communications that
the company is often called a campaign. Wisdom of this campaign cannot walk alone, because it is
part of marketing wisdom. So the implementation must also be supported by other marketing
wisdom. Such as product policy, sales policy, distribution policy. To increase the volume of sales,
the company doing various forms of promotion such as advertising, which is a form of presentation
of the promotion of non-personnel of ideas, goods and services by a specific sponsor and paid by
these sponsors. Usually advertising often uses media such as billboards, banners, radio, television,
newspapers, magazines and so forth. Personal selling is a form of promotion using sales force
where they entered into an oral agreement in the negotiation of one or more potential buyers to
sell something. Direct sales force to deal with customers. This activity requires a large cost, if its use
is expanding. Also requires a quality sales force. Salaes Promotion which includes a variety of
promotional tool as an incentive for short-term that is designed in such a way to invigorate
marketing faster and stronger. Space for sales promotion include exit and into the company. To get
out of sales promotion through a broker. As for all employees into the cover that is connected
directly to the consumer.
H. HERYANTO/International Journal of Lean Thinking Volume 2, Issue 1 (June 2011)
66

Customer Loyalty
Understanding Customer Loyalty
According Sipatuhar (2000), customers are all demanding the bank to meet a certain quality
standard. Meanwhile, according to the median (1995), is a good customer, without them the bank
will be closed or bankrupt. From the above definition can be concluded that the customer is
demanding to meet customer desires. The definition of loyalty is expressed in Oliver (2005: 129)
declared Customer loyalty is deeply held commitment to rebuy or repatronize a preferred product
or service consistenly in the future, despite situational Influences and Marketing Efforts having
potential to cause switching behavior.
From the definition, customer loyalty is to survive in a deep commitment to subscribe again or
re-purchase the product / service consistently chosen in the future, although the influence of the
situation and marketing efforts, have the potential to cause changes in behavior.
Typical characteristics of Loyal Customers
Customers who are loyal according to Griffin (2002: 31) has characteristics including: (1)
make a purchase re-seacar regularly, (2) buy out the product line / services, (3) invites another
person, (4) indicates immunity from the pull of competitors. Understanding customer loyalty is not
only seen from the transaction just
or repeat sales. Griffin (2003: 23) promoted seoarang there are some features could be considered
loyal customers. Among others:
a. Makes rugular repeat purchase
b. Purcase across product lines and servise
c. Refers others
d. Demonstrates in immunity to the pull nof the competition
Loyal customers are loyal to their bank customers. Griffin (2002: 13) suggests the benefits -
benefits that would be obtained if the company has loyal customers that include: (1) reduce
marketing costs (because the cost to attract new customers is more expensive), (2) reduce
transaction costs (such as costs of contract negotiations, order processing), (3) reduce customer
turnover costs (because fewer consumers replacement), (4) to increase cross selling which will
enlarge the company's market share, (5) word of mouth is more positive, with the assumption that
consumers are loyal bearti also those who feel satisfied, and (6) reduce the cost of failure (such as
replacement cost).
H. HERYANTO/International Journal of Lean Thinking Volume 2, Issue 1 (June 2011)
67

Loyalty Levels
Kartajaya (2003:100) divides into five stages of customer loyalty levels, as follows:
1. Terrorist Customer, are customers who like menjelek-jelekan brand because the company did
not like or ever not satisfied with the services provided by the company. Customers like this act
like terrorists who like to bother the company.
2. Customer transactional, ie customers who have relationships with companies that are limited to
the transaction, customers like this to buy one or two times, after that not to repeat purchase, or
if doing pembelin again it is only sometimes. Customers who have properties like these easily
come and go because they do not have a good relationship with the product / brand company,
its base is a transactional relationship.
3. Customer Relationship, where this type of customer equity value is higher than the above two
types of customers. Customers of this type have been doing repeat buying and patterns to do
with the product or the brand of the company is rational.
4. Loyal Customer, customers are not only doing this type of repeat buying, but even further is very
loyal to the company's products and brands. If there are other people who discredit the
company, subscribers to survive and remain with the company anything as bad as people vilify
the company.
5. Customer Advocator, types of customers with the highest level, this kind of very special
customers and excellence, they became the biggest assets if the company had it. Advocator
Customer is a customer who always defended the company's products and brands, customers
who become a good spokesman to another customer and angry customers if there are other
people who speak ill of the company's brand.
Another approach is to segment loyalty behavior into several groups, namely:
1. Non-customers, to those who choose the brand competitors
2. PriceSwitcher, ie groups that are sensitive to price, brand loyalty easy to waver because there is
another brand that is cheaper
3. Passivelly loyalist, to those who buy out of habit and not for some reason
4. Fence Sitter, to those who feel no difference between brand A and B. This group is those who
have committed to buy our brand back.
H. HERYANTO/International Journal of Lean Thinking Volume 2, Issue 1 (June 2011)
68

Factors Affecting / Establishing Loyalty
A consumer is loyal to a brand in general is very difficult to change in the use of other
products, where consumer loyalty to a brand has increased, then the threat of similar competitor
products will be reduced. Cause of brand loyalty is due to inability of the company in maintaining
stability and kuaitas quality of products or specific brands. According to Gunawan's view of business
practitioners (2004:21) customer loyalty will be created if the company is able to create quality
standards and quality of product, one way is done by a company within the created is by forming a
team of marketing intelligence yangmerupakan who served in responding to and researching
consumer behavior towards products such as changes in tastes, trends, society and the threat from
competitors' products. After all the "necessary information can be collected then the change of an
analysis of all possibilities that will happen to the products they hasikan and then create a strategy
that will serve as a tool to maintain consumer trust and loyalty. Sudjana (2001: 19) revealed that a
company has a customer base that has a high brand loyalty can provide many benefits for
companies that can reduce marketing costs, high brand loyalty can increase trade, attract new
customers and brand loyalty gives time or breathing space, at a company to quickly respond to
competitors' movements.
Loyalty Indicators
Consumers who are loyal very great significance for the company. According to Kotler
(2002:25) there are five indicators that loyal customers, namely:
a. Customers tend to buy more and longer loyal.
b. Customers tend malakukan cross-selling or add-on-selling.
c. Customers are not sensitive to price.
d. Customers will make a positive word of mouth.
e. Offer ideas to the company's goods or services.
Customer loyalty will be affected by customer satisfaction, customer characteristic swiching
barrier, market competition and value. The main factors that affect loyalty is customer satisfaction,
customer satisfaction will be determined by the hope (expectation) and product performance. If
performance exceeds expectations, the customer satisfied and vice versa if the performance is less
than expectations, the customer will be dissatisfied. If customer satisfaction is fulfilled then the
customer loyalty will be created and vice versa if customer satisfaction is not met then the loyalty of
customers will not be created. As seen in the following figure:
H. HERYANTO/International Journal of Lean Thinking Volume 2, Issue 1 (June 2011)
69

Figure 1. The Customer Loyality Creation Factor (Tjiptono, 1997:126)
Hypothesis
Based on the problem to be solved and the theory underlying the framework in this study, the
hypothesis can be formulated as follows:
a. Marketing strategy of product has a significant and positive impact on customer loyalty savings
on PT.BPR Berok Gunung Pangilun Padang.
b. Marketing strategy of price has a significant and positive impact on customer loyalty in PT.BPR
Berok Gunung Pangilun Padang.
c. Marketing strategy for location has a significant and positive impact on customer loyalty in
PT.BPR Berok Gunung Pangilun Padang.
d. Marketing strategy for promotion has a significant and positive impact on customer loyalty in
PT.BPR Berok Gunung Pangilun Padang.
Expectation
Performance
Customer Satisfaction
Switching
Barrier
value
Market
Competition
Customer
Characteristic
Customer Loyality
H. HERYANTO/International Journal of Lean Thinking Volume 2, Issue 1 (June 2011)
70

Research Methodology
Research Object
This research was carried out on customers' savings PT. BPR Berok Gunung Pangilun Padang.
Population and Sample
Population
According Istijanto (2005) population is a collection of items that work together to achieve a
common purpose. In this study the population is all customers of savings by the end of 2009,
amounting to 5750 people.
Sample
According to Ridwan and Akdon (2006) sample is part of the population have characteristics -
characteristics of a particular situation to be studied. To know the size of the study sample used
sampling technique by accidental sampling, ie sampling technique based on spontaneity, meaning
that anyone who accidentally met with the research and according to their characteristics, then that
person can be used as a sample (respondents).
The method of sampling conducted by Slovin in Umar (2002:14), namely:
n = N
1+ Ne2
n = 5750
1+ (0,1)2
= 100
Where:
n = Number of Samples
N = Population Size
e = error of 10%.
H. HERYANTO/International Journal of Lean Thinking Volume 2, Issue 1 (June 2011)
71

Operational definitions of variables / Measurement Variables
Definition of Independent Variables and Dependent Variables
Table 3. The Decription of Operational Definition and Measurement Variable Definition Sub Indicator Scala
Marketing
Strategy on
Product
Products (X1)
Is something that can be offered on the market
for attention, requested, used or consumed
that satisfy consumer needs and wants of both
goods and services (Kothler, 1990). The
indicator used to measure this variable is
savings safety
1. Security Savings
2. Books withdraw savings
3. Directive in the passbook is
easy to understand
4. Can be used as a means of
payment
5 = Very
satisfied
4 =
Satisfied
3 = Less
satisfied
2 = Not
satisfied
1 = Very
dissatisfi
ed
Marketing
Strategy on
Price
Price (X2)
Is the number of values
assigned to a product or service to get some
combination of the product or service to get
sejulah combination of prodik and ministry
(Swatha, 1983)
1. The amount of savings
interest rate
2. The amount of administrative
costs
3. The amount of replacement
cost savings books
4. Other expenses
5 = Very
satisfied
4 =
Satisfied
3 = Less
satisfied
2 = Not
satisfied
1 = Very
dissatisfied
Marketing
Strategy on
Location
Location (X3)
Are institutions that have a distributor or
dealer events meyalurkan products and
services from producers to consumers
(Nitisemitro, 1997)
1. Bank's strategic location
2. Availability of public
transport to localized Bank
3. Number of office units
4. Easily accessible
5 = Very
satisfied
4 =
Satisfied
3 = Less
satisfied
2 = Not
satisfied
1 = Very
dissatisf
ied
Marketing
Strategy on
Promotion
Promotion (X4)
Is the flow of information or persuasion of a
direction made to direct a person or
organization to the action that creates an
exchange in marketing (Private and Irawan
1999; 349)
1. The information provided
through personal selling /
account officer.
2. The information provided
through banner
3. Mass or radio
4. Information through
brochures
5. Lottery by the Bank's
Procurement
5 = Very
satisfied
4 =
Satisfied
3 = Less
satisfied
2 = Not
satisfied
1 = Very
dissatisf
ied
Customer
Loyalty (Y)
1. To use PT. BPR Berok
5 = Always
H. HERYANTO/International Journal of Lean Thinking Volume 2, Issue 1 (June 2011)
72

Loyality Loyalty is a commitment from the consumer to
use a particular product or service brand,
which formed due to the consistency of the
company to meet customer expectations
Gunung Panggilun for
financial facility primarily
saving.
2. To give recommendations
to others to use savings
3. To survive as customers,
although there are
inducements to move to
other banks
4. To delively positive things
on savings products to
others
5. Provide advice to the PT.
BPR Berok Gunung
Panggilun Padang for the
development of savings
products
4 = Often
3 =
Sometimes
2 = Rarely
1 = Never
Conceptual Framework
Customer loyalty savings will be largely determined by several factors. The more interesting
the facilities offered to customers the savings the more it will attract customers to save money on
PT. BPR Berok Gunung Pangilun Padang. Savings Products PT. BPR Berok expected to bring more
customers, it may be through a physical product such as shape and size of the book is interesting,
the clues contained in the passbook, the process of opening savings accounts and savings also can
be used as a means of payment, it may be the things This will make customers interested to use the
product even expected savings customers will be loyal to their savings like this bajapuik savings.
The more competitive interest rates and low costs it will be more and more customers who will use
this bajapuik savings. Other factors may also be due to the location. Bank location, easily accessible,
and availability that make it easy to access the transaction will allow the higher level of customer
keloyalan.
Conduct a vigorous campaign, will make customers get information about the benefits of
savings products on offer. And held a raffle, raffle prizes will also make the customer satisfied in the
use of savings products.
Based on the above thinking, the conceptual framework of research can be described as
follows:
H. HERYANTO/International Journal of Lean Thinking Volume 2, Issue 1 (June 2011)
73

Types and Sources of Data
Data Type
Type of data in this study is the data subject (Self-Report Data). Where according Indriantoro
(1999:145) data on the subject is the kind of research data in the form of opinion research, attitude,
experience and characteristics of the person or persons who become subject peneliltian
responders.
Source Data
1. Primary Data
Data used in this research is the primary data is the data sought and processed individually by
the investigators and has not been published by individual groups or institutions to the various
parties concerned.
2. Secondary Data
Secondary data source research data obtained directly through a media researcher intermediary /
acquired and recorded by others (Indriantoro, 1999:147). Techniques used in the collection of
secondary data obtained from literature studies relevant to the research, as well as an overview
of enterprise data obtained from magazines or via the internet.
Marketing Strategy
on Product (X1)
Marketing Strategy
on Price(X2)
Marketing Strategy
on Location (X3)
Marketing Strategy
on Promotion (X4)
Customer
Loyality (Y)
H. HERYANTO/International Journal of Lean Thinking Volume 2, Issue 1 (June 2011)
74
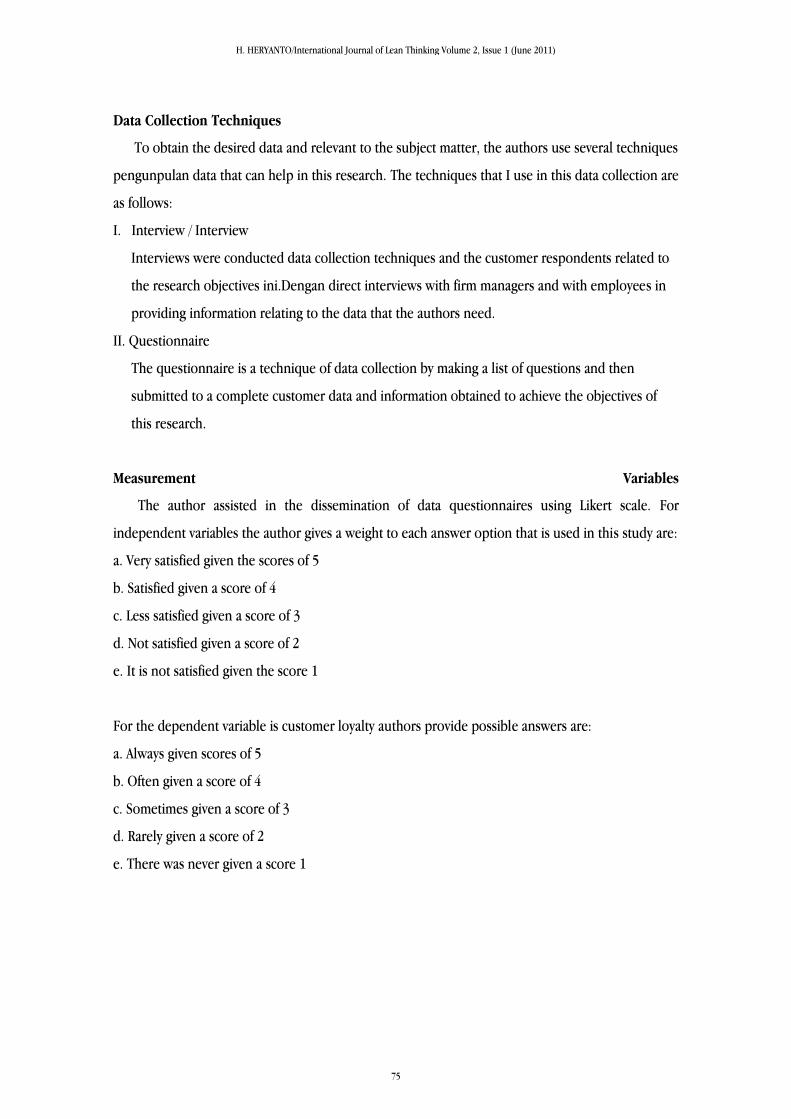
Data Collection Techniques
To obtain the desired data and relevant to the subject matter, the authors use several techniques
pengunpulan data that can help in this research. The techniques that I use in this data collection are
as follows:
I. Interview / Interview
Interviews were conducted data collection techniques and the customer respondents related to
the research objectives ini.Dengan direct interviews with firm managers and with employees in
providing information relating to the data that the authors need.
II. Questionnaire
The questionnaire is a technique of data collection by making a list of questions and then
submitted to a complete customer data and information obtained to achieve the objectives of
this research.
Measurement Variables
The author assisted in the dissemination of data questionnaires using Likert scale. For
independent variables the author gives a weight to each answer option that is used in this study are:
a. Very satisfied given the scores of 5
b. Satisfied given a score of 4
c. Less satisfied given a score of 3
d. Not satisfied given a score of 2
e. It is not satisfied given the score 1
For the dependent variable is customer loyalty authors provide possible answers are:
a. Always given scores of 5
b. Often given a score of 4
c. Sometimes given a score of 3
d. Rarely given a score of 2
e. There was never given a score 1
H. HERYANTO/International Journal of Lean Thinking Volume 2, Issue 1 (June 2011)
75
Research Instruments
Instruments to collect data in this study were prepared questionnaires for measuring the
variables of research by providing a scale score of answers to questions. Scale was used Likert scale.
Each question has five alternative answers.
Data Analysis Techniques
Analytical methods
To prove the influence of independent variables to the dependent variable then used multiple
regression equation. Multiple regression equation as follows:
Y = a + b1X1 + b2X2 + b3X3 + b4X4 + e
Where:
Y = Customer Loyalty
a = Constant
X1 = Marketing Strategies for Products
X2 = Marketing Strategies for Price
X3 = Marketing Strategies for Location
X4 = for Promotion Marketing Strategy
b1-bn = regression coefficients
e = Variable Pangganggu
Normality Test
According to the Gujarat (2001: 79) normality test used to see whether the pattern of spread of
data with normal distribution or not, but it can also be used for normality test untukmenentukan
what statistical test used in a study whether to use parametric tests or non-parametric test. Normal
or not a data can be seen from the asym sig generated in the test> 0.05. If the normal data then
parametric statistical tests can be done and vice versa.
Test Validity
It is a test that is intended to simplify the items that were used directly in measuring the
research variables, whether these items have accuracy in explaining a variable used in the study who
viewed the value of loading factor. Factor coefficient (loading) which has absolute value> 0:40
means that variable has a value of the accuracy of the qualified.
H. HERYANTO/International Journal of Lean Thinking Volume 2, Issue 1 (June 2011)
76

Test Reliability
According Supranto (2001: 45) test the reliability test is a test to measure whether realibel or
reliable data and can be used in processing the data in this study, using the coefficient alpha
cronbach. If the value of coefficient alpha cronbach> 0.60 then the data can be declared reliable or
powerful.
Hypothesis Testing
1. T-Test Statistics
To prove the influence of marketing strategies on customer loyalty, the authors conducted a
statistical test using test t-test. Supranto (1997: 97) states t-test is a statistical test that can be
formulated as follows:
t = B/SB
where,
t = follow function with degrees of freedom; (dt) = n-2
SB = Standard
B = regression coefficient
Characteristics of Tests:
a. If signnifikasi under alpha then the decision is Ho refused and Ha is received it can be
concluded that the independent variables significantly influence the dependent variable
partially.
b. If the significance of the above alpha then the decision is accepted and Ha Ho is rejected it
can be concluded that the independent variables significantly influence the dependent
variable partially.
2. Test F-Statistics
According to Santoso (2001) F-statistics test is a test used to determine whether or not
significant independent variables influence dependent variables simultaneously. Tests carried
out using an alpha of 0.05. With the testing criteria as follows:
1. If sig <α, then the decision is Ho refused and Ha is received means it can be concluded
that the independent variables significantly influence the dependent variables
simultaneously.
H. HERYANTO/International Journal of Lean Thinking Volume 2, Issue 1 (June 2011)
77

2. If sig> α, then the decision is accepted and Ha Ho rejected means it can be concluded that
the independent variable does not significantly influence the dependent variables
simultaneously.
Research Results and Discussion
Data Analysis
Identity Characteristics of Respondents
This section will set out the identity of respondents grouped by characteristics of sex, age, past
education, employment, and duration of a customer. Below are the results of questionnaire
distributed.
1. Sex
Profile of respondents by gender can be seen from the table below in which the more female
respondents as many as 52 people or about 52%, while male respondents as many as 48 people or
about 48%
Table 4.Characteristic Based on Respondent Sex
Sex Total Persentage ( % )
Male 48 48%
Female 52 52 %
Total 100 100 %
2. Age
Profile of respondents by age, where no respondents younger than 20 years. Respondents who
are more present in the respondents aged 31-40 years as many as 39 people or about 39%.
Respondents aged 21-30 are as many as 18 people or about 18%. Respondents aged 41-50 years
as many as 23 people or about 2
H. HERYANTO/International Journal of Lean Thinking Volume 2, Issue 1 (June 2011)
78

Tabel 5. Characteristik Based on Respondent Age
Age Total Persentage ( % )
Less Than 20 Year 0 0%
21 – 30 Year 18 18%
31 – 40 Year 39 39%
41– 50 Year 23 23%
>50 Year 20 20%
Total 100 100 %
3. Educational Background
Profile of respondents by education last seen that there are no recent education graduate
respondents S2. Respondents who graduated from primary school education last about 19
people or about 19%. Respondents who graduated from junior high last education is as many
as 26 people or about 33%. Respondents who last education high school graduates are as many
as 51 people or about 51%. Respondents who graduated last D3 is as much as 1 person or
about 1%. Respondent who graduated S1 is as much as 3 person ar about 3%.
Table 6. Characteristik Based on Educational Background
Educational Background Total Persentage ( % )
SD 19 19 %
SMP 26 26 %
SMA 51 51 %
D3 1 1 %
S1 3 3%
S2 0 0%
Total 100 100 %
4. Job
Based on job characteristics seen that no respondents with a job as a retiree. Respondents with a
job as other jobs or more trade as many as 81 people or about 81%. Respondents with a job as a
H. HERYANTO/International Journal of Lean Thinking Volume 2, Issue 1 (June 2011)
79

student that is as much a people or about 1%. Respondents with a job as private as many as 8
people, or about 8%. Respondents with a job as a Government employee as many as 4 people,
or about 4%. While respondents with jobs sebagat housewife as many as 6 people or about 6%.
Table 7. Characteristik Based on Respondent Jobw
Job Total Persentage ( % )
Student 1 1%
Private 8 8 %
Government Employee 4 4 %
Retire 0 0 %
Housewife 6 6 %
Other (Trader) 81 81%
Total 100 100%
5. Income
Income of respondents ranged from Rp. 2,000,001.00 - Rp. More 3,000,000.00 as many as 32
people or about 32%. Respondents who earned less than Rp. 1,000,000.00 as many as 10 people
or about 10%. Respondents who earned Rp. 1,000,000.00 - Rp. 1,500,000.00 as many as 12
people or about 12%. Respondents who earned Rp.1.500.001, 00 - Rp. 2,000,000.00 as many as
21 people or about 21%. Meanwhile, respondents who earned Rp.3.000.000, 00 upwards as
many as 25 people or about 25%.
Table 8. Characteristic Based on Respondent Income
Income Total Persentage ( % )
Less Than Rp 1.000.000,00 10 10 %
Rp 1.000.000,00 – Rp 1.500.000,00 12 12 %
Rp 1.500.001,00 – Rp 2.000.000,00 21 21 %
Rp 2.000.001,00 – Rp 3.000.000,00 32 32 %
Upper Rp 3.000.000,00 25 25 %
Total 100 100 %
H. HERYANTO/International Journal of Lean Thinking Volume 2, Issue 1 (June 2011)
80

6. Being Old Customer
Viewed from term customers shows that respondents who had long been a customer in 2-4 years
as many as 48 people or about 48%. Respondents who had long been a customer less than 2
years as many as 26 people or about 26%. Respondents who had long been a customer 5-6 years
as many as 16 people or about 16%. Respondents who had long been a customer 7-8 years as
many as 6 people or about 6%. And respondents who had long been a customer for more than 8
years yatu as many as 4 people or about 4%.
Tabel 9. Characteristic Based on Being Old Customer
Being Old Customer Total Persentage ( % )
Less Than 2 Year 26 26 %
2 – 4 Year 48 48 %
5 – 6 Year 16 16 %
7 - 8 Year 6 6%
More Than 8 Year 4 4% %
Total 100 100 %
Test Data and Discussion
To determine the influence of independent variables measured between the Effect of
Marketing Strategy on Customer Loyalty Savings on PT. BPR Berok Gunung Pangilun Padang
performed using multiple linear regression.
Test Validity
Validity test is done by using the correlation between the score of each - each item questions
with a total score. Techniques used in this study is factor analysis. For the calculation process, the
researcher uses SPSS 16.00. The method used Varimax Rotation and variables have factor loading
more than 0.4 otherwise appropriate for factor analysis.
H. HERYANTO/International Journal of Lean Thinking Volume 2, Issue 1 (June 2011)
81

Table 10. Validity Testing Result
KMO and Bartlett's Test
Kaiser-Meyer-Olkin Measure of Sampling Adequacy. .872
Bartlett's Test of Sphericity Approx. Chi-Square 1.290E3
Df 10
Sig. .000
source : processed data
Test Reliability
Reliability test used to view the reliability of instruments has been declared invalid. Instrument
say reliable, using the coefficient alpha croanbach. If the value croanbach alpha coefficient> 0.60.
Table 11. Reability Testing Result
Reliability Statistics
Cronbach's Alpha Cronbach's Alpha Based on Standardized Items N of Items
.970 .978 5
source : processed data
H. HERYANTO/International Journal of Lean Thinking Volume 2, Issue 1 (June 2011)
82

Component Matrixa
Component
1 2 3 4 5 6 7 8
Y1 .084 .232 .179 .144 -.580 -.078 .027 .034
Y2 -.120 .295 .287 .402 .150 -.346 .119 .430
Y3 .297 .158 -.027 .378 .302 .156 .553 .048
Y4 .133 .727 -.181 .015 .229 .193 -.004 .075
Y5 .479 .260 .234 -.404 -.001 .037 -.087 .087
Y6 .757 .114 -.034 -.163 -.145 -.178 .237 -.114
Y7 .699 -.131 -.441 -.145 -.027 -.290 .127 .106
Y8 .365 .501 .202 -.314 .255 -.092 -.127 -.052
Y9 .251 -.259 -.144 -.440 .474 .293 .229 .174
Y10 .294 -.387 -.693 .092 .018 -.129 -.113 .144
Y11 .446 -.463 .280 -.153 .149 -.073 -.246 -.095
Y12 .465 -.305 -.305 -.158 .077 -.193 .175 -.233
Y13 .191 -.434 .532 -.077 -.264 .278 .319 .037
Y14 .328 -.404 .266 .442 .105 .283 -.282 -.217
Y15 .420 -.111 .607 -.266 -.271 -.025 .154 .015
Y16 .472 .683 .038 -.025 -.153 -.015 -.207 .039
Y17 .644 .171 -.047 .085 -.303 -.002 .265 .243
Y18 .631 -.199 .168 .344 .101 -.334 -.188 -.127
Y19 .260 -.132 .314 .404 .443 .113 .019 .367
Y20 .690 -.234 .135 .189 .144 -.258 -.185 .009
Y21 .198 -.070 -.366 .406 -.453 .151 -.115 .233
Y22 .407 -.272 -.092 -.143 -.159 .534 -.303 .342
Y23 .287 .431 .012 -.170 .111 .046 -.354 .190
Y24 .578 .179 -.275 .135 -.049 .405 .080 -.255
Y25 .318 .460 .027 .358 .080 .219 .026 -.478
Extraction Method: Principal Component Analysis
a. 8 components extracted.
source : processed data
Variable marketing strategy on product, price, location, promotion and customer loyalty
consists of 25 questions with factor loading items from 0084 to 0.757 Testing with Kaiser's MSA
method shows the value of 0.872. This value indicates greater than 0.5, which means the data
obtained is valid or appropriate for factor analysis.
Reliability testing showed a mean value of 0.970 is greater than 0.6 thus indicates that the data
H. HERYANTO/International Journal of Lean Thinking Volume 2, Issue 1 (June 2011)
83

obtained is reliable and shows the instruments used in this study is reliable.
Normality Test
Normality test used to determine what statistical test used in a study whether to use parametric
tests or non-parametric test. Normal or not a data can be seen from the asym sig generated in the
test> 0.05. The test is using Kolmogorov Smirnov Test, the test criteria:
1. If the data are spread around the diagonal line and follow the direction of the diagonal line, then
the regression model to meet the assumption of normality.
2. If the data are spread far from the diagonal line, the regression model did not meet the
assumption of normality.
Table 12. Normality Testing
Residuals Statisticsa
Minimum Maximum Mean Std. Deviation N
Predicted Value 2.31793284E0 3.22743487E0 2.89856002E0 .174922408 100
Std. Predicted Value -3.319 1.880 .000 1.000 100
Standard Error of
Predicted Value .003 .024 .005 .003 100
Adjusted Predicted
Value 2.31013131E0 3.22810054E0 2.89945278E0 .172329066 100
Residual -7.682170719E-2 .052075502 .000000000 .025237084 100
Std. Residual -2.982 2.021 .000 .980 100
Stud. Residual -3.329 2.624 -.007 1.037 100
Deleted Residual -1.382942796E-1 .087763682 -8.927622490E-4 .031074217 100
Stud. Deleted Residual -3.523 2.710 -.007 1.050 100
Mahal. Distance .308 87.023 3.960 10.171 100
Cook's Distance .000 5.123 .075 .522 100
Centered Leverage
Value .003 .879 .040 .103 100
a. Dependent Variable: customer loyality
source : processed data
Multiple Regression Analysis
To determine the influence of marketing strategies for product, price, place and promotion of
customer loyalty bajapuik saving at. PT. BPR Berok Gunung Pangilun Padang then conducted
multiple regression analysis as shown in Table 13 below.
H. HERYANTO/International Journal of Lean Thinking Volume 2, Issue 1 (June 2011)
84

Table 13. Multiple Regression Accounting Result
Model
Unstandardized Coefficients
Standardized
Coefficients
t Sig. B Std. Error Beta
1 (Constant) -.073 .097 -.758 .450
Strategi pemasaran atas
produk .213 .071 .270 3.013 .003
Strategi pemasaran atas
harga .235 .073 .292 3.209 .002
Strategi pemasaran atas
lokasi .498 .063 .386 7.886 .000
Strategi pemasaran atas
promosi .069 .033 .082 2.091 .039
a. Dependent Variable: customer loyality
As for the relationship and contribution of marketing strategy variables on product, price,
place and promotion of customer loyalty bajapuik saving at. PT. BPR Berok Gunung Pangilun
Padang, can be seen correlations coeficient and determinants in the summary table as follows.
From the table were obtained as following equation:
Y = -0.073 + 0.213 X1 + 0.235 X2 + 0.498 X3 + .060 X4
Table 14. Model Summary
Model R R Square Adjusted R Square
Std. Error of the
Estimate
1 .990a .980 .979 .025762913
a.Predictors: (Constant), marketing strategy on promotion, price, location and product
In the summary table above, the model coefficients as indicated by the R Square value of 0.980
means that the relationship marketing strategy on product, price, location, and promotions with
customer loyalty by 98.0%, 98.0% means that marketing strategies affect customer loyalty while 2,
0% influenced by other factors that are not explained in the model.
T test
H. HERYANTO/International Journal of Lean Thinking Volume 2, Issue 1 (June 2011)
85

Partial test of the model above (Table 13) shows that the model is significant. This can be seen from
the average coefficient is significant, because the sig. smaller than 5%.
Anova F-Test
Based on table 15, the simultaneous regression coefficient significant at 5% confidence level. From
the table shows that the F-count 1.141 with an error rate of 0,000. Then it can be stated that the sig
<α (0.000 <0.05) mean H0 rejected and Ha accepted. This means that there are influence which
sinifikan between marketing strategy on product, price, location, and promotion of customer
loyalty bajapuik saving at. PT. BPR Berok Gunung Pangilun Padang.
Table 15. ANOVAb
Model Sum of Squares df Mean Square F Sig.
1 Regression 3.029 4 .757 1.141E3 .000a
Residual .063 95 .001
Total 3.092 99
a. Predictors: (Constant), marketing strategy on promotion, price, location, and product
b. Dependent Variable: customer loyality
Conclusion
From the data analysis has been done on PT.BPR Berok Gunung Pangilun Padang, it can be
concluded that:
a. Marketing strategy for products made by the bank PT.BPR Berok Gunung Pangilun Padang has
a significant influence on customer loyalty bajapuik savings.
b. Marketing strategy over the price made by the PT. BPR Berok Gunung Pangilun Padang has a
significant influence on customer loyalty bajapuik savings.
c. Marketing strategy for the location by the banks PT.BPR Berok Gunung Pangilun Padang has a
significant influence on customer loyaltas bajapuik savings.
d. Marketing strategy of the campaign carried out by the bank PT.BPR Berok Gunung Pangilun
Padang has a significant influence on customer loyalty bajapuik savings.
H. HERYANTO/International Journal of Lean Thinking Volume 2, Issue 1 (June 2011)
86

References
Aldila. (2008). “Pengaruh Kepuasan Konsumen terhadap Loyalitas Merek dalam
menggunkan produk pepsodent. Skripsi Universitas Bung Hatta Fakultas Ekonomi
Dendawijata, Lukman. 2005. Manajemen perbankan. Jakarta: Ghalia Indonesia
Hariadi (2010). ”Pengaruh Kepuasan Konsumen terhadap Loyalitas Merek ( Studi kasus
handphone nokia di kabuipaten Kerinci). Skripsi Universitas Bung Hatta jurusan
Manajemen Fakultas Ekonomi
Idris. 2006. Aplikasi SPSS dalam Analisa Data Kuantitatif. Padang: FE-UNP
Idrianto, Nur dan Riyanto Supomp. 2002. Metodologi Penelitian Bisnis: untuk Akuntansi dan
Manajemen. Yogyakarta: BPFE
Kotler , Philip , 2002, Manajemen Pemasaran , edisi Milenium, Prenhalindo, Jakarta.
Kotler, Philip, 1994, Manajemen Pemasaran, CV . Intermedia, Jakarta
Kotler, Philip, Manajemen Pemasaran, Analisa Perencanaan & Pengendalian, Jilid , Erlangga,
Jakarta.
Morgan dalam Kotler, 1997, Manajemen Pemasaran Analisis, Perencanaan, Implementasi,
dan pengendalian, Jilid I dan II, Edisi kedelapan, penerbit PT. SalembaEmpat , Jakarta.
Para Suraman, et al & Lupiyoadi, 2001, Dasar – dasar Pemasaran, terjemahan oleh Gunawan
Hutahuruk, Erlangga, Jakarta
Rosni Yenti, “Pengaruh kepuasaan nasabah atas bauran pemasaran jasa terhadap
loyalitas nasabah tabungan Bank Nagari Cabang Bukittinggi” ,2010
Swastha DH, Basu dan Irawan, 1997, Manajemen Pemasaran Moderen, Edisi III, Liberty,
Yogyakarta .
H. HERYANTO/International Journal of Lean Thinking Volume 2, Issue 1 (June 2011)
87