Embed Size (px)
Citation preview
Effect of Manufacturing Processes and Welding Type on Quasi-static and Dynamic Responses of Aluminum Alloys: Experimentsand Modeling
Muneer Baig1 • Akhtar S. Khan2 • Shi-Hoon Choi3 • E. Lee3
Received: 8 March 2015 / Accepted: 8 June 2015 / Published online: 18 June 2015
� Society for Experimental Mechanics, Inc 2015
Abstract Measured responses of two aluminum alloys
over a wide range of strain-rates (10-5 to 103 s-1) and
temperatures are presented. The aluminum alloys include
AA5182-O and AL6111-T4. A tensile spilt Hopkinson
pressure bar was used for the dynamic experiments. The
aluminum AA5182-O alloy (manufactured using continu-
ous casting and direct chilling processes) including its first
and second generation gas tungsten arc welded and friction
stir welded TWB’s exhibited negative strain-rate sensitiv-
ity. AL6111-T4 is found to have positive strain-rate sen-
sitivity. The Khan-Huang-Liang constitutive model is
shown to correlate and predict the observed responses
reasonably well. The texture evolution of the AA5182-O
and AL6111-T4 sheets during uniaxial tension is investi-
gated using the EBSD technique and full-constraint poly-
crystal model. It is observed through the EBSD analysis
that, the stable orientation is strongly dependent on the
initial texture components.
Keywords AA5182-O � AL6111-T4 � Quasi-static and
dynamic response � Tensile split Hopkinson bar � EBSD
Introduction
Increasing the fuel efficiency while maintaining the safety
of the occupants has been an area of interest for the auto-
motive industry. To incorporate this desirable feature,
various alternatives have been explored (e.g. hybrid cars,
aerodynamic design etc.). One way to improve the fuel
efficiency is to reduce the weight of the automobile.
Consequently, aluminum alloys are gaining attention due to
their high strength to weight ratio [1]. One of the major
development in the automotive industry is the introduction
of Ford F-150 all aluminum truck. It is worthwhile to note
here that the overall reduction in weight of the F-150 truck
is around 317 kg (700 pounds). This reduction in weight
implies an increase in the fuel economy of the automotive.
Currently, aluminum alloys are being used for non-struc-
tural components such as deck lids and hoods with a pos-
sibility of more and more use in future [2]. Also, the weight
of the automobile can be successfully reduced through the
use of tailor welded blanks (TWB) technique, which results
in less number of parts, fewer spot welds and improved
structural integrity. TWB technique consists of joining two
or more materials of different thicknesses to produce one
sheet of variable thickness. Although this technique results
in effective use of material, it suffers from major drawback
because of the presence of a weld.
In general, aluminum alloys exhibit good strength and
stiffness but has comparatively poor formability at room
temperature than typical steel [3]. Hence, enhancing the
formability of aluminum alloys is currently an area of
considerable interest in the automotive industry and the
research community. It was reported in the literature that
the formability of aluminum alloys can be increased by
warm forming methods [4–8]. Also, Warm forming above
a critical temperature may negate the serrated flow
& Muneer Baig
1 AMI-CEREM-Center of Excellence for Research in
Engineering Materials, King Saud University, Riyadh 11421,
Kingdom of Saudi Arabia
2 Department of Mechanical Engineering, University of
Maryland Baltimore County, Baltimore, MD 21250, USA
3 Department of Materials Science and Metallurgical
Engineering, Sunchon National University,
Sunchon 540-742, Korea
123
J. dynamic behavior mater. (2015) 1:299–314
DOI 10.1007/s40870-015-0025-3
behavior [dynamic strain aging/Portevin-LeChatelier
(PLC) effect] observed on certain Al–Mg alloy [6].
Hughes et al. [9], in their efforts to understand the
material behavior of AA 5182-O as a function of strain rate
and temperature, performed a series compression experi-
ments in the strain rate and temperature regimes of 10-3 to
100 s-1 and 22–550 �C, respectively. Based on these
results they concluded that the deformation mechanism is
governed by dynamic strain aging at room temperature.
Further, negative strain rate sensitivity was observed at all
strain rates. Davies et al. [10] reported their work in
developing theoretical forming limit diagrams (FLDs) for
weld materials. They used power law along with the
Hosford yield criteria to obtain right-hand-side of FLD.
The authors concluded that AA5182-O exhibit near zero
strain rate sensitivity and consequently used a strain rate
insensitive constitutive model in their calculation of theo-
retical FLD. Picu et al. [1], investigated the effect of
dynamic strain aging on ductility of the aluminum alloy
AA5182-O. Experimental results at temperatures ranging
from -120 to 150 �C, and strain-rates from 10-6 to
10-1 s-1, were reported. They observed that AA5182-O
exhibit negative strain rate sensitivity in the temperature
regime of -80 to 110 �C.The structural components of automobiles are subjected
to quasi-static and dynamic loading rates during their
manufacturing processes, as well as in an accident. As
such, it is imperative to understand the material behavior
under these loading rates. With much of the progress done
in determination of the material behavior under quasi-static
loading rates, it was deemed important to determine
material response under high rates of loading. Since these
materials are in the form of thin sheets, Kolsky [11]
compression split Hopkinson bar (SHPB) was modified by
many researches to perform dynamic high strain-rate ten-
sile experiments. While the compression configuration
does not need any mechanism to grip the specimen, the
tensile configuration needs a grip to hold the specimen and
transmit the tensile pulse from incident to transmitted bar.
The major problem in designing a high strain-rate tensile
apparatus is the design of the griping mechanism. It was
mentioned by Kang et al. [12] that grips should be able to
clamp the specimen without sliding and reduce the
mechanical impedance so that the wave propagation is not
dissipative. Harding et al. [13] used a tension Hopkinson
bar in which the compressive pulse was sent in a tube
surrounding a solid inner rod. Although, this technique was
simple to use it had a major drawback of wave dispersion at
the mechanical joint. Similar setup was later used by
Hauser et al. [14]. Later, Lindholm and Yeakly [15] and
Lindholm [16] developed a technique where they used two
Hopkinson bars; one being solid and the other being hol-
low. They performed high strain-rate tensile experiments
on a hat shaped specimen. The technique was simple to use
but it was reported that, making a hat type specimen was a
complicated process. Nicholas [17, 18] modified the split
Hopkinson configuration by using a split-shoulder (collar)
arrangement surrounding a specimen threaded to the two
bars. The compressive pulse was generated on the incident
bar which traveled through the split shoulder (collar) to the
transmitted bar, without going through the specimen.
During passage of reflected tensile wave generated a ten-
sion in the specimen; the collar was inactive this time. In
this case, wave distortion occurred due to the clearance of
the threaded region [19]. Huh et al. [19] developed a tensile
split Hopkinson pressure bar (SHPB) in which a hollow
striker tube is fired from gas gun and impacts an anvil
which is a part of the incident bar. At the impact, a tensile
pulse is generated in incident bar and propagates through
the specimen to the transmitted bar. Staab and Gilat [20]
proposed a new method in which the portion on the inci-
dent bar was clamped using a clamping mechanism. The
clamped portion was then pre-tensioned. The clamp was
suddenly released to generate a tensile pulse in the incident
bar, which was transmitted to the other bar through the
specimen. They named this method as ‘‘direct tension’’.
The strain rate sensitivity of AA5182-O and on different
types of welds in TWBs, in the dynamic regime was not
fully explored. The present investigation was made to
address this void. The dynamic experiments were per-
formed by using modified tensile split Hopkinson pressure
bar, using a combination of Nicholas [17, 18] and Huh
et al. [19] techniques, to investigate the strain-rate sensi-
tivity of AA5182 and AL6111-T4, during tensile loading,
including welded alloy as well. The KHL constitutive
model was used to correlate and predict the experimental
response. Also, the texture evolution of AA5182-O and
AL6111-T4 sheets is investigated using electron
backscattered diffraction (EBSD) technique. The ODF
analysis was performed with respect to the sample sym-
metry defined by rolling direction (RD), transverse direc-
tion (TD), and normal direction (ND). To understand the
stable orientation developed in the quasi-static and
dynamic specimens, the rotation rate map and orientation
stability of typical texture components were theoretically
evaluated using a full-constraints polycrystal model [21,
22].
Experimental Procedures
Material
All the specimens used in this study were made from sheet
and were supplied by Pacific Northwest National Labora-
tories. The initial chemical composition of the base
300 J. dynamic behavior mater. (2015) 1:299–314
123
materials used in the current investigation is shown in
Table 1 (AA 5182-O) and Table 2 (Al6111-T4). The two
materials investigated are of significant interest to the
automotive industry which is inclined to reduce the weight
of automobiles and increase its fuel economy. The speci-
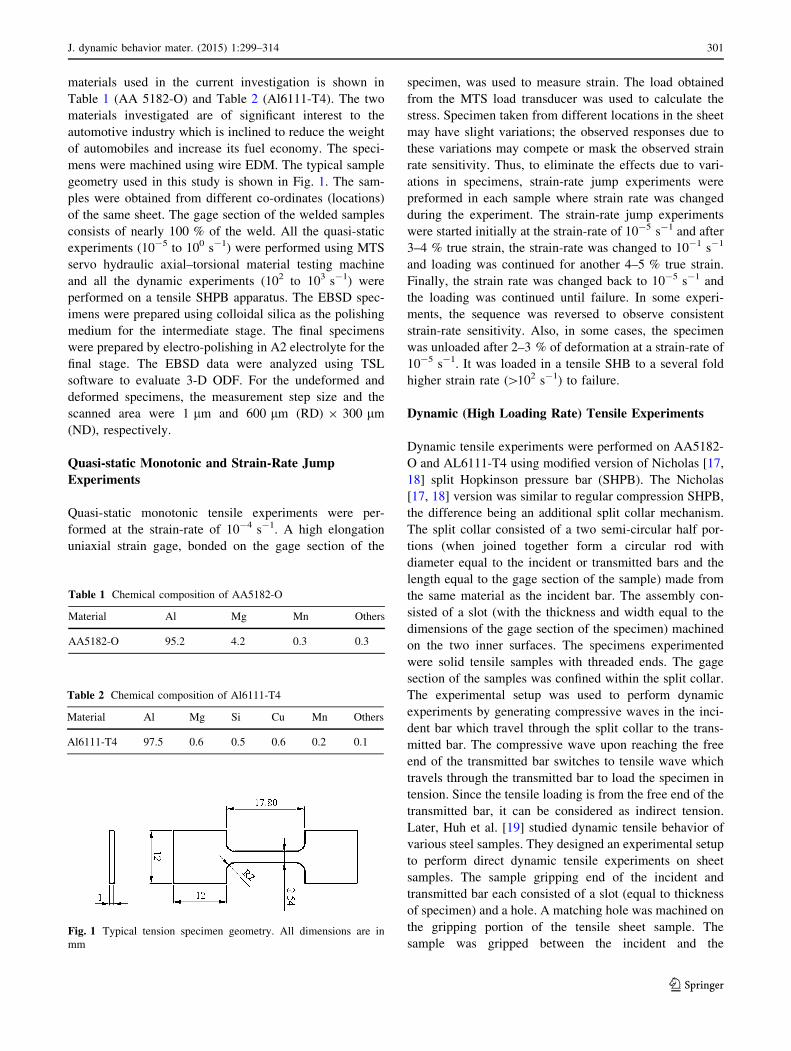
mens were machined using wire EDM. The typical sample
geometry used in this study is shown in Fig. 1. The sam-
ples were obtained from different co-ordinates (locations)
of the same sheet. The gage section of the welded samples
consists of nearly 100 % of the weld. All the quasi-static
experiments (10-5 to 100 s-1) were performed using MTS
servo hydraulic axial–torsional material testing machine
and all the dynamic experiments (102 to 103 s-1) were
performed on a tensile SHPB apparatus. The EBSD spec-
imens were prepared using colloidal silica as the polishing
medium for the intermediate stage. The final specimens
were prepared by electro-polishing in A2 electrolyte for the
final stage. The EBSD data were analyzed using TSL
software to evaluate 3-D ODF. For the undeformed and
deformed specimens, the measurement step size and the
scanned area were 1 lm and 600 lm (RD) 9 300 lm(ND), respectively.
Quasi-static Monotonic and Strain-Rate Jump
Experiments
Quasi-static monotonic tensile experiments were per-
formed at the strain-rate of 10-4 s-1. A high elongation
uniaxial strain gage, bonded on the gage section of the
specimen, was used to measure strain. The load obtained
from the MTS load transducer was used to calculate the
stress. Specimen taken from different locations in the sheet
may have slight variations; the observed responses due to
these variations may compete or mask the observed strain
rate sensitivity. Thus, to eliminate the effects due to vari-
ations in specimens, strain-rate jump experiments were
preformed in each sample where strain rate was changed
during the experiment. The strain-rate jump experiments
were started initially at the strain-rate of 10-5 s-1 and after
3–4 % true strain, the strain-rate was changed to 10-1 s-1
and loading was continued for another 4–5 % true strain.
Finally, the strain rate was changed back to 10-5 s-1 and
the loading was continued until failure. In some experi-
ments, the sequence was reversed to observe consistent
strain-rate sensitivity. Also, in some cases, the specimen
was unloaded after 2–3 % of deformation at a strain-rate of
10-5 s-1. It was loaded in a tensile SHB to a several fold
higher strain rate ([102 s-1) to failure.
Dynamic (High Loading Rate) Tensile Experiments
Dynamic tensile experiments were performed on AA5182-
O and AL6111-T4 using modified version of Nicholas [17,
18] split Hopkinson pressure bar (SHPB). The Nicholas
[17, 18] version was similar to regular compression SHPB,
the difference being an additional split collar mechanism.
The split collar consisted of a two semi-circular half por-
tions (when joined together form a circular rod with
diameter equal to the incident or transmitted bars and the
length equal to the gage section of the sample) made from
the same material as the incident bar. The assembly con-
sisted of a slot (with the thickness and width equal to the
dimensions of the gage section of the specimen) machined
on the two inner surfaces. The specimens experimented
were solid tensile samples with threaded ends. The gage
section of the samples was confined within the split collar.
The experimental setup was used to perform dynamic
experiments by generating compressive waves in the inci-
dent bar which travel through the split collar to the trans-
mitted bar. The compressive wave upon reaching the free
end of the transmitted bar switches to tensile wave which
travels through the transmitted bar to load the specimen in
tension. Since the tensile loading is from the free end of the
transmitted bar, it can be considered as indirect tension.
Later, Huh et al. [19] studied dynamic tensile behavior of
various steel samples. They designed an experimental setup
to perform direct dynamic tensile experiments on sheet
samples. The sample gripping end of the incident and
transmitted bar each consisted of a slot (equal to thickness
of specimen) and a hole. A matching hole was machined on
the gripping portion of the tensile sheet sample. The
sample was gripped between the incident and the
Table 1 Chemical composition of AA5182-O
Material Al Mg Mn Others
AA5182-O 95.2 4.2 0.3 0.3
Table 2 Chemical composition of Al6111-T4
Material Al Mg Si Cu Mn Others
Al6111-T4 97.5 0.6 0.5 0.6 0.2 0.1
Fig. 1 Typical tension specimen geometry. All dimensions are in
mm
J. dynamic behavior mater. (2015) 1:299–314 301
123
transmitted bar using a bolt an nut assembly that passed
through the specimen hole.
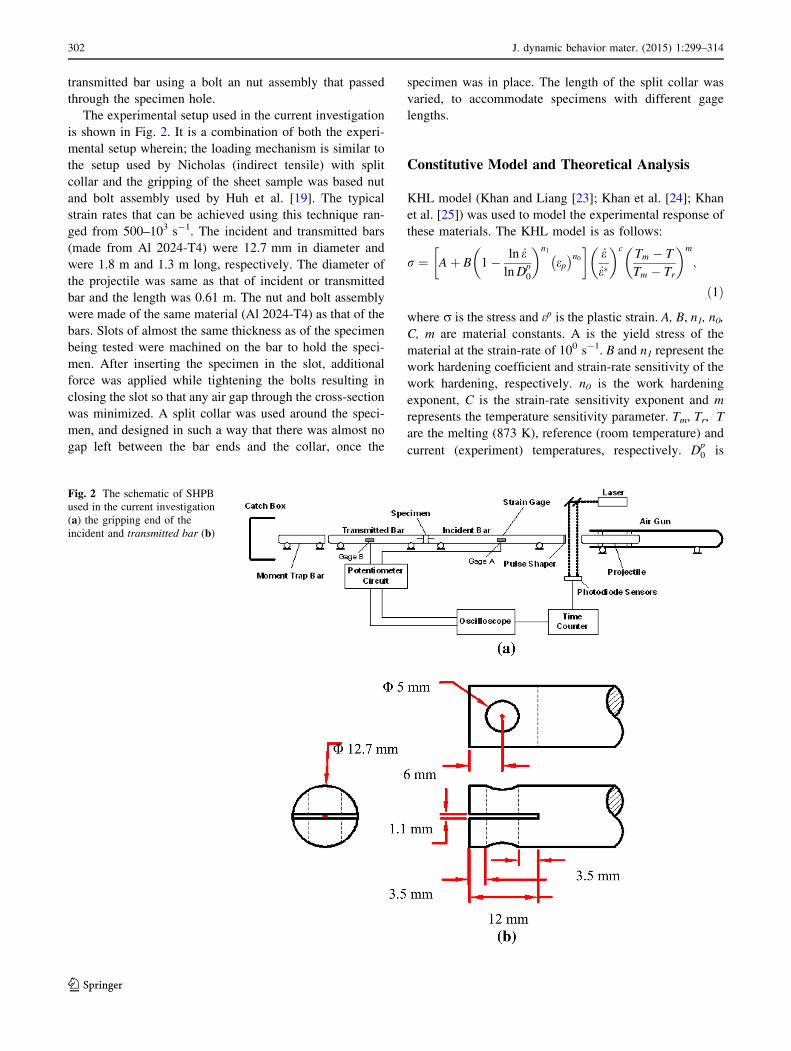
The experimental setup used in the current investigation
is shown in Fig. 2. It is a combination of both the experi-
mental setup wherein; the loading mechanism is similar to
the setup used by Nicholas (indirect tensile) with split
collar and the gripping of the sheet sample was based nut
and bolt assembly used by Huh et al. [19]. The typical
strain rates that can be achieved using this technique ran-
ged from 500–103 s-1. The incident and transmitted bars
(made from Al 2024-T4) were 12.7 mm in diameter and
were 1.8 m and 1.3 m long, respectively. The diameter of
the projectile was same as that of incident or transmitted
bar and the length was 0.61 m. The nut and bolt assembly
were made of the same material (Al 2024-T4) as that of the
bars. Slots of almost the same thickness as of the specimen
being tested were machined on the bar to hold the speci-
men. After inserting the specimen in the slot, additional
force was applied while tightening the bolts resulting in
closing the slot so that any air gap through the cross-section
was minimized. A split collar was used around the speci-
men, and designed in such a way that there was almost no
gap left between the bar ends and the collar, once the
specimen was in place. The length of the split collar was
varied, to accommodate specimens with different gage
lengths.
Constitutive Model and Theoretical Analysis
KHL model (Khan and Liang [23]; Khan et al. [24]; Khan
et al. [25]) was used to model the experimental response of
these materials. The KHL model is as follows:
r ¼ Aþ B 1� ln _elnD
p0
� �n1
ep� �n0� �
_e_e�
� �cTm � T
Tm � Tr
� �m
;
ð1Þ
where r is the stress and ep is the plastic strain. A, B, n1, n0,C, m are material constants. A is the yield stress of the
material at the strain-rate of 100 s-1. B and n1 represent the
work hardening coefficient and strain-rate sensitivity of the
work hardening, respectively. n0 is the work hardening
exponent, C is the strain-rate sensitivity exponent and m
represents the temperature sensitivity parameter. Tm, Tr, T
are the melting (873 K), reference (room temperature) and
current (experiment) temperatures, respectively. Dp0 is
Fig. 2 The schematic of SHPB
used in the current investigation
(a) the gripping end of the
incident and transmitted bar (b)
302 J. dynamic behavior mater. (2015) 1:299–314
123
arbitrarily chosen upper bound strain-rate, taken to be
106 s-1. _e represents the experimental strain-rate and _e� is
the normalizing strain-rate parameter, usually taken as 1/s.
The step by step procedure to obtain the material constants
for the KHL model can be found in Khan and Liang [23].
A full-constraints polycrystal model [21, 22] was used to
predict the rotation rate map and orientation stability dur-
ing uniaxial tension. The loading direction of AA5182-O
and AL6111-T4 sheets was parallel to the TD. Deformation
rate tensor, D along the TD can be described with respect
to the sample coordinate system as a function of plastic
strain ratio.
D ¼DRD 0 0
0 DTD 0
0 0 DND
24
35
¼ DTD
� RTD
RTD þ 10 0
0 1 0
0 0 � 1
RTD þ 1
26664
37775 ð2Þ
In the present study, the plastic strain ratio was deter-
mined theoretically using a visco-plastic self-consistent
(VPSC) polycrystal model under a stress boundary condi-
tion [26]. The estimated R-values of the IF-HSS sheet were
0.61 and 0.83, respectively. The deformation of rate sen-
sitive polycrystal is usually modeled by a power law
relationship between the shear rate _cs and the resolved
shear stress ss on a slip system s.
ss ¼ sosgnð _csÞ_cs_co
��������m
¼ so_cs_co
_cs_co
��������m�1
ð3Þ
where m is the rate sensitivity parameter, so is a reference
shear stress and _co is a reference shear rate. The sign term
in Eq. (3) means that the shear rate has the same sign with
the resolved shear stress. The resolved shear stress is
related to the Cauchy stress tensor rij of the crystal through
the following relation.
ss ¼ msijrij ð4Þ
where the Schmid tensor msij = bsi n
sj
is defined with the
component of the unit vector nsj which is normal to the slip
plane and the unit vector bsi which is parallel to the slip
direction of the slip system s. When the elastic deformation
is ignored, the vectors nsj and bsi are orthogonal. The
component of the strain rate tensor Dij associated to the
given stress tensor rij is
Dij ¼Xs
1
2ðms
ij þmsjiÞ _cs
¼_co
s1=mo
Xs
1
2ðms
ij þmsjiÞms
klrkl mspqrpq
��� ��� 1m�1
ð5Þ
It should be noted that the strain rate is deduced from the
following stress potential (Toth et al. [21]; Choi et al. [22])
FðrijÞ ¼m
ðmþ 1Þ_co
s1=mo
Xs
1
2ðms
ij þmsjiÞrij
��������1mþ1
¼ m
ð1þmÞ_WðrijÞ
and Dij ¼oFðrijÞorij
ð6Þ
where _WðrijÞ is the rate of plastic work according to the
prescribed strain rate Dij. The stress state which satisfies
the above equation for a given strain rate can be numeri-
cally obtained by the Newton–Raphson method. The lattice
rotation rate _Xij with respect to the laboratory is given as
follows.
_Xij ¼ Dij �Xs
msij _cs ð7Þ
The lattice rotation rate can be obtained from the pre-
scribed strain rate tensor Dij and the calculated shear rate
_cs. The Euler angles (/1;U;/2) of the individual orienta-
tions should be updated according to the lattice rotation
rate _gð _/1; _U; _/2Þ as_/1 ¼ ð _X32 sin/2 þ _X13 cos/2Þ= sinU_U ¼ _X32 cos/2 � _X13 sin/2
_/2 ¼ _X21 � _/1 cosU
ð8Þ
The kinematic stability of an orientation can be esti-
mated using two parameters. The first parameter is the
condition for either convergence or divergence of an ori-
entation in 3-D Euler space. The condition can be
expressed by divergence of the rotation field, _g ¼ð _/1; _U; _/2Þ as follows (Choi et al. [27])
div _g ¼ o _/1
o/1
þ o _UoU
þ o _/2
o/2
ð9Þ
The conditions for convergence and divergence are
div _g\0 and div _g[ 0 , respectively. div _g\0 indicates
that more orientations around g rotate toward g. The sec-
ond parameter is the relative magnitude of the lattice
rotation rate of the orientation in 3-D Euler space. The
stability parameter can be expressed in terms of the lattice
rotation rate (Choi et al. [27])
S ¼ ln_eeq_X�� ��
!¼ ln
_eeq½ _X2
32 þ _X213 þ _X2
21� 1=2
!ð10Þ
where _eeq is the von Mises equivalent strain rate for the
deformation mode of interest. Kinematically stable orien-
tations have high values of S compared with the unstable
orientation.
J. dynamic behavior mater. (2015) 1:299–314 303
123
Results and Discussion
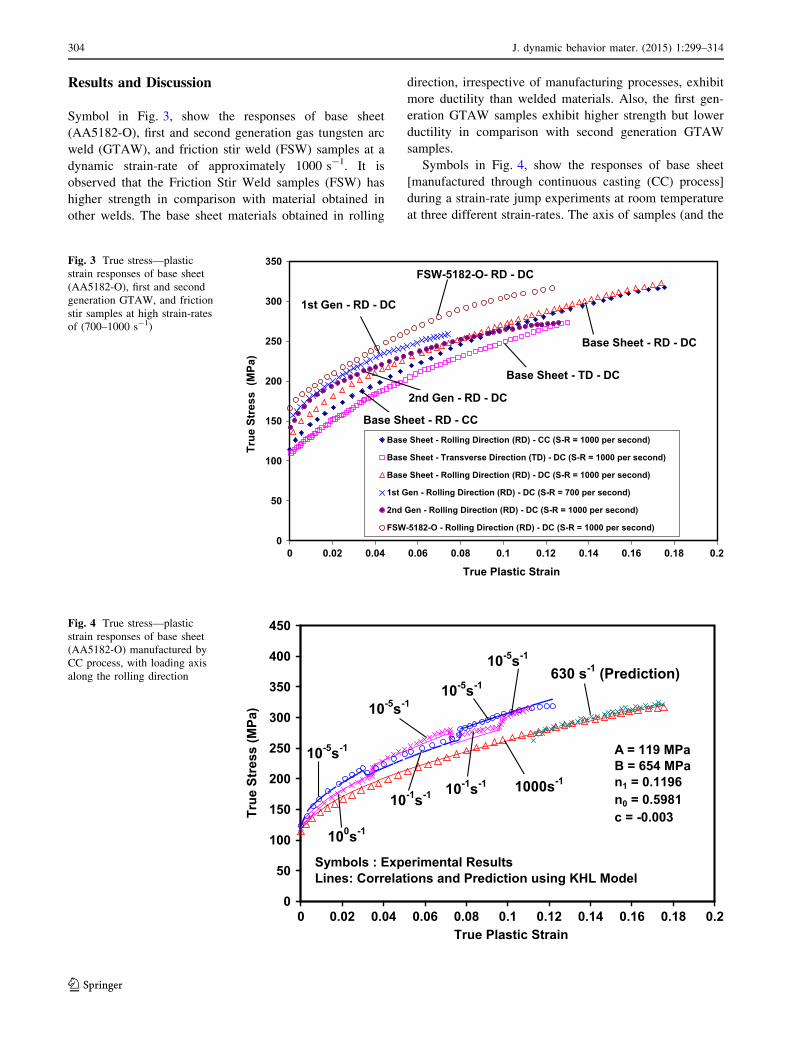
Symbol in Fig. 3, show the responses of base sheet
(AA5182-O), first and second generation gas tungsten arc
weld (GTAW), and friction stir weld (FSW) samples at a
dynamic strain-rate of approximately 1000 s-1. It is
observed that the Friction Stir Weld samples (FSW) has
higher strength in comparison with material obtained in
other welds. The base sheet materials obtained in rolling
direction, irrespective of manufacturing processes, exhibit
more ductility than welded materials. Also, the first gen-
eration GTAW samples exhibit higher strength but lower
ductility in comparison with second generation GTAW
samples.
Symbols in Fig. 4, show the responses of base sheet
[manufactured through continuous casting (CC) process]
during a strain-rate jump experiments at room temperature
at three different strain-rates. The axis of samples (and the
0
50
100
150
200
250
300
350
0 0.02 0.04 0.06 0.08 0.1 0.12 0.14 0.16 0.18 0.2
True Plastic Strain
True
Str
ess
(MPa
)
Base Sheet - Rolling Direction (RD) - CC (S-R = 1000 per second)
Base Sheet - Transverse Direction (TD) - DC (S-R = 1000 per second)
Base Sheet - Rolling Direction (RD) - DC (S-R = 1000 per second)
1st Gen - Rolling Direction (RD) - DC (S-R = 700 per second)
2nd Gen - Rolling Direction (RD) - DC (S-R = 1000 per second)
FSW-5182-O - Rolling Direction (RD) - DC (S-R = 1000 per second)
Base Sheet - TD - DC
Base Sheet - RD - CC
Base Sheet - RD - DC
1st Gen - RD - DC
FSW-5182-O- RD - DC
2nd Gen - RD - DC
Fig. 3 True stress—plastic
strain responses of base sheet
(AA5182-O), first and second
generation GTAW, and friction
stir samples at high strain-rates
of (700–1000 s-1)
0
50
100
150
200
250
300
350
400
450
0 0.02 0.04 0.06 0.08 0.1 0.12 0.14 0.16 0.18 0.2True Plastic Strain
True
Str
ess
(MPa
)
630 s-1 (Prediction)
Symbols : Experimental ResultsLines: Correlations and Prediction using KHL Model
100s-1
10-5s-1
10-1s-1
10-5s-1
10-5s-1
10-1s-1 1000s-1
A = 119 MPaB = 654 MPan1 = 0.1196n0 = 0.5981c = -0.003
10-5s-1
Fig. 4 True stress—plastic
strain responses of base sheet
(AA5182-O) manufactured by
CC process, with loading axis
along the rolling direction
304 J. dynamic behavior mater. (2015) 1:299–314
123
loading direction) was aligned with the rolling direction of
the base sheet. As seen in Fig. 4, the base material
(AA5182-O) exhibit negative strain-rate sensitivity. Picu
et al. [1] also observed similar behavior (but at low strain
rates) and concluded that the negative sensitivity of
AA5182 was due to the interaction of solute atoms with
dislocations. These interactions are associated to dynamic
strain ageing (DSA). The DSA mechanism may lead to
clustering of solute atoms which provides resistance to
dislocation motion. The average size of clusters is depen-
dent on strain-rate. At high strain-rates, the clusters are
smaller in size and do not offer significant resistance to the
dislocation motion. On the other hand, at a lower strain-rate
there is enough time to form large clusters which provide
resistance to dislocation motion. Hence, negative strain-
rate sensitivity is observed in this alloy (Picu et al. [1]).
Further, in this Fig. 4 it is observed that the ductility of the
base sheet material increases with strain-rate. The experi-
mental results from Fig. 4 are used to obtain the material
constants for the KHL constitutive model and the corre-
sponding correlations (lines) are also shown in the same
figure along with the experimental results (symbols). These
material parameters obtained for the base sheet material
(manufactured by using CC technique) are shown in the
insert of the Fig. 4. The experimental data at a strain rate of
630 s-1 was not used to determine the material constants.
Without changing these constants, the experimental result
at the strain-rate of 630 s-1 is predicted. The prediction is
observed to be very close to the experimental values.
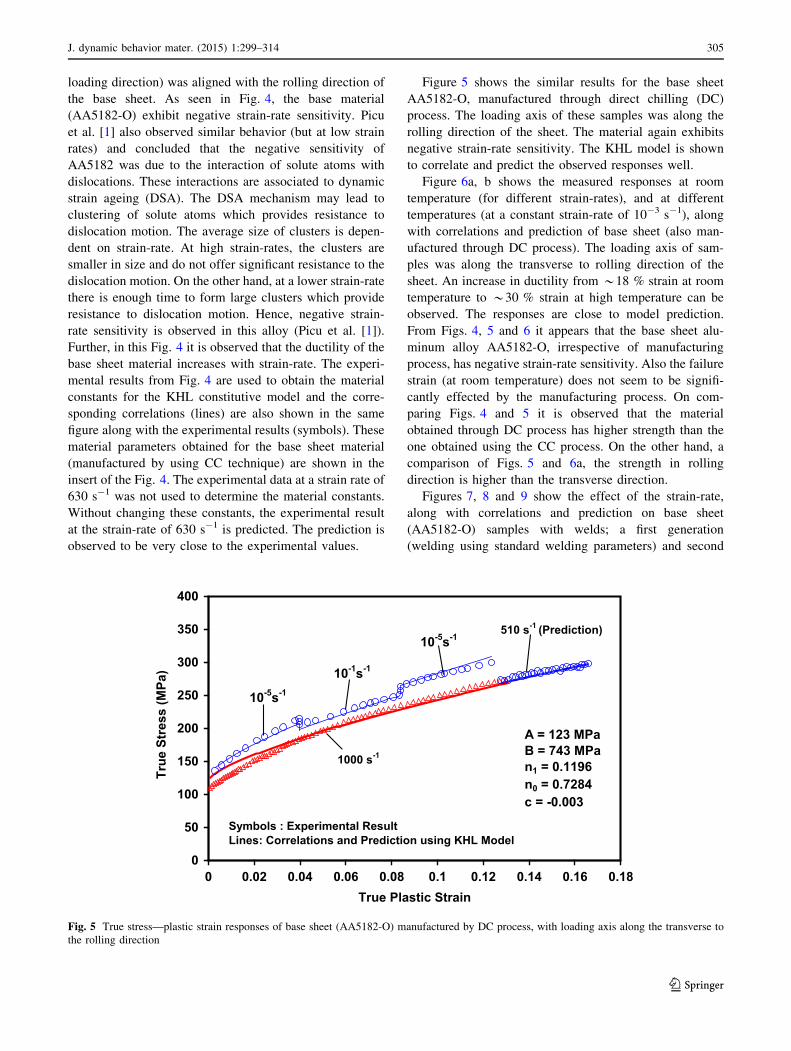
Figure 5 shows the similar results for the base sheet
AA5182-O, manufactured through direct chilling (DC)
process. The loading axis of these samples was along the
rolling direction of the sheet. The material again exhibits
negative strain-rate sensitivity. The KHL model is shown
to correlate and predict the observed responses well.
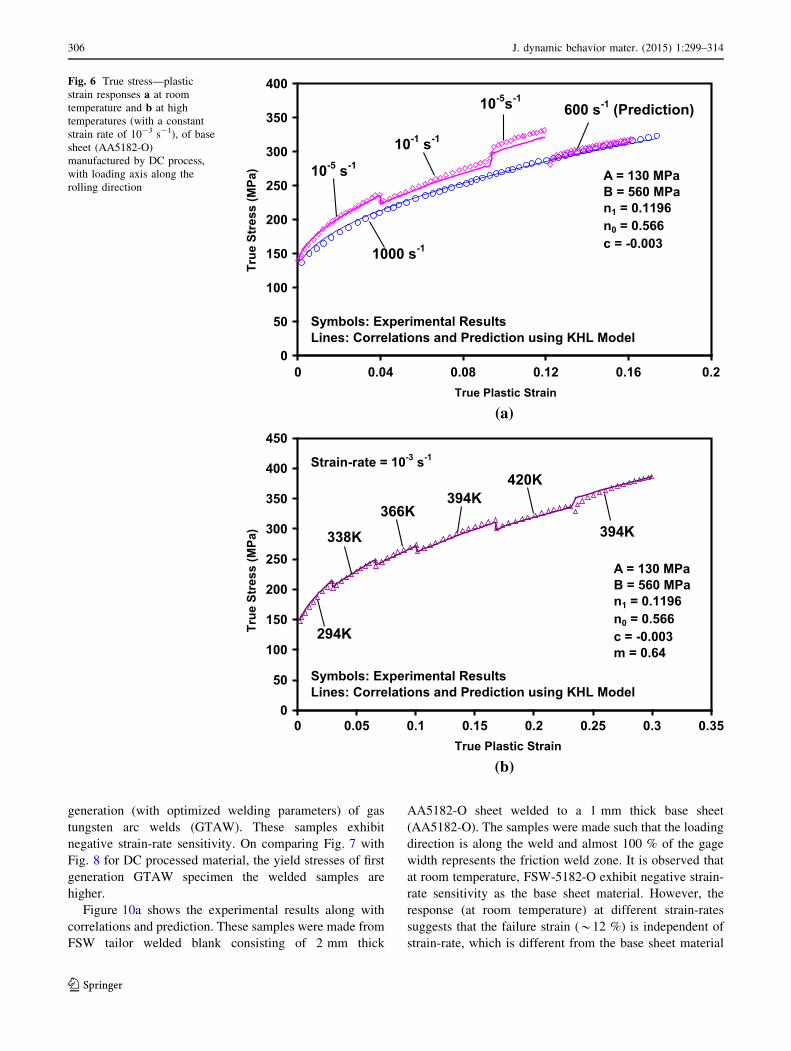
Figure 6a, b shows the measured responses at room
temperature (for different strain-rates), and at different
temperatures (at a constant strain-rate of 10-3 s-1), along
with correlations and prediction of base sheet (also man-
ufactured through DC process). The loading axis of sam-
ples was along the transverse to rolling direction of the
sheet. An increase in ductility from *18 % strain at room
temperature to *30 % strain at high temperature can be
observed. The responses are close to model prediction.
From Figs. 4, 5 and 6 it appears that the base sheet alu-
minum alloy AA5182-O, irrespective of manufacturing
process, has negative strain-rate sensitivity. Also the failure
strain (at room temperature) does not seem to be signifi-
cantly effected by the manufacturing process. On com-
paring Figs. 4 and 5 it is observed that the material
obtained through DC process has higher strength than the
one obtained using the CC process. On the other hand, a
comparison of Figs. 5 and 6a, the strength in rolling
direction is higher than the transverse direction.
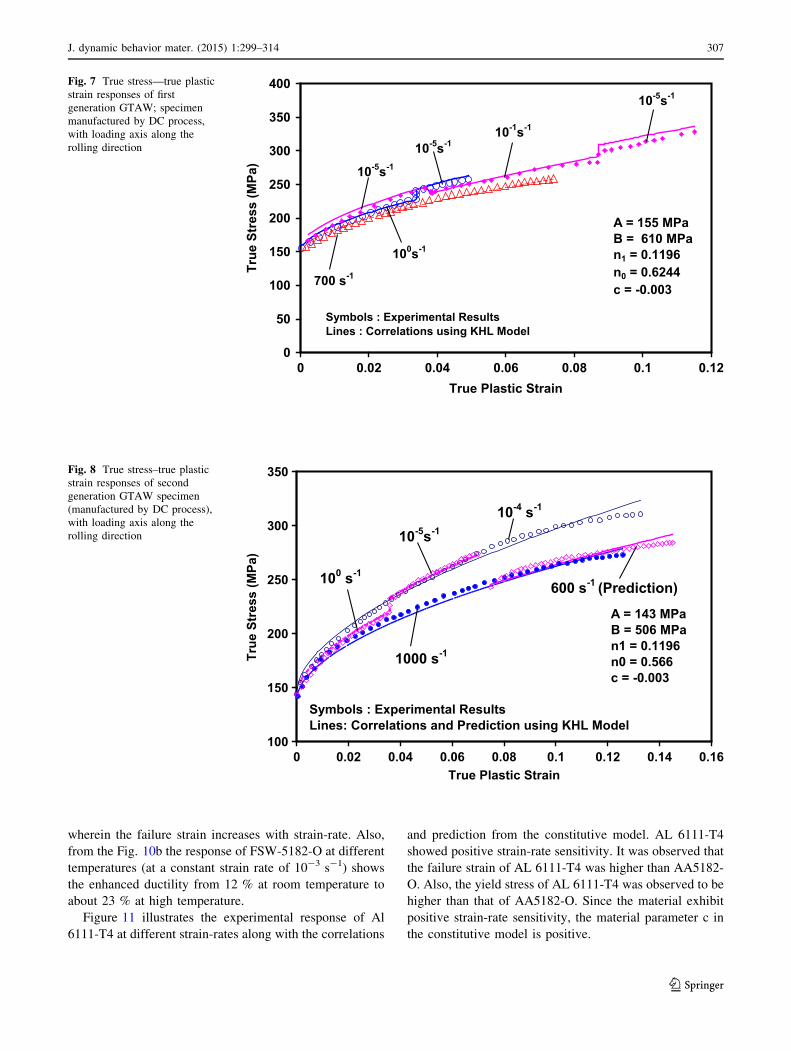
Figures 7, 8 and 9 show the effect of the strain-rate,
along with correlations and prediction on base sheet
(AA5182-O) samples with welds; a first generation
(welding using standard welding parameters) and second
0
50
100
150
200
250
300
350
400
0 0.02 0.04 0.06 0.08 0.1 0.12 0.14 0.16 0.18True Plastic Strain
True
Str
ess
(MPa
)
Symbols : Experimental ResultLines: Correlations and Prediction using KHL Model
510 s-1 (Prediction)
10-5s-1
10-1s-1
10-5s-1
1000 s-1
A = 123 MPaB = 743 MPan1 = 0.1196n0 = 0.7284c = -0.003
Fig. 5 True stress—plastic strain responses of base sheet (AA5182-O) manufactured by DC process, with loading axis along the transverse to
the rolling direction
J. dynamic behavior mater. (2015) 1:299–314 305
123
generation (with optimized welding parameters) of gas
tungsten arc welds (GTAW). These samples exhibit
negative strain-rate sensitivity. On comparing Fig. 7 with
Fig. 8 for DC processed material, the yield stresses of first
generation GTAW specimen the welded samples are
higher.
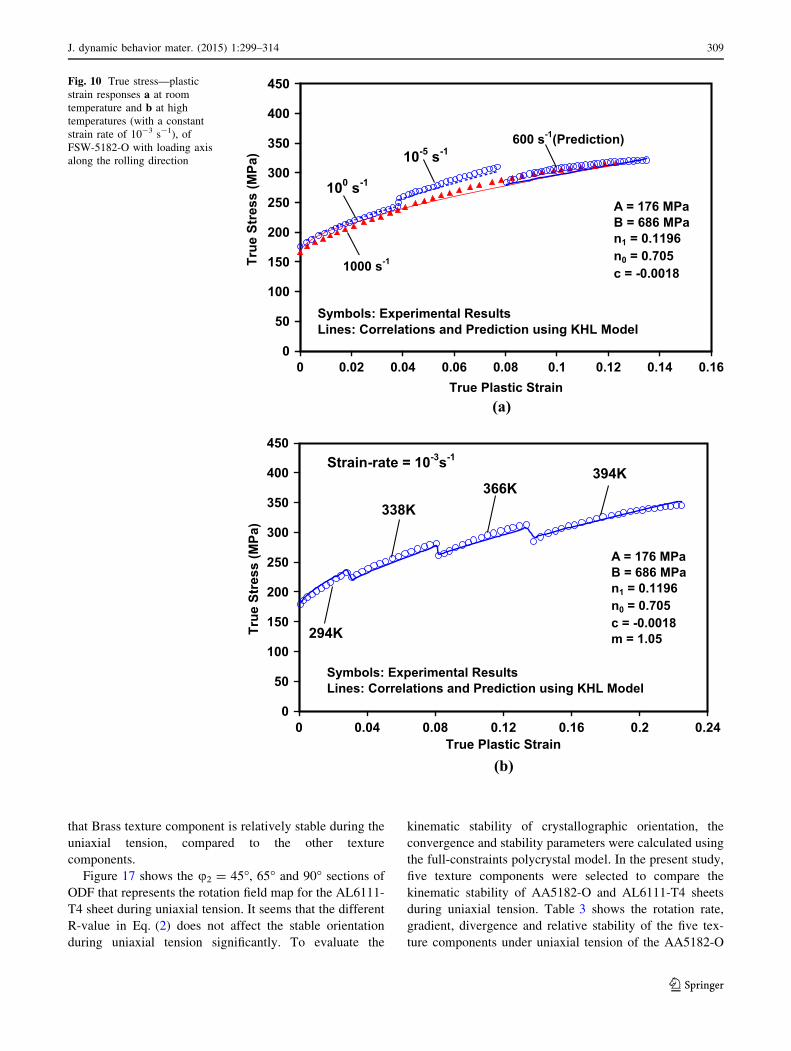
Figure 10a shows the experimental results along with
correlations and prediction. These samples were made from
FSW tailor welded blank consisting of 2 mm thick
AA5182-O sheet welded to a 1 mm thick base sheet
(AA5182-O). The samples were made such that the loading
direction is along the weld and almost 100 % of the gage
width represents the friction weld zone. It is observed that
at room temperature, FSW-5182-O exhibit negative strain-
rate sensitivity as the base sheet material. However, the
response (at room temperature) at different strain-rates
suggests that the failure strain (*12 %) is independent of
strain-rate, which is different from the base sheet material
0
50
100
150
200
250
300
350
400
0 0.04 0.08 0.12 0.16 0.2True Plastic Strain
10-5 s-1
10-1 s-1
10-5s-1
1000 s-1
600 s-1 (Prediction)
Symbols: Experimental ResultsLines: Correlations and Prediction using KHL Model
A = 130 MPaB = 560 MPan1 = 0.1196n0 = 0.566c = -0.003
(a)
0
50
100
150
200
250
300
350
400
450
0 0.05 0.1 0.15 0.2 0.25 0.3 0.35True Plastic Strain
True
Str
ess
(MPa
)Tr
ue S
tres
s (M
Pa)
Symbols: Experimental ResultsLines: Correlations and Prediction using KHL Model
A = 130 MPaB = 560 MPan1 = 0.1196n0 = 0.566c = -0.003m = 0.64
294K
338K
366K394K
420K
394K
Strain-rate = 10-3 s-1
(b)
Fig. 6 True stress—plastic
strain responses a at room
temperature and b at high
temperatures (with a constant
strain rate of 10-3 s-1), of base
sheet (AA5182-O)
manufactured by DC process,
with loading axis along the
rolling direction
306 J. dynamic behavior mater. (2015) 1:299–314
123
wherein the failure strain increases with strain-rate. Also,
from the Fig. 10b the response of FSW-5182-O at different
temperatures (at a constant strain rate of 10-3 s-1) shows
the enhanced ductility from 12 % at room temperature to
about 23 % at high temperature.
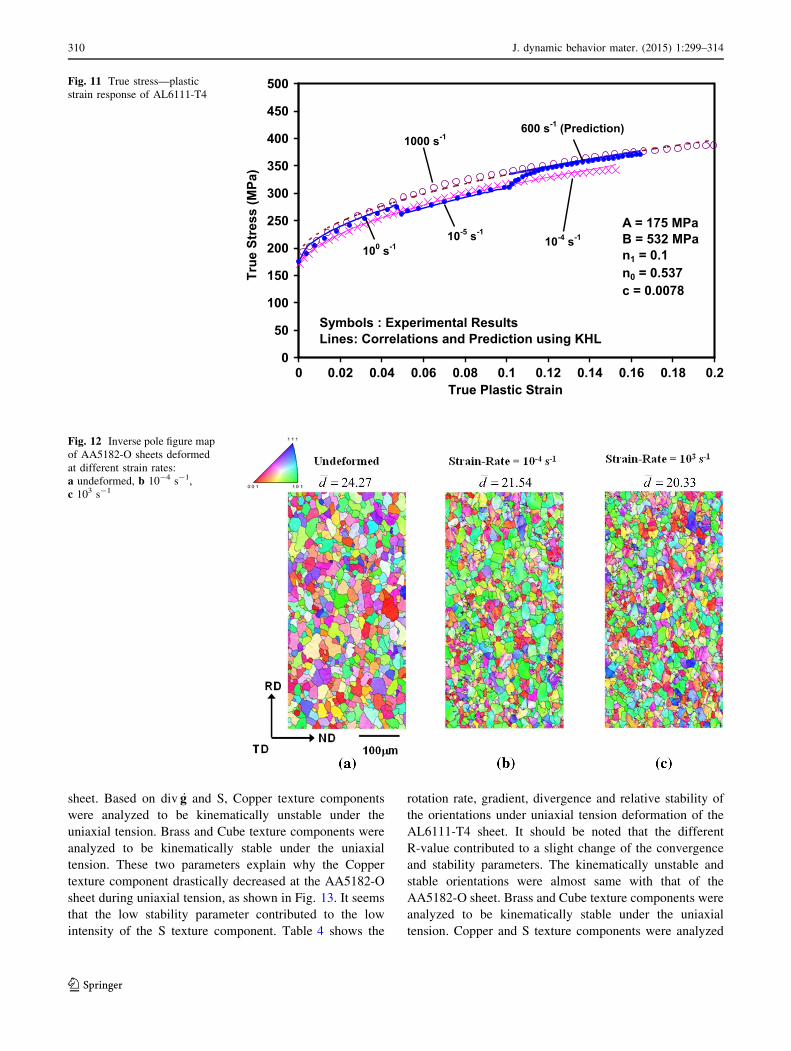
Figure 11 illustrates the experimental response of Al
6111-T4 at different strain-rates along with the correlations
and prediction from the constitutive model. AL 6111-T4
showed positive strain-rate sensitivity. It was observed that
the failure strain of AL 6111-T4 was higher than AA5182-
O. Also, the yield stress of AL 6111-T4 was observed to be
higher than that of AA5182-O. Since the material exhibit
positive strain-rate sensitivity, the material parameter c in
the constitutive model is positive.
0
50
100
150
200
250
300
350
400
0 0.02 0.04 0.06 0.08 0.1 0.12True Plastic Strain
True
Str
ess
(MPa
) 10-5s-1
Symbols : Experimental ResultsLines : Correlations using KHL Model
10-1s-1
10-5s-1
700 s-1
10-5s-1
100s-1
A = 155 MPaB = 610 MPan1 = 0.1196n0 = 0.6244c = -0.003
Fig. 7 True stress—true plastic
strain responses of first
generation GTAW; specimen
manufactured by DC process,
with loading axis along the
rolling direction
100
150
200
250
300
350
0 0.02 0.04 0.06 0.08 0.1 0.12 0.14 0.16True Plastic Strain
True
Str
ess
(MPa
)
600 s-1 (Prediction)
Symbols : Experimental ResultsLines: Correlations and Prediction using KHL Model
10-4 s-1
1000 s-1
100 s-1
10-5s-1
A = 143 MPaB = 506 MPan1 = 0.1196n0 = 0.566c = -0.003
Fig. 8 True stress–true plastic
strain responses of second
generation GTAW specimen
(manufactured by DC process),
with loading axis along the
rolling direction
J. dynamic behavior mater. (2015) 1:299–314 307
123
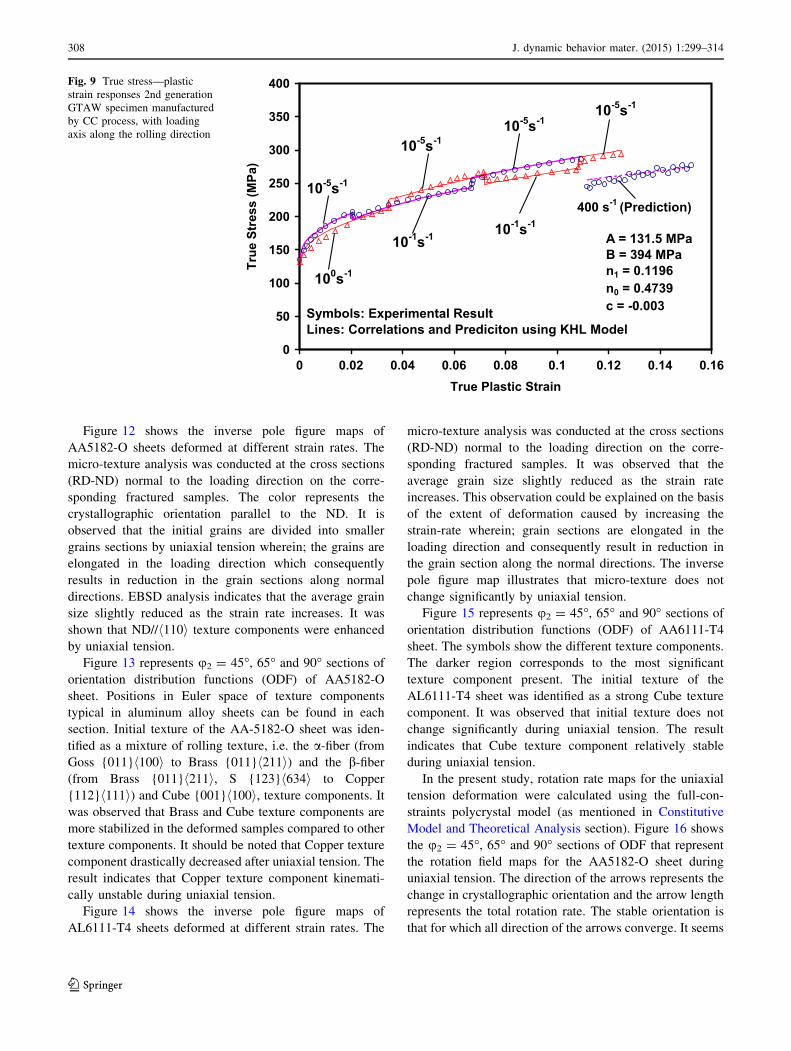
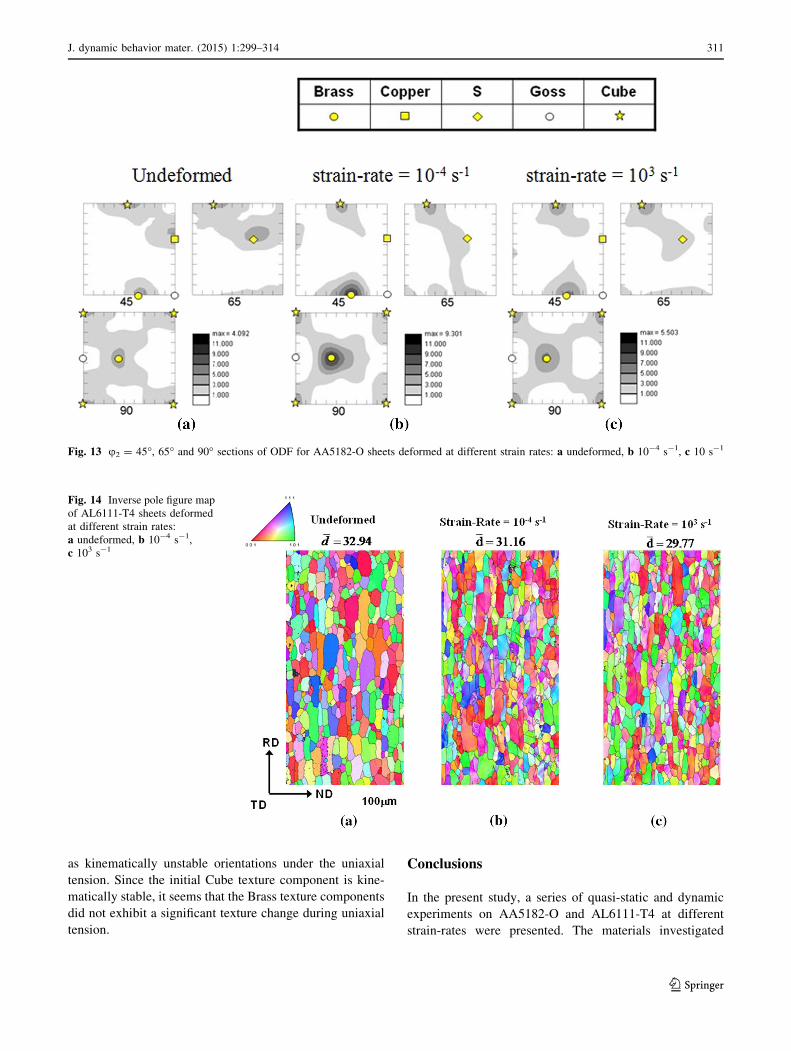
Figure 12 shows the inverse pole figure maps of
AA5182-O sheets deformed at different strain rates. The
micro-texture analysis was conducted at the cross sections
(RD-ND) normal to the loading direction on the corre-
sponding fractured samples. The color represents the
crystallographic orientation parallel to the ND. It is
observed that the initial grains are divided into smaller
grains sections by uniaxial tension wherein; the grains are
elongated in the loading direction which consequently
results in reduction in the grain sections along normal
directions. EBSD analysis indicates that the average grain
size slightly reduced as the strain rate increases. It was
shown that ND//h110i texture components were enhanced
by uniaxial tension.
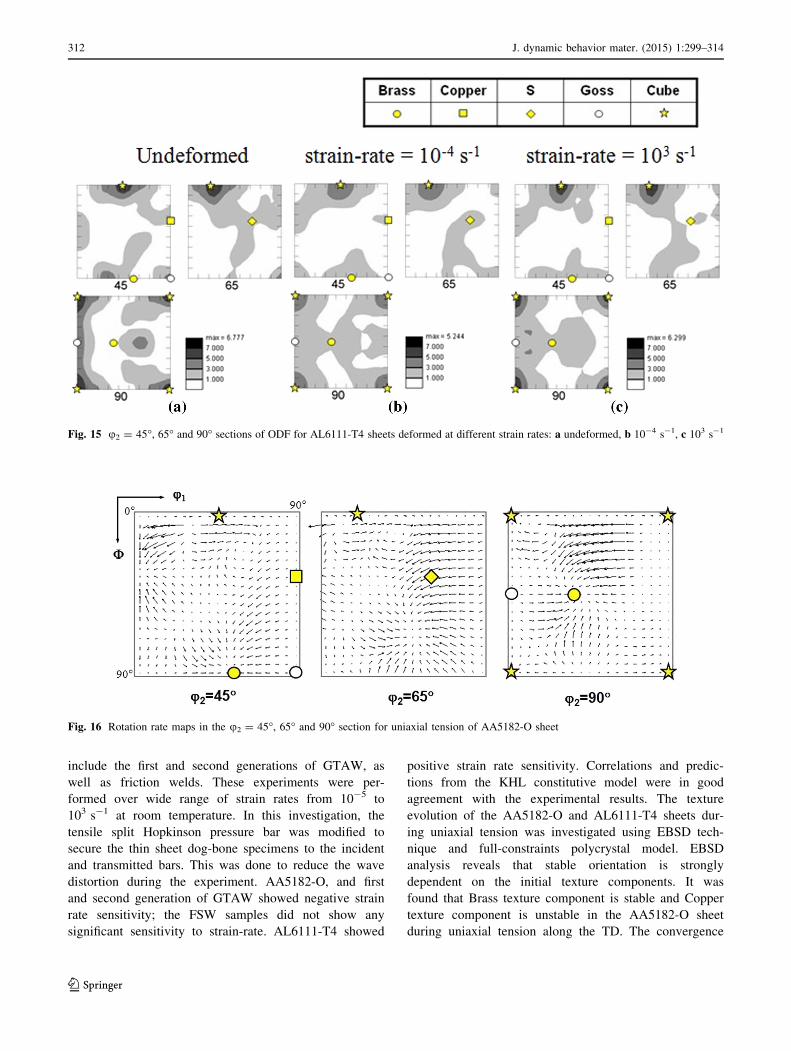
Figure 13 represents u2 = 45�, 65� and 90� sections oforientation distribution functions (ODF) of AA5182-O
sheet. Positions in Euler space of texture components
typical in aluminum alloy sheets can be found in each
section. Initial texture of the AA-5182-O sheet was iden-
tified as a mixture of rolling texture, i.e. the a-fiber (fromGoss {011}h100i to Brass {011}h211i) and the b-fiber(from Brass {011}h211i, S {123}h634i to Copper
{112}h111i) and Cube {001}h100i, texture components. It
was observed that Brass and Cube texture components are
more stabilized in the deformed samples compared to other
texture components. It should be noted that Copper texture
component drastically decreased after uniaxial tension. The
result indicates that Copper texture component kinemati-
cally unstable during uniaxial tension.
Figure 14 shows the inverse pole figure maps of
AL6111-T4 sheets deformed at different strain rates. The
micro-texture analysis was conducted at the cross sections
(RD-ND) normal to the loading direction on the corre-
sponding fractured samples. It was observed that the
average grain size slightly reduced as the strain rate
increases. This observation could be explained on the basis
of the extent of deformation caused by increasing the
strain-rate wherein; grain sections are elongated in the
loading direction and consequently result in reduction in
the grain section along the normal directions. The inverse
pole figure map illustrates that micro-texture does not
change significantly by uniaxial tension.
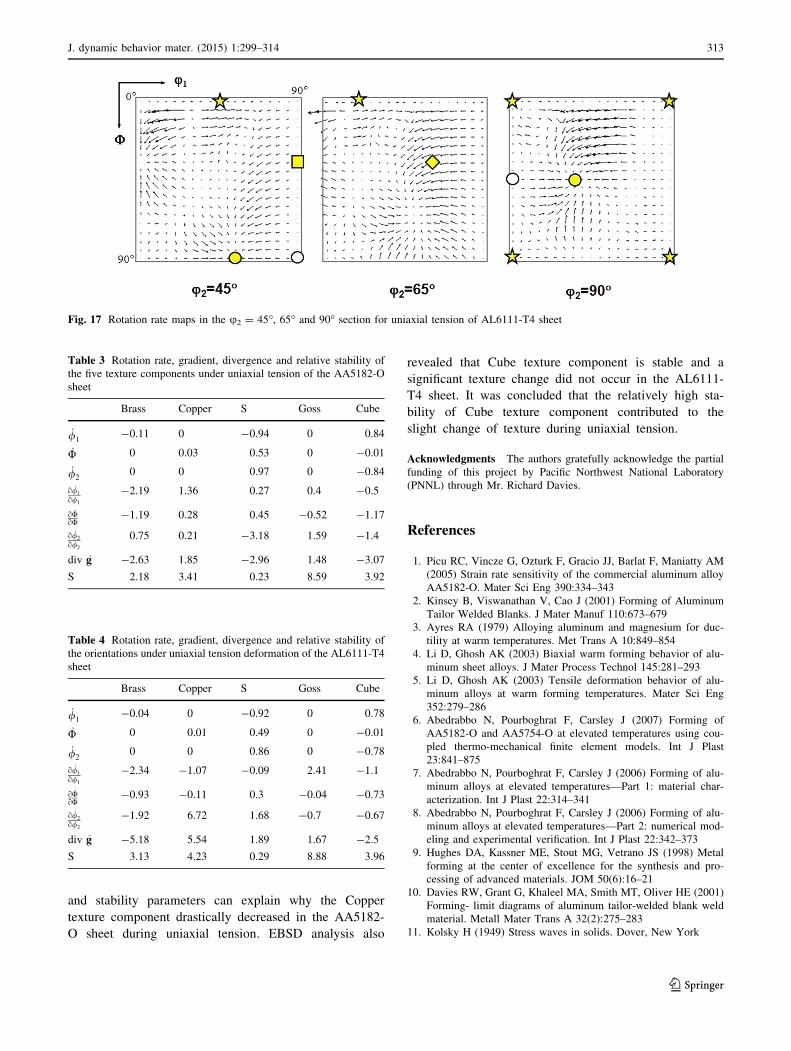
Figure 15 represents u2 = 45�, 65� and 90� sections oforientation distribution functions (ODF) of AA6111-T4
sheet. The symbols show the different texture components.
The darker region corresponds to the most significant
texture component present. The initial texture of the
AL6111-T4 sheet was identified as a strong Cube texture
component. It was observed that initial texture does not
change significantly during uniaxial tension. The result
indicates that Cube texture component relatively stable
during uniaxial tension.
In the present study, rotation rate maps for the uniaxial
tension deformation were calculated using the full-con-
straints polycrystal model (as mentioned in Constitutive
Model and Theoretical Analysis section). Figure 16 shows
the u2 = 45�, 65� and 90� sections of ODF that represent
the rotation field maps for the AA5182-O sheet during
uniaxial tension. The direction of the arrows represents the
change in crystallographic orientation and the arrow length
represents the total rotation rate. The stable orientation is
that for which all direction of the arrows converge. It seems
0
50
100
150
200
250
300
350
400
0 0.02 0.04 0.06 0.08 0.1 0.12 0.14 0.16True Plastic Strain
True
Str
ess
(MPa
)
400 s-1 (Prediction)
Symbols: Experimental ResultLines: Correlations and Prediciton using KHL Model
10-5s-1
10-1s-1
10-5s-1
100s-1
10-5s-1
10-1s-1
10-5s-1
A = 131.5 MPaB = 394 MPan1 = 0.1196n0 = 0.4739c = -0.003
Fig. 9 True stress—plastic
strain responses 2nd generation
GTAW specimen manufactured
by CC process, with loading
axis along the rolling direction
308 J. dynamic behavior mater. (2015) 1:299–314
123
that Brass texture component is relatively stable during the
uniaxial tension, compared to the other texture
components.
Figure 17 shows the u2 = 45�, 65� and 90� sections ofODF that represents the rotation field map for the AL6111-
T4 sheet during uniaxial tension. It seems that the different
R-value in Eq. (2) does not affect the stable orientation
during uniaxial tension significantly. To evaluate the
kinematic stability of crystallographic orientation, the
convergence and stability parameters were calculated using
the full-constraints polycrystal model. In the present study,
five texture components were selected to compare the
kinematic stability of AA5182-O and AL6111-T4 sheets
during uniaxial tension. Table 3 shows the rotation rate,
gradient, divergence and relative stability of the five tex-
ture components under uniaxial tension of the AA5182-O
0
50
100
150
200
250
300
350
400
450
0 0.02 0.04 0.06 0.08 0.1 0.12 0.14 0.16True Plastic Strain
True
Str
ess
(MPa
)
Symbols: Experimental ResultsLines: Correlations and Prediction using KHL Model
100 s-1
10-5 s-1600 s-1(Prediction)
1000 s-1
A = 176 MPaB = 686 MPan1 = 0.1196n0 = 0.705c = -0.0018
(a)
0
50
100
150
200
250
300
350
400
450
0 0.04 0.08 0.12 0.16 0.2 0.24True Plastic Strain
True
Str
ess
(MPa
)
Symbols: Experimental ResultsLines: Correlations and Prediction using KHL Model
A = 176 MPaB = 686 MPan1 = 0.1196n0 = 0.705c = -0.0018m = 1.05294K
338K366K
394KStrain-rate = 10-3s-1
(b)
Fig. 10 True stress—plastic
strain responses a at room
temperature and b at high
temperatures (with a constant
strain rate of 10-3 s-1), of
FSW-5182-O with loading axis
along the rolling direction
J. dynamic behavior mater. (2015) 1:299–314 309
123
sheet. Based on div _g and S, Copper texture components
were analyzed to be kinematically unstable under the
uniaxial tension. Brass and Cube texture components were
analyzed to be kinematically stable under the uniaxial
tension. These two parameters explain why the Copper
texture component drastically decreased at the AA5182-O
sheet during uniaxial tension, as shown in Fig. 13. It seems
that the low stability parameter contributed to the low
intensity of the S texture component. Table 4 shows the
rotation rate, gradient, divergence and relative stability of
the orientations under uniaxial tension deformation of the
AL6111-T4 sheet. It should be noted that the different
R-value contributed to a slight change of the convergence
and stability parameters. The kinematically unstable and
stable orientations were almost same with that of the
AA5182-O sheet. Brass and Cube texture components were
analyzed to be kinematically stable under the uniaxial
tension. Copper and S texture components were analyzed
0
50
100
150
200
250
300
350
400
450
500
0 0.02 0.04 0.06 0.08 0.1 0.12 0.14 0.16 0.18 0.2True Plastic Strain
True
Str
ess
(MPa
)10-4 s-1
1000 s-1
100 s-110-5 s-1
Symbols : Experimental ResultsLines: Correlations and Prediction using KHL
600 s-1 (Prediction)
A = 175 MPaB = 532 MPan1 = 0.1n0 = 0.537c = 0.0078
Fig. 11 True stress—plastic
strain response of AL6111-T4
Fig. 12 Inverse pole figure map
of AA5182-O sheets deformed
at different strain rates:
a undeformed, b 10-4 s-1,
c 103 s-1
310 J. dynamic behavior mater. (2015) 1:299–314
123
as kinematically unstable orientations under the uniaxial
tension. Since the initial Cube texture component is kine-
matically stable, it seems that the Brass texture components
did not exhibit a significant texture change during uniaxial
tension.
Conclusions
In the present study, a series of quasi-static and dynamic
experiments on AA5182-O and AL6111-T4 at different
strain-rates were presented. The materials investigated
Fig. 13 u2 = 45�, 65� and 90� sections of ODF for AA5182-O sheets deformed at different strain rates: a undeformed, b 10-4 s-1, c 10 s-1
Fig. 14 Inverse pole figure map
of AL6111-T4 sheets deformed
at different strain rates:
a undeformed, b 10-4 s-1,
c 103 s-1
J. dynamic behavior mater. (2015) 1:299–314 311
123
include the first and second generations of GTAW, as
well as friction welds. These experiments were per-
formed over wide range of strain rates from 10-5 to
103 s-1 at room temperature. In this investigation, the
tensile split Hopkinson pressure bar was modified to
secure the thin sheet dog-bone specimens to the incident
and transmitted bars. This was done to reduce the wave
distortion during the experiment. AA5182-O, and first
and second generation of GTAW showed negative strain
rate sensitivity; the FSW samples did not show any
significant sensitivity to strain-rate. AL6111-T4 showed
positive strain rate sensitivity. Correlations and predic-
tions from the KHL constitutive model were in good
agreement with the experimental results. The texture
evolution of the AA5182-O and AL6111-T4 sheets dur-
ing uniaxial tension was investigated using EBSD tech-
nique and full-constraints polycrystal model. EBSD
analysis reveals that stable orientation is strongly
dependent on the initial texture components. It was
found that Brass texture component is stable and Copper
texture component is unstable in the AA5182-O sheet
during uniaxial tension along the TD. The convergence
Fig. 15 u2 = 45�, 65� and 90� sections of ODF for AL6111-T4 sheets deformed at different strain rates: a undeformed, b 10-4 s-1, c 103 s-1
Fig. 16 Rotation rate maps in the u2 = 45�, 65� and 90� section for uniaxial tension of AA5182-O sheet
312 J. dynamic behavior mater. (2015) 1:299–314
123
and stability parameters can explain why the Copper
texture component drastically decreased in the AA5182-
O sheet during uniaxial tension. EBSD analysis also
revealed that Cube texture component is stable and a
significant texture change did not occur in the AL6111-
T4 sheet. It was concluded that the relatively high sta-
bility of Cube texture component contributed to the
slight change of texture during uniaxial tension.
Acknowledgments The authors gratefully acknowledge the partial
funding of this project by Pacific Northwest National Laboratory
(PNNL) through Mr. Richard Davies.
References
1. Picu RC, Vincze G, Ozturk F, Gracio JJ, Barlat F, Maniatty AM
(2005) Strain rate sensitivity of the commercial aluminum alloy
AA5182-O. Mater Sci Eng 390:334–343
2. Kinsey B, Viswanathan V, Cao J (2001) Forming of Aluminum
Tailor Welded Blanks. J Mater Manuf 110:673–679
3. Ayres RA (1979) Alloying aluminum and magnesium for duc-
tility at warm temperatures. Met Trans A 10:849–854
4. Li D, Ghosh AK (2003) Biaxial warm forming behavior of alu-
minum sheet alloys. J Mater Process Technol 145:281–293
5. Li D, Ghosh AK (2003) Tensile deformation behavior of alu-
minum alloys at warm forming temperatures. Mater Sci Eng
352:279–286
6. Abedrabbo N, Pourboghrat F, Carsley J (2007) Forming of
AA5182-O and AA5754-O at elevated temperatures using cou-
pled thermo-mechanical finite element models. Int J Plast
23:841–875
7. Abedrabbo N, Pourboghrat F, Carsley J (2006) Forming of alu-
minum alloys at elevated temperatures—Part 1: material char-
acterization. Int J Plast 22:314–341
8. Abedrabbo N, Pourboghrat F, Carsley J (2006) Forming of alu-
minum alloys at elevated temperatures—Part 2: numerical mod-
eling and experimental verification. Int J Plast 22:342–373
9. Hughes DA, Kassner ME, Stout MG, Vetrano JS (1998) Metal
forming at the center of excellence for the synthesis and pro-
cessing of advanced materials. JOM 50(6):16–21
10. Davies RW, Grant G, Khaleel MA, Smith MT, Oliver HE (2001)
Forming- limit diagrams of aluminum tailor-welded blank weld
material. Metall Mater Trans A 32(2):275–283
11. Kolsky H (1949) Stress waves in solids. Dover, New York
Fig. 17 Rotation rate maps in the u2 = 45�, 65� and 90� section for uniaxial tension of AL6111-T4 sheet
Table 3 Rotation rate, gradient, divergence and relative stability of
the five texture components under uniaxial tension of the AA5182-O
sheet
Brass Copper S Goss Cube
_/1-0.11 0 -0.94 0 0.84
_U 0 0.03 0.53 0 -0.01
_/20 0 0.97 0 -0.84
o _/1
o/1
-2.19 1.36 0.27 0.4 -0.5
o _UoU
-1.19 0.28 0.45 -0.52 -1.17
o _/2
o/2
0.75 0.21 -3.18 1.59 -1.4
div _g -2.63 1.85 -2.96 1.48 -3.07
S 2.18 3.41 0.23 8.59 3.92
Table 4 Rotation rate, gradient, divergence and relative stability of
the orientations under uniaxial tension deformation of the AL6111-T4
sheet
Brass Copper S Goss Cube
_/1-0.04 0 -0.92 0 0.78
_U 0 0.01 0.49 0 -0.01
_/20 0 0.86 0 -0.78
o _/1
o/1
-2.34 -1.07 -0.09 2.41 -1.1
o _UoU
-0.93 -0.11 0.3 -0.04 -0.73
o _/2
o/2
-1.92 6.72 1.68 -0.7 -0.67
div _g -5.18 5.54 1.89 1.67 -2.5
S 3.13 4.23 0.29 8.88 3.96
J. dynamic behavior mater. (2015) 1:299–314 313
123
12. Kang WJ, Cho SS, Huh H, Chung DT (1998) Identification of
dynamic behavior of sheet metals for an auto-body with tension
split Hopkinson bar. SAE Trans J Mater Manuf 107:908–913
13. Harding J, Wood EO, Campbell JD (1960) Tensile testing of
materials at impact rates of strain. J Mech Eng Sci 2:88–96
14. Hauser FR (1966) Technique for measuring stress-strain relation
at high strain rate. Exp Mech 6:395–402
15. Lindholm US, Yeakly LM (1968) High strain-rate testing: tension
and compression. Exp Mech 8:1–9
16. Lindholm US (1971) High strain rate tests. In: Bunshah RF (ed)
Techniques of metals research, vol 5, 1st edn. Wiley, Hoboken
17. Nicholas T (1981) Tensile testing of materials at high rates of
strain. Exp Mech 21(5):177–185
18. Nicholas T (1982) Material Behavior at High Strain Rates. In:
Zukas JA, Swift HF, Greszczuk LB, Curran (eds) Impact
Dynamics, vol 8. Wiley, Hoboken
19. Huh H, Kang WJ, Han SS (2002) A tension split Hopkinson bar
for investigating the dynamic behavior of sheet metals. Exp Mech
42(1):8–17
20. Staab GH, Gilat A (1981) A direct-tension split Hopkinson bar
for high strain-rate testing. Exp Mech 31:232–235
21. Toth LS, Jonas JJ, Gilormini P, Bacroix B (1990) Length changes
during free end torsion: a rate sensitive analysis. Int J Plast
6:83–108
22. Choi SH, Cho JH, Oh KH, Chung KS, Barlat F (2000) Texture
evolution of FCC sheet metals during deep drawing process. Int J
Mech Sci 42:1571–1592
23. Khan AS, Liang R (1999) Behavior of three BCC metal over a
wide range of strain rates and temperatures. Int J Plast
15:1089–1109
24. Khan AS, Suh YS, Kazmi R (2004) Quasi-static and dynamic
loading responses and constitutive modeling of titanium alloys.
Int J Plast 20:2233–2248
25. Khan AS, Kazmi R, Farrokh B (2007) Multiaxial and non-pro-
portional loading responses, anisotropy and modeling of Ti–6Al–
4 V titanium alloy over wide ranges of strain rates and temper-
atures. Int J Plast 23:931–950
26. Choi SH, Brem JC, Barlat F, Oh KH (2000) Macroscopic ani-
sotropy in AA5019A sheets. Acta Mater 44:1853–1863
27. Choi SH, Han SH, Chin KG (2009) Simulation of orientation
gradients in a ferrite matrix containing hard martensite under
plane-strain flange deformation. Acta Mater 57:1947–1958
314 J. dynamic behavior mater. (2015) 1:299–314
123