Embed Size (px)
Citation preview
EFFECT OF MANIPULATED VISUAL FEEDBACK ON THE FORCE OUTPUT OF ISOKINETIC ELBOW FLEXION AND
EXTENSION PERFORMED BY UNIVERSITY MALE STUDENTS
BY
GE LI
07050593
AN HONOURS PROJECT SUBMITTED IN PARTIAL FULFILMENT OF THE REQUIREMENTS FOR THE DEGREE OF
BACHELOR OF ARTS
IN
PHYSICAL EDUCATION AND RECREATION MANAGEMENT (HONOURS)
HONG KONG BAPTIST UNIVERSITY
APRIL 2010
HONG KONG BAPTIST UNIVERSITY
23th APRIL, 2010
We hereby recommend that the Honours Project by Mr. Ge Li entitled “Effect of
Manipulated Visual Feedback on the Force Output of Isokinetic Elbow Flexion and
Extension Performed by University Male Students”
be accepted in partial fulfillment of the requirements for the Bachelor of Arts Honours
Degree in Physical Education And Recreation Management.
_______________________________ _______________________________
Prof. Chow Bik Chu Dr. Tong Kwok Keung
Chief Adviser Second Reader
DECLARATION
I hereby declare that this honours project “Effect of Manipulated Visual Feedback on
the Force Output of Isokinetic Elbow Flexion and Extension Performed by University
Male Students” represents my own work and had not been previously submitted to this or
other institution for a degree, diploma or other qualification. Citations from the other
authors were listed in the references.
________________________ Student Name
Date
ACKNOWLEDGEMENTS
I would like to express my deepest gratitude to my chief supervisor Prof. Chow Bik
Chu for her generous guidance and unfailing support throughout the whole project period.
I am truly grateful to her helpful suggestions and comments on the initial drafts.
In addition, sincere thanks go to Mr. Fung Ying Ki, the graduate stundent of Hong
Kong Baptist University, Department of Physical Education for his kindly instruction on
my project.
_____________________________
Student’s signature
Department of Physical Education
Hong Kong Baptist University
Date: ________________________
ABSTRACT
Manipulated visual feedback was not well studied about its efficacy on strength training.
A total of 30 university male students aged from 19 to 25 participated in the study and
assigned into one Control Group (CG), Experimental Group of Underrated Report (EGU)
and Experimental Group of Overrated Report (EGO). The subject performed eight
repetition-maximums (RMs) elbow flexion and extension on isokinetic dynamometer. The
video of real-time work value bar chart was captured in the first test and further edited
according to subject’s group. The video was played to subjects when performing eight
RMs elbow flexion and extension in the third test. Video played to CG was not
manipulated. The dynamic bar chart of video played to EGU was manipulated into
irrationally low and fading bar. That of EGO was into high and increasing one. The result
of Contrast test for ANOVA indicated no significant difference between the average peak
torque of CG and EG (p < 0.05). But the different manipulation aroused different
physiological response on the working muscles.
TABLE OF CONTENTS
CHAPTER Page
1. INTRODUCTION……………………………………………….…..……1 Statement of the Problem………………………………………....….2 Hypothesis ………………………………………………...…..….….2 Definition of Terms ………………………………………..….….….2 Delimitations……………………………………………….…...........4 Limitations………………………………………………..…….……5 Significance of the Study..………………………………..…….……6
2. REVIEW OF LITERATURE…………………………………..……….…7
Concurrent studies on the Effect of Visual Stimulation on Sport Performance…………………………………………..…….…7 Biofeedback Applications in Exercise Science and Physical Education ……………………………………………….…11 Application of Isokinetic Dynamometer in Exercise Science…….…13 Summary…………………………………………………….......…..15
3. METHOD………………………………………………………..….........17
Subjects……………………………………………….......................17 Testing Apparatus………………………………..………...…….….18 Pilot Testing……………………………………………….…..…….21 Procedures………………………………………………….…….....21 Method of Analysis…………………………………………………33
4. ANALYSIS OF DATA……………………………….…………….….....34
Results………………………………………………………….…...34
CHAPTER Page Discussions…………………………………………………..………..48
5. SUMMARY AND CONCLUSIONS……………………………..………..57
Summary of Results……………………………………………….….57 Conclusion………………………………………………………….…58 Recommendations of Further Study…………………………….…….58
REFERENCES………………………………………………………………..............60 APPENDIX…................................................................................................................65
A. Consent Form to Students (Chinese Version)………………………………65
B. Consent Form to Students (English Version)………………………… ……66
C. Physical Activity Readiness Questionnaire………………………………...68
D. Post-test Illustrations……………………………………………………….69
E. Two-Tailed Independent T-Test (Reference Only)…………………………70
LIST OF TABLES
TABLE Page
1. The Average Peak Torque of Eight-RM Elbow Flexion and
Extension during Pre-test by Descending Order in Reference
to Sum and the Result of Grouping…………………………………..……37
2. Descriptive Statistic for Pre-test Average Peak Torque ……………..…….39
3. The Average Peak Torque of Eight-RM Elbow Flexion and
Extension during Post-test by Descending Order in Reference
to Sum and the Result of Grouping………………………………..……….41
4. Descriptive Statistic for Post-test Average Peak Torque……………..…….43
5. Comparison between Pre-test Sum and Post-test Sum of
Average Peak Torques…………………………………………….…..……44
6. Result of One-Way ANOVA on the PreSUM, PostSUM,
and % Change among Three Groups (N=29)………………………………46
7. Result of the Contrast test for One-Way ANOVA (N=29)…….............…...47
LIST OF FIGURES
FIGURE Page
1. Sample of Work Report ……………………………………………………20
2. Sample Line-Chart………………………………………………………….20
3. Ergonomic Setting…………………………………………………………..23
4. CSMi Humac Norm Testing and Rehabilitation System……………………25
5. Flow Chart of Entire Experiment……………………………………..…….25
6. Edited Video for Experimental Group (Overrated Report)…………………28
7. Edited Video for Experimental Group (Underrated Report)………………..28
8. The Subject’s Posture during Post-test……………………………..………30
9. Sample Uutput Work Report Produced by Dynamometer………………….35
1
Chapter 1
INTRODUCTION
Do what people see during physical exercise influence the efficacy of training? Does
manipulated visual feedback affect the sport performance more significantly than without
manipulation? Although previous investigators have observed that knowledge of
performance via visual feedback tends to enhance performance during an isokinetic test
(Kim and Kramer, 1997), few researches related to the manipulated visual feedback in
exercise and training was conducted.
Among the limited studies in manipulated visual feedback, most researches were
related to motor learning. Manipulation was usually achieved by physical method e.g.
varying the illumination on both sides of a one way mirror. In this study, the visual
feedback was well manipulated by computer graphic editing.
On the other hand, the development of biofeedback technology also provided a lot of
evidences that visual feedbacks, as a broader concept, can enhance the force output
produced by muscle. Many visual biofeedback therapies also provided feasible ideas in
exercise science and physical education. Although not counted as biofeedback according to
the definition listed in later section, the experiment process in this study adopted the
common idea of biofeedback therapy, which is to interact with real-time feedback
information produced by instruments to achieve certain physiology alteration.
The purpose of this study was to assess the effect of manipulated visual feedback
2
aroused by real-time report on arm muscles’ force output in university male students by
using isokinetic dynamometer. The manipulated real-time report was dynamic bar-chart
work report in which the last four bars were edited into irrationally high (low) and kept
increasing (fading).
Statement of Problems
The effect of visual feedback on physical education or physical exercise was not
well studied. The visual feedback is not well adopted in athletes’ training currently.
Furthermore, few researches were conducted on the effect of manipulated real-time visual
feedback.
Hypothesis
The following hypothesis and questions were set in the study:
1. The average peak torque value of eight repetition-maximums elbow flexions and
extensions would not be enhanced by the visual feedback produced by underrated
and fading work report in the university male students.
2. The average peak torque value of eight repetition-maximums elbow flexions and
extensions would not be inhibited by the visual feedback produced by overrated
and increasing work report in the university male students.
Definition of Terms
The following terms were operationally defined especially for this study:
Visual Feedback
Visual feedback in this study described the situation when output report of the elbow
3
flexion and extension produced by the dynamometer influenced the same event (elbow
flexion and extension).
Biofeedback
Biofeedback is a process that enables an individual to learn how to change
physiological activity for the purposes of improving health and performance. Precise
instruments measure physiological activity such as brainwaves, heart function, breathing,
muscle activity, and skin temperature. These instruments rapidly and accurately "feed
back" information to the user. The presentation of this information — often in conjunction
with changes in thinking, emotions, and behavior — supports desired physiological
changes. Over time, these changes can endure without continued use of an instrument (The
Association for Applied Psychophysiology and Biofeedback [AAPB], 2008). The
experiment of this study is not counted as biofeedback according to the entire procedure
listed in Chapter 3.
Isokinetic
The action in which the rate of movement is constantly maintained through a
specific range of motion even though maximal force is exerted (Powers & Howley, 2007).
Powers and Howley added isokinetic means movement at a constant rate of speed. A
variable-resistance isokinetic dynamometer is an electronic-mechanical instrument that
maintains a constant speed of movement while varying the resistance during a particular
movement. The resistance offered by the instrument is an accommodating resistance,
which is designed to match the force generated by the muscle (p.436). Elbow flexion and
4
extension were performed on the CSMi Humac Norm Testing and Rehabilitation System
with right side elbow
Torque
Torque is the tendency of a force to rotate an object about an axis. Torque reported in
this study is a parameter reflects the tendency of a force produced by subject’s arm muscles
when performing elbow flexion and extension to rotate the crank. Since the length of lever
arm keeps constant and the magnitude of torque equals to the value that magnitude of force
applied times magnitude of length of lever arm. So the magnitude (value) of torque can
indirectly reflect the magnitude (value) of force output produced by the arm muscles.
Work
Work is defined as the amount of energy transferred by a force in physics. The work
report in this study reflects the amount of energy transferred by the force the subject
produced to the dynamometer. Since the work value keeps increasing during one repetition
in elbow flexion or extension, it is easier for subjects to understand so that the work report
was captured to produce visual feedback after edited.
University Male Students
University in this study is defined as the students in institutions of tertiary education
such as universities. These student sample subjects were all undergraduate male students in
Hong Kong Baptist University (aged 19 to 25).
Delimitations
The study was delimited to the following:
5
1. The participants of the study were delimited to university male undergraduate
students aged between 19 to 25 years old who major in Physical Education and
Recreation Management.
2. 30 students were selected as sample subjects. All the subjects were from Hong
Kong Baptist University.
3. The tests were conducted in the laboratory (Dr. Stephen Hui Research Center for
Physical Recreation and Wellness in Hong Kong Baptist University) in three
separate days.
Limitations
The study was limited by the following factors:
1. Due to the small sample size (N=30), the result of this study could not produce a
good generalization.
2. The participants’ attitude toward the test might affect the result of the study.
3. Although the three testing days were separated with minimum of three days, the
learning effect may exist.
4. The manipulated irrationally underrated and fading real-time work report may not
be vivid enough to effectively alter the physiology condition of the subject.
5. The manipulated irrationally overrated and increasing real-time work report may
not be vivid enough to effectively alter the physiology condition of the subject.
6. There were eight repetitions of elbow flexion and extension (trial set) functioned as
warming-up assigned before the maximum-effort set. The fatigue and energy loss
6
due to the trial set were uncontrollable.
7. The physical training and the life style of the subjects among the testing days were
uncontrollable.
Significance of Study
Few studies on the current topic were conducted before. So the efficacy of visual
feedback was usually ignored by general population when exercise. For example, it is
common in resistance weight training that the athletes fail to exert maximum strength due
to various reasons. This may reduce the stimulation to the target muscle and therefore
reduce the effect of weight training. Especially for low-repetition-rate and
high-peak-intensity weight training, whether the muscles contract then reach maximum
peak strength directly correlates to the muscular strength gaining and muscle hypertrophy.
A vivid manipulated visual arousal may help athletes to exert maximally themselves to
achieve better training result. Thus this study not only evaluated how significant the effect
of a visual feedback could be, but also provided an alternative training method for both
trainer and athletes as the virtual reality technology develops. Besides regular training, a
visual feedback may be further applied to sport game or competition especially in
non-confrontational sports such as weight lifting.
7
Chapter 2
REVIEW OF LITERATURE
The review of literature was mainly divided into four sections: (a) concurrent studies
on the effect of visual feedback on sport performance; (b) biofeedback applications in
exercise science and physical education; (c) application of isokinetic dynamometer in
exercise science; and (d) summary.
Concurrent Studies on the Efficacy of Visual Feedback on Sport Performance
Jung and Hallbeck (2004) conducted a research to quantify the magnitude of the
influence of the effects of instruction type, verbal encouragement, and visual feedback on
static strength and to verify the applicability of the Caldwell Regimen to grip strength
measurement. Twenty-one male students participated in the study that employed an
isokinetic wrist dynamometer to measure handgrip strength. The results revealed that these
three factors had significant positive effects on static grip strength, peak grip strength and
time to reach the maximal strength.
Campenella, Mattacola, and Kimura (2000) indicated that the use of visual and
combined visual and verbal feedback increased quadriceps and hamstrings force
production when compared to the control condition where no feedback was provided. In
their study, fifteen males and 15 females (age = 25.4 \pm 2.4 yrs, wt = 76.6 \pm 16.5 kg, ht
= 173.61 \pm 9.5 cm) subjects were performed on the Biodex B-2000 isokinetic
dynamometer in three sessions, separated by 7 to 14 days. Subjects tested under the
8
following conditions: (a) visual feedback, (b) verbal encouragement, (c) combined visual
feedback and verbal encouragement, and (d) no feedback (control). The authors found that
examination of quadriceps force production revealed that subjects generated greater peak
torque when visual feedback was provided than when verbal encouragement or no
feedback were provided. Similarly, quadriceps force production was greater when
combined visual feedback and verbal encouragement was provided than when verbal
encouragement or no feedback were provided (p<0.05). Examination of hamstrings force
production revealed that subjects generated greater peak torque when combined visual
feedback and verbal encouragement was provided than when verbal encouragement and no
feedback were provided. Additionally, hamstrings force production was greater when
visual feedback was provided than when no feedback was provided (p<0.05).
In another study conducted by Gallagher, McClure, McGuigan, Crothers, and
Browning (1999), virtual reality was indicated to effectively enhance hand-eye
coordination of novice endoscopic surgeons. Virtual reality is a kind of visual feedback
because the virtual reality interacts with people and gives feedbacks. In the study, sixteen
participants with no experience of endoscopy were required to make multiple defined
incisions under laparoscopic laboratory conditions within 2-minute periods. Half of the
subjects were randomized to receive initial training on the Minimally Invasive Surgical
Trainer, Virtual Reality (MIST VR) computer program. The result was participants with
MIST VR traing made significantly more correct incisions (P = 0.0001) than the control
group on test trial 1, and even after extended practice by both groups (P = 0.0001). They
9
were also significantly more likely to actively use both hands to perform the endoscopic
evaluation task (P = 0.01). Although this study was about medical science, eye-hand
coordination was also a critical characteristic in some sports.
Sihvonen, Sipilä, and Era (2004) indicated that balance training based on visual
feedback improves the balance control in frail elderly women living in residential care,
also enhancing the performance of functional balancing tasks relevant to daily living. They
studied on elderly women of two residential care facilities who were randomized to an
exercise group (EG, n = 20) and to a control group (CG, n = 7). The EG participated in
training sessions three times/week for 4 weeks. The exercises were carried out with a
computerized force platform with visual feedback screen. The dimensions of balance
function studied were standing body sway, dynamic weight shifting, and Berg Balance
Scale performance. The result was the EG showed significant improvement in balance
functions. The performance time in dynamic balance tests improved on average by 35.9%
compared with a 0.6% increase in the CG (p = 0.025–0.193). The performance distance in
these tests decreased on average by 28.2% in the EG as compared with a 9.8% decrease
seen in the CG. The Berg Balance Scale performance improved by 6.9% compared with a
0.7% increase in the CG (p = 0.003). The standing balance tests in the more demanding
standing positions showed improvements in the EG, whereas similar changes in the CG
were not found.
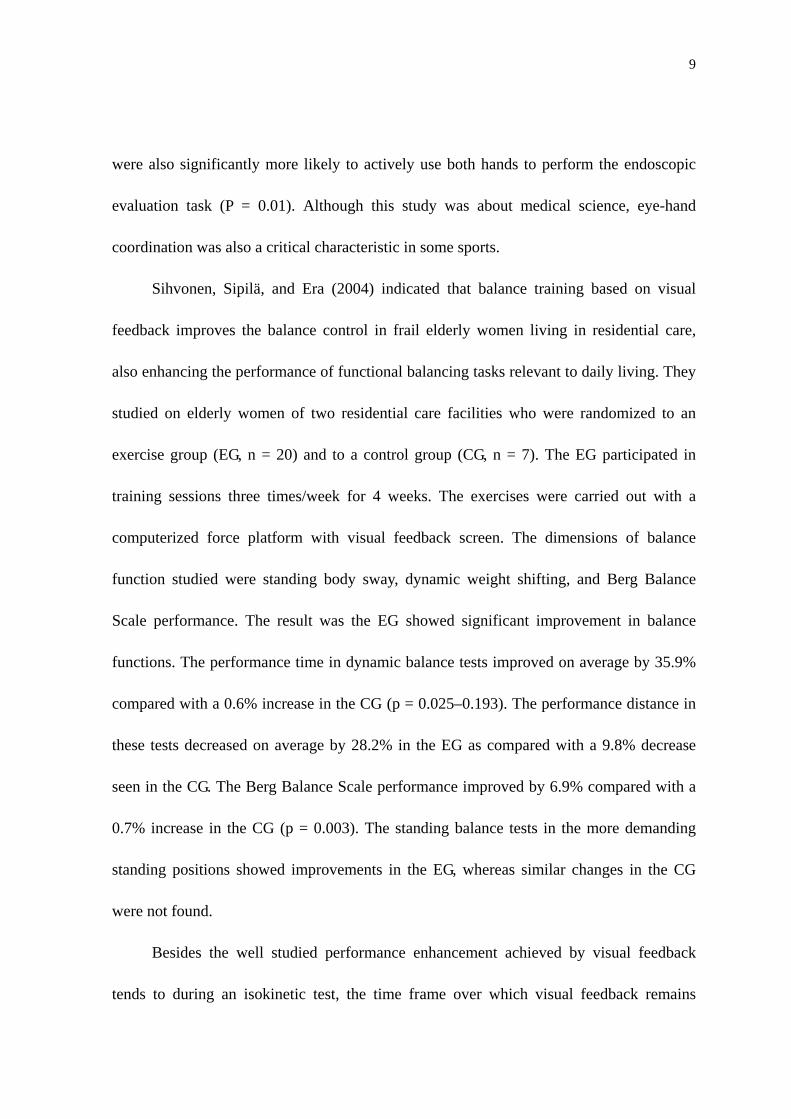
Besides the well studied performance enhancement achieved by visual feedback
tends to during an isokinetic test, the time frame over which visual feedback remains
10
advantageous has been studied by Kim and Kramer (1997). They found that the
effectiveness of visual feedback tended to decrease over the first three occasions,
suggesting that visual feedback may not be as advantageous once a skill is well learned.
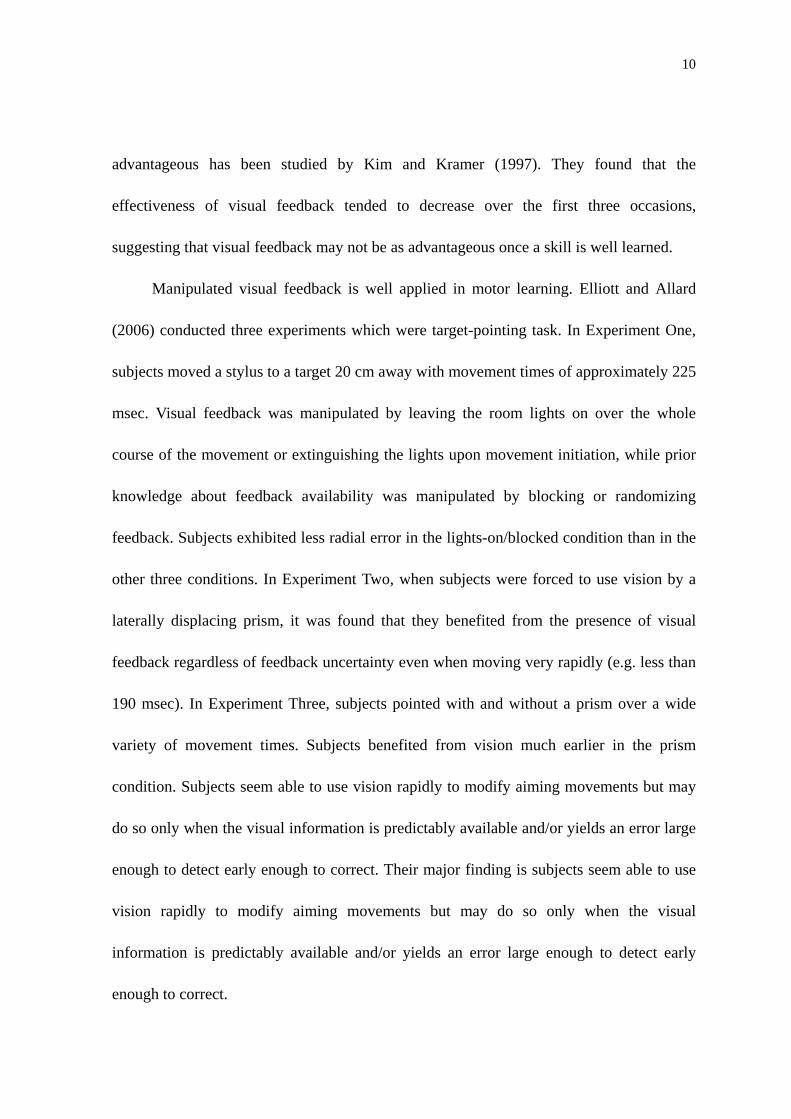
Manipulated visual feedback is well applied in motor learning. Elliott and Allard
(2006) conducted three experiments which were target-pointing task. In Experiment One,
subjects moved a stylus to a target 20 cm away with movement times of approximately 225
msec. Visual feedback was manipulated by leaving the room lights on over the whole
course of the movement or extinguishing the lights upon movement initiation, while prior
knowledge about feedback availability was manipulated by blocking or randomizing
feedback. Subjects exhibited less radial error in the lights-on/blocked condition than in the
other three conditions. In Experiment Two, when subjects were forced to use vision by a
laterally displacing prism, it was found that they benefited from the presence of visual
feedback regardless of feedback uncertainty even when moving very rapidly (e.g. less than
190 msec). In Experiment Three, subjects pointed with and without a prism over a wide
variety of movement times. Subjects benefited from vision much earlier in the prism
condition. Subjects seem able to use vision rapidly to modify aiming movements but may
do so only when the visual information is predictably available and/or yields an error large
enough to detect early enough to correct. Their major finding is subjects seem able to use
vision rapidly to modify aiming movements but may do so only when the visual
information is predictably available and/or yields an error large enough to detect early
enough to correct.
11
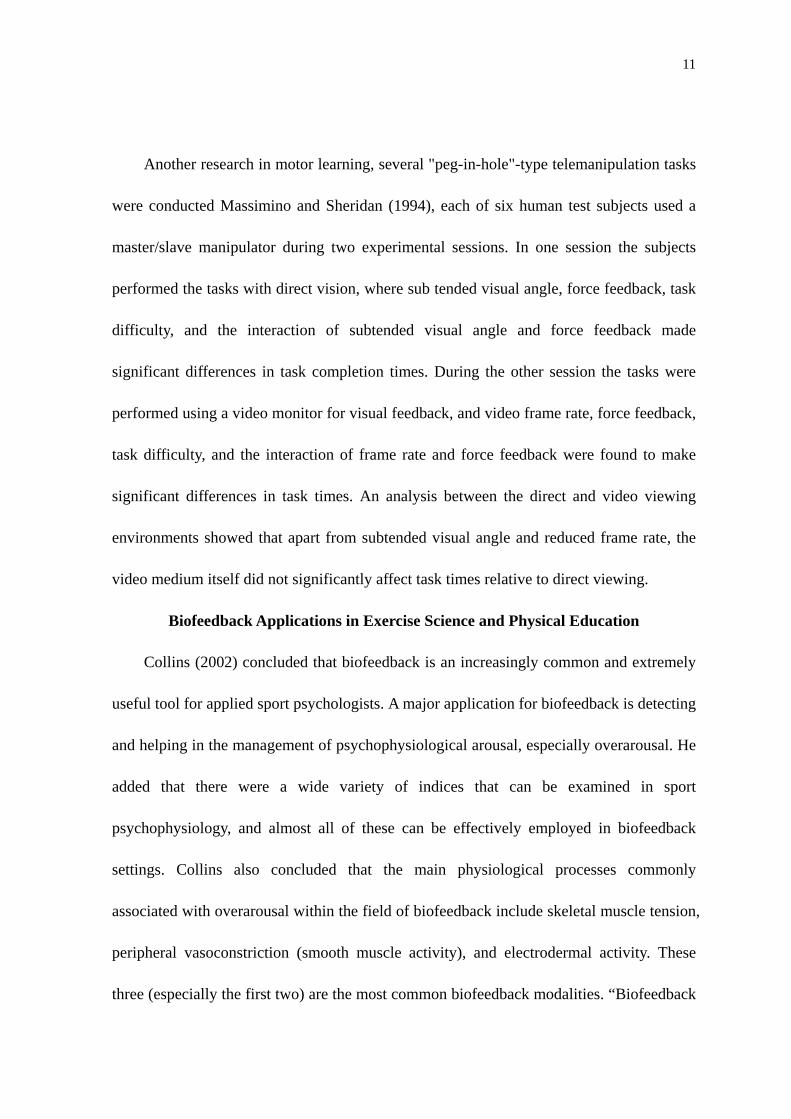
Another research in motor learning, several "peg-in-hole"-type telemanipulation tasks
were conducted Massimino and Sheridan (1994), each of six human test subjects used a
master/slave manipulator during two experimental sessions. In one session the subjects
performed the tasks with direct vision, where sub tended visual angle, force feedback, task
difficulty, and the interaction of subtended visual angle and force feedback made
significant differences in task completion times. During the other session the tasks were
performed using a video monitor for visual feedback, and video frame rate, force feedback,
task difficulty, and the interaction of frame rate and force feedback were found to make
significant differences in task times. An analysis between the direct and video viewing
environments showed that apart from subtended visual angle and reduced frame rate, the
video medium itself did not significantly affect task times relative to direct viewing.
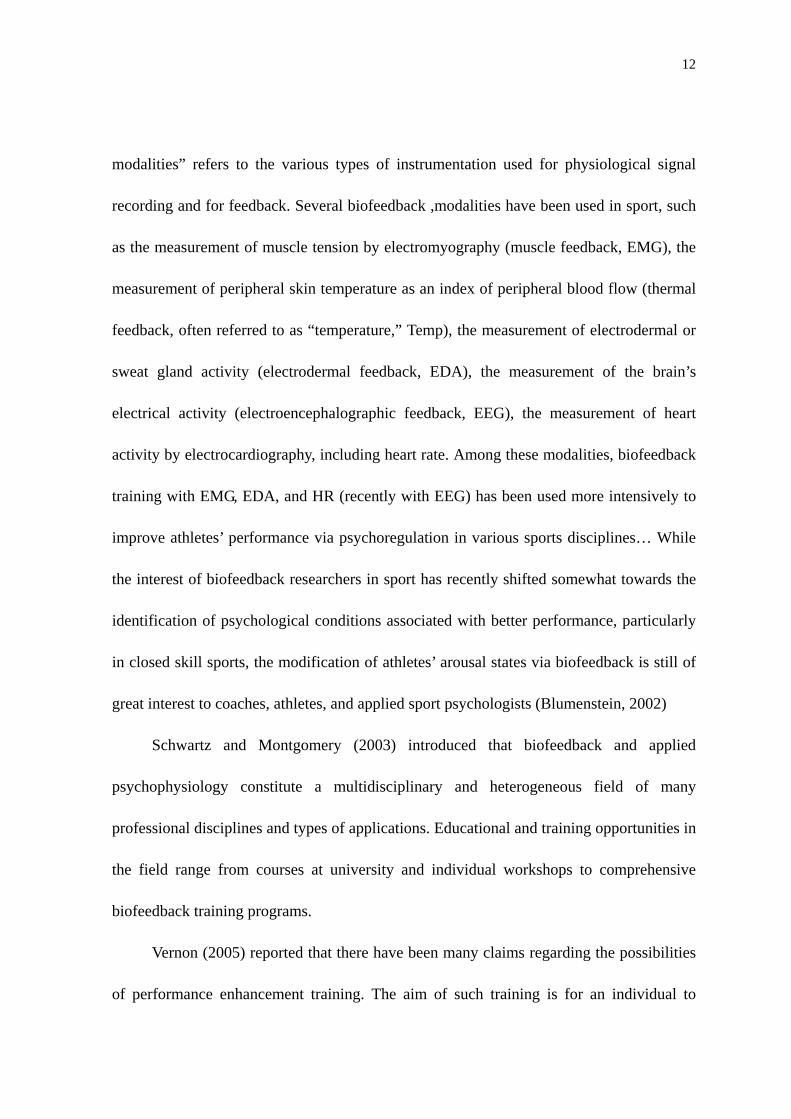
Biofeedback Applications in Exercise Science and Physical Education
Collins (2002) concluded that biofeedback is an increasingly common and extremely
useful tool for applied sport psychologists. A major application for biofeedback is detecting
and helping in the management of psychophysiological arousal, especially overarousal. He
added that there were a wide variety of indices that can be examined in sport
psychophysiology, and almost all of these can be effectively employed in biofeedback
settings. Collins also concluded that the main physiological processes commonly
associated with overarousal within the field of biofeedback include skeletal muscle tension,
peripheral vasoconstriction (smooth muscle activity), and electrodermal activity. These
three (especially the first two) are the most common biofeedback modalities. “Biofeedback
12
modalities” refers to the various types of instrumentation used for physiological signal
recording and for feedback. Several biofeedback ,modalities have been used in sport, such
as the measurement of muscle tension by electromyography (muscle feedback, EMG), the
measurement of peripheral skin temperature as an index of peripheral blood flow (thermal
feedback, often referred to as “temperature,” Temp), the measurement of electrodermal or
sweat gland activity (electrodermal feedback, EDA), the measurement of the brain’s
electrical activity (electroencephalographic feedback, EEG), the measurement of heart
activity by electrocardiography, including heart rate. Among these modalities, biofeedback
training with EMG, EDA, and HR (recently with EEG) has been used more intensively to
improve athletes’ performance via psychoregulation in various sports disciplines… While
the interest of biofeedback researchers in sport has recently shifted somewhat towards the
identification of psychological conditions associated with better performance, particularly
in closed skill sports, the modification of athletes’ arousal states via biofeedback is still of
great interest to coaches, athletes, and applied sport psychologists (Blumenstein, 2002)
Schwartz and Montgomery (2003) introduced that biofeedback and applied
psychophysiology constitute a multidisciplinary and heterogeneous field of many
professional disciplines and types of applications. Educational and training opportunities in
the field range from courses at university and individual workshops to comprehensive
biofeedback training programs.
Vernon (2005) reported that there have been many claims regarding the possibilities
of performance enhancement training. The aim of such training is for an individual to
13
complete a specific function or task with fewer errors and greater efficiency, resulting in a
more positive outcome. The present review examined evidence from neurofeedback
training studies to enhance performance in a particular area.
Besides fewer errors and greater efficiency, biofeedback is used to reduce the
psychological stress, so that the performance is enhanced. Blumenstein (2002) concluded
that research findings in the field of sport behavior and psychophysiology of exercise
indicate that psychological stress during training and competition can be reduced by
biofeedback training, and thus performance in different sport disciplines can be enhanced.
A very similar study was conducted by Cohen, Richardson, Klebez, Febbo, and
Tucker (2001). They studied on the effects of schedules of reinforcement on an EMG
response maintained by biofeedback. The biofeedback in this study was aiming to enhance
the forearm muscle tension. Because the study was the first attempt to compare the five
basic schedules of reinforcement (i.e., continuous reinforcement (CRF), variable interval
(VI), fixed interval (FI), variable ratio (VR), and fixed ratio (FR)) using the same
experimental procedures, only small values of each schedule were studied in order to
provide fairly comparable rates of reinforcement (feedback) under each of the four
intermittent schedules. But still, some of the data are consistent with the
partial-reinforcement-extinction effect.
Application of Isokinetic Dynamometer in Exercise Science
Isokinetic dynamometer is widely used in exercise science especially musle training
and rehabilitation. Wrigley and Strauss (2000) stated that isokinetic dynamometer can be
14
performed under a range of conditions - of angular velocity, positioning, range of motion,
contraction mode, movement sequence, and so on - from which a wide range of
measurement parameters can be derived.
CSMi Humac Norm Testing and Rehabilitation System, the dynamometer used in
this study, adopted proven mechanical design of the CYBEX NORM (CSMi Medical
Solution, 2005).
Bircan et al. (2002) conducted a study to investigate whether electrical stimulation is
effective in improving quadriceps strength in healthy subjects and to compare interferential
and low-frequency current in terms of the effects on quadriceps strength and perceived
discomfort by using an isokinetic dynamometer. Thirty medical faculty students, divided
into three groups, participated in the study. Group A received electrical stimulation with
bipolar interferential current while group B received electrical stimulation with
low-frequency current (symmetrical biphasic). Group C served as the control group.
Electrical stimulation was given for 15 minutes, five days a week for three weeks, at a
maximally tolerated intensity with the knee fully extended in the sitting position. Before
and after the study, quadriceps strength was measured with a Cybex dynamometer
isokinetically at the angular velocities of 60°/s and 120°/s. The perceived discomfort
experienced with each type of electrical stimulation was quantified by the use of a visual
analogue scale (VAS). Statistically signicant increase in isokinetic strength was observed
after training in group A and group B. Increase in strength did not differ between the
stimulation groups. No signicant change in strength occurred in group C. Perceived
15
discomfort by the stimulation groups was not signicantly different. The study indicated
both interferential and low-frequency currents can be used in strength training with the
parameters used in this study.
In another study conducted by Larivière, Gagnon, Arsenault, Gravel, and Loisel
(2005), the isokinetic dynamometer was used to assess the electromyographic activity
imbalances between contralateral back muscles. Healthy controls (n = 34) and chronic low
back pain subjects (n = 55) stood in a dynamometer measuring the principal (extension)
and coupled (lateral bending, axial rotation) L5/S1 moments during isometric trunk
extension efforts. The results showed that back pain subjects did not produce higher
coupled moments than controls. Providing feedback of the axial rotation moment to correct
asymmetric efforts during the task did not reduce EMG contralateral imbalances, except
for some extreme cases. Normalized EMG imbalance parameters remain relatively
constant between 40% and 80% of the maximal voluntary contraction. The reliability of
EMG imbalance parameters was moderate, at best. Finally, neither low back status nor pain
location had an effect on EMG contralateral imbalances. We conclude that the clinical
relevance of EMG contralateral imbalances of back muscles remains to be established.
Summary
The above review of literature introduced various studies on the effect of visual
feedback on sport performance, different biofeedback applications in exercise science and
physical education and some applications of isokinetic dynamometer in exercise science.
The visual feedback which enhances sport performance in concurrent study was usually
16
without manipulation. For those studies about visual biofeedback conducted in both
athletic and clinical realms, most of those studies were intervened by apparatus such as
EMG or EEG. Various research designs of visual biofeedback studies influenced this study
greatly. The idea, overarousal is somewhat a kind of manipulated feedback. However the
visualized synchronous visualized reports produced by isokinetic dynamometer were
seldom adopted. Thanks to its computer-based operating system, CSMi dynamometer
provides computer-based graph report which is easy for further treatment. Last but not
least, it may involve some ethical problems and the problems will be discussed in chapter
5.
17
Chapter 3
METHOD
This study was to assess the effect of visual feedback aroused by manipulated
real-time report on muscle force output in university male students. The data was obtained
from subjects’ performing elbow flexions and extensions. The experiment of the study
consisted of three testing sessions: (a) VCS, (b) Pre-test, and (c) Post-test. In each testing
session, there was a Trial set followed by resting period and Maximum-Effort set for the
subject to perform. Random sampling and video editing was conducted after Pre-test. The
method comprised in this study was presented in the following sections: (a) subjects, (b)
testing apparatus, (c) pilot testing, (f) procedure, and (g) method of analysis.
Subjects
Thirty male university students aged between 19 and 25 from the Hong Kong Baptist
University were invited to take part in this study. All subjects were free of any
cardiopulmonary or respiratory dysfunction. The health status of subjects was ascertained
by the Physical Activity Readiness Questionnaire (PAR-Q) (see Appendix A). Each of the
subjects was provided informed written consent prior to the test (see Appendix B). The
subjects were assigned into three groups evenly: Control Group (CG), Experimental Group
of Overrated Report (EGO) and Experimental Group of Underrated Report (EGU). There
were 10 subjects in each group. The group assignment was conducted after Pre-test period.
18
Testing Apparatus
The Apparatus adopted in this study included an isokinetic dynamometer with its
computer system and three computer software.
The isokinetic dynamometer, CSMi Humac Norm Testing and Rehabilitation System
(CSMi, Stoughton, MA, USA) was utilized in this study. The system includes the
dynamometer, the computer, and the Humac software. Subjects performed right-side elbow
flexion and extension on the seat of the dynamometer. Eight repetitions of moderate-to-low
intensity elbow flexion and extension was assigned in Trial set which was assigned for
warming up before the Maximum-Effort set in VCS. However only four repetitions were
assigned in Pre-test and Post-test Trial sets. The reason was eight repetitions may probably
limit the performance of Maximum-Effort set in which eight Repetition Maximums (RMs)
were assigned. Since eight RMs exercise was related to both absolute muscle strength and
muscle endurance, prolonged warm-up may consume energy though only a little was used
up during eight repetitions. A beep was given when Trial set had been done. The computer
recorded data when Maximum-Effort sets and displayed the report during both Trial and
Maximum-Effort sets. Besides used as warming-up the target muscles, Trial set was used
to check the ergonomic setting of the machine before the maximum-effort test.
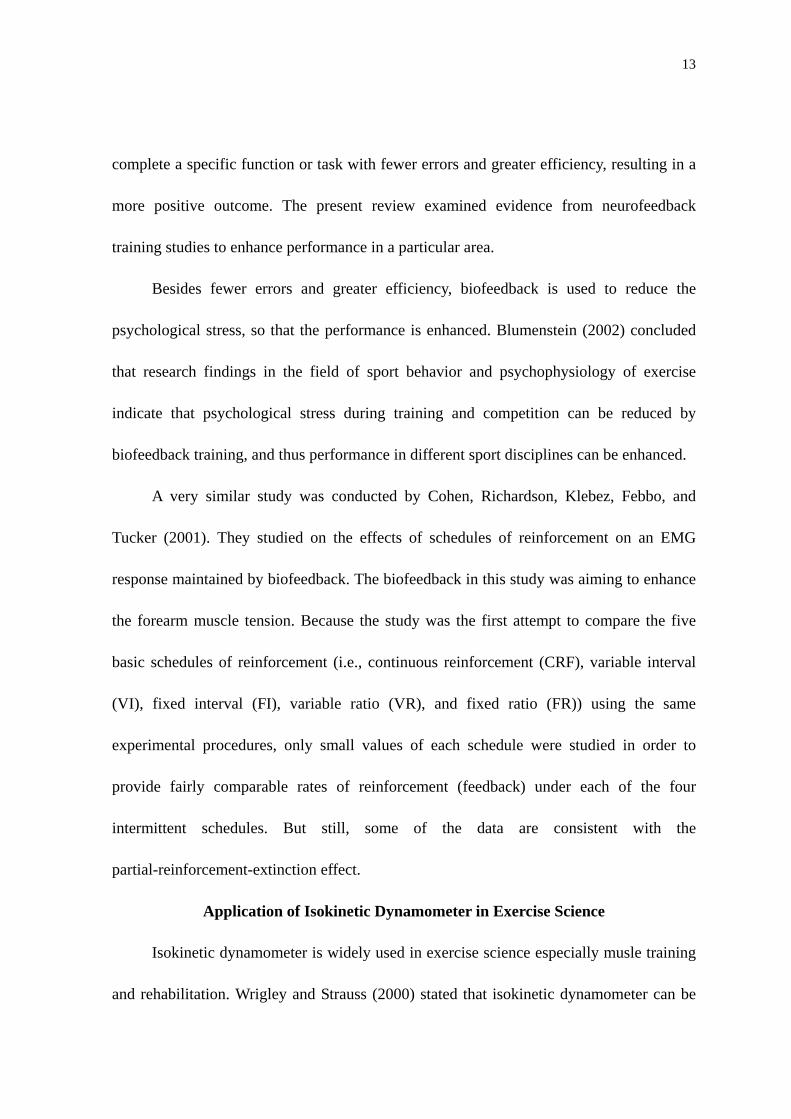
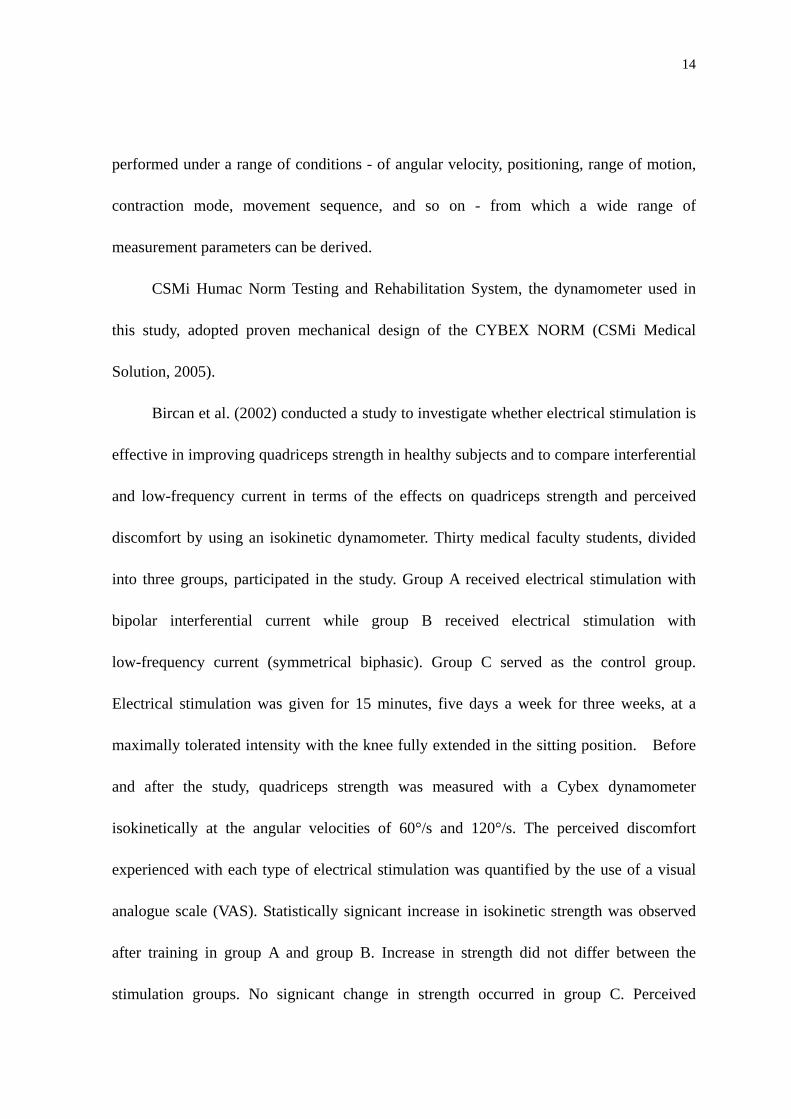
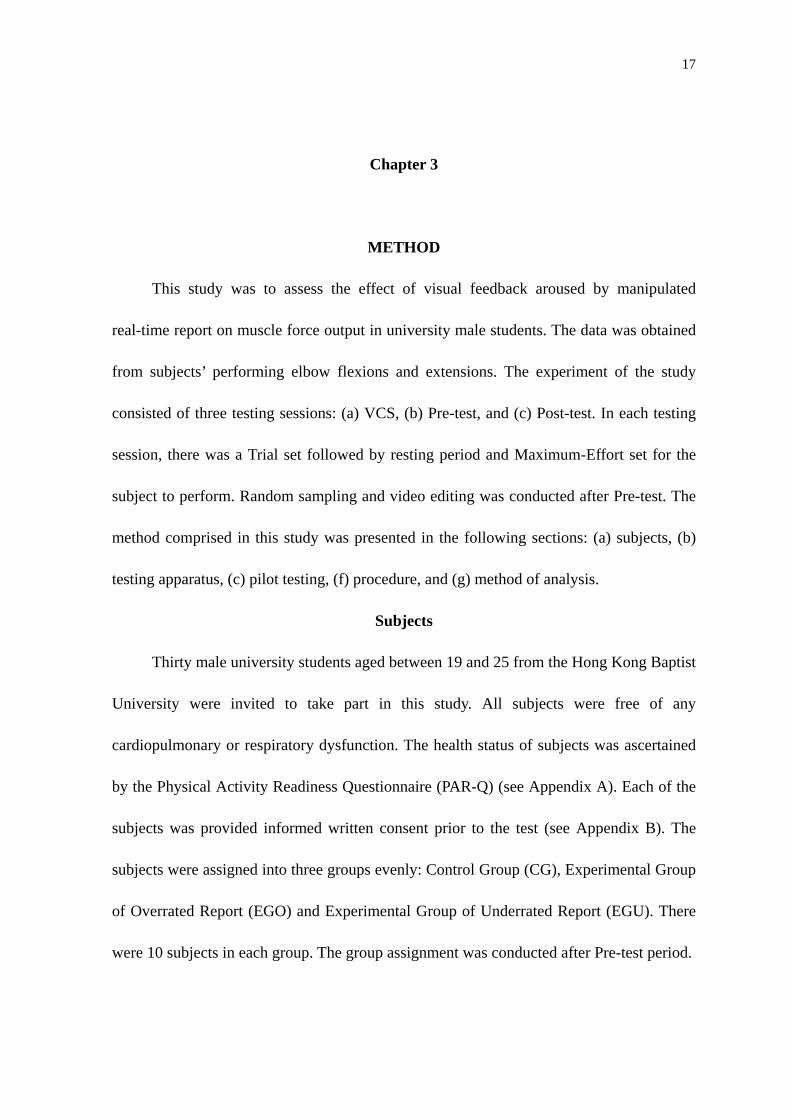
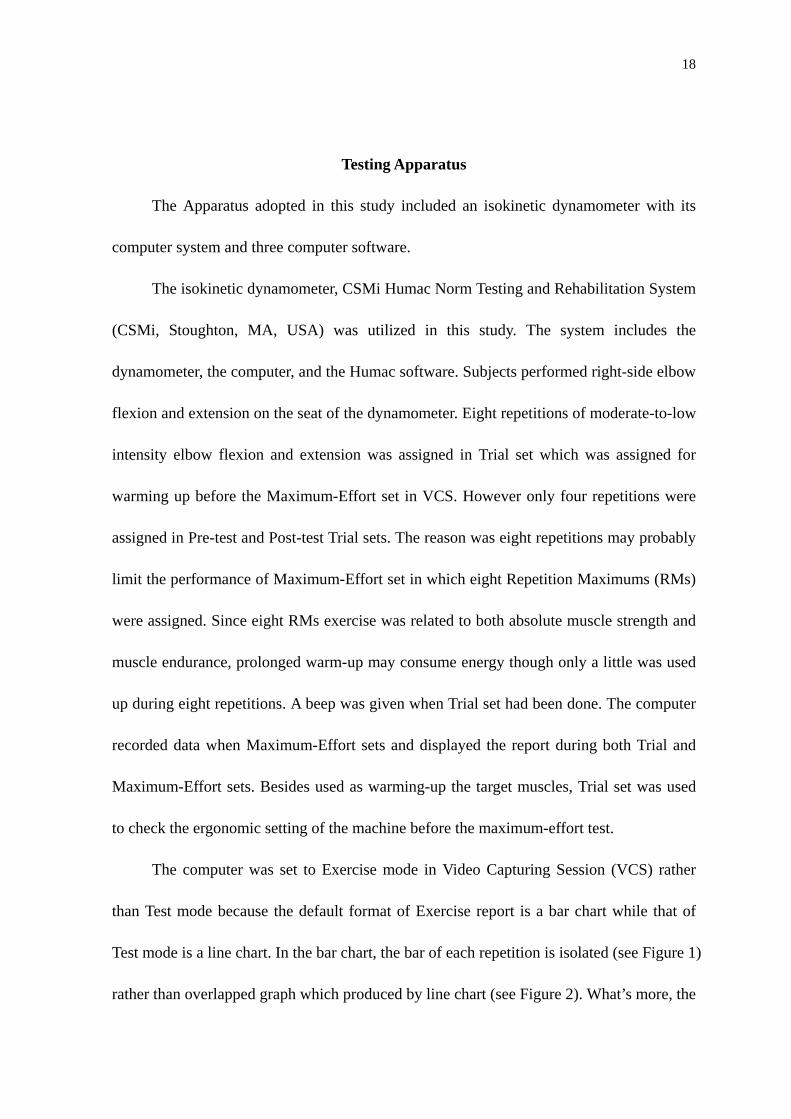
The computer was set to Exercise mode in Video Capturing Session (VCS) rather
than Test mode because the default format of Exercise report is a bar chart while that of
Test mode is a line chart. In the bar chart, the bar of each repetition is isolated (see Figure 1)
rather than overlapped graph which produced by line chart (see Figure 2). What’s more, the
19
bar chart keeps increasing until the rotating arm reached full range in each repetition,
which is suitable to produce the visual feedback, and therefore it was applied and captured
in VCS. By contrast, the line of Test mode (line chart) vibrates and unstable (see Figure 2).
However Test mode can provide a more detailed report so that it was used in Pre-test and
Post-test.
20
Figure 1. Sample of Work Report*
* The height of bars kept relatively stable. The computer program adjusts the unit on Y
axis into appropriate scale timely, and therefore the first bar in Extension was filtered
Figure 2. Sample Line-Chart
21
The three computer software used in the study is: (a) Snagit 9 (TechSmith, Okemos,
MI, USA), (b) Windows Movie Maker (Microsoft, Redmond, WA, USA), (c) Nero Media
Player (Nero, Karlsbad, Germany). Snagit 9 was used to capture the video of dynamic
work value report displayed by computer in VCS. This report was a bar chart which
represented the work value of elbow flexion and extension. Some of the captured movie
will be further edited into manipulated but vivid video by using Windows Movie Maker.
During Post-test, the manipulated video was played with Nero Media Player. The detail of
video editing is described in Procedure section.
Pilot Testing
There were ten university students (other than the subjects described above)
involved in the pilot testing. Several problems were observed during this testing, such as
the conflict between computer software which resulted in the failure to output report when
capturing the video simultaneously. Thus the video capture and report producing were
separated into two isolated test sessions. Other problems emerged were all solved before
the later experiment.
Procedure
The subjects were told to avoid high-intensity strength training two days prior to first
testing as well as during the whole testing period. The entire experiment including VCS,
Pre-test, and Post-test were conducted in the Dr. Stephen Hui Research Center for Physical
Recreation and Wellness in Hong Kong Baptist University, with the temperature and
relative humidity at 22 degree Celsius and 70% respectively.
22
As mentioned above, the experiment included three sessions: VCS, Pre-test, and
Post-test. A minimum of three days were required between two tests to minimize the
learning effect. The three tests were the same in the following procedure:
Common Procedure
Firstly, the subject was required to complete a written consent form and Par-Q
(Appendix B) form to ensure his suitability and readiness for the testing. Furthermore the
subjects were given a brief introduction about the test and instruction about its procedure.
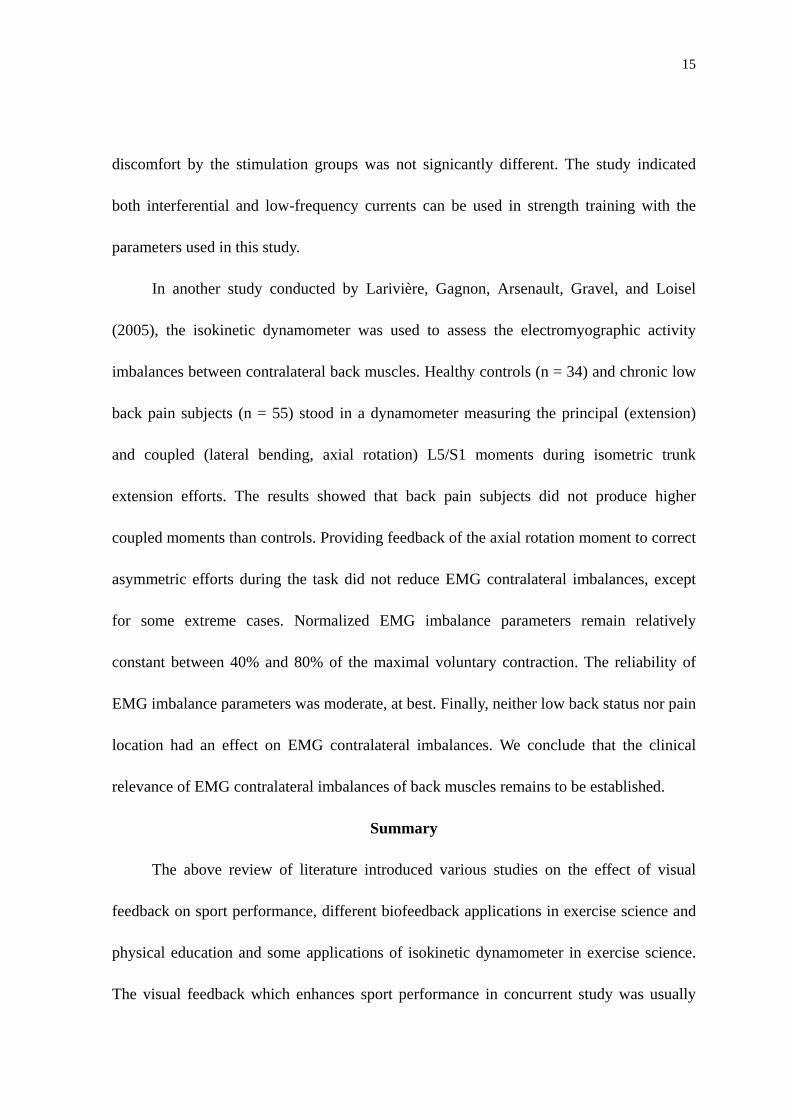
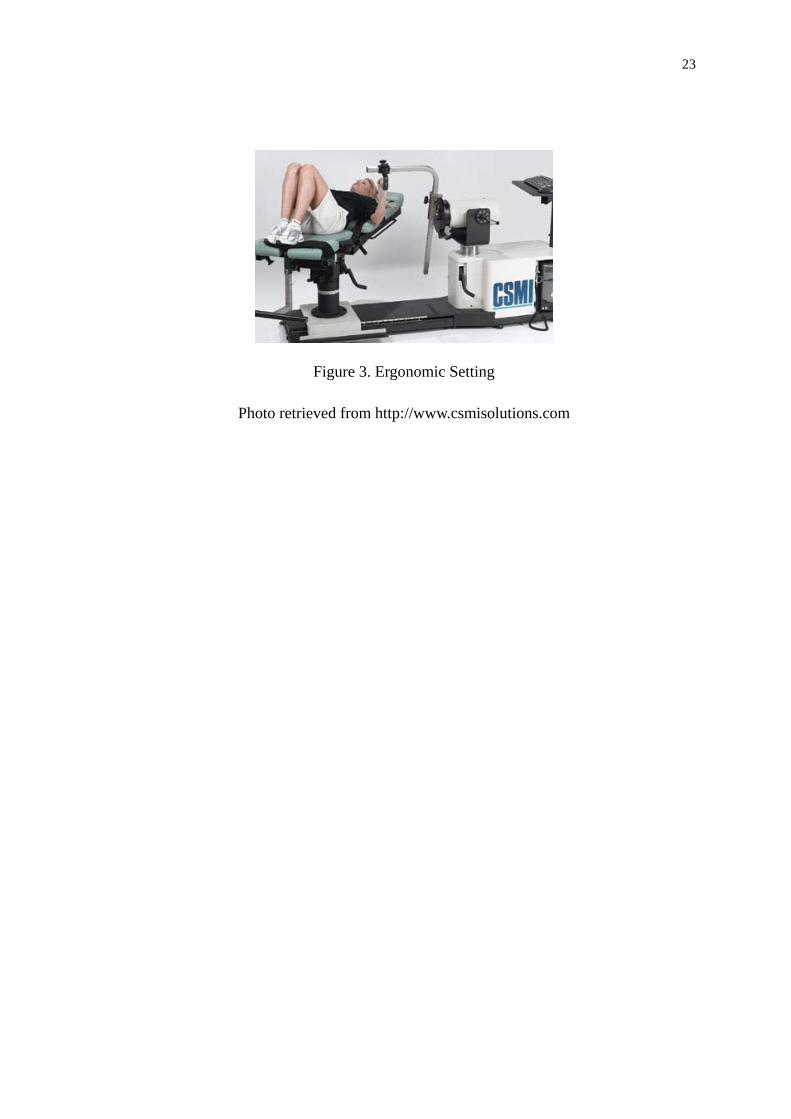
Secondly, the machine had to be set. The isokinetic dynamometer was set into the
elbow flexion/extension mode with Elbow/Shoulder Adapter parts (see Figure 3). The
subject kept to a supine position on the seat of the dynamometer. Seatbelts for trunk and
legs which attached to the machine were fastened around the subject so that the subject can
hold his body and minimize unnecessary trunk rotation when performing maximum-effort
elbow flexion and extension. Once the optimal ergonomic setting (e.g. seat position and
rotation head position) and the setting of the adjustable crank for each subject’s arm action
was achieved, all settings were recorded, individualized and pre-set for each subsequent
test.
23
Figure 3. Ergonomic Setting
Photo retrieved from http://www.csmisolutions.com
24
Thirdly, the subject then initiated exercise. Each subject was assigned to perform
eight repetitions of moderate-to-low intensity trial (warming-up) elbow flexions and
extensions on the machine (only four repetitions in Pre-test and Post-test, the reason was
elaborated in previous section). They were provided eight-second rest right after this trial.
After the rest, the technician checked the ergonomic setting again and asked the subject for
any problem. Afterwards subject performed one set (eight RMs) of maximum-effort elbow
flexion and extension. The flexion and extension must be performed with full range of
motion, which means the subject must drag the handle until hitting both sides’ Range of
Motion Stop (see Figure4, “Adjustable Range of Motion Stops”). No information about the
real-time report or video capturing was presented during VCS and Pre-test. During this
high-intensity exercise, the subject was advised to grab the handgrip attached to the seat
using his left hand. Screaming when exerting force was allowed.
25
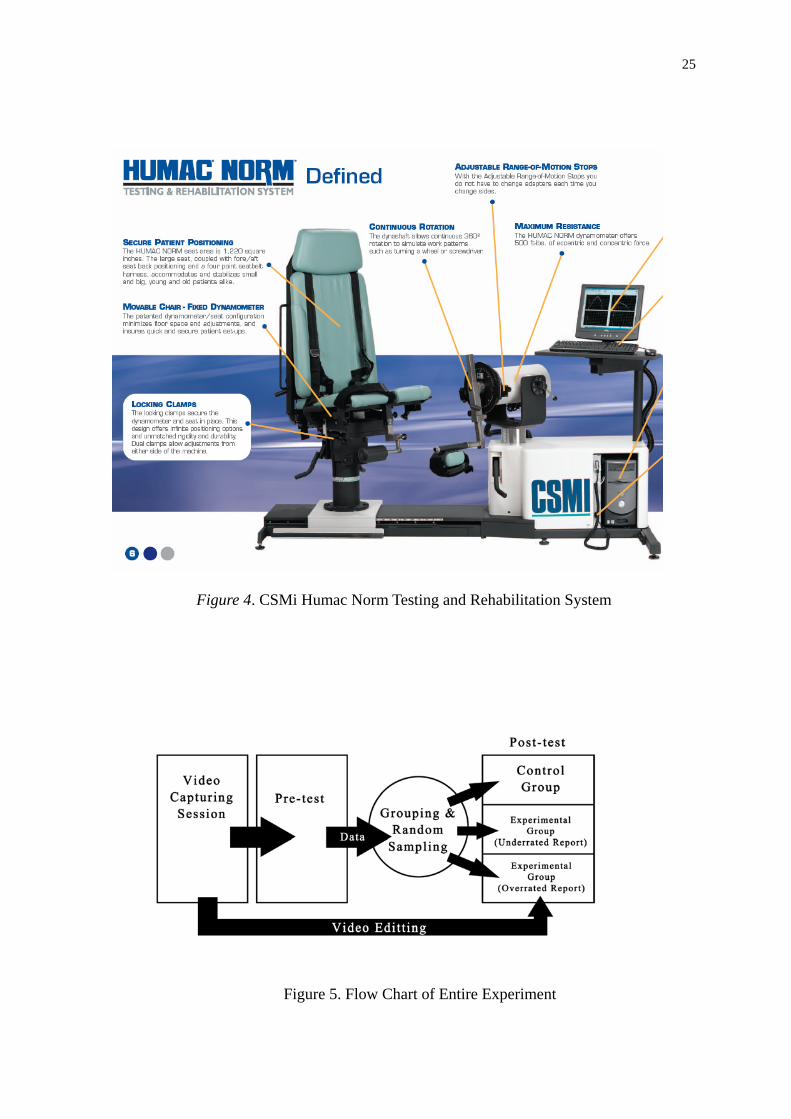
Figure 4. CSMi Humac Norm Testing and Rehabilitation System
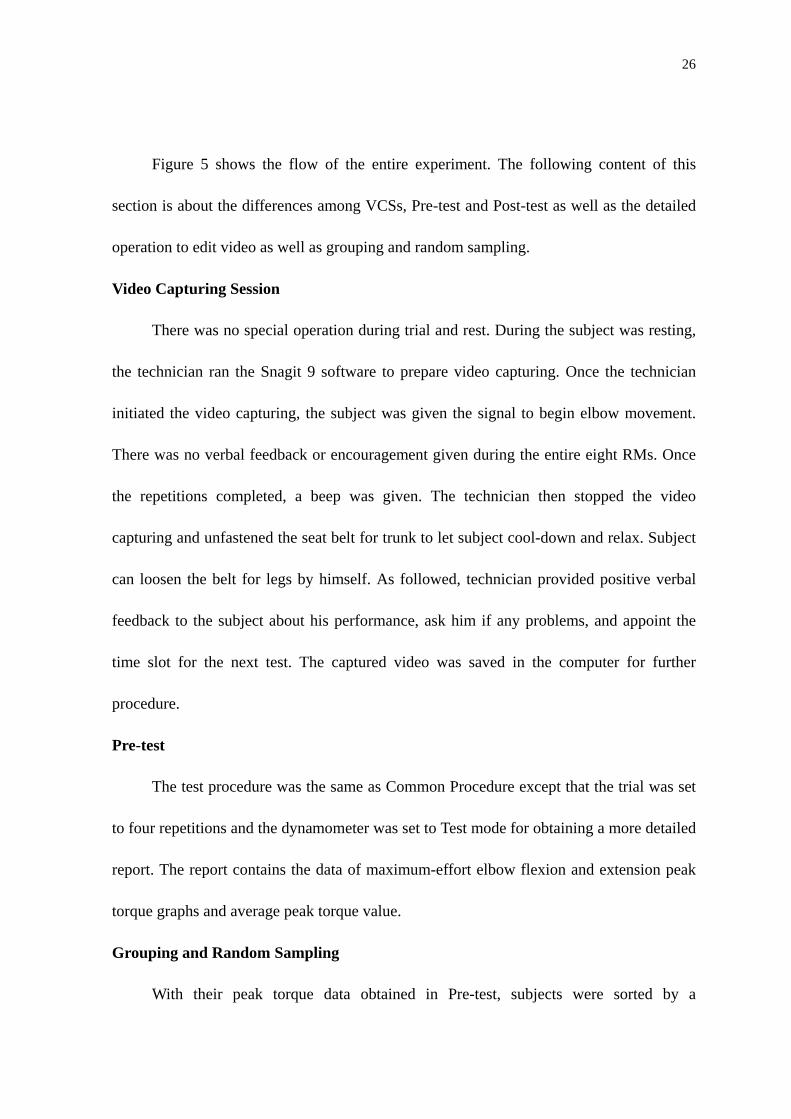
Figure 5. Flow Chart of Entire Experiment
26
Figure 5 shows the flow of the entire experiment. The following content of this
section is about the differences among VCSs, Pre-test and Post-test as well as the detailed
operation to edit video as well as grouping and random sampling.
Video Capturing Session
There was no special operation during trial and rest. During the subject was resting,
the technician ran the Snagit 9 software to prepare video capturing. Once the technician
initiated the video capturing, the subject was given the signal to begin elbow movement.
There was no verbal feedback or encouragement given during the entire eight RMs. Once
the repetitions completed, a beep was given. The technician then stopped the video
capturing and unfastened the seat belt for trunk to let subject cool-down and relax. Subject
can loosen the belt for legs by himself. As followed, technician provided positive verbal
feedback to the subject about his performance, ask him if any problems, and appoint the
time slot for the next test. The captured video was saved in the computer for further
procedure.
Pre-test
The test procedure was the same as Common Procedure except that the trial was set
to four repetitions and the dynamometer was set to Test mode for obtaining a more detailed
report. The report contains the data of maximum-effort elbow flexion and extension peak
torque graphs and average peak torque value.
Grouping and Random Sampling
With their peak torque data obtained in Pre-test, subjects were sorted by a
27
descending order of their sum up value of average peak torque (flexion) and average peak
torque (extension), which was named as Pre:SUM in later data analysis. Then they were
stratified into ten strata in which three subjects were stratified in each stratum and they
were further random sampled into CG, EGO, and EGU within their own stratum.
Video Editing
The captured video was edit by Windows Media Maker. Useless head and tail part of
this video were precisely cut up so that once strike the keyboard, the work bar on the
screen initiated rising immediately. This can promise an optimal synchronization
theoretically. Then these treated videos were further edited in different ways by group.
There was no manipulation on the video of CG.
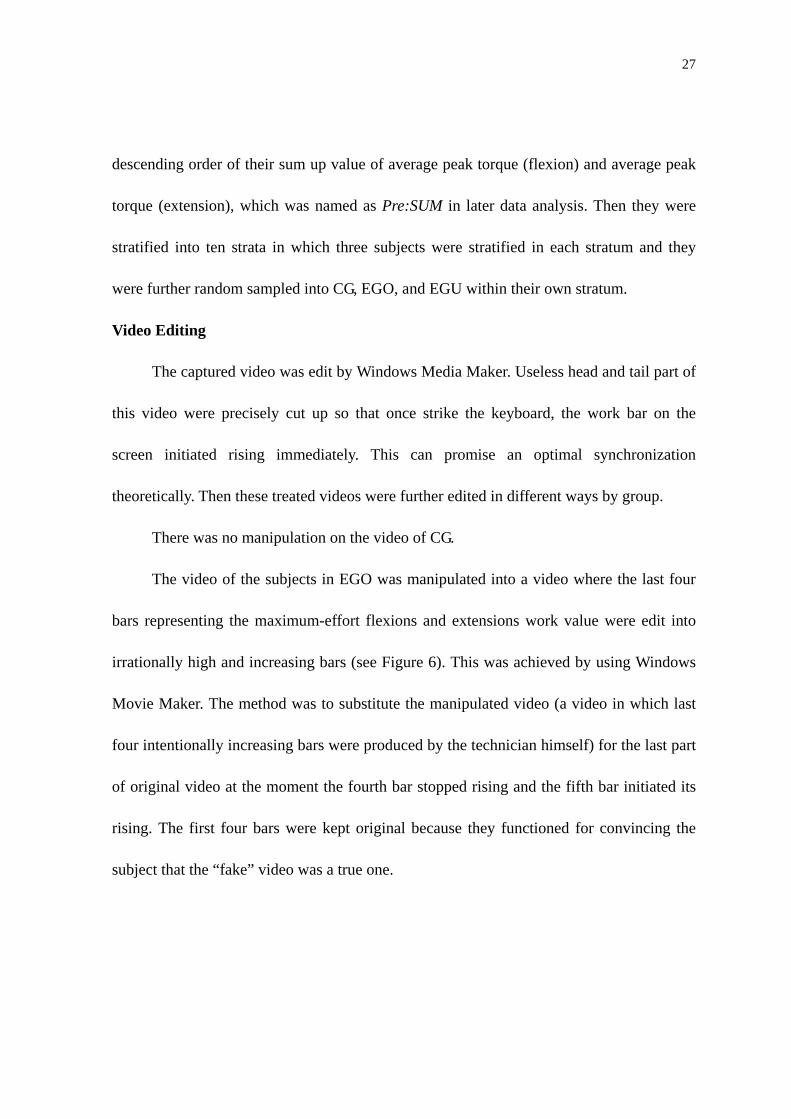
The video of the subjects in EGO was manipulated into a video where the last four
bars representing the maximum-effort flexions and extensions work value were edit into
irrationally high and increasing bars (see Figure 6). This was achieved by using Windows
Movie Maker. The method was to substitute the manipulated video (a video in which last
four intentionally increasing bars were produced by the technician himself) for the last part
of original video at the moment the fourth bar stopped rising and the fifth bar initiated its
rising. The first four bars were kept original because they functioned for convincing the
subject that the “fake” video was a true one.
28
Figure 6. Edited Video for EGO
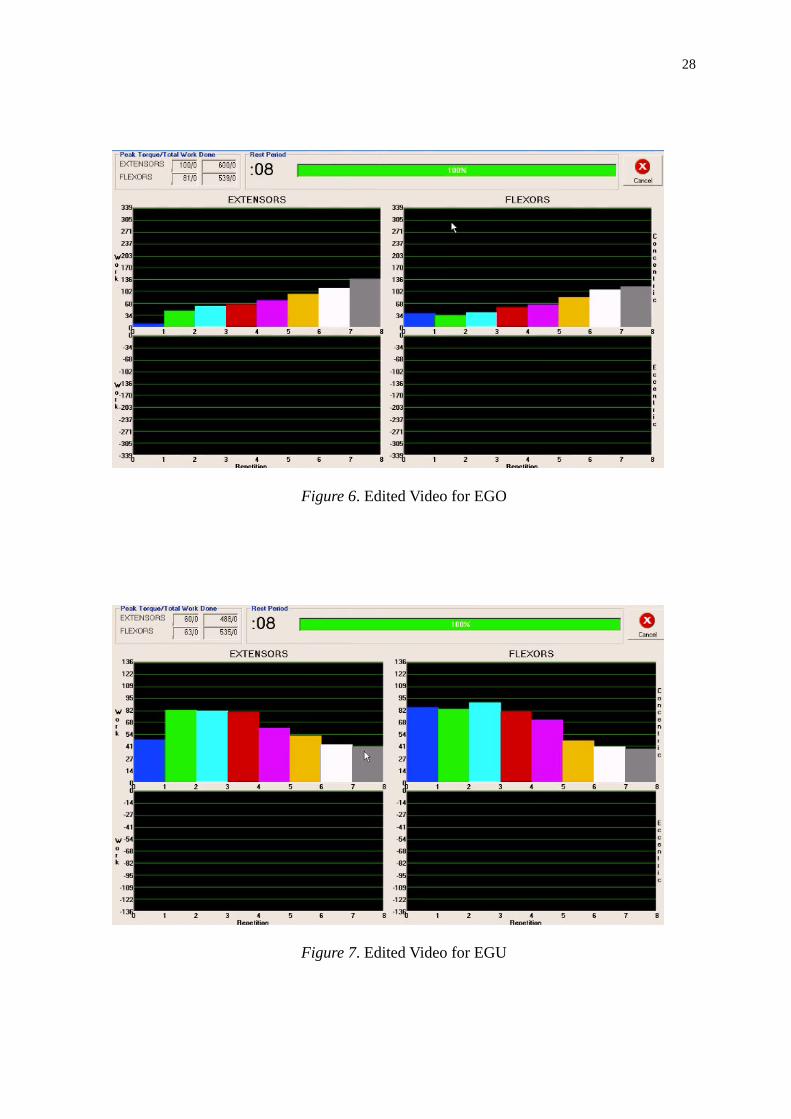
Figure 7. Edited Video for EGU
29
The video of the subjects in EGU was manipulated into a video where the last four
bars representing the maximum-effort flexions and extensions work value were edit into
irrationally low and fading bars (see Figure 7). The first four bars were kept original
because they functioned for convincing the subject that the “fake” video was a true one.
All these videos would be played in Post-test Session.
Post-test
Minimum of three days after the Pre-test, subjects participated in the last test, the
Post-test Session. Before testing, the technician told the subject that he was required to
perform four repetition trial elbow flexions and extensions, and at the same time, he must
watch the screen (see Figure 8) which displayed torque report in line chart. The technician
explained that the line chart displayed during trial set was a torque report and used for
subject being familiar with the both ergonomic setting and body posture with head rotated
when flexing and extending elbow. After the trial, eight-second rest was provided.
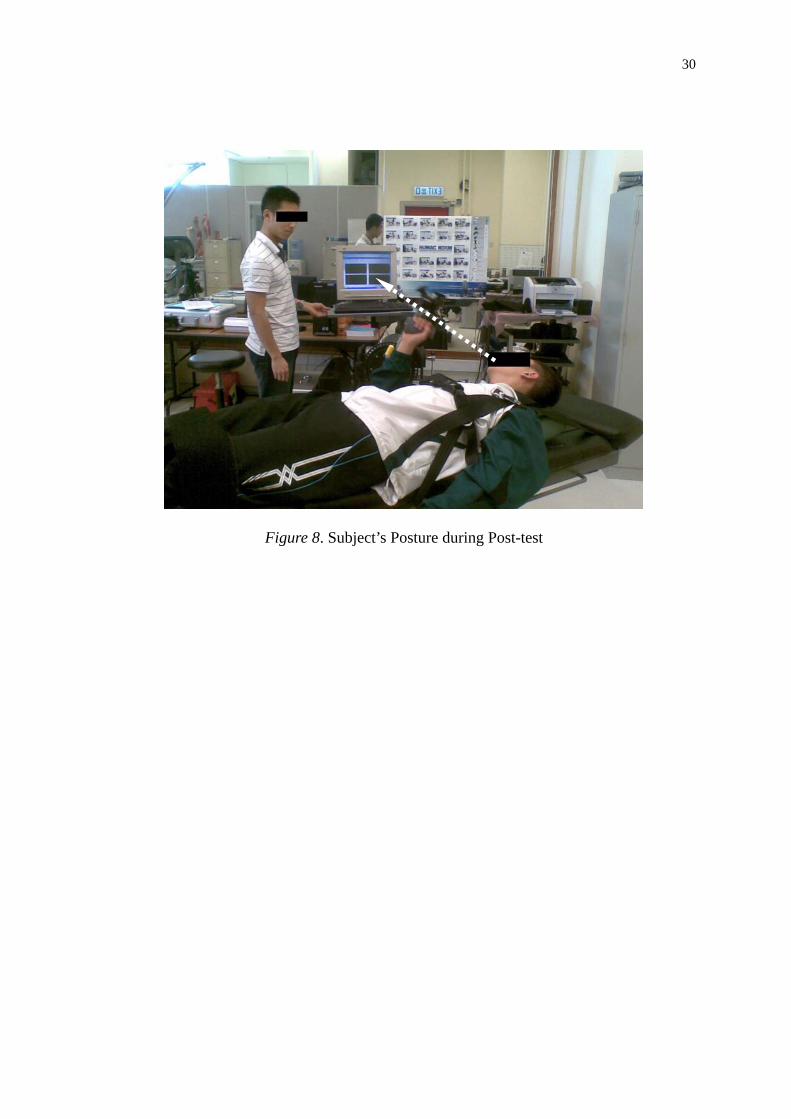
30
Figure 8. Subject’s Posture during Post-test
31
The technician then told the subject that he was going to perform maximum-effort
elbow flexions and extensions (eight RMs) with watching the screen. The subject was told
that the screen would display his real-time work report which was in the bar chart form,
but in fact what the technician would play was a manipulated video mentioned above.
Then the technician explained to the subject that the bar represented the work value of his
elbow movement. The higher the bar rises, the more work done by the subject’s arm
muscles. The technician specially emphasized that the subject was wished to produce as
high bar as possible because the set was a maximum-effort one. Furthermore, the
mechanism, the computer would automatically adjust the unit on Y axis for optimal display
as well as the consequence that all bars may be squeezed or elongated together after
adjusted, were explained. This was important because at the very beginning of the
manipulated part in Experimental Groups’ video, the ratio of Y-axis would alter and all the
bars may be elongated or squeezed. However it should be noted that the unit
auto-adjustment actually was not the reason why the bars transformed at the fifth
repetition.
After instruction, the trial began. During the following eight-second rest, the
technician rotated the computer screen to the direction that the subject can not see what
was going on the screen. Then the technician prepared for playing the manipulated video
by using Nero Media Player with full screen. The instruction about the maximum-effort set
mentioned in Video Captured Session was repeated to the subject. The only extra
instruction was that the subject had to watch the screen from start to the end and the
32
technician would rotate the screen to the direction subject can watch clearly a short
moment after he started the video playing. After ensured no problems existed, the
technician gave a signal to the subject to initiate the elbow flexion. At the moment the
machine arm hit the stop, the technician strike the keyboard gently to play the video and
then rotate to the subject. Similarly, no verbal feedback or encouragement was presented.
After finishing the entire eight RMs, the subject was released from the belt and advised to
cool-down himself. The data of Post-test maximum-effort elbow flexions and extensions
average peak torques were soon obtained and printed out. At last, the subject was told the
truth and the whole experimental design. Some first-step analysis after quick glance at the
raw data was also provided. The summed-up value of average peak torque in extension and
flexion was named as Post:SUM. Another variance, %Change was defined as Post:SUM
divided by Pre:SUM then minus 1. These variances will be analyzed in Chapter 4.
The tested movement (elbow flexion and extension) was set as an isokinetic
contraction in the system with the range of motion fixed both in Pre-tests and Post-test, the
pace of bicep curl were almost the same in Post-test compared with in Pre-test. This
synchronization between Post-test physical elbow movement and the manipulated bar
vibration rhythm was based on the condition when both initiated simultaneously (i.e. the
technician click the button just at the moment the machine arm hit the Range of Motion
Stop while the subject performing the first elbow flexion). This technique need to be
practiced but is not very hard to handle.
33
Method of Analysis
Statistical Package for Social Science (SPSS) for window14.0 version computer
program was used for all the statistical calculations. The mean values of average peak
torque such as Pre: SUM and Post: SUM in each group during Pre-test and Post-test
computed. Contrast test for One-Way ANOVA between CG and two Experimental Groups’
%Change was conducted to compare the mean peak torque change differences, with
significance level set at 0.05. To promise the reliability and validity of the study, Contrast
tests for One-Way ANOVA between different groups’ Pre:SUM and Post:SUM were also
conducted.
34
Chapter 4
ANALYSIS OF DATA
Results
Twenty-nine subjects completed the entire experiment (i.e. VCS, Pre-test, and
Post-test). The test on twenty-nine subjects generated their reports about average peak
torques and % change from Pre-test to Post-test, in which eight repetitions of
maximum-effort elbow flexions and extensions were measured. These subjects did not
know what they watched on the monitor during Post-test maximum-effort session was
manipulated. One subject in the EGU was able to complete all sessions of the experiment,
but the system failed to output its Post-test report. Since this subject was told about the
experiment design right after Post-test, it was not suitable for him to repeat the Post-test in
order to obtain a report, so his data was not included in this study. One of the subject in
EGO, who achieved a significant increase (increased by 40.4% of the number of Pre-test)
in extension average peak torque but a slight decrease in flexion, reported that he did
several sets of high intensity push-up trainings a few days before Post-test. Another subject
in EGO who achieved significant increase in both flexion and extension average peak
torques (increased by 39.7% of the sum of flexion and extension average peak torques)
during Posttest reported that the ergonomic setting of dynamometer machine in Pre-test
was not as comfortable as in Post-test. These cases may be considered as threats to the
experimental result but their data was still analyzed together. No other adverse effect from
35
the experiment sessions was observed or reported by the subjects.
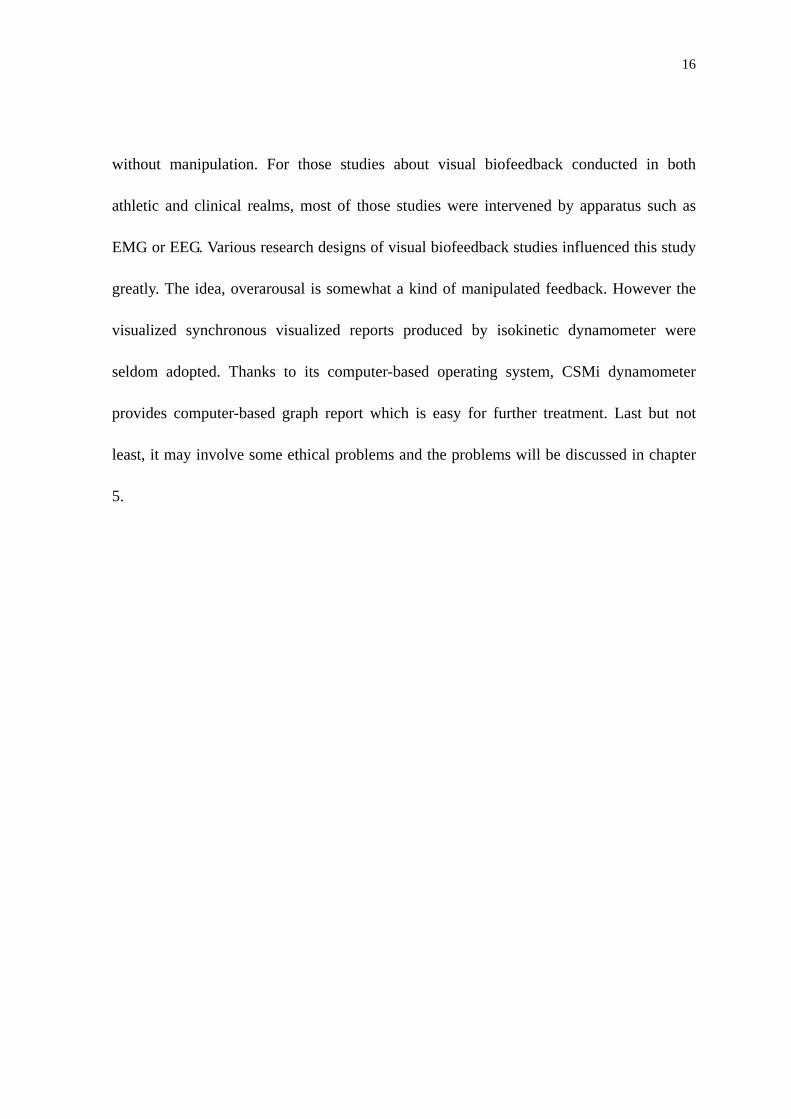
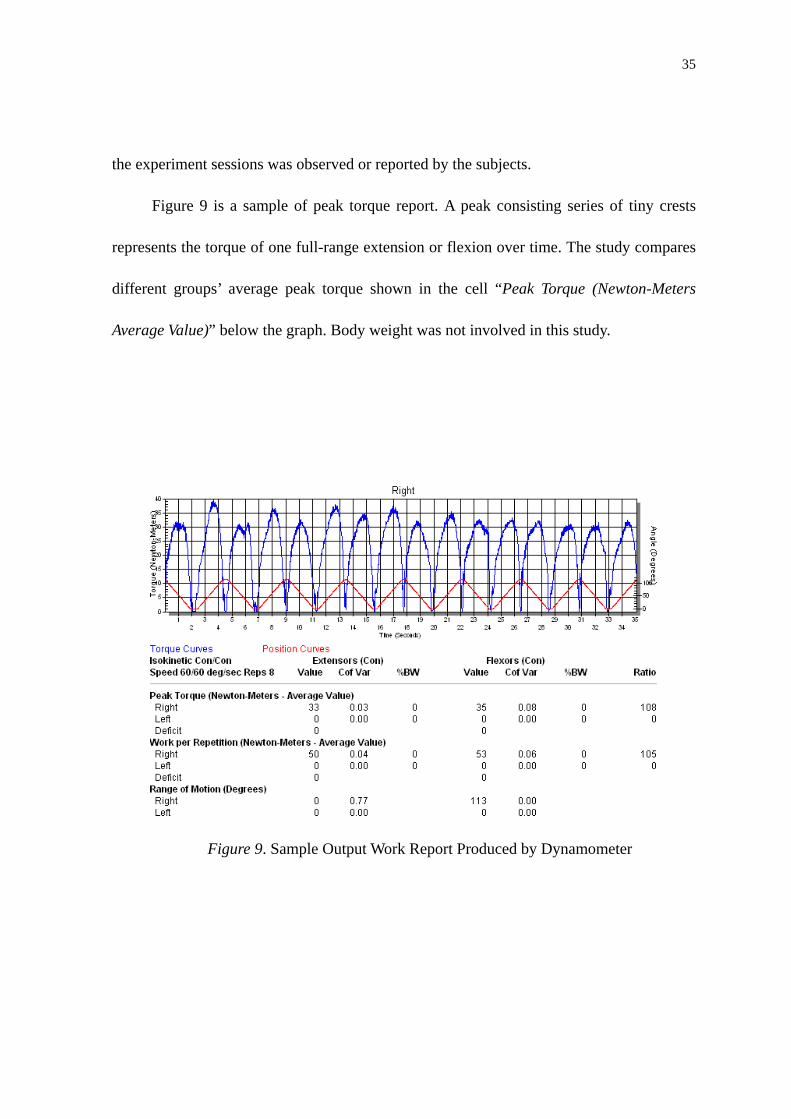
Figure 9 is a sample of peak torque report. A peak consisting series of tiny crests
represents the torque of one full-range extension or flexion over time. The study compares
different groups’ average peak torque shown in the cell “Peak Torque (Newton-Meters
Average Value)” below the graph. Body weight was not involved in this study.
Figure 9. Sample Output Work Report Produced by Dynamometer
36
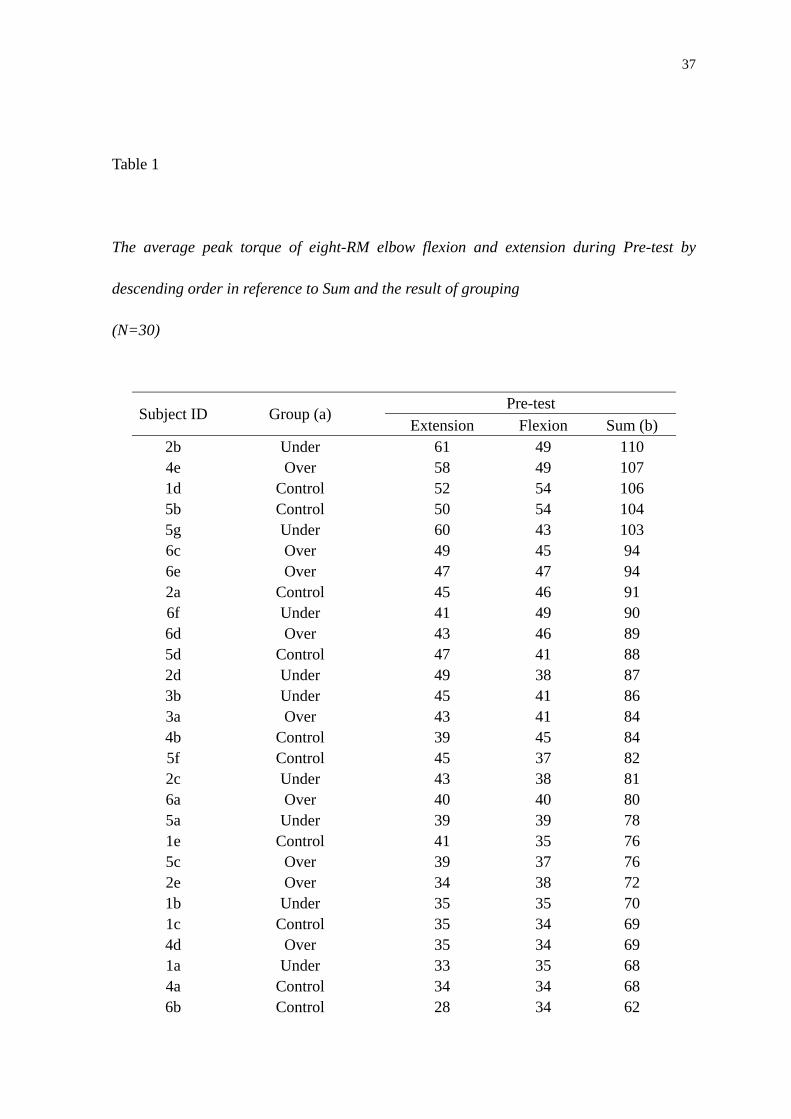
Table 1 shows the result of Pre-test. This result represents all subjects’ performance
and the result of grouping. The subjects were listed in descending order in reference of
their Sum value. Extension (Flexion) is the average peak torque value of eight
maximum-effort elbow extensions (flexions) during the Pre-test maximum-effort set. Sum
is the sum-up value of Extension with Flexion.
37
Table 1
The average peak torque of eight-RM elbow flexion and extension during Pre-test by
descending order in reference to Sum and the result of grouping
(N=30)
Pre-test Subject ID Group (a)
Extension Flexion Sum (b) 2b Under 61 49 110 4e Over 58 49 107 1d Control 52 54 106 5b Control 50 54 104 5g Under 60 43 103 6c Over 49 45 94 6e Over 47 47 94 2a Control 45 46 91 6f Under 41 49 90 6d Over 43 46 89 5d Control 47 41 88 2d Under 49 38 87 3b Under 45 41 86 3a Over 43 41 84 4b Control 39 45 84 5f Control 45 37 82 2c Under 43 38 81 6a Over 40 40 80 5a Under 39 39 78 1e Control 41 35 76 5c Over 39 37 76 2e Over 34 38 72 1b Under 35 35 70 1c Control 35 34 69 4d Over 35 34 69 1a Under 33 35 68 4a Control 34 34 68 6b Control 28 34 62
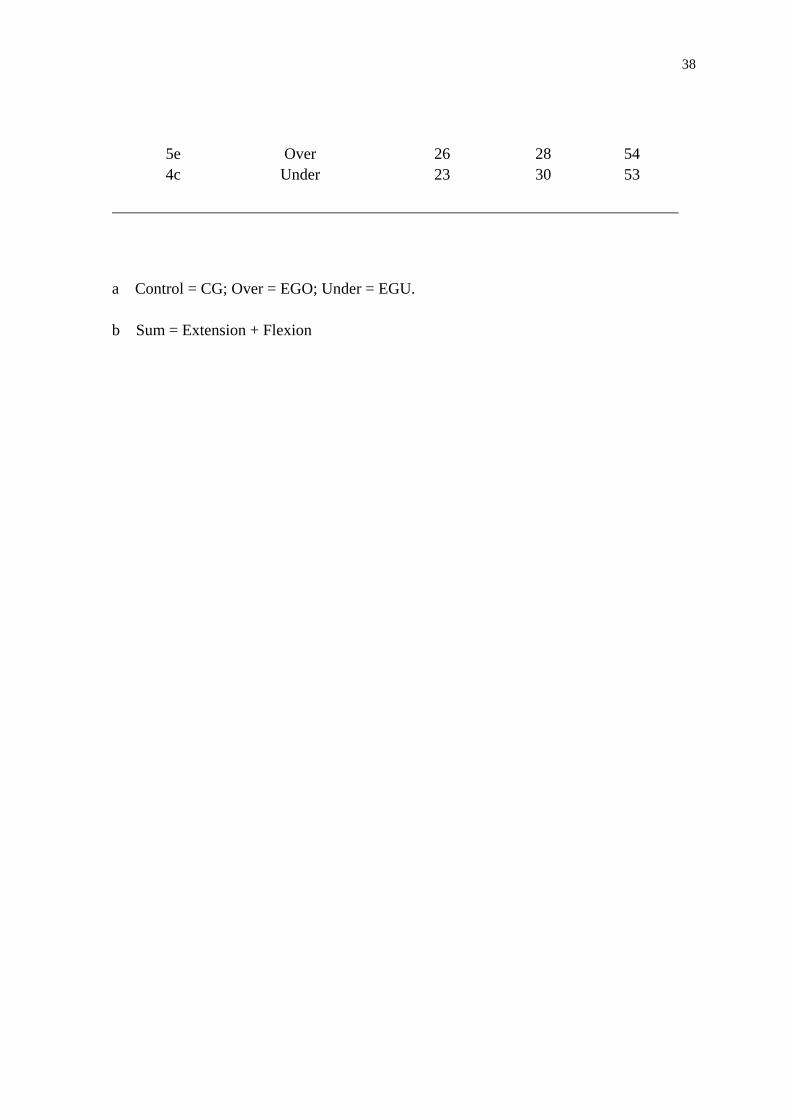
38
5e Over 26 28 54 4c Under 23 30 53
a Control = CG; Over = EGO; Under = EGU.
b Sum = Extension + Flexion
39
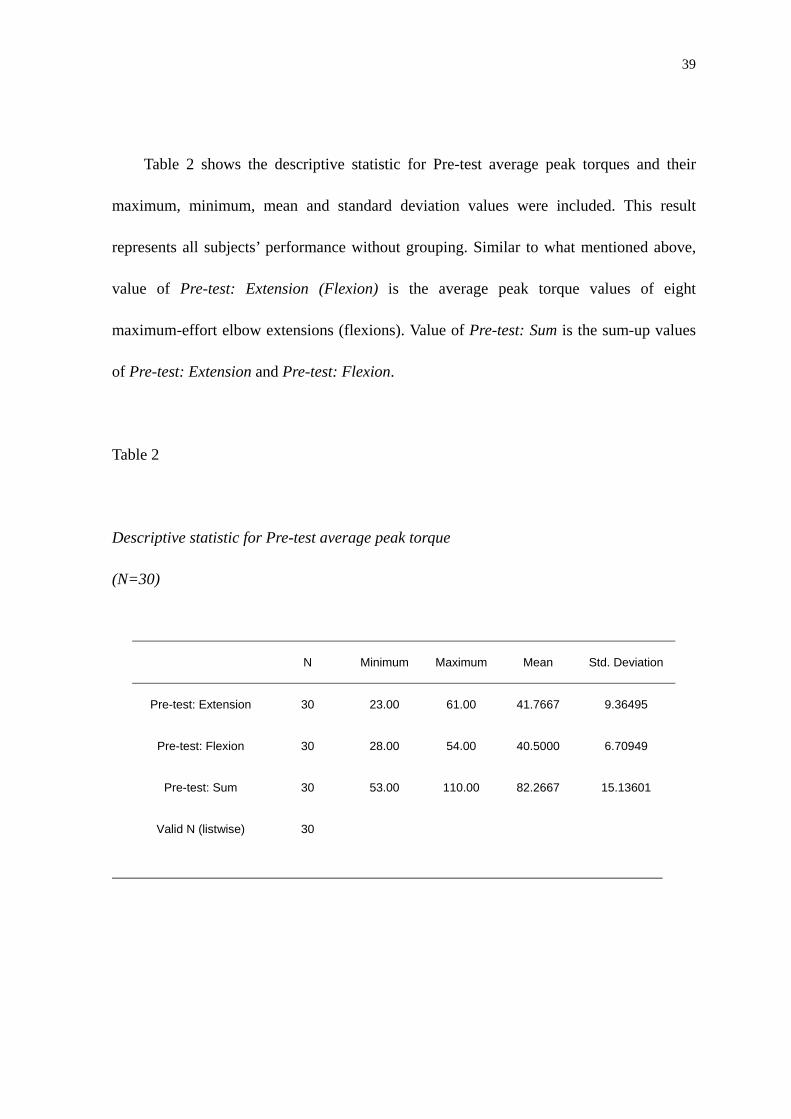
Table 2 shows the descriptive statistic for Pre-test average peak torques and their
maximum, minimum, mean and standard deviation values were included. This result
represents all subjects’ performance without grouping. Similar to what mentioned above,
value of Pre-test: Extension (Flexion) is the average peak torque values of eight
maximum-effort elbow extensions (flexions). Value of Pre-test: Sum is the sum-up values
of Pre-test: Extension and Pre-test: Flexion.
Table 2
Descriptive statistic for Pre-test average peak torque
(N=30)
N Minimum Maximum Mean Std. Deviation
Pre-test: Extension 30 23.00 61.00 41.7667 9.36495
Pre-test: Flexion 30 28.00 54.00 40.5000 6.70949
Pre-test: Sum 30 53.00 110.00 82.2667 15.13601
Valid N (listwise) 30

40
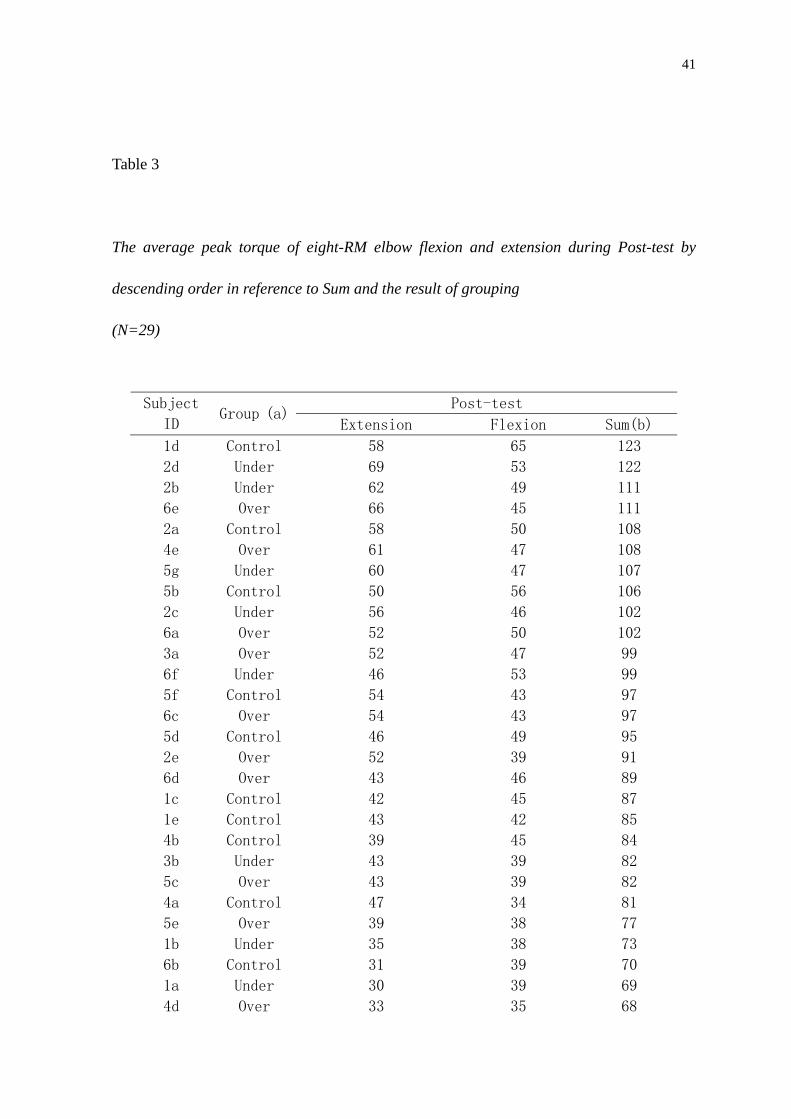
Table 3 shows the result of Post-test. The result of one subject was failed to produce
after Post-test’s testing, so there were only 29 subjects’ result listed in the table. The
subjects were also listed in descending order in reference to Sum value.
41
Table 3
The average peak torque of eight-RM elbow flexion and extension during Post-test by
descending order in reference to Sum and the result of grouping
(N=29)
Post-test Subject
ID Group (a)
Extension Flexion Sum(b)
1d Control 58 65 123
2d Under 69 53 122
2b Under 62 49 111
6e Over 66 45 111
2a Control 58 50 108
4e Over 61 47 108
5g Under 60 47 107
5b Control 50 56 106
2c Under 56 46 102
6a Over 52 50 102
3a Over 52 47 99
6f Under 46 53 99
5f Control 54 43 97
6c Over 54 43 97
5d Control 46 49 95
2e Over 52 39 91
6d Over 43 46 89
1c Control 42 45 87
1e Control 43 42 85
4b Control 39 45 84
3b Under 43 39 82
5c Over 43 39 82
4a Control 47 34 81
5e Over 39 38 77
1b Under 35 38 73
6b Control 31 39 70
1a Under 30 39 69
4d Over 33 35 68
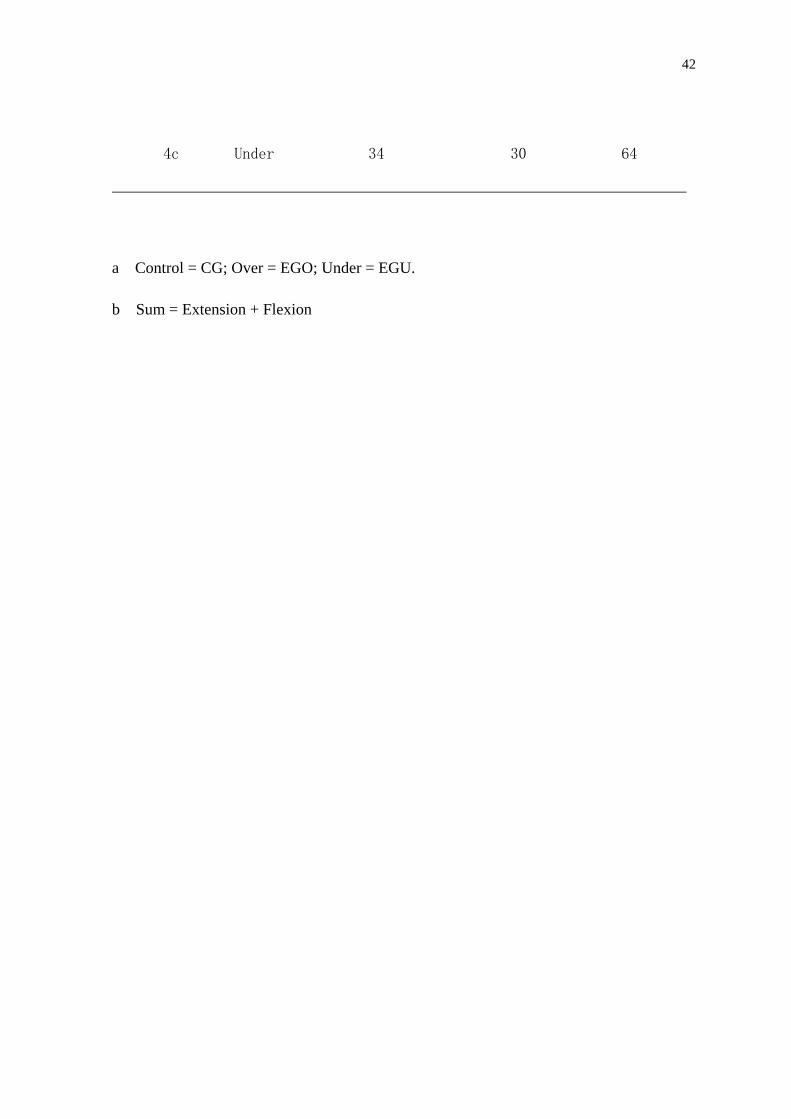
42
4c Under 34 30 64
a Control = CG; Over = EGO; Under = EGU.
b Sum = Extension + Flexion
43
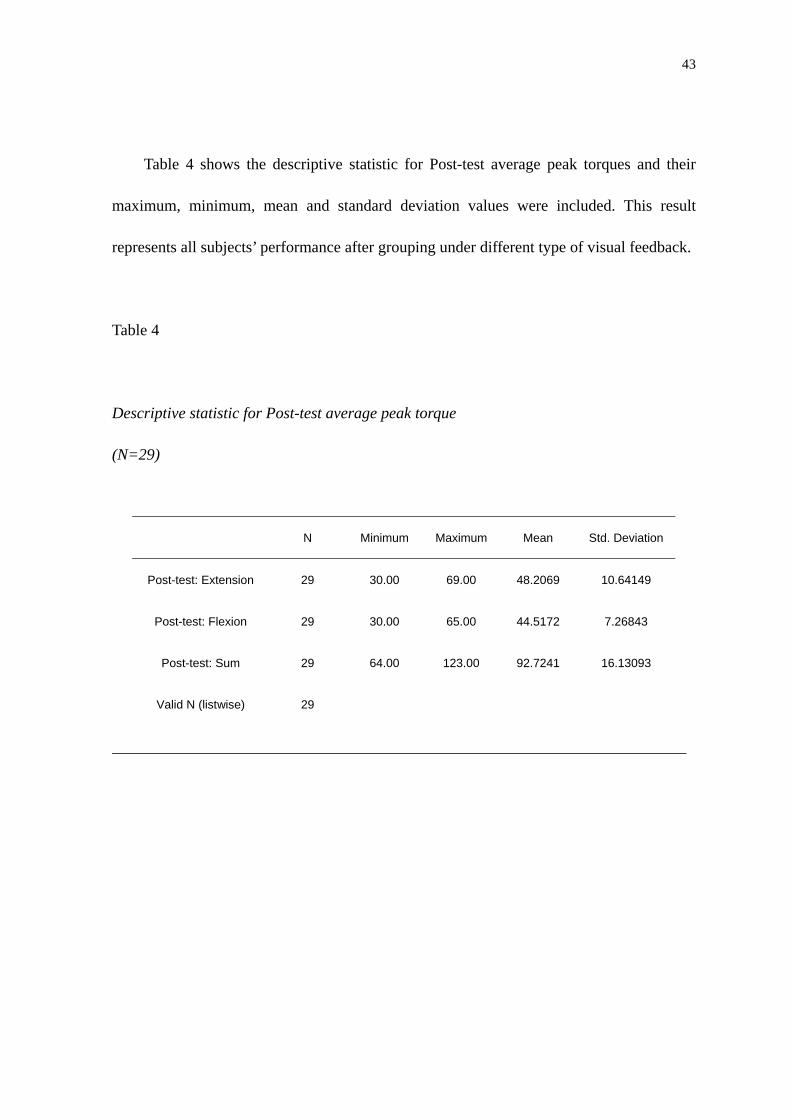
Table 4 shows the descriptive statistic for Post-test average peak torques and their
maximum, minimum, mean and standard deviation values were included. This result
represents all subjects’ performance after grouping under different type of visual feedback.
Table 4
Descriptive statistic for Post-test average peak torque
(N=29)
N Minimum Maximum Mean Std. Deviation
Post-test: Extension 29 30.00 69.00 48.2069 10.64149
Post-test: Flexion 29 30.00 65.00 44.5172 7.26843
Post-test: Sum 29 64.00 123.00 92.7241 16.13093
Valid N (listwise) 29
44
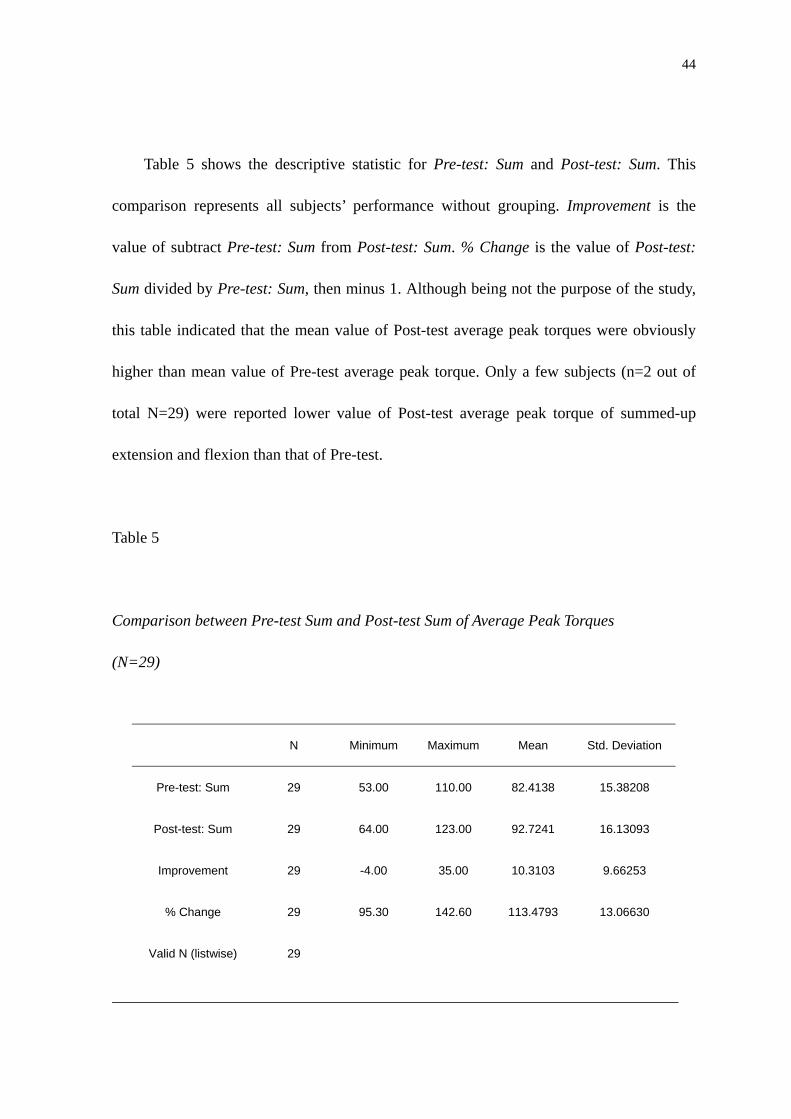
Table 5 shows the descriptive statistic for Pre-test: Sum and Post-test: Sum. This
comparison represents all subjects’ performance without grouping. Improvement is the
value of subtract Pre-test: Sum from Post-test: Sum. % Change is the value of Post-test:
Sum divided by Pre-test: Sum, then minus 1. Although being not the purpose of the study,
this table indicated that the mean value of Post-test average peak torques were obviously
higher than mean value of Pre-test average peak torque. Only a few subjects (n=2 out of
total N=29) were reported lower value of Post-test average peak torque of summed-up
extension and flexion than that of Pre-test.
Table 5
Comparison between Pre-test Sum and Post-test Sum of Average Peak Torques
(N=29)
N Minimum Maximum Mean Std. Deviation
Pre-test: Sum 29 53.00 110.00 82.4138 15.38208
Post-test: Sum 29 64.00 123.00 92.7241 16.13093
Improvement 29 -4.00 35.00 10.3103 9.66253
% Change 29 95.30 142.60 113.4793 13.06630
Valid N (listwise) 29
45
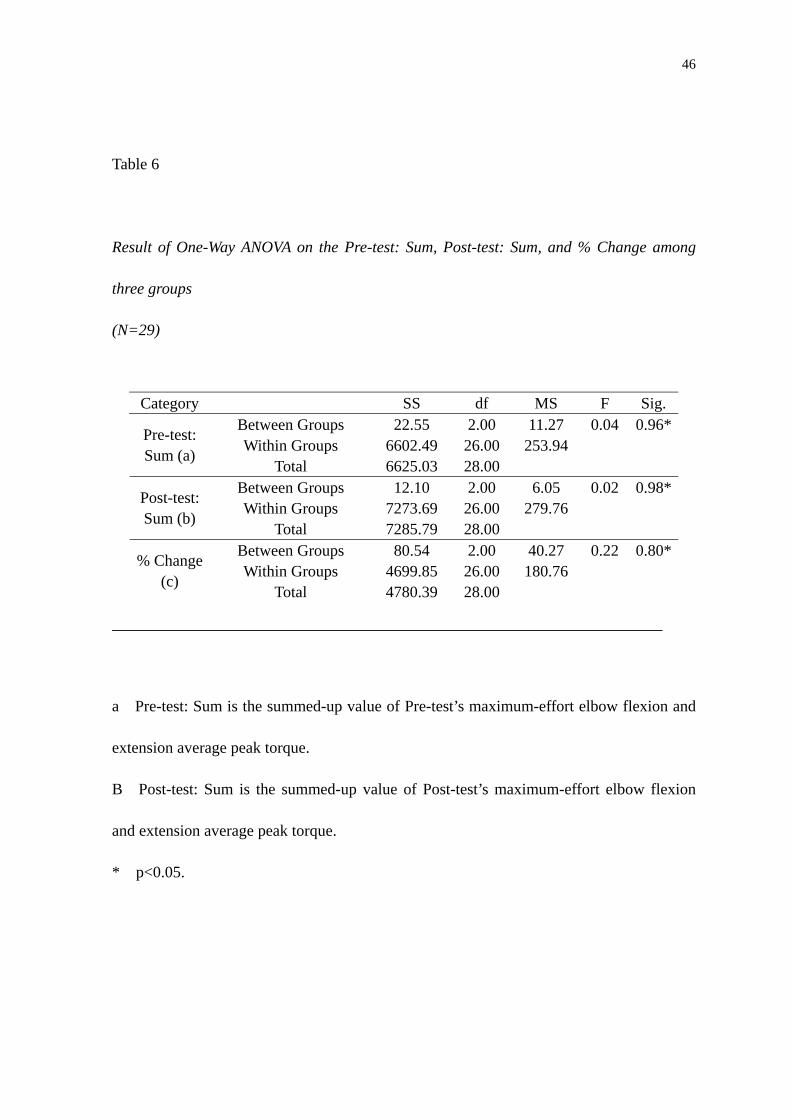
Table 6 shows the result of One-Way ANOVA comparing the mean values of %
change (the value of Post-test: Sum divided by Pre-test: Sum, then minus 1) among CG
(labeled as “control”) and two Experimental Groups (Overrated Report labeled as “over”
and Underrated Report labeled as “under”). Table 7 is the result of the Contrast test for
One-Way ANOVA. The result of analysis indicated no significant difference in average
peak torque value between CG and EGO as well as CG and EGU at the significant level of
0.05. Thus the hypothesis, the value of average peak torque of elbow flexion and extension
would not be enhanced by the visual feedback produced by overrated report in the
university male students, was accepted.
46
Table 6
Result of One-Way ANOVA on the Pre-test: Sum, Post-test: Sum, and % Change among
three groups
(N=29)
Category SS df MS F Sig. Between Groups 22.55 2.00 11.27 0.04 0.96*Within Groups 6602.49 26.00 253.94
Pre-test: Sum (a)
Total 6625.03 28.00 Between Groups 12.10 2.00 6.05 0.02 0.98*Within Groups 7273.69 26.00 279.76
Post-test: Sum (b)
Total 7285.79 28.00 Between Groups 80.54 2.00 40.27 0.22 0.80*Within Groups 4699.85 26.00 180.76
% Change (c)
Total 4780.39 28.00
a Pre-test: Sum is the summed-up value of Pre-test’s maximum-effort elbow flexion and
extension average peak torque.
B Post-test: Sum is the summed-up value of Post-test’s maximum-effort elbow flexion
and extension average peak torque.
* p<0.05.

47
48
Another statistic, one-tailed independent t-test comparing the mean values of %
Change between CG and Experimental Groups (p < 0.05) were conducted just as a
reference in Appendix E, though t-test is not suitable to apply in this case. In this statistic,
the % Change of EGO is significantly higher than that of CG. Contrarily, there is no
significant different of % Change between EGU and CG. This somewhat obeys the
psychology theory (i.e. reinforcement is more power than punishment in altering humans
behavior).
Discussion
This section contains three issues: (a) discussion about experiment design, reliability,
and validity; (b) discussion on psychophysiological domain; (c) discussion on ethical
issues.
Discussion about Experiment Design and Reliability
The objective of this study was to assess the effect of manipulated visual feedback
on the force output of elbow flexion and extension by observing peak torque. Although
several potential risks may threat the reliability, the experiment was successful in
convincing subjects that the manipulated fake or original torque report video was a
real-time report. The factors threatening the reliability and validity of the study are listed
below:
Individual Differences
Subjects’ individual differences in learning efficiency may affect the reliability of the
experiment. Some subjects were able to handle the technique so as to effectively perform
49
elbow flexion and extension on the isokinetic dynamometer after Pre-test, and then achieve
a much greater work peak output in Post-test than others. In addition, the fact that some
subjects have known isokinetic dynamometer before but some not, may also affected the
reliability. On the other hand, the psychology activity process and the consequent
psychophysiological response during the test, especially Post-test, varies among the
subjects. Although it may affect the reliability, these personal differences did neither
specifically assemble in certain groups nor increase or decrease the significant level jointly.
Further psychophysiology issue is discussed in (b) Discussion on psychophysiological
domain part.
Ergonomic Setting
A suboptimal ergonomic setting of isokinetic dynamometer for certain subject would
hinder his elbow movement and therefore suppress the peak torque. Several subjects
reported after the test that the ergonomic setting was not optimal, but the problem was
minor. Only one subject reported the ergonomic problem was significant and it may
contribute to the significant enhancement of EGO peak torque, which was mentioned in
Result part.
Muscle Training between the Tests
Although subjects were required to cease “overloading or high-intensity” weight
training of arms during the study period to prevent unwanted muscular strength gaining,
there was no precise definition for “overloading or high-intensity” training. Simultaneously,
moderate- to low-intensity regular training of arms may also result in muscular strength
50
gaining in arm muscles and then enhance peak torque value in Post-test more significantly
than those without arm training. One subject in EGO reported that he had worked out
intensively (i.e. push-up) days before the Post-test day, which mentioned in previous
paragraph. This extra training may also contribute to the significant enhancement of peak
torque value.
Overkill in Statistics
CSMi Humac Norm Testing and Rehabilitation System gives the report of average
peak torque value within the entire set (one set contains several repetition). This means the
average peak torque value actually reported the mean value of total eight flexions and eight
extensions in this experiment, in which first four flexions and extensions were not
manipulated and therefore no effect caused by manipulation existed. Although the system
can work out a report with the graph of each single flexion or extension, the statistic
numeric result only contains average peak torque value still for total eight repetitions rather
than for the last four. Thus the result of average peak torque value does not purely imply
the effect of manipulation.
Concentration towards the Monitor
Another risk affecting reliability was the different concentration levels among the
subjects towards the monitor that displayed the report. Some subjects were too
concentrated on elbow movement to miss the process of the bars on the screen. Neglecting
the crucial 5th, 6th or 7th bar would alter the subject’s psychophysiological process since the
visual information was delayed and discounted. Fortunately, after given a briefing about
51
the test, most of the subjects kept watching the screen from begin to the end.
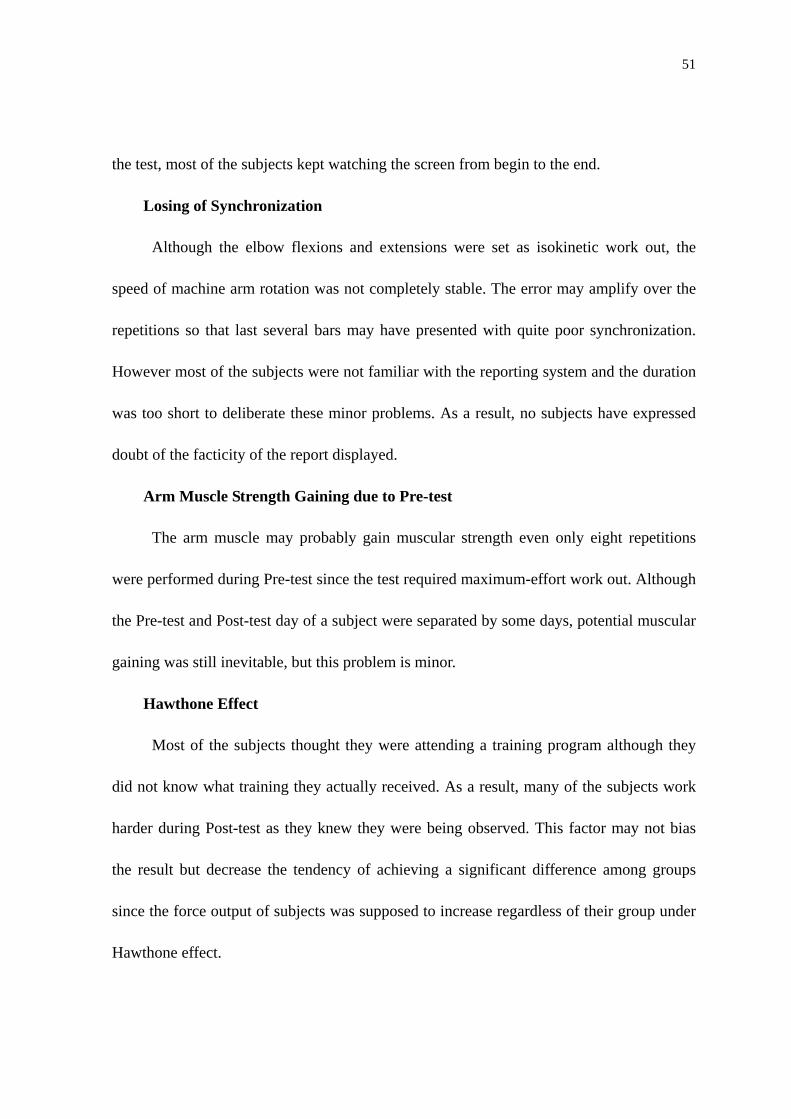
Losing of Synchronization
Although the elbow flexions and extensions were set as isokinetic work out, the
speed of machine arm rotation was not completely stable. The error may amplify over the
repetitions so that last several bars may have presented with quite poor synchronization.
However most of the subjects were not familiar with the reporting system and the duration
was too short to deliberate these minor problems. As a result, no subjects have expressed
doubt of the facticity of the report displayed.
Arm Muscle Strength Gaining due to Pre-test
The arm muscle may probably gain muscular strength even only eight repetitions
were performed during Pre-test since the test required maximum-effort work out. Although
the Pre-test and Post-test day of a subject were separated by some days, potential muscular
gaining was still inevitable, but this problem is minor.
Hawthone Effect
Most of the subjects thought they were attending a training program although they
did not know what training they actually received. As a result, many of the subjects work
harder during Post-test as they knew they were being observed. This factor may not bias
the result but decrease the tendency of achieving a significant difference among groups
since the force output of subjects was supposed to increase regardless of their group under
Hawthone effect.
52
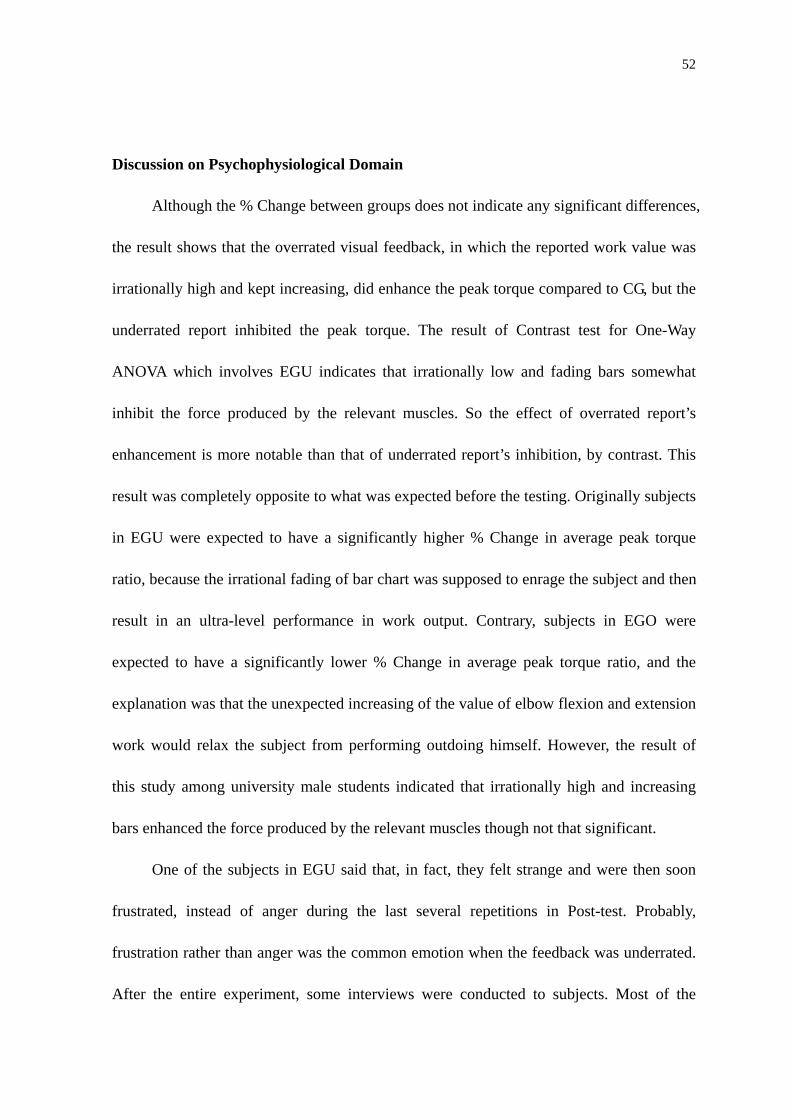
Discussion on Psychophysiological Domain
Although the % Change between groups does not indicate any significant differences,
the result shows that the overrated visual feedback, in which the reported work value was
irrationally high and kept increasing, did enhance the peak torque compared to CG, but the
underrated report inhibited the peak torque. The result of Contrast test for One-Way
ANOVA which involves EGU indicates that irrationally low and fading bars somewhat
inhibit the force produced by the relevant muscles. So the effect of overrated report’s
enhancement is more notable than that of underrated report’s inhibition, by contrast. This
result was completely opposite to what was expected before the testing. Originally subjects
in EGU were expected to have a significantly higher % Change in average peak torque
ratio, because the irrational fading of bar chart was supposed to enrage the subject and then
result in an ultra-level performance in work output. Contrary, subjects in EGO were
expected to have a significantly lower % Change in average peak torque ratio, and the
explanation was that the unexpected increasing of the value of elbow flexion and extension
work would relax the subject from performing outdoing himself. However, the result of
this study among university male students indicated that irrationally high and increasing
bars enhanced the force produced by the relevant muscles though not that significant.
One of the subjects in EGU said that, in fact, they felt strange and were then soon
frustrated, instead of anger during the last several repetitions in Post-test. Probably,
frustration rather than anger was the common emotion when the feedback was underrated.
After the entire experiment, some interviews were conducted to subjects. Most of the
53
subjects in Experimental Group expressed their confusion about the irrational fluctuation
of the last several bars representing the work value in the report displayed. The only
subject in EGU, whose Post-test’s average peak torque was even lower than that of Pre-test,
said that he felt very strange when he saw first several irrational low bars since he had tried
his best, and then he felt frustrated soon during last several repetitions. By contrast, the
subject in EGO said that he felt a little bit confused at the very beginning of manipulated
video was played. After the confusion, he soon attempted to produce an even higher bar.
These explanations are far away from the expectation but are quite reasonable. However
the fact that subjects have not enough time to doubt the facticity of the video is expected.
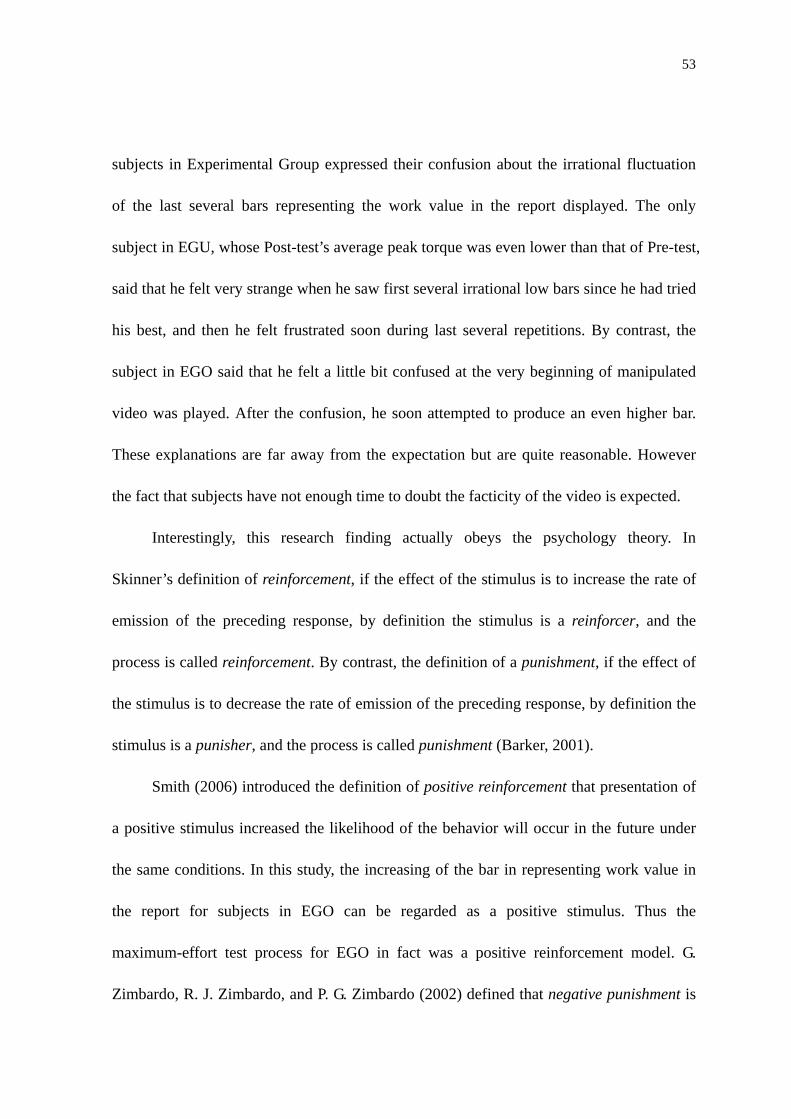
Interestingly, this research finding actually obeys the psychology theory. In
Skinner’s definition of reinforcement, if the effect of the stimulus is to increase the rate of
emission of the preceding response, by definition the stimulus is a reinforcer, and the
process is called reinforcement. By contrast, the definition of a punishment, if the effect of
the stimulus is to decrease the rate of emission of the preceding response, by definition the
stimulus is a punisher, and the process is called punishment (Barker, 2001).
Smith (2006) introduced the definition of positive reinforcement that presentation of
a positive stimulus increased the likelihood of the behavior will occur in the future under
the same conditions. In this study, the increasing of the bar in representing work value in
the report for subjects in EGO can be regarded as a positive stimulus. Thus the
maximum-effort test process for EGO in fact was a positive reinforcement model. G.
Zimbardo, R. J. Zimbardo, and P. G. Zimbardo (2002) defined that negative punishment is
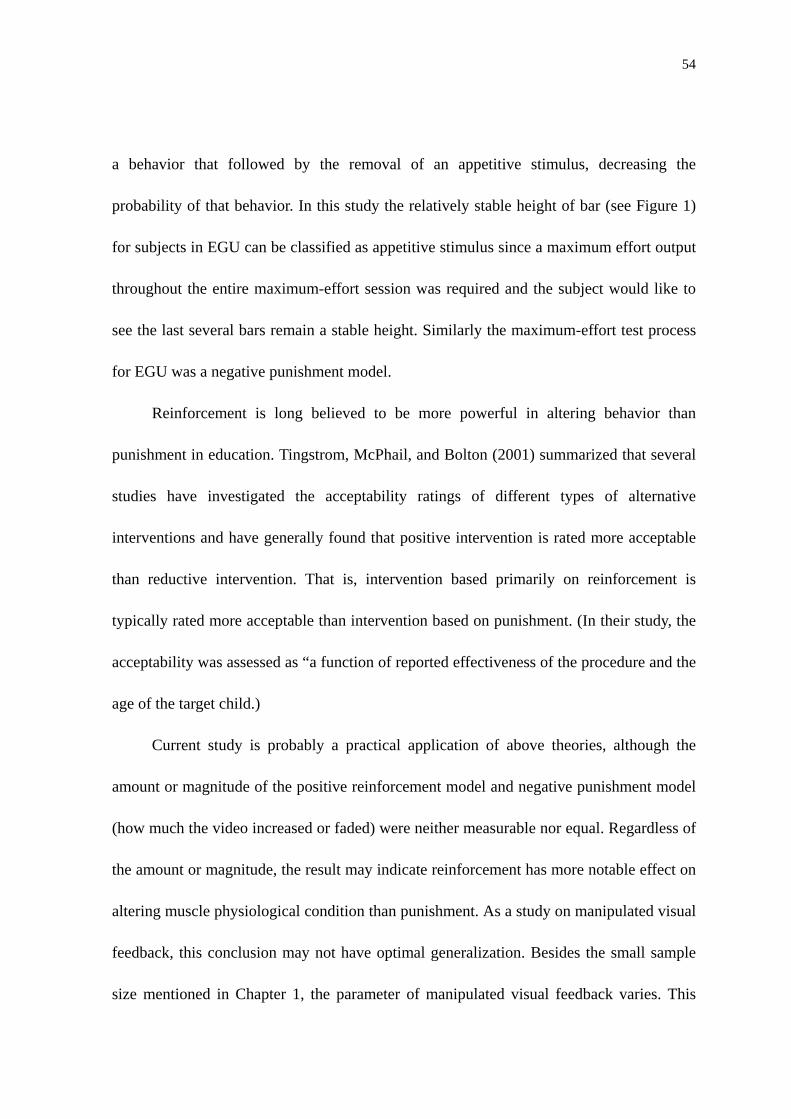
54
a behavior that followed by the removal of an appetitive stimulus, decreasing the
probability of that behavior. In this study the relatively stable height of bar (see Figure 1)
for subjects in EGU can be classified as appetitive stimulus since a maximum effort output
throughout the entire maximum-effort session was required and the subject would like to
see the last several bars remain a stable height. Similarly the maximum-effort test process
for EGU was a negative punishment model.
Reinforcement is long believed to be more powerful in altering behavior than
punishment in education. Tingstrom, McPhail, and Bolton (2001) summarized that several
studies have investigated the acceptability ratings of different types of alternative
interventions and have generally found that positive intervention is rated more acceptable
than reductive intervention. That is, intervention based primarily on reinforcement is
typically rated more acceptable than intervention based on punishment. (In their study, the
acceptability was assessed as “a function of reported effectiveness of the procedure and the
age of the target child.)
Current study is probably a practical application of above theories, although the
amount or magnitude of the positive reinforcement model and negative punishment model
(how much the video increased or faded) were neither measurable nor equal. Regardless of
the amount or magnitude, the result may indicate reinforcement has more notable effect on
altering muscle physiological condition than punishment. As a study on manipulated visual
feedback, this conclusion may not have optimal generalization. Besides the small sample
size mentioned in Chapter 1, the parameter of manipulated visual feedback varies. This
55
study is mainly about one parameter, the height of bars in the real-time work report, and
therefore the efficacy of manipulated visual feedback needs further studied in various
dimension such as psychophysiology, on its different parameters.
In exercise science and physical education, reinforcement and punishment have also
been widely studied. Smith (2006) mentioned that there is clear evidence that punishment
and criticism can decrease unwanted behaviors. Unfortunately, the evidence is equally
compelling that punishment has certain undesirable side effects that can actually interfere
with what a coach is trying to accomplish. First and foremost is the fact that punishment
works by arousing fear.
Barker and Cliff (2003) concluded that fear of the negative stimulus may initially
inhibit or prevent the athlete from achieving peak performance. But once the player is put
into a relaxed and confident frame of mind and exposed repeatedly to the negative stimulus
in the form of game competition, he can ultimately have a breakthrough game in which he
will overcome his performance anxiety and lock the powerful positive reinforcements
associated with successful play into the desired behavior.
Previous researches in sport psychology successfully analyzed the effect of emotion
on sports performance. Extra research finding of this study (i.e. the psychophysiology
finding) probably implies that the psychological activity can affect the force output of
working muscles instead of a very broad idea such as sports performance.
Discussion on Ethical Issues
During Post-test maximum-effort sets, the subjects were told at first that the video
56
played at mean time was his real-time torque report, but actually not. This design was
aimed to optimize the experiment validity. After explaining the study during debriefing, no
subjects have complained about being deceived.
57
Chapter 5
SUMMARY AND CONCLUSION
Summary of Results
This study was to assess the effect of visual feedback aroused by manipulated
real-time report on muscle force output in university male students. Thirty university male
students participated in the study as subjects and 29 data was obtained at last. The subjects
were asked to perform maximum-effort elbow flexions and extensions on isokinetic
dynamometer after several seconds break behind the trial. There were three test sessions in
the study after several pilot tests. The first test was used to capture the video of real time
report. The second one was a Pre-test which used to obtain the raw data before
manipulation. The last test, Post-test was used to obtain data during manipulation. Subjects
were divided into three groups: CG, EGU, and EGO. Three groups were interfered with
different manipulations in Post-test. CG subjects were given the original report captured in
the first test. EGU was given a manipulated video, where the last four bars which reflect
work value of elbow flexions and extensions in the dynamic report being edited into
irrationally low and fading bars. Contrary, the video played to EGO were edited into
irrationally high and increasing ones. The system recorded the average peak torque of eight
flexions and that of eight extensions. Then the ratio Post-test value over Pre-test value in
different Experimental Groups were compared to that in CG by Contrast test for One-way
ANOVA at a significant level of 0.05. The means of % change in average peak torque were
58
additionally compared by independent t-test just as a reference.
Conclusion
The result indicated that the improvement in average torque value from Pre-test to
Post-test neither in EGO nor in EGU were significantly different from CG. However, the %
Change of EGO was higher than EGU though not significant. Due to various threats to
reliability and validity, the manipulated visual feedback is not significant in altering force
output of target muscle, although the result of t-test implies the overrated visual feedback
can significantly enhance the force output, it is not suitable to use t-test here. In
psychology concepts, the situation in EGO can be identified as positive reinforcement
model; the situation in EGU can be identified as negative punishment model.
Reinforcement is widely accepted to have a stronger ability to alter human behavior than
punishment in education, and the result of this conclusion obeys this theory even in
physiological performance such as muscle contraction. In addition, this study potentially
implied that psychological activity can affect the force output produced by working muscle
in university male students.
Recommendation for Further Studies
Besides prevention of various risks listed in Chapter 4 which would threat the
reliability of the study, several extra recommendations are listed below.
First, more Pre-tests are highly recommended if time allows. With repeated practices,
subjects can learn the technique of how to perform optimal work output inside the
ergonomic environment on isokinetic dynamometer and finally discover their individual
59
optimal ergonomic setting, which may promise the real maximum output during Post-test.
Second, the magnitude of edited irrationally high or low bars should be standardized
and taken into statistic. Current study has no control upon the qualitative parameters of
manipulation on the feedback but only the quantitative parameters. With the magnitude of
manipulation taken into consideration, the result would be more precise and persuasive.
Last but not least, if the computer of the isokinetic dynamometer can calculate only
the mean torque value in manipulated period (i.e. last four repetitions of elbow flexions
and extensions), the result would be more accurate and valid.
60
REFERENCES
Barker, C. (2003). Personality theory in coaching: Positive reinforcement. Coach &
Athletic Director, 73(2), 68.
Barker, L. M. (2001). Learning and behavior: Biological, psychological, and sociocultural
perspectives. Upper Saddle River, NJ: Prentice Hall.
Biofeedback. (n.d.). In The Association for Applied Psychophysiology and Biofeedback.
Retrieved February 7, 2010, from http://www.aapb.org
Bircan, C., Senocak, O., Peker, O., Kaya, A., Tamcõ, S. A., Gulbahar, S., …Akalin, E.
(2002). Efficacy of two forms of electrical stimulation in increasing quadriceps
strength: a randomized controlled trial. Clinical Rehabilitation, 16, 194-199. doi:
10.1191/0269215502cr467oa
Campenella, B., Mattacola, C. G., & Kimura, I. F. (2000). Effect of visual feedback and
verbal encouragement on concentric quadriceps and hamstrings peak torque of males
and females . Isokinetics and Exercise Science, 8, 1-6. Abstract retrieved from
http://iospress.metapress.com/content/c8hkw7ef5t9glm2b/
Cohen, S. L., Richardson, J., Klebez, J., Febbo, S., & Tucker, D. (2001). EMG biofeedback:
The effects of CRF, FR, VR, FI, and VI schedules of reinforcement on the acquisition
and extinction of increases in forearm muscle tension. Applied Pschophysiology and
Biofeedback, 26(3), 179-194. doi: 1090-0586/01/0900-0179$19.50/0
Collins, D. (2002). Psychophysiology and athletic performance. In B. Blumenstein, M.
Bar-eli, & G. Tenenbaum (Eds.), Brain and body in sport and exercise: Biofeedback
61
application in performance enhancement (pp.15-35). UD, UK: John Wiley & Sons.
CSMi Humac Norm product overview. (n.d.) Retrieved April 22, 2010, from
http://www.csmisolutions.com/products/humac_norm/humac_overview.shtml
Elliott, D., & Allard, F. (2006). The utilization of visual feedback information during rapid
pointing movements. The Quarterly Journal of Experimental Psychology, A, 37(3),
407 - 425. Abstract retrieved from
http://www.informaworld.com/smpp/content~content=a776369028&db=all
Gallagher, A. G., McClure, N., McGuigan, J., Crothers, I., & Browning, J. (1999). Virtual
reality training in laparoscopic surgery: A preliminary assessment of Minimally
Invasive Surgical Trainer Virtual Reality (MIST VR). Endoscopy, 31(4), 310-313.
Abstract retrieved from
https://www.thieme-connect.com/ejournals/abstract/endoscopy/doi/10.1055/s-1999-1
5
Jung, M. C., & Hallbeck, M. S. (2004). Quantification of the effects of instruction type,
verbal encouragement, and visual feedback on static and peak handgrip strength.
International Journal of Industrial Ergonomics, 34(5), 367-374. Abstract retrieved
from
http://www.sciencedirect.com/science?_ob=ArticleURL&_udi=B6V31-4CMYR2T-1
&_user=10&_coverDate=11%2F30%2F2004&_rdoc=1&_fmt=high&_orig=search
&_sort=d&_docanchor=&view=c&_searchStrId=1307976538&_rerunOrigin=schola
r.google&_acct=C000050221&_version=1&_urlVersion=0&_userid=10&md5=0f69
1596c7d6c5c3cadaf79c173f2b26
62
Kim, H. J.,& Kramer, J. F. (1997). Effectiveness of visual feedback during isokinetic
exercise. Journal of Orthopaedic & Sports Physical Therapy, 26(6), 318-23. Abstract
retrieved from
http://www.sciencedirect.com/science?_ob=ArticleURL&_udi=B6V31-4CMYR2T-1
&_user=10&_coverDate=11%2F30%2F2004&_rdoc=1&_fmt=high&_orig=search
&_sort=d&_docanchor=&view=c&_searchStrId=1307976538&_rerunOrigin=schola
r.google&_acct=C000050221&_version=1&_urlVersion=0&_userid=10&md5=0f69
1596c7d6c5c3cadaf79c173f2b26
Larivière, C., Gagnon, D., Arsenault, A. B., Gravel, D., & Loisel, P. (2005).
Electromyographic activity imbalances between contralateral back muscles: An
assessment of measurement properties. Journal of Rehabilitation Research &
Development, 42(2), 235-250. doi: 10.1682/JRRD.2004.01.0008
Massimino, M. J., & Sheridan, T. B. (1994). Teleoperator performance with varying force
and visual feedback. The Journal of the Human Factors and Ergonomics Society,
36(1), 145-157. Abstract retrieved from
http://www.ingentaconnect.com/content/hfes/hf/1994/00000036/00000001/art00009
Morone, N. E., & Greco, C. M. (2007). Mind-body interventions for chronic pain in older
adults: A structured review. Pain Medicine, 8(4), 359-375. doi:
10.1111/j.1526-4637.2007.00312.x
Powers, S. K. & Howley, E. T. (2007). Exercise physiology: Theory and application to
fitness and performance. New York, NY: McGraw-Hill.
Schwartz, M. S., and Montgomery, D. D. (2003). Entering the field and assuring
competence. In M. S. Schwartz, & F. Andrasik (Eds.), Biofeedback, a practitioner's
63
guide (pp. 20-26). New York, NY: The Guilford Press.
Sihvonen, S. E., Sipilä, S., & Era, P. A. (2004). Changes in postural balance in frail elderly
women during a 4-week visual feedback training: A randomized controlled trial.
Gerontology, 50, 87–95. doi: 10.1159/000075559
Smith, R. E. (2006). Positive reinforcement, performance feedback, and performance
enhancement. In J. M. Willians (Ed), Applied sport psychology: Personal growth to
peak performance (pp. 40-56). New York, NY: McGraw-Hill.
Tingstrom, D. H., McPhail, R. L., & Bolton, A. B. (2001). Acceptability of alternative
school-based interventions: The influence of reported effectiveness and age of target
child. The Journal of Psychology, 123(2), 133-140.
[Untitled photograph of elbow extension / flexion using dynamometer]. Retrieved
February 9, 2010, from:
http://www.csmisolutions.com/images/products/humac/patterns/pattern19_photo.jpg
Vernon, D. J. (2005). Can neurofeedback training enhance performance? An evaluation of
the evidence with implications for future research. Applied Psychophysiology and
Biofeedback, 30(4), 347-364.
Wrigley, T., & Strauss, G. (2000). Strength assessment by isokinetic dynamometer. In C. J.
Gore (Ed.), Physiological tests for elite athletes (p. 157). Champaign, IL: Human
Kinetics.
Zimbardo, G., Zimbardo, R. J., & Zimbardo, P. G. (2002). Glossary of psychological terms.
Psychology and Life, 16(e). Retrieved April 11, 2010, from

64
http://www.apa.org/research/action/glossary.aspx

65
APPENDIX A
Consent Form to Students (Chinese Version)*
敬啟者:
生理回饋對於力量訓練作用的測試 本人葛力,現就讀於香港浸會大學康樂及體育系三年級,正預備完成上述測試。 本測試存在一定的危險性,但是在我們的嚴密監控下,多數情況下是安全的。本
測試需要採集受試者在 CSMi HUMAC Norm Testing and Rehabilitation System 上做八
次肘屈曲熱身及八次全力的肘屈曲,本測試的後測試(post-test)將于約兩周後進行,
測試內容相同。如有必要,受試者可以隨時揚聲要求終止測試。 如對本問卷有任何諮詢或欲得本研究結果,歡迎聯絡本人葛力,電話 98144997,
獲取有關資料 ◦ 謝謝
日期: 2010 年 2 月 11 日
_________________________________________________________________ 本人______________願意參與這次問卷調查,並得知本人之姓名將被保密 和有
權諮詢研究結果。 _________________ ________________ 簽署 日期
* Since this form was produced before the first testing, it does not reflect the updated
features in later tests or includes wrong information. However all subjects were informed
of the latest and correct information before testing. This note is also applicable to
Appendix B.
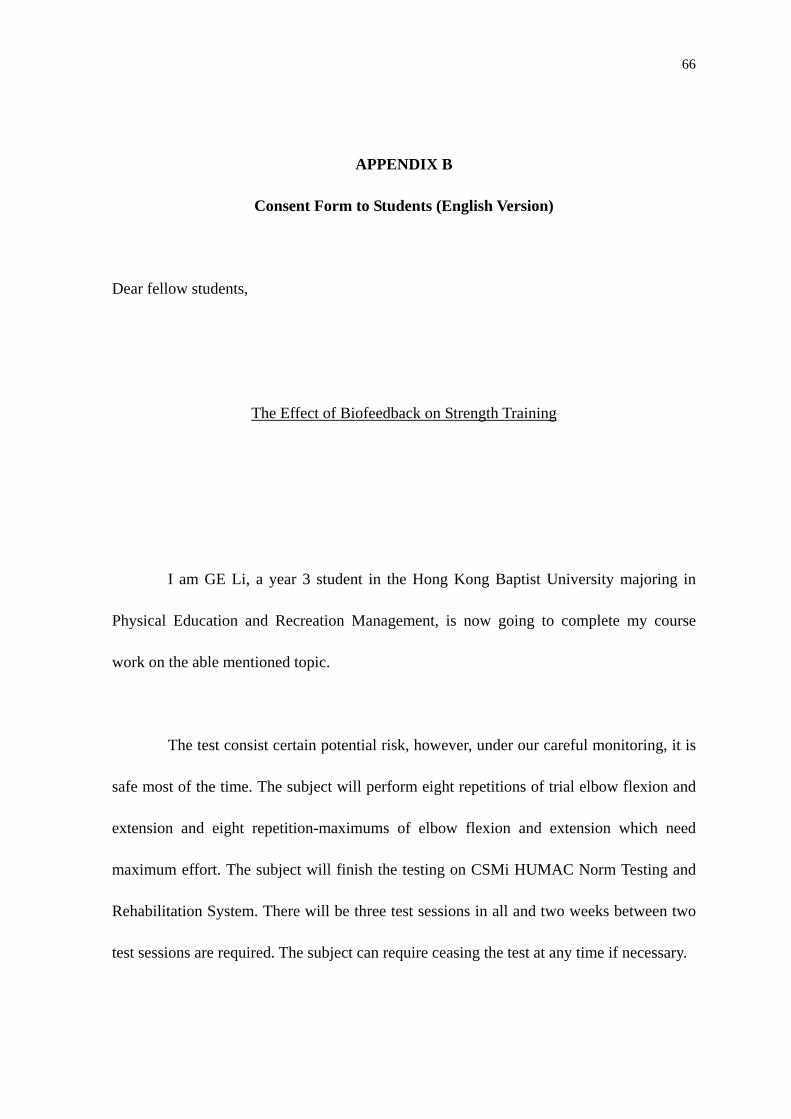
66
APPENDIX B
Consent Form to Students (English Version)
Dear fellow students,
The Effect of Biofeedback on Strength Training
I am GE Li, a year 3 student in the Hong Kong Baptist University majoring in
Physical Education and Recreation Management, is now going to complete my course
work on the able mentioned topic.
The test consist certain potential risk, however, under our careful monitoring, it is
safe most of the time. The subject will perform eight repetitions of trial elbow flexion and
extension and eight repetition-maximums of elbow flexion and extension which need
maximum effort. The subject will finish the testing on CSMi HUMAC Norm Testing and
Rehabilitation System. There will be three test sessions in all and two weeks between two
test sessions are required. The subject can require ceasing the test at any time if necessary.
67
Should there be any queries or if you want to get a copy of this research report,
please contact GE Li, telephone: 98144997.
Thank you.
Yours sincerely,
__________________
Date: Feb 11, 2010
_____________________________________________________________________
I, ___________________ understand my involvement of doing this questionnaire is
voluntary, and I have been told that my name will be kept confidential. I have the right to
ask for the completed report.
____________ ____________
Signature Date
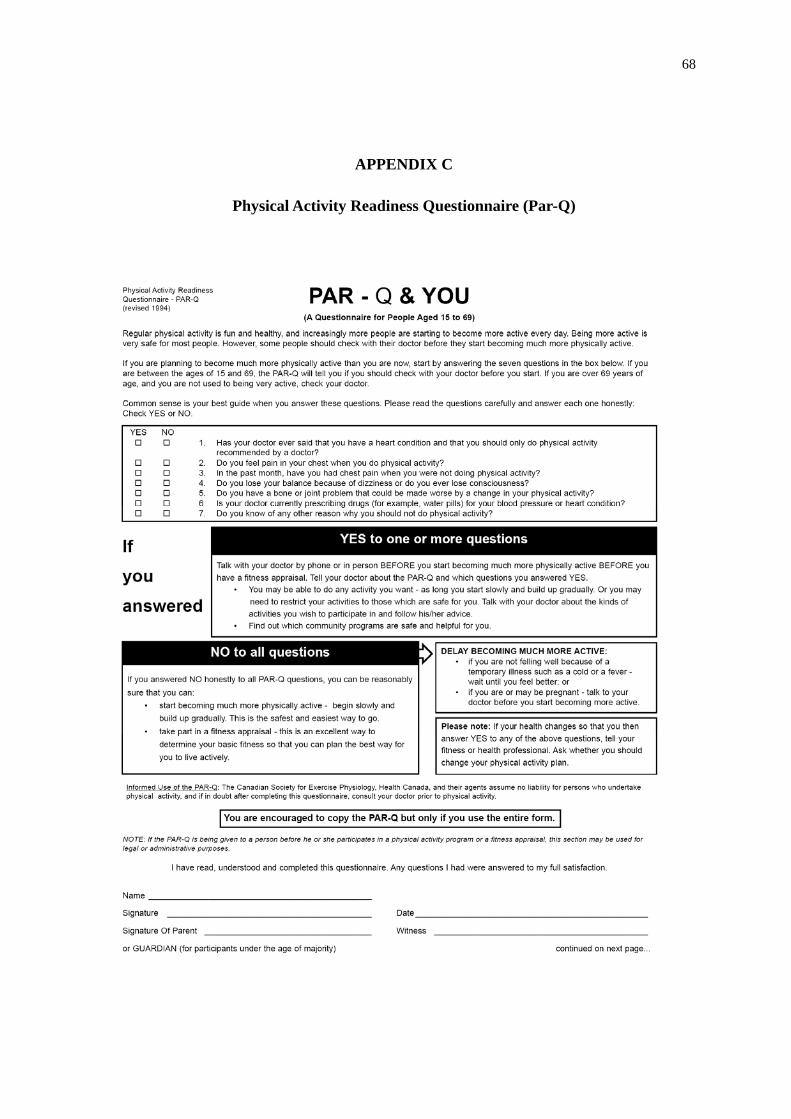
68
APPENDIX C
Physical Activity Readiness Questionnaire (Par-Q)
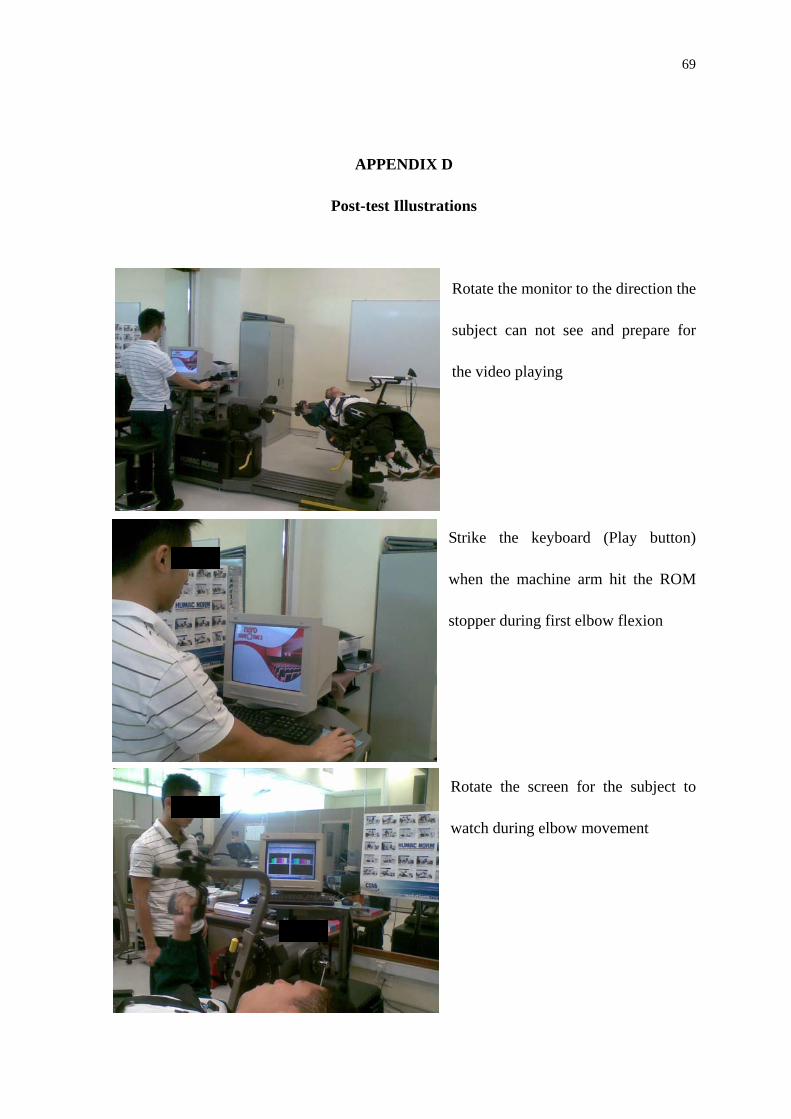
69
APPENDIX D
Post-test Illustrations
Rotate the monitor to the direction the
subject can not see and prepare for
the video playing
Strike the keyboard (Play button)
when the machine arm hit the ROM
stopper during first elbow flexion
Rotate the screen for the subject to
watch during elbow movement
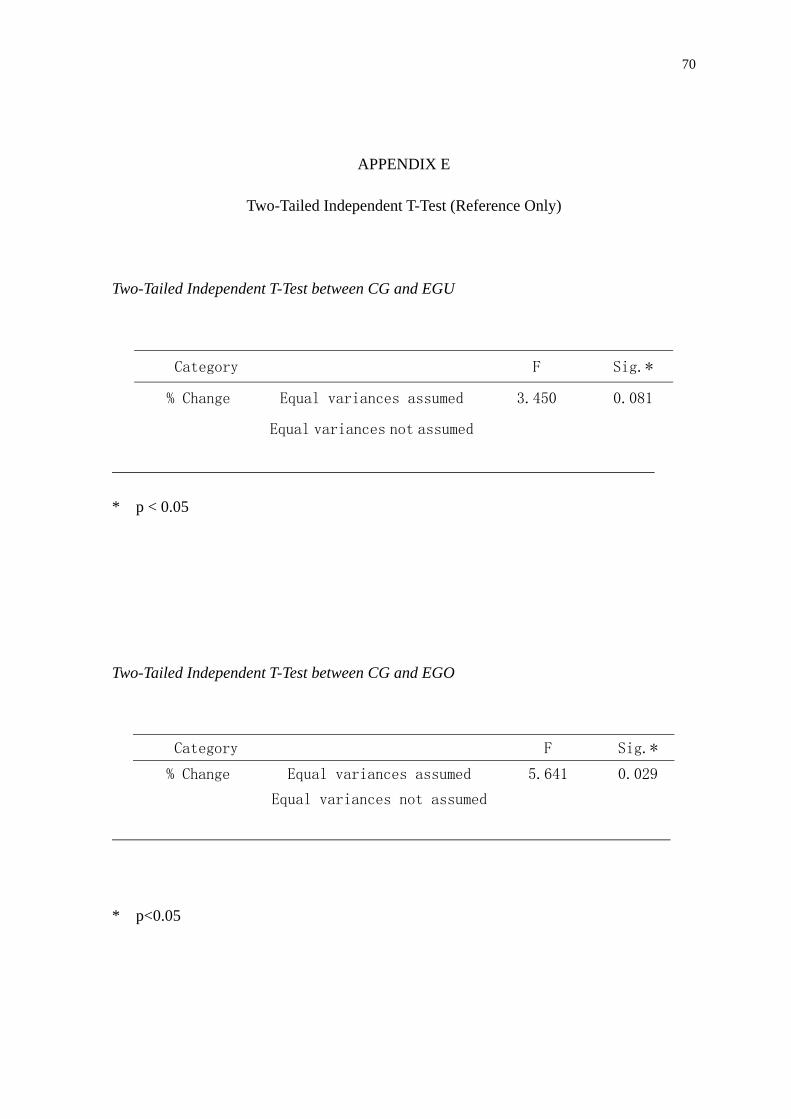
70
APPENDIX E
Two-Tailed Independent T-Test (Reference Only)
Two-Tailed Independent T-Test between CG and EGU
Category F Sig.*
% Change Equal variances assumed 3.450 0.081
Equal variances not assumed
* p < 0.05
Two-Tailed Independent T-Test between CG and EGO
Category F Sig.*
% Change Equal variances assumed 5.641 0.029
Equal variances not assumed
* p<0.05


![The Use of Visual Feedback [2009]](https://img.pdfslide.us/doc/110x75/55cf8f38550346703b9a23d0/the-use-of-visual-feedback-2009.jpg)