Embed Size (px)
Citation preview
307
Vol. 39, No. 3 (2017) 307-318, DOI: 10.24874/ti.2017.39.03.05
Tribology in Industry
www.tribology.fink.rs
Effect of Lubrication on Sliding Wear of Red Mud Particulate Reinforced Aluminium Alloy 6061
N. Panwar
a, R.P. Poonia a, G. Singh
a, R. Dabral a, A. Chauhan
a a Department of Mechanical engineering, University Institute of Engineering and Technology, Panjab University,
Chandigarh-160014, India.
Keywords:
Al6061 Red Mud Lubrication Sliding wear Mechanical properties
A B S T R A C T
In present study, Red mud, an industrial waste, has been utilized as a reinforcement material to fabricate Aluminium 6061 matrix based metal matrix composite. Taguchi L18 orthogonal array has been employed for fabrication of composite castings and for conducting the tribological experimentation. ANOVA analysis has been applied to examine the effect of individual parameters such as sliding condition: dry and wet, reinforcement weight fraction, load, speed, and sliding distance on specific wear rate obtained experimentally. It has been found that tensile strength and impact energy increases while elongation decreases, with increasing weight fraction and decrease in particle size of red mud. The percentage contribution of the effect of factors on SWR is Sliding condition (73.17), speed (7.84), percentage reinforcement (7.35), load (5.75), sliding distance (2.24), and particle size (1.25). It has also been observed that specific wear rate is very low in wet condition. However, it decreases with increase in weight fraction of reinforcement, decrease in load and sliding speed. Al6061/red mud metal matrix composites have shown reasonable strength and wear resistance. The use of red mud in Aluminium composite provides the solution for disposal of red mud and can possibly become an economic replacement of Aluminium and its alloys.
2017 Published by Faculty of Engineering
Corresponding author:
Amit Chauhan Department of Mechanical engineering, University Institute of Engineering and Technology, Panjab University, Chandigarh-160014, India. E-mail: [email protected]
1. INTRODUCTION The particulate reinforced metal matrix composites (MMCs) are the one of the most preferred engineering materials utilized for advanced applications. The MMCs consists of at least two chemically and physically distinct phases which are suitably distributed to provide properties not attainable with either of the individual phases [1]. Reinforcement material
improves the mechanical properties of the soft metal matrix materials such as high strength and stiffness and also provides ease of fabrication. Mostly used reinforcement materials in metallic alloys are SiC, Al2O3, TiC, B4C and boron and graphite (either independently or a combination of two or more) [2-6]. Some natural material such as coconut shell char, mica, palm-kernel shell char, red mud, fly ash, zircon and palm oil clinker are also available in abundance that can
RE
SEA
RC
H

N. Panwar et al., Tribology in Industry Vol. 39, No. 3 (2017) 307-318
308
also be used as reinforcements for development of low cost MMCs. Among the natural reinforcements, the red mud is a caustic insoluble waste and exhibit good potential. Quantities of red mud generated during aluminum production occupy big area and harms the environment by basifying land and polluting underground water. Therefore, Red mud must be treated and disposed off safely in order to reduce its environmental effects. In past, red mud has been restricted to recovery of some valuable materials i.e. Ti, V and Zn. Its use as a reinforcement has not been much reported. In India, red mud has been classified into east coast bauxite and central India bauxites and their composition has been reported by Kumar et al. [4]. In order to develop red mud based MMCs, suitable manufacturing process needs to be selected since it affects the fabricated composite’s microstructure, interfacial bonding between the matrix and reinforcement and distribution of reinforcing agent into matrix. Stir casting is the most common, economic and suitable choice to achieve optimum properties and uniform distribution of reinforcements in particle matrix composites [7]. Studies have been conducted by the researchers to study the wear behaviour of Al alloys composites under lubricating conditions. In these studies, the composites of Al-alloy with different fabrication techniques have been studied under various lubricating conditions. Some of the lubricants selected for these investigations are engine oil, base oil with additives and ionic liquids. It has been reported that wear losses of Al 6061 alloy and stainless steel 304 were considerably reduced by addition of yttrium and cerium in commercial lubricant [8]. Friction coefficient and wear of ASTM B211 aluminium-AISI 52100 steel contacts have been reduced by use of additive such as liquid crystals. Further, the abrasive wear mechanism has been found more at lower speed and adhesive wear has been prominent at higher speeds [9]. Walker et al. studied Al alloys (5056, 2121) matrix composite reinforced with 15 vol.% of Cr3Si, MoSi2, Ni3Al and SiC particles have been fabricated using powder metallurgy technique. It has been found that two and three body abrasion (particularly from the counter face) plastically deformed the surface by micro-ploughing and indentation [10]. Mohammad et al. in their study concluded that there has been significant reduction in wear of Al under helix lubricant with polytron as an
additive. This can be attributed to physical and chemical changes and hard surface film formed by polytron [11]. Further, Venkat et al. noticed that AlSi10Mg/fly ash/graphite hybrid composites possess better hardness, tensile strength and lower density than unreinforced alloy and aluminium-graphite composite. Wear rate has been found to be increasing with increase in fly ash content. Load carrying capacity of fly ash particles and formation of lubricating film of graphite have played the most important role in enhancement of tribological properties [12]. It has been observed from the literature that the wear characteristics of aluminium are improved under the application of lubricant. However, the wear study of Al 6061- red mud based composite under lubrication has not reported in literature. The effect of particle size on the properties of composite has not been reported in literature. Therefore, the present study aims at investigation of effect of parameters on mechanical properties such as tensile strength and impact strength of Al6061/red mud composite. A statistical analysis of parameters affecting SWR under both of the dry and lubricated conditions has been carried using Taguchi technique.
2. MATERIALS 2.1 Matrix Material In this study, Al 6061 alloy has been used as a matrix material. It was purchased in the form of rod from local market. 2.2 Reinforcement Material Red mud has been used as reinforcement material for development of the composites. Red mud is available at free of cost as it is waste by product of Bayer’s process. Red mud has been acquired from HINDALCO’s plant located at Renukoot (India). It has been separated in 60 (250 µm), 80 (177 µm) and 100 (149 µm) mesh sizes by using sieves of adequate sizes. The XRF (X-ray fluorescence) technique has been used to determine elemental composition of red mud. The result of XRF has been shown in Table 1.
N. Panwar et al., Tribology in Industry Vol. 39, No. 3 (2017) 307-318
309
Table 1. XRF result of red mud used in this study.
Fe2O3 3233.8 KCps 35.26 %
Al2O3 136.6 KCps 21.89 %
TiO2 411.9 KCps 15.11 %
SiO2 76.0 KCps 12.46 %
Na2O 39.7 KCps 11.82 %
CaO 47.2 KCps 1.83 %
P2O5 3.2 KCps 0.40 %
V2O5 16.9 KCps 0.38 %
SO3 2.6 KCps 0.19 %
ZrO2 78.9 KCps 0.15 %
K2O 3.3 KCps 0.13 %
MgO 0.9 KCps 0.12 %
SrO 2.2 KCps 43 PPM
Y2O3 1.2 KCps 22 PPM
Cr2O3 7.4 KCps 0.11 %
Cl 0.9 KCps 0.04 %
MnO 3.1 KCps 0.04 %
CuO 2.1 KCps 0.02 %
Sc2O3 0.3 KCps 0.01 %
Ga2O3 1.9 KCps 0.01 %
Nb2O5 5.4 KCps 0.01 %
ZnO 1.0 KCps 65 PPM
Ag 0.2 KCps 56 PPM
PbO 0.7 KCps 47 PPM
As2O3 1.7 KCps 45 PPM
NiO 0.4 KCps 44 PPM
Intensity Scale 0.9610
2.3 Lubricant In current study, SAE 20W-40 lubricant has been used and some of the specifications of the said lubricating oil are given below [13]:
Kinematic viscosity =13.5-15.5 CSt (at 100 oC),
Viscosity index=110 (Min.). 3. METHOD 3.1 Fabrication of samples Samples have been fabricated by stir casting method. The matrix material has been melted inside a graphite crucible using muffle furnace. Reinforcement particles are preheated in a separate muffle furnace. The alloy melt and the reinforcement particles have been mixed by mechanical stirrer mounted on muffle furnace. The molten mixture has been superheated in muffle furnace to increase fluidity for pouring. Then melt is then poured into the cylindrical moulds of different dimensions. 3.2 Experimental setup and procedure After casting, the samples have been machined and polished metallographically according to ASTM standard in order to investigate their mechanical properties and wear behaviour. For this purpose, a universal testing machine (Model: UTE100) with capacity of 1000 kN and resolution 0.05 kN has been used for tensile testing of samples according to ASTM 790-02 standards. Also, Izod V-notch test method (ASTM
D256 standard) has been used to measure impact strength of composite samples. Impact testing machine has a range of 1 to 175 J load capacity with least count of 0.5 J. In order to study the wear properties of the composites, a pin-on-disc friction and wear monitor (Model: TR-20LE-PHM-CHM400 from DUCOM Bangalore) has been used. The equipment is designed for a wide range of loads up to 200N & speed from 200 to 2000 rpm. The apparatus facilitates the study of friction and wear characteristics of a specimen in sliding contacts under different test conditions. The sliding occurs between the stationary pin of composite samples and a rotating disc of very hard material. The normal load, rotational speed and wear track diameter can be varied to suit test conditions. Tangential force and wear are observed with electronic sensors and recorded on computer monitor. These parameters are plotted as functions of load and speed. The disc is made up of EN-31 having a diameter of 100mm and 8 mm thickness and a hardness value of 60 HRc (ground to surface roughness of 1.6Ra). The specimens used in the shape of cylindrical pin and have a diameter of 10 mm with 30 mm length. The initial and final weights of pin have been measured to calculate mass loss using an electronic weighing machine with least count of 0.0001 gm. Following formula has been used to calculate specific wear rate.
SWR=∆m/LF (1)
Where, SWR is specific wear rate (mm3/N-m), ∆m is the mass loss (gm), is density of testing pin specimen (gm/cm3) and F is the load (N), L is the sliding distance (m). 3.3 Planning and conduction of experiments Taguchi method has been used to for designing of the experiments and analysing the results. Taguchi method is a powerful tool of experimental design, which is used to enhance the quality of product or process. It acquires data in a controlled manner and study the effect of process variables over response variable. It has been used by many researchers to study wear and frictional behaviour of aluminium matrix composites (AMCs). In comparison to full factorial design, Taguchi’s method models the response function and reduces the amount of experiments to study the effect of various

N. Panwar et al., Tribology in Industry Vol. 39, No. 3 (2017) 307-318
310
variables on the response function. Thus, this saves time and resources and helps in finding out optimal combination of parameters that gives optimal response. After studying the literature feasibility of experiments at our institute laboratory different factors and their corresponding levels has been decided. In this research work, specific wear rate has been chosen as a response variable to be studied and Table 2 shows the selected factors and their levels. Table 2. Factors and their levels for experimentation.
Symbol Control factor
Units Levels
C1 Sliding
Condition - Dry (1) Lubrication (2)
C2 Percentage - 4 % 8 % 12 %
C3 Particle size - 60 80 100
C4 Load N 39.24 49.05 58.86
C5 Sliding
Distance M 3000 4000 5000
C6 Speed m/s 0.5 1 1.5
The most important part of the planning phase is to select appropriate orthogonal array (OA). The OA is used to arrange factors and their levels and the experiments are conducted according to a sequence and combination. The number of runs in the orthogonal design should be greater than or equal to the total degree of freedom (DOF) and the selected OA should be able to accommodate the factor-level combination. The degrees of freedom are defined as the number of comparisons between the design parameters that need to be made to determine the influence of the parameters and their levels. For example, a three-level design parameter counts for two degrees of freedom. The degrees of freedom associated with the interaction between two design parameters are given by the product of the degrees of freedom for the two design parameters. In the present study, the interaction between the wear parameters is neglected. Therefore, there are eleven degrees of freedom owing to six wear parameters out of which one has two level and five parameters has three level [14,15]. For this, L18 OA has been selected as it fulfils both conditions mentioned above. Table 3 shows the factors and their levels after placing their value in standard OA L18. According to the below table experiments has been conducted. Replication of each experiments has been done twice to reduce the error and for geeting reliable results.
Table 3. L18 Orthogonal Array.
S.N. C1 C2 C3 C4 C5 C6
1 1 4 60 39.24 3000 0.5
2 1 4 80 49.05 4000 1 3 1 4 100 58.86 5000 1.5 4 1 8 60 39.24 4000 1 5 1 8 80 49.05 5000 1.5 6 1 8 100 58.86 3000 0.5 7 1 12 60 49.05 3000 1.5 8 1 12 80 58.86 4000 0.5 9 1 12 100 39.24 5000 1
10 2 4 60 58.86 5000 1
11 2 4 80 39.24 3000 1.5 12 2 4 100 49.05 4000 0.5 13 2 8 60 49.05 5000 0.5 14 2 8 80 58.86 3000 1 15 2 8 100 39.24 4000 1.5 16 2 12 60 58.86 4000 1.5
17 2 12 80 39.24 5000 0.5
18 2 12 100 49.05 3000 1
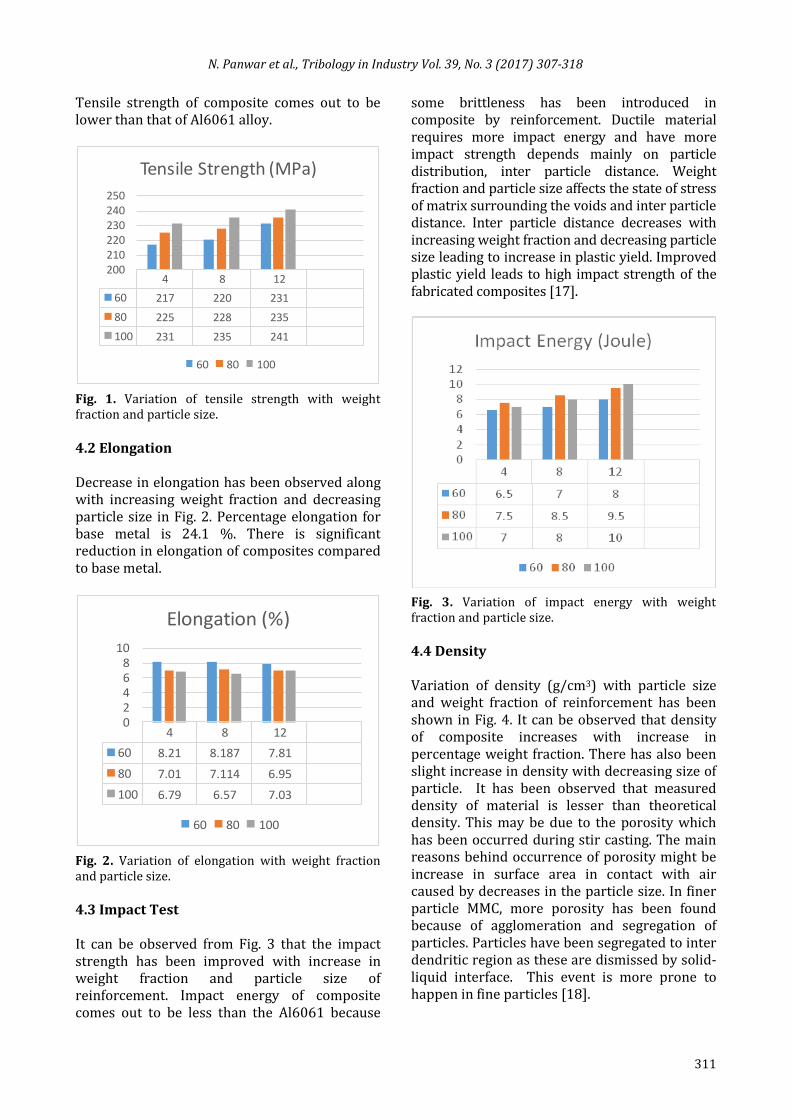
The aim of this research is to calculate specific wear rate and analyze its variation caused by controlled input factor. Analysis of this design has been done using MINITAB 17 software. The most important term used in this analysis is S/N ratio which is described as ratio of mean of signal to the standard deviation of the noise. Noise factors are random uncontrollable factors. The S/N ratio predicts the performance of a product in the existence of noise factors. So, efforts are made to maximum the S/N ratio for the response variables. As the efforts are being made to minimize the specific wear rate so smaller is better has been selected out of three different S/N ratios smaller is better, nominal is best and larger is better for this research work. 4. RESULTS AND DISCUSSIONS 4.1 Tensile strength Figure 1 show that the tensile strength has been increased, with increase in weight fraction of reinforcement particles and decrease in particle size. As amount of reinforcement increases, material deforms plastically, more number of dislocations are generated and hinder the further movement of the composites during testing. Strong reinforcement-matrix interaction effectively transfers tensile stress from matrix to reinforcement leads to improvement of tensile strength [16]. Decrease in particle size increases in interfacial action leading to material become more brittle hence reduced tensile strength.
N. Panwar et al., Tribology in Industry Vol. 39, No. 3 (2017) 307-318
311
Tensile strength of composite comes out to be lower than that of Al6061 alloy.
4 8 12
60 217 220 231
80 225 228 235
100 231 235 241
200210220230240250
Tensile Strength (MPa)
60 80 100
Fig. 1. Variation of tensile strength with weight fraction and particle size.
4.2 Elongation Decrease in elongation has been observed along with increasing weight fraction and decreasing particle size in Fig. 2. Percentage elongation for base metal is 24.1 %. There is significant reduction in elongation of composites compared to base metal.
4 8 12
60 8.21 8.187 7.81
80 7.01 7.114 6.95
100 6.79 6.57 7.03
02468
10
Elongation (%)
60 80 100
Fig. 2. Variation of elongation with weight fraction and particle size.
4.3 Impact Test It can be observed from Fig. 3 that the impact strength has been improved with increase in weight fraction and particle size of reinforcement. Impact energy of composite comes out to be less than the Al6061 because
some brittleness has been introduced in composite by reinforcement. Ductile material requires more impact energy and have more impact strength depends mainly on particle distribution, inter particle distance. Weight fraction and particle size affects the state of stress of matrix surrounding the voids and inter particle distance. Inter particle distance decreases with increasing weight fraction and decreasing particle size leading to increase in plastic yield. Improved plastic yield leads to high impact strength of the fabricated composites [17].
Fig. 3. Variation of impact energy with weight fraction and particle size.
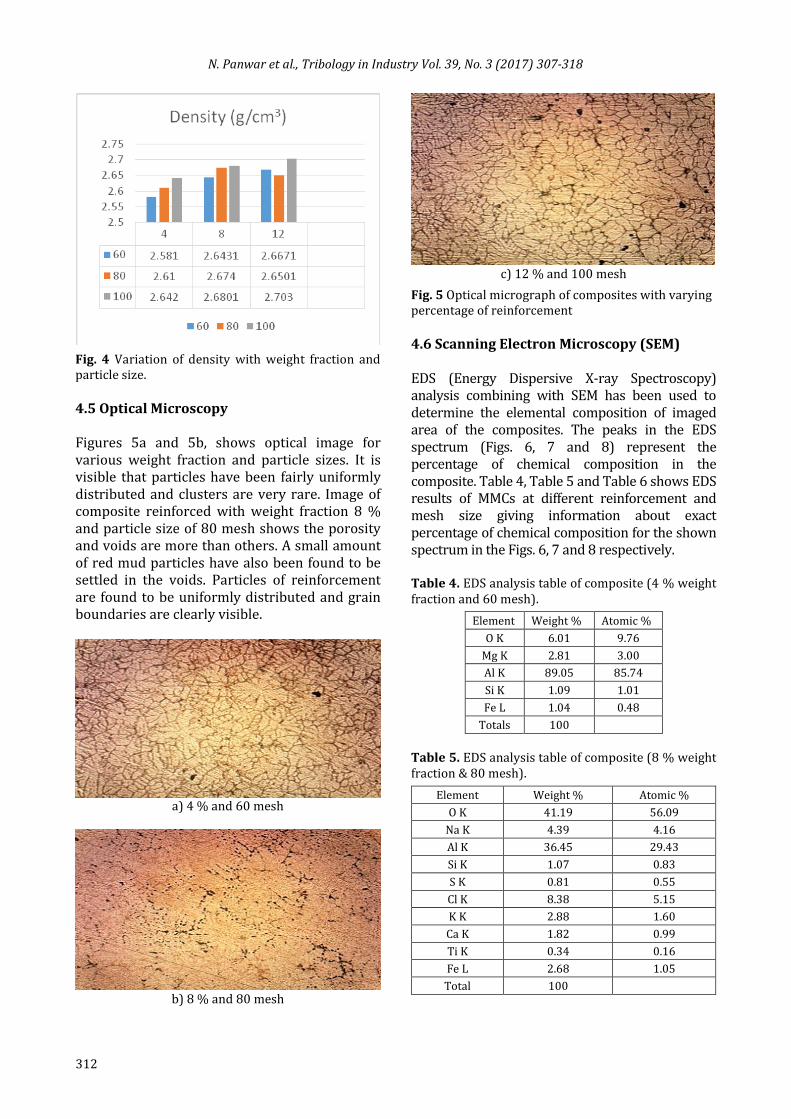
4.4 Density Variation of density (g/cm3) with particle size and weight fraction of reinforcement has been shown in Fig. 4. It can be observed that density of composite increases with increase in percentage weight fraction. There has also been slight increase in density with decreasing size of particle. It has been observed that measured density of material is lesser than theoretical density. This may be due to the porosity which has been occurred during stir casting. The main reasons behind occurrence of porosity might be increase in surface area in contact with air caused by decreases in the particle size. In finer particle MMC, more porosity has been found because of agglomeration and segregation of particles. Particles have been segregated to inter dendritic region as these are dismissed by solid-liquid interface. This event is more prone to happen in fine particles [18].
N. Panwar et al., Tribology in Industry Vol. 39, No. 3 (2017) 307-318
312
Fig. 4 Variation of density with weight fraction and particle size.
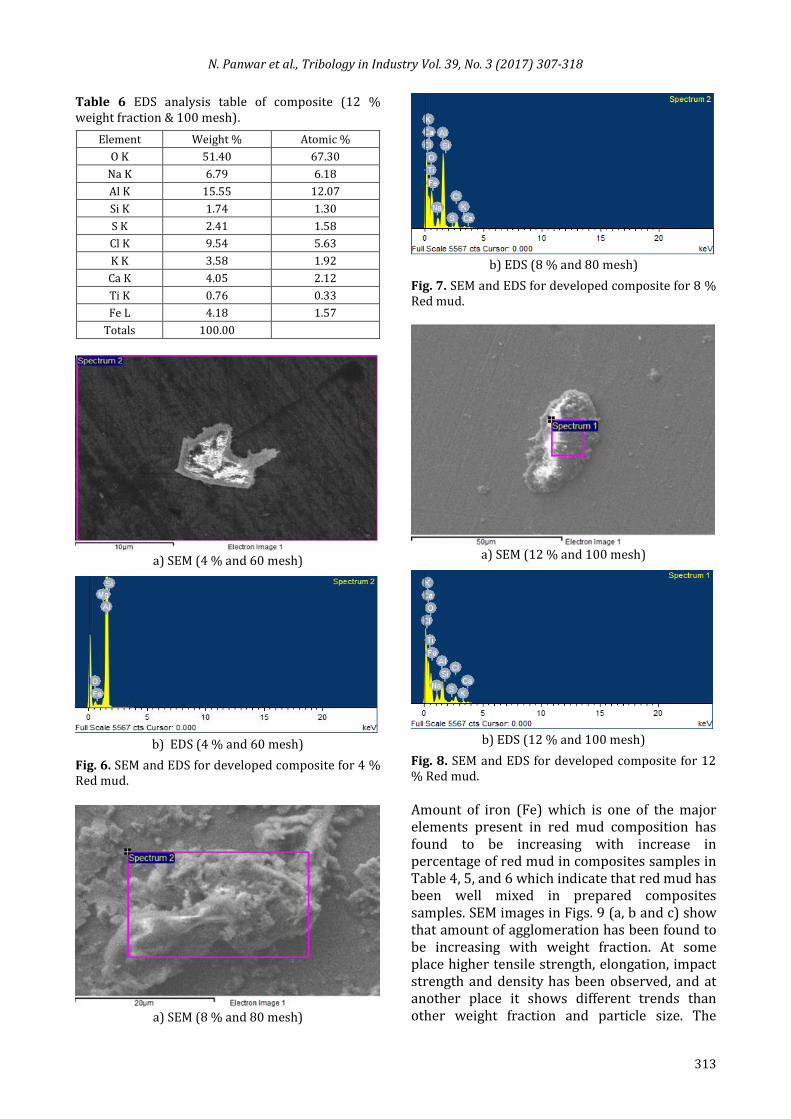
4.5 Optical Microscopy Figures 5a and 5b, shows optical image for various weight fraction and particle sizes. It is visible that particles have been fairly uniformly distributed and clusters are very rare. Image of composite reinforced with weight fraction 8 % and particle size of 80 mesh shows the porosity and voids are more than others. A small amount of red mud particles have also been found to be settled in the voids. Particles of reinforcement are found to be uniformly distributed and grain boundaries are clearly visible.
a) 4 % and 60 mesh
b) 8 % and 80 mesh
c) 12 % and 100 mesh
Fig. 5 Optical micrograph of composites with varying percentage of reinforcement
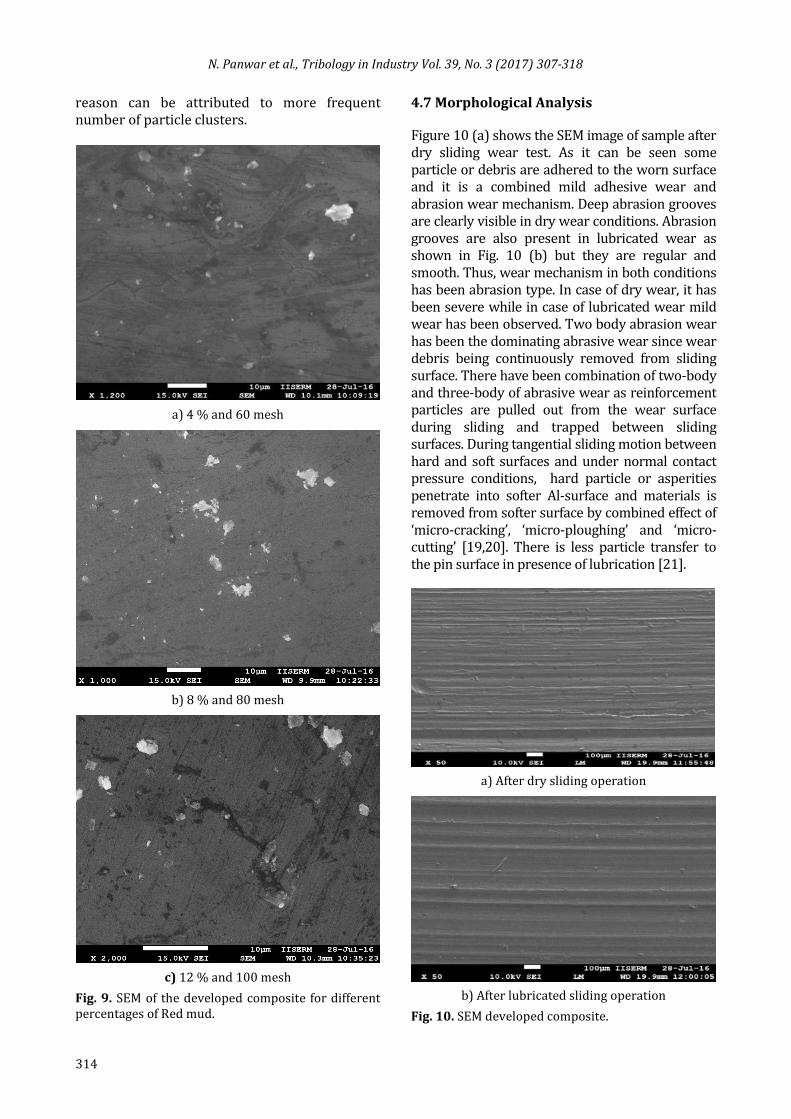
4.6 Scanning Electron Microscopy (SEM) EDS (Energy Dispersive X-ray Spectroscopy) analysis combining with SEM has been used to determine the elemental composition of imaged area of the composites. The peaks in the EDS spectrum (Figs. 6, 7 and 8) represent the percentage of chemical composition in the composite. Table 4, Table 5 and Table 6 shows EDS results of MMCs at different reinforcement and mesh size giving information about exact percentage of chemical composition for the shown spectrum in the Figs. 6, 7 and 8 respectively. Table 4. EDS analysis table of composite (4 % weight fraction and 60 mesh).
Element Weight % Atomic %
O K 6.01 9.76
Mg K 2.81 3.00
Al K 89.05 85.74
Si K 1.09 1.01
Fe L 1.04 0.48
Totals 100
Table 5. EDS analysis table of composite (8 % weight fraction & 80 mesh).
Element Weight % Atomic %
O K 41.19 56.09
Na K 4.39 4.16
Al K 36.45 29.43
Si K 1.07 0.83
S K 0.81 0.55
Cl K 8.38 5.15
K K 2.88 1.60
Ca K 1.82 0.99
Ti K 0.34 0.16
Fe L 2.68 1.05
Total 100
N. Panwar et al., Tribology in Industry Vol. 39, No. 3 (2017) 307-318
313
Table 6 EDS analysis table of composite (12 % weight fraction & 100 mesh).
Element Weight % Atomic %
O K 51.40 67.30
Na K 6.79 6.18
Al K 15.55 12.07
Si K 1.74 1.30
S K 2.41 1.58
Cl K 9.54 5.63
K K 3.58 1.92
Ca K 4.05 2.12
Ti K 0.76 0.33
Fe L 4.18 1.57
Totals 100.00
a) SEM (4 % and 60 mesh)
b) EDS (4 % and 60 mesh)
Fig. 6. SEM and EDS for developed composite for 4 % Red mud.
a) SEM (8 % and 80 mesh)
b) EDS (8 % and 80 mesh)
Fig. 7. SEM and EDS for developed composite for 8 % Red mud.
a) SEM (12 % and 100 mesh)
b) EDS (12 % and 100 mesh)
Fig. 8. SEM and EDS for developed composite for 12 % Red mud.
Amount of iron (Fe) which is one of the major elements present in red mud composition has found to be increasing with increase in percentage of red mud in composites samples in Table 4, 5, and 6 which indicate that red mud has been well mixed in prepared composites samples. SEM images in Figs. 9 (a, b and c) show that amount of agglomeration has been found to be increasing with weight fraction. At some place higher tensile strength, elongation, impact strength and density has been observed, and at another place it shows different trends than other weight fraction and particle size. The
N. Panwar et al., Tribology in Industry Vol. 39, No. 3 (2017) 307-318
314
reason can be attributed to more frequent number of particle clusters.
a) 4 % and 60 mesh
b) 8 % and 80 mesh
c) 12 % and 100 mesh
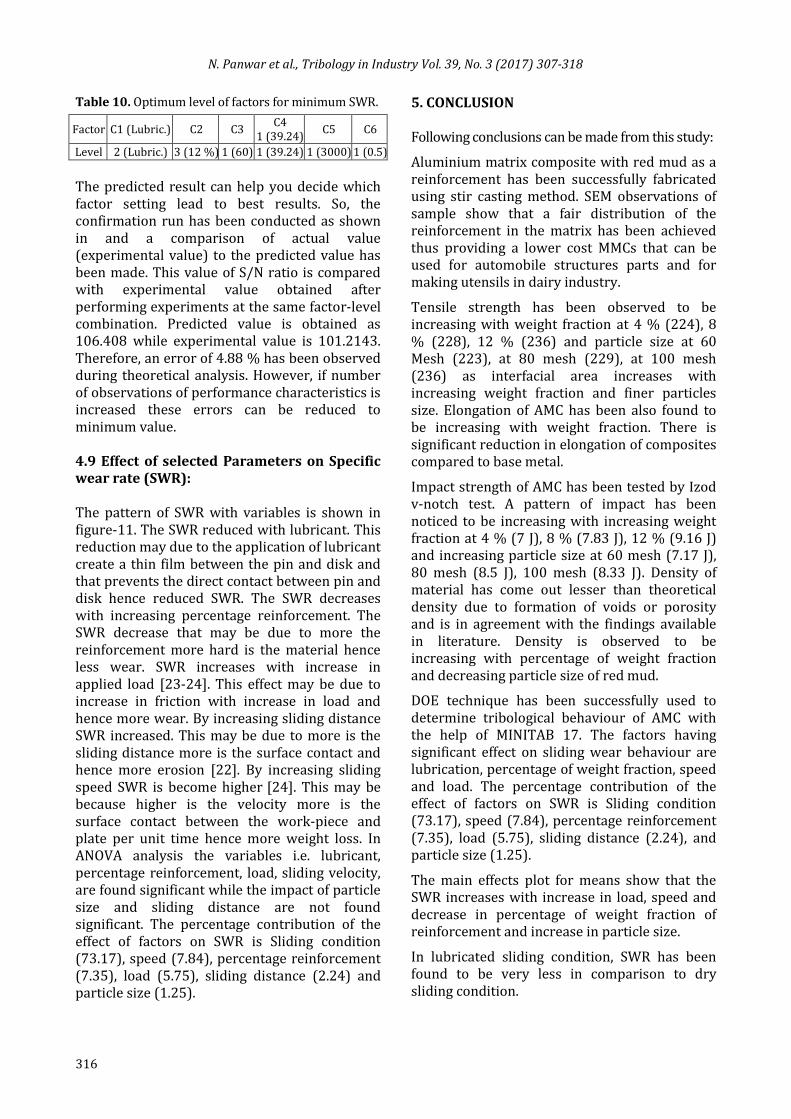
Fig. 9. SEM of the developed composite for different percentages of Red mud.
4.7 Morphological Analysis
Figure 10 (a) shows the SEM image of sample after dry sliding wear test. As it can be seen some particle or debris are adhered to the worn surface and it is a combined mild adhesive wear and abrasion wear mechanism. Deep abrasion grooves are clearly visible in dry wear conditions. Abrasion grooves are also present in lubricated wear as shown in Fig. 10 (b) but they are regular and smooth. Thus, wear mechanism in both conditions has been abrasion type. In case of dry wear, it has been severe while in case of lubricated wear mild wear has been observed. Two body abrasion wear has been the dominating abrasive wear since wear debris being continuously removed from sliding surface. There have been combination of two-body and three-body of abrasive wear as reinforcement particles are pulled out from the wear surface during sliding and trapped between sliding surfaces. During tangential sliding motion between hard and soft surfaces and under normal contact pressure conditions, hard particle or asperities penetrate into softer Al-surface and materials is removed from softer surface by combined effect of ‘micro-cracking’, ‘micro-ploughing’ and ‘micro-cutting’ [19,20]. There is less particle transfer to the pin surface in presence of lubrication [21].
a) After dry sliding operation
b) After lubricated sliding operation
Fig. 10. SEM developed composite.

N. Panwar et al., Tribology in Industry Vol. 39, No. 3 (2017) 307-318
315
4.8 Statistical Analysis OA with additional column of S/N ratio has been shown in Table 7. Table 7. L18 OA with columns of SWR and S/N ratio.
S.N. C1 C2 C3 C4 C5 C6 SWR S/N Ratio
1 1 4 60 39.24 3000 0.5 0.000301 70.42867
2 1 4 80 49.05 4000 1 0.001453 56.75469
3 1 4 100 58.86 5000 1.5 0.00389 48.20101
4 1 8 60 39.24 4000 1 0.000373 68.56582
5 1 8 80 49.05 5000 1.5 0.00228 52.8413
6 1 8 100 58.86 3000 0.5 0.000888 61.03174
7 1 12 60 49.05 3000 1.5 0.000311 70.14479
8 1 12 80 58.86 4000 0.5 0.000593 64.53891
9 1 12 100 39.24 5000 1 0.000562 65.00527
10 2 4 60 58.86 5000 1 0.000198 74.06669
11 2 4 80 39.24 3000 1.5 0.000075 82.49877
12 2 4 100 49.05 4000 0.5 0.000049 86.19608
13 2 8 60 49.05 5000 0.5 0.000018 94.89454
14 2 8 80 58.86 3000 1 3.45E-05 89.24362
15 2 8 100 39.24 4000 1.5 0.000079 82.04746
16 2 12 60 58.86 4000 1.5 0.000078 82.15811
17 2 12 80 39.24 5000 0.5 7.9E-06 102.0474
18 2 12 100 49.05 3000 1 0.000021 93.55561
The effect of control factor on SWR has been shown in Figs. 11 and 12. Figure 11 shows the main effects plot for means and Fig. 12 shows the main effect plots of S/N ratio. Main effect plot for data means is plotted using average values of response for each factor level. Relative magnitude of effect of factors can be determined by comparing the slopes of graph lines. ANOVA has been used to determine the significance of each factor and to evaluate percentage of contribution on total variation. Table 8 shows the analysis of variance for S/N ratios for the response function.
Fig. 11. Main effects plot for means.
Fig. 12. Main effects plots for S/N ratios.
Table 8. Analysis of Variance for S/N ratios.
Source DF Seq SS Adj SS Adj MS F P P (%)
C1 1 2918.38 2918.38 2918.38 182.39 0.000 73.17 C2 2 293.16 293.16 146.58 9.16 0.015 7.35 C3 2 48.90 48.90 24.45 1.53 0.291 1.22 C4 2 229.73 229.73 114.86 7.18 0.026 5.75 C5 2 89.50 89.50 44.75 2.80 0.139 2.24 C6 2 312.78 312.78 156.39 9.77 0.013 7.84
Residual Error
6 96.01 96.01 16.00
Total 17 3988.45
The p-value is used to find the statistically significant parameters. This analysis has been evaluated at significance level of α=0.05. If the p-value of a factor is less than or equal to α, factor is considered significant. The last column of Table 8 shows the percentage contribution (P%) of each factor indicating the influence on SWR. Table 9 shows the response values for S/N ratios. It provides rank for each factor in the order from having greatest effect to the least effect on the SWR. Table 9. Response table for S/N ratios.
Level C1 C2 C3 C4 C5 C6
1 61.95 69.69 76.71 78.43 77.82 79.86 2 87.41 74.77 74.65 75.73 73.38 74.53 3 79.58 72.67 69.87 72.84 69.65
Delta 25.47 9.88 4.04 8.56 4.97 10.21 Rank 1 3 6 4 5 2
It can be observed from Table 9 that highest effect on SWR is of sliding environment (dry and lubrication) and mesh size have least effect. By analysing these graphs, the optimal levels of each factor have been identified for minimum SWR and shown in Table 10. Predicted Taguchi Results (in MINITAB software) have been used to evaluate the values of S/N ratio at specified factor-level setting shown in Table 10.
N. Panwar et al., Tribology in Industry Vol. 39, No. 3 (2017) 307-318
316
Table 10. Optimum level of factors for minimum SWR.
Factor C1 (Lubric.) C2 C3 C4
1 (39.24) C5 C6
Level 2 (Lubric.) 3 (12 %) 1 (60) 1 (39.24) 1 (3000) 1 (0.5)
The predicted result can help you decide which factor setting lead to best results. So, the confirmation run has been conducted as shown in and a comparison of actual value (experimental value) to the predicted value has been made. This value of S/N ratio is compared with experimental value obtained after performing experiments at the same factor-level combination. Predicted value is obtained as 106.408 while experimental value is 101.2143. Therefore, an error of 4.88 % has been observed during theoretical analysis. However, if number of observations of performance characteristics is increased these errors can be reduced to minimum value. 4.9 Effect of selected Parameters on Specific wear rate (SWR): The pattern of SWR with variables is shown in figure-11. The SWR reduced with lubricant. This reduction may due to the application of lubricant create a thin film between the pin and disk and that prevents the direct contact between pin and disk hence reduced SWR. The SWR decreases with increasing percentage reinforcement. The SWR decrease that may be due to more the reinforcement more hard is the material hence less wear. SWR increases with increase in applied load [23-24]. This effect may be due to increase in friction with increase in load and hence more wear. By increasing sliding distance SWR increased. This may be due to more is the sliding distance more is the surface contact and hence more erosion [22]. By increasing sliding speed SWR is become higher [24]. This may be because higher is the velocity more is the surface contact between the work-piece and plate per unit time hence more weight loss. In ANOVA analysis the variables i.e. lubricant, percentage reinforcement, load, sliding velocity, are found significant while the impact of particle size and sliding distance are not found significant. The percentage contribution of the effect of factors on SWR is Sliding condition (73.17), speed (7.84), percentage reinforcement (7.35), load (5.75), sliding distance (2.24) and particle size (1.25).
5. CONCLUSION Following conclusions can be made from this study:
Aluminium matrix composite with red mud as a reinforcement has been successfully fabricated using stir casting method. SEM observations of sample show that a fair distribution of the reinforcement in the matrix has been achieved thus providing a lower cost MMCs that can be used for automobile structures parts and for making utensils in dairy industry.
Tensile strength has been observed to be increasing with weight fraction at 4 % (224), 8 % (228), 12 % (236) and particle size at 60 Mesh (223), at 80 mesh (229), at 100 mesh (236) as interfacial area increases with increasing weight fraction and finer particles size. Elongation of AMC has been also found to be increasing with weight fraction. There is significant reduction in elongation of composites compared to base metal.
Impact strength of AMC has been tested by Izod v-notch test. A pattern of impact has been noticed to be increasing with increasing weight fraction at 4 % (7 J), 8 % (7.83 J), 12 % (9.16 J) and increasing particle size at 60 mesh (7.17 J), 80 mesh (8.5 J), 100 mesh (8.33 J). Density of material has come out lesser than theoretical density due to formation of voids or porosity and is in agreement with the findings available in literature. Density is observed to be increasing with percentage of weight fraction and decreasing particle size of red mud.
DOE technique has been successfully used to determine tribological behaviour of AMC with the help of MINITAB 17. The factors having significant effect on sliding wear behaviour are lubrication, percentage of weight fraction, speed and load. The percentage contribution of the effect of factors on SWR is Sliding condition (73.17), speed (7.84), percentage reinforcement (7.35), load (5.75), sliding distance (2.24), and particle size (1.25).
The main effects plot for means show that the SWR increases with increase in load, speed and decrease in percentage of weight fraction of reinforcement and increase in particle size.
In lubricated sliding condition, SWR has been found to be very less in comparison to dry sliding condition.
N. Panwar et al., Tribology in Industry Vol. 39, No. 3 (2017) 307-318
317
Acknowledgement Authors are very much thankful to the Science and Engineering Research Board, New Delhi (India) for funding this research project through Fast Track Young Scientist Engineering Science Scheme vide their letter No. SB/FTP/ETA-148/2013, Dated: 31/10/2013. REFERENCES [1] J. Hashim, L. Looney and M.S.J. Hashmi, ‘Metal
matrix composites: production by the stir casting method’, Journal of Materials Processing Technology, vol. 92-93, pp. 1-7, 1999.
[2] M. Ramachandra and K. Radhakrishna, ‘Effect of reinforcement of flyash on sliding wear, slurry erosive wear and corrosive behavior of aluminium matrix composite’, Wear, vol. 262, pp. 1450–1462, 2007.
[3] S. Sawla and S. Das, ‘Combined effect of reinforcement and heat treatment on the two body abrasive wear of aluminum alloy and aluminum particle composites’, Wear, vol. 257, pp. 555-561, 2004.
[4] G.B.V. Kumar, C.S.P. Rao, N. Selvaraj and M.S. Bhagyashekar, ‘Studies on Al6061-SiC and Al 7075-Al2O3 Metal Matrix Composites’, Journal of Minerals and Materials Characterization and Engineering, vol. 9, pp. 43-55, 2010.
[5] N.R.P. Swamy, C.S. Ramesh and T. Chandrashekar, ‘Effect of Heat Treatment on Strength and Abrasive Wear Behaviour of Al6061–SiCp Composites’, Bull. Mater. Sci., vol. 33, pp. 49–54, 2010.
[6] S. Karabulut, H. Karakoç and R. Çıtak, ‘Influence of B4C particle reinforcement on mechanical and machining properties of Al6061/B4C composites’, Composites Part B, vol. 101, pp. 87-98, 2016.
[7] M.D. Bermudez, G. Martinez-Nicolas, F.J. Carrion, I. Martinez-Mateo, J.A. Rodriguez and E.J. Herrera, ‘Dry Lubricated wear resistance of mechanically-alloyed aluminium base sintered composites’, Wear, vol. 248, pp. 178–186, 2001.
[8] R. Liu, D.Y. Li and C. Tg, ‘Effects of yttrium and cerium additives in lubricants on corrosive wear of stainless steel 304 and Al alloy 6061’, Journal of materials science, vol. 35, pp. 633– 641, 2000.
[9] P. Iglesias, M.D. Bermúdez, F.J. Carrion and G. Mart, ‘Friction and wear of aluminium–steel contacts lubricated with ordered fluids-neutral
and ionic liquid crystals as oil additives’, Wear, vol. 256, pp. 386–392, 2004.
[10] J.C. Walker, W.M. Rainforth and H. Jones, ‘Lubricated sliding wear behaviour of aluminium alloy composites’, Wear, vol. 259, pp. 577–589, 2005.
[11] S. Mohammad, H. Ahmer and L.S. Jan, ‘The Wear of Aluminium in the Presence of Polytron Additive in the Helix Lubricant; A Quantitative Analysis’, Canadian Journal on Computing in Mathematics, Natural Sciences, Engineering and Medicine, vol. 4, pp. 287-290, 2013.
[12] S. Venkat Prasat and R. Subramanian, ‘Tribological properties of AlSi10Mg/fly ash/graphite hybrid metal matrix composites’, Industrial Lubrication and Tribology, vol. 65, pp. 399–408, 2013.
[13] Lubricating oils data sheet, Available at: https://www.iocl.com/downloads/lubes/Servo%20Super%20MG%20SERIES.pdf, accessed: 20.07.2016.
[14] W.H. Yang and Y.S. Tarng, ‘Design optimization of cutting parameters for turning operations based on the Taguchi method’, Journal of materials processing technology, vol. 84, pp. 122-129, 1998.
[15] M. Nalbant, H. Gokkaya and G. Sur, ‘Application of Taguchi method in the optimization of cutting parameters for surface roughness in turning’, Materials and design, vol. 28, pp. 1379-1385, 2007.
[16] Crystal Defects - linear defects (dislocations), available: https://www.nde-ed.org/EducationResources/CommunityCollege/Materials/Structure/linear_defects.htm, accessed: 15.08.2016.
[17] S. Zhang, X.Y. Cao, Y.M. Ma, Y.C. Ke, J.K. Zhang and F.S. Wang, ‘The effects of particle size and content on the thermal conductivity and mechanical properties of Al2O3/high density polyethylene (HDPE) composites’, express polymer letters, vol. 5, pp. 581-590, 2011.
[18] M. Kok, ‘Production and mechanical properties of Al2O3 particle-reinforced 2024 aluminium alloy composites’, Journal of Material Processing Technology’, vol. 161, pp. 381-387, 2005.
[19] K. Umanath, K. Palanikumar and S.T. Selvamani, ‘Analysis of dry sliding wear behaviour of Al 6061/SiC/Al2O3 hybrid metal matrix composites’, Composites: Part B, vol. 53, pp. 159-168, 2013.
[20] R.K. Upadhyay, ‘Microscopic technique to determine various wear modes of used engine oil’, Journal of microscopy and ultrastructure, vol. 1, pp. 111-114, 2013.

N. Panwar et al., Tribology in Industry Vol. 39, No. 3 (2017) 307-318
318
[21] S. Das and S.K. Biswas, ‘Boundary lubricated tribology of an aluminium–silicon alloy sliding against steel’, Tribology Letters, vol. 17, pp. 623-628, 2004.
[22] S. Suresha and B.K. Sridhara,’ Wear characteristics of hybrid aluminium matrix composites reinforced with graphite and silicon carbide particulates’ Composites Science and Technology, vol. 70, pp. 1652-1659, 2010.
[23] Y. Sahin, ‘The prediction of wear resistance model for the metal matrix composites’, Wear, vol. 258, pp. 1717-1722, 2005.
[24] O. Adem, ‘Mechanical and dry sliding wear properties of silicon carbide particulate reinforced aluminium–copper alloy matrix composites produced by direct squeeze casting method’, Journal of Alloys and Compounds, vol. 489, pp. 119-124, 2010.

![[Tech-lubrication]Lubrication Inst for BEVT S1501CII ... · Microsoft Word - [Tech-lubrication]Lubrication Inst for BEVT S1501CII_20130613R02.doc Author: EHickman Created Date: 11/7/2013](https://img.pdfslide.us/doc/110x75/5f063c3e7e708231d416f958/tech-lubricationlubrication-inst-for-bevt-s1501cii-microsoft-word-tech-lubricationlubrication.jpg)