Embed Size (px)
Citation preview

Proceedings of the 31st Annual Central Plains Irrigation Conference, Kearney, Nebraska, Feb. 26-27, 2019 Available from CPIA, 760 N. Thompson, Colby, Kansas
71
EFFECT OF LIMITED WATER SUPPLIES ON CENTER PIVOT PERFORMANCE
Derrel Martin and Derek Heeren Professor and Associate Professor,
Irrigation and Water Resources Engineers University of Nebraska-Lincoln
Lincoln, NE 402-472-1586 and (402) 472-8577
[email protected] and [email protected]
Steve Melvin and Troy Ingram Extension Educators
University of Nebraska-Lincoln Central City and St. Paul, Nebraska 308-946-3843 and 308-754-5422
[email protected] and [email protected]
ABSTRACT When appropriately designed and operated center pivot irrigation systems can efficiently irrigate many crops grown on diverse soil and terrain conditions. However, a significant number of pivots are not supplied with an adequate water to operate as envisioned. Inflow for the pivot could be inadequate for several reasons based on the capacity of an aquifer, mismatched system components, and/or the original design. Inadequate inflow causes major degradation of the uniformity of water application and the ability of the system to meet crop needs. We analyzed the performance of a center pivot for a sloping field. The performance was simulated for a range of inlet pressures when pressure regulators were used and for systems without pressure regulators. The operation of the pivot in unison with a pump/well system was simulated for water supplies that are adequate, i.e. consistent with original design. Conditions were also simulated for low supply conditions that occur because of decreasing inflow. Results show that regulators improve uniformity for high-flow conditions but do not improve the discharge uniformity when inlet pressures—and therefore system inflow—drop below design specifications. The variability of discharge at the distal end of the pivot is less for unregulated conditions than when regulators are used for limited inflows. More work is necessary to evaluate a wider range of slope and supply conditions, and to compute a whole-field uniformity. The field map could offer the opportunity to utilize speed control on the pivot to enhance uniformity with rotation around the field. Unified design procedures should also be explored for systems that experience such variations in water supply during the irrigation season.
INTRODUCTION Center pivot systems have been used extensively because of the ability to efficiently apply water for many different soil-crop-management conditions. However, the water supply capacity of aquifers and wells varies throughout the growing season for some locations across the Great Plains. Therefore, center pivots designed to operate efficiently when a full water supply is available may operate during extended portions of the growing season when the water supply is below design requirements. We don’t know how many systems face this problem, but the condition is widespread across the Great Plains and in other locations. The goal of this paper is to describe how pivot system performance is affected when forced to operate under varying supply conditions. Management strategies and system designs to best operate under varying inflows will be discussed.
Center-pivot irrigation systems utilize sprinkler devices to apply water based on the pressure available along the pivot lateral. The pressure at an outlet depends on the pressure at the inlet to the

72
pivot lateral, elevation across the field, the original design of sprinkler devices on the pivot and the friction loss along the pivot lateral. Some factors are static based on physical features of the field. Other factors are dynamic based on flow and pressure characteristics across the field and during the irrigation season. The irrigation system must interact with the pumping system. An example of a center pivot supplied by a groundwater well is illustrated in figure 1. The hydraulic components consists of the static water level—the distance from the soil surface to the water table when not pumping—plus the drawdown in the well due to aquifer and pumping characteristics. The static water level and the drawdown represent the lift required to bring water to the pump base. The elevation change from the pump discharge base to the inlet of the center pivot is static but contributes to the total head required for the irrigation system. The friction loss that occurs in the various components on the system is dynamic and depends on the original design and the flow of water. The system also requires pressure to discharge water in a uniform manner across the field. The pressure required for varying system flows encompass what is commonly referred to as the total dynamic head requirement of the irrigation system as illustrated in graph in figure 1.
Matching a pump to a center pivot system involves determining the flow where the head output from the pump equals the requirements for the irrigation system. This is shown in figure 1 where the pump curve intersects the total dynamic head for the system. This analysis focuses on the pressure requirements to operate the center pivot under different water supply conditions. Subtraction of the head requirements for all components except pressure from the pump output provides an estimate of the amount of pressure available to operate the center pivot for varying flow rates. The pressure available to the inlet to the center pivot irrigation system can be described expressed as:
i p w L LP = γ TDH - L - s - E - F (1)
where: Pi = the pressure available to the center pivot inlet, TDHp = the total dynamic head output from the pump, L = the static water level-lift, sw is the drawdown, EL is the elevation change from the pump base to the pivot inlet (could be positive or negative), and FL is the friction loss in the system components and γ is the specific weight of water equaling 0.433 psi/foot.
Some components in equation 1 vary with the flow through the system but may also vary during the irrigations season due to other factors. The depth of the saturated thickness of an aquifer measured in an observation well in southwest Nebraska is shown in Figure 2. The saturated thickness represents the depth of water in the aquifer and reflects the change in the static water level during the year. The saturated thickness is deepest in the spring prior to irrigation during the season and then the water level drops during the pumping season. The saturated thickness drops by 50% some seasons. These measurements were from an observation well that represents general conditions for a region not the level in an irrigation well, note that water is not pumped from and observation well. The drawdown in an irrigation well is larger when the saturated thickness is smaller. Thus, the pressure available to the inlet of the pivot varies through the growing season due to changing aquifer conditions. In some cases, the depth of water in a well may limit pump discharge as pumps might produce air in the flow stream if pumping capacity exceeds the well yield. Producers often control “pumping air” using throttling valves. Thus, declining water levels which may lead to throttling valves which increases the friction loss. These factors illustrate that the pressure available to supply the center pivot can vary throughout the growing season. The goal is to analyze the effect of varying pressure availability on the performance of center pivots.
Research by McDougall (2015) in Arkansas showed that the flow rate from irrigation wells often decreases during the irrigation season. He computed the percent decrease in well output during the

73
season for 28 wells (figure 3). The results show that the discharge from six of the twenty-eight wells decreased more than 30% during the season. The average decline was 19% for all wells. The decline in well discharge is also experienced in the Great Plains, but we do not have specific data such as from McDougall. The point is that many pivots face changing flow rates during the season. Since many pivots utilize pressure regulators, the pivot inflow cannot exceed the installed or design flow; thus, pivots must be operating well below conditions used in the initial design.
Figure 1. Illustration of the components of a center pivot field and their contribution to the total dynamic head requirement.

74
Figure 2. Depth of the saturated thickness of an observation well in southwest Nebraska.
Figure 3. Flow decrease of well systems during irrigation seasons in Arkansas (from McDougall, 2015).

75
PIVOT PERFORMANCE The flow rate required from sprinklers along a center pivot lateral must increase in a linear fashion to maintain uniformity. The linear increase is required because sprinklers located at the distal end of the pivot lateral irrigate a much larger area than a sprinkler at the midpoint of the lateral. The discharge required from a sprinkler can be expressed as:
ss
s
Q Sq RR
2
2 (2)
where; qs = the discharge required from a sprinkler located a distance R from the pivot inlet, Qs = the flow into the pivot lateral, Rs is the radius of the irrigated field and S = the distance between sprinklers along the lateral at location R. Uniformity requires the slope of the sprinkler discharge included in the parentheses in equation 2.
The actual discharge from sprinklers on a lateral depends on the pressure available to the sprinkler located at radial distance R, and the size of nozzle installed in the sprinkler at location R. The discharge from an individual sprinkler can be represented by:
s d nq C D P 2 (3)
where: Cd = the discharge coefficient for a model of sprinkler nozzle, Dn is the effective diameter of the nozzle in the sprinkler and P is the pressure available at the base of the sprinkler. Therefore, if the variation in pressure along the center pivot lateral is known, then the discharge from individual sprinklers can be estimated. The distribution of sprinkler discharge may not follow a linear pattern, and/or the linear slope may not follow the value required for uniformity. Variations in pressure along the pivot lateral that does not follow the pattern that occurs from design will degrade uniformity across the field. Tests are required to determine if the distribution of discharge from sprinklers remains linear—at the proper slope—as the pressure available in the pivot lateral decreases during the growing season. The analysis will focus on whether the slope of linear relationship is adequate to maintain the uniformity of the center pivot.
The performance of center pivot irrigation systems has been simulated with computer models many times. Originally, Bittinger and Longenbaugh (1962) described an overlapping procedure to determine how the water application pattern from successive sprinklers varied along the center pivot lateral. Beccard and Heermann (1981) built a very flexible simulation program to further simulate the effect of sprinkler characteristics, sprinkler spacing, computer movement and terrain on the uniformity of water application for a center pivot oriented in one direction in a field. Other such as James (1982), James (1984), James and Blair (1984), Heermann (1990), Bremond and Molle (1995), and Heermann and Spofford (1998) built on the original concept of Bittenger and Longenbaugh. Numerous other authors have built models and conducted simulation studies of center pivot analysis since these early studies. These approaches rely on a mathematical representation of the pattern of water application about individual sprinklers. These relationships depend on sprinklers operating in a pressure range specified by manufacturers for specific devices. The previous simulation approaches have primarily focused on simulation and testing of sprinkler packages in the design process. The application here requires analysis of an existing sprinkler package operated under conditions different than intended in design.
76
Heermann (2006) performed an analysis of the impact of lowering water tables on the performance of center pivots considering the interaction of the pumping system. He included limited analysis of the impact of pressure regulators on the water distribution and the increase in operating cost due to pressure loss in the regulators. The analysis by Heermann illustrated how irrigators should modify systems as the water table declines over time; however, the analysis did not consider ramifications to variations during the irrigation season. The analysis conducted here used a spreadsheet model to compute the sprinkler discharge and pressure variation along a center pivot lateral for varying pressure/inflow conditions for several field slopes. The sprinkler package on the pivot was designed to produce the required sprinkler discharge, for the steepest upslope in the field, when the water supply to the pivot was higher in the spring. This is how many systems are currently operated in the Great Plains. The performance for other slopes and inflow pressure conditions was compared to the design conditions at high flows. Altering the inflow pressure—and thus the pivot inflow—changes the pressure and sprinkler discharge distribution along the lateral. The effects of changed operating conditions on uniformity was evaluated by comparing the flow from each sprinkler to the flow for the respective sprinkler when operated as originally designed. If the ratio of sprinkler discharge for the altered inflow to the design requirement is constant along the lateral, then the application uniformity will be the like the original design—even though the depth of water applied will change. If the ratio of discharge is not consistent along the lateral, the uniformity will deviate from that attained through the initial design. The uniformity estimated by Bittinger and Longenbaugh and others requires analysis of the changes in water distribution about individual sprinklers using an overlapping procedure like that in the CPED computer program by Heermann (2006). Analysis would require description of the distribution characteristics of sprinkler devices over a wide range of pressures not anticipated by manufactures. Thus, additional data would be necessary to describe the performance of sprinkler devices operated outside the range they were intended.
It is common for the flow rate from wells to be largest in the spring when the systems are first used. The supply capacity and available pressure may decrease during the growing season leading to smaller water application depths and a reduction in the uniformity of application within the field. The variation in pressure and sprinkler discharge as a function of available pressure to the inlet of the pivot, slope of land in the field, and the impact of pressure regulators on uniformity will be analyzed. Results will illustrate the change in the uniformity and highlight the expected changes in the water supply for the pivot.
The analysis will include an evaluation of the impact of pressure regulators on the operation of the sprinklers on the center pivot. Some experts have noted that pressure regulators may not be advantageous when the amount of pressure available to the pivot decreases during the growing season and therefore the flow decreases. The effect of the pressure regulators on the distribution of water for fields that have mild slopes and for level fields will be evaluated.
PIVOT DESIGN A generic center pivot irrigation system was selected for analysis where the inflow and pressure vary significantly throughout the growing season. For these conditions, it is essential to select sprinkler devices that are operable over a wide range of pressures. It is also likely that the pressure along the system could drop quite low during the latter part of the summer; therefore, the spacing of devices along the lateral should be rather small to maintain local uniformity. Thus, if the throw pattern from the device is negatively affected by pressure drops below design conditions the overlap between closely space devices should provide a more acceptable local uniformity. Sprayhead can operate over a wide pressure range as shown in figure 4; therefore, sprayheads were chosen for the center pivot

77
sprinkler package. To maintain reasonable uniformity at low pressures the sprayheads were spaced 7.5 feet apart along the lateral.
The center pivot was designed for a field that has a general slope of either 1% or 2% across the field. This provides a portion of the field to evaluate the performance when the pivot lateral is generally level. The sprinkler package—including nozzle sizes for each outlet—for the basic design was based upon the water supply conditions at the start of the irrigation season for an inflow of 800 gallons per minute. The nozzles sizes for the sprinkler package was determined when the pivot lateral was positioned along the upslope portion of the field. Therefore, the sprinkler package was designed assuming that the pivot lateral ran directly uphill. That orientation will provide the least pressure available at the far end of the pivot lateral and would be the critical location for selection of sprinkler devices and the estimation of available pressure.
As the center pivot rotates through other angles of the field the pressure at a point in the pipeline will increase reaching the maximum when the pivot lateral points directly downhill. When pressure regulators are utilized to enhance uniformity, the devices are normally selected for the upslope orientation of the pivot as described. Since that orientation would provide the lowest pressure at the distal end of the lateral, all other areas of the field will experience higher pressures but constant flow when regulators are used. If the inflow pressure drops below that required for the high flows, then portions of the field will experience reductions in sprinkler discharge. The impact of pressure regulators for such conditions is uncertain.
Figure 4. Performance characteristics of a sprayhead sprinkler (source: https://www.senninger.com/sites/senninger.hunterindustries.com/files/ldn_up3_brochure.pdf)

78
We selected 20-psi pressure regulators for the design at 800 gallons/minute (gpm) at the start of the irrigation season. Devices were installed on a 1300-ft center-pivot lateral of 6 ⅝ inch galvanized steel tubing. Sprinkler were spaced 7.5 feet apart along the lateral. The design pressure at the distal end of the pivot lateral when sloping uphill was set to 5 psi above the pressure for the regulated system. Therefore, pressure at the distal end of the pivot lateral when oriented uphill was 25 psi. If regulators are not used the center pivot was also designed to provide the required flow rate in the uphill position. Since regulators were not utilized, the pressure at other angles of rotation would experience higher pressures and larger sprinkler discharges than required for uniformity based on equation 2. The Hazen-Williams equation was used to calculate friction loss within the pivot lateral. A resistance coefficient was set to 140. The inside diameter of the lateral pipe was 6.407 inches. The pressure distribution for various orientations was computed by starting at the distal end of the pivot and computing the discharge from each sprinkler adding the discharge and calculating the friction loss incrementally from the distal end to the pivot inlet. This provides a relationship between the pressure at the distal end of the pivot lateral and the inflow to the center pivot. The hydraulic distribution along the pivot lateral was computed when the pivot was sloping uphill, downhill and on flat portions of the field.
PRESSURE REGULATOR We modeled the operation of pressure regulators as illustrated in figure 5. Most pressure regulators have a recommended maximum and minimum flow rate. The flow variation causes variation in the outlet for the same inlet pressure. The pressure variation about the midrange outlet pressure was approximately ±5% of the rated pressure. Once the inlet pressure reaches the rating of the regulator, the regulator closes to maintain a relatively flat pressure as illustrated in figure 5. The heavy-dark line in figure 5 represents a median flow midway between the outlet pressure at the minimum and maximum rated flows for the regulator. We described the variation about the midpoint flow using a flow coefficient once the pressure exceeded the rated pressure. For example, if the regulator was rated at 50 psi the variation in pressure depending on flow rate with estimated to be 5 psi. We developed the following equation:
22 2hi lo
reg c
2 2
O
c c
c L
mreg
Q - Q QF = P =
0.1 × P F
Q QP = P +
F F
thus
-
(4)
where; Fc is the flow coefficient for a specific pressure rating, Qhi and Qlo are the maximum and minimum flow rate for the regulator, Preg is the rated pressure of the regulator, PL is the pressure loss through the regulator for other flow rates, Qm is the median flow that corresponds to the rated pressure for the regulator and PO is the outlet pressure from the regulator.
Friction loss also occurs within the regulator when the inlet pressure is below the rated pressure for the regulator. Laboratory research indicated that the slope of the relationship between the outlet pressure and the inlet pressure was approximately 0.91 for the rising limb of the regulator performance curve. The heavy line on the rising segment represents the midrange flow. Therefore, an inlet pressure of 55 psi results would provide an outlet pressure of 50 psi for the midrange flow.

79
The vertex of the sloping segment for a specific flow occurs at the inlet pressure equal to 0.91×Preg and an outlet computed in equation 4 for that flow rate. The outlet pressure for inlet pressures below the vertex value follows the slope of the line from the origin through the vertex. The results in figure 5 illustrate that the range of pressures for 25-psi regulators is half of that for a 50-psi regulator. This closely matches information available from suppliers and was consistent with descriptions by Rogers et al. (2010) and von Bernuth and Baird (1984). It also is representative of laboratory investigations we conducted. It's been well documented that pressure regulators maintain a hysteresis effect which gives a range of pressures even for constant flows. Given this characteristic this description of regulator performance seems adequate for simulating varying inflow and inlet pressures.
SIMULATION RESULTS Simulations were conducted for varying inflow pressures for laterals running up and down slopes of 1% and for level fields. Pivots with and without regulators along the lateral were considered. Variation of the inflow pressure changes the pressure and sprinkler discharge distributions along the lateral. The sum of discharge for all sprinklers equals the inflow to the pivot. The uniformity and effectiveness of water applications can be addressed using the ratio of the sprinkler discharge for a selected inlet pressure relative to the discharge from the same sprinkler from design conditions. The value of the ratio indicates the overall change in application depth per irrigation, while the distribution of the ratio along the lateral demonstrates how the uniformity of application varies relative to design conditions.
Results for pivots without pressure regulators when the lateral was positioned along a 1% upslope from the pivot inlet are presented in figure 6. The distribution of pressure in the lateral from the inlet to the distal end of the pivot is illustrated at the top of figure 6. The shape of the pressure pattern along the lateral is similar for all inlet pressures—shifted down and a smaller pressure range from
Figure 5. Performance model for pressure regulators.
80
the inlet to the distal end for smaller inlet pressures. The difference in pressure from the lateral inlet to the distal end of the lateral is larger for higher inlet pressures than for lower inlet pressures because higher pressures result in more sprinkler discharge when regulators are not used. This is expected because the friction loss is larger in the lateral. The pressure is always largest at the inlet and the pressure decreases to approximately 34 psi for the highest inlet pressure and 10 psi for the lowest inlet pressure. The second line down in the graph represents the design condition where the pressure was adequate at the distal end of the lateral to provide 25 psi in the lateral. The discharge from individual sprinklers along the lateral are illustrated in the middle of figure 6. The design condition is where the pressure was adequate to provide a linear distribution of sprinkler discharge along the lateral. The stairstep discharge pattern occurs because finite nozzle sizes are available; thus, the same nozzle size is used for a small group of sprinklers and then the next larger nozzle is used for the next downstream group of sprinklers. Therefore, the discharge is relatively constant over a small group of sprinklers and then increases for the subsequent group of sprinklers. Since the discharge pattern is nearly linear, applications will be uniform along the lateral. The flow rate from individual devices obviously is larger for higher inlet pressures and smaller for lower inlet pressures for unregulated systems. Higher pressures produced nearly linear relationships with distance along the lateral; however, the conditions for lower pressures indicates that the distribution becomes somewhat curvilinear. The ratio of sprinkler discharge to the design discharge is included at the bottom of figure 6. The results illustrate that the average depth of application decreases as the inlet pressure drops as expected, but the depth is reasonably uniform for most inlet pressures. The ratio does decline near the end of the lateral for the lower pressures. This is important as much of the irrigated field is affected by the outer spans of the pivot.
Results for the level portion of the field are presented in figure 7. The sprinkler package design for the upslope condition was used for the level field, i.e. the pivot just rotated to the level portion of the field. The pressure distribution along the lateral produces a very linear sprinkler discharge distribution for all inlet pressures; therefore, the discharge ratios are very uniform and the average depth of application declines with overall system inflow. Obviously, regulators are not needed for flat fields, but the results show that a sprinkler package designed for uphill orientations performs very well for flat areas of the field.
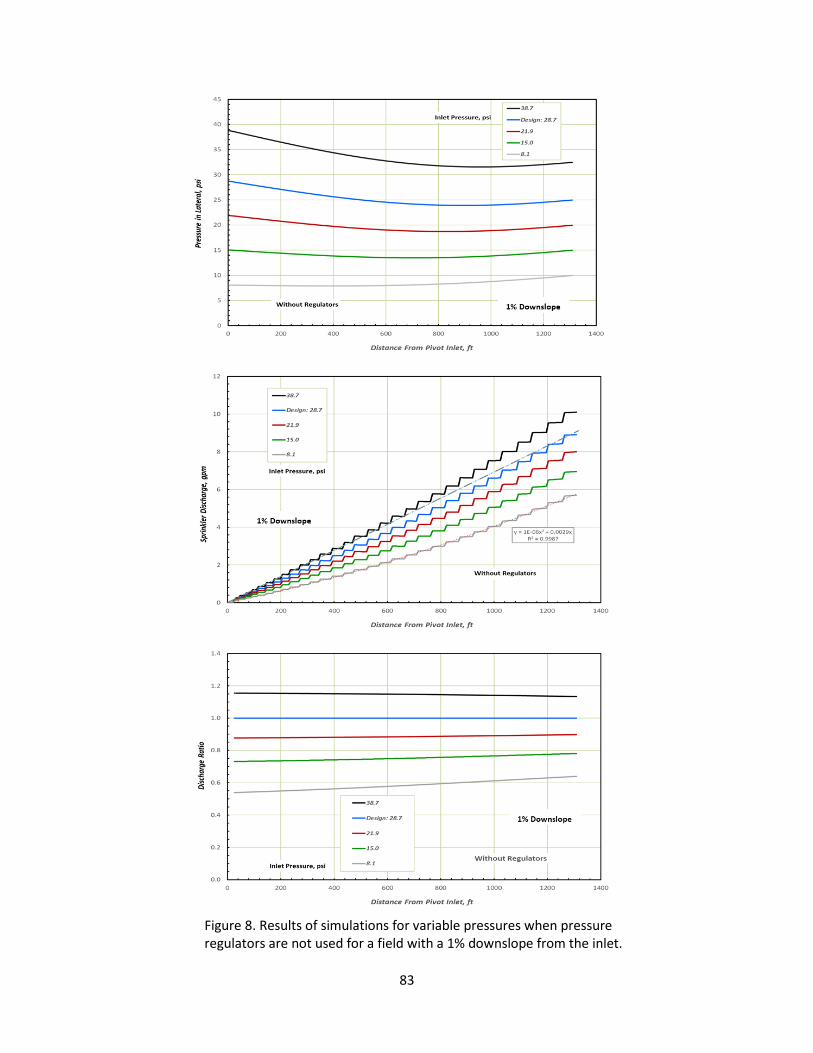
The results when the pivot lateral rotates to the 1% downslope position are included in figure 8. Higher inflow pressures produce pressure distributions that result is reasonably uniform sprinkler discharge distributions and uniform discharge ratios. For lower pressures the friction loss in the lateral is smaller for the reduced system flow and the downslope produces more pressure gain that lost due to friction. Thus, the pressure distribution gives a discharge ratio trend that increases toward the distal end of the pivot lateral.
Results for the unregulated pivot show that the uniformity along the pivot lateral is reasonably good for all orientations of the pivot lateral when inlet pressures and pivot inflow capacities decrease from the design conditions. The primary impact is that the overall depth of application decreases requiring longer or more frequent irrigation, if possible, to meet the crop needs compared to early in the season.

81
Figure 6. Results of simulations for variable pressures when pressure regulators are not used for a field with a 1% upslope from the inlet.

82
Figure 7. Results of simulations for variable pressures when pressure regulators are not used for a level field.
83
Figure 8. Results of simulations for variable pressures when pressure regulators are not used for a field with a 1% downslope from the inlet.
84
Results for the same orientations of the lateral are illustrated in figure 9 when a 20-psi pressure regulator was utilized on the center pivot. The pressure distribution along the lateral is like the distribution when regulators were not utilized. Expectedly, sprinkler discharge equals design values when the inlet pressure exceeds that for design. However, the discharge pattern in the middle of the figure is more curvilinear when the inlet pressure drops below the design pressure than for the unregulated system. The discharge ratio for any portion of lateral where pressure exceeds the 20-psi rated pressure for the regulator will discharge the design flow and the discharge ratio will equal design values. When the pressure drops below the regulator rating the sprinkler is not experiencing as much pressure as required for the design and the discharge ratio decreases. The impact of reduced depth with the regulated systems occurs at the distal end of the pivot—which represents a large portion of the upslope area. The discharge ratio for smaller inflow pressures that may occur due to decreasing well capacity late in the irrigation season are less uniform for the upslope orientation that when regulators were not used.
Results for the level field with 20-psi regulators are illustrated in figure 10. The sprinkler discharge is quite linear except for the lower inlet pressures. Low inlet pressures produce a curvilinear depth of application that falls below that required for uniform application and the outer portion of the field will be under irrigated. Regulators do not provide better uniformity along the lateral than unregulated system, but the depth of application does match the design goal. Thus, the overall field uniformity would improve for higher inflow pressures. The uniformity along the lateral is poorer with regulation that for unregulated systems when the inflow pressure is below design values.
Results for the 1% downslope orientation with 20-psi pressure regulators are illustrated in figure 11. The 20-psi pressure regulators were selected thus locations along the lateral that exceed regulated pressures will produce discharges equal to the design value for the sprinkler package derived for the upslope orientation. The discharge ratio for low inlet pressures is slightly curvilinear, but the uniformity is reasonably good. The uniformity is not materially better with regulators than without for low inlet pressures. Regulators do throttle discharge when the pressures in the lateral exceed the regulated pressure which consumes some energy but does contribute to field uniformity rather than just lateral uniformity.

85
Figure 9. Results of simulations for variable pressures when pressure regulators are used for a field with a 1% upslope from the inlet.

86
Figure 10. Results of simulations for variable pressures when pressure regulators are used for a level field.

87
Figure 11. Results of simulations for variable pressures when pressure regulators are used for a field with a 1% downslope from the inlet.
88
COMBINING WITH PUMP CURVE The previous results illustrated how laterals perform with different inlet pressures and therefore changing system inflow. It is critical to consider the interaction of the pump with the center pivot to assess the impact of changing water supply conditions. A pump curve for a vertical turbine pump was used to evaluate the effect of varying water supply conditions. The pressure available to the pivot inlet depends on the interaction of the pump performance curve and the system required total dynamic head as illustrated in figure 1. Two water supply conditions were considered as depicted in figure 12. The upper pump curve is labeled high flow which represents water supply conditions early in the irrigation season. The pump cure in figure 12 represents the available inlet pressure from the pump after discounting the factors listed in equation 1. The low-flow pump curve represents the available inlet pressure when supply conditions have decreased later in the irrigation season—when the regional water table drops and due to throttling inflow may have occurred. The top graph in the figure provides operating points for nine rotation angles around the field in 22.5⁰ intervals when 20-psi regulators were utilized. The zero angle was aligned along the flat portion of the field. The total system flow rates are essentially equal at about 800 gpm for the high-flow case for all lateral orientations and the inlet pressure is approximately 40 psi for all lateral orientations. The system curve for regulated pivots becomes vertical once the flow rate reaches the design inflow rate for the pivot. Increasing pressure will not increase system flow once all sprinklers have reached the rated pressure of the regulator. Thus, the excess pressure is essentially wasted. Designers may desire some excess pressure to ensure uniformity; therefore, the pump-system match points are essentially the same for all lateral orientations for the high-flow supply condition.
There is considerable variation for the low-flow supply conditions when regulators are utilized as shown in the upper graph in figure 12. The least discharge occurs when the lateral is oriented upslope and most flow occurs when for the downslope rotation. For this pump and system, the inflow varies by about 50 gallons per minute between the upslope and downslope orientations. The variation is about 10% of the average inflow for the low-flow supply condition. This illustrates that the quantity of water that can be pump produce must be consider for the whole-field uniformity.
The system flow during the low-flow period is approximately 62% of the flow during the high-flow period. This represents a 38% reduction of flow which is similar to the largest reduction from McDougall. Thus, the average depth of application will be less that expected during high-flow periods. The change in flow must be included into the system operation and a new percent timer relationship should be developed. The low-flow system should operate longer to provide the depth expected during high-flow periods.
The lower graph in figure 12 presents the operating points for unregulated pivots. The variation for high-flow conditions is about the same as for low-flow conditions. The variation between upslope and downslope system flows is about 6% for high-flow conditions and 10% for low-flow conditions. The system flows are higher for the unregulated configuration and for regulated pivots during high-flow periods. The system flows are slightly higher for regulated pivots for the low-flow conditions.

89
Figure 12. Flow conditions and operating points for high and low flow supply conditions for three lateral orientations for center pivot systems with and without pressure regulators.
90
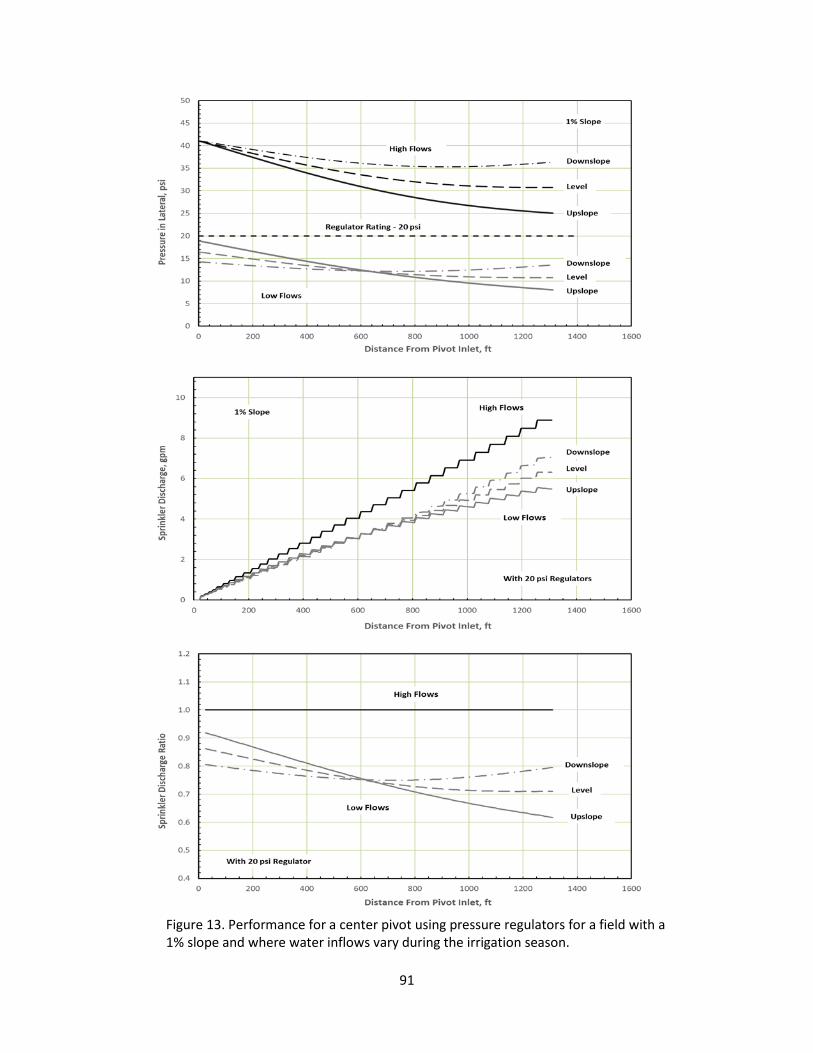
The distribution of pressure, discharge and discharge ratio when considering pump interactions are presented in figure 13 for systems using regulators. These results stem from the operating points for the regulated system shown in figure 12. The pressure along the lateral is well above the regulator rating for all lateral orientations for the high-flow supply condition. Therefore, the sprinkler discharge is linear, and the discharge ratio matches the design goal throughout the field. The system works as designed. When the supply capacity drops below the design value the pressure in the lateral is below the regulated pressure for all lateral orientations for the low-flow supply conditions. The discharge distribution is most linear for the downslope condition and thus the discharge ratio is more uniform when the lateral is oriented downhill. The discharge ratio decreases from about 90% near the inlet to about 60% near the distal end when oriented upslope. There is a 20% variation in discharge ratio at the distal end of the lateral between the downslope and upslope orientation.
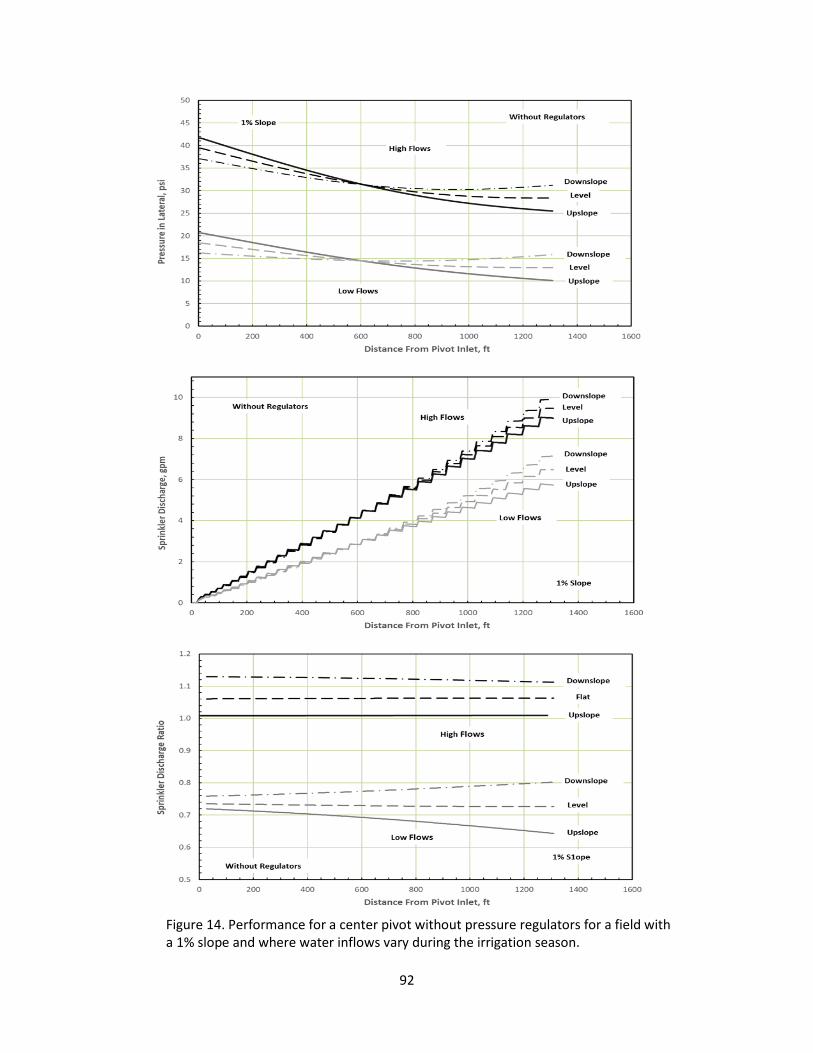
The results for the pressure, discharge and discharge ratio for the unregulated pivot are presented in figure 14. The pressure distributions for all orientations produces nearly linear discharge patterns and uniform discharge ratios for the high-flow orientation. The depth of application for the downslope orientation appears to exceed the upslope—i.e., the design ratio—by about 13% for the high-flow conditions. The discharge patterns are somewhat curvilinear for the low-flow conditions producing discharge ratios that are less uniform. The discharge ratio for the level and downslope orientations are more uniform that the upslope pattern where the discharge ratio varies from about 7% along the lateral for the upslope orientation. The variation of the discharge ratio is much less for the unregulated system than the regulated system for low-flow conditions, especially for the upslope orientation. The variation of depth at the distal end of the lateral varies by about 15% for the unregulated system and low-flow conditions.
The sprinkler discharge ratios for the regulated and unregulated pivot are summarized for the low-flow supply condition in figure 15. Ratios vary less along the pivot lateral for unregulated pivot than for regulated pivots and the variation is less at the distal end of the lateral is less for the unregulated pivot than when regulated.
A summary of the simulation results for the 1% field is presented in table 1. These results summarize the performance for the range of conditions simulated. Major changes occur for either the regulated or unregulated pivot when the inflow capacity decreases during the irrigation season. The uniformity changes and perhaps most importantly the system inflow changes considerably requiring adjustments to irrigation scheduling procedures.
91
Figure 13. Performance for a center pivot using pressure regulators for a field with a 1% slope and where water inflows vary during the irrigation season.
92
Figure 14. Performance for a center pivot without pressure regulators for a field with a 1% slope and where water inflows vary during the irrigation season.

93
Table 1. Simulation results for 1% slope conditions.
With Regulators
High Flow Conditions Low Flow Conditions
Upslope Level Downslope Upslope Level Downslope
Flow, gpm 795 795 795 557 583 609
Inlet Pressure, psi 41.0 41.0 41.0 18.8 16.4 14.2
Without Regulators
High Flow Conditions Low Flow Conditions
Upslope Level Downslope Upslope Level Downslope
Flow, gpm 802 819 833 536 561 585
Inlet Pressure, psi 41.7 39.4 37.0 20.7 18.4 16.2
Figure 15. Comparison of the sprinkler discharge ratio for low-flow conditions for regulated and unregulated pivot on a field with a slope of 1%.
94
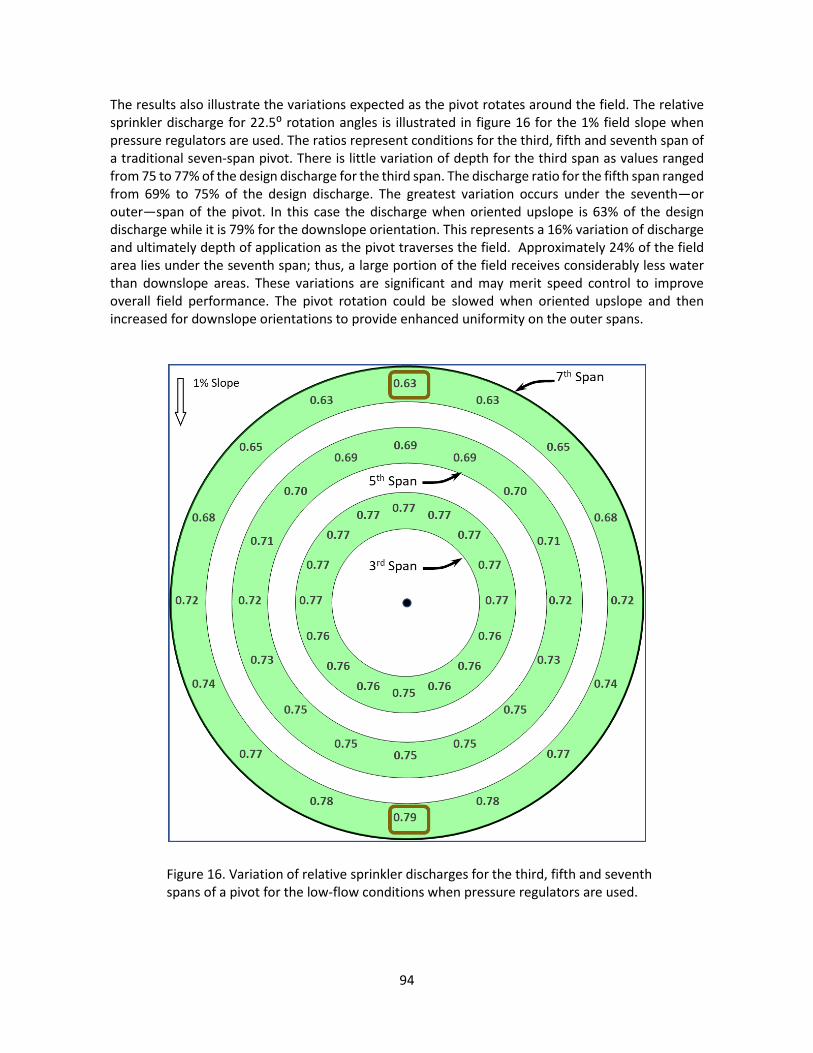
The results also illustrate the variations expected as the pivot rotates around the field. The relative sprinkler discharge for 22.5⁰ rotation angles is illustrated in figure 16 for the 1% field slope when pressure regulators are used. The ratios represent conditions for the third, fifth and seventh span of a traditional seven-span pivot. There is little variation of depth for the third span as values ranged from 75 to 77% of the design discharge for the third span. The discharge ratio for the fifth span ranged from 69% to 75% of the design discharge. The greatest variation occurs under the seventh—or outer—span of the pivot. In this case the discharge when oriented upslope is 63% of the design discharge while it is 79% for the downslope orientation. This represents a 16% variation of discharge and ultimately depth of application as the pivot traverses the field. Approximately 24% of the field area lies under the seventh span; thus, a large portion of the field receives considerably less water than downslope areas. These variations are significant and may merit speed control to improve overall field performance. The pivot rotation could be slowed when oriented upslope and then increased for downslope orientations to provide enhanced uniformity on the outer spans.
Figure 16. Variation of relative sprinkler discharges for the third, fifth and seventh spans of a pivot for the low-flow conditions when pressure regulators are used.
95
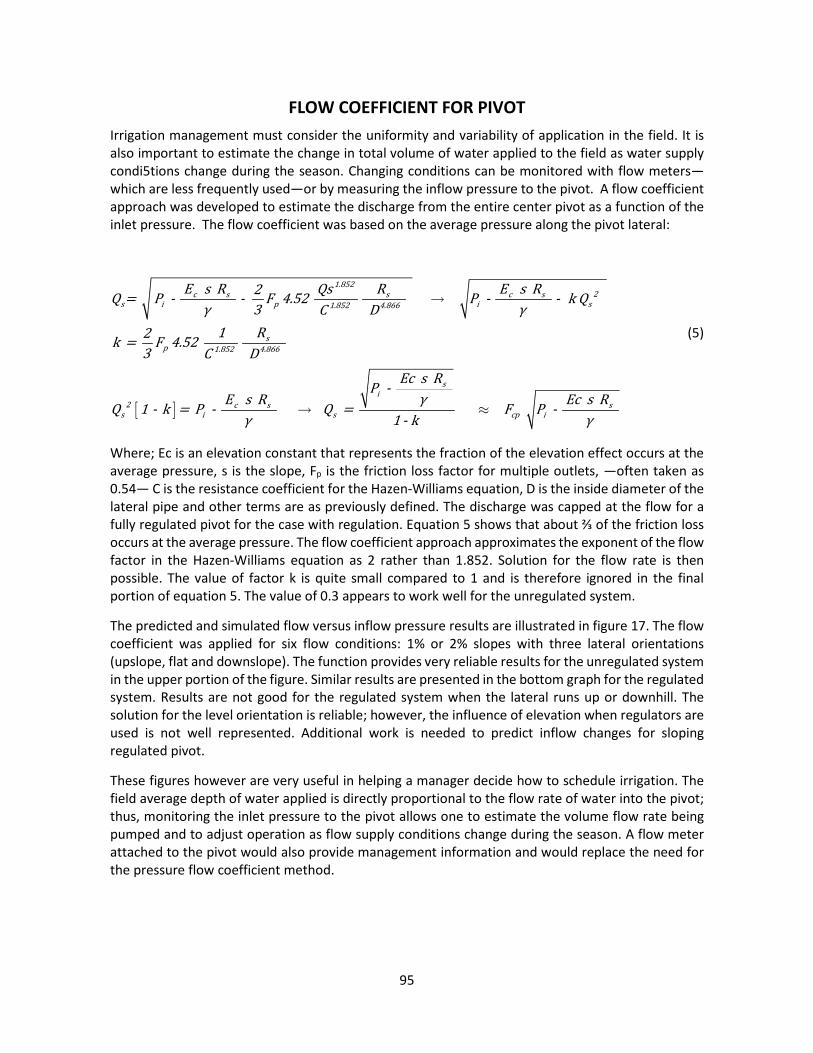
FLOW COEFFICIENT FOR PIVOT Irrigation management must consider the uniformity and variability of application in the field. It is also important to estimate the change in total volume of water applied to the field as water supply condi5tions change during the season. Changing conditions can be monitored with flow meters—which are less frequently used—or by measuring the inflow pressure to the pivot. A flow coefficient approach was developed to estimate the discharge from the entire center pivot as a function of the inlet pressure. The flow coefficient was based on the average pressure along the pivot lateral:
1.8522c s s c s
s i p i s1.852 4.866
sp 1.852 4.866
si
2 c s ss i s cp i
E s R Qs R E s R2Q = P - - F 4.52 P - - k Qγ 3 γC D1 R2k = F 4.52
3 C DEc s RP -
γE s R Ec s RQ 1 - k = P - Q = F P -γ 1 - k γ
(5)
Where; Ec is an elevation constant that represents the fraction of the elevation effect occurs at the average pressure, s is the slope, Fp is the friction loss factor for multiple outlets, —often taken as 0.54— C is the resistance coefficient for the Hazen-Williams equation, D is the inside diameter of the lateral pipe and other terms are as previously defined. The discharge was capped at the flow for a fully regulated pivot for the case with regulation. Equation 5 shows that about ⅔ of the friction loss occurs at the average pressure. The flow coefficient approach approximates the exponent of the flow factor in the Hazen-Williams equation as 2 rather than 1.852. Solution for the flow rate is then possible. The value of factor k is quite small compared to 1 and is therefore ignored in the final portion of equation 5. The value of 0.3 appears to work well for the unregulated system.
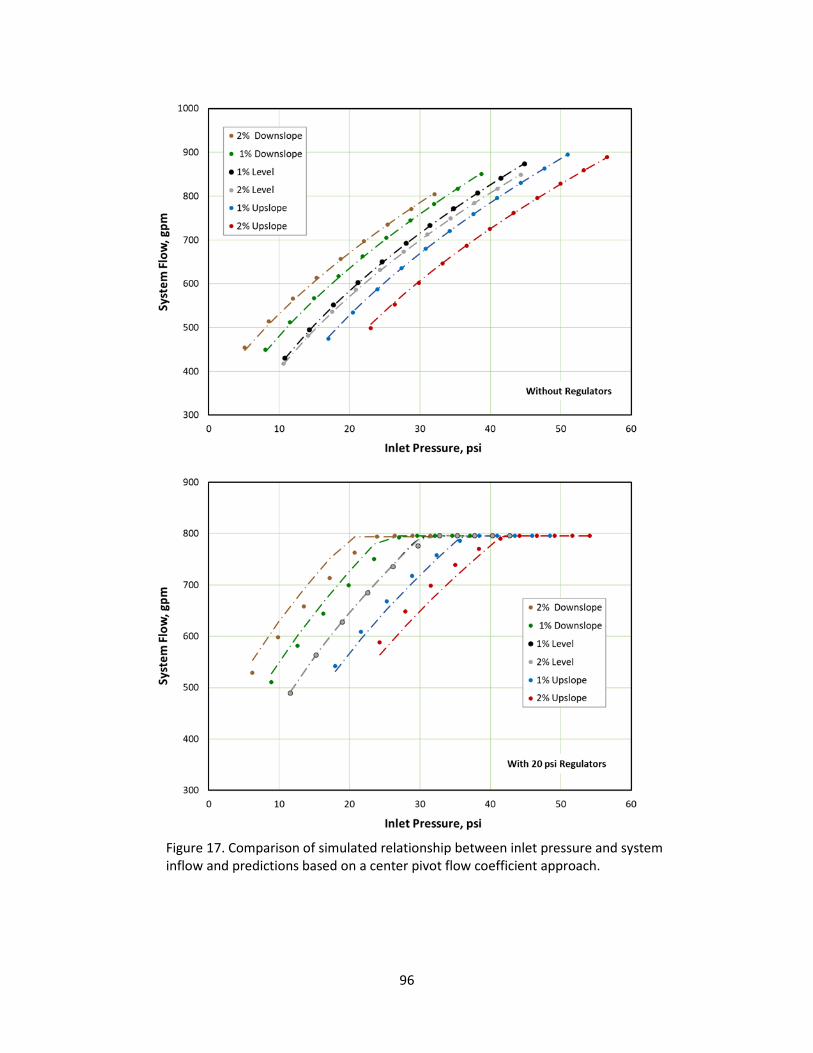
The predicted and simulated flow versus inflow pressure results are illustrated in figure 17. The flow coefficient was applied for six flow conditions: 1% or 2% slopes with three lateral orientations (upslope, flat and downslope). The function provides very reliable results for the unregulated system in the upper portion of the figure. Similar results are presented in the bottom graph for the regulated system. Results are not good for the regulated system when the lateral runs up or downhill. The solution for the level orientation is reliable; however, the influence of elevation when regulators are used is not well represented. Additional work is needed to predict inflow changes for sloping regulated pivot.
These figures however are very useful in helping a manager decide how to schedule irrigation. The field average depth of water applied is directly proportional to the flow rate of water into the pivot; thus, monitoring the inlet pressure to the pivot allows one to estimate the volume flow rate being pumped and to adjust operation as flow supply conditions change during the season. A flow meter attached to the pivot would also provide management information and would replace the need for the pressure flow coefficient method.
96
Figure 17. Comparison of simulated relationship between inlet pressure and system inflow and predictions based on a center pivot flow coefficient approach.

97
SUMMARY Simulation results for center pivots that experience changes in available water supply and therefore changing inflows and inlet pressures was simulated for a traditional center pivot. Results show that the uniformity of application varies considerably when inflows are smaller that the original design specifications. Pressure regulators improve whole-field uniformity on sloping fields when the inflow is at or above the design inflow; however, it appears that the field uniformity may be better without regulators when the flow is well below design values. The manager should explore ways to mitigate the impact of diminishing water supplied. In some cases, it may be possible to increase flow by increasing pump speeds. When it is not possible to increase flows renozzling could be considered for the low-flow supply. It may also be possible to vary the rotation speed of the pivot to enhance field-uniformity for sloping or undulating fields.
REFERENCES Beccard, R.W. and D.F. Heermann. 1981. Performance of pumping plant-center pivot sprinkler
irrigation systems. ASAE Paper 81-2548, St. Joseph MI.
Bremond, B. and B. Molle. 1995. Characterization of rainfall under center pivot: influence of measuring procedure. Journal of Irrigation and Drainage Engineering, ASCE, Vol. 121(5):347-353.
Heermann, D. F. 1990. Center pivot Design and Evaluation. Proceedings of the Third National Irrigation Symposium (ASAE), Oct. 28-Nov. 1. Phoenix, AZ.
Heermann, D. F. 2006. The Effect of Dropping Water Tables on Center Pivot Performance. The 27th Annual International Irrigation Show.
Heermann, D. F. CENTER PIVOT EVALUATION AND DESIGN. 2005. In Proceedings for 2005 Central Plains Irrigation Conference, Sterling, Colorado, Feb 16-17 (p. 137).
Heermann, D.F. and T.L. Spofford. 1998. Evaluating center pivot irrigation systems. ASAE Paper 98-2068. St. Joseph, MI.
James, L.G. 1982. Modeling the performance of center pivot irrigation systems operating on variable topography. Trans. of the ASAE 25(1):143-149.
James, L.G. 1984. Effects of pump selection and terrain of center pivot performance. Trans. of ASAE 27(1):64-68,72.
James, L.G. and S.K. Blair. 1984. Performance of low-pressure center pivot systems. Trans. of the ASAE 27(6):1753-1757, 1762.
McDougall, W.M. 2015. A Pump Monitoring Approach to Irrigation Pumping Plant Performance Testing. M.S. Thesis. University of Arkansas. Fayetteville, Arkansas.
Rogers, D.R, L. K. Shaw, S. R. Pragada, and M. Alam. 2010. Evaluation of Pressure Regulators from Center Pivot Nozzle Packages. Proceedings of the 22nd Annual Central Plains Irrigation Conference, Kearney, NE., February 24-25, 2010 Available from CPIA, 760 N. Thompson, Colby, Kansas.
Von Bernuth, R D. and D. Baird. 1990. Characterizing Pressure Regulator Performance. Transactions of the ASAE Vol. 33 (1): 0145-0150.