Embed Size (px)
Citation preview
PAGE 1 OF 8 www.wsp-opus.co.nz
WSP Opus Whangarei Office
Mansfield Terrace Service Lane, 125A Bank St PO Box 553, Whangarei 0140
New Zealand
+64 9 430 1700
www.wsp-opus.co.nz
7 February 2019
Northland Regional Council BY EMAIL Email – [email protected] NRC Ref: 039859 Our Ref: 1-19643.01
APP.039589.01.01 - Response to request for further information: Te Aupouri Commercial Development Ltd – GW Take at various locations, Pukenui.
Dear Stuart
Please find as follows, our response to the further information requested in your email dated 23 March 2018 and your response to our initial submission of the requested information on 18th December 2018.
1 Sufficient drilling and hydraulic testing to enable development of a robust conceptual model of the local hydrogeological environment.
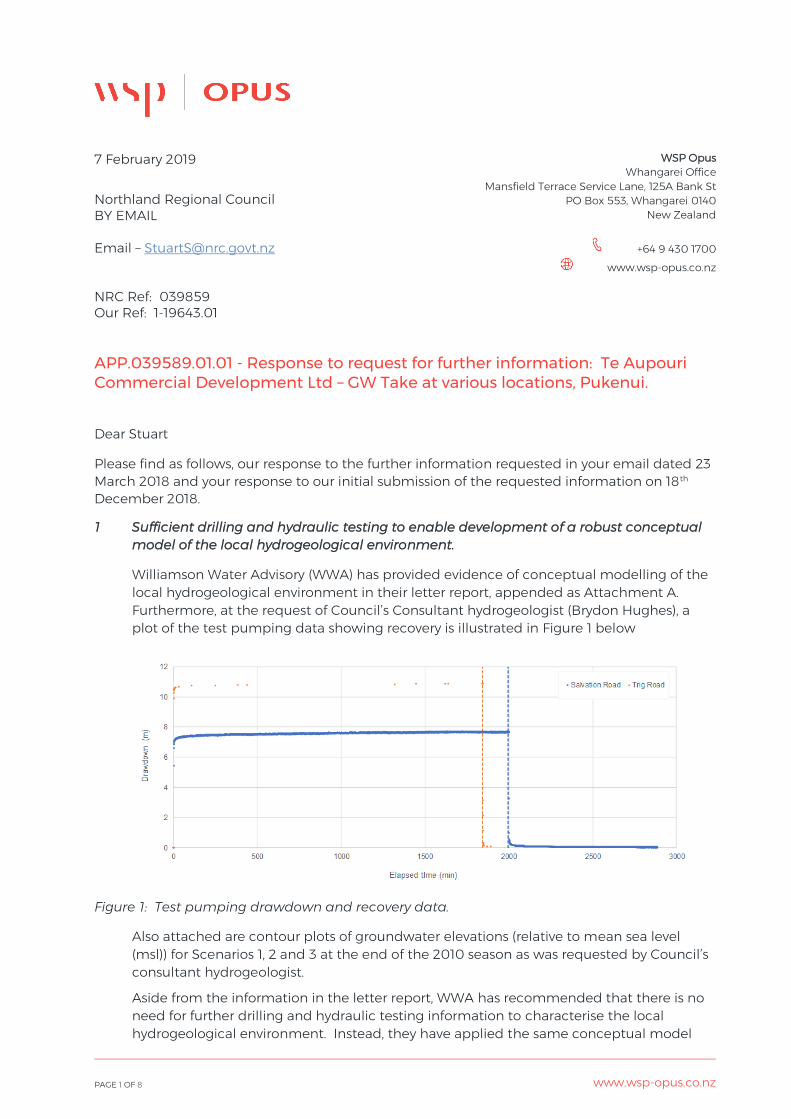
Williamson Water Advisory (WWA) has provided evidence of conceptual modelling of the local hydrogeological environment in their letter report, appended as Attachment A. Furthermore, at the request of Council’s Consultant hydrogeologist (Brydon Hughes), a plot of the test pumping data showing recovery is illustrated in Figure 1 below
Figure 1: Test pumping drawdown and recovery data.
Also attached are contour plots of groundwater elevations (relative to mean sea level (msl)) for Scenarios 1, 2 and 3 at the end of the 2010 season as was requested by Council’s consultant hydrogeologist.
Aside from the information in the letter report, WWA has recommended that there is no need for further drilling and hydraulic testing information to characterise the local hydrogeological environment. Instead, they have applied the same conceptual model
PAGE 2 OF 8 www.wsp-opus.co.nz
that exists from Sweetwater through to Motutangi, on the assumption that because all other features of the physical and depositions environment are similar, the same conceptual model still applies.
2 Further information to identify crop types and areas on the proposed irrigation areas.
The initial application stated the following;
Table 1: Summary detail of proposed groundwater take and use activity from AEE dated 22 February 2018.
The information in Table 1 above is still completely relevant
Table 2 below indicates how water was initially sought to be utilised.
Table 2: Irrigation areas and expected annual irrigation water application rates per block.
It is now the intention to focus most of the irrigation development to the south of the property to make most efficient use of infrastructure and benefits of centralising operations i.e. high value and more labour-intensive land-uses.
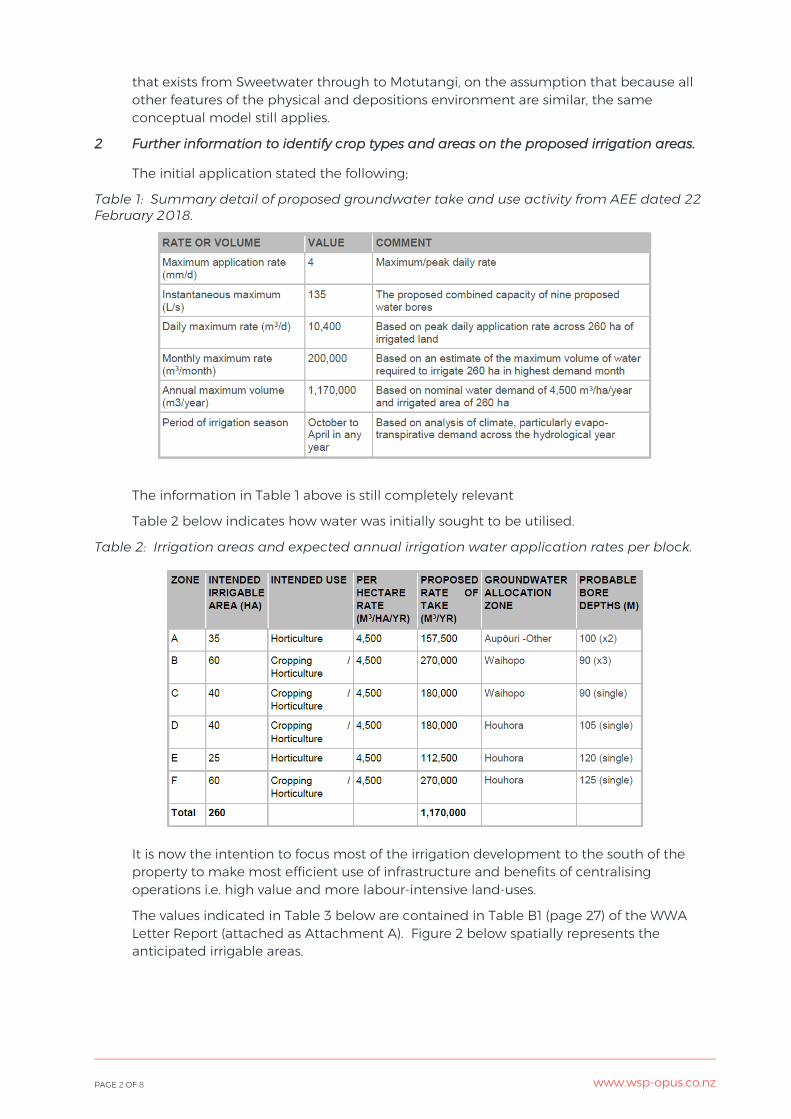
The values indicated in Table 3 below are contained in Table B1 (page 27) of the WWA Letter Report (attached as Attachment A). Figure 2 below spatially represents the anticipated irrigable areas.
PAGE 3 OF 8 www.wsp-opus.co.nz
Table 3: Revised irrigation area schedule with overall annual volume.
Block WWA Block Name Allocation
Zones Approx Area
(Ha) Annual Vol
Salvation Avocado Salvation Rd Houhora 40 175,000
Kimberly Avocado Cropping Avocados Other 40 175,000
Waihopo - Kimberly Waihopo - Kimberly Waihopo 15 60,000
Waihopo - Trig Waihopo - Trig Waihopo 15 60,000
Pivot A Pivot A-centre Pivot A-N Pivot A-S
Houhora 70 300,000
Pivot B Pivot B Houhora 40 180,000
Pivot C Pivot C-E Pivot C-W
Houhora 50 220,000
Total 270 1,170,000
Figure 2: Spatial indication of irrigation areas as described in Table 3 above.
Given the size of Te Raite Station, and myriad of soil types and irrigable land use options, the volume being sought is only enough to irrigate in the order of 15-20% of the property dependent on land use and practices.
Land use will be mixed with varying requirements. It is proposed that water use efficiency will be demonstrated by ensuring that at least 80 percent of the annual volume of water applied to the irrigable area is retained in the soil in the root zone of the crop, compared to the average gross depth of water applied to the crop.
This will require the preparation of an Irrigation Scheduling Plan (ISP) for approval prior to executing consent to address specific irrigable area water balance and crop water requirements, subsurface drainage, and will provide an irrigation strategy for the station.
For each irrigation area, the ISP will include:
(a) A description of how water requirements for each irrigation cycle are calculated; (b) Method(s) for assessing current soil moisture levels; (c) Method(s) for assessing potential evapotranspiration (PET) and rainfall to date;
PAGE 4 OF 8 www.wsp-opus.co.nz
(d) Assessment of other inputs such as effluent irrigation and effect on irrigation requirement;
(e) Soil moisture target to be maintained in each zone by irrigation; (f) How measured data will be used to assess irrigation requirements over the next
irrigation cycle; and (g) A description of proposed method(s) for remaining within consent limits at each
borehole or group of boreholes.
3 Additional assessment to better characterise the potential nature and magnitude of hydraulic connection with overlying surface waterbodies and quantify the potential magnitude of any surface water depletion effects
Characterisation of Surface Waterbodies
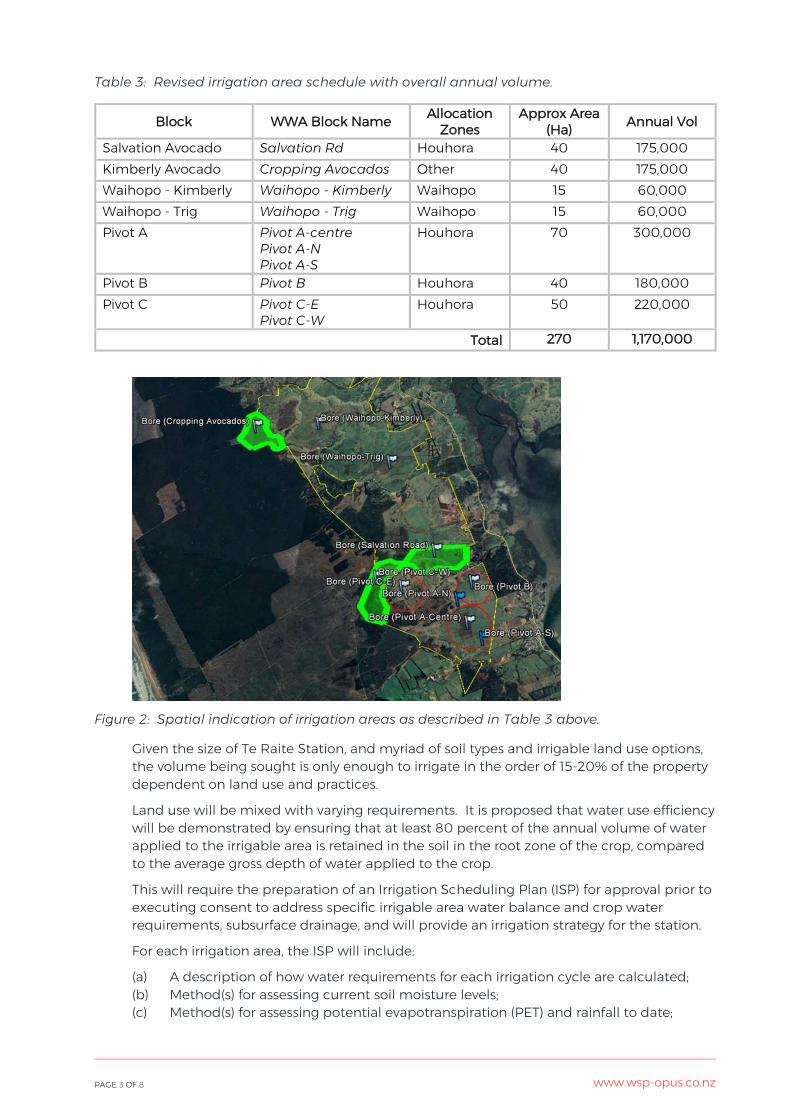
Te Raite Station covers 1,866ha and of that, 1,222ha is classified as flat to undulating. Figure 3 below illustrates the typical nature of the station.
Figure 3: Example of topography of most of the Te Raite Station landholding showing waterways, drains and lakes.
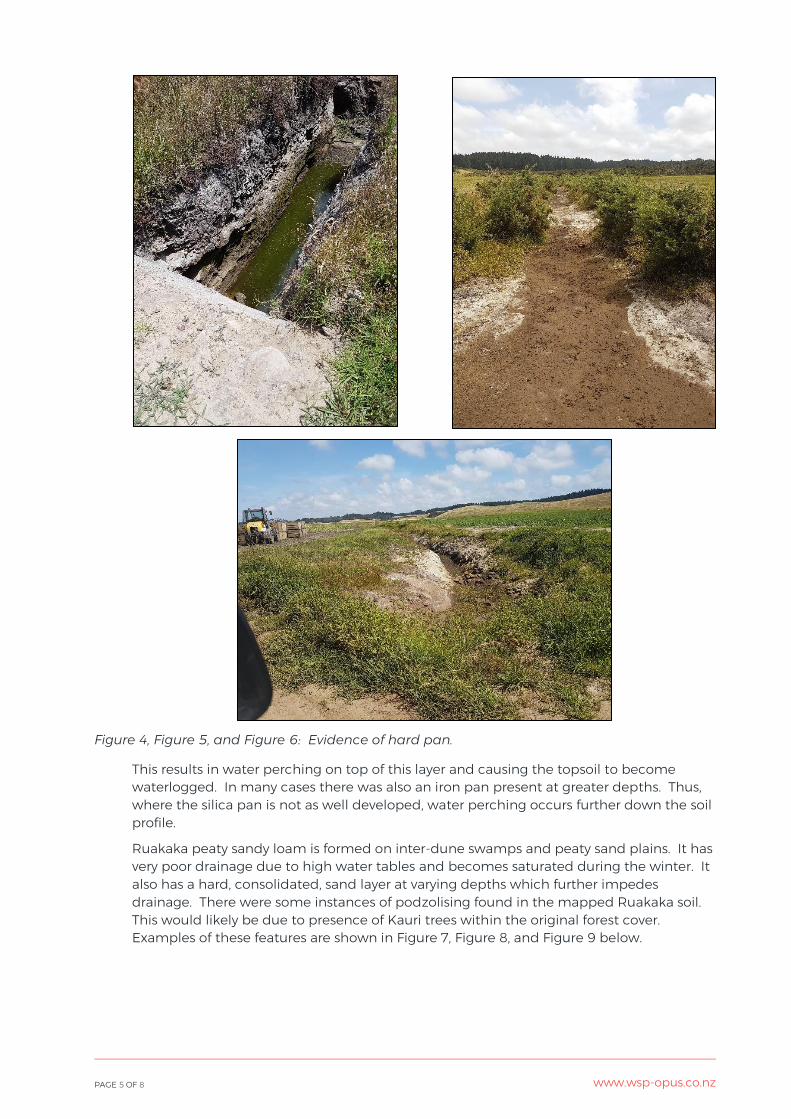
The dominant soils on the property are Te Kopuru sand and Ruakaka peaty sandy loam. The Te Kopuru soil has the hard silica pan characteristic of podzolised soil (this is the white layer that can be seen in Figure 4, Figure 5, and Figure 6: Evidence of hard pan.) which significantly impedes water filtration through the soil profile.
PAGE 5 OF 8 www.wsp-opus.co.nz
Figure 4, Figure 5, and Figure 6: Evidence of hard pan.
This results in water perching on top of this layer and causing the topsoil to become waterlogged. In many cases there was also an iron pan present at greater depths. Thus, where the silica pan is not as well developed, water perching occurs further down the soil profile.
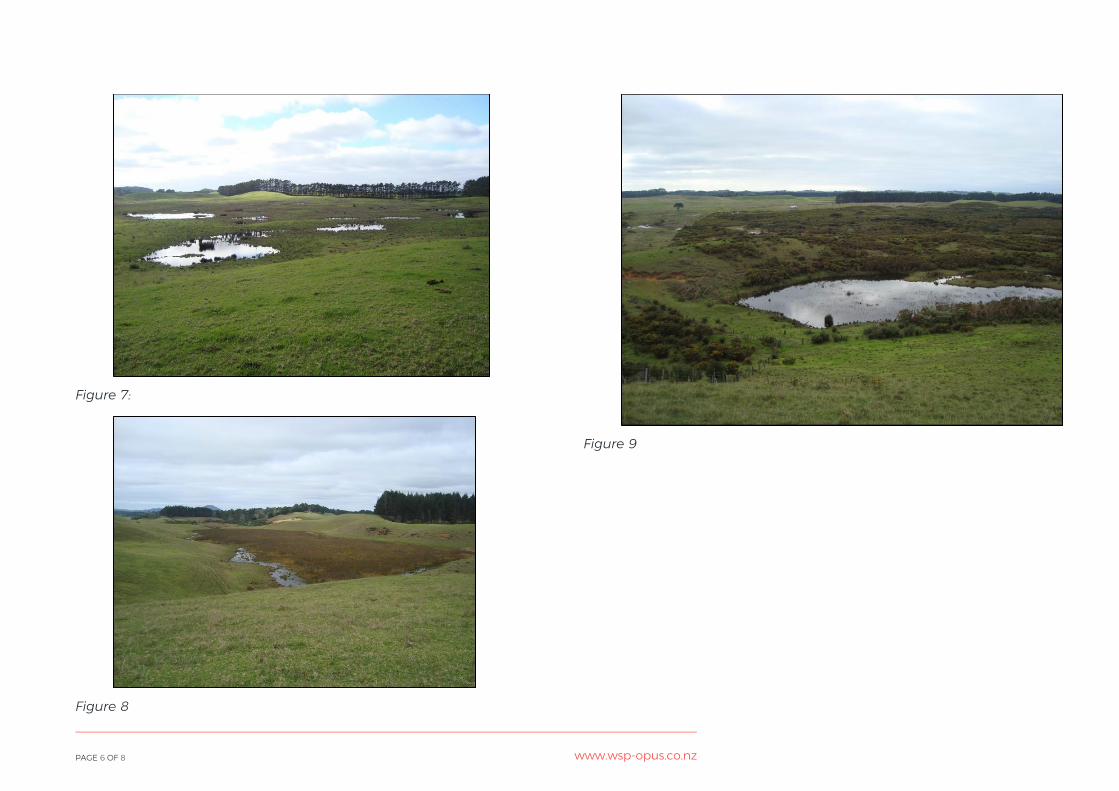
Ruakaka peaty sandy loam is formed on inter-dune swamps and peaty sand plains. It has very poor drainage due to high water tables and becomes saturated during the winter. It also has a hard, consolidated, sand layer at varying depths which further impedes drainage. There were some instances of podzolising found in the mapped Ruakaka soil. This would likely be due to presence of Kauri trees within the original forest cover. Examples of these features are shown in Figure 7, Figure 8, and Figure 9 below.
PAGE 6 OF 8 www.wsp-opus.co.nz
Figure 7:
Figure 8
Figure 9
PAGE 7 OF 8 www.wsp-opus.co.nz
Summary Assessment of Effects on Surface Waterbodies
The WWA letter report concludes that the variation in annual minimum discharge from groundwater to surface water over a range of drought severities (i.e. annual to 100-year recurrence interval) is likely to be in the range of a 2% reduction with the proposed groundwater abstraction, with the relative reduction increasing slightly for the more infrequent events. In the event of a 100-year drought the annual low flow with proposed groundwater abstraction is likely to be under 2.4% less than under the conditions applied in the Base Case scenario. This magnitude of alteration of surface water hydrology is considered to be negligible. Consequently, the potential risk of ecological change is assessed as low, and any ecological and natural character effects on overlying surface waterbodies in the drawdown areas will be less than minor.
4 Re-evaluation of well interference calculations taking into consideration the hydraulic properties of the local aquifer system and the potential contribution to cumulative drawdown resulting from abstraction across the wider Aupouri aquifer management unit.
Potential drawdown effects on existing (consented) groundwater users were assessed in the AEE dated 22 February 2018 using Theis (see Appendix 1 of the original AEE report).
WWA has re-evaluated well interference calculations, in particular, the potential contribution to cumulative drawdowns resulting from abstractions across the wider Aupouri aquifer management unit. The assessment can be found in Section 7.3 of the WWA letter report with revised Figures 10, 11 and 12 showing drawdown contours within the context of the Aupouri aquifer sub-zone boundaries.
Furthermore, in an email dated 8th January 2019, WWA states that, “With respect to cumulative drawdown, Figure 10 shows the actual drawdown from Te Raite alone and Figure 11 shows the same under a low leakage scenario, which is more likely. From this you can see that the effect on the adjoining bores to the south is less than 0.5 m. We know from the MWWUG model that the impact on the northern boundary of that proposal was approx. 0.8 m. Hence the cumulative effect is likely to be between 1.3-1.5 m of all bores in the area pumping.”
5 Further assessment of potential risks associated with saline intrusion via lateral migration, taking including appropriate groundwater level thresholds along the coastal margin and revised estimates of cumulative water level drawdown.
The Lincoln Agritech (2015) report recommended provisional allocation limits for various sub-aquifer areas across the peninsula based on the calculated volume of groundwater able to be abstracted without drawing groundwater levels below thresholds established at the coast to maintain the saline interface offshore (i.e. to prevent the migration of the saline interface inland of the coastal margin). As assessed above, the requested volumes do not exceed the recommended limits.
Section 7.4 of the WWA letter report provides an assessment of potential upconing of the saline interface resulting from the proposed abstraction based on the Ghyben-Herzberg relation. Results of this assessment show that saltwater intrusion via lateral migration along the basement contact is unlikely to increase in response to the proposed groundwater abstraction and the predicted impact on any wells that are currently accessing water in the drawdown area would be less than minor. The assessment does identify that there is potential for localised saline intrusion to occur on the West coast but that these areas are used for forestry and are not susceptible to the impact of periodic saline intrusion.
Mechanisms to monitor and respond to salinity indicators are anticipated to be identified through further collaboration with the Council.
PAGE 8 OF 8 www.wsp-opus.co.nz
6 Assessment of the potential for the proposed abstraction to result in aquifer compaction and/or land subsidence.
Please see Section 7.5 of the WWA letter report appended as Attachment 1.
7 Assessment of potential water quality effects in shallow groundwater and/or surface water bodies resulting from the proposed use of water for irrigation.
As a discretionary activity, there is no limitation to the effects on the environment of an activity that Council may turn its attention to in s104(1)(a) RMA. However, these must be relevant and necessary.
Regional plans have an enabling role because under the RMA no person may discharge any contaminant to water or onto or into land in circumstances where that contaminant may enter water unless permitted by a rule in a regional plan or authorised through a resource consent issued by a council. That is, regional plans can permit activities that would otherwise require resource consent under the RMA. Discharges to air are unconstrained unless they are in contravention of a national environmental standard or regional rule.
The current implementation of Section 15 of the RMA is that uses of land that affect water quality (diffuse discharges) are generally permitted under the RMA unless controlled by a rule in a regional plan.
The Regional Water and Soil Plan 2004 (RWSP) and the Proposed Regional Plan 2017 (PRP) are both silent on regulation or a framework for diffuse discharges resulting from land use change. Consequently, the effects of water quality from the use of water would first need to be in breach of the relevant discharge rule in the relevant plan before any further assessment is warranted.
When forming an opinion as to any actual and potential effects on the environment of allowing the activity, the consenting authority may disregard an adverse effect of the activity on the environment if a national environmental standard or the plan permits an activity with that effect pursuant to s104(2) RMA. This is a matter for discretion for the decision maker, however, it is considered that permitted baseline can be applied to ancillary activities associated with the use of the water. Such an assessment of permitted baseline can be submitted if this is deemed necessary by Council.
8 Details of monitoring and/or contingency options to address uncertainties in the magnitude of estimated effects on the environment
A monitoring and contingency plan has not been prepared at this time as it is anticipated that this would be more effective as a collaboration with the Council given its recent undertaking to monitor and maintain trigger level alerts for the Motutangi-Waiharara Water User’s Group (MWWUG). We expect to have further dialogue with Council on this matter before finalising anything.
Regards
Martell Letica Team Leader – Planning Attachments