Embed Size (px)
Citation preview
Uşak Üniversitesi Sosyal Bilimler Dergisi Yıl: XIII- Sayı:2-2020 Sayfa:13-24
Usak University Journal Of Social Sciences Year: XIII /Issue:2-2020 Pages: 13-24
Geliş:18.06.2020 Received:18.06.2020 Kabul:31.12.2020 Accepted:31.12.2020
Bu makale benzerlik taramasına tabi tutulmuştur.
Araştırma Makalesi/ Research Article
EFFECT OF INVESTMENT AND FINANCING DECISIONS ON FIRM
VALUE; EXAMPLE OF BIST INDUSTRIAL INDEX Aslı AFŞAR* Emine KARAÇAYIR**
Abstract The purpose of this study is to investigate the effect of investment and financing decisions on
firm value. Productivity and profitability ratios representing investment decisions, leverage ratio and current ratio representing financial decisions, firms representing firm value were chosen as the last trading day share values. Investment and financing decisions and the impact of the 2008 global crisis on the firm value were tested for 100 firms operating in the Borsa Istanbul Industrial Index, using the annual data for the period 2003-2018 and the fixed effects panel data method. According to empirical findings, asset turnover rate, return on assets, intangible assets, current ratio, stock turnover rate and profit per share variables positively and significantly affect firm value. Leverage ratio, debt turnover rate and crisis variable affect the firm value negatively and significantly. In addition, it was concluded that the effects of the receivable turnover rate and firm size variables on the firm value are meaningless.
Keywords: Firm value, investment decisions, financing decisions, panel data
YATIRIM VE FİNANSMAN KARARLARININ FİRMA DEĞERİ ÜZERİNE ETKİSİ; BIST SINAİ ENDEKSİ ÖRNEĞİ
Öz Bu çalışmanın amacı yatırım ve finansman kararlarının firma değeri üzerindeki etkisini
araştırmaktır. Yatırım kararlarını temsilen verimlilik ve karlılık oranları, finansman kararlarını temsilen kaldıraç oranı ve cari oran, firma değerini temsilen firmaların yıl sonu son işlem günü pay senedi değerleri tercih edilmiştir. Yatırım ve finansman kararları ile 2008 küresel krizinin firma değeri üzerindeki etkisi, Borsa İstanbul Sınai endeksinde faaliyet gösteren 100 firma için, 2003-2018 dönemi yıllık verileri kullanılarak sabit etkiler panel very yöntemi kullanılarak test edilmiştir. Ampirik bulgulara göre, aktif devir hızı, aktif karlılık oranı, maddi olmayan duran varlıklar, cari oran, stok devir hızı ve hisse başına kar değişkenleri firma değerini pozitif yönde ve anlamlı olarak etkilemektedir. Kaldıraç oranı, borç devir hızı ve kriz değişkeni ise firma değerini negatif yönde ve anlamlı olarak etkilemektedir. Ayrıca alacak devir hızı ve firma büyüklüğü değişkenlerinin firma değeri üzerine etkilerinin anlamsız olduğu sonucuna ulaşılmıştır.
AnahtarKelimeler: Firmadeğeri, yatırımkararları, finansmankararları, panel very 1. Introduction The main purpose of a firm is to increase the fortunes of the firm's existing shareholders.
In other words, the value of the company is maximized. With the concept of firm value gaining importance, investors, financial institutions associated with the firm, other people and institutions want to have information about the value of the firm. In addition, they want to learn
* Prof. Dr., Anadolu Üniversitesi, EMYO, [email protected]. Orcid: 0000-0001-7031-1419 ** Arş. Gör. Dr. Karamanoğlu Mehmetbey Üniversitesi, İİBF, [email protected]. Orcid: 0000-0003-0512-9084
13

Uşak Üniversitesi Sosyal Bilimler Dergisi Aslı Afşar – Emine Karaçayır
both the factors that companies cannot control, such as general economic and political conditions, and the factors that companies can control, such as investment and financing decisions.
Although there is no generally accepted definition for firm value, firm value is related to liquidity, profitability, capital structure and operating rates. Many methods are used in the literature to determine the firm value. While some of these methods take into account the price coefficients of the companies, some of them take into account the information about the activities of the companies (Ercan and Ureten, 2000: 123). Although it was seen that the Market Value / Book Value (MV/BV) ratio was used in the previous studies, in this study, the stock end values of the firms representing the firm value were used by considering the financial statement disclosure dates. The reason why MV/BV ratio is not used as dependent variable is mostly because it expresses stock market performance. December stocks last transaction day prices were used both in terms of separation from previous studies and reflecting the current status of firms and revealing the effects of changes in the economy (Meder, 2000: 41).
In order to achieve the purpose of value maximization of companies, if the value of the stock increases, the value of the company will increase. Considering that the investment decisions they will make are important while providing value maximization, firms demonstrate the importance of financing decisions where, how and which way these investments are financed. It is also very important to finance these investments with the least cost (Schularick& Steger, 2010). Firm value and the decisions to be made will affect the profitability and risk of firms, and this effect will cause the firm value to increase or decrease (Arkan, 2010: 25).
Investment is the fund usage decisions that companies use to reach their goals by performing their activities. Investment decisions are one of the most important factors that determine the profitability, efficiency and risk levels in order for companies to survive (Usta, 2012: 28). These decisions also benefit the company to act according to its financial strength and competitive position in the future. While making financial decisions, mechanisms affecting firm value should not be ignored (Akgüç, 2011: 3).
Financing decisions are decisions about how companies will grow and how investments will be financed. It is very important to correctly determine the financial resources required for investments. When making financial decisions, the tools used must be analyzed and the conditions of the firm and the financial analysis must be taken into account. Firms can apply for debt only, equity only or both debt and equity when making their financing decisions. In order for growth to occur and investments to be efficient, a financing approach that is suitable for competitive conditions must be adopted (Betz, 2011). In order to make investment and financing decisions effectively, minimum cost and maximum firm value are required. For this reason, it was decided to investigate the effect of investment and financing decisions of the companies on the firm value.
In this study, as a result of the results obtained from the previous studies, it has been investigated how these variables have an impact on the firm value by classifying the variables as investment decisions and financing decisions instead of just calling them financial ratios. For this purpose, analysis was carried out using panel data method by using efficiency and profitability ratios to explain investment decisions, leverage ratio and current ratio to explain financing decisions, and final share closing price in December to determine firm value. In the study, variables that affect the firm's value were investigated by using the annual data of 2003-2018 of the variables belonging to 100 firms trading in Borsa İstanbul (BIST) Industrial index. When we look at the studies carried out so far, the relationship between capital structure and firm value in general has been examined. This study differs from other studies in terms of both addressing the crisis period and also investigating investments in intangible assets.The reason for adding intangible assets to variables; It is due to the fact that it is a long-term investment specific to the company and reflects the value of the firm.By adding the crisis dummy variable,
14
Uşak Üniversitesi Sosyal Bilimler Dergisi Aslı Afşar – Emine Karaçayır
it is aimed to investigate what effect the crisis has on firm value.In addition, this study differs from previous studies in terms of the dependent variable used and the time period examined is longer. Firstly, empirical findings were included in the study, and then regression analysis results were explained by including the data set and method used in the study and the analysis. In the last section, the findings were evaluated.
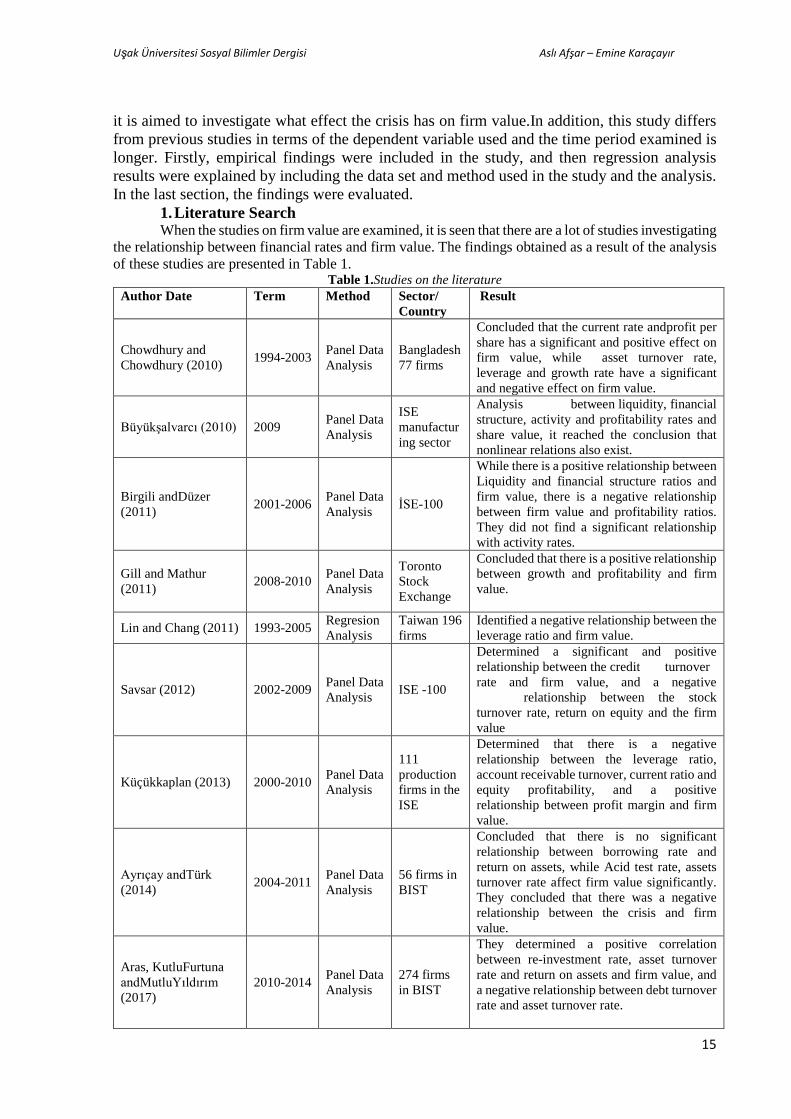
1. Literature Search When the studies on firm value are examined, it is seen that there are a lot of studies investigating
the relationship between financial rates and firm value. The findings obtained as a result of the analysis of these studies are presented in Table 1.
Table 1.Studies on the literature Author Date Term Method Sector/
Country Result
Chowdhury and Chowdhury (2010) 1994-2003 Panel Data
Analysis Bangladesh 77 firms
Concluded that the current rate andprofit per share has a significant and positive effect on firm value, while asset turnover rate, leverage and growth rate have a significant and negative effect on firm value.
Büyükşalvarcı (2010) 2009 Panel Data Analysis
ISE manufacturing sector
Analysis between liquidity, financial structure, activity and profitability rates and share value, it reached the conclusion that nonlinear relations also exist.
Birgili andDüzer (2011) 2001-2006 Panel Data
Analysis İSE-100
While there is a positive relationship between Liquidity and financial structure ratios and firm value, there is a negative relationship between firm value and profitability ratios. They did not find a significant relationship with activity rates.
Gill and Mathur (2011) 2008-2010 Panel Data
Analysis
Toronto Stock Exchange
Concluded that there is a positive relationship between growth and profitability and firm value.
Lin and Chang (2011) 1993-2005 Regresion Analysis
Taiwan 196 firms
Identified a negative relationship between the leverage ratio and firm value.
Savsar (2012) 2002-2009 Panel Data Analysis ISE -100
Determined a significant and positive relationship between the credit turnover rate and firm value, and a negative relationship between the stock turnover rate, return on equity and the firm value
Küçükkaplan (2013) 2000-2010 Panel Data Analysis
111 production firms in the ISE
Determined that there is a negative relationship between the leverage ratio, account receivable turnover, current ratio and equity profitability, and a positive relationship between profit margin and firm value.
Ayrıçay andTürk (2014) 2004-2011 Panel Data
Analysis 56 firms in BIST
Concluded that there is no significant relationship between borrowing rate and return on assets, while Acid test rate, assets turnover rate affect firm value significantly. They concluded that there was a negative relationship between the crisis and firm value.
Aras, KutluFurtuna andMutluYıldırım (2017)
2010-2014 Panel Data Analysis
274 firms in BIST
They determined a positive correlation between re-investment rate, asset turnover rate and return on assets and firm value, and a negative relationship between debt turnover rate and asset turnover rate.
15
Uşak Üniversitesi Sosyal Bilimler Dergisi Aslı Afşar – Emine Karaçayır
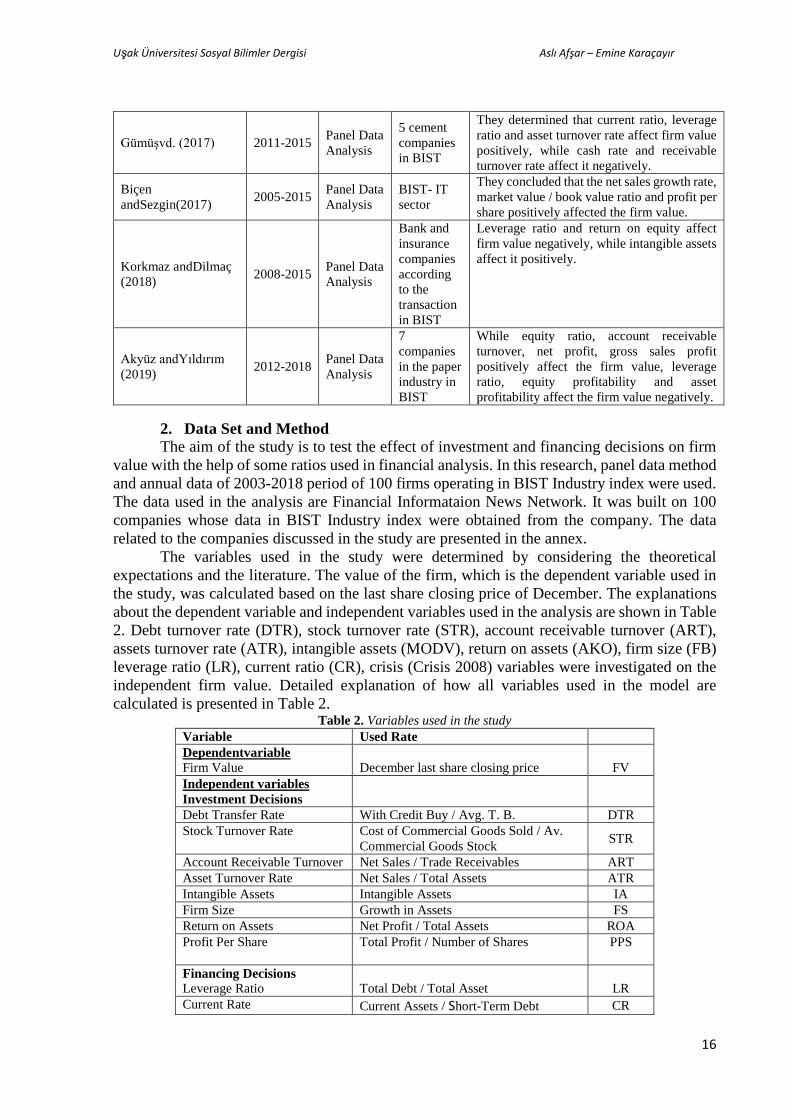
Gümüşvd. (2017) 2011-2015 Panel Data Analysis
5 cement companies in BIST
They determined that current ratio, leverage ratio and asset turnover rate affect firm value positively, while cash rate and receivable turnover rate affect it negatively.
Biçen andSezgin(2017) 2005-2015 Panel Data
Analysis BIST- IT sector
They concluded that the net sales growth rate, market value / book value ratio and profit per share positively affected the firm value.
Korkmaz andDilmaç (2018) 2008-2015 Panel Data
Analysis
Bank and insurance companies according to the transaction in BIST
Leverage ratio and return on equity affect firm value negatively, while intangible assets affect it positively.
Akyüz andYıldırım (2019) 2012-2018 Panel Data
Analysis
7 companies in the paper industry in BIST
While equity ratio, account receivable turnover, net profit, gross sales profit positively affect the firm value, leverage ratio, equity profitability and asset profitability affect the firm value negatively.
2. Data Set and Method
The aim of the study is to test the effect of investment and financing decisions on firm value with the help of some ratios used in financial analysis. In this research, panel data method and annual data of 2003-2018 period of 100 firms operating in BIST Industry index were used. The data used in the analysis are Financial Informataion News Network. It was built on 100 companies whose data in BIST Industry index were obtained from the company. The data related to the companies discussed in the study are presented in the annex. The variables used in the study were determined by considering the theoretical expectations and the literature. The value of the firm, which is the dependent variable used in the study, was calculated based on the last share closing price of December. The explanations about the dependent variable and independent variables used in the analysis are shown in Table 2. Debt turnover rate (DTR), stock turnover rate (STR), account receivable turnover (ART), assets turnover rate (ATR), intangible assets (MODV), return on assets (AKO), firm size (FB) leverage ratio (LR), current ratio (CR), crisis (Crisis 2008) variables were investigated on the independent firm value. Detailed explanation of how all variables used in the model are calculated is presented in Table 2.
Table 2. Variables used in the study Variable Used Rate Dependentvariable Firm Value
December last share closing price
FV
Independent variables Investment Decisions
Debt Transfer Rate With Credit Buy / Avg. T. B. DTR Stock Turnover Rate Cost of Commercial Goods Sold / Av.
Commercial Goods Stock STR
Account Receivable Turnover Net Sales / Trade Receivables ART Asset Turnover Rate Net Sales / Total Assets ATR Intangible Assets Intangible Assets IA Firm Size Growth in Assets FS Return on Assets Net Profit / Total Assets ROA Profit Per Share Total Profit / Number of Shares PPS
Financing Decisions Leverage Ratio
Total Debt / Total Asset
LR
Current Rate Current Assets / Short-Term Debt CR
16

Uşak Üniversitesi Sosyal Bilimler Dergisi Aslı Afşar – Emine Karaçayır
Dummy Variable Crisis
2008 Global Crisis (0 is given for Crisis2008 years before 2008 and 1 for subsequent years)
Crisis 2008
This research was created by using panel data method with annual data of 2005-2018
period of 100 firms operating in BIST Industry index. Descriptive statistics related to the series consisting of a total of 1,400 observation values for 9 variables are presented in Table 3.
Table 3.Descriptive statistics Data Average Standard
Deviation Minimum Maximum
FV .6012232 .1749623 .0291738 2.931484 DTR 4.110267 2.244511 .2340789 16.56455 STR 29.21312 12.23231 3.765429 62.67531 ART 5.123090 4.578315 .1280453 12.66739 ATR 2.246234 14.23235 12.5679 121.0265 IA 1.426342 8.4182 0.64917 1.46276
ROA .2056435 .140978 -.54381 1.52043 FS 4.78610 .032168 4.8920 18.2901
PPS .509.028 .40531 21.052 18.44836 LR .0564798 .0211564 .0002176 .305311 CR 213.5642 201.278 1.1417 1.5434
Crisis 2008 10.92669 1.342902 15.44287 12.23344
In order to measure the effect of investment and financing decisions on firm value with the help of ratios used in financial analysis, panel data analysis was performed and the model described below was tested in this context. Model: Effect of Investment and Financing Decisions on Firm Value 𝐹𝐹𝐹𝐹 = 𝛽𝛽0𝑖𝑖𝑖𝑖 + 𝛽𝛽1𝐷𝐷𝐷𝐷𝐷𝐷𝑖𝑖𝑖𝑖 + 𝛽𝛽2𝑆𝑆𝐷𝐷𝑖𝑖𝑖𝑖 + 𝛽𝛽3𝐴𝐴𝐷𝐷𝐷𝐷𝑖𝑖𝑖𝑖 + 𝛽𝛽4𝐴𝐴𝐷𝐷𝐷𝐷𝑖𝑖𝑖𝑖 + 𝛽𝛽5𝐼𝐼𝐴𝐴𝑖𝑖𝑖𝑖 + 𝛽𝛽6𝐹𝐹𝑆𝑆𝑖𝑖𝑖𝑖 + 𝛽𝛽7𝐷𝐷𝑅𝑅𝐴𝐴𝑖𝑖𝑖𝑖
+ 𝛽𝛽8𝑃𝑃𝑃𝑃𝑆𝑆𝑖𝑖𝑖𝑖 + 𝛽𝛽9𝐿𝐿𝐷𝐷𝑖𝑖𝑖𝑖 + 𝛽𝛽10𝐶𝐶𝐷𝐷𝑖𝑖𝑖𝑖 + 𝐶𝐶𝐶𝐶𝐶𝐶𝐶𝐶𝐶𝐶𝐶𝐶 2008 + 𝜀𝜀𝐶𝐶 Within the scope of the model used in the study, both horizontal and time section
dimensions were used together. The firm data of the BIST Industrial index are used as the time dimension and the bed cross-section dimension. Predicting the relationships between the variables with the help of panel data models created using panel data containing time dimension is called panel data analysis (Tatoğlu, 2013: 4). A general panel data model with dependent variable Y and independent variable X is expressed as follows.
𝑌𝑌𝑖𝑖𝑖𝑖 = 𝑎𝑎𝑖𝑖𝑖𝑖 + 𝛽𝛽𝑖𝑖𝑖𝑖 + 𝑒𝑒𝑖𝑖𝑖𝑖 Here, α represents constant parameter, β_it slope parameter, e_itthe error term andi represents the sub-indices for units and t sub-indices for time periods (Baltagi, 2005: 11). In panel data analysis, F test, LM test and Hausman tests are used to determine the existence of unit and time and which model is suitable (Güriş, 2015: 35). In this study, Hausman test was used to determine the model. In the Hausman test, the rejection of the null hypothesis, which showed that both the coincidence effects model and the coefficients obtained from the desabit effects model were the same, indicates that the results of the random effects model are more effective (Tarı, 2011). In panel data analysis method, it should first be determined whether the variables are stationary or not. Also, horizontal dependency must be tested to test for the existence of the unit root. In the case of mutual interactions between companies, namely, the cross-sectional dependency, the shock that may occur in any of the units affects other units. In the literature,
17
Uşak Üniversitesi Sosyal Bilimler Dergisi Aslı Afşar – Emine Karaçayır
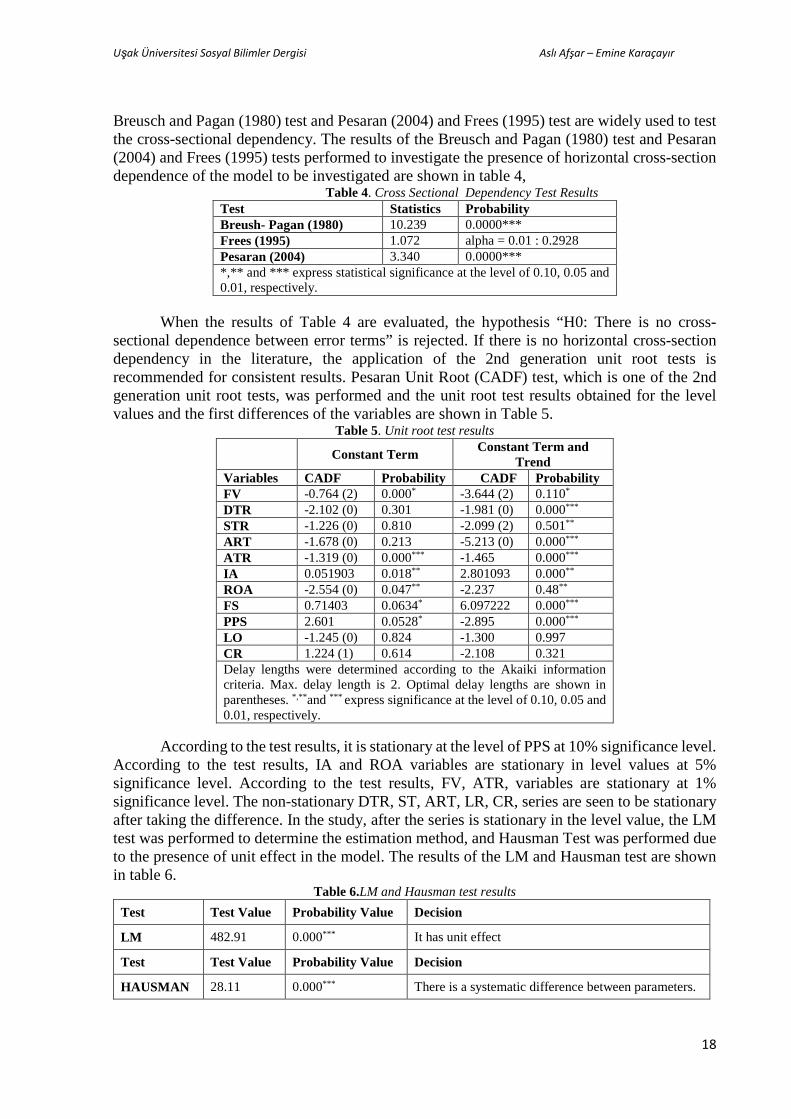
Breusch and Pagan (1980) test and Pesaran (2004) and Frees (1995) test are widely used to test the cross-sectional dependency. The results of the Breusch and Pagan (1980) test and Pesaran (2004) and Frees (1995) tests performed to investigate the presence of horizontal cross-section dependence of the model to be investigated are shown in table 4,
Table 4. Cross Sectional Dependency Test Results Test Statistics Probability Breush- Pagan (1980) 10.239 0.0000*** Frees (1995) 1.072 alpha = 0.01 : 0.2928 Pesaran (2004) 3.340 0.0000*** *,** and *** express statistical significance at the level of 0.10, 0.05 and 0.01, respectively.
When the results of Table 4 are evaluated, the hypothesis “H0: There is no cross-
sectional dependence between error terms” is rejected. If there is no horizontal cross-section dependency in the literature, the application of the 2nd generation unit root tests is recommended for consistent results. Pesaran Unit Root (CADF) test, which is one of the 2nd generation unit root tests, was performed and the unit root test results obtained for the level values and the first differences of the variables are shown in Table 5.
Table 5. Unit root test results Constant Term Constant Term and
Trend Variables CADF Probability CADF Probability FV -0.764 (2) 0.000* -3.644 (2) 0.110*
DTR -2.102 (0) 0.301 -1.981 (0) 0.000***
STR -1.226 (0) 0.810 -2.099 (2) 0.501**
ART -1.678 (0) 0.213 -5.213 (0) 0.000***
ATR -1.319 (0) 0.000*** -1.465 0.000*** IA 0.051903 0.018** 2.801093 0.000**
ROA -2.554 (0) 0.047** -2.237 0.48**
FS 0.71403 0.0634* 6.097222 0.000***
PPS 2.601 0.0528* -2.895 0.000***
LO -1.245 (0) 0.824 -1.300 0.997 CR 1.224 (1) 0.614 -2.108 0.321 Delay lengths were determined according to the Akaiki information criteria. Max. delay length is 2. Optimal delay lengths are shown in parentheses. *,**and *** express significance at the level of 0.10, 0.05 and 0.01, respectively.
According to the test results, it is stationary at the level of PPS at 10% significance level.
According to the test results, IA and ROA variables are stationary in level values at 5% significance level. According to the test results, FV, ATR, variables are stationary at 1% significance level. The non-stationary DTR, ST, ART, LR, CR, series are seen to be stationary after taking the difference. In the study, after the series is stationary in the level value, the LM test was performed to determine the estimation method, and Hausman Test was performed due to the presence of unit effect in the model. The results of the LM and Hausman test are shown in table 6.
Table 6.LM and Hausman test results Test Test Value Probability Value Decision
LM 482.91 0.000*** It has unit effect
Test Test Value Probability Value Decision
HAUSMAN 28.11 0.000*** There is a systematic difference between parameters.
18

Uşak Üniversitesi Sosyal Bilimler Dergisi Aslı Afşar – Emine Karaçayır
Based on the table above, it is seen that the model of fixed effect panel data analysis is suitable. The diagnostic test results of the model to be estimated in the study are as follows.
Table 7. Diagnostic test results for the model Autocorrelation Test Test Value Bhargava, Franzını& Narendranathan’sDurbın Watson Test 1.7563
Variance Test 𝑿𝑿𝟐𝟐Value Probability Value Wald Test 100.21 0.000***
When the table above is examined, it is understood that there is a problem of
autocorrelation and variance. In order for estimators to provide reliable results, the model will continue to be predicted with resistant standard errors. In this context, standard errors were corrected with the help of Arellano-Froot-Rogers estimator. The fixed effects model results estimated by the Arellano-Froot-Rogers estimator are reported in the table below.
Table 8.Fixed effects test results
Independent Variables Coefficient Standard Error
Probability Value
DTR -0.18021 0.0471 0.000***
STR 0.0179 0.0024 0.000***
ART 0.04611 0.0018 0.1602 ATR 0.0295 1.0349 0.000***
IA 0.92512 1.0166 0.000***
ROA 1.2850 0.1243 0.012**
FS -0.2045 0.1595 0.081**
PPS 0.0162 0.0012 0.010**
D1LO -0.32310 0.0208 0.000***
D1CR 0.43428 0.1500 0.0110**
Crisis2008 -0.4011 0.0248 0.0010 ** Constant TermC 0.213671 0.0190 0.0000 R2 0.4309 Wald Statistics 2.93 (0.000)*** "D1" in front of the variable shows that the first cyclical difference of the series is taken.*,** and *** express significance at the level of 0.10, 0.05 and 0.01, respectively.
Table 8 shows that the R2 coefficient, which shows the effect of independent variables on the dependent variable, is 0.4309. The closer the R2 value is to 1, the stronger it is to explain the independent variables of the dependent variable (Gujarati, 2001: 247). It can be said that 43% of the changes in the firm value are caused by the changes in the independent variables. When the table is analyzed, the variables that affect the firm value significantly are debt turnover rate (DTR), stock turnover rate (ST), asset turnover rate (ATR), intangible assets (IA), return on assets (ROA), profit per share (PPS), leverage ratio (LR), current ratio(CR) and crisis 2008. If the variables showing investment decisions are examined; The debt turnover rate (DTR) appears to affect the firm value negatively, while the increase in the debt turnover rate decreases the firm value by 0.18021. This result is compatible with Aras, Kutlu Furtuna and Mutlu Yıldırım (2017) and Büyükşalvarcı (2010). While the inventory turnover rate (STR) positively affects the firm value, it is seen that the increase in this rate increases the firm value by 0.0179. This result is in line with the works of Çakır and Küçükkaplan (2012). It is observed that the increase in asset turnover rate increased the firm value by 0.295. This result is in line with the works of Aras, Kutlu Furtuna and Mutlu Yıldırım (2017) and Akyüz and Yıldırım (2019). It is observed that the increase in intangible assets increased the firm value by 0.92512. This result is in parallel with the work of Korkmaz and Dilmaç (2018). Although they do not
19

Uşak Üniversitesi Sosyal Bilimler Dergisi Aslı Afşar – Emine Karaçayır
have any physical assets, they are an important variable since they are assets that give privileges to companies as long as they continue to exist. While the return on assets (ROA) positively affects the firm value, the increase in the return on assets increases the firm value by 1.2850. This result is in line with Aras, Kutlu Furtuna and Mutlu Yıldırım (2017). It is observed that the increase in profit per share increased the firm value by 0.0162. This result is in parallel with the works of Biçen and Sezgin (2017) and Birgili and Düzer (2011). It is determined that the account receivable turnover (ART) and firm size (FS) have no significant effect on the firm value. If the variables showing the financing decisions are examined; leverage ratio (LR) is seen to affect firm value negatively and significantly, and the increase in leverage ratio decreases firm value by 0.3231. This result is compatible with the work of Lin and Chang (2011), Küçükkaplan (2013) and Korkmaz and Dilmaç (2018). The increase in the current ratio increased the firm value by 0.43428, and thisshows parallelism with the studies of Chowdhury and Chowdhury (2010), Birgili and Düzer (2011) and Gümüş et al. (2017). While the 2008 crisis negatively and significantly affected the firm value, it appears to decrease the firm value by 0.4011 and is in line with the studies of Ayrıçay and Türk (2014).
Table 9.Theoretical expectations and findings Theoretical Expectation Result Obtained Debt Transfer Rate - Debt Transfer Rate - Stock Turnover Rate + Stock Turnover Rate + Credit Turnover Rate + Credit Turnover Rate Nonsignificant Assets Turnover Rate + Assets Turnover Rate + Intangible Asset + Intangible Asset + Return on Assets -/+ Return on Assets + Firm Size + Firm Size Nonsignificant Profit Per Share + Profit Per Share + Leverage Ratio -/+ Leverage Ratio - Current Rate + Current Rate + Crisis - Crisis -
According to the findings obtained from the analysis results, while the debt turnover rate, stock turnover rate, return on assets, profit per share variables affect the firm value positively and significantly, the increases in these rates will affect the firm value positively and cause an increase in the firm value. Leverage ratio, current ratio and crisis variables will affect the firm value negatively and significantly, and the increase in these rates will have a negative effect on the firm value.
3. Result Maximizing the firm value, which is the main goal of financial management, is influenced by many factors. Some of these are factors that companies cannot control, such as general economic and political conditions, while others are factors that companies can control. In this study, the relationship between investment and financing decisions and firm value with the help of some ratios used in financial analysis has been tested with panel data method for BIST Industrial index firms. In particular, the main reason for choosing this index is that firms, which are the important building blocks of the economic structure, are included in this index and are suitable for accurately reflecting the general economic situation. Debt turnover rate, which shows investment decisions, affects firm value significantly and negatively. This is an indication that the firm value increases as the debt payment period decreases. In other words, it is understood that firms do not delay in paying their debts in the period examined. Inventory turnover rate affects firm value significantly and positively impact on firm value. Assets turnover rate affects firm value significantly and positively, and it can be understood that the increase in sales will increase the firm value. Intangible assets affect the
20

Uşak Üniversitesi Sosyal Bilimler Dergisi Aslı Afşar – Emine Karaçayır
firm value significantly and positively, which may indicate that the investments made for the growth of the firm increase the firm value. Intangible assets, which are generally ignored in previous studies, are important in terms of providing advantages to companies, even though they do not have any physical assets. It is observed that the rate of active profitability affects firm value significantly and positively. it can prove that the market value of the companies is high as the return on assets increases. Profit per share appears to affect firm value significantly and positively, which may be an indication that the firm has maximized value. According to the findings obtained as a result of the study, it is seen that the increases in investment decisions (asset turnover rate, intangible assets, asset profitability rate, profit per share) increase the firm value. We can say that the leverage ratio, which shows the financing decisions, affects firm value significantly and negatively, which is an indicator that the firm value will increase as debts decrease. The current ratio affects firm value significantly and positively, and it is an indicator that the increase in current assets or decrease in short-term debts will increase firm value. According to the findings obtained as a result of the study, it is seen that the increase in leverage ratio decreases the firm value, while the increase in the current rate increases the firm value. The 2008 crisis appears to affect firm value significantly and negatively, and this is very important on firm value. Unlike previous studies, the 2008 crisis was added to the study as a dummy variable and it was concluded that the crisis negatively affected the firm's value.
The study includes conclusions that can support stock investors and financial managers in decision making. In addition, it is thought that the findings will contribute to the literature, and the studies to be conducted with different indexes, methods, periods, countries and sectors are important in terms of obtaining new findings in testing the relationship between the series. Firms can find solutions to their financing policies by turning to alternative sources of financing during times of financial crisis. Finance managers can increase firm value through more effective and efficient investment and financing preferences. It is very important to carefully examine the rates that show positive and negative relations with the firm value and to implement the measures that can be taken financially for the firm value. Investors can reach their investment targets by considering the general situation of the economy, if they know from which variables and in which way the firm's value is affected.
21

Uşak Üniversitesi Sosyal Bilimler Dergisi Aslı Afşar – Emine Karaçayır
Kaynakça Akgüç, Ö. (2011). Financial Management. İstanbul: Avcıol Publishing.
Akyüz, K.C. and Yıldırım, İ. (2019). Relationship Between Financial Ratios and Firm Value; An Application in Paper and Paper Products Industry. Düzce University Journal of Science and Technology, 19(7), 1778-1792.
Aras, G., Kutlu Furtuna, Ö. And MutluYıldırım, F. (2017). The Impact of Investment and Financing Decisions on Market Value in Turkey. Journal of Business Research Turk, 9(4), 120-138.
Arkan, F. (2010). Financial Structure and Firm Value Relationship: A Research on Firms Registered in ISE. (Unpublished Master Thesis), Selcuk University Institute of Social Sciences, Konya.
Ayrıçay, Y. and Türk, V. E. (2014). The Relationship Between Financial Ratios And Firm Value: An Enforcement In Borsa Istanbul. Journal of Accounting and Finance, 64, 53- 70.
Baltagi, B. (2005). Econometric Analysis of Panel Data. New York: John Wiley & Sons INC.
Betz, F. (2011). Managing Technological İnnovation: Competitive Advantage From Change. Wiley-Inter Science.
Biçen, Ö.F. and Sezgin, H. (2017). The Effects Of Financial Ratios On Firm Value: A Panel Data Analysis For Borsa Istanbul It Sector, Journal of Management and Economic Research. 15(3),25-41. Birgili, E. and Düzer, M. (2010). The Relationship Between The Rates Which Are Used In Financial Analysis And Firm Value An Application in Istanbul Stock Exchange. Journal of Accounting and Finance, (46) 74- 83. Breusch, T., and Pagan, A. (1980). The Lagrange Multiplier Test and Its Applications to Model Specification Tests in Econometrics. Review of Economic Studies (47), 239-253. Büyükşalvarcı, A. (2010). The Analysis of Relationships between Financial Ratios and Stock Returns: A Research on ISE Manufacturing Sector. Journal of Accounting and Finance, (48), 130-141. Chowdhury, A and Chowdhury, S. P. (2010). Impact of Capital Structure on Firm’s Value: Evidence from Bangladesh. Business and Economic Horizons, 3(3), 111-122. Ercan, M. K. and Üreten, A. (2000). Firm Value Determination and Management. Gazi Publishing: Ankara. Gümüş, T.U., Şakar, Z., Akkın, G. and Şahin, M. (2017). The Ratios Used in Financial Analysis and Firm Value Relations: An Analysis on Cement Company In BIST Index. Journal of Black Sea Social Sciences. (9)16. Gill, A. and Mathur, N. (2011). Board Size, CEO Duality, and the Value of Canadian Manufacturing Firms. Journal of Applied Finance and Banking, 1(3), 1-13. Gujaratı, Damodar N. (2001). Basic Econometrics. (Trans., Ü. Şenesen ve G. Şenesen), 2. Baskı, İstanbul: Literatür Publishing. Güriş, S., Çağlayan, E., and Güriş, B. (2011). Basic Econometrics with Eviews. İstanbul: Der Publishing.
22

Uşak Üniversitesi Sosyal Bilimler Dergisi Aslı Afşar – Emine Karaçayır
Hausman, J. A. (1978). Specification Test in Econometrics. Econometrica, 46(6): 1251-1271. Korkmaz, Ö. and Dilmaç, M. (2018). Factors Affecting Firm Stock Market Value: An Application on Bank And Insurance Firms. Journal of Management and Economic Research, 16(2),179-201. Küçükkaplan, İ. (2013). The Endogenous Variables Explaining the Market Value of Manufacturing Firms in the ISE: A Sectoral Level Panel Data Analysis for Sectors. Journal of Eskişehir Osmangazi University, 8(2), 161-182. Lin, F.L. and Chang, T. (2011). Does Debt Affect Firm Value in Taiwan? A Panel Threshold Regression Analysis. Applied Economics, (46), 117-128. Meder, H. (2000). Firm Value and Application on Firm in Denizli. (Unpublished Phd Thesis). Adnan Menderes University Institute of Social Sciences, Denizli. Savsar, A. (2012). The Relationship Between Financial Ratios and Firm Value and An Application in the Istanbul Stock Exchange. (Unpublished Master Thesis). Gaziosmanpaşa University Institute of Social Sciences, Tokat. Pesaran, M. (2007). A Simple Panel Unit Root test in the Presence of Cross Section Depence. Journal of Applied Econometrics, 22(2), 265-312. Schularick, M. and Steger, T. M. (2010). Financial Integration, Investment, And Economic Growth: Evidence From Two Eras Of Financial Globalization. The Review Of Economics And Statistics, 92(4): 756-768. Tarı, R. (2011). Econometrics, Umuttepe Publishing: Kocaeli. Tatoğlu, Y. (2013). Panel Data Econometrics Applied to Stata. İstanbul: Beta Publishing. Usta, Ö. (2012). Business Finance and Financial Management. Ankara: Detay Publishing.
23

Uşak Üniversitesi Sosyal Bilimler Dergisi Aslı Afşar – Emine Karaçayır
Ad.Data on the companies discussed in the study
No Company CompanyCode No Company
CompanyCode No Company
CompanyCode No Company
CompanyCode
1 Adana Çimento (A) ADANA 26 Bossa BOSSA 51 Good-Year GOODY 76 Otokar OTKAR
2 Adana Çimento (B) ADBGR 27 Brisa BRISA 52
GöltaşÇimento GOLTS 77
Park Elek.Madencilik PRKME
3 Adana Çimento (C) ADNAC 28 Burçelik BURCE 53
Gübre Fabrik. GUBRF 78 Parsan PARSN
4 Adel Kalemcilik ADEL 29
Componenta Dökümcülük COMDO 54 Hektaş HEKTS 79
PenguenGıda PENGD
5 AfyonÇimento AFYON 30 ÇelikHalat CELHA 55
HürriyetGzt. HURGZ 80 Petkim PETKM
6 Akçansa AKCNS 31 Çemtaş CEMTS 56 İhlasEvAletleri IHEVA 81
Pınar Et Ve Un PETUN
7 AkınTekstil ATEKS 32 Çimbeton CMBTN 57
İzmir Demir Çelik IZMDC 82 PınarSu PINSU
8 Aksa AKSA 33 Çimentaş CMENT 58 İzocam IZOCM 83 PınarSüt PNSUT
9 AlarkoCarrıer ALCAR 34 Çimsa CIMSA 59 Kaplamin KAPLM 84 Sarkuysan SARKY
10 AlkimKağıt ALKA 35 DemısaşDöküm DMSAS 60
KarsanOtomotiv KARSN 85
Sasa Polyester SASA
11 Anadolu Cam ANACM 36 Denizli Cam DENCM 61
KarsuTekstil KRTEK 86 Soda Sanayii SODA
12 Anadolu Efes AEFES 37 Derimod DERIM 62 Kartonsan KARTN 87 Söktaş SKTAS
13 Anadolu Isuzu ASUZU 38 Deva Holding DEVA 63 Kent Gıda KENT 88
Sönmez Pamuklu SNPAM
14 Arçelik ARCLK 39 DitaşDoğan DITAS 64 Klimasan Klima KLMSN 89 T.Tuborg TBORG
15 Arsan Tekstil ARSAN 40 Doğusan DOGUB 65
KonfrutGıda KNFRT 90 Tat Gıda TATGD
16 Aslan Çimento ASLAN 41
Duran DoğanBasım DURDO 66
Konya Çimento KONYA 91
Tofaş Oto. Fab. TOASO
17 Aygaz AYGAZ 42 Dyo Boya DYOBY 67 Kordsa Global KORDS 92 Trakya Cam TRKCM
18 Bagfaş BAGFS 43 EgeEndüstri EGEEN 68 Kristal Kola KRSTL 93 Tukaş TUKAS
19 BakAmbalaj BAKAB 44 EgeGübre EGGUB 69 KütahyaPorselen KUTPO 94 Tüpraş TUPRS
20 Banvit BANVT 45 EgeProfil EGPRO 70 MardinÇimento MRDIN 95
UşakSeramik USAK
21 BatıÇimento BTCIM 46 EgeSeramik EGSER 71 Marshall MRSHL 96 ÜlkerBisküvi ULKER
22 BatısökeÇimento BSOKE 47
Ereğli Demir Celik EREGL 72
Menderes Tekstil MNDRS 97
ÜnyeÇimento UNYEC
23 BirlikMensucat BRMEN 48 Ford Otosan FROTO 73
MerkoGıda MERKO 98 Vestel VESTL
24
Borusan Mannesmann BRSAN 49 Gentaş GENTS 74
Mondi Tire Kutsan TIRE 99 Yataş YATAS
25
Bosch FrenSistemleri BFREN 50 GersanElektrik GEREL 75
Olmuksan-IP OLMIP 100 Yünsa YUNSA
24

Uşak Üniversitesi Sosyal Bilimler Dergisi Aslı Afşar – Emine Karaçayır
25