Embed Size (px)
Citation preview
EFFECT OF FINANCIAL LITERACY ON PERSONAL FINANCIAL
MANAGEMENT ON KENYA REVENUE AUTHORITY EMPLOYEES
IN NAIROBI
BY
BONFACE OLIMA
REG. NO. D61/P/9107/2001
A MANAGEMENT RESEARCH PROJECT SUBMITTED IN PARTIAL
FULFILMENT OF THE REQUIREMENT OF THE DEGREE OF MAST ERS OF
BUSINESS ADMINISTRATION (MBA) UNIVERSITY OF NAIROBI
October 2013
ii
DECLARATION
This research project is my original work and has not been presented to any other
University or college.
Name: BONFACE OLIMA
Sign…………………………………………
Date: ……………………………………….
Declaration by supervisor
This research project has been submitted with my approval as the student’s Supervisor
Supervisor Name: DR JOSIAH O. ADUDA
Senior Lecturer and Chairman,
Department of Finance and Accounting,
University of Nairobi.
Signature…………………………………
Date: …………………………………….

iii
ACKNOWLEDGEMENTS
My sincere thanks go to my parents, Andrew W. Ipaat and Prisca Ibere who brought me
up and educated me under those difficult conditions, my brothers & sisters for their moral
support. My wife Joanne, my daughter Ibere and my son Ipaat for their patience and
continued love during the long hours of absence during the course.
I cannot forget to thank my employer Kenya Revenue Authority for sponsoring me for
this course without which it would have been very difficult for me to raise the finances
required.
I also wish to thank my classmates especially Ogare, Mutua, Auch, Waithera, Bitutu and
Chege just to mention a few. Their sharing of knowledge and team work was very
enlightening.
My appreciation also goes to my supervisor Dr. Josiah Aduda O for his guidance and
constructive criticism, other University staff for their hard work and dedication and the
University Of Nairobi management for providing a conducive environment for the
course.
Finally thanks go to the almighty God for life, love and protection since the start of my
life.
iv
ABSTRACT
Current economic conditions in the world over have raised serious concerns about
individuals’ financial security. Financial literacy is the possession of knowledge and
understanding of financial matters. The objectives of the study, was to establish the level
of financial literacy of Kenya Revenue Authority employees and establish the effect of
financial literacy on saving practices and social security planning of Kenya Revenue
Authority employees. The study used primary data collected from semi-structured
questionnaires. Quantitative data was analysed using descriptive statistics while
qualitative data was analysed using content analysis. Statistical Packages for Social
Scientists (SPSS Version 17.0) was used. The study also used multiple regression
analysis to establish the relationship between financial literacy and personal financial
management. The study findings indicated that financial literacy impacts to a great extent
on the financial management because financial education programs guide program
development and refinement. The programs to be developed will be aimed at increasing
the level of financial literacy on the aspects considered in this study which included
retirement planning, estate planning, management of credit and other liabilities, insurance
and tax planning.
The study findings indicate that generally financial literacy to a great extent affects
personal financial management among the respondents. However, most participants
considered retirement planning less important, were less aware of the effects of estate
planning, insurance planning and tax planning. The respondents also were less literate on
the effects of good credit and other liabilities hence making poor financial decisions on
this aspect of financial management.
The research findings imply that there is need to come up with elaborate and detailed
education programs to address the aspects that the respondents were less aware of and
less literate on that is; effects of estate planning, insurance planning tax planning and
effects of good credit and other liabilities. There is also need to replicate the study among
KRA employees across the country, other organisations and over time to make the
findings more representative and objective.

v
TABLE OF CONTENT
DECLARATION............................................................................................................... ii
ACKNOWLEDGEMENTS ............................................................................................ iii
ABSTRACT...................................................................................................................... iv
CHAPTER ONE ............................................................................................................... 1
Introduction......................................................................................................................... 1
1.1 Background of the Study .......................................................................................... 1
1.1.1 Financial Literacy .............................................................................................. 1
1.1.2 Personal Financial Management ........................................................................ 2
1.1.3 Financial Literacy and Personal Financial Management ................................... 3
1.1.4 Kenya Revenue Authority.................................................................................. 4
1.2 Statement of the Research Problem .......................................................................... 5
1.3 Research Objective ................................................................................................... 7
1.4 Value of the Study .................................................................................................... 7
CHAPTER TWO .............................................................................................................. 9
LITERATURE REVIEW ................................................................................................ 9
2.1 Introduction............................................................................................................... 9
2.2 Review of Theories ................................................................................................... 9
2.2.1 Modern Portfolio Theory ................................................................................... 9
2.2.2 Learning Theory............................................................................................... 11
2.2.3 Piaget’s Cognitive Theory ............................................................................... 11
2.3 Financial Literacy and Personal Financial Management ........................................ 12
2.4 Empirical Review.................................................................................................... 13
2.5 Chapter Summary ................................................................................................... 18
CHAPTER THREE........................................................................................................ 20
RESEARCH METHODOLOGY ..................................................................................20
3.1 Introduction............................................................................................................. 20
3.2 Research Design...................................................................................................... 20
3.3 Population ............................................................................................................... 20
3.4 Sampling Technique ............................................................................................... 20
3.5 Data Collection Procedure ...................................................................................... 21
vi
3.5.1 Data Validity and Reliability ........................................................................... 21
3.6 Data Analysis .......................................................................................................... 22
CHAPTER FOUR........................................................................................................... 24
DATA PRESENTATION AND ANALYSIS................................................................ 24
4.1 Introduction............................................................................................................. 24
4.2: Data Presentation ................................................................................................... 24
4.2.1 Demographic Information-Gender................................................................... 24
4.2.2 Demographic Information-Age bracket of the respondents............................. 25
4.2.3 Demographic Information-Duration of Employment at KRA......................... 26
4.2.4 Demographic Information-Level of Education................................................ 27
4.2.5 Demographic Information-The Current KRA Grade....................................... 28
4.2.6 Extent of Respondent Knowledge on financial literacy .................................. 28
4.2.7 Aspects of Financial Management................................................................... 30
4.2.8 Retirement Plan................................................................................................ 32
4.2.9 Estate Planning................................................................................................. 33
4.2.10 Credit and Other Liabilities ........................................................................... 34
4.2.11 Insurance Cover ............................................................................................. 34
4.2.12 Tax Return ..................................................................................................... 36
4.2.13 Personal Financial Management ................................................................... 36
4.2.14 Financial Management Practices ................................................................... 37
4.2.15 Correlation Analysis ...................................................................................... 38
4.2.16 Regression Model Summary.......................................................................... 39
4.2.17 Chi-Square test of the personal financial management.................................. 42
4.3 Summary and interpretation of findings ........................................................... 439
CHAPTER FIVE ............................................................................................................ 47
SUMMARY, CONCLUSIONS AND RECOMMENDATIONS ........... ..................... 47
5.1 Summary................................................................................................................. 47
5.2 Conclusions............................................................................................................. 48
5.3 Policy recommendations......................................................................................... 49
5.4 Limitations of the study .......................................................................................... 50
5.5 Suggestaions for further studies.............................................................................. 50

vii
REFERENCES................................................................................................................ 52
APPENDIX II: RESEARCH QUESTIONNAIRE ...................................................... 58
viii
LIST OF FIGURES
Figure 4. 1: gender ............................................................................................................ 24
Figure 4. 2: Age ................................................................................................................ 25
Figure 4.3: Duration of Employment at KRA .................................................................. 26
Figure 4.4: Education Level.............................................................................................. 27
Figure 4.5: The Current KRA Grade ................................................................................ 28
ix
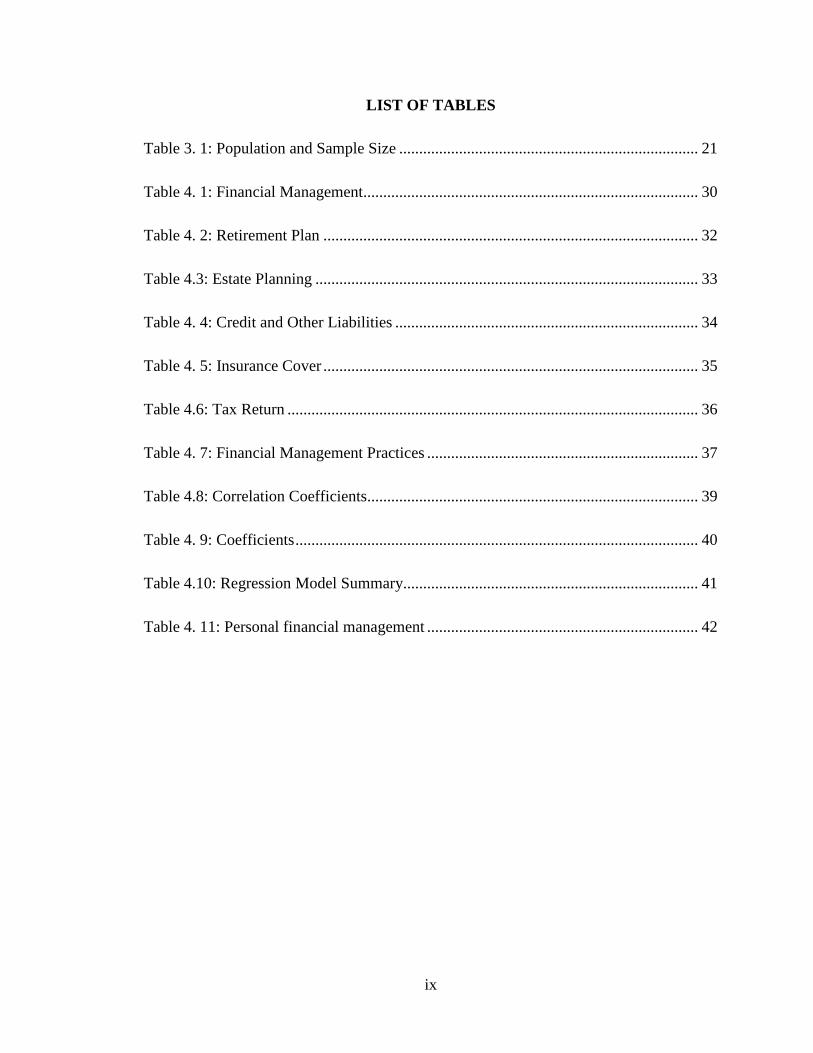
LIST OF TABLES
Table 3. 1: Population and Sample Size ........................................................................... 21
Table 4. 1: Financial Management.................................................................................... 30
Table 4. 2: Retirement Plan .............................................................................................. 32
Table 4.3: Estate Planning ................................................................................................ 33
Table 4. 4: Credit and Other Liabilities ............................................................................ 34
Table 4. 5: Insurance Cover .............................................................................................. 35
Table 4.6: Tax Return ....................................................................................................... 36
Table 4. 7: Financial Management Practices .................................................................... 37
Table 4.8: Correlation Coefficients................................................................................... 39
Table 4. 9: Coefficients..................................................................................................... 40
Table 4.10: Regression Model Summary.......................................................................... 41
Table 4. 11: Personal financial management .................................................................... 42
x
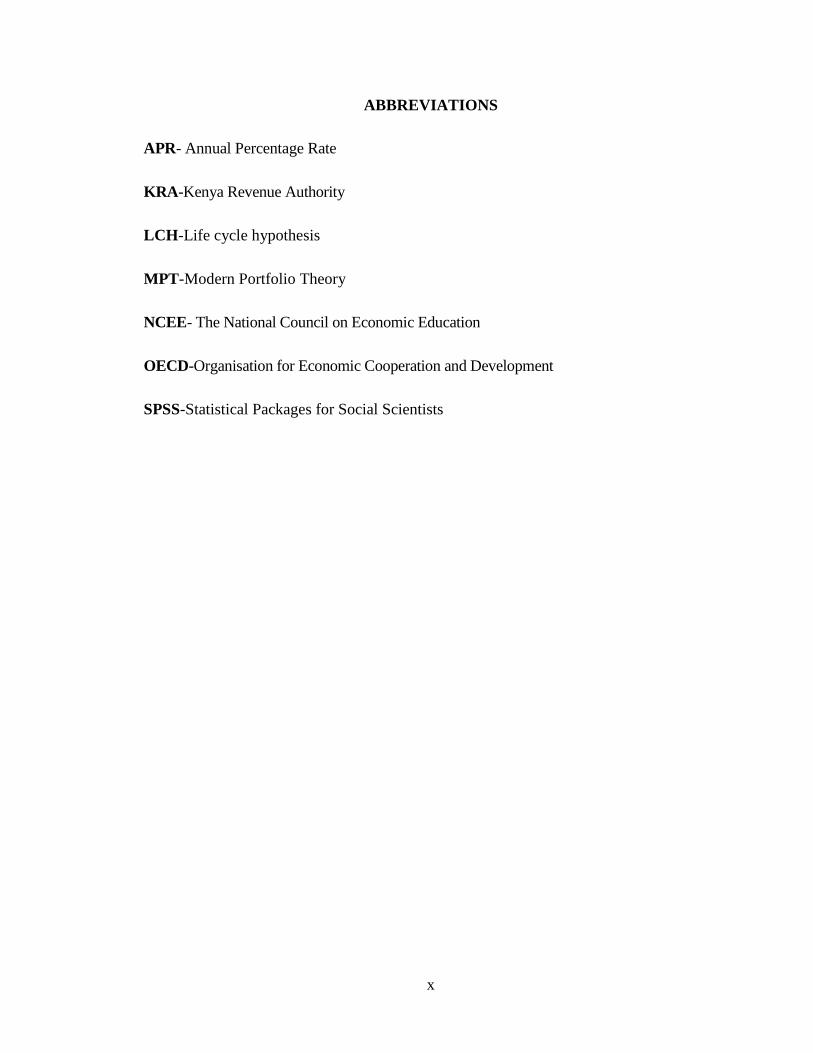
ABBREVIATIONS
APR- Annual Percentage Rate
KRA -Kenya Revenue Authority
LCH -Life cycle hypothesis
MPT -Modern Portfolio Theory
NCEE- The National Council on Economic Education
OECD-Organisation for Economic Cooperation and Development
SPSS-Statistical Packages for Social Scientists
1
CHAPTER ONE
Introduction.
1.1 Background of the Study
Current economic conditions in the world over have raised serious concerns about
individuals’ financial security, especially for those who lack the skills and resources to
withstand financial market downswings and take advantage of upswings. Individuals are
taking responsibility for a growing number of financial decisions. Among the most important
arguably being the purchase and financing of a home and preparing for retirement (Anthes,
2004). Conceptually, poor financial decision making is surprisingly a widespread
phenomenon in many Nations. This problems are always unnoticed for a long time before a
crisis is reached hence the systemic effects and the costs of preserving stability may be
sizable, as demonstrated by the ensuing financial market turmoil and subsequent
interventions after the financial crises that included bailing out of private companies by the
various governments in Europe and United States of America (Gerrit, 2008).
Households in general and especially workers and retirees have increasingly been asked to
take on an unprecedented degree of responsibility for their retirement and other saving, as
defined benefit pensions decline and government programs face insolvency in one country
after another. As a result, consumers are now faced with the need to make several financial
decisions in regard to a wide range of financial products ranging from insurance pension
plans like group and regular Individual Retirement Accounts, phased withdrawal plans to
annuities, and many more. This process implies that it is becoming ever more important for
households to acquire and manage economic know-how (Arkes, 1991).
1.1.1 Financial Literacy
Schreiner, (2007) terms financial literacy as the possession of knowledge and
understanding of financial matters. Financial literacy is mainly used in connection with
personal finance matters. Financial literacy often entails the knowledge of properly
making decisions pertaining to certain personal finance areas like real estate, insurance,
investing, saving (especially for college), tax planning and retirement. It also involves
2
intimate knowledge of financial concepts like compound interest, financial planning, the
mechanics of a credit card, advantageous savings methods, consumer rights, time value
of money (Mark, 2007).
1.1.2 Personal Financial Management
Finance may be defined as the art and science of managing money. The major areas of
finance are: (1) financial services and (2) managerial finance/corporate finance/financial
management. While financial services is concerned with the design and delivery of
advice and financial products to individuals, businesses and governments within the areas
of banking and related institutions, personal financial planning, investments, real estate,
insurance and so on, financial management is concerned with the duties of the financial
managers in the business firm. Financial managers actively manage the financial affairs
of any type of business, namely, financial and non-financial, private and public, large and
small, profit-seeking and not-for-profit. They perform such varied tasks as budgeting,
financial forecasting, cash management, credit administration, investment analysis, funds
management and so on. In recent years, the changing regulatory and economic
environments coupled with the globalisation of business activities have increased, the
complexity as well as the importance of the financial managers' duties. As a result, the
financial management function has become more demanding and complex (John ,2006).
Financial management on the other hand has been defined by Pandey (1999) as that
managerial activity that is concerned with the planning and controlling of a firm’s financial
resources. The resources under consideration include assets both tangible like machinery,
inventory, cash debtors and intangible like patents and goodwill. It also includes managing the
firm’s indebtedness in order to minimise the cost of doing business. This definition is
applicable to households and individuals as well since there is need for planning and
controlling households’ and individuals resources for wealth creation, financial stability and
peaceful retirement.
As people become more literate they become increasingly more financially sophisticated and
it is assumed that this may also mean that an individual may be more competent. Mandell
(2007) on the other hand asserts that it is the ability to evaluate the new and complex
3
financial instruments and make informed judgments in both choice of instruments and extent
of use that would be in their own best long-run interests. The National Council on Economic
Education (NCEE) (2005) on the other hand defines financial literacy as familiarity with
basic economic principles, knowledge about the U.S. economy, and understanding of some
key economic terms
1.1.3 Financial Literacy and Personal Financial Management
Managing personal finances is a crucial and often difficult issue. Personal debt continues
to rise (Bennett, 2006), bankruptcy rates are uncertain due to recent changes in
bankruptcy legislation, while the personal savings rate remains in the red at negative
1.5% in June 2006 in developing nations. In The Bankruptcy Abuse Prevention and
Consumer Protection Act of 2005 requires consumers who file bankruptcy to complete a
personal financial management class before the bankruptcy can be discharged, suggesting
that more knowledge will help avoid future financial difficulties (White, 2005).
Educators believe that financial education leads to improved financial literacy and
financial security for families (Garman, 1999). There has been an increase in interest in
how financial education can equip individuals with the skills needed to avoid financial
problems and recover from the consequences of extreme debt such as bankruptcy.
Researching the effectiveness of financial education programs can guide program
development and refinement (Hilgert, Hogarth, & Beverly, 2003) and help educators find
a method for dealing with community needs related to family financial management.
Research on successful financial education methods is scarce (Financial Literacy and
Education Commission, 2006), and even though some research suggests that use of sound
financial practices can provide families with greater wealth accumulation (Beutler &
Mason, 1987; Hira; 1987; Titus, Fanslow, & Hira, 1989), it is unclear whether there is a
direct relationship between education and improved economic well-being (Braunstein &
Welch, 2002). Financial literacy programs are designed with the goal of helping
individuals adopt sound financial practices that promote economic health and improved
quality of life. It is important to know if that goal is being met. The purpose of the study
4
reported here was to explore one state's experience in helping adults improve their
financial management practices through financial education programs.
1.1.4 Kenya Revenue Authority
Kenya Revenue Authority (KRA) is a state corporation established by an act of
Parliament of July 1st, 1995 Cap 469 as a central body. The authority is charged with the
responsibility of collecting revenue on behalf of the government of Kenya. The authority
is under the general supervision of the Minister of Finance (Treasury). The Authority’s
mandate and core business is to assess, account and administrate and enforce all the laws
relating to revenue. KRA’s role is assessment, collection, administration and enforcement
of laws relating to revenue; restoring economic independence be it elimination of budget
deficits and creating organisation structures that maximize revenue collection. Since
KRA plays an important role in the economy i.e. contributing Kshs. 360 billion in
financial year 2006/07 , and contributing Kshs. 274 billion in financial year 2007/08,
which accounted for over 93% of total government revenue, with the rest coming from
development partners (KRA’s Third Corporate Plan 2009/10-2011/12). Consequently the
funds collected being used to run the economy, providing the Kenyan public with goods
and services throughout the country, which includes sustaining the Health sector,
Education and Infrastructure among others. As society changes, the skills needed to deal
with the complexities of life also change. The meaning of skills like financial literacy
may change to reflect context, or current realities. Financial literacy, however, is about
empowerment, the ability to access, manage, integrate, evaluate, and create information
in order to function in a knowledge society (Ndemo, 2002).
The vision articulated by the KRA journal states, each employee in KRA need to learn
financial literacy concepts, enabling them to succeed in a complex global environment.
The essential concepts and skill sets for financial literacy address the requirements
outlined in KRA statute. They also reflect broader, universal skills that cultivate critical
thinking and responsible citizenship. They provide us the framework and knowledge to
be proactive. When we accept responsibility for our actions because they have
consequences for other people as well as for our personal success, we will also
5
understand what it means to solve the problems and face the collective challenges of an
increasingly diverse and interconnected world.
Employees of KRA become attractive for research in this area as they comprise of over
4000 employees with varied diversity. The diversity is in areas of age, education
background, hierarchy in the organization and varied financial literacy levels. It is also
attractive as KRA is not a financial or banking institution which makes it different from
the organization covered by the study by Nyamute and Monyoncho (2008) in terms of
expected attention to financial knowledge through every day work and training-
1.2 Statement of the Research Problem
Significant debate continues about the role of financial literacy, the extent of the problem it
truly represents, and the best way to address it because: First, real knowledge gaps persist
about fundamental relationships between literacy, education and behaviour, partly because
researchers lack the appropriate data. Few studies have been able to construct sophisticated
measures of financial literacy and definitively establish causal links between financial
education, literacy and behaviour.
Financial literacy among KRA employees is closely connected to an individual’s
emotional, personal, social, economic, and employment success. An individual needs to
understand the basics of money management, and use financial resources appropriately to
function well in society at a personal, professional, business and community level. In a
broader sense, KRA employees need to identify and discuss significant economic issues,
important to society and to the world. They should practice examining the consequences
of change in economic conditions and public policies (Century, 2003). The issues that
would be expected to concern any person including the KRA employees include the best
savings opportunities for future consumption and security, retirement planning, tax
planning which include issues to do with tax returns and prudent cash management which
includes proper management of personal credit facilities.
Empirical studies have confirmed the positive association between financial knowledge and
household financial decision making. For example Hilgerth, Hogarth, and Beverly (2003)
6
document a positive link between financial knowledge and financial. Agarwal, Driscoll,
Gabaix and Laibson (2007) show that financial mistakes are most prevalent among the
young and elderly, who are also those displaying the lowest amount of financial knowledge
and cognitive ability
Various local studies have been done on this line with various findings. Kempson et al.
(2008) carried out a study on Measuring and improving financial capability to know more
about current levels of financial capability in Kenya, to understand the potential approaches
that could be taken to measure financial capability in a less developed nation where the vast
majority of the population does not use formal banking services and to explore levels of
financial inclusion in Kenya. It relied on the ways in which financial capability has been
measured in various countries, and to review evidence from Kenya and elsewhere on the
most appropriate objectives of financial education and consider how financial capability
education could be prioritised in Kenya to ensure the largest gains. Research undertaken as
part of the Financial Education for the Poor Project with partners in India, Morocco, South
Africa, Kenya and Bolivia also found that poor people have a limited knowledge of financial
planning for the future (Cohen, et al., 2006).
Nyamute and Monyoncho (2008) surveyed Employees of finance and banking institutions
and concluded that the practices of those perceived to be financially literate seem to agree
with the current literature. However, survey findings also showed that even those perceived
not to be financially literate exhibit some strong characteristics of personal financial
management implying that probably, formal college education and employment environment
may not be the only source of financial education.
This study seeks to find out if there have been any changes on the financial literacy
situation among Kenyan households since the year 2008 when earlier studies were carried
out. It also seeks to find out the level of financial literacy for employees of KRA which is
an institution that is not a financial or banking institution and the effect on their financial
management. Finally, this study shall fill in those gaps by trying to investigate to whether
there is need for policy makers and organisations to formulate deliberate saving and
retirement strategies, academicians to formulate relevant education curriculum for
7
financial literacy in Kenya by establishing the gaps in knowledge as far as financial
literacy is concerned. Therefore, this study seeks to answer the question; what are the
Effects of Financial Literacy on Personal Financial Management on Kenya Revenue
Authority Employees in Nairobi?
1.3 Research Objective
The objectives of the study were:-
i. To establish the level of financial literacy of Kenya Revenue Authority
employees;
ii. To establish the effect of financial literacy on saving practices and social security
planning of Kenya Revenue Authority employees.
1.4 Value of the Study
This study will be important to the following users
a) Policy makers
The Policy makers will benefit immensely due to the following reasons. To formulate
programs to promoting saving and financial security including during retirement having
in mind the findings from the researches shown below. Due to the research findings,
policy makers will be able to use the gaps in the literacy of the respondents to formulate
appropriate education syllabus in order to increase financial literacy leading to better
financial management. This is important as shown by Bernheim and Garrett (2003) who
argue that seminars are often remedial, that is offered in firms where workers do little or no
saving.
b) Employees and employers
The study will be invaluable to the employees and employers. Strategies can be
formulated to promote savings for wealth creation and retirement like to automatically
enrol workers into employer-provided pension plans. This simple but ingenious method has
been proven to be very effective in increasing pension participation. For example,
8
according to Madrian and Shea (2001), after a company implemented a change in its
pension plan and automatically enrolled its new hires in the plan, pension participation
went from 37% to 86%.
By finding out the actual state of financial literacy individuals will be able to be
challenged to seek for information to improve their knowledge for better savings for
wealth creation and retirement planning.
c) Academicians
The findings will add to the wide academia knowledge in finance especially on financial
literacy on personal financial management. The researchers and academicians will find
this study useful for further discussion and research so that they can explore and further
develop their studies on financial literacy on personal financial management.
d) Individuals and their households
The findings will be useful to individuals and their households in getting advising about
the importance of deferent aspects of financial literacy on personal financial management
to safeguard their future welfare. In addition, they will be in a better position to predict
the deferent financial investment opportunities available.
e) Pension Schemes, mortgage companies
Pension Schemes and mortgage companies will deliver best information to borrowers who
always display a weak understanding of mortgages and interest rates. The firms shall find
useful information to conclude as to reasons why younger people, those in low social
classes, and those with low incomes, are the least sophisticated financial consumers.
9
CHAPTER TWO
LITERATURE REVIEW
2.1 Introduction
The purpose of this segment of the research is to determine how behaviour theory can be
applied to provide insight regarding financial behaviour. In order to motivate financial
behaviour change, better understanding is needed about how behaviours are formed and
how to help consumers change undesirable financial behaviours and develop positive ones.
This section also looks at the studies that have been carried out so far to address research
gaps from the theories put forward so far and in the literature.
2.2 Review of Theories
The theoretical framework used to model consumption and saving decisions posits that
rational and foresighted consumers derive utility from consumption over their lifetimes. In
the simplest format, the consumer maximizes a lifetime expected utility subject to an inter-
temporal budget constraint.
2.2.1 Modern Portfolio Theory
The choice between the wide varieties of investment alternatives to achieve optimal
personal portfolios ushers in the role of modern portfolio theory (MPT). These three
frameworks: lifecycle, MPT and sociological bases of wealth holding find wide
application in this discourse. In contrast to the egalitarian concerns for wealth holding at
the macro level, the focus of studies at the micro level is on the specifics of personal
wealth portfolios. One such area of interest is the accumulation/deccumulation of
personal wealth and its underlying determinants especially in the family lifecycle
framework, and more recently sociology. This is usually tied to a second phenomenon
where the academic curiosity is the form in which wealth is held by individuals and
households and its adequacy to support similar standards of living after retirement.
Pioneering micro-level studies of personal wealth portfolios were an offshoot from
consumption theories that were put forward by welfare/financial economists as well as
investment theories of scholars in finance. In this respect, the main consumption theories
10
include the classical theory by Keynes (1936) with its promulgation that current
consumption expenditure is a stable function of current income; the relative income
hypothesis of Duesnberry (1949) which theorized that people are concerned with relative
and not absolute consumption and the permanent income hypothesis of Friedman (1956)
which postulated that permanent consumption by consumers is determined by their
person’s permanent income. On the other hand, studies that are cantered on the
investment aspect of personal wealth tend to be dominated by modern portfolio theory as
championed by Professor Harry Markowitz.
Informed by finance theory, the seminal paper on MPT by Markowitz (1952) provided
researchers with a set of quantitative tools for prescribing how investors should combine
their financial assets to maximize return for a given risk thus emphasizing on the nature
and mix of wealth held. Research in this field received a significant boost in the 1990s
following the compilation and availability of monthly and annual return data for typical
assets such as shares in listed companies, bonds and housing as well as estimates of
annual inflation rates. A central aspect of MPT, is that the enthusiasts proposed that every
investor should hold an optimal portfolio that is fully diversified.
Almost working in parallel, the thrust of studies by economists in the latter half of the
20th Century was an attempt to gain insight into the life cycle of household economic
behaviour, namely income, savings, consumption and wealth. These studies examined
personal wealth accumulation and its determinants on the foundation of saving and
consumption theory. In this line of inquiry, the life cycle hypothesis (LCH ) of
Modigliani and Blumberg (1954) appears to have gained wider acceptance in its
proposition that age is the most important determinant of a person’s wealth and that it
(wealth) follows a hump-shape to a person’s age; rising during the youthful age, peaking
just before retirement and declining thereafter. Ando and Modigliani (1963) expands
these works and develops the life cycle hypothesis of saving where they test empirical
data to show that savings, a necessary precursor to wealth also follows a hump shape to
age.
11
2.2.2 Learning Theory
Learning theory evolved most notably with the work of Skinner who determined that once
the behaviour is associated with a consequence, whether a reinforce or punishment, the
likelihood of the action continuing changes. Skinner argued that positive reinforcement and
punishment are not equal; with the former providing longer lasting results and the latter
having negative side effects (Skinner 1953).
Critics of learning theory question the greater scientific basis of behaviourism over
psychosocial or psychoanalysis theory and the ability to explain complex human behaviours
by only considering the observable and ignoring the important roles of cognitions and
emotions (Breger and McGaugh 1965). Additionally, because behavioural experiments often
take place in the laboratory, critics question learning theory’s application to describing
behaviour that occurs in a social reality (Bandura 1977).
Nevertheless, learning theory advanced investigations of human behaviour by focusing
attention on the observable, thus emphasizing the importance of testing behaviour
propositions. It acknowledges the power of prerequisite conditions and the anticipated
consequences, whether positive or negative, in influencing people’s actions. Thus, in contrast
to theories that emphasized the power of early development, learning theory emphasizes the
possibility of lifelong learning during which the stimulus for or the consequences of
behaviours can be altered (Crain 1992; Goldhaber 2000).
2.2.3 Piaget’s Cognitive Theory
Cognitive theory’s interest is in the cognitive processes that lie between the observed cause
and its effect on behaviour. From observing the thinking and actions of children, Jean Piaget
argued that what actually elicits a response is both the sensitization to the stimulus and how
people think (Byrnes 2008). Central to Piaget’s theory is his view of how individuals gained
knowledge, arguing that it occurred from interaction, first physically and then mentally, with
objects. He was convinced that, ‘in order to know objects, the subject must act upon them,
and therefore transform them. He must displace, connect, combine, take apart, and
reassemble them (Piaget, 1983)
12
Cognitive theory also hypothesized developmental stages of which there were four
(Goldhaber 2000; Piaget 1983). Each stage is constructed by the individual and is achieved at
his/her own pace. However, no stage can be skipped, resulting in some individuals never
making it to the final cognitive development stage (Crain 1992; Goldhaber 2000; Piaget
1983). It is in the third stage of development that the capacities, such as use of logic and
ability to follow rules, are formed. These capacities are essential to making financially sound
decisions. However, it is only in the last stage, which may never be achieved, that the
individual develops the ability to think abstractly and manage hypothetical situations (Crain
1992). With the ability to plan ahead and think through all possibilities, these individuals are
at a greater advantage when it comes to financial decision making. Memory, or the retrieval
to information, plays an important part (Bruner 1988).
No single theory provides a comprehensive view of how financial decisions are made. Each
draws on observable variations in decision making to offer hypothesized reasons for
differences in the use of information by individuals. To different degrees and with different
emphases, the combination of theories confirms the emotional, cognitive, behavioural,
physiological, and cultural forces that shape decisions. Although the most advantageous
decision may be mechanistically evident, individuals bring values, misperceptions, fears, and
community shared goals to their decisions.
2.3 Financial Literacy and Personal Financial Management
From a broader perspective, market operations and competitive forces are compromised
when consumers do not have the skills to manage their finances effectively. Informed
participants help create a more competitive, more efficient market. As knowledgeable
consumers demand products that meet their short- and long-term financial needs,
providers compete to create products having the characteristics that best respond to those
demands. As concern about financial literacy has increased, so too have the number and
variety of financial literacy training programs and program providers, some offering
comprehensive information on savings, credit, and similar topics for a broad audience
and others tailored to a specific group, such as youth or military personnel, or focused on
a specific goal, such as home ownership or savings.
13
Financial literacy training has been mixed. Although some programs, particularly those
having discrete objectives, have succeeded in improving certain aspects of consumers'
personal financial management such as maintaining a mortgage, increasing savings, or
participating in employer-sponsored benefit plans improved financial behaviour does not
necessarily follow from increased financial information. The timing and format of
training, as well as human traits such as aversion to change play a role in whether
programs will effect positive change that contributes to households' long-term financial
well-being. Accounting for all the variables associated with financial literacy training
when, how, and where it is delivered, who is trained, and what information is presented
poses a great challenge for program developers. Given the resources now devoted to
financial literacy training, this is an opportune time to evaluate the research, identify best
practices, and consider public policy options that would further the goal of creating more
financially savvy consumers.
2.4 Empirical Review
The empirical results indicate that wealth has a positive effect on households’ degree of
financial knowledge, even after controlling for socio demographics and removing wealth
endogeneity. In recent years, financial literacy has gained the attention of a wide range of
major banking companies, government agencies, grass-roots consumer and community
interest groups, and other organizations. Interested groups, including policymakers, are
concerned that consumers lack a working knowledge of financial concepts and do not
have the tools they need to make decisions most advantageous to their economic well-
being. Such financial literacy deficiencies can affect an individual's or family's day-to-
day money management and ability to save for long-term goals such as buying a home,
seeking higher education, or financing retirement. Ineffective money management can
also result in behaviours that make consumers vulnerable to severe financial crises (Crain,
1992).
Earlier studies indicated that workers were woefully uninformed about their pensions and the
characteristics of their pension plans (Mitchell, 1988). Given that most pensions in the past
were defined benefit pensions and workers had to make few or no decisions about their
pension contributions, lack of knowledge is perhaps not surprising.
14
Gustman and Steinmeier (2004) compared the types of pensions that workers report they
have whether defined benefit, defined contribution, or a combination of both with the reports
of employers. He found out that only half of older workers are able to correctly identify the
plan they have. Because errors can abound not only from the reports of workers but also from
the reports of firms. Gustman, Steinmeier and Tabatabai (2007) use different sources of data,
including data from Watson Wyatt, where it is possible to correctly identify the pension type
from firms’ data. They show that it is workers who are most often erroneous and confused
about the type of pensions they have.
A study sponsored by the State of Washington sponsored that surveyed smaller and more
limited samples to assess financial literacy among its residents (Moore, 2003) concluded that
people know the least about financial instruments. Specifically, most respondents did not
know the inverse relationship between bonds prices and interest rates. They were also
uninformed about mutual funds, as many did not know what a no-load mutual fund was, or
that mutual funds do not pay a guaranteed rate of return. More than one-third did not know
that stocks had returned more than bonds over the last forty years, and many did not know
about risk diversification. Finally, a large fraction of these respondents did not understand
interest rates, which was especially troublesome since a subset of the respondents had
applied for loans.
Similar findings are reported by Agnew and Szykman (2005), who devised a financial
literacy survey as part of an experiment held at a mid-size public university in the
Southeast designed in the spirit of a John Hancock Financial Services Defined Contribution
Plan Survey (2002). Their respondents produced similar patterns: college employees,
tourists, parents of students, and local construction workers, all knew little about mutual
funds and they could not explain even simple differences between stocks, bonds, and
money market mutual funds. This research also confirmed conclusions from surveys
conducted by the Employee Benefit Research Institute. For example, their survey in 1996
showed that only 55 percent of workers knew that US government bonds provided lower
returns over the past 20 years, compared to the US stock market.
15
In Europe, Miles (2004) showed that UK borrowers display a weak understanding of
mortgages and interest rates. The UK Financial Services Authority also concluded that
younger people, those in low social classes, and those with low incomes, were the least
sophisticated financial consumers. Christelis, Jappelli, and Padula (2005) documented that
respondents in several European nations scored low on financial numeracy and literacy
scales.
A Japanese consumer finance survey showed that 71% of adult respondents knew little
about equity and bond investments, and more than 50% lacked any knowledge of financial
products (OECD 2005). A Korean youth survey in 2000 conducted by the Jump$tart
coalition showed that young Koreans fared no better than their American counterparts when
tested on economics and finance knowledge, with most receiving a failing grade. Again, a
positive correlation was detected between family income and education, and the students’
performance on the financial literacy test (OECD, 2005).
While financial knowledge is weak, it is also the case that people tend to be more confident
in their abilities than should be warranted. For instance, a German survey conducted by
Commerzbank AG in 2003 found that 80% of respondents were confident in their
understanding of financial issues, but only 42% could answer half of the survey questions
correctly (OECD, 2005). Similar patterns obtain in the United States, the United Kingdom,
and Australia. Indeed, consumer overconfidence regarding their financial knowledge may be
a deterrent to seeking out professional advice, thus widening the ‘knowledge gap’. While the
low levels of financial literacy are troubling in and of themselves, policymakers are most
concerned because of the potential implications of financial illiteracy for economic
behaviour. One example is offered by Hogarth, Anguelov, and Lee (2005), who
demonstrate that low educated consumers are disproportionately represented amongst the
“unbanked,” those lacking any kind of transaction account.
Other authors have also confirmed the positive association between knowledge and financial
behaviour. For example Calvert, Campbell, and Sodini (2005) find that more financially
sophisticated households are more likely to buy risky assets and invest more efficiently.
16
Hilgerth, Hogarth, and Beverly (2003) also document a positive link between financial
knowledge and financial behaviour.
Lusardi and Mitchell (2006) devised a special module on financial literacy for the 2004 HRS.
Adding these types of questions to a large U.S. survey is important not only because it allows
researchers to evaluate levels of financial knowledge but also and, most importantly, because
it makes it possible to link financial literacy to a very rich set of information about household
saving behaviour. The module measures basic financial knowledge related to the workings of
interest rates, the effects of inflation, and the concept of risk diversification. Findings from
this module reveal an alarmingly low level of financial literacy among older individuals in
the United States (50 and older). Only 50% of respondents in the sample were able to
correctly answer two simple questions about interest rates and inflation, and only one-third
of respondents were able to answer correctly these two questions and a question about risk
diversification. Financial illiteracy is particularly acute among the elderly, African-American
and Hispanics, women, and those with low education, a common finding in the surveys of
financial literacy.
Other studies have confirmed the positive association between financial knowledge and
household financial decision making. Hilgerth, Hogarth, and Beverly (2003) document a
positive link between financial knowledge and financial behaviour. Stango and Zinman
(2007) show that those who are not able to correctly calculate interest rates out of a stream
of payments end up borrowing more and accumulating lower amounts of wealth
Campbell (2006) has highlighted how household mortgage decisions, particularly the
refinancing of fixed-rate mortgages, should be understood in the larger context of investment
mistakes and their relation to consumers’ financial knowledge. His findings are confirmed
by Bucks and Pence (2008), who examine whether homeowners know the value of their
home equity and the terms of their home mortgages. They show that many borrowers
underestimate the amount by which their interest rates can change and that low-income,
low-educated households are least knowledgeable about the details of their mortgages
especially those with adjustable rate mortgages. Further evidence of biases is provided by
Stango and Zinman (2006) who well document the systematic tendency of people to
17
underestimate the interest rate associated with a stream of loan payments. The
consequences of this bias are important: those who underestimate the annual percentage
rate (APR) on a loan are more likely to borrow and less likely to save.
Little is still known about the effects of financial advice and whether it can improve financial
decision-making, but there is some evidence that financial counseling can be effective in
reducing debt levels and delinquency rates (Hirad and Zorn, 2001; Elliehausen, Londquist
and Staten, 2007). Mottola and Utkus (2007) also provide evidence in favour of relying on
professionals to manage financial investments. They compare the portfolios of individuals
before and after shifting to a professionally managed account. Those who shifted are not a
randomly chosen group of the population but, nevertheless, the effects are remarkable.
Those who shifted to manage accounts changed their asset allocation dramatically. Most
importantly, their new portfolios did not suffer from several of the mistakes identified in the
finance literature, such as investing too little or too much in the stock market and holding
poorly diversified portfolios (Campbell, 2006).
Garman, Leech and Grable (1996), Joo and Grable (2000) find that in addition to
adversely affecting individuals, poor financial decisions negatively influence productivity
in the workplace. Volpe et al. (2006) surveyed corporate benefit administrators and
identified basic personal finance as a critical area in which employee knowledge is
deficient. They recommend that educational programs should focus on improving
knowledge of basic personal finance.
Locally, studies done by Nyamute and Monyoncho (2008) surveyed Employees of finance
and banking institutions and concluded that the practices of those perceived to be financially
literate seem to agree with the current literature. However survey findings also showed that
even those perceived not to be financially literate exhibit some strong characteristics of
personal financial management implying that probably, formal college education and
employment environment may not be the only source of financial education.
18
2.5 Chapter Summary
Financial literacy surveys in many developed nations show that consumers are poorly
informed about financial products and practices. This is troubling, in that financial illiteracy
may stunt peoples’ ability to save and invest for retirement, undermining their well-being in
old age. It is also concerning that these deficiencies are concentrated among particular
population subgroups - those with low income and low education, minorities, and women -
where being financially illiterate may render them most vulnerable to economic hardship in
retirement.
Given the increased complexity of financial instruments, the evidence of illiteracy raises the
question of whether consumers will appreciate and take advantage of the opportunities
offered by financial markets or more easily fall prey to scams or unscrupulous brokers. No
studies definitively provides an evaluation of the costs of financial education programs and,
without that information, it is not possible to estimate a return on financial education
programs. Moreover, as previous studies show, few employees ever attend education
programs and of those who attend, many do not modify behaviour, at least in the short run.
While these are drawbacks, financial education programs cannot be dismissed.
Information and financial knowledge can affect many financial decisions, not simply saving
for retirement. Moreover, that knowledge may be put to use over long periods of time and
should be evaluated in the long run rather than just in the few months or years after a
program is offered. For example, according to Bernheim, Garrett and Maki (2001), those
who were exposed to financial education programs while in high school were more likely to
save later in life.
Another finding that emerges from both the literature on saving and studies on financial
literacy is that there are specific segments of the population, those with low education and
low income that save in very different ways than other, more educated and affluent
households. It may be important to target these groups and devise programs that are better
tailored to their needs and barriers to saving. There is evidence that existing targeted
programs have had some success in increasing saving among the poor (Schreiner and
Sherraden, 2007). Recognizing that individuals possess limited literacy and do not plan for

19
retirement brings us inevitably to the issue of mistakes. One such program could be to require
people to acquire some basic financial knowledge (Alesina and Lusardi, 2006).
20
CHAPTER THREE
RESEARCH METHODOLOGY
3.1 Introduction
This chapter presents a blueprint that was used in carrying out the research. It includes
the research design, target population, sampling method was used, data collection
instrument and procedure and analysis, interpretation and presentation.
3.2 Research Design
Descriptive research design was adopted as it seeks to determine the level of financial
literacy among KRA staff and how it influences their personal financial management.
Descriptive research design utilizes elements of both quantitative and qualitative research
approaches to establish the what, where and how of a phenomenon (Mugenda, 2008).
Descriptive approach was, thus, enable the study achieve its objectives.
3.3 Population
The population of the study was the employees of KRA based in Nairobi. According to
KRA’s Fifth Corporate Plan 2012/13 - 2014/15, the parastatal has 4571 employees with
about 2000 of them in Nairobi.
3.4 Sampling Technique
To ensure that all levels of employees are represented, the study used stratified random
sampling technique. According to Mugenda (2008), stratified sampling technique is
advantageous since it enables variability within strata to be minimized in case of
heterogonous population.
Thus, the goal of stratified random sampling is to achieve the desired representation from
various sub-groups in the population. Stratified sampling technique has the advantage
allowing the use of different sampling techniques for different subpopulations, hence,
improves the accuracy of representation. The population was stratified into different job
groups from which a sample size of 100 employees was selected.
21
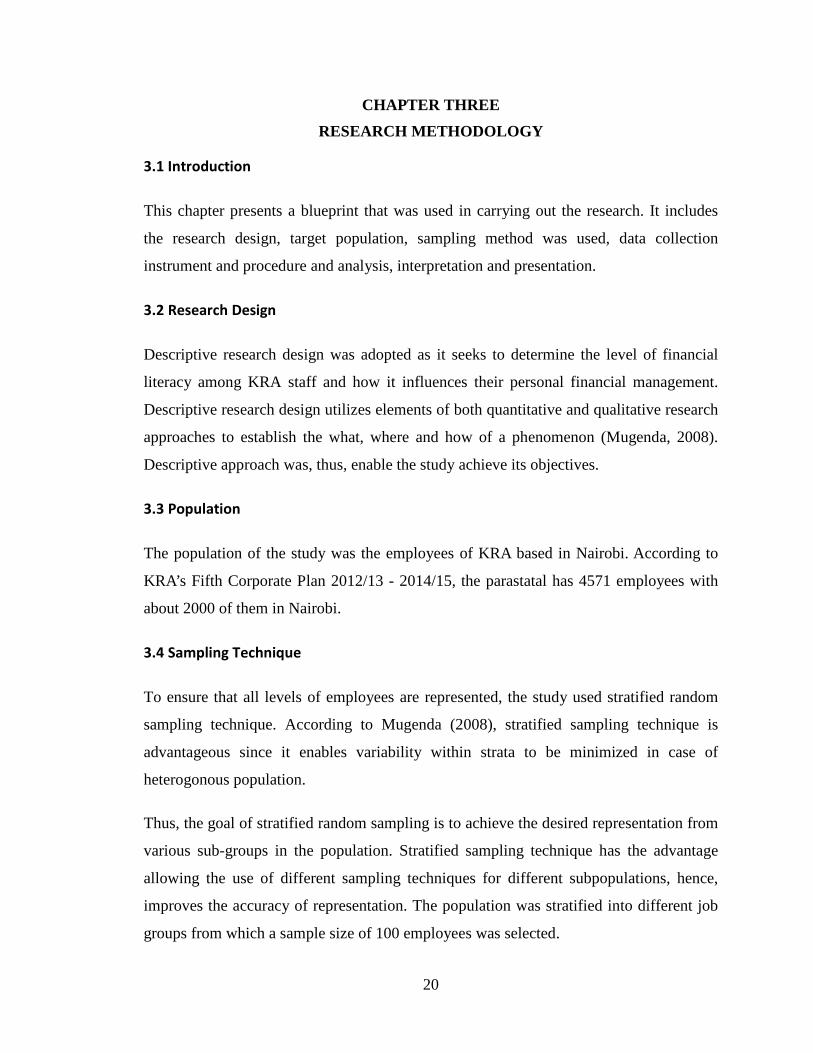
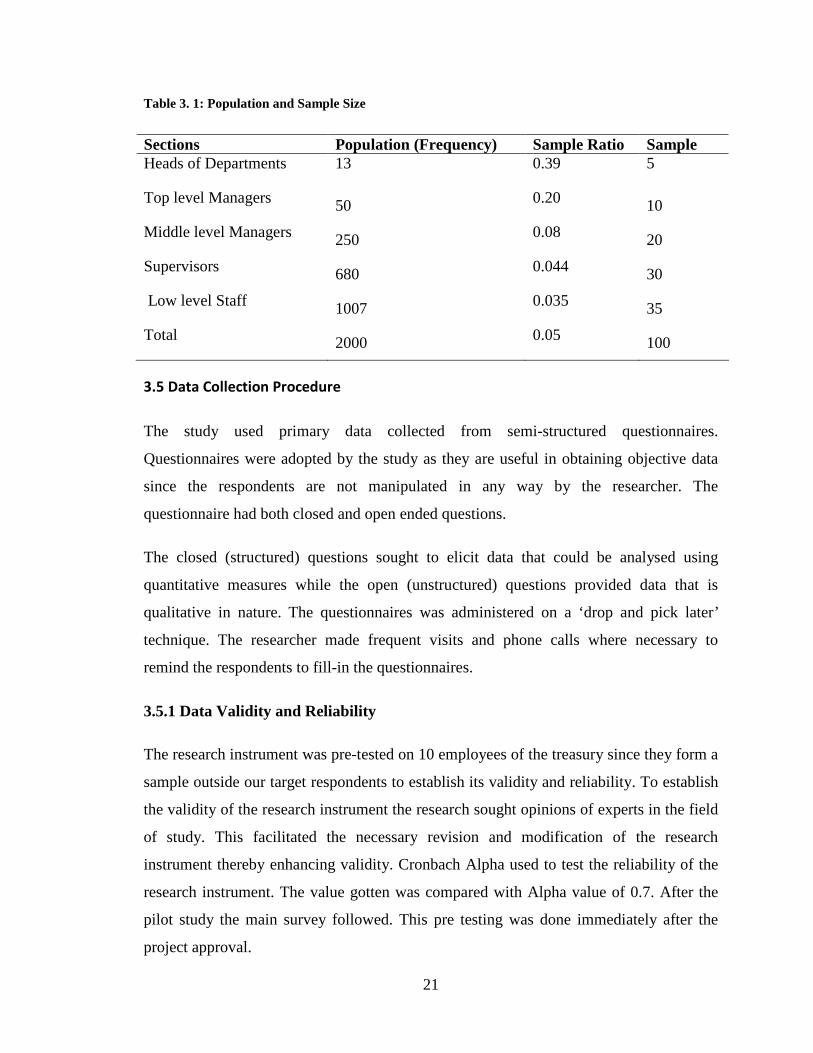
Table 3. 1: Population and Sample Size
Sections Population (Frequency) Sample Ratio Sample Heads of Departments 13 0.39 5
Top level Managers 50 0.20 10
Middle level Managers 250 0.08 20
Supervisors 680 0.044 30
Low level Staff 1007 0.035 35
Total 2000 0.05 100
3.5 Data Collection Procedure
The study used primary data collected from semi-structured questionnaires.
Questionnaires were adopted by the study as they are useful in obtaining objective data
since the respondents are not manipulated in any way by the researcher. The
questionnaire had both closed and open ended questions.
The closed (structured) questions sought to elicit data that could be analysed using
quantitative measures while the open (unstructured) questions provided data that is
qualitative in nature. The questionnaires was administered on a ‘drop and pick later’
technique. The researcher made frequent visits and phone calls where necessary to
remind the respondents to fill-in the questionnaires.
3.5.1 Data Validity and Reliability
The research instrument was pre-tested on 10 employees of the treasury since they form a
sample outside our target respondents to establish its validity and reliability. To establish
the validity of the research instrument the research sought opinions of experts in the field
of study. This facilitated the necessary revision and modification of the research
instrument thereby enhancing validity. Cronbach Alpha used to test the reliability of the
research instrument. The value gotten was compared with Alpha value of 0.7. After the
pilot study the main survey followed. This pre testing was done immediately after the
project approval.
22
3.6 Data Analysis
The completed questionnaires were edited for completeness and consistency. Qualitative
data resulted from efforts to respondents’ divergent views on personal financial
management as they were not limited by choices. Quantitative data was analysed using
descriptive statistics while qualitative data was analysed using content analysis.
Quantitative data was coded and entered into Statistical Packages for Social Scientists
(SPSS Version 17.0).
Analysis was, then, be based on descriptive statistics. Descriptive statistics involves the
use of absolute and relative (percentages) frequencies, measures of central tendency and
dispersion (mean and standard deviation respectively). The study also used multiple
regression analysis to establish the relationship between financial literacy and personal
financial management using the variables highlighted in the background of this study in
chapter one.
The regression analysis was done using the multiple linear regression model. This model
was used following Markowitz (1952) usage to determine the Capital Market Line
(CML) which represents the risk-return trade off in the capital market during portfolio
analysis. Lusardi and Mitchell (2006) also used the model to study the effects of financial
literacy on the consumption or saving decisions of households.
The model’s significance was tested using analysis of variance (ANOVA) test conducted
at 95% confidence level (α ≤ 0.05). T-test significance was further, test the significance
of the variables included in the model. Since we are dealing with samples we cannot
say we are 100% certain that the difference between the sample and the population is
significant.
Y = β0 + β1X1 + β2X2 + β3X3 + β4X4 + ε
Whereby: β0 is regression constant; ε is error term from regression model significance; β1
to β4 are regression coefficient;

23
Y is the financial management score calculated as the index of items in financial
management practice scale and was the average of the individual scores of the 100
employees sampled.
X1 is the investment/savings literacy index calculated from its scale;
X2 is the retirement literacy index calculated from retirement/pensions scale;
X3 is Tax return/insurance literacy index calculated from its scale; and,
X4 is credit and other liabilities literacy index calculated from its scale.
24
CHAPTER FOUR
DATA PRESENTATION AND ANALYSIS
4.1 Introduction
This chapter covers the data presentation and analysis. The main objective of the study was to
investigate effect of financial literacy on personal financial management on Kenya revenue
authority employees in Nairobi. The reliability of the data collected for the study was determined
through ascertaining the reliability of the questionnaires used in data collection. The target
population was 2000. Sample size was 100 respondents from the Kenya revenue
Authority. Out of 100 questionnaires issued, 85 were filled and returned making a
response rate of 85%. According to Mugenda and Mugenda (1999), a response rate of 50% is
adequate for analysis and reporting; a rate of 60% is good and a response rate of 70% and over is
excellent, so from Mugenda (1999), the response was excellent.
4.2: Data presentation
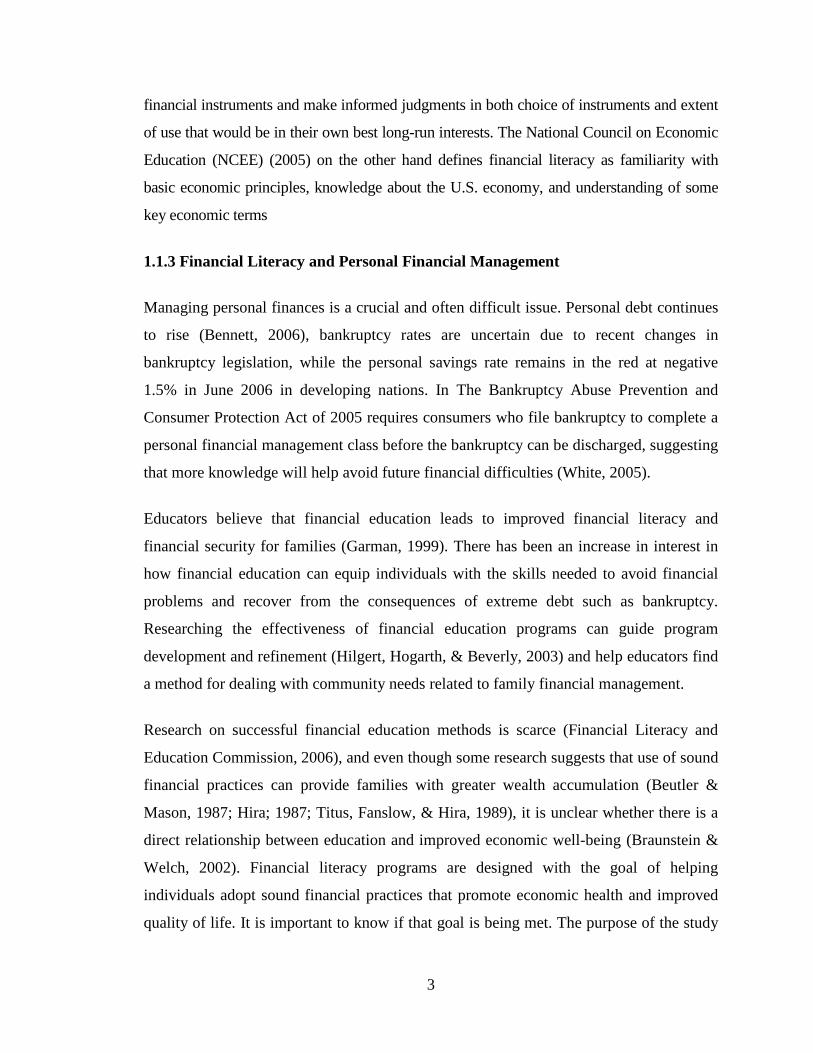
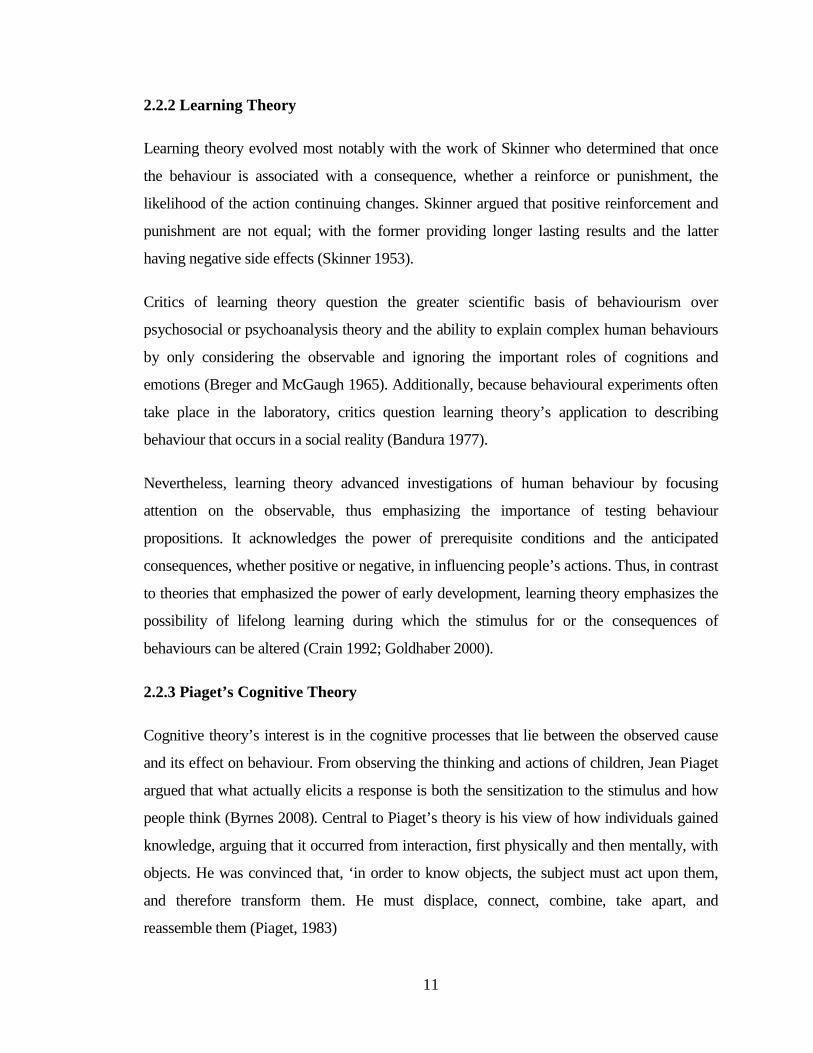
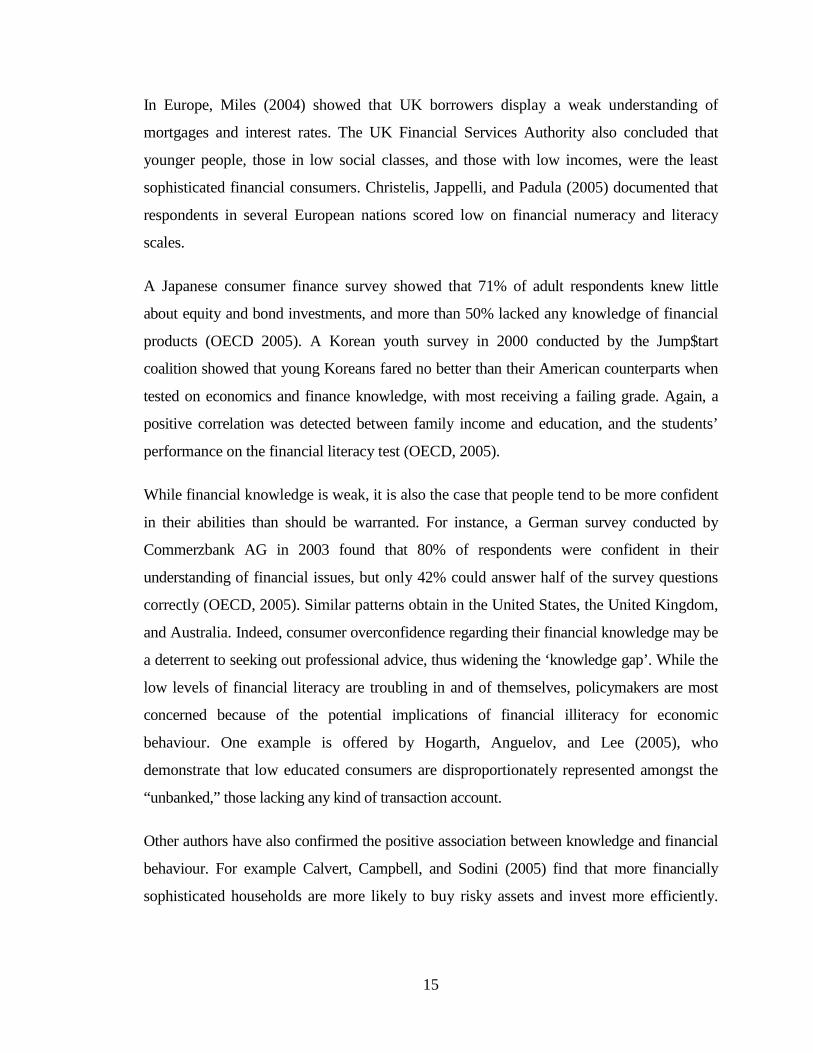
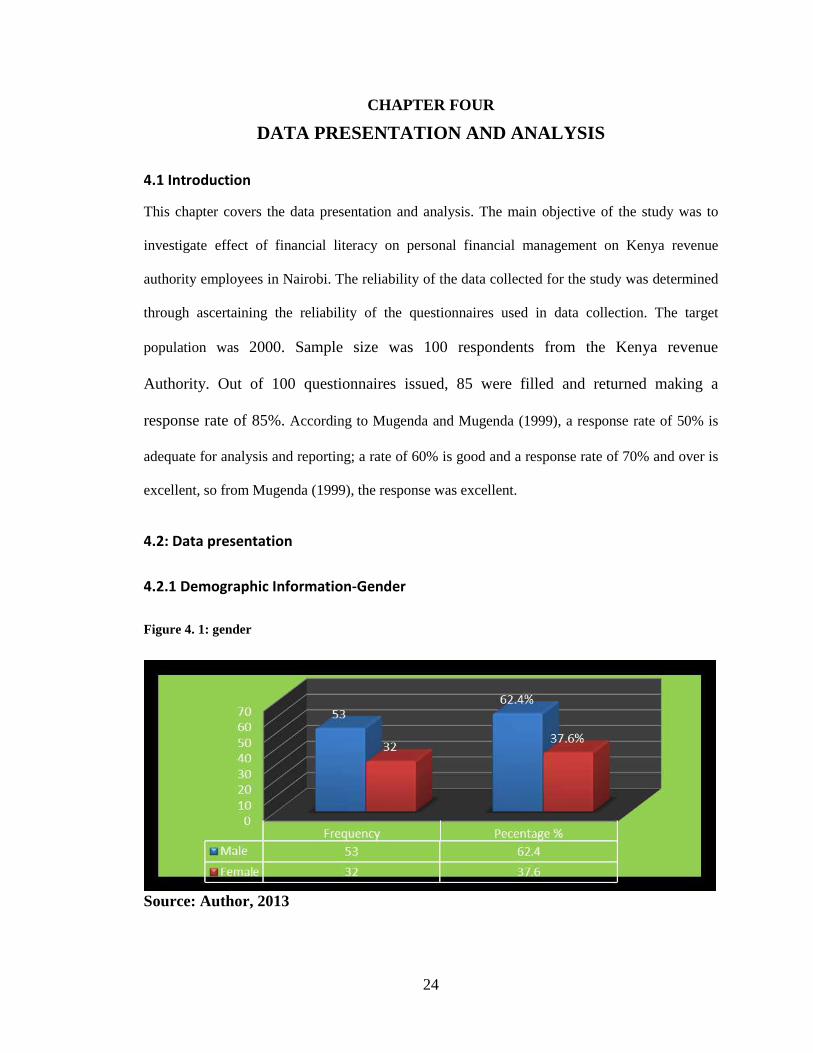
4.2.1 Demographic Information-Gender
Figure 4. 1: gender
Source: Author, 2013
25
The researcher determined gender of the respondents. The findings of the study indicated
that the dominant group are the male who accounted for 62.4% and their female
counterparts accounted for 37.6%. On gender, the findings of the study showed that there
are gender disparities.
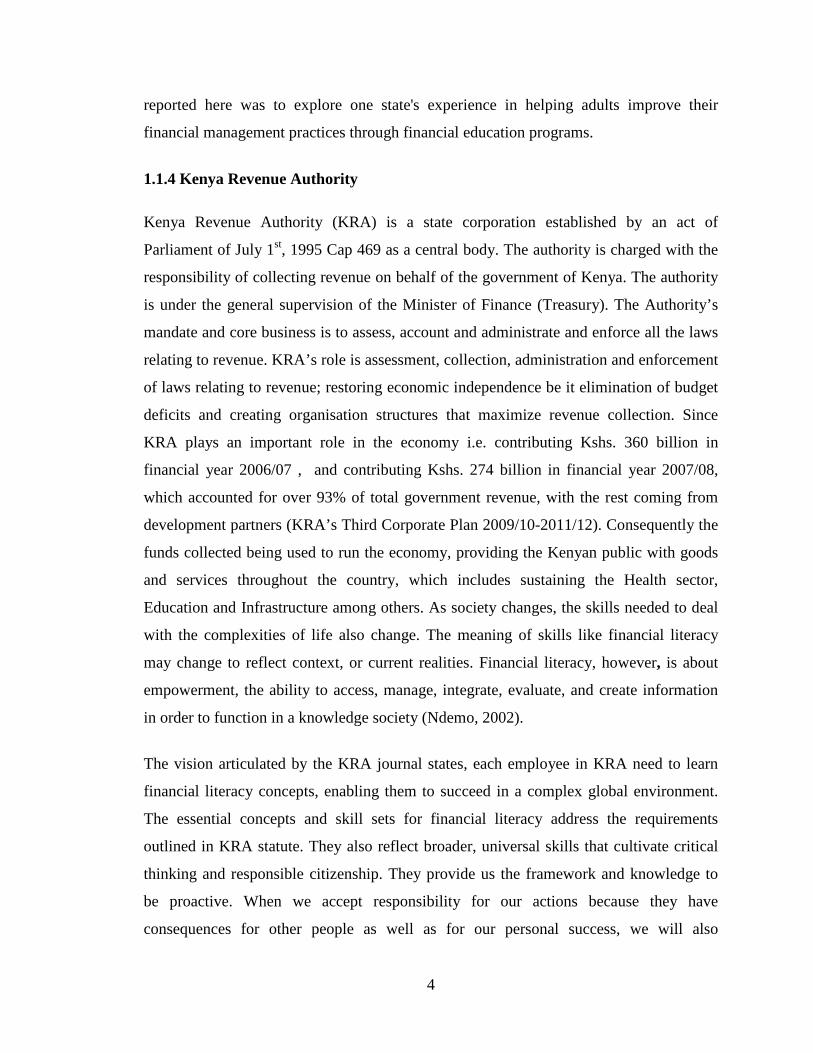
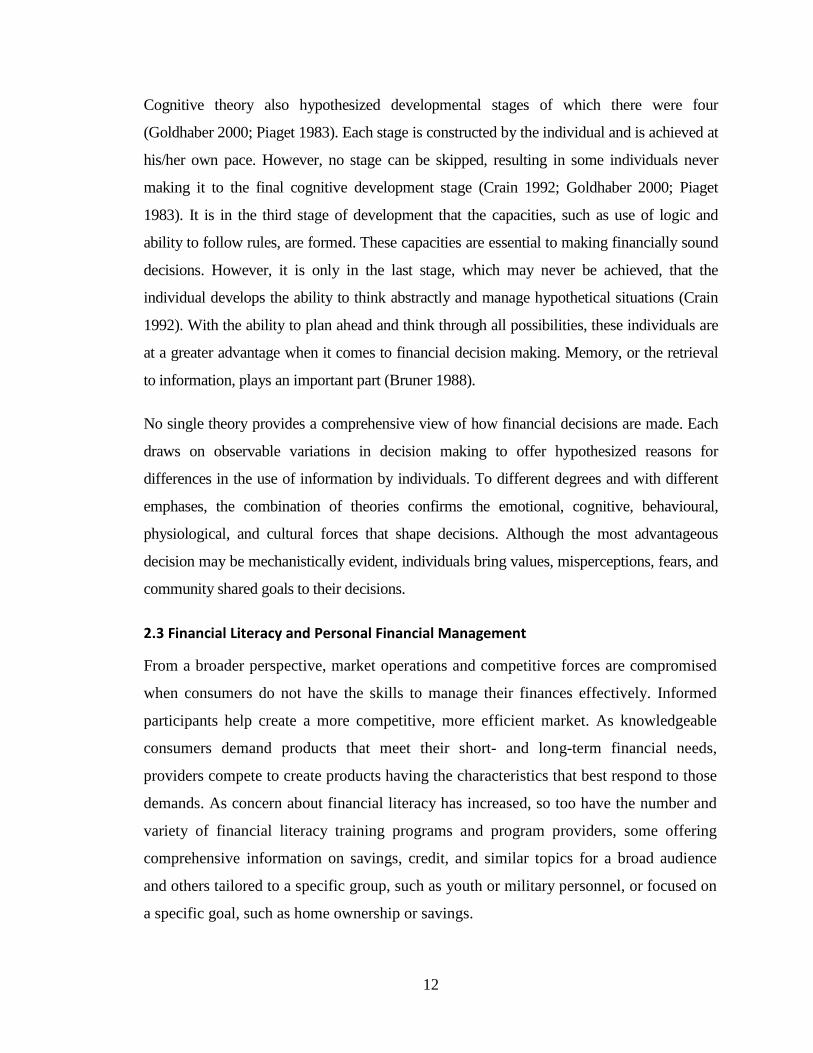
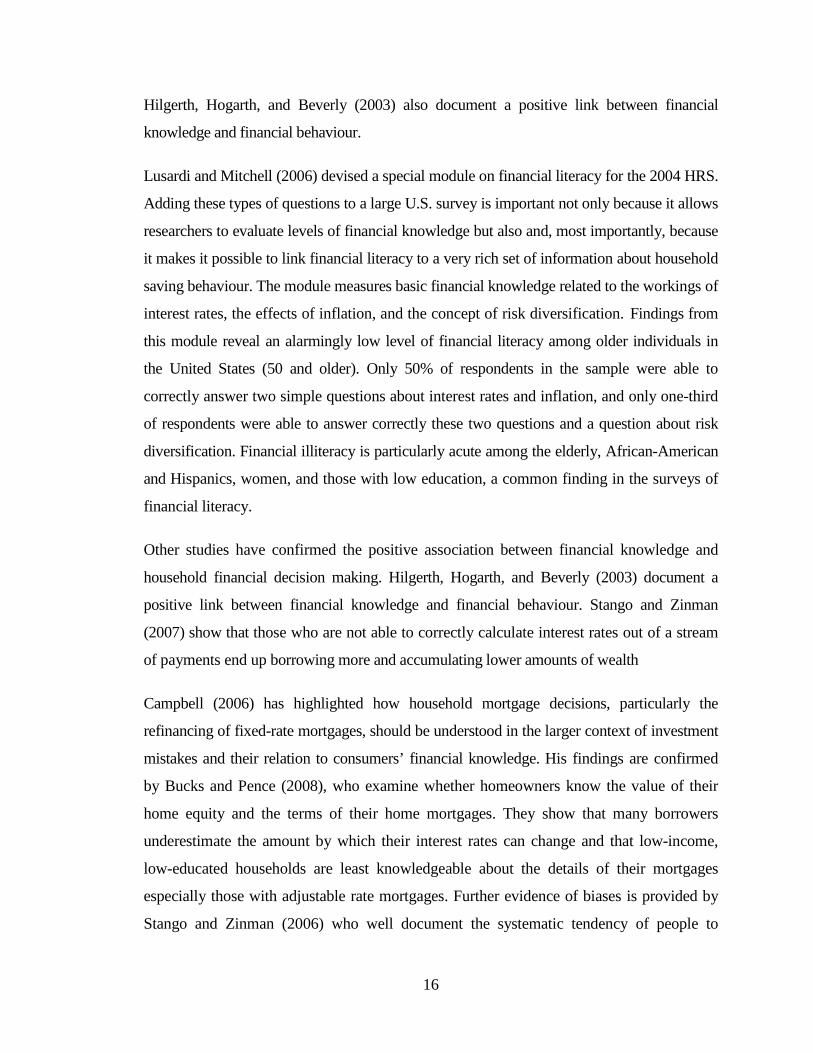
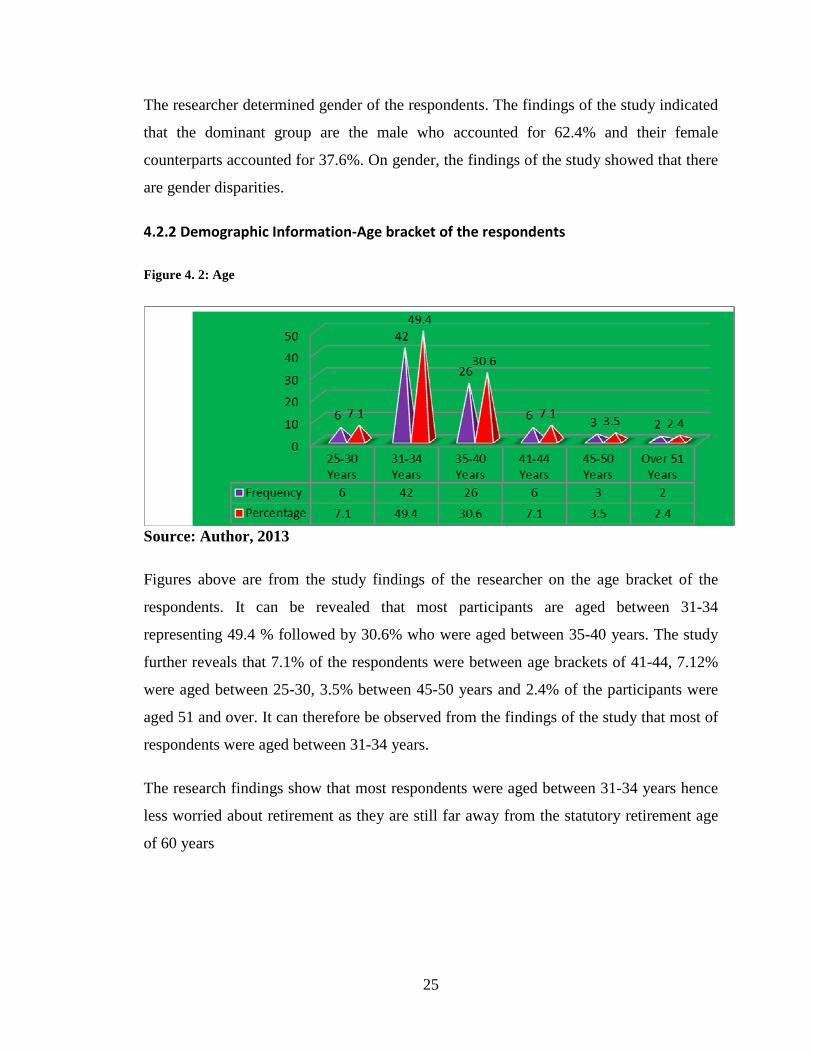
4.2.2 Demographic Information-Age bracket of the respondents
Figure 4. 2: Age
Source: Author, 2013
Figures above are from the study findings of the researcher on the age bracket of the
respondents. It can be revealed that most participants are aged between 31-34
representing 49.4 % followed by 30.6% who were aged between 35-40 years. The study
further reveals that 7.1% of the respondents were between age brackets of 41-44, 7.12%
were aged between 25-30, 3.5% between 45-50 years and 2.4% of the participants were
aged 51 and over. It can therefore be observed from the findings of the study that most of
respondents were aged between 31-34 years.
The research findings show that most respondents were aged between 31-34 years hence
less worried about retirement as they are still far away from the statutory retirement age
of 60 years
26
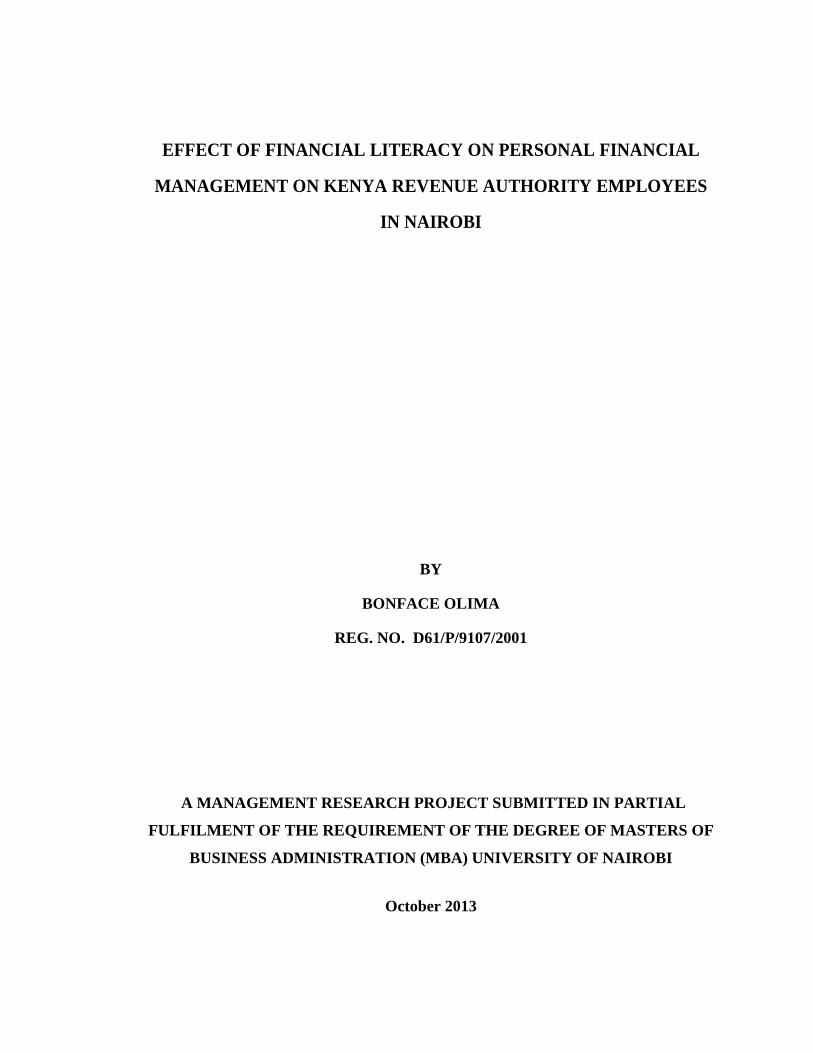
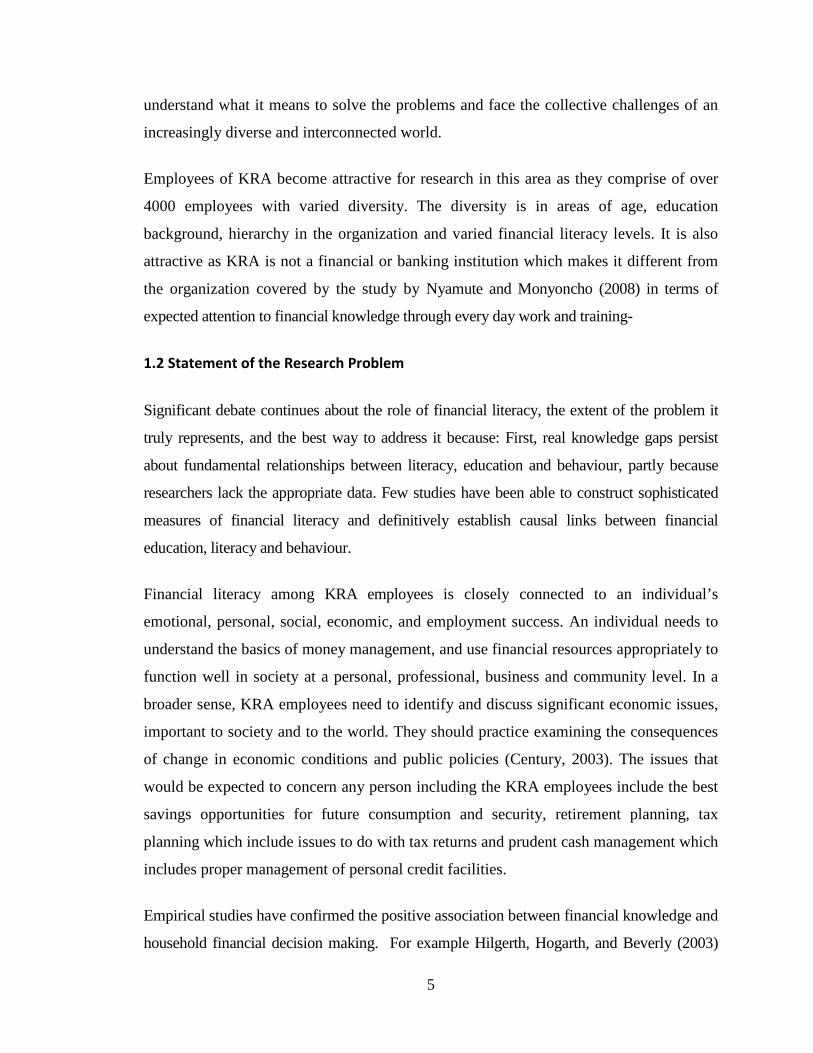
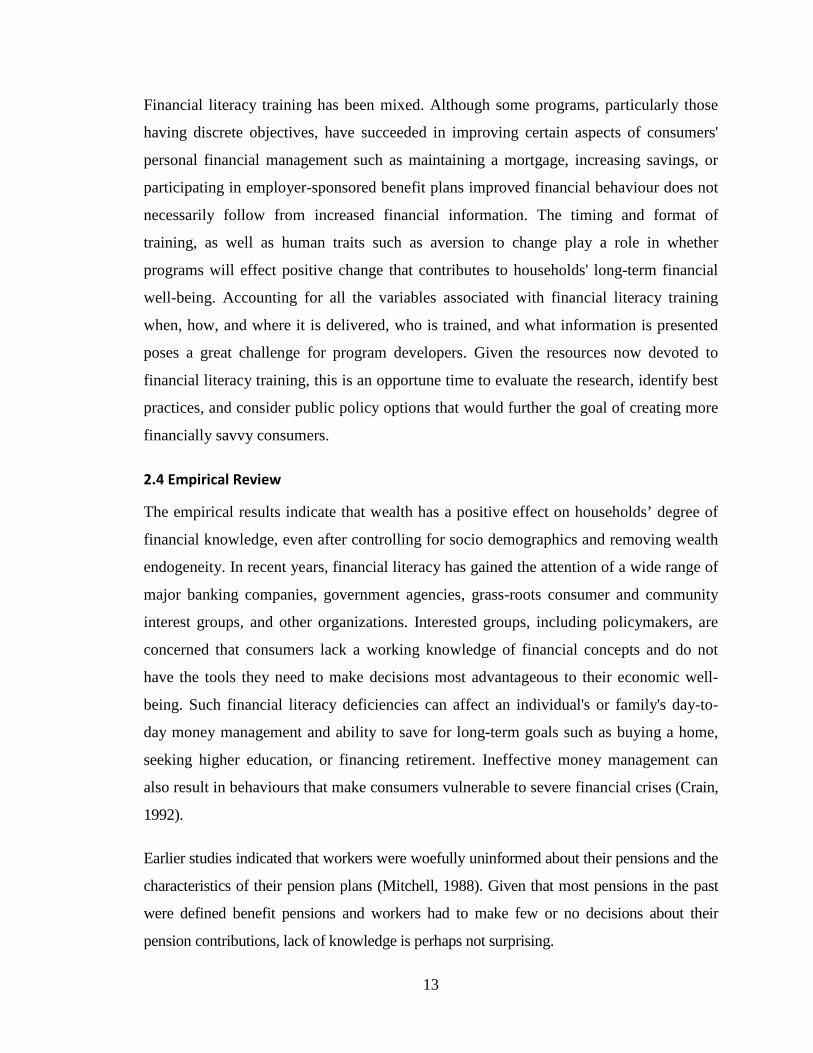
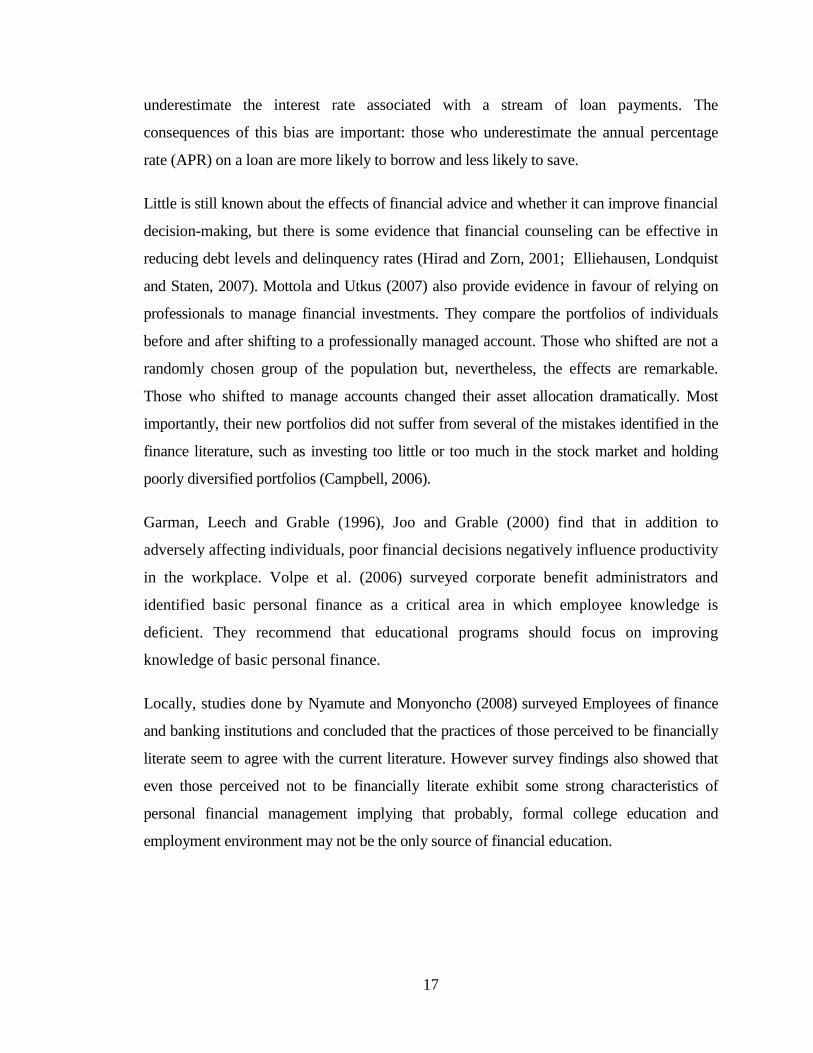
4.2.3 Demographic Information-Duration of Employment.
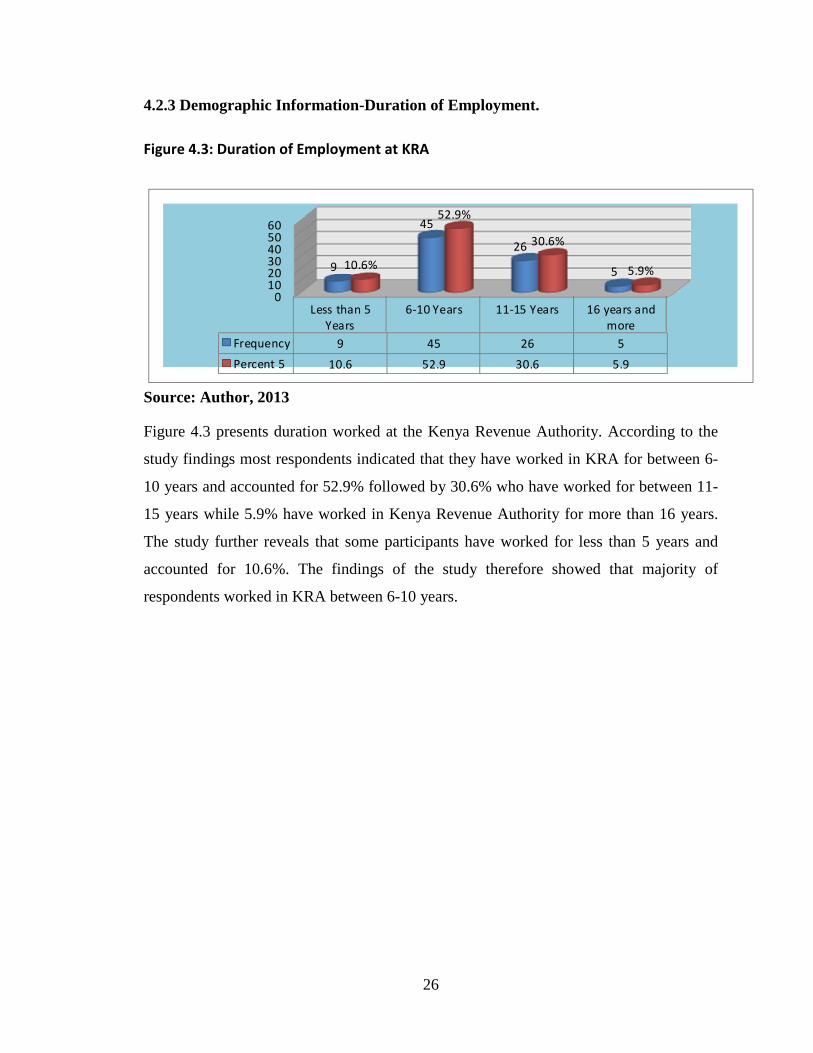
Figure 4.3: Duration of Employment at KRA
0102030405060
Less than 5
Years
6-10 Years 11-15 Years 16 years and
more
Frequency 9 45 26 5
Percent 5 10.6 52.9 30.6 5.9
9
45
26
510.6%
52.9%
30.6%
5.9%
Source: Author, 2013
Figure 4.3 presents duration worked at the Kenya Revenue Authority. According to the
study findings most respondents indicated that they have worked in KRA for between 6-
10 years and accounted for 52.9% followed by 30.6% who have worked for between 11-
15 years while 5.9% have worked in Kenya Revenue Authority for more than 16 years.
The study further reveals that some participants have worked for less than 5 years and
accounted for 10.6%. The findings of the study therefore showed that majority of
respondents worked in KRA between 6-10 years.
27
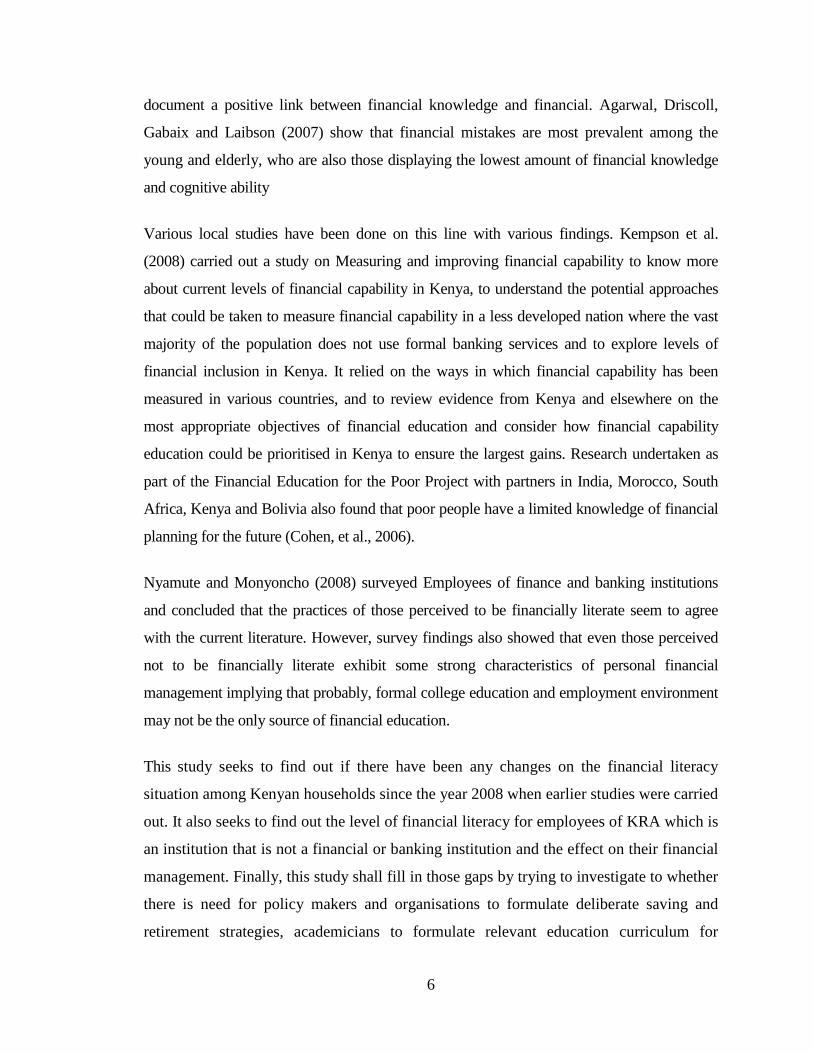
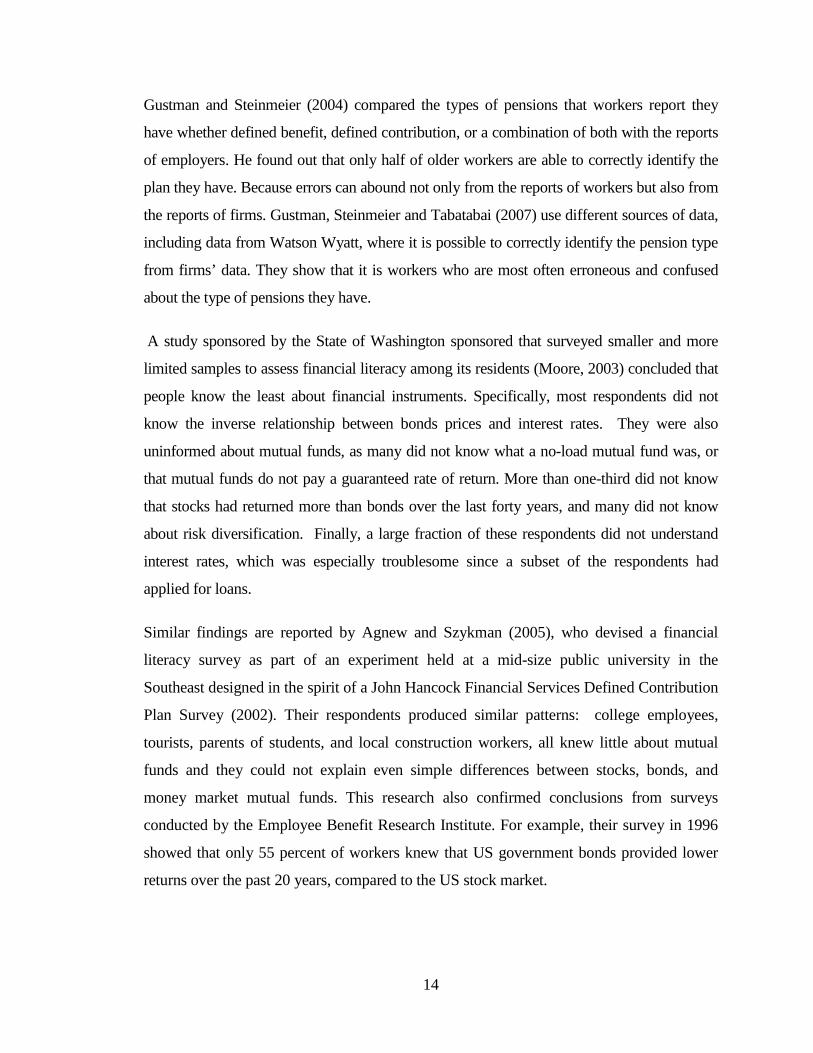
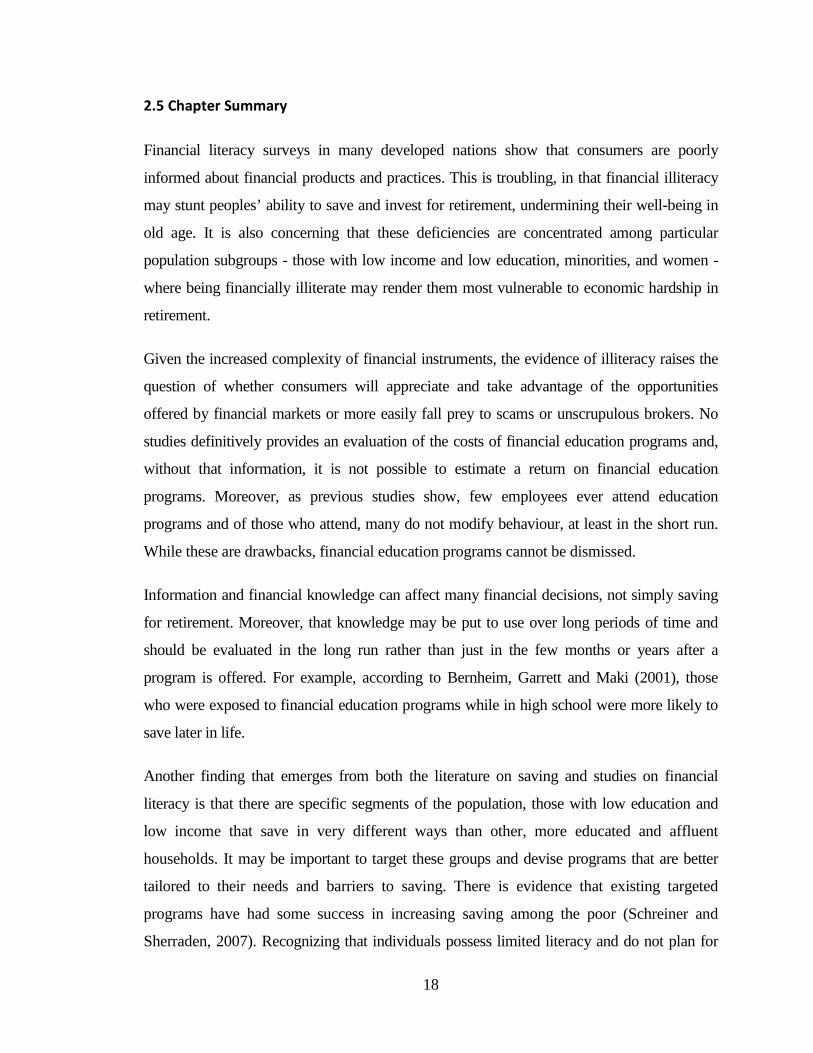
4.2.4 Demographic Information-Level of Education.
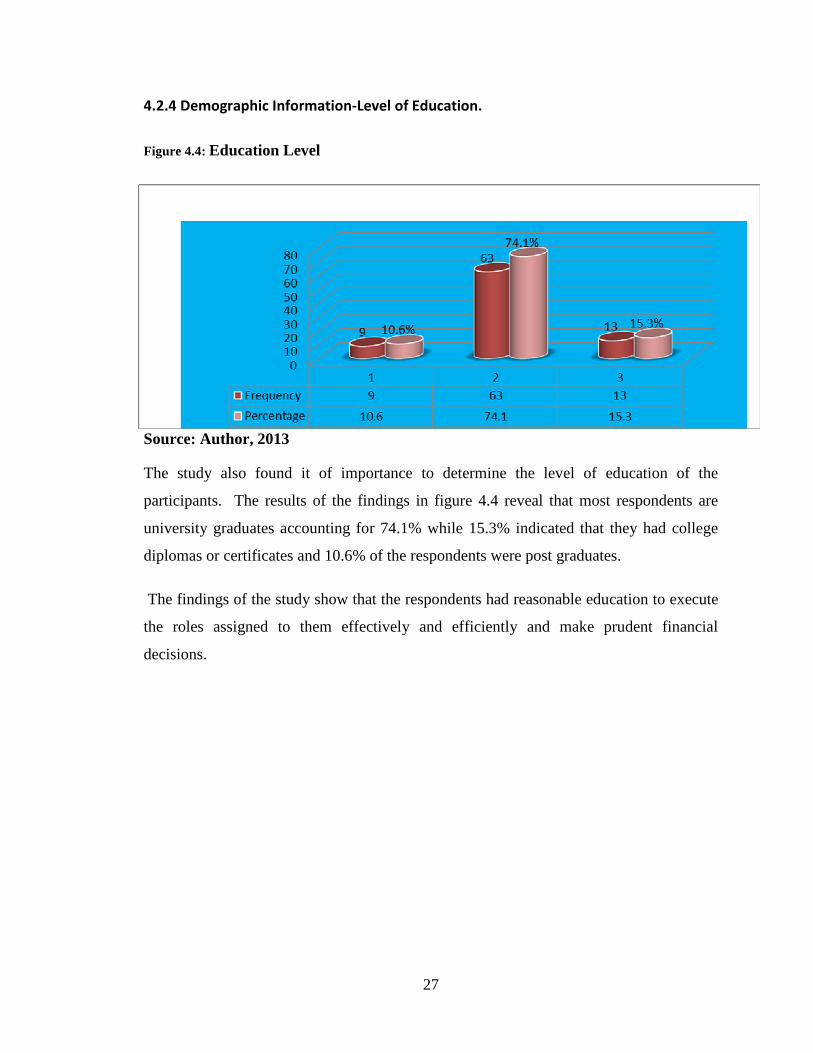
Figure 4.4: Education Level
Source: Author, 2013
The study also found it of importance to determine the level of education of the
participants. The results of the findings in figure 4.4 reveal that most respondents are
university graduates accounting for 74.1% while 15.3% indicated that they had college
diplomas or certificates and 10.6% of the respondents were post graduates.
The findings of the study show that the respondents had reasonable education to execute
the roles assigned to them effectively and efficiently and make prudent financial
decisions.
28
4.2.5 Demographic Information-The Current KRA Grade
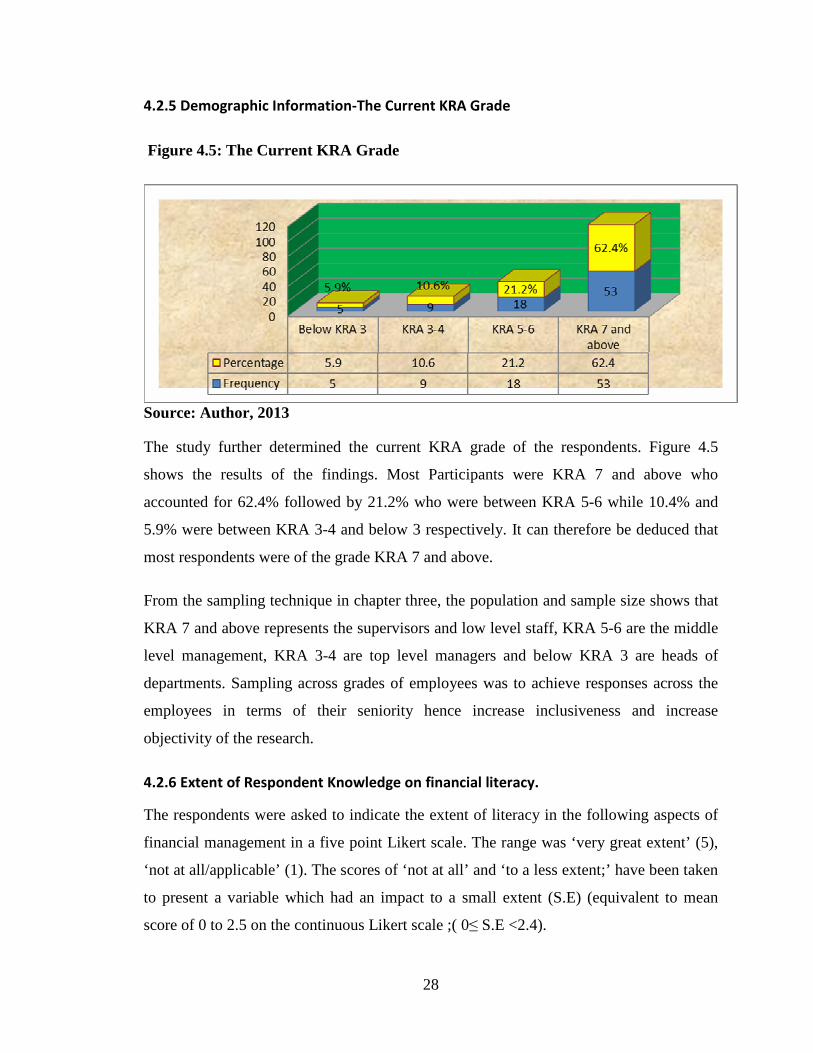
Figure 4.5: The Current KRA Grade
Source: Author, 2013
The study further determined the current KRA grade of the respondents. Figure 4.5
shows the results of the findings. Most Participants were KRA 7 and above who
accounted for 62.4% followed by 21.2% who were between KRA 5-6 while 10.4% and
5.9% were between KRA 3-4 and below 3 respectively. It can therefore be deduced that
most respondents were of the grade KRA 7 and above.
From the sampling technique in chapter three, the population and sample size shows that
KRA 7 and above represents the supervisors and low level staff, KRA 5-6 are the middle
level management, KRA 3-4 are top level managers and below KRA 3 are heads of
departments. Sampling across grades of employees was to achieve responses across the
employees in terms of their seniority hence increase inclusiveness and increase
objectivity of the research.
4.2.6 Extent of Respondent Knowledge on financial literacy.
The respondents were asked to indicate the extent of literacy in the following aspects of
financial management in a five point Likert scale. The range was ‘very great extent’ (5),
‘not at all/applicable’ (1). The scores of ‘not at all’ and ‘to a less extent;’ have been taken
to present a variable which had an impact to a small extent (S.E) (equivalent to mean
score of 0 to 2.5 on the continuous Likert scale ;( 0≤ S.E <2.4).
29
The scores of ‘to a moderate extent;’ have been taken to represent a variable that had an
impact to a moderate extent (M.E.) (equivalent to a mean score of 2.5 to 3.4 on the
continuous Likert scale: 2.5≤M.E. <3.4). The score of ‘great extent; and very great
extent’ have been taken to represent a variable which had an impact to a large extent
(L.E.) (equivalent to a mean score of 3.5 to 5.0 on a continuous Likert scale; 3.5≤ L.E.
<5.0). A standard deviation of >1.5 implies a significant difference on the impact of the
variable among respondents.
30
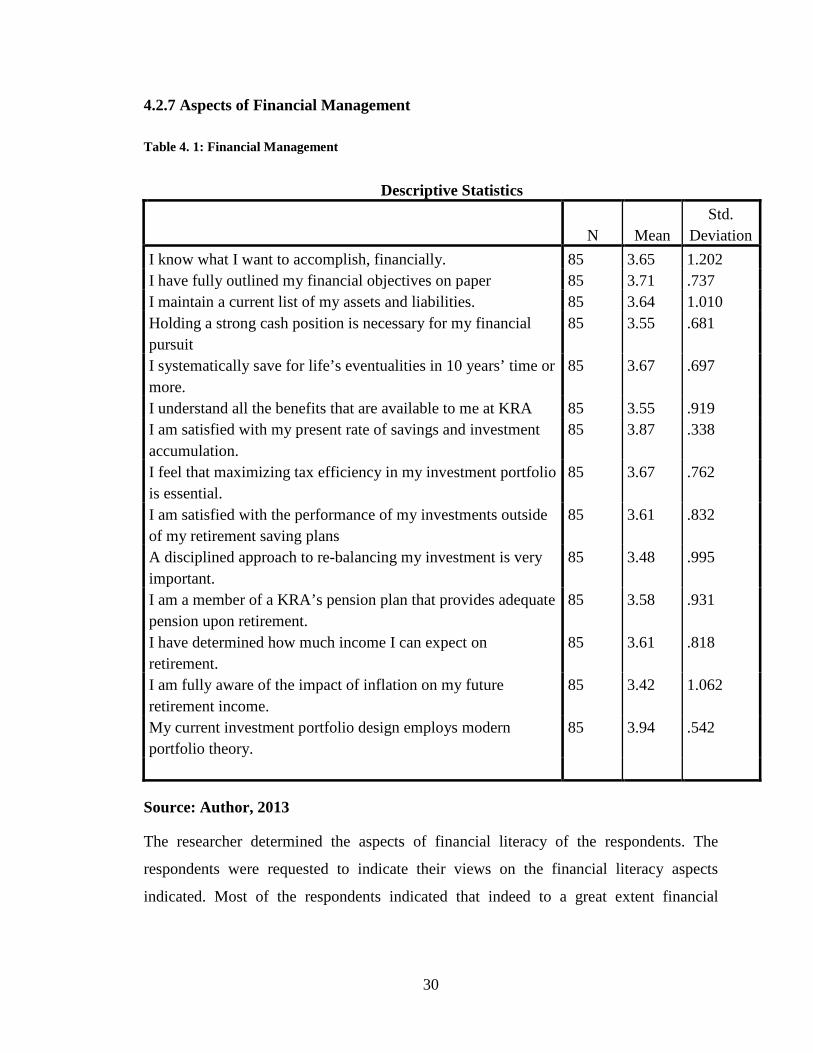
4.2.7 Aspects of Financial Management
Table 4. 1: Financial Management
Descriptive Statistics
N Mean
Std. Deviation
I know what I want to accomplish, financially. 85 3.65 1.202 I have fully outlined my financial objectives on paper 85 3.71 .737 I maintain a current list of my assets and liabilities. 85 3.64 1.010 Holding a strong cash position is necessary for my financial pursuit
85 3.55 .681
I systematically save for life’s eventualities in 10 years’ time or more.
85 3.67 .697
I understand all the benefits that are available to me at KRA 85 3.55 .919 I am satisfied with my present rate of savings and investment accumulation.
85 3.87 .338
I feel that maximizing tax efficiency in my investment portfolio is essential.
85 3.67 .762
I am satisfied with the performance of my investments outside of my retirement saving plans
85 3.61 .832
A disciplined approach to re-balancing my investment is very important.
85 3.48 .995
I am a member of a KRA’s pension plan that provides adequate pension upon retirement.
85 3.58 .931
I have determined how much income I can expect on retirement.
85 3.61 .818
I am fully aware of the impact of inflation on my future retirement income.
85 3.42 1.062
My current investment portfolio design employs modern portfolio theory.
85 3.94 .542
Source: Author, 2013
The researcher determined the aspects of financial literacy of the respondents. The
respondents were requested to indicate their views on the financial literacy aspects
indicated. Most of the respondents indicated that indeed to a great extent financial
31
literacy affects financial management on the Kenya revenue authority as shown by means
and standard deviations.
For example on the following aspects: My current investment portfolio design employs
modern portfolio theory. (X=3.94, S.D=.542), i am satisfied with my present rate of
savings and investment accumulation. (X=3.87, S.D=.338), know what to accomplish,
financially (X=3.65, S.D=1.202), i have fully outlined my financial objectives on
paper(X=3.71, S.D=.737), i systematically save for life’s eventualities in 10 years’ time
or more. (X=3.67, S.D=.697), i feel that maximizing tax efficiency in my investment
portfolio is essential. (X=3.67, S.D=.762), I know what I want to accomplish, financially
(X=3.65, S.D=1.202), i have determined how much income i can expect on retirement.
(X=3.61, S.D=.818), i am a member of a KRA’s pension plan that provides adequate
pension upon retirement. (X=3.58, S.D=.931). The study further revealed some of the
respondents were to a moderate extent as it can be shown by mean= 3.42, and standard
deviation=1.062.
It can therefore be concluded from the findings of the study that the respondents were ‘to
a great extent’ on the aspect of financial literacy.
32
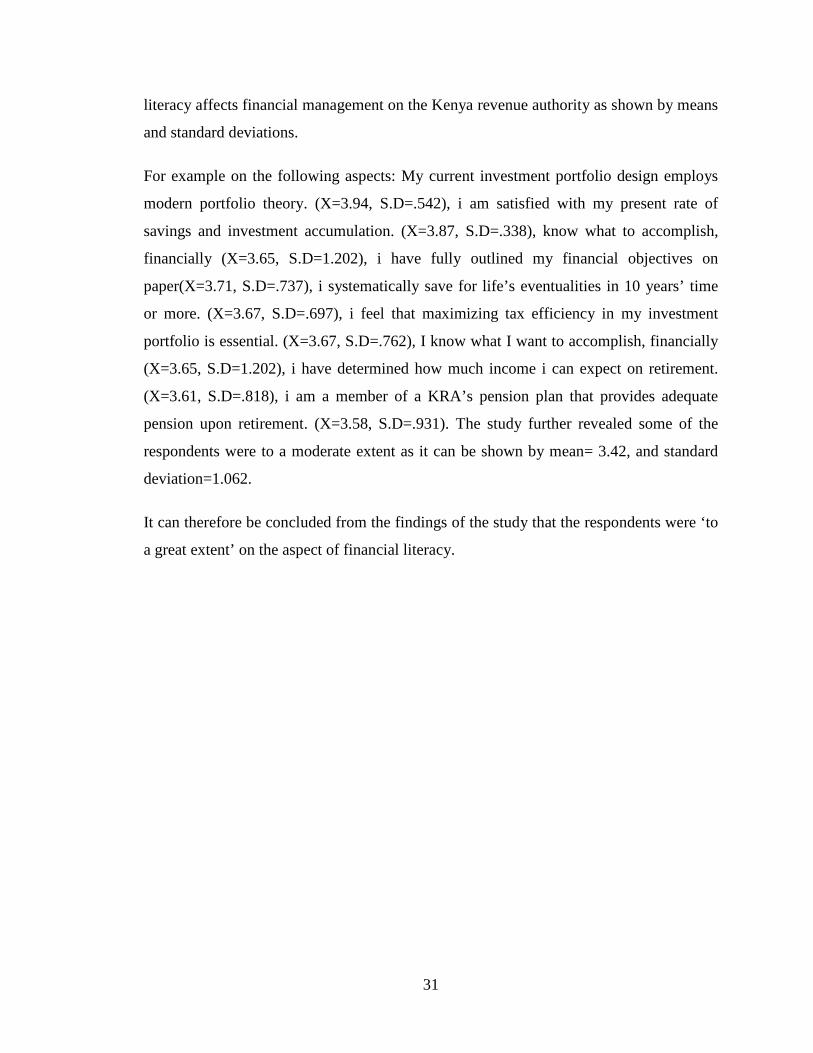
4.2.8 Retirement Plan
Table 4. 2: Retirement Plan
Descriptive Statistics
N Mean
Std. Deviation
I maximize my retirement/pension contributions each year. 85 1.93 .431 I want to help build a vision of my retirement lifestyle 85 1.84 .508 I know what income I would need if I were unable to work due to an accident or severe illness
85 1.91 .294
In the event of a prolonged disability, I know how long I could survive on my present savings.
85 1.95 .375
I have fully understood the government disability benefits’ alternative source of income in the event of an extended disability.
85 2.00 .378
I have an alternative source of income in the event of an extended disability.
85 2.05 .554
I feel confident that the present health care system can support my needs in the event of a major illness
85 2.04 .566
Source: Author, 2013
Table 4.2 shows the study findings on retirement benefit plan. According to the results
most respondents were ‘to a less extent’ on their retirement plan. For instance on X=2.04,
S.D=.566, X=2.05, S.D=.554, X=2.00, S.D=.378. The study also revealed that some of
the participants said not at all or don’t apply retirement plan in that matter as shown by
the means and standard deviations above.
For example; In the event of a prolonged disability, I know how long I could survive on
my present savings. (X=1.95, S.D=.375), i maximize my retirement/pension contributions
each year. (X=1.91, S.D=.294), i know what income i would need if i were unable to
work due to an accident or severe illness (X=1.94, S.D=.397) and also on i want to help
build a vision of my retirement lifestyle (X=1.84, S.D=.508).
33
The study findings indicate that most respondents indicated ‘not at all’ on their retirement
plans.
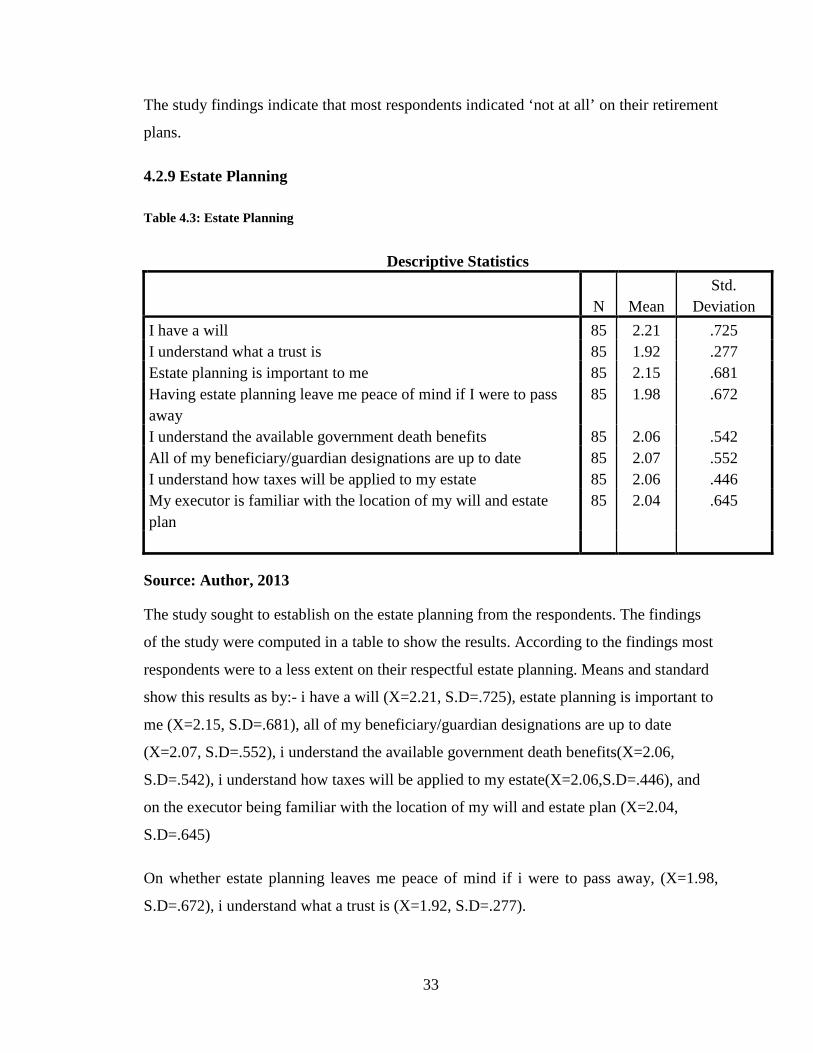
4.2.9 Estate Planning
Table 4.3: Estate Planning
Descriptive Statistics
N Mean
Std. Deviation
I have a will 85 2.21 .725 I understand what a trust is 85 1.92 .277 Estate planning is important to me 85 2.15 .681 Having estate planning leave me peace of mind if I were to pass away
85 1.98 .672
I understand the available government death benefits 85 2.06 .542 All of my beneficiary/guardian designations are up to date 85 2.07 .552 I understand how taxes will be applied to my estate 85 2.06 .446 My executor is familiar with the location of my will and estate plan
85 2.04 .645
Source: Author, 2013
The study sought to establish on the estate planning from the respondents. The findings
of the study were computed in a table to show the results. According to the findings most
respondents were to a less extent on their respectful estate planning. Means and standard
show this results as by:- i have a will (X=2.21, S.D=.725), estate planning is important to
me (X=2.15, S.D=.681), all of my beneficiary/guardian designations are up to date
(X=2.07, S.D=.552), i understand the available government death benefits(X=2.06,
S.D=.542), i understand how taxes will be applied to my estate(X=2.06,S.D=.446), and
on the executor being familiar with the location of my will and estate plan (X=2.04,
S.D=.645)
On whether estate planning leaves me peace of mind if i were to pass away, (X=1.98,
S.D=.672), i understand what a trust is (X=1.92, S.D=.277).
34
From the findings of the study it can be therefore depicted that most of the respondents
were ‘to a small extent’ on the estate planning. This means that fewer respondents do
practice these financial management aspects.
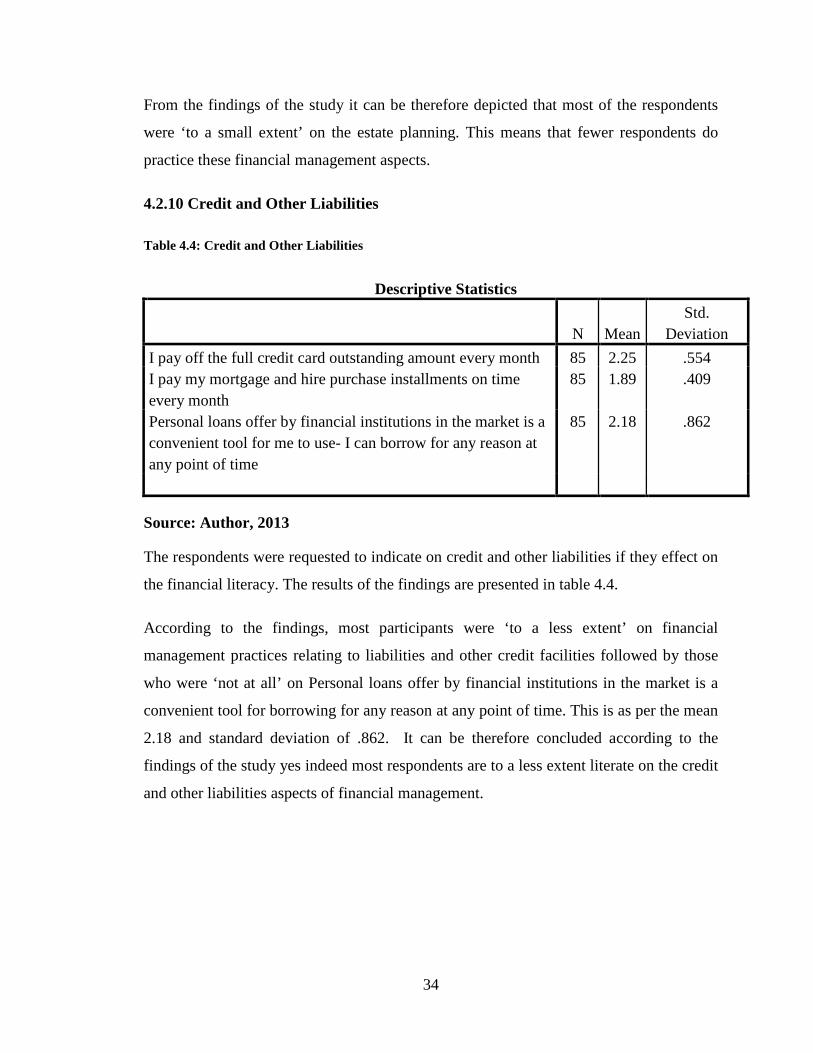
4.2.10 Credit and Other Liabilities
Table 4.4: Credit and Other Liabilities
Descriptive Statistics
N Mean
Std. Deviation
I pay off the full credit card outstanding amount every month 85 2.25 .554 I pay my mortgage and hire purchase installments on time every month
85 1.89 .409
Personal loans offer by financial institutions in the market is a convenient tool for me to use- I can borrow for any reason at any point of time
85 2.18 .862
Source: Author, 2013
The respondents were requested to indicate on credit and other liabilities if they effect on
the financial literacy. The results of the findings are presented in table 4.4.
According to the findings, most participants were ‘to a less extent’ on financial
management practices relating to liabilities and other credit facilities followed by those
who were ‘not at all’ on Personal loans offer by financial institutions in the market is a
convenient tool for borrowing for any reason at any point of time. This is as per the mean
2.18 and standard deviation of .862. It can be therefore concluded according to the
findings of the study yes indeed most respondents are to a less extent literate on the credit
and other liabilities aspects of financial management.
35
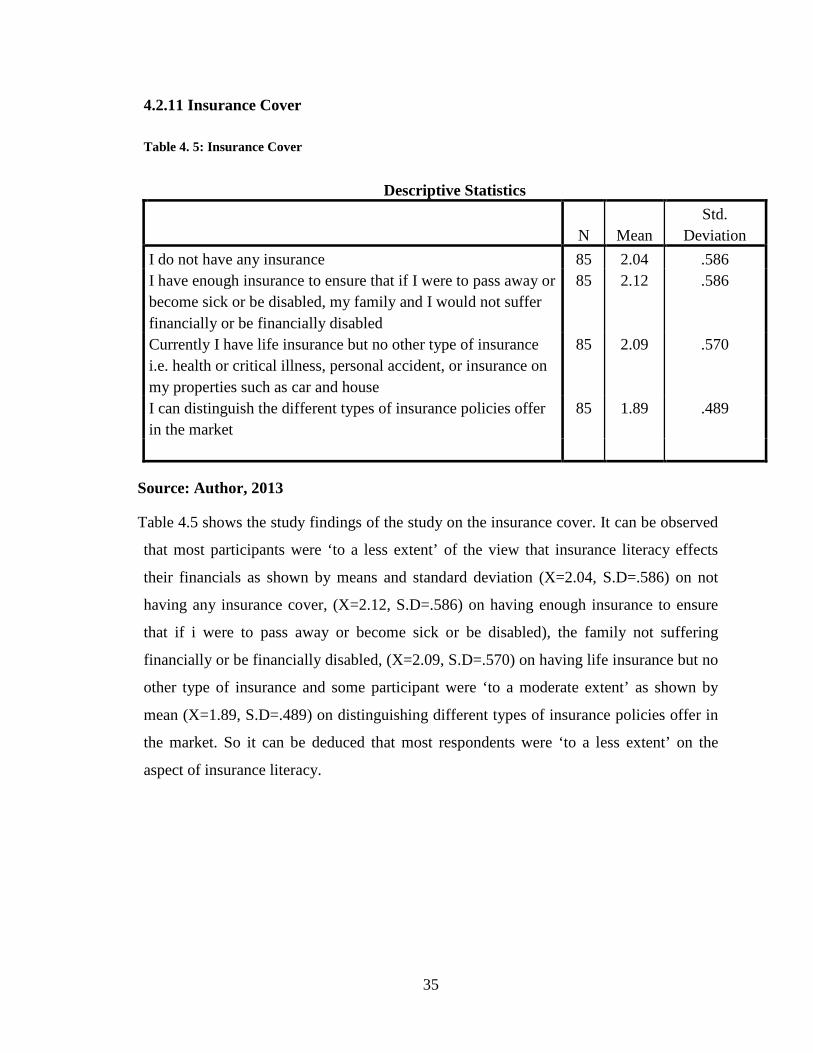
4.2.11 Insurance Cover
Table 4. 5: Insurance Cover
Descriptive Statistics
N Mean
Std. Deviation
I do not have any insurance 85 2.04 .586 I have enough insurance to ensure that if I were to pass away or become sick or be disabled, my family and I would not suffer financially or be financially disabled
85 2.12 .586
Currently I have life insurance but no other type of insurance i.e. health or critical illness, personal accident, or insurance on my properties such as car and house
85 2.09 .570
I can distinguish the different types of insurance policies offer in the market
85 1.89 .489
Source: Author, 2013
Table 4.5 shows the study findings of the study on the insurance cover. It can be observed
that most participants were ‘to a less extent’ of the view that insurance literacy effects
their financials as shown by means and standard deviation (X=2.04, S.D=.586) on not
having any insurance cover, (X=2.12, S.D=.586) on having enough insurance to ensure
that if i were to pass away or become sick or be disabled), the family not suffering
financially or be financially disabled, (X=2.09, S.D=.570) on having life insurance but no
other type of insurance and some participant were ‘to a moderate extent’ as shown by
mean (X=1.89, S.D=.489) on distinguishing different types of insurance policies offer in
the market. So it can be deduced that most respondents were ‘to a less extent’ on the
aspect of insurance literacy.
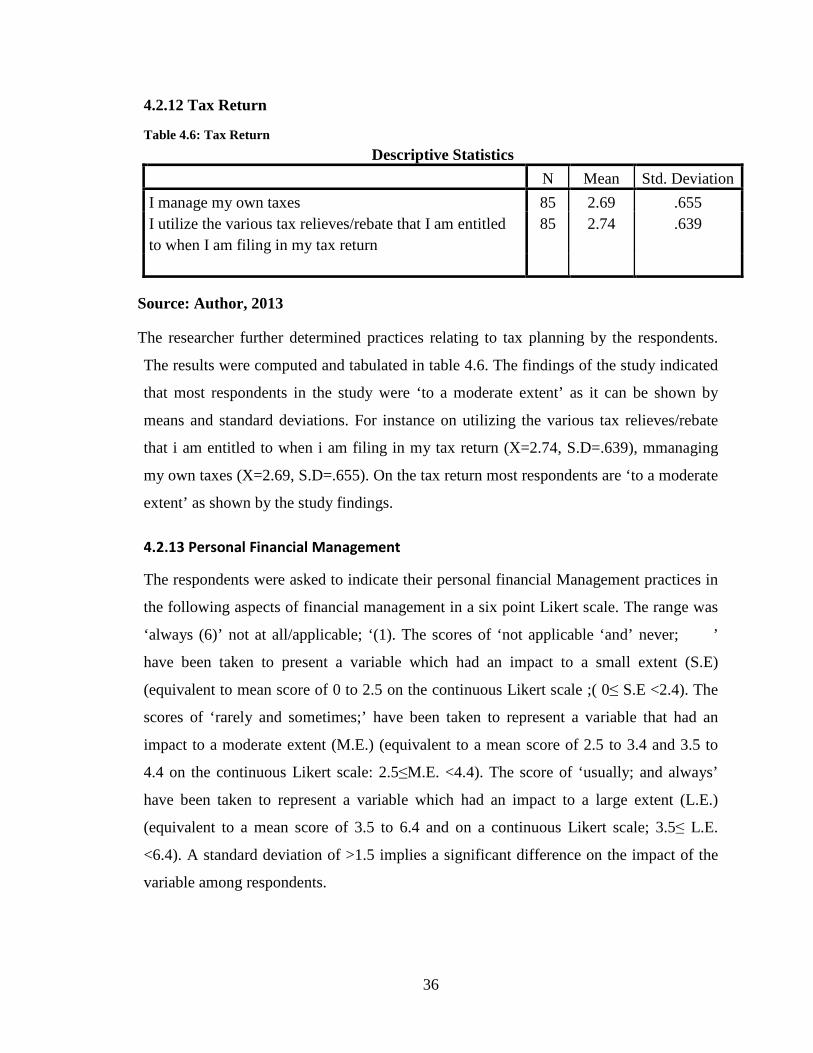
36
4.2.12 Tax Return
Table 4.6: Tax Return
Descriptive Statistics N Mean Std. Deviation
I manage my own taxes 85 2.69 .655 I utilize the various tax relieves/rebate that I am entitled to when I am filing in my tax return
85 2.74 .639
Source: Author, 2013
The researcher further determined practices relating to tax planning by the respondents.
The results were computed and tabulated in table 4.6. The findings of the study indicated
that most respondents in the study were ‘to a moderate extent’ as it can be shown by
means and standard deviations. For instance on utilizing the various tax relieves/rebate
that i am entitled to when i am filing in my tax return (X=2.74, S.D=.639), mmanaging
my own taxes (X=2.69, S.D=.655). On the tax return most respondents are ‘to a moderate
extent’ as shown by the study findings.
4.2.13 Personal Financial Management
The respondents were asked to indicate their personal financial Management practices in
the following aspects of financial management in a six point Likert scale. The range was
‘always (6)’ not at all/applicable; ‘(1). The scores of ‘not applicable ‘and’ never; ’
have been taken to present a variable which had an impact to a small extent (S.E)
(equivalent to mean score of 0 to 2.5 on the continuous Likert scale ;( 0≤ S.E <2.4). The
scores of ‘rarely and sometimes;’ have been taken to represent a variable that had an
impact to a moderate extent (M.E.) (equivalent to a mean score of 2.5 to 3.4 and 3.5 to
4.4 on the continuous Likert scale: 2.5≤M.E. <4.4). The score of ‘usually; and always’
have been taken to represent a variable which had an impact to a large extent (L.E.)
(equivalent to a mean score of 3.5 to 6.4 and on a continuous Likert scale; 3.5≤ L.E.
<6.4). A standard deviation of >1.5 implies a significant difference on the impact of the
variable among respondents.
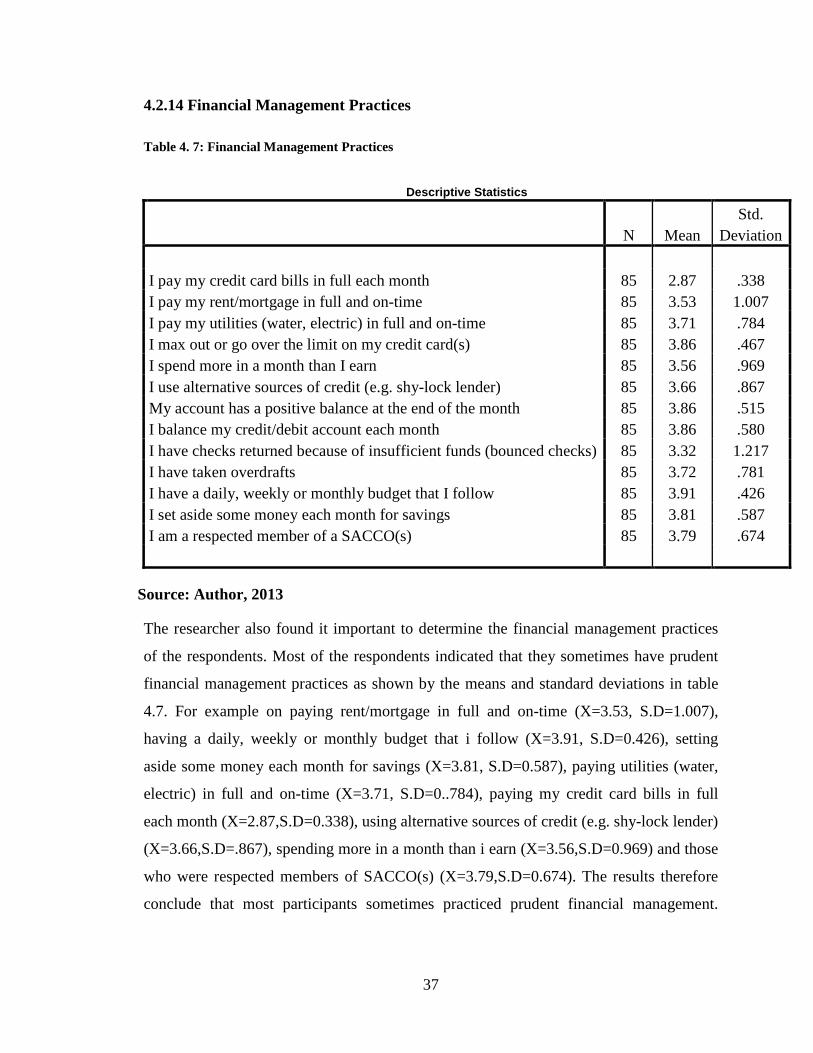
37
4.2.14 Financial Management Practices
Table 4. 7: Financial Management Practices
Descriptive Statistics
N Mean
Std. Deviation
I pay my credit card bills in full each month 85 2.87 .338 I pay my rent/mortgage in full and on-time 85 3.53 1.007 I pay my utilities (water, electric) in full and on-time 85 3.71 .784 I max out or go over the limit on my credit card(s) 85 3.86 .467 I spend more in a month than I earn 85 3.56 .969 I use alternative sources of credit (e.g. shy-lock lender) 85 3.66 .867 My account has a positive balance at the end of the month 85 3.86 .515 I balance my credit/debit account each month 85 3.86 .580 I have checks returned because of insufficient funds (bounced checks) 85 3.32 1.217 I have taken overdrafts 85 3.72 .781 I have a daily, weekly or monthly budget that I follow 85 3.91 .426 I set aside some money each month for savings 85 3.81 .587 I am a respected member of a SACCO(s) 85 3.79 .674
Source: Author, 2013
The researcher also found it important to determine the financial management practices
of the respondents. Most of the respondents indicated that they sometimes have prudent
financial management practices as shown by the means and standard deviations in table
4.7. For example on paying rent/mortgage in full and on-time (X=3.53, S.D=1.007),
having a daily, weekly or monthly budget that i follow (X=3.91, S.D=0.426), setting
aside some money each month for savings (X=3.81, S.D=0.587), paying utilities (water,
electric) in full and on-time (X=3.71, S.D=0..784), paying my credit card bills in full
each month (X=2.87,S.D=0.338), using alternative sources of credit (e.g. shy-lock lender)
(X=3.66,S.D=.867), spending more in a month than i earn (X=3.56,S.D=0.969) and those
who were respected members of SACCO(s) (X=3.79,S.D=0.674). The results therefore
conclude that most participants sometimes practiced prudent financial management.
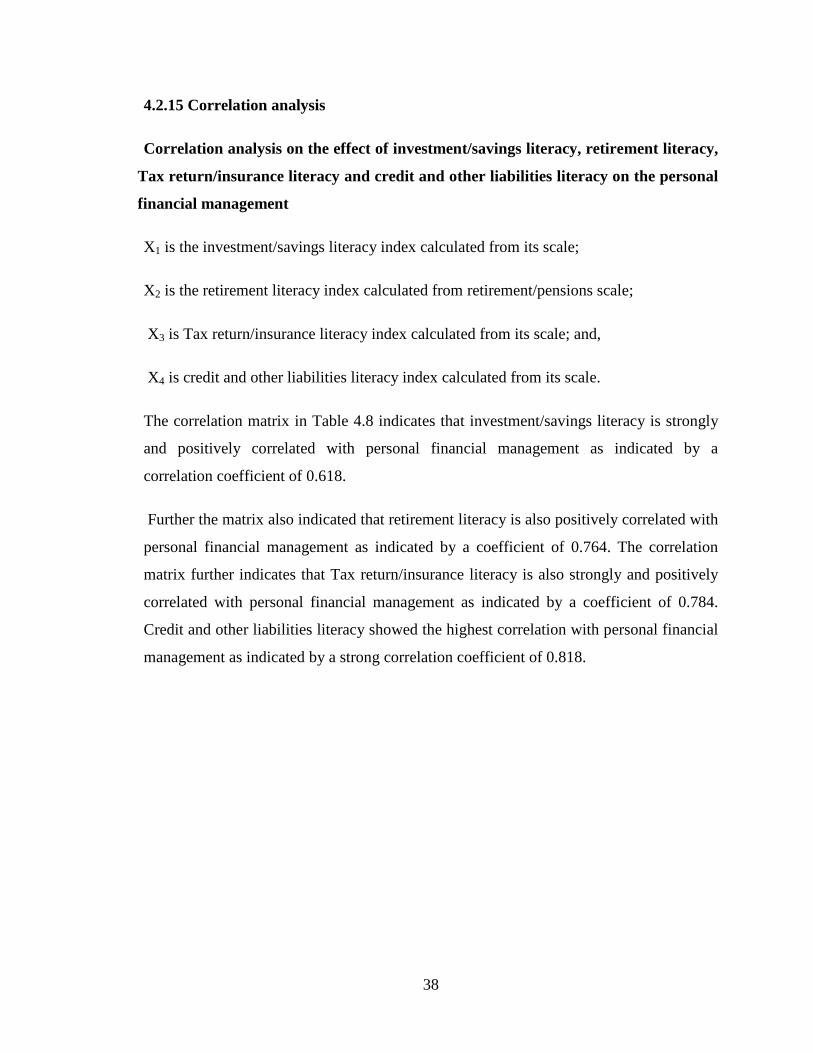
38
4.2.15 Correlation analysis
Correlation analysis on the effect of investment/savings literacy, retirement literacy,
Tax return/insurance literacy and credit and other liabilities literacy on the personal
financial management
X1 is the investment/savings literacy index calculated from its scale;
X2 is the retirement literacy index calculated from retirement/pensions scale;
X3 is Tax return/insurance literacy index calculated from its scale; and,
X4 is credit and other liabilities literacy index calculated from its scale.
The correlation matrix in Table 4.8 indicates that investment/savings literacy is strongly
and positively correlated with personal financial management as indicated by a
correlation coefficient of 0.618.
Further the matrix also indicated that retirement literacy is also positively correlated with
personal financial management as indicated by a coefficient of 0.764. The correlation
matrix further indicates that Tax return/insurance literacy is also strongly and positively
correlated with personal financial management as indicated by a coefficient of 0.784.
Credit and other liabilities literacy showed the highest correlation with personal financial
management as indicated by a strong correlation coefficient of 0.818.
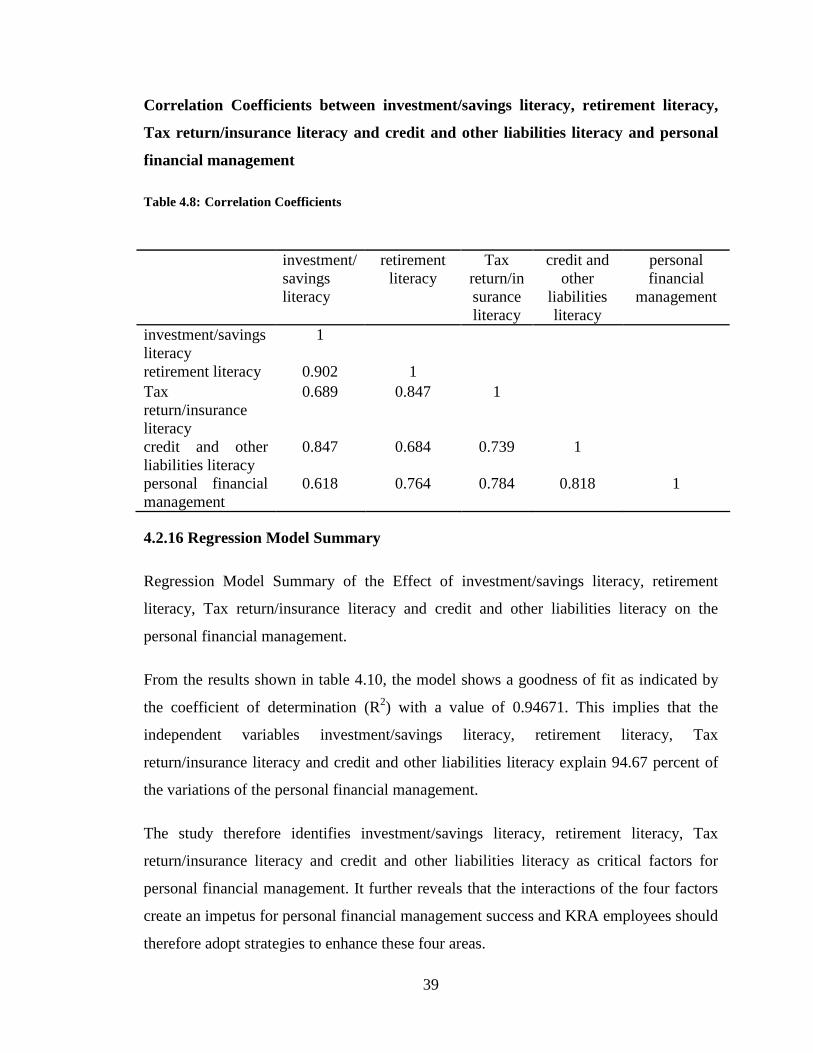
39
Correlation Coefficients between investment/savings literacy, retirement literacy,
Tax return/insurance literacy and credit and other liabilities literacy and personal
financial management
Table 4.8: Correlation Coefficients
4.2.16 Regression Model Summary
Regression Model Summary of the Effect of investment/savings literacy, retirement
literacy, Tax return/insurance literacy and credit and other liabilities literacy on the
personal financial management.
From the results shown in table 4.10, the model shows a goodness of fit as indicated by
the coefficient of determination (R2) with a value of 0.94671. This implies that the
independent variables investment/savings literacy, retirement literacy, Tax
return/insurance literacy and credit and other liabilities literacy explain 94.67 percent of
the variations of the personal financial management.
The study therefore identifies investment/savings literacy, retirement literacy, Tax
return/insurance literacy and credit and other liabilities literacy as critical factors for
personal financial management. It further reveals that the interactions of the four factors
create an impetus for personal financial management success and KRA employees should
therefore adopt strategies to enhance these four areas.
investment/savings literacy
retirement literacy
Tax return/insurance literacy
credit and other
liabilities literacy
personal financial
management
investment/savings literacy
1
retirement literacy 0.902 1 Tax return/insurance literacy
0.689 0.847 1
credit and other liabilities literacy
0.847 0.684 0.739 1
personal financial management
0.618 0.764 0.784 0.818 1
40
Table 4. 9: Coefficients
Unstandardized Coefficients
Standardized Coefficients
B Std. Error
Beta t Sig.
(Constant) 13.019 0.457 2.421 0.031 investment/savings literacy
0.034 0.057 0.006 0.034 0.098
retirement literacy 0.189 0.341 0.086 0.931 0.054
Tax return/insurance literacy
0.065 0.187 0.046 0.34 0.076
credit and other liabilities literacy
0.611 0.173 0.432 3.321 0.005
As per the R generated table above, the Y = β0 + β1X1 + β2X2 + β3X3 + β4X4 + ε
become:
Y = 13.019+ 0.034 (X1) + 0.189 (X2) + 0.065 (X3) + 0.611 (X4) + έ
The βi’s in the above equation represent the estimated parameters.
Where; Yi=Personal financial management
β = regression weight
έ = representing the error term
X1 is the investment/savings literacy
X2 is the retirement literacy
X3 is Tax return/insurance literacy
X4 is credit and other liabilities literacy
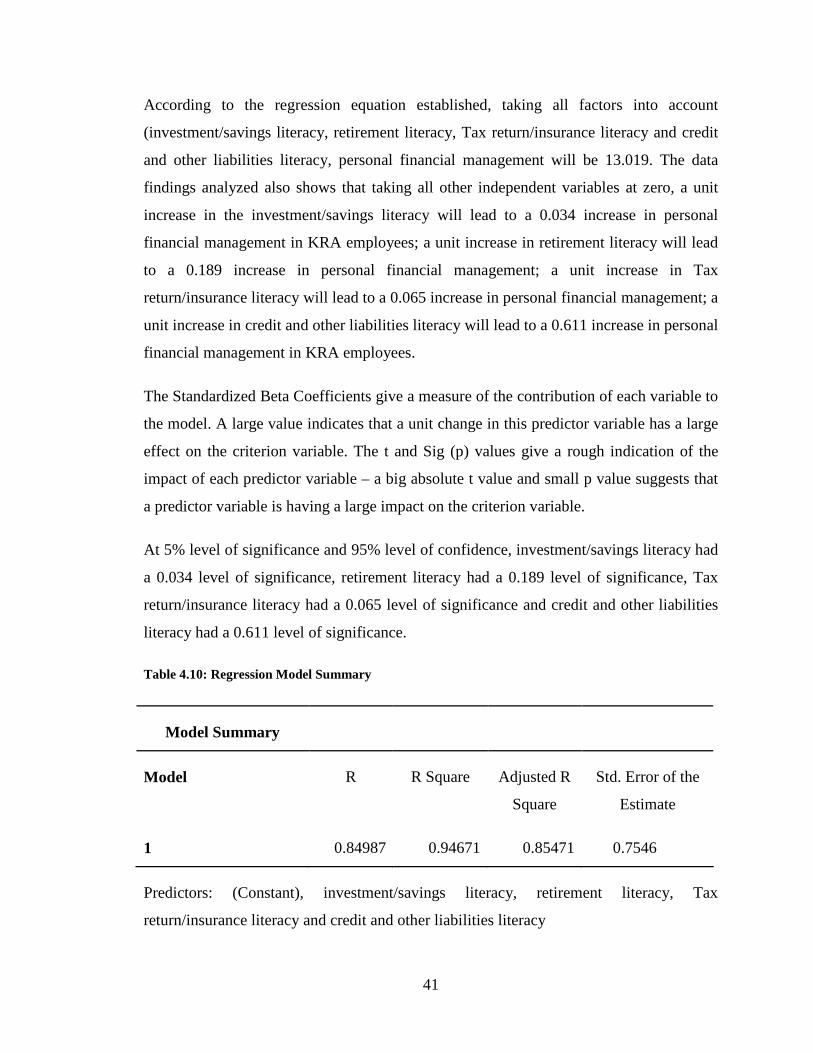
41
According to the regression equation established, taking all factors into account
(investment/savings literacy, retirement literacy, Tax return/insurance literacy and credit
and other liabilities literacy, personal financial management will be 13.019. The data
findings analyzed also shows that taking all other independent variables at zero, a unit
increase in the investment/savings literacy will lead to a 0.034 increase in personal
financial management in KRA employees; a unit increase in retirement literacy will lead
to a 0.189 increase in personal financial management; a unit increase in Tax
return/insurance literacy will lead to a 0.065 increase in personal financial management; a
unit increase in credit and other liabilities literacy will lead to a 0.611 increase in personal
financial management in KRA employees.
The Standardized Beta Coefficients give a measure of the contribution of each variable to
the model. A large value indicates that a unit change in this predictor variable has a large
effect on the criterion variable. The t and Sig (p) values give a rough indication of the
impact of each predictor variable – a big absolute t value and small p value suggests that
a predictor variable is having a large impact on the criterion variable.
At 5% level of significance and 95% level of confidence, investment/savings literacy had
a 0.034 level of significance, retirement literacy had a 0.189 level of significance, Tax
return/insurance literacy had a 0.065 level of significance and credit and other liabilities
literacy had a 0.611 level of significance.
Table 4.10: Regression Model Summary
Model Summary
Model R R Square Adjusted R
Square
Std. Error of the
Estimate
1 0.84987 0.94671 0.85471 0.7546
Predictors: (Constant), investment/savings literacy, retirement literacy, Tax
return/insurance literacy and credit and other liabilities literacy
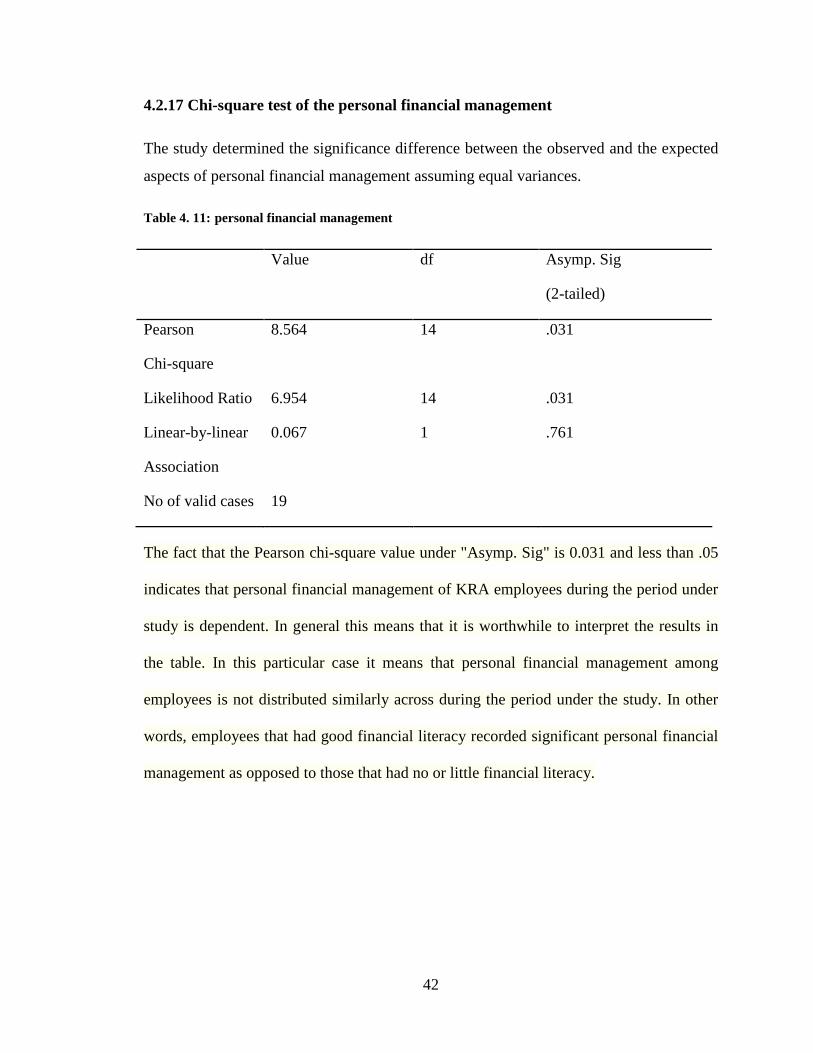
42
4.2.17 Chi-square test of the personal financial management
The study determined the significance difference between the observed and the expected
aspects of personal financial management assuming equal variances.
Table 4. 11: personal financial management
Value df Asymp. Sig
(2-tailed)
Pearson
Chi-square
8.564 14 .031
Likelihood Ratio 6.954 14 .031
Linear-by-linear
Association
0.067 1 .761
No of valid cases 19
The fact that the Pearson chi-square value under "Asymp. Sig" is 0.031 and less than .05
indicates that personal financial management of KRA employees during the period under
study is dependent. In general this means that it is worthwhile to interpret the results in
the table. In this particular case it means that personal financial management among
employees is not distributed similarly across during the period under the study. In other
words, employees that had good financial literacy recorded significant personal financial
management as opposed to those that had no or little financial literacy.
43
4.3 Summary and interpretation of findings
On gender the findings of the study showed that there are gender disparities hence
deducing that there may be need to address these disparities for different findings on the
effect of financial literacy on personal financial management. This is important since the
risk averseness of male respondents differs from that of their female counterparts.
Most respondents were aged between 31-34 years hence less worried about retirement as
they are still far away from the statutory retirement age of 60 years. The impact of the age
distribution of the respondent can be seen on the responses to certain aspects of financial
aspects like the retirement planning which showed that the respondents were to ‘a lesser
extent’ literate.
The findings of the study show that the respondents had reasonable education to execute
the roles assigned to them effectively and efficiently and make prudent financial
decisions. This is important for this study as the respondents’ level of education
eliminates the bias of uneducated respondents.
On the aspect of retirement planning, the study findings indicate that most respondents
indicated ‘not at all’ on their retirement plans and depicted that most of the respondents
were ‘to a small extent’ on the estate planning. The research findings also indicated that
most participants were ‘to a less extent’ on financial management practices relating to
liabilities and other credit facilities
On Financial Management Practices that included payment of rent/mortgage in full and
on-time, having daily, weekly or monthly budget that is followed and saving some money
at the end of the month, the results showed that most participants sometimes practiced
prudent financial management.
The correlation matrix in indicates that investment/savings literacy is strongly and
positively correlated with personal financial management, that retirement literacy is also
positively correlated with personal financial management, that tax return/insurance
literacy is also strongly and positively correlated with personal financial management and
44
Credit and other liabilities literacy showed the highest correlation with personal financial
management.
The regression model summary shows a goodness of fit as indicated by the coefficient of
determination (R2) with a value of 0.94671. This implies that the independent variables
investment/savings literacy, retirement literacy, Tax return/insurance literacy and credit
and other liabilities literacy explain 94.67 percent of the variations of the personal
financial management.
The study therefore identifies investment/savings literacy, retirement literacy, tax
return/insurance literacy and credit and other liabilities literacy as critical factors for
personal financial management. It further reveals that the interactions of the four factors
create an impetus for personal financial management success and KRA employees should
therefore adopt strategies to enhance these four areas.
According to the regression equation established, taking all factors into account
(investment/savings literacy, retirement literacy, tax return/insurance literacy and credit
and other liabilities literacy, personal financial management will be 13.019. The data
findings analyzed also shows that taking all other independent variables at zero, a unit
increase in the investment/savings literacy will lead to a 0.034 increase in personal
financial management in KRA employees; a unit increase in retirement literacy will lead
to a 0.189 increase in personal financial management; a unit increase in tax
return/insurance literacy will lead to a 0.065 increase in personal financial management; a
unit increase in credit and other liabilities literacy will lead to a 0.611 increase in personal
financial management in KRA employees.
The Standardized Beta Coefficients gave a measure of the contribution of each variable
to the model. A large value indicated that a unit change in this predictor variable has a
large effect on the criterion variable. The t and Sig (p) values gave a rough indication of
the impact of each predictor variable, a big absolute t value and small p value suggests
that a predictor variable is having a large impact on the criterion variable.
45
At 5% level of significance and 95% level of confidence, investment/savings literacy had
a 0.034 level of significance, retirement literacy had a 0.189 level of significance, Tax
return/insurance literacy had a 0.065 level of significance and credit and other liabilities
literacy had a 0.611level of significance.
The fact that the Pearson chi-square value under "Asymp. Sig" is 0.031 and less than .05
indicates that personal financial management of KRA employees during the period under
study is dependent. In general this means that it is worthwhile to interpret the results in
the table. In this particular case it means that personal financial management among
employees is not distributed similarly across during the period under the study. In other
words, employees that had good financial literacy recorded significant personal financial
management as opposed to those that had no or little financial literacy.
It can be therefore concluded from the findings of the study that the respondents were ‘to
a great extent’ on the aspect of financial literacy. The findings concur with Nyamute and
Monyoncho (2008) who surveyed on Employees of finance and banking institutions and
concluded that the practices of those perceived to be financially literate seem to agree
with the current literature. However their survey findings also showed that even those
perceived not to be financially literate exhibit some strong characteristics of personal
financial management implying that probably, formal college education and employment
environment may not be the only source of financial education.
These results on retirement planning, estate planning and financial management practices
may be as a result of failing to have financial education in high school as shown by
Bernheim, Garrett and Maki (2001), who argue that those who were exposed to financial
education programs while in high school were more likely to save later in life. They
further argue that recognizing individuals who possess limited literacy do not plan for
retirement which brings inevitably to the issue of mistakes. One such program could be to
require people to acquire some basic financial knowledge (Alesina and Lusardi, 2006).
The research findings correlation matrix in indicating that investment/savings literacy is
strongly and positively correlated with personal financial management, that retirement
literacy is positively correlated with personal financial management, that tax
46
return/insurance literacy is strongly and positively correlated with personal financial
management and that credit and other liabilities literacy is positively correlated with
personal financial management is in line with earlier study findings which confirmed the
positive association between knowledge and financial behaviour. For example Calvert,
Campbell, and Sodini (2005) find that more financially sophisticated households are
more likely to buy risky assets and invest more efficiently. Hilgerth, Hogarth, and
Beverly (2003) also document a positive link between financial knowledge and financial
behaviour.
47
CHAPTER FIVE
SUMMARY, CONCLUSIONS AND RECOMMENDATIONS
5.1 Summary
The objectives of the study were to establish the level of financial literacy and determine
the effect of financial literacy on personal financial management on Kenya revenue
authority employees in Nairobi.
Descriptive research design was adopted for this study. The population of the study was
the employees of KRA based in Nairobi which comprised of 2000 employees. To ensure
that all levels of employees are represented, the study used stratified random sampling
technique. The study used primary data collected from semi-structured questionnaires.
Quantitative data was analysed using descriptive statistics while qualitative data was
analysed using content analysis. Quantitative data was coded and entered into Statistical
Packages for Social Scientists (SPSS Version 17.0). Analysis was, then, based on
descriptive statistics. Multiple regression analysis to establish the relationship between
financial literacy and personal financial management using the variables
From the study findings, on gender issues male respondents are the dominant group than
their female counterparts and many of them aged between 31-34 years. On the duration
for employment, most respondents have worked between 6-10 years and many of the
participants are university graduates. On the KRA grade, most respondents were in KRA
grade 7 and above (supervisors and low level staff) according to the study findings.
The findings showed that on the aspects of financial literacy, the respondents were ‘to a
great extent’ literate and aware that they affect personal financial management. On the
level of literacy and the effects of retirement plans and the results of the findings revealed
that most participants were ‘to a less extent’ literate and consider it less important. On the
effects of estate planning, the respondents were ‘to a less extent literate’. On aspects on
credit and other liabilities where the respondents were ‘to a less extent’ literate and on the
insurance cover, the findings revealed that participant were ‘to a less extent’ literate. On
48
the tax return the respondents were ‘to a moderate’ extent literate and on the financial
management practices, the respondents indicated they sometimes practice them.
5.2 Conclusions
One of the objectives of the study was to determine the financial literacy of the
respondents. According to the findings of the study, it can be concluded that surely the
participants were ‘to a great extent’ that financial literacy indeed affects personal
financial management among the Kenya Revenue Authority employees.
The researcher also sought to establish effects of retirement plan on personal financial
management. The results of the findings conclude that most participants consider it ‘to a
less extent’ as important. This could be due to the age distribution of the respondents who
were mostly aged between 31-34 years hence viewing retirement as far.
The study findings further sought to establish whether estate planning affects personal
financial management. The results conclude that majority of the respondents were ‘to a
less extent’ aware if this is so. This is because financial literacy deficiencies can affect an
individual's day-to-day money management and ability to save for long-term goals.
From findings of the study on credit and other liabilities, the results also conclude that the
respondents were ‘to a less extent’ literate due to poor financial decisions. This can affect
savings and financial stability or independence.
The researcher sought to establish what the effects of insurance cover are on the
respondents. The findings conclude that majority indicated that it affects ‘to a less
extent’. This could be due to lack of specific education programs on this aspect of
financial management.
The study also determined effects of tax planning on personal financial management. The
results concluded that it moderately affected personal financial management while on the
financial management practices; the respondents indicated that they sometimes apply
them in their personal financial management.
49
5.3 Policy recommendations
From the research findings, it is recommended that financial literacy training programs
and program providers should offer comprehensive information on savings and credit.
The study further recommends that borrowers should plan on their expenditure habits and
meeting of obligations so as not be financially disabled by the magnitude of interest rates
changes.
Due to the increase of financial literacy, the study recommends to have the number and
variety of financial literacy training programs and program providers increased with
some offering comprehensive information on savings, and credit.
On estate planning, it is recommended that the respondents should be trained on how they
can run their day-to-day money management and ability to save for long term goals.
The study finally recommends that consumer’s should be given skills to manage their
personal finances effectively so that to create a more competitive and efficient
consumption and savings market
The study found out that most respondents indicated ‘not at all’ on their retirement plans.
These results may be as a result of failing to have financial education in high school as
shown by Bernheim, Garrett and Maki (2001), who argue that those who were exposed to
financial education programs while in high school were more likely to save later in life. It
is therefore important to have deliberate financial education programs for retirement
planning for all staff regardless of their ages and if possible from early ages in high
school.
50
5.4 Limitations of the Study
The research was met with various challenges when conducting the research that included
some of the respondents not free to give personal information as they considered it of
private nature and sometimes of competitive importance. Naturally people feel that
revealing information that shows inadequacies in their personal management aspect can
be embarrassing especially where they are not assured of confidentiality. Some
respondents may have felt that the information on how well they know certain aspects of
financial management and exploit for financial gain was to important to share in the
questionnaires hence some respondents may have been biased or dishonest in their
answers.
The research having been limited to only employees of KRA in Nairobi had limitations in
terms of the limited location of employees who may be more being in the city with its
many financial challenges and the findings also may not be necessarily applicable to
other organizations.
Since more respondents from across the country would have been essential to increase
the representation of the KRA team in this study and to allow for better reliability and
consistency of the information given, a lot of time and finances were needed to collect
information from the respondents. Time and financial limitations made it impractical to
include more respondents in the study.
The study also was carried out at a specific point in time which in mid May 2013. The
limitation is that the study does not capture the financial literacy levels of the respondents
and their financial management practices over a period of time. This is important since
rational consumers have changing knowledge levels, preferences over a period of time.
5.5 Suggestions for further studies
This study focused on the effect of financial literacy on personal financial management
on Kenya Revenue Authority employees. It is therefore recommended that similar
51
researches should be replicated in other organizations and the results be compared so as
to establish whether there is consistency on effect of financial literacy on personal
financial management among respondents in the various organizations.
Many strategies on financial literacy aimed at influencing the effects of financial literacy
on personal financial management do not realize expected results because of many
reasons. It would be interesting to conduct studies exploring implementation of the
strategies and to find out the impact of the various financial literacy programs in place in
KRA and other organizations in the area of financial literacy and personal financial
management.
It is also recommended that similar studies to this one on respondents be carried out over
a period of time. This is important in order to capture their financial literacy levels and
financial management practices over a period of time since rational consumers have
changing knowledge levels, preferences over a period of time.
This study focused on the effect of financial literacy on personal financial management
on Kenya Revenue Authority employees in Nairobi. It is therefore recommended that a
study be carried among KRA employees from across the country in order to increase
reliability and consistency of the findings
52
REFERENCES
Agarwal, S., J. Driscoll, X. Gabaix, and D. Laibson (2007). “The Age of Reason: Financial Decisions over the Lifecycle,” mimeo, Harvard University. Agnew, J.R. & Szykman, L.R. (2005). Asset allocation and information overload: The
influence of information display, asset choice, and investor experience. Journal of
Behavioral Finance, 6, 57-70.
Alesina, Alberto, and Annamaria Lusardi (2006). “Driving Your Financial Investment?
Perhaps a License is Needed.” Dartmouth College. Retrieved from
http://www.dartmouth.edu/~vox/0607/0724/lusardi.html
Ando, A., and Modligliani, F.(1963). "The Life-Cycle Hypothesis of Saving: Aggregate
Implications and Tests." American Economic Review 53 (1963): 55–84.
Anthes, W.L. (2004). Financial illiteracy in America: a perfect storm, a perfect opportunity.
Journal of Financial Service Professionals, 58(6):49–56
Antonides, Gerrit (2008), 'Comparing Models of Consumer Behaviour,' in Alan Lewis (ed.),
The Cambridge Handbook of Psychology and Economic Behaviour. Cambridge, UK:
Cambridge University Press, pp. 227-252.
Arkes, Hal R. (1991). 'Costs and Benefits of Judgment Errors: Implications for Debiasing,'
Psychological Bulletin, 110 (3), 486-498.
Bandura, Albert (1977). 'Self-Efficacy: Toward a Unifying Theory of Behavioral Change,'
Psychological Review, 84 (2), 191-215.
Bennett, J. (2006). Spend cycle. Newsweek, August 8, 2006.
Bernheim, D. and Garrett, D. (2003). The effects of financial education in the workplace:
evidence from a survey of households. Journal of Public Economics Vol. 87,
1487-1519.
Bernheim, D., Garrett, D. and Maki, D. (2001), “Education and Saving: The Long-
term Effects of High School Financial Curriculum Mandates,” Journal of Public
Economics, 85, pp. 435-565.
Beutler, I. F., & Mason, J. W. (1987). Family cash flow budgeting. Home Economics
Research Journal, 16, 3-12.
Braunstein, S., & Welch, C. (2002). Financial literacy: An overview of practice, research
and policy. Federal Reserve Bulletin, 88, (11), 445-457.
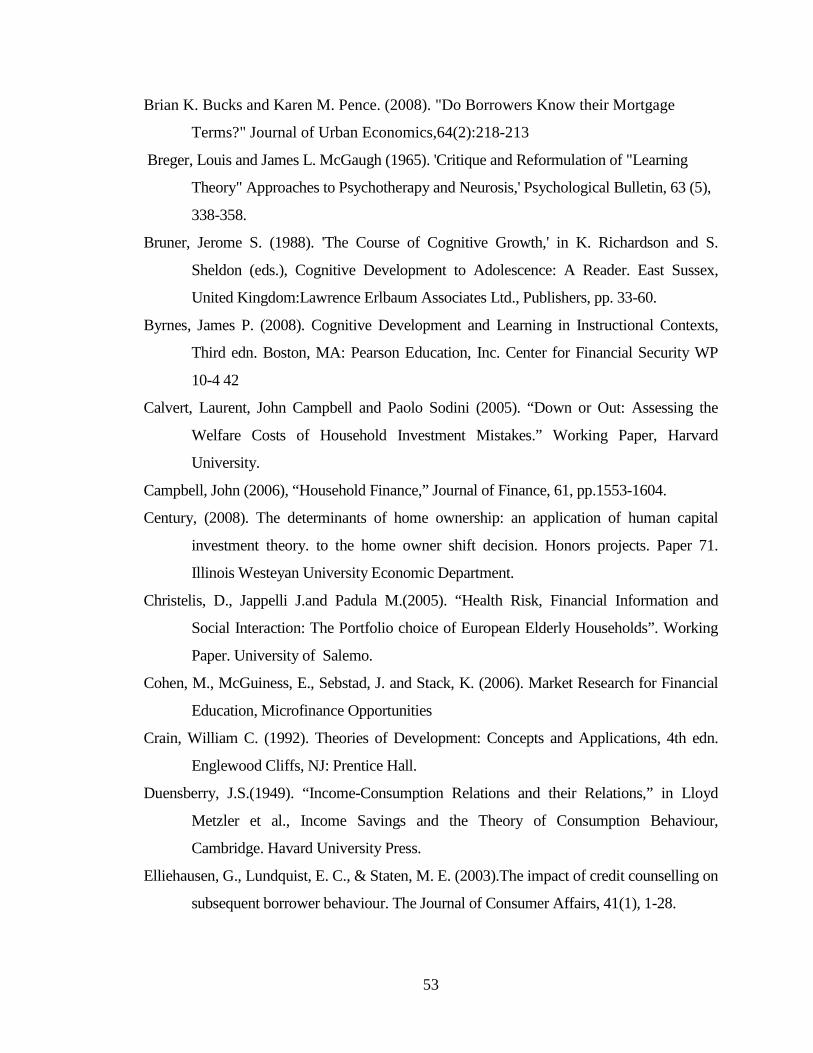
53
Brian K. Bucks and Karen M. Pence. (2008). "Do Borrowers Know their Mortgage
Terms?" Journal of Urban Economics,64(2):218-213
Breger, Louis and James L. McGaugh (1965). 'Critique and Reformulation of "Learning
Theory" Approaches to Psychotherapy and Neurosis,' Psychological Bulletin, 63 (5),
338-358.
Bruner, Jerome S. (1988). 'The Course of Cognitive Growth,' in K. Richardson and S.
Sheldon (eds.), Cognitive Development to Adolescence: A Reader. East Sussex,
United Kingdom:Lawrence Erlbaum Associates Ltd., Publishers, pp. 33-60.
Byrnes, James P. (2008). Cognitive Development and Learning in Instructional Contexts,
Third edn. Boston, MA: Pearson Education, Inc. Center for Financial Security WP
10-4 42
Calvert, Laurent, John Campbell and Paolo Sodini (2005). “Down or Out: Assessing the
Welfare Costs of Household Investment Mistakes.” Working Paper, Harvard
University.
Campbell, John (2006), “Household Finance,” Journal of Finance, 61, pp.1553-1604.
Century, (2008). The determinants of home ownership: an application of human capital
investment theory. to the home owner shift decision. Honors projects. Paper 71.
Illinois Westeyan University Economic Department.
Christelis, D., Jappelli J.and Padula M.(2005). “Health Risk, Financial Information and
Social Interaction: The Portfolio choice of European Elderly Households”. Working
Paper. University of Salemo.
Cohen, M., McGuiness, E., Sebstad, J. and Stack, K. (2006). Market Research for Financial
Education, Microfinance Opportunities
Crain, William C. (1992). Theories of Development: Concepts and Applications, 4th edn.
Englewood Cliffs, NJ: Prentice Hall.
Duensberry, J.S.(1949). “Income-Consumption Relations and their Relations,” in Lloyd
Metzler et al., Income Savings and the Theory of Consumption Behaviour,
Cambridge. Havard University Press.
Elliehausen, G., Lundquist, E. C., & Staten, M. E. (2003).The impact of credit counselling on
subsequent borrower behaviour. The Journal of Consumer Affairs, 41(1), 1-28.
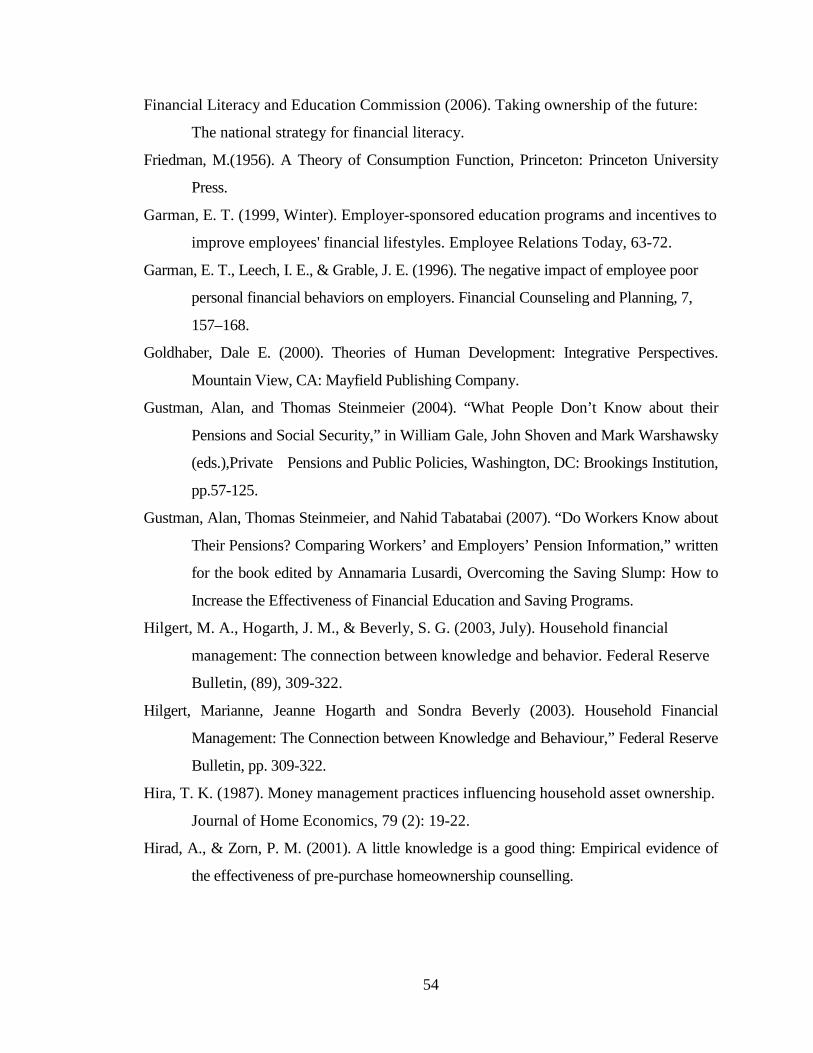
54
Financial Literacy and Education Commission (2006). Taking ownership of the future:
The national strategy for financial literacy.
Friedman, M.(1956). A Theory of Consumption Function, Princeton: Princeton University
Press.
Garman, E. T. (1999, Winter). Employer-sponsored education programs and incentives to
improve employees' financial lifestyles. Employee Relations Today, 63-72.
Garman, E. T., Leech, I. E., & Grable, J. E. (1996). The negative impact of employee poor
personal financial behaviors on employers. Financial Counseling and Planning, 7,
157–168.
Goldhaber, Dale E. (2000). Theories of Human Development: Integrative Perspectives.
Mountain View, CA: Mayfield Publishing Company.
Gustman, Alan, and Thomas Steinmeier (2004). “What People Don’t Know about their
Pensions and Social Security,” in William Gale, John Shoven and Mark Warshawsky
(eds.),Private Pensions and Public Policies, Washington, DC: Brookings Institution,
pp.57-125.
Gustman, Alan, Thomas Steinmeier, and Nahid Tabatabai (2007). “Do Workers Know about
Their Pensions? Comparing Workers’ and Employers’ Pension Information,” written
for the book edited by Annamaria Lusardi, Overcoming the Saving Slump: How to
Increase the Effectiveness of Financial Education and Saving Programs.
Hilgert, M. A., Hogarth, J. M., & Beverly, S. G. (2003, July). Household financial
management: The connection between knowledge and behavior. Federal Reserve
Bulletin, (89), 309-322.
Hilgert, Marianne, Jeanne Hogarth and Sondra Beverly (2003). Household Financial
Management: The Connection between Knowledge and Behaviour,” Federal Reserve
Bulletin, pp. 309-322.
Hira, T. K. (1987). Money management practices influencing household asset ownership.
Journal of Home Economics, 79 (2): 19-22.
Hirad, A., & Zorn, P. M. (2001). A little knowledge is a good thing: Empirical evidence of
the effectiveness of pre-purchase homeownership counselling.
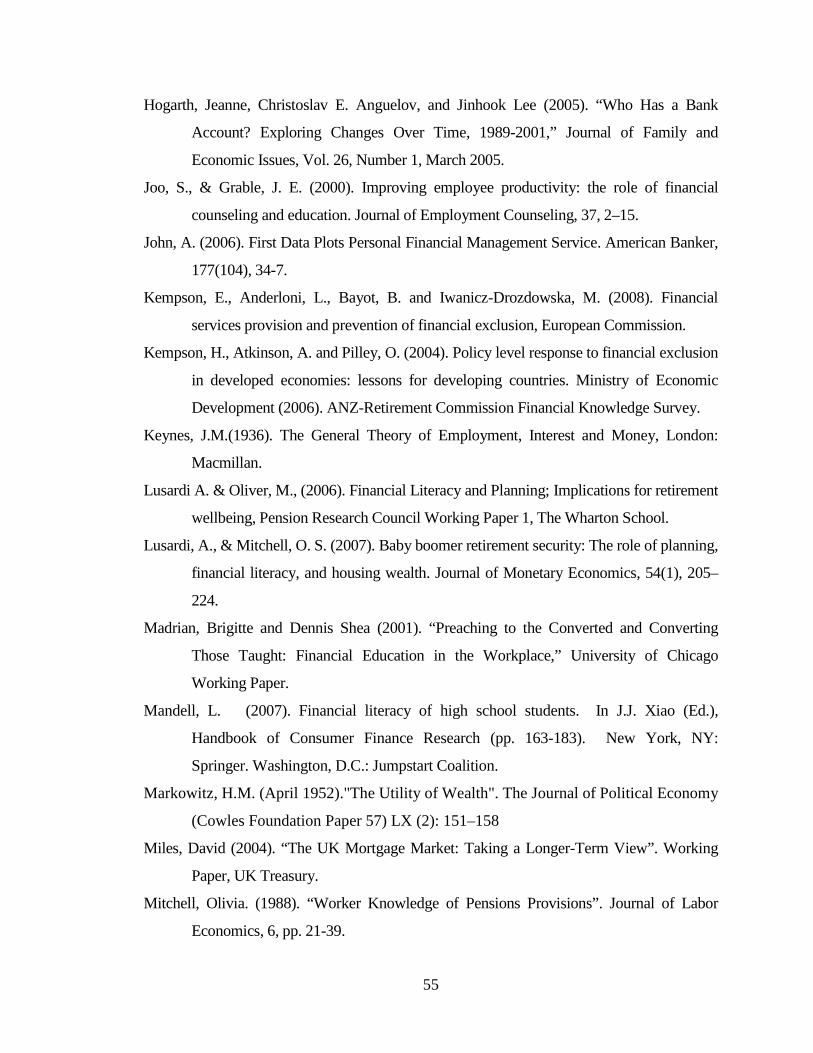
55
Hogarth, Jeanne, Christoslav E. Anguelov, and Jinhook Lee (2005). “Who Has a Bank
Account? Exploring Changes Over Time, 1989-2001,” Journal of Family and
Economic Issues, Vol. 26, Number 1, March 2005.
Joo, S., & Grable, J. E. (2000). Improving employee productivity: the role of financial
counseling and education. Journal of Employment Counseling, 37, 2–15.
John, A. (2006). First Data Plots Personal Financial Management Service. American Banker,
177(104), 34-7.
Kempson, E., Anderloni, L., Bayot, B. and Iwanicz-Drozdowska, M. (2008). Financial
services provision and prevention of financial exclusion, European Commission.
Kempson, H., Atkinson, A. and Pilley, O. (2004). Policy level response to financial exclusion
in developed economies: lessons for developing countries. Ministry of Economic
Development (2006). ANZ-Retirement Commission Financial Knowledge Survey.
Keynes, J.M.(1936). The General Theory of Employment, Interest and Money, London:
Macmillan.
Lusardi A. & Oliver, M., (2006). Financial Literacy and Planning; Implications for retirement
wellbeing, Pension Research Council Working Paper 1, The Wharton School.
Lusardi, A., & Mitchell, O. S. (2007). Baby boomer retirement security: The role of planning,
financial literacy, and housing wealth. Journal of Monetary Economics, 54(1), 205–
224.
Madrian, Brigitte and Dennis Shea (2001). “Preaching to the Converted and Converting
Those Taught: Financial Education in the Workplace,” University of Chicago
Working Paper.
Mandell, L. (2007). Financial literacy of high school students. In J.J. Xiao (Ed.),
Handbook of Consumer Finance Research (pp. 163-183). New York, NY:
Springer. Washington, D.C.: Jumpstart Coalition.
Markowitz, H.M. (April 1952)."The Utility of Wealth". The Journal of Political Economy
(Cowles Foundation Paper 57) LX (2): 151–158
Miles, David (2004). “The UK Mortgage Market: Taking a Longer-Term View”. Working
Paper, UK Treasury.
Mitchell, Olivia. (1988). “Worker Knowledge of Pensions Provisions”. Journal of Labor
Economics, 6, pp. 21-39.
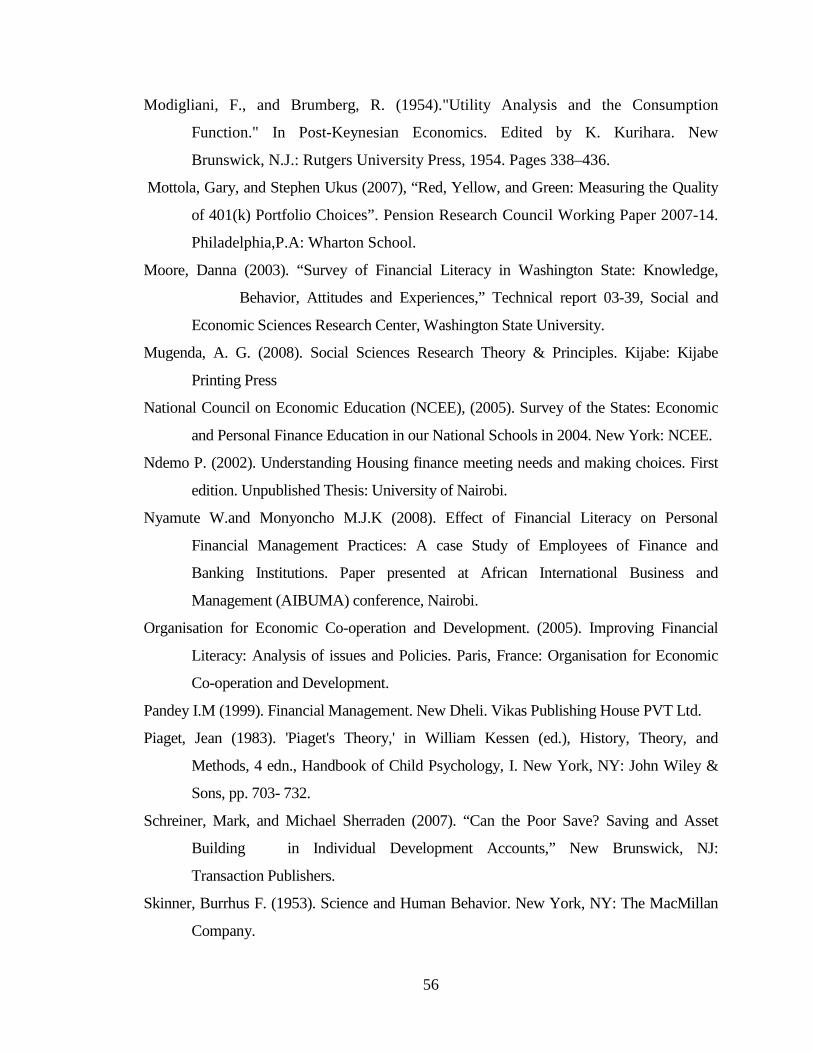
56
Modigliani, F., and Brumberg, R. (1954)."Utility Analysis and the Consumption
Function." In Post-Keynesian Economics. Edited by K. Kurihara. New
Brunswick, N.J.: Rutgers University Press, 1954. Pages 338–436.
Mottola, Gary, and Stephen Ukus (2007), “Red, Yellow, and Green: Measuring the Quality
of 401(k) Portfolio Choices”. Pension Research Council Working Paper 2007-14.
Philadelphia,P.A: Wharton School.
Moore, Danna (2003). “Survey of Financial Literacy in Washington State: Knowledge,
Behavior, Attitudes and Experiences,” Technical report 03-39, Social and
Economic Sciences Research Center, Washington State University.
Mugenda, A. G. (2008). Social Sciences Research Theory & Principles. Kijabe: Kijabe
Printing Press
National Council on Economic Education (NCEE), (2005). Survey of the States: Economic
and Personal Finance Education in our National Schools in 2004. New York: NCEE.
Ndemo P. (2002). Understanding Housing finance meeting needs and making choices. First
edition. Unpublished Thesis: University of Nairobi.
Nyamute W.and Monyoncho M.J.K (2008). Effect of Financial Literacy on Personal
Financial Management Practices: A case Study of Employees of Finance and
Banking Institutions. Paper presented at African International Business and
Management (AIBUMA) conference, Nairobi.
Organisation for Economic Co-operation and Development. (2005). Improving Financial
Literacy: Analysis of issues and Policies. Paris, France: Organisation for Economic
Co-operation and Development.
Pandey I.M (1999). Financial Management. New Dheli. Vikas Publishing House PVT Ltd.
Piaget, Jean (1983). 'Piaget's Theory,' in William Kessen (ed.), History, Theory, and
Methods, 4 edn., Handbook of Child Psychology, I. New York, NY: John Wiley &
Sons, pp. 703- 732.
Schreiner, Mark, and Michael Sherraden (2007). “Can the Poor Save? Saving and Asset
Building in Individual Development Accounts,” New Brunswick, NJ:
Transaction Publishers.
Skinner, Burrhus F. (1953). Science and Human Behavior. New York, NY: The MacMillan
Company.
57
Stango, Victor and Jonathan Zinman (2006). “Fuzzy Math and Red Ink: Payment/Interest
Bias, Intertemporal Choice and Wealth Accumulation.” Working Paper, Dartmouth
College.
Stango, Victor, and Jonathan Zinman (2007). “Fuzzy Math and Red Ink: When the
Opportunity Cost of Consumption is Not What It Seems,” Working Paper,
Dartmouth College.
Stewart, R. (2005). Income and spending decline in January, Personal Income Estimates.
Bureau of Economic Analysis, U.S. Department of Commerce.
Titus, P. M., Fanslow, A. M., & Hira, T. K. (1989). Effect of financial management
knowledge of household money managers on behaviours and outputs. Journal of
Vocational Home Economics Education, 7 (1): 58-70.
Volpe, R. P., Chen, H., & Liu, S. (2006). An analysis of the importance of personal finance
topics and the level of knowledge possessed by working adults. Financial Services
Review, 15, 81–99.
Webster, Richard (1995). Why Freud Was Wrong: Sin, Science, and Psychoanalysis. New
York, NY: Basic Books.
White, C. (2005). Statement of Clifford J. White III, Acting Director Executive Office
for United States trustees. United States Department of Justice. Retrieved from:
http://www.abiworld.org/pdfs/s256/White.pdf
58
APPENDIX II: RESEARCH QUESTIONNAIRE
Instructions: (Please read the instructions given and answer the questions as
appropriately as possible). It is advisable you answer or fill in each section as provided.
Make an attempt to answer every question fully and correctly.
SECTION A: DEMOGRAPHIC INFORMATION
1. Gender : Male [ ] Female [ ]
2. Please indicate your age bracket:
Below 24 Years [ ] 25 - 30 Years [ ] 31 - 34 years [ ] 35 – 40 years [ ]
41 – 44 years [ ] 45 – 50 years [ ] Over 51 years [ ]
3. For how long have you served in employment?
Less than 5 years [ ] 6 – 10 years [ ]
11 – 15 years [ ] 16 years and more [ ]
4. What is your highest level of education?
Certificate/ Diploma [ ] Graduate [ ]
Post-Graduate [ ]
5. What is your current KRA grade?
Below KRA 3 [ ] KRA 3 – 4 [ ]
KRA 5 – 6 [ ] KRA 7 and above [ ]
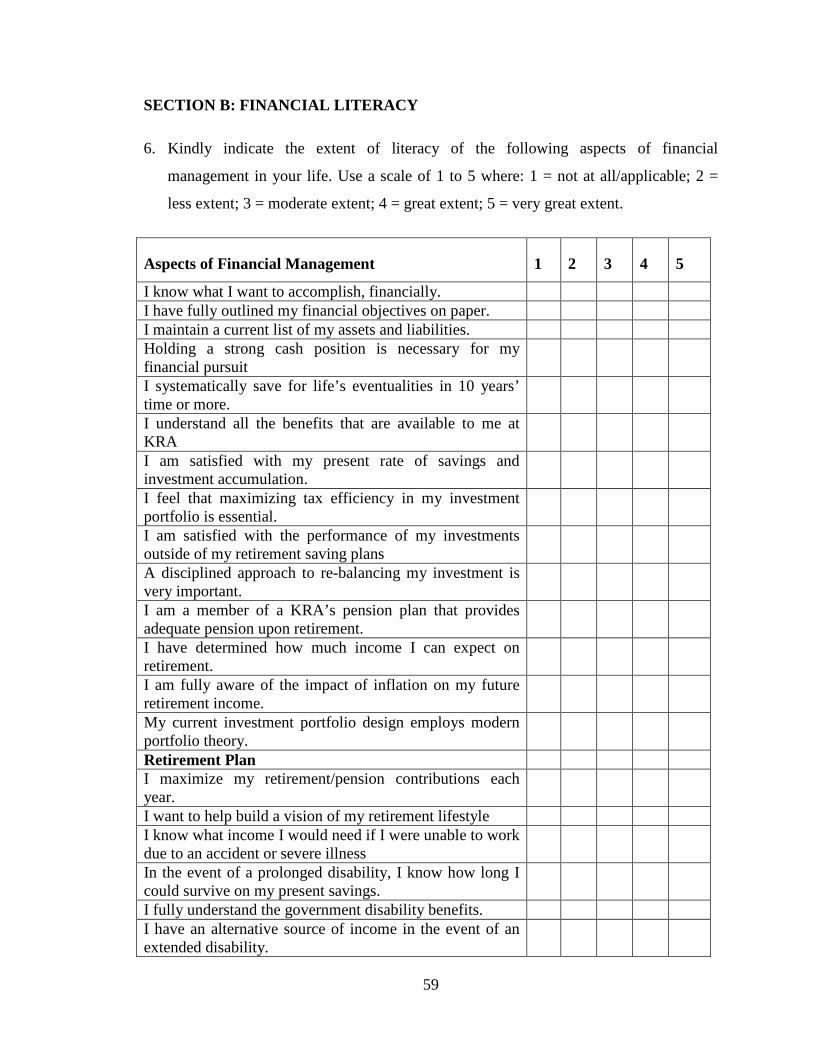
59
SECTION B: FINANCIAL LITERACY
6. Kindly indicate the extent of literacy of the following aspects of financial
management in your life. Use a scale of 1 to 5 where: 1 = not at all/applicable; 2 =
less extent; 3 = moderate extent; 4 = great extent; 5 = very great extent.
Aspects of Financial Management 1 2 3 4 5
I know what I want to accomplish, financially. I have fully outlined my financial objectives on paper. I maintain a current list of my assets and liabilities. Holding a strong cash position is necessary for my financial pursuit
I systematically save for life’s eventualities in 10 years’ time or more.
I understand all the benefits that are available to me at KRA
I am satisfied with my present rate of savings and investment accumulation.
I feel that maximizing tax efficiency in my investment portfolio is essential.
I am satisfied with the performance of my investments outside of my retirement saving plans
A disciplined approach to re-balancing my investment is very important.
I am a member of a KRA’s pension plan that provides adequate pension upon retirement.
I have determined how much income I can expect on retirement.
I am fully aware of the impact of inflation on my future retirement income.
My current investment portfolio design employs modern portfolio theory.
Retirement Plan I maximize my retirement/pension contributions each year.
I want to help build a vision of my retirement lifestyle I know what income I would need if I were unable to work due to an accident or severe illness
In the event of a prolonged disability, I know how long I could survive on my present savings.
I fully understand the government disability benefits. I have an alternative source of income in the event of an extended disability.

60
I feel confident that the present health care system can support my needs in the event of a major illness
Estate Planning I have a will I understand what a trust is Estate planning is important to me Having estate planning leave me peace of mind if I were to pass away
I understand the available government death benefits All of my beneficiary/guardian designations are up to date I understand how taxes will be applied to my estate My executor is familiar with the location of my will and estate plan
Credit and Other Liabilities I pay off the full credit card outstanding amount every month
I pay my mortgage and hire purchase installments on time every month
Personal loans offer by financial institutions in the market is a convenient tool for me to use- I can borrow for any reason at any point of time
Insurance Cover I do not have any insurance I have enough insurance to ensure that if I were to pass away or become sick or be disabled, my family and I would not suffer financially or be financially disabled
Currently I have life insurance but no other type of insurance i.e. health or critical illness, personal accident, or insurance on my properties such as car and house
I can distinguish the different types of insurance policies offer in the market
Tax Return I manage my own taxes I utilize the various tax relieves/rebate that I am entitled to when I am filing in my tax return

61
SECTION C: PERSONAL FINANCIAL MANAGEMENT
7. The following are statements regarding an individual financial management
practices. Please select the most appropriate answer to each of the following questions:
Use a scale of 1 to 6 where: 1 = not applicable; 2 = Never; 3 = Rarely; 4=Sometimes; 5 =
Usually; 6 = Always.
Financial Management Practices
Not
A
pplic
able
Nev
er
Rar
ely
Som
etim
es
Usu
ally
Alw
ays
I pay my credit card bills in full each month I pay my rent/mortgage in full and on-time I pay my utilities (water, electric) in full and on-time I max out or go over the limit on my credit card(s) I spend more in a month than I earn I use alternative sources of credit (e.g. shy-lock lender)
My account has a positive balance at the end of the month
I balance my credit/debit account each month I have checks returned because of insufficient funds (bounced checks)
I have taken overdrafts I have a daily, weekly or monthly budget that I follow I set aside some money each month for savings I am a respected member of a SACCO(s)
THANK YOU FOR YOUR TIME