Embed Size (px)
Citation preview
International Journal of Economics, Commerce and Management United Kingdom Vol. IV, Issue 12, December 2016
Licensed under Creative Common Page 445
http://ijecm.co.uk/ ISSN 2348 0386
EFFECT OF FINANCIAL LEVERAGE ON PROFITABILITY OF
LISTED AGRICULTURAL FIRMS AT THE NAIROBI
SECURITIES EXCHANGE
David Chesang
Accountant (C. P. A.), Baringo County Government, Kenya
Caroline Okello Ayuma
Lecturer, Kisii University, School of Business and Economics, Kenya
Abstract
The financial leverage decisions made by a firm are a vital one as the performance of a firm is
directly affected by such decision; hence, managers should trade with concern when taking
debt-equity mix decisions. The objective of the study was to examine the effect of financial
leverage on profitability of agricultural firms listed at the Nairobi Securities Exchange. The
specific objectives were to, determine the effect of debt to equity ratio on the profitability of listed
agricultural firms at Nairobi Securities Exchange, the effect of long term debt to capital
employed on Nairobi securities exchange, determine the effect of current ratio on the profitability
of listed agricultural firms at Nairobi securities exchange and to establish the effect of firm size
on the profitability of agricultural firms listed at the Nairobi securities exchange. The study was
anchored on four theories i.e. pecking order Theory, Agency theory, Tradeoff theory and Net
income theory. The study used a descriptive research design. The study targeted 66 listed firms
at Nairobi securities exchange and a target population of all the seven agricultural firms listed at
the Nairobi securities Exchange. The study used regression model to determine the effect of
independent and dependent variables under study. The Time series secondary data was
collected from the publications of Nairobi securities exchange and Capital Markets Authority,
Statistical Bulletins, Economic and Financial Reviews, and Annual Reports and Statement of
Accounts from the respective firms. The study established that debt to equity ratio and current
© Chesang & Ayuma
Licensed under Creative Common Page 446
ratio have a statistically significant effect on the profitability of agricultural firms listed at the
Nairobi Securities Exchange while long term debt to total capital employed, and firm size did not
have a statistically significant effect on the profitability of agricultural firms listed at the Nairobi
Securities Exchange. Following these the study recommended that agricultural firms consider
finding out the best mix of capital structure that does not negatively affect profitability; devising
strategies on how to reap best from the associated size benefits in the quest of making more
profits; mobilizing resources for non-current assets / fixed assets so as to enhance their long
term loan borrowing capacity; and ensuring that the current ratio is maintained at most minimum
since for this can help boost the firms’ profitability. The management of these firms, the
government of Kenya can use these findings in guiding the review or development of
appropriate financial policies and guidelines that enhance the efficacy of financial leverage in
positively affecting profitability.
Keywords: Financial leverage, profitability, agricultural firms, Nairobi Securities Exchange,
capital structure
INTRODUCTION
An increase in leverage result in increased return and risk, while decrease in leverage result in
decreased return and risk. There are two types of leverage that is operating and financial
leverage, financial leverage is the use of the fixed charges of resources, that is preference and
debt capital along with the owners‟ equity in the capital structure while operating leverage is
degree in which the firms uses much of fixed expenses, the higher the fixed expense the higher
the operating leverage.
Studies worldwide demonstrate how important financial leverage is influencing
profitability in companies. Most have found a significant relationship between the two but
varying extent. Such studies include: in the Kingdom of Jordan (Al-Shamaileh & Khanfar, 2014),
in Pakistan (Nawaz, Salmani & Shamsi, 2015) who found that financial leverage has a
statistically significant inverse impact on profitability at 99% confidence interval; in China on the
relationship between operational leverage and profitability (Chen, 2004); in Tehran, Iran on the
relationship among financial leverage and profitability (Fengju, Fard, Maher and Akhteghan,
2013).Other examples include Banchuenvijit (2011) in Thailand and Srivastava (2014) in India
who established a positive relationship amid financial leverage and profitability.
The association between the two types of leverage is also demonstrated in several
studies in Africa such as: Enekwe, Agu and Eziedo (2014) in Nigeria, Boachie, Boachie, Ezidisi,
International Journal of Economics, Commerce and Management, United Kingdom
Licensed under Creative Common Page 447
Nyanese and Gyabeng (2013) in Ghana and Joshau, (2007) in South Africa. In East Africa,
there is the study by Ishuza (2015) who sought to the effect of financial leverage on commercial
banks‟ profitability in Tanzania. In Kenya there are studies such as Gweyi and Karanja (2014)
on the effect of financial leverage on financial performance of Deposit Taking Savings and
Credit Co-operative in Kenya; and Kale (2014) on the impact of financial leverage on firm
performance: the case of non-financial firms in Kenya; and Mule (2015) on the financial
leverage and performance of listed firms in a frontier market: panel evidence from Kenya. All
these studies revealed a significant relationship between financial leverage and profitability.
However, these studies did not look relationship in Agricultural firms listed with the Nairobi Stock
Exchange.
In Pakistan, Al-Taani, (2013) carried out a study on how financial leverage measures
firms use of debt and equity to finance firm assets and its operations. A firm can fund its
investments portfolio through debt and equity. A company can also employ preference capital
as another form of capital. The company's rate of return on assets is fixed regardless of the rate
of interest on debt. The financial leverage used by companies is meant to earn more funds on
their fixed charges than operation cost. As debt increases, financial leverage increases (Al-
Taani, 2013; Mohammed, 2010).The increased financial leverage means an increase in the
company‟s capacity and thus, enhances its capacity of making much profits.
Financial leverage decision is important since the operation is precisely affected by such
choice; hence, the choice of combination between equity and debt should be handled by
financial managers with concern, since the seminar paper of Modigliani and Miller in 1958 the
capital structure theory and interaction with firms‟ performance there has been conformity with
current findings (Al-Taani, 2013; Mohammed, 2010; Ogebe. P, Ogebe & Alewi, 2013).
Modigliani and Miller (1958) assert that worthlessness of equity to debt proportion for company
worth. However, since they considered the assumptions of perfect markets with no taxes, and
no bankruptcy transaction costs, the theory about the debt irrelevance is hardly realistic (Osman
& Mohammed 2010, Ogebe, Ogebe & Alewi, 2013).Financial leverage, thus therefore has an
effect on profitability. Since low debt results into limited ability to add more productive assets.
Myers and Majluf (2004) carried out a study on the impact of asymmetric information on
firms choice for source of funds, the study used a descriptive one where 342 agribusiness firms
in Canada were sampled, the study found that in the existence of asymmetric material, internal
source of finance is mostly preferred by the firm other than other funds , but debt will be issued
if internal finance is exhausted, the least alternative for the company is to issue new equity
shares, profitable companies are likely to have more retained earnings. Donaldson, (2001)
carried out a study on the relationship between leverage and past profitability in Canadian
© Chesang & Ayuma
Licensed under Creative Common Page 448
consultancy firms where a sample of 235 firms were used. The study revealed that a negative
relationship is anticipated between leverage and past profitability. The study therefore
concluded that investors will prefer to invest in gainful companies. Since the more the profitable
the firm is, the lower the likelihood of facing financial problems which leads to bankruptcy.
Hence, a positive relationship is anticipated between institutional profitability and ownership.
Hovakimian et al. (2004) carried a study to determine the effect of growth potential of dairy firms
to investors in UK where 312 firms were involved, using exploratory research design he found
that high growth dairy firms bring more capital gains to influential investors than lower growth
ones, growing firms are more severe to agency hitches, in that they are more flexible in their
choice of becoming company investments. So, it‟s anticipated that growth rate and long term
leverage are negatively related.
Studies in various countries in the world have shown different associations between
leverage and financial performance. While examining the capital structure and performance of
firms in USA, UK, France and Japan, Wald (2009) found a positive association amongst size
and financial performance. However, there was a negative association for firms in Germany. In
China, Chen (2004) also established a negative association amongst long-term leverage and
financial performance. This disparity in results necessitates a study in Kenya.
The role of financial leverage in increasing the return of the shareholders' is based on
the belief that subject to change in funds such as the lending from financial institutions and other
sources for example debentures should be obtained at a value less than the organization rate of
return on total assets. Damouri, et al (2013) carried a study on firms in South Africa and defined
using of equity as risk charge involved and can be measured by leverage ratio. They add that
there are various measures known for measuring the capital structure and commonly used are,
market value based measures,book value based measures and semi- market value based
measures.
Financial leverage impacts earnings per share or profit after tax. The combination of two
leverage has importance to the earnings attributable to ordinary shareholders (Pandey, 2010,
Ogebe, Ogebe & Alewi, 2013). Al-Taani (2012) they posed that impact of financial performance
on working capital management policy and financial leverage. From their studies showed that
firm's working capital management policy, represented by financial leverage and firm size have
significant relationship to firms‟ performance in respect to net income however found no
significant impact on Return on equity and return on Assets.
The firm size has the potential to influence the firm's financial performance in form of the
preference of capital structure mix. As big companies have advantageous position in raising
external funds easily from the capital markets, also there is less reliance on internal funds.
International Journal of Economics, Commerce and Management, United Kingdom
Licensed under Creative Common Page 449
Moreover, the probability of bankruptcy is lower in larger firms; therefore, they are likely to pay
dividends (Osman et al; 2013). Small firms suffer from financial restrictions. Furthermore, the
cash flow of these companies did not show any significant impact on investment. They indicated
that the theory of pecking order and FCF theory do not have any effect on medium firms'
investment. Size, capital, ownership structure and growth opportunities play important roles in
the choice of performance measure.
Adekunle (2009) did a research to examine effect of capital structure on the performance
of pharmaceuticals in Nigeria, he used debt ratio to stand on capital structure thoughreturn on
equity and return on asset were used as measures of firm‟s performance. Ordinary Least
Square method of estimation were used by the researcher. The result of the study indicated that
debt ratio has an important negative effect on the company‟s financial actions of performance.
However, the study did not consider other funding choices in the inquiry, including the
intervening effect of internal cash flow available.
Kaumbuthu (2011) carried out a study to establish the association amongst capital
structure and return on equity for allied and industrial segment in Nairobi Securities Exchange
for the years between 2004 to 2008. Capital structure were proxy by debt to equity ratio while
performance concentrated on return on equity. The research used regression analysis and
found a negative association between equity to debt ratio and Return on equity. The research
focused on only one segment of the companies listed in Nairobi Securities Exchange and
concentrated only on one aspect of financing decisions. Agriculture remains the backbone of the
Kenyan economy. Agriculture is considered be the most important sector in the economy, this
sector is considered to contributing approximately 25% of the Gross Domestic Product,
employing 75% of the state labour force (Republic of Kenya 2005) as cited by Alilaand
Atieno(2006). More than 80% of the Kenyan populace live in the rural areas and derive their
livelihoods, directly or indirectly from agriculture. In Kenya it is a significant for economic
development growth as it gives 35% of the gross domestic product and gives 40% of the export
income. Agriculture is a source of employment to the populace through farming, agriculture also
improves the standard of living of individuals through business and research activities. Through
agriculture a market for industrial products is created which leads to improvement of purchasing
power of the population.
Profitability is the capacity of a business enterprise to make a profit after doing business.
Profit is what remains of a business after paying all expenses rightly related to the generation of
the revenue. The data available on the website of the listed agricultural firms shows few firms
publish their financial statements and others post profits on decline from their previous profits.
© Chesang & Ayuma
Licensed under Creative Common Page 450
According to Hassan, Khan and Wazir (2016) who did a study to determine the effect of debt on
profitability of companies indication from non-financial sector of Pakistan showed a significant
but negative association between long term debt, total debt, short term, and return on assets.
His Results indicated a negative association between debt and profitability implying that
increasing debt in the capital structure will decrease profitability. Thus, firms should choose
internal financing or other sources of financing than debt financing accepting the key issues
defining profitability supports managers in developing an effective profitability approach.
Nairobi securities exchange was founded in 1954 under the society's Act as a voluntary
association for stock brokers and was not accessible to non-Europeans (Nairobi Stock
Exchange, 2014).The Nairobi Securities Exchange was established as a charitable relationship
of stock agents under the Society Act. Over the historical period, the securities exchange has
seen many transformation, systematizing its trading operation as from September 2006 and in
2007 that enabled stockbrokers to do business of buying and selling shares in their offices
unlike previous decades where one was supposed to be present at the trading floor (NSE,
2014).
Agricultural stocks are predictable to continue to reduce in financial performance at the
NSE with most investors expected to continue going after liquid stands, in business which are
not exaggerated by uncontainable influences for example the weather, environmental factors.
External factors like variation of local currency against international currency, economic
recessions in agricultural export markets, and high costs of inputs affect the incomes of
agricultural firms in addition the dividends they pay out to the farmers. There are seven
agricultural firms listed in NSE as at December 2013. The agricultural sector is one of the most
significant segments in Kenyan economy. Apart from providing food for the Kenyan economy
basket, the sector also offers a good proportion of our transfer market in international countries.
Most of the companies in agricultural segment offer non-commercial facilities such as ethical
investing, corporate social responsibility, community social investment and resource
management. These firms are Kapchorua Tea Co,Limuru Tea CoLtd,Eaagads Ltd, Ltd, Rea
Vipingo Plantations Ltd,Sasini Ltd, Williamson Tea Kenya Ltd and Kakuzi. There are 66
companies listed at the Nairobi Securities Exchange as indicated in Appendix V.
However, after independence the securities market activities slumped as a result of
uncertainty on Kenya's future independence trend. The NSE has been denationalization since
1988 by the Kenyan government selling 20% of its holdings. The operation is through a Central
Depository and Settlement Corporation (NSE, 2014). NSE has been operating currently with 66
listed firms. The companies listed in NSE are anticipated to be financially stable in order to build
investors' confidence and contribute to economic growth. During listing period these firms
International Journal of Economics, Commerce and Management, United Kingdom
Licensed under Creative Common Page 451
should meet the set criteria set by NSE. However, despite meeting the set listing requirements,
firms are exposed to market dynamics which affect them either negatively or positively. These
dynamics may be caused by the government policies, risk perceptions, management decisions
and investment decisions taken (NSE, 2014).
Statement of the Problem
Firms‟ performance is greatly influenced by financial leverage as established by many studies.
Such studies include Etyang', (2012), Koech, (2013) Arowoshegbe & Emeni, (2014),
Chinaemerem & Anthony (2012),Ogebe et al., (2013). However, most of this studies in Kenya
were carried out on firms in different sectors most notably banking and manufacturing industries
other than agricultural sector while agricultural sector is one of the pillar of Country‟s economy.
It is important to note that, the success of agricultural firms in Kenya‟s ever-changing
environment depends on how able firms can structure their capital so as to ensure profitability.
The paradox often is that a particular combination of debt, common stock, and preferred stock
used in financing the assets of a firm creates some level of financial risk that also affect
profitability. Arguably, this risk affects a firm‟s capacity to make profits. However, there is scanty
information regarding the effect of financial leverage on firms profitability of agricultural
companies at the Nairobi Securities Exchange Kenya. These include a study by Maroa and
Kioko (2016) who investigated the determinants of profitability of Agricultural Companies
scheduled at the Nairobi Securities Exchange in Kenya; and Njagi (2013) who sought to
determine the association among financial profitability and capital structure of agricultural firms
listed at the NSE. Wandeto (2005) conducted a study on the relationship between cash flows,
dividend changes and earnings and capital structure for the firms listed in the NSE, while
Nyaboga (2008) looked at the relationship between capital structure and agency cost. However,
the focus of these studies was not specifically on the dimensions of the financial leverage. This
information inadequacy has left a glaring research gap. Therefore, the study sought to analyze
the effect of financial leverage on profitability of agricultural firms listed in Nairobi securities
exchange.
Objectives of the Study
The main objective of the study was to examine the effect of financial leverage on profitability of
agricultural firms listed at the Nairobi securities exchange.
Specific objectives of the study were to;
i. Determine the effect of debt to equity ratio on the profitability of agricultural firms listed at
the Nairobi Securities Exchange
© Chesang & Ayuma
Licensed under Creative Common Page 452
ii. Establish the effect of long term debt to total capital employed on the profitability of
agricultural firms listed at the Nairobi Securities exchange.
iii. Determine the effect of current ratio on the profitability of agricultural firms listed at the
Nairobi Securities Exchange
iv. Establish the effect of firm size on the profitability of agricultural firms listed at the Nairobi
Securities Exchange
Research Hypotheses
HO1: Debt to equity ratio has no statistical significant effect on the profitability of agricultural
firms listed at the Nairobi securities exchange
HO2: Long term debt to capital employed has no statistical effect on the profitability of listed
agricultural firms at the Nairobi securities exchange
HO3: Current ratio has no statistical significant effect on the profitability of agricultural firms listed
at Nairobi securities exchange
HO4: Firm size has no statistical significant effects on the profitability of agricultural firms listed at
the Nairobi securities exchange
Scope of the Study
The aim of the study was to establish the effect of financial leverage on profitability of
agricultural firms listed at the Nairobi Securities Exchange. The companies selected were all
agricultural firms listed at Nairobi securities exchange. The study also focused on accounting
information since they were in a strategic position to provide primary data sought in the
company. The confine of the study was on the effect of debt to equity ratio, long term debt to
total capital employed, current ratio and firm size on profitability of agricultural firms. The study
will cover the period of 5 years between 2010 to 2015.
Significance of the Study
The findings of this research would be of significance to the following groups specifically
government, Board of directors, management of agricultural firms, Stakeholders and investors
and finally to a theoretical critique. Last but not least the study contributes to knowledge in the
field of finance and related studies. The study findings from this study may also be used as
serve as reference materials by researchers and academicians in guiding future studies in
respect to the effect of financial leverage on profitability of agricultural firms.
International Journal of Economics, Commerce and Management, United Kingdom
Licensed under Creative Common Page 453
Limitations of the Study
The researcher collected data from Nairobi Securities Market and Capital Market Authority. The
researcher found challenges in getting the relevant financial booklets, financial statements from
Nairobi securities exchange and Capital Market Authority. To overcome this, the researcher
sends emails, use official letters from Kisii University and book appointments in advance and
honor them on time. The researcher sought clarification on data information at the data sources
in both Capital Market Authority and Nairobi securities exchange and the company‟s website.
Confidentiality of data provided was assured, as the researcher demonstrated on the use of
data for research purposes only.
Assumptions of the Study
The researcher made several assumptions in line with the study. The study made assumption
on the population; each firm has an equal chance of representation within the study. In addition,
data was collected from firms with full information running from 2010-2015.
Operational Definition of Terms
Capital structure It‟s a mix of debt and equity which a firm deems as appropriate to enhance its
operations (Friend, 2008). Capital structure is therefore composition of long-
term liabilities, specific short-term liabilities like bank notes, common equity,
and preferred equity which make up the funds with which a business firm
finances its operations and its growth.
Debt Ratio Financial ratio that indicates the percentage of a company's total debt to its
total assets.
Financial Leverage Is the degree to which operating assets are financed with debt versus equity
(Penman, 2001).
Financial performance Is a measure of how well a firm can use its current assets from its primary
mode of business and operations and generate revenues for the business
(Baxter, 2007). Financial performance is an indication of the financial health
over a given period of time for a firm, and can be used to compare similar
firms across the same industry or to compare industries or sectors in
aggregation to enable a business to make decision on how it can improve on
the prevailing situation or sustain a desirable position (Berger, Oliver & Pua,
2007).
© Chesang & Ayuma
Licensed under Creative Common Page 454
Liquidity It‟s the ability of a firm to meet its financial obligations in a timely manner. In
essence, the assets owned by a company are liquid if they can quickly and
cheaply be converted to cash (Brealey, et al., 2001).
Profitability: The state or condition of yielding a financial profit or gain. It is often
measured by price to earnings ratio.
Return on assets The percentage that shows how profitable a company's assets are used in
Generating income.
LITERATURE REVIEW
Theoretical Framework
This section presents the theoretical review guiding this study. After the foundation study of
corporate financing decisions in the 1950s by Modigliani and Miller (1958), research on capital
structure has been done to identify optimal mixes for debt and equity. The purpose of the study
is to find the desirable mix to maximize the value of equity shareholders; however, MM stated
that financing choices do not affect the firm‟s value. The study is therefore, supported by the
Pecking Order Theory, Agency theory, Trade -off theory and Net Income Theory.
Pecking Order Theory
Many theories have been advanced in line with the financial decisions process. Among these
theories is the Pecking order theory by Myers & Najfuf (1984), a capital structure theory. This
theory advocates that companies should use the cheapest form of finance to run their
operations first. In most cases, businesses adhere to hierarchy of financing sources and mostly
prefer internal sources first and debt is preferred over equity due to information asymmetry
between the firm and outsiders. Internal sources may not be efficient to meet certain financial
decisions therefore the firm may consider external borrowing. Too much external borrowing
affects financial decision.
According to Frank & Goyal, (2003) Pecking order theory states that companies prefer
internal funds, if available, and use debt or issue equity last. In line with Myers (1984),
companies prefer internal sources to external finance due to asymmetric information. The
utilization of external financing sources are signals to information that a firm is not profitable,
which can decrease stock prices. When external financing sources are obligatory, firms choose
debts to equity because of lower information costs relate with debt. Issuing new stock, instead
of acquiring new debt, signals the news that directors think firms‟ stocks are overpriced. Frank &
Goyal, (2003) posited that the management of a company usually knows more about its
company's business and financial information than average outside investors do and the
International Journal of Economics, Commerce and Management, United Kingdom
Licensed under Creative Common Page 455
company administration don‟t expect to issue new stock when they think the stock price is
undervalued in the market. When the market is fairly priced or overpriced management tend to
issue shares. Thus, outside investors may interpret the declaration of a stock issue as a
negative signal for the current stock price (Tang & Jang, 2007).
This theory is relevant to this study since agricultural firms operate in a financial
environment that fits the Pecking order. If the agricultural firms must use outside financing,
preference capital is to be used in the subsequent command of funding sources: convertible
securities, debt, preferred stock, and common stock. An appropriate debt to equity ratio and
current ration needs to be maintained.
Agency theory
Agency theory was developed by Jensen & Meckling (1976). The theory relates to decisions
made within a firm by managers and the shareholders. This is the principal agent relationship.
The theory states that, with low monitoring level to the organization and low discipline in
decision making, managers might decide to invest in projects with negative net present values.
According to agency theory, higher level of debt increases shareholders' value because of its
disciplinary effect on manager behavior. There are two types of inherent conflicts of interest in
this theory: manager-to-shareholder conflict, and creditors-to-shareholder conflict. In the first
case, when long debt increases, shareholders can bind managers to service the debt obligation.
Thus, when the debt level is increased, a larger portion of unrestricted cash flow should be used
to pay the debt obligations. In this case, shareholders or boards of directors effectively reduce
the free cash flow in the company and prevent managers from financing in sub-optimal or
excessive investments (Jang & Tang, 2009).
Managers would also lose their large investments if they fail to fulfill the obligation of
debt, and this results in insolvency (Jensen & Meckling, 1976). Agency theory offers an
additional end to clarify the high profitability and low debt ratio correlation. In a money-making
form, it is the managers' advantage to keep debt ratio low, because: The debt payment is not
committed to unrestricted cash flow and can be used for management's interests, and
managers are then free from debt payment pressure. This leads to a loss in a shareholder's
stock value, and it is agency cost. It is important to note that such managers are answerable to
stakeholders and thus need to make sound financial leverage decisions that positively affect
their financial performance.
This theory is relevant to this study in that managers of agricultural firms are bound by
shareholders to act responsibly by making correct decisions on the level of debt ratio and
© Chesang & Ayuma
Licensed under Creative Common Page 456
profitability. They are answerable to the shareholders or board of directors and thus need to
ensure that higher level of debt increases shareholders' value.
Trade-off theory
This theory explains why a company will concentrate on trade off benefits by selecting how
much equity and debt to use for its financing. Companies are taxed by government on their
income, but interest is a tax-deductible expense. As per trade-off theory a chargeable company
will increase its debt level to the point where additional debt is offset by the marginal value of tax
shield the NPV of possible costs of financial distress (Myers, 2001). Because interest expense
for debt is tax deductible, a higher leverage level would create a larger tax benefit for corporate
income. However, as the level of debt increases, the company would have a high burden to
service its debt obligations including a large amount of interest expense. Subsequently, the
company would incur default risk, which would cause higher costs for debt financing and
financial distress (Myers, 2001). Thus, an optimal proportion of equity to debt capital structure
maybe reached through establishing equilibrium between the tax advantages and financial
distress of debt.
This theory is relevant to this study given that agricultural firms that carefully select
equity levels and debts used for their financing were better placed to make higher profits
compared to those that were not keen with the levels of equity and debts. Those firms with
higher debts were highly disadvantaged. Most firms strive to achieve an optimal proportion of
equity to debt capital structure and this is argued to create tax advantages.
Net Income Theory
This theory exerts that there exists an optimal level of leverage, a point where the cost of capital
will be at the minimum value possible and allowing the firm to maximize its return. The
consequences of this is that low cost of capital, the value of the firm is maximized when the
optimal level of debt capital is employed (Brealey and Myer, 1998). Their argument is that for
firms with low debt ratio, increasing their financial leverage level will not increase the cost of
debt and therefore can be used as a replacement of equity and preserves the firm‟s value. This
therefore implies that whether the firm is large or small, with higher earnings or not there exist
an optimal debt ratio that it must maintain for it to maximize its return. This negates the effect
that firms earning may be having on its leverage. According to Brealey and Myers (1998),
financial leverage will make the managers be aware of the increased risk that they have to
shoulder for the firm to continue growing in the industry. This therefore calls for going for debt
sparingly just to obtain that amount that the firm will be able to shoulder without suffering the
International Journal of Economics, Commerce and Management, United Kingdom
Licensed under Creative Common Page 457
financial distress and may go into bankruptcy. This again showed that the size and earnings of
the firm has a bearing on the financial leverage of the firm.
This theory is relevant to this study, since agricultural firms strive to strike an optimal
level of leverage, a point where the cost of capital will be at the minimum value possible and
allowing the firm to maximize its return. Therefore, the right mix of leverage in terms of current
ratio, liquidity, and total assets needs to be put in perspective. Agricultural firms thus, need to
ensure that the cost of capital is held at a minimum value possible, since the opposite has a
negative effect on profitability.
Empirical Studies on Financial Leverage and Firms’ Profitability
In a study carried out by Ebaid (2009) on the effect of capital structure on performance of firms
in Egypt securities exchange, financial leverage did not appear to influence the firms‟
performance. Multiple regression technique was applied to determine the association between
the leverage and performance. The result showed that financial leverage has no impact on
company‟s performance.
Mwangi, Makau and Kosimbei (2014) examined the relationship among capital structure
and firms‟ performance of 42 non-financial companies in the Nairobi Securities Exchange. The
study used secondary panel data contained in the experimented financial statements of the
listed companies, and employs panel data using random effects and feasible Generalized Least
Square (FGLS) model. The findings were that financial leverage is negatively correlated to
performance which is measured by return on assets.
Akhtar et al. (2012) studied the relationship among financial leverage and financial
performance using Energy and fuel segment of Pakistan. The result found a positive association
among financial performance and financial leverage of the firm thus confirming that the firms
having higher profitability may increase their performance by possessing high levels of financial
leverage. Additionally, the study give proof that the participants of the energy and fuel in
Pakistan can increase their financial performance by employing the financial leverage and this
can be arrived by making important decisions on the choice of capital structure which will lead to
sustaining future growth of the company (Akhtar et al. (2012).
Onaolapo and Kajola (2010) studied the effect of capital structure on financial
presentation of firms listed on the Nigerian Stock Exchange. study used 30 non-financial
companies in 15 business segments for a period from 2001 to 2007.The results indicated that
financial leverage had a significant negative relationship on financial performance, Return On
Assets and Return On Equity of tested companies (Onaolapo and Kajola, 2010).
© Chesang & Ayuma
Licensed under Creative Common Page 458
Chinaemerem and Anthony (2012) investigated the effect of capital structure portfolio on
financial performance of Nigerian firms using 30 listed non-financial firms on the Nigerian Stock
Exchange for a span of 7 years from 2004- 2010. Panel data for the chosen companies were
examined using ordinary least squares method of approximation. The findings indicate that a
company's capital structure represented by debt ratio has negative significantly association with
the firm's financial performance surrogated by Return on Assets and Return on Equity
(Chinaemerem and Anthony, 2012).
An analysis of the impact of capital structure on company performance of firms in Jordan
securities exchange was conducted by Tian and Zeitun (2007). The analysis was done by using
a panel data approach of 167 companies for a span of 15 years from 1989 to 2003. The study
used Return On Equity, Return On Assets,Earnings Before Interest and Tax and tax plus
depreciation to total assets, market value of ordinary equity to book value of equity,
price/earnings ratio and market value of equity plus total liabilities divided by book value of
equity as market performance measures. The results show that firms‟ performance and capital
structure has negative relationship. The study also found that short term debt to total assets as
a determinant of leverage has an association which is positive on the market performance proxy
by Tobin's Q (Zeitun andIan, 2007).
Al-Taani (2013) investigated relationship between capital structure and firm's
performance in 45 Jordanian manufacturing firms scheduled on Amman Stock Exchange for a
period of 5 years from 2005 to 2009. Study variables were return on assets, profit margin,total
debt to equity, total assets to short term debt ratios, and long term debt to total assets (Al-Taani
(2013). Return on assets and Profit margin to represent the dependent variables were used as
indicators for financial performance, independent variables were long term debt to short term
debt to total assets represented for capital structure. Al Taani‟s studyfound that there is no
important association among Short Term Debt to Total Assets and Return on Assets, Total Debt
to Equity and Return on Assets, Short Term Debt to Total Assets and Profit Margin, long term
debt to total assets and Profit Margin, and Total Debt to Equity and Profit Margin.
Nuri and Archer (2001) established debt ratios in the UK lodging industry were higher
than the debt ratios in United Kingdom retail business. They indicate out that the theory of trade
-off is more consistent with regard to pecking order theory in the lodging and retail industry the
UK (Nuri and Archer (2001). They stated that profitability is the most significant factor for the
retail industry, followed by tax shields of non-debt products as related factors to leverage level.
Non-debt tax shields, contract management, and firm's profitability were the most significant
factors for the UK hotel industry.
International Journal of Economics, Commerce and Management, United Kingdom
Licensed under Creative Common Page 459
Dalbor and Upneja (2002) reports that long-term debt ratio positively relates to profitability of
firms going into bankruptcy because of firm size among publicly traded U.S. restaurant firms.
Dalbor and Upneja (2002) established that firm quality and growth opportunities were related
negatively with long-term debt usage. According to the study, lower quality and larger firms tend
to use more long-term debt and companies on growth opportunities stage use less long-term
debt. They also found that Hotel and restaurant, companies with positive growth opportunities
tend to use less long-term debt (Dalbor and Upneja (2002).Consistent with prior research, it was
revealed profitability of hospitality firms were independent of debt level (Phillips & Sipahioglu,
2004) and that growth opportunities for companies have a link with debt level (Dalbor & Upneja,
2004; Tang & Jang, 2007).
Saeedi and Mahmoodi (2011) examined the association among capital structure and
performance of scheduled companies in Tehran Stock Exchange. According to the study market
measures of presentation are completely related to capital structure and while Return on assets
is positively associated to capital structure of the firm, no significant association exists between
Return on equity and capital structure. Saeedi and Mahmoodi (2011) findings shows that
financial leverage may have impact on measures of performance in different ways.
Effects of Debt to Equity Ratio on firms Profitability
Nwude (2003) defines debt to equity ratio as a measure of the proportion of debt to
shareholders‟ funds (i.e Net Worth) in the total financing of a business. Items such as
accumulated losses and deferred expenditures are eliminated from the shareholders' funds
before using it as the denominator. The ratio indicates how much naira was raised as debt for Nl
of equity. Enekwe (2012) continues that equity to debt ratio is indicating the relative proportion
of debt to equity used to finance a company's assets which is a measure of leverage. The
formula equals to total debt over shareholders' equity. When used to calculate a firm‟s financial
leverage, the debt usually includes only the total debt. However, as specified the bigger the
interests then theirs need to repay the principal on borrowed fund because it can outweigh the
benefit, it is used to measure the net worth of the organization. DER equals to total liabilities
over shareholders‟ funds or total equity.
Pouraghajan and Bagheri (2012) examined on the effect of capital structure on the
financial performance of firms listed in the Tehran Stock Exchange. The study tested a sample
of 40 firms among the listed firms in Stock Exchange of Tehran. The Results suggest that there
is an important negative association among debt ratio and financial performance of companies,
and an important positive association between asset tangibility, growth opportunities, asset
turnover, firm size, and with financial performance actions.
© Chesang & Ayuma
Licensed under Creative Common Page 460
In China, Yuan and Kazuyuki (2011) carried out a study on the impact of the debt ratio on firm
investment. Using example of Chinese scheduled firms presented that total debt ratio had a
negative impact on fixed investment. Equally additional if debt is employed in the capital
structure of a firm, the business risk will also increase.
Nduati (2010) studied the association among leverage and financial performance of firms
listed at the Nairobi Securities Exchange. In the collection of data the researcher used
descriptive research design. Data was collected using secondary sources and interviews such
as yearly financial reports and statements of the targeted firms. Statistical Package for Social
Sciences SPSS was used in analyses of data, and findings were accessed in the form of
graphs, tables and pie charts. The findings concluded that leverage did not contribute to
financial performance of firms scheduled at the Nairobi stock Exchange.
Wainaina (2014) studied the association among leverage and financial performance of
topmost 100 SMEs small and medium organization in Kenya. The research used cross sectional
type of descriptive research design in his study. Objective population for the study was the top
100 SMEs (2013) in Kenya. It used an example of 30 Small Medium Enterprises
unsystematically nominated based on the study population. This study compiled data for a
period of five years (2008-2012). The study made use of SPSS version 20, to aid in the
analysis. The study concluded that leverage had important effect on the financial performance,
and that there was a positive association amid leverage debt equity ratio and financial
performance of small and medium enterprises SMEs in Kenya.
A study by Gweji and Karanja (2014) examined the impact of financial leverage on
companies‟ performance of credit, deposit taking and savings co-operative societies. Secondary
data obtained from financial reports of 40 savings, credit co-operative societies considered in
the study from 2000 - 2012. Descriptive and logical plans were both adopted. The findings show
strong positive association between financial leverage represented by equity to debt ratio with
ROE and net profit after tax at 99% confidence time, and a faint confident correlation between
equity to debt ratio with return on assets and income growth.
The effect of Long term debts to capital employed on profitability
The financial leverage of the firm can be shown by a long term debt to capital employed ratio.
This ratio is computed by dividing the long term debt with the total capital accessible by a firm.
The total capital of the firm comprises the long term debt and the stock of the firm. The formula
of calculating Long Term Debt to Capitalization Ratio is:
Long term debt / Common Stock +Preferred Stock+ Long term debt
International Journal of Economics, Commerce and Management, United Kingdom
Licensed under Creative Common Page 461
A long term debt to capital employed ratio greater than 1.0 shows business has more debts than
capital employed in essence is not a worthy practice to a business entity as it can indicate
financial difficulties, particularly the firm running to bankrupt. A tall long term debt to capital
employed ratio would show the financial limitation of the company and the debt would most
likely increase the risk of the firm (Myers and Majluf, 2004).
Kaumbuthu (2011) made a study to determine the link between capital structure and
return on equity for allied industrial sectors in the NSE between 2004 - 2008. The study used
regression examination and found a negative association between debt to equity ratio and
return on equity. The study centered to one sector of the firms listed in Nairobi Securities
Exchange and concentrate on aspect of financing decisions. The results cannot not be
generalized to the other sectors (Dalbor and Upneja (2002).
The information on the effect of debt on the performance of the company is still
uncertain. The work of others researchers shows a positive effect of debt on the performance of
the company (Myers and Majluf, 2004) and others that reason that the effect is negative. They
felt that debt makes the companies chart dissimilar output and investing strategies, in that
differs with regard to the make-up of the debt. Long term debts prompt the firm to pick higher
output and financing heights beside higher expertise up progression payments. It therefore
should have a positive effect on the performance of the company. Though, the short-term debts,
which make the company conformist with reference to output and financing strategies, might
have a harmful impact on the financial performance of the companies (Myers and Majluf, 2004).
In Kenya, a study Maroko (2014) looked at the effect of the firm‟s capital structure on firms
financial performance of companies scheduled in Nairobi Securities Exchange. Secondary data
used was obtained from financial statements of listed firms, and used stratified random
sampling technique. Multiple regression technique was used to explain the association between
financial leverage, debt interest and cost of equity and companies performance. The findings
presented that positive association exists among cost of equity, financial leverage, debt interest
and organization financial performance.
Maina and Kondongo (2013) in their attempt to validate Miller and Modiglian (1963)
theory in Kenya, examined the impact of debt to equity leverage ratio on the operation of
companies listed at the NSE for the period 2002 to 2011. From their findings companies listed at
Nairobi Securities Exchange depend mostly on short term debt of financing. The findings also
disclose that statistically significant negative association exists between debt to equity ratio as a
measure of performance. The results also provided support for MM theory that capital structure
is significant in defining the performance of a company.
© Chesang & Ayuma
Licensed under Creative Common Page 462
Innocent, Ikechukwu & Nnagbogu (2014) conducted a study on the impact of financial leverage
on financial performance on scheduled pharmaceutical companies in Nigeria stock exchange for
the period 2001 to 2012. Financial leverage represented by debt ratio, debt to equity ratio, ratio
on interest coverage were used as independent variable while financial performance proxy by
return on assets as dependent variable. The study employed secondary data information
sourced from audited financial statements of 3 pharmaceutical firms listed on the Stock
Exchange of Nigeria. Pearson correlation and descriptive statistics were utilized in order to
establish the association amid financial leverage variables and performance degree adjustable
identified in the research. The results showed that debt ratio and debt to equity ratio contain
harmful association with Return on Assets, while interest coverage ratio has a positive
relationship with ROA. The study also displayed that on whole financial leverage variables has
no significant effect on financial performance of sampled companies (Innocent, Ikechukwu and
Nnagbogu (2014).
Effects of Current Ratio On the firm Profitability
High current ratio shows a higher level of liquidity, a lower ratio shows a small amount of
liquidity, involving a greater reliance on operating cash flow and outside financing to meet
immediate requirement. Liquidity involves the firm‟s capacity to take on debt.
Almazari (2013) studied association among the working capital management and the
company‟s profitability for the Saudi cement manufacturing companies. The example comprised
of 8 Saudi cement manufacturing firms scheduled in Saudi Stock Exchange between 5 years
from 2008-2012. Regression and Pearson bivariate examination were used. The study results
showed that Saudi cement company current ratio is important liquidity estimate which effected
profitability, therefore, the cement companies should put a trade-off between these two
objectives found neither the liquidity nor profitability suffers. Almazari (2013) argued that if size
of a company increases, profitability increases and vice versa. Besides, when the debt financing
is improved, profitability is declined. Linear regression tests established a high degree of
association among the profitability and working capital management.
According to Padron, Apolinario and Santana (2005), performance of companies with
liquid assets are likely to be more and better as they are capable to get money at given period
to meet up its requirement and are less open to the elements of liquidity risks. By not having
sufficient cash or liquid assets, listed firms end up selling their securities at a substantial low
price in order to settle debts quickly. Though, there are divergent views of investors with regard
to liquidity and performance in relation to the agency theory cost.
International Journal of Economics, Commerce and Management, United Kingdom
Licensed under Creative Common Page 463
A study by Kayo and Kimura (2010) observed that high liquidity could increase agency
expenses incurred by the owners by providing administrators with inducements to misuse
excess cash-flows by investing in projects with harmful net present prices and appealing in
excessive privilege consumption. Liquidity measures the ability of managers to meet their
immediate commitments to shareholders and other creditors without having to increase profit
from investment activities and/or liquidate financial assets.
Eljelly (2004) looked at the relationship between profitability and liquidity measured by
current ratio cash breach and cash conversion cycle on an example of joint stock firms in Saudi
Arabia using method of correlation and regression examination. Eljelly (2004) established a
harmful association amid profitability and liquidity signify, and it was established that Cash
Conversion Cycle had a large effect over profitability than Current ratio factor affecting firm
profitability. It was found out there was great difference among firms with respect to the
assessment of liquidity Eljelly (2004)
Suhaila (2014) investigated the effect of liquidity and leverage on financial performance
of commercial public companies in the tourism trade in Kenya. The study adopted descriptive
research design where information was recovered from the financial statements and Notes of
ten (10) Profitable State Companies in the travel industry in Kenya during the study period
2008-2012. A positive relationship was found to exist between tourism industry liquidity and
profitability of Commercial State Corporations in the tourism sector in Kenya.
Effects of Firm Size on the firm Profitability
A study by Qureshi et al. (2012) observed that large sized companies are proficient of lessening
transaction costs by allotting long-term debt at a favorable low interest and raise funds from
creditors with ease (Moses, Edna and Newton, 2013). There exists a positive association
among the company size and leverage (Nadeem and Zongjun, 2011), implying that the larger
the agricultural firm is the more levered it is likely to be as compared to the smaller firms. On the
other hand, large firms also due to their high level of operations they are likely to enjoy higher
earnings which according to the pecking order theory they may use to finance their operations
instead of debt financing, negating the value of debt in the capital structure. High earnings by
the firm promote the use of debt and provide an incentive to firms to benefit from tax shields on
interest payments (Nadeem & Zongjun, 2011). The pecking order theory therefore ascertains
that firms prefer to use internally generated funds when adequately available over debt
financing. This therefore depicts a negative relationship between earnings and the leverage of
the firm.
© Chesang & Ayuma
Licensed under Creative Common Page 464
Padron et al., (2005) argued that profit interacted with size. The study noted that large
companies are less vulnerable to insolvency since they tend to be more diversified than smaller
companies. So, subordinate expected bankruptcy prices allow large companies to take on more
obligations like debts.
Financial assets are more easily to be achieved in the market as the level of
asymmetries information are reduced by large firms. Large firms are more likely to access debt
as compared to small firms since they are more stable (Padron et al., 2005). If two companies
have same profitability, larger company will get more external finance.
Capital structure is one of factors bigger firms benefit over small firms, and can be
examined by comparing firm‟s performance in particular financial performance (Eljelly (2004).
Larger firms obtain benefits from their size and diversification because they can borrow with
lower costs and survive economic disasters with more resilience than smaller firms (Eljelly
(2004).
Larger firms obtain benefits from their size and diversification because they can borrow
with lower costs and survive economic disasters with more resilience than smaller firm's and
thus generate more profit. Their diversification and low borrowing cost benefits are expected to
support the profitability assumption. The size of a firm has the potential to influence the firm's
financial performance in terms of the choice of capital structure mix. Larger firms had an
advantageous position in capital markets to raise external funds, they are less dependent on
internal funds. Moreover, the probability of bankruptcy is lower in larger firms; therefore, they
are more likely to pay dividends (Osman & Mohammed 2010).
Kholdy and Sohrabian (2001) determined the FCF theory and pecking order hypothesis
in small, medium and large firms. Their conclusion showed that smaller firms suffer from
financial restrictions. Furthermore, the cash flow of these firms did not show any significant
effect on investment. Kholdy and Sohrabian (2001) concluded that the pecking order theory and
FCF theory do not have any effect on medium firms' investment.
When studying the relationship between firm growth, age and size, Evans (1987) found
that age is an important determinant of a firm's success. Older firms are expected to have more
historical information than younger ones and are thus expected to be more likely to survive than
growing firms. In other words, older firms will be able to use their experience to avoid
unexpected economic problems (Brooks et al.2009).
Bulan and Yan (2009) conducted a study to examine the central prediction of pecking
order theory, taking into account the two phases of companies‟ lifecycle which they describe to
be the first years of a company since its IPO, and maturity (Bulan and Yan (2009). They argued
that mature firms are older, more stable and more highly profitable, with fewer development
International Journal of Economics, Commerce and Management, United Kingdom
Licensed under Creative Common Page 465
opportunities and good credit accounts. Due to this distinctiveness (Bulan and Yan (2009)
mature firms are able to borrow more easily at cost which is lower. Therefore, older firms are
supposed to use debt before considering equity when they need to finance their projects.
Hence, it is expected here that older firms are more powered than younger firms. That is, firms
with higher poor selection costs are more likely to follow the pecking order theory (Bulan and
Yan (2009).
According to Titman and Wessels (1988) larger firms are not faced with greater
challenges of straight insolvency cost owing to their capability to spread their processes in order
make money to allow the organisation offset the cost of debt. They argued that big firms are
better off using debt financing to finance their projects, as there exist a positive relationship
between the size and the leverage of the firm.
According to agency theory (Jensen and Meckling's, 1976) large firms go for debt
financing as a way of trying to solve their agency cost. Therefore, the more the firm expands in
size, the more debt financing it should go for.
Research Gap
Most of the studies done on the effect of financial leverage on profitability have been done in the
non-agricultural segment which the current study is focusing upon. Further, there are limited
studies done in Kenya focusing on the effect of financial leverage on profitability and this study
will address the same as it will enrich the current knowledge on the financial leverage on effect
of Return on Assets / Profitability of listed agricultural firms at NSE. This study therefore comes
in to fill the annulled by making whether there is an association between financial leverage and
firm performance/profitability among listed agricultural firms‟ in Kenya.
Conceptual Framework
Fraenkel and Wallen (2000) articulated that greatest study information through the problem
statement in perspective of a theoretical context or conceptual. An explanation of this context
adds to a research information in at least two means as it identifies research study variables,
and association among the study variables. This study tries to examine the effect of financial
leverage on profitability of agricultural firms listed at the Nairobi securities exchange.
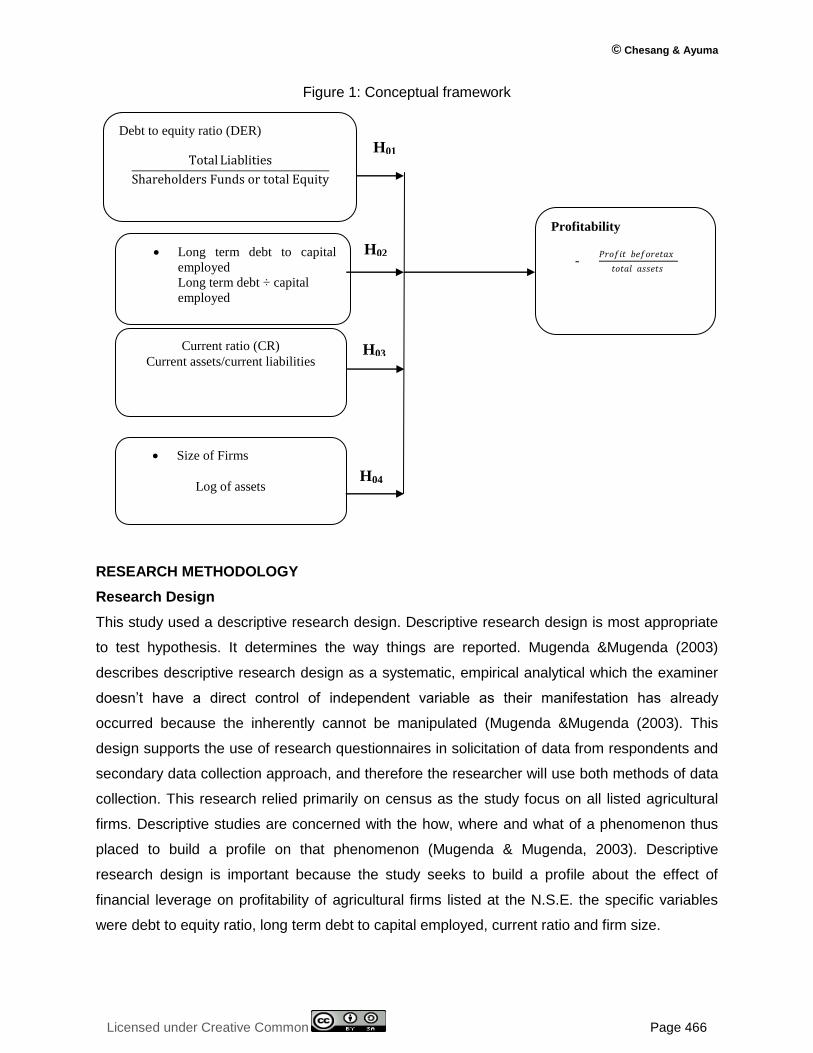
The conceptual framework of this study spells out the relationship between the
profitability which is the dependent variable and debt to equity ratio DER, long term to total
capital employed, current ratio CR and total firm sizes as the independent variables.
© Chesang & Ayuma
Licensed under Creative Common Page 466
Long term debt to capital
employed
Long term debt ÷ capital
employed
Current ratio (CR)
Current assets/current liabilities
Profitability
- 𝑃𝑟𝑜𝑓𝑖𝑡 𝑏𝑒𝑓𝑜𝑟𝑒𝑡𝑎𝑥
𝑡𝑜𝑡𝑎𝑙 𝑎𝑠𝑠𝑒𝑡𝑠
Debt to equity ratio (DER)
Total Liablities
Shareholders Funds or total Equity
Figure 1: Conceptual framework
RESEARCH METHODOLOGY
Research Design
This study used a descriptive research design. Descriptive research design is most appropriate
to test hypothesis. It determines the way things are reported. Mugenda &Mugenda (2003)
describes descriptive research design as a systematic, empirical analytical which the examiner
doesn‟t have a direct control of independent variable as their manifestation has already
occurred because the inherently cannot be manipulated (Mugenda &Mugenda (2003). This
design supports the use of research questionnaires in solicitation of data from respondents and
secondary data collection approach, and therefore the researcher will use both methods of data
collection. This research relied primarily on census as the study focus on all listed agricultural
firms. Descriptive studies are concerned with the how, where and what of a phenomenon thus
placed to build a profile on that phenomenon (Mugenda & Mugenda, 2003). Descriptive
research design is important because the study seeks to build a profile about the effect of
financial leverage on profitability of agricultural firms listed at the N.S.E. the specific variables
were debt to equity ratio, long term debt to capital employed, current ratio and firm size.
H01
H03
H02
Size of Firms
Log of assets H04
International Journal of Economics, Commerce and Management, United Kingdom
Licensed under Creative Common Page 467
Study Area
The study was conducted at the Nairobi Securities Exchange on listed agricultural companies.
Considering the fact that, the study collected both primary and secondary data, there was need
to visit the organizations physically at their head offices to carry out the survey. Most of these
organizations are head quartered in Nairobi. The data was obtained from company‟s websites
on individual companies‟ financial books of accounts.
Target Population
According to Ogula (2005), population is any group of people, institutions, objects that have at
least one characteristic in common. The study targeted the seven listed agricultural firms at the
NSE. These firms are Kapchorua Tea Co. Ltd, Eaagads Ltd, Rea Vipingo Plantations Ltd,
Limuru Tea Co. Ltd, Sasini Ltd, Williamson Tea Kenya Ltd and Kakuzi. The accessible
population for purposes of data collection was made up of 7 accounting officers or finance
managers each from the seven agricultural firms. These are preferred in this study, for they are
in a strategic position to provide information sough through this study.
Sample size and sampling procedures
Owing to the fact that the population is small, the census technique was employed, where all the
seven respondents were used for the study. The researcher selected all the seven agricultural
firms listed at the Nairobi securities exchange Kapchorua tea co, Limuru Tea co. ltd,Eaagads
ltd, ltd, Rea vipingo Plantations ltd, sasini ltd, Williamson tea Kenya ltd and Kakuzi ltd.
Purposing sampling was employed in the selection of the sample. This is because they type and
class of respondents is already determined. In cases where we have two accounting officers,
preference was made to the senior most or most relevant as guided by the organization. Data is
anything given as a fact on which research inference was based. It is anything actual or
assumed as a basis of reckoning. In this study the researcher applied for approval from C.M.A
and N.S.E. With the approval the researcher collected the data using secondary data.
Data Collection procedures
The study collected both secondary and primary data. The Primary data was collected from the
accounting officers using questionnaires. The accounting officers provided information covering
all the study objectives. A questionnaire has the following advantages according to Kombo &
Tromp (2006): Information can be collected from a large sample, confidentiality is upheld, saves
on time and no opportunity for interview bias. The questionnaire comprised of closed ended
questions subdivided thematically into sections. Secondary data can improve the clarity of the
© Chesang & Ayuma
Licensed under Creative Common Page 468
problem and the circumstances surrounding the issues in data collection procedure. This
research relied primarily on secondary data of all the seven listed agricultural firms. The Time
series secondary data were collected from the publications of NSE and CMA. Statistical
Bulletins, Economic and Financial Reviews, and Annual Reports and Statement of Accounts
from the respective firms found on the company‟s website.
Pilot testing
Piloting was conducted using 2 Agricultural firms listed at the NSE (10% of the sample). Care
was taken to ensure that piloted organizations do not form part of the sample in the actual data
collection. The purpose of pilot test is to detect weaknesses in design and implementation and
to provide proxy for data collection of a probability sample (Cooper & Schindler, 2006). These
processes are important because they enhance the quality of information collected from the
respondents for purposes of achieving the research objectives. The piloting was also used to
establish validity and reliability of Instruments.
Validity of Instruments
Prior to use the questionnaires were subjected to validity checks. The validity of the research
instruments should be confirmed prior to actual data collection (Drost, 2011). Establishing
validity of research instruments means that the study delivers the intended results (Mugenda
and Mugenda, 2003). This ensured that the instruments can be trusted and results referred to
when forming opinions and conclusions. Content validity was established by judgement of
experts who comprise supervisors. The experts provided guidance on the content of the
instruments by ensuring that all the research objectives have been addressed in the
instruments. The manner of construction of the questionnaires was also checked to ensure
there is no ambiguity during pilot study. The findings from the pilot study were used to improve
on the questionnaire, thus enhancing its validity.
Reliability of Instruments
Reliability refers to the stability or internal consistency of a questionnaire. Cronbach‟s alpha will
be used to test the reliability of the measures in the questionnaire. According to Sekaran (2006),
in this approach, a score obtained is correlated with scores obtained from other items in the
instrument. Cronbach‟s Alpha is a general form of the Kunder-Richardson (K-R) 20. A value
above 0.7 was accepted. If Cronbach‟s alpha coefficient is close to 1, the higher the internal
consistency reliability (Sekaran, 2006), hence reliable for collecting data.
International Journal of Economics, Commerce and Management, United Kingdom
Licensed under Creative Common Page 469
Data Analysis and Presentation
The study collected both quantitative and qualitative data. The study used SPSS statistical
package for social science in data analysis. Regression model was used to determine the effect
of explanatory between the independent and dependent variables. In statistical modeling,
regression analysis is a statistical process for estimating the relationships among variables
(Babbie, Wagner & Zaino, 2015). Therefore, was used to determine the relationship between
the independent variables and the dependent variables. The statistical tool was preferred
because of its efficiency and its powerful ability to display results in a very detailed and more
advanced manner. The following regression model was used:
Y = α + β1X1 + β2X2 + β3X3 + β4X4 + έ
Profitability = α0 + 𝛃𝟏DER + 𝛃𝟐CR + 𝛃𝟑ld + 𝛃𝟒lnFSIZE + ε
Where;
DER = Ratio of debt to equity
CR =Current ratio
ld =Long term debt to total capital employed
FSIZE =Agricultural firms’ sizes
𝜀 = Error term
α = Constant Term;
β1, β2, β3, β4= Beta Coefficients
ANALYSIS AND FINDINGS
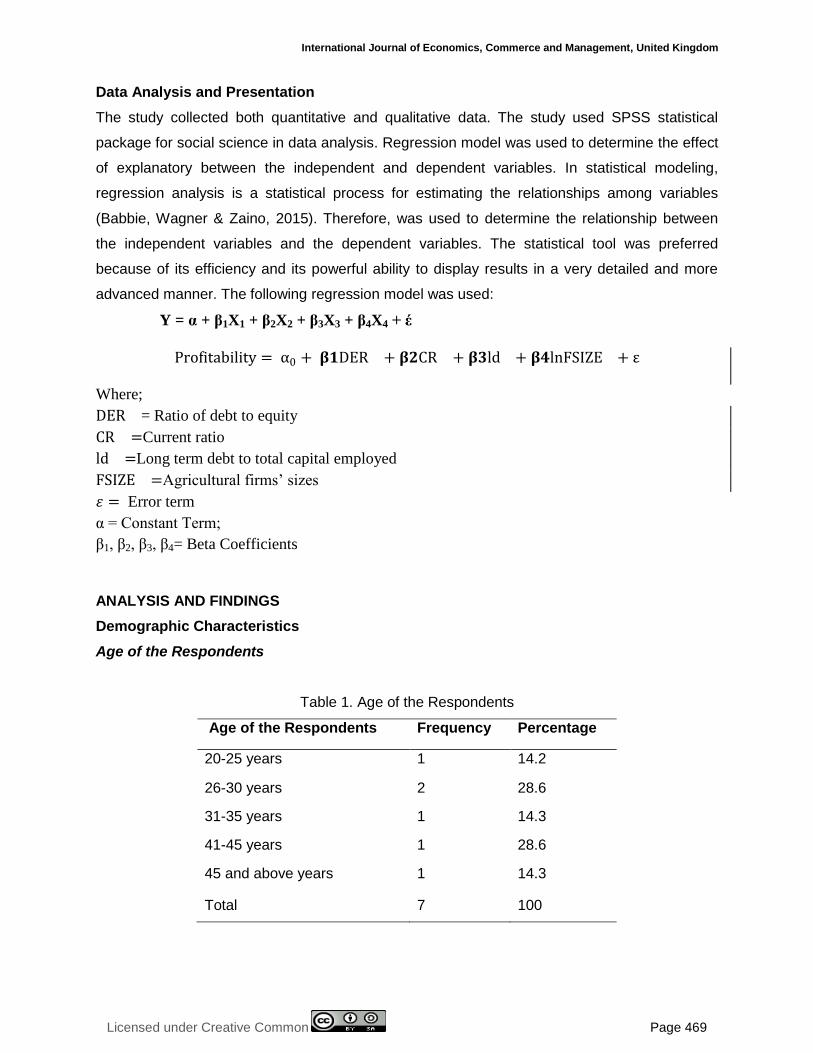
Demographic Characteristics
Age of the Respondents
Table 1. Age of the Respondents
Age of the Respondents Frequency Percentage
20-25 years 1 14.2
26-30 years 2 28.6
31-35 years 1 14.3
41-45 years 1 28.6
45 and above years 1 14.3
Total 7 100
© Chesang & Ayuma
Licensed under Creative Common Page 470
The findings in Table 1 shows that 57.2% of the respondents indicated that they were aged
above 31 years, while 42.8% were aged between 15 and 30 years. This implied that most
persons interviewed were aged above 30 years. This therefore, means that the officers
interviewed were above the youth age bracket.
According to the Kenya National Youth Policy Sessional Paper No. 3 of July 2007
defines a Kenyan Youth as one aged between 15 – 30 years. Therefore, less youths occupied
accounting jobs in the agricultural firms.
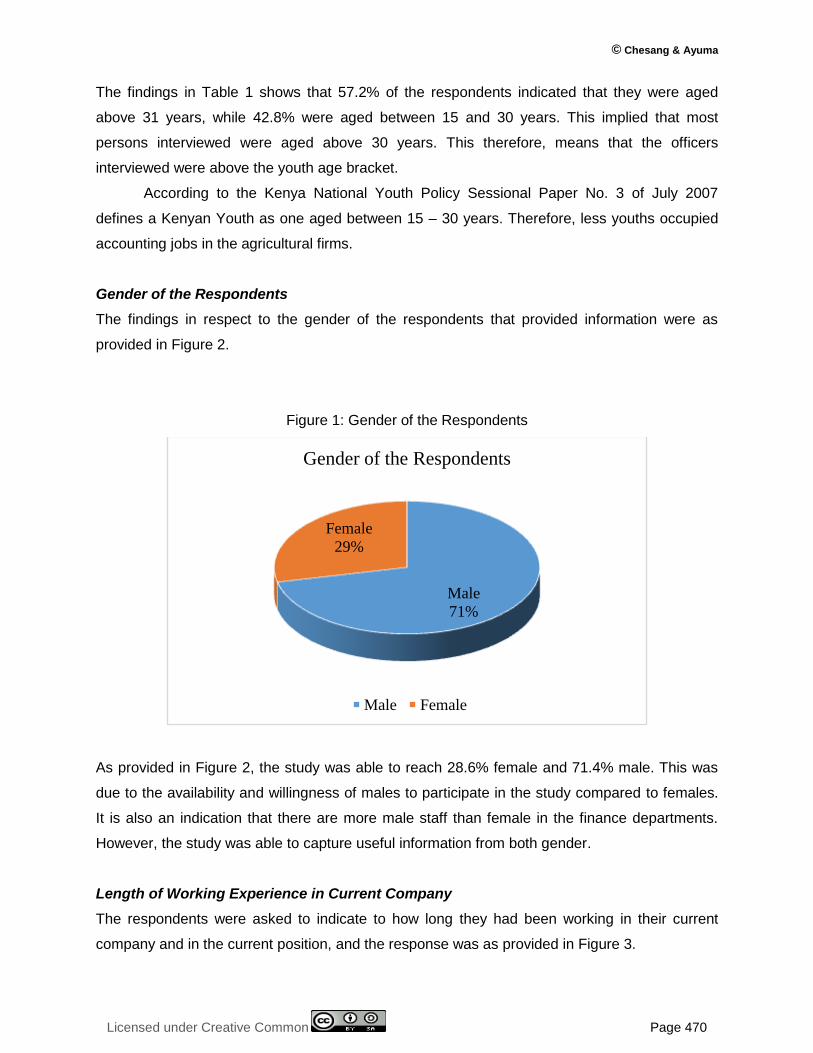
Gender of the Respondents
The findings in respect to the gender of the respondents that provided information were as
provided in Figure 2.
Figure 1: Gender of the Respondents
As provided in Figure 2, the study was able to reach 28.6% female and 71.4% male. This was
due to the availability and willingness of males to participate in the study compared to females.
It is also an indication that there are more male staff than female in the finance departments.
However, the study was able to capture useful information from both gender.
Length of Working Experience in Current Company
The respondents were asked to indicate to how long they had been working in their current
company and in the current position, and the response was as provided in Figure 3.
Male
71%
Female
29%
Gender of the Respondents
Male Female
International Journal of Economics, Commerce and Management, United Kingdom
Licensed under Creative Common Page 471
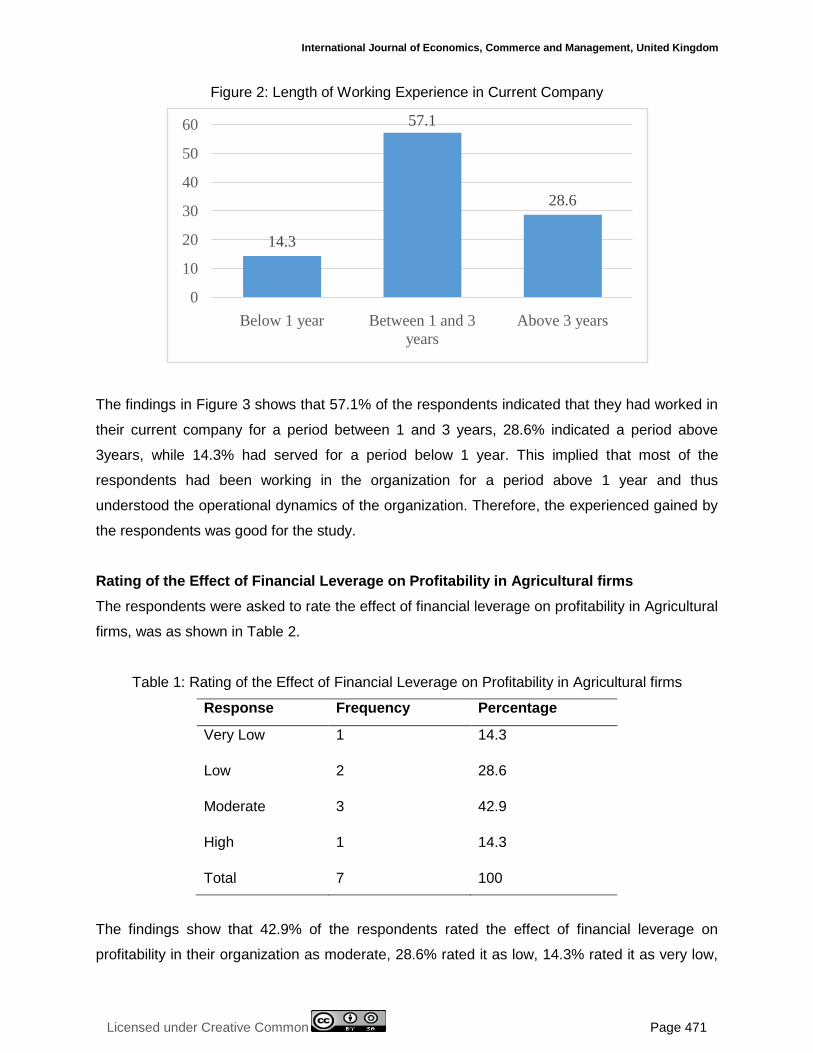
Figure 2: Length of Working Experience in Current Company
The findings in Figure 3 shows that 57.1% of the respondents indicated that they had worked in
their current company for a period between 1 and 3 years, 28.6% indicated a period above
3years, while 14.3% had served for a period below 1 year. This implied that most of the
respondents had been working in the organization for a period above 1 year and thus
understood the operational dynamics of the organization. Therefore, the experienced gained by
the respondents was good for the study.
Rating of the Effect of Financial Leverage on Profitability in Agricultural firms
The respondents were asked to rate the effect of financial leverage on profitability in Agricultural
firms, was as shown in Table 2.
Table 1: Rating of the Effect of Financial Leverage on Profitability in Agricultural firms
Response Frequency Percentage
Very Low 1 14.3
Low 2 28.6
Moderate 3 42.9
High 1 14.3
Total 7 100
The findings show that 42.9% of the respondents rated the effect of financial leverage on
profitability in their organization as moderate, 28.6% rated it as low, 14.3% rated it as very low,
14.3
57.1
28.6
0
10
20
30
40
50
60
Below 1 year Between 1 and 3
years
Above 3 years
© Chesang & Ayuma
Licensed under Creative Common Page 472
while 14.3% rated it as high. This implied that according to most of the respondents the effect of
financial leverage was high. High leverage positively affected the financial performance of
agricultural firms. This finding was in agreement with a study by Gweji and Karanja (2014) which
established that there was a strong correlation between financial leverage and financial
performance of firms in Kenya.
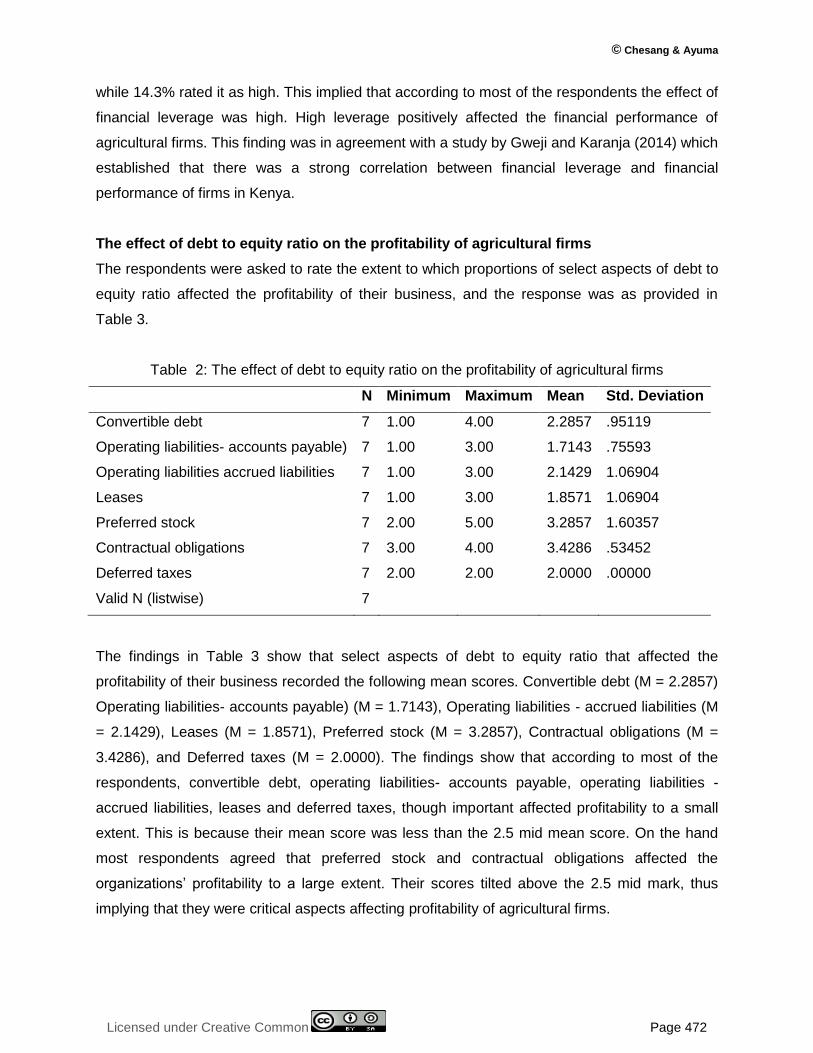
The effect of debt to equity ratio on the profitability of agricultural firms
The respondents were asked to rate the extent to which proportions of select aspects of debt to
equity ratio affected the profitability of their business, and the response was as provided in
Table 3.
Table 2: The effect of debt to equity ratio on the profitability of agricultural firms
N Minimum Maximum Mean Std. Deviation
Convertible debt 7 1.00 4.00 2.2857 .95119
Operating liabilities- accounts payable) 7 1.00 3.00 1.7143 .75593
Operating liabilities accrued liabilities 7 1.00 3.00 2.1429 1.06904
Leases 7 1.00 3.00 1.8571 1.06904
Preferred stock 7 2.00 5.00 3.2857 1.60357
Contractual obligations 7 3.00 4.00 3.4286 .53452
Deferred taxes 7 2.00 2.00 2.0000 .00000
Valid N (listwise) 7
The findings in Table 3 show that select aspects of debt to equity ratio that affected the
profitability of their business recorded the following mean scores. Convertible debt (M = 2.2857)
Operating liabilities- accounts payable) (M = 1.7143), Operating liabilities - accrued liabilities (M
= 2.1429), Leases (M = 1.8571), Preferred stock (M = 3.2857), Contractual obligations (M =
3.4286), and Deferred taxes (M = 2.0000). The findings show that according to most of the
respondents, convertible debt, operating liabilities- accounts payable, operating liabilities -
accrued liabilities, leases and deferred taxes, though important affected profitability to a small
extent. This is because their mean score was less than the 2.5 mid mean score. On the hand
most respondents agreed that preferred stock and contractual obligations affected the
organizations‟ profitability to a large extent. Their scores tilted above the 2.5 mid mark, thus
implying that they were critical aspects affecting profitability of agricultural firms.
International Journal of Economics, Commerce and Management, United Kingdom
Licensed under Creative Common Page 473
A study by Bancel and Mittoo (2004) in Europe revealed that a majority of firms issue
convertibles as „delayed equity‟ and as „debt sweetener‟ and that managers also use
convertibles to avoid short-term equity dilution and to signal firm‟s future growth opportunities.
Furthermore, they document a large cross-sectional variation across firms in rationales for
issuing convertibles and find mixed support for most theoretical models. Therefore, debt to
equity ratio had an effect on the profitability of agricultural firms.
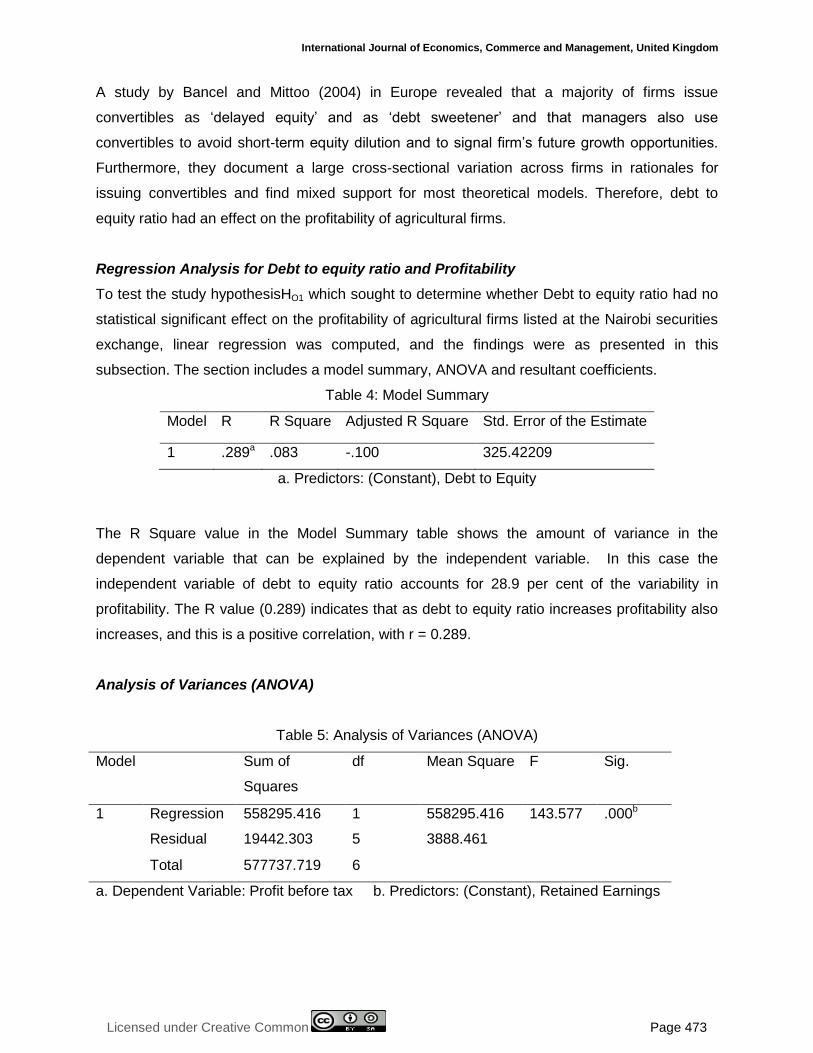
Regression Analysis for Debt to equity ratio and Profitability
To test the study hypothesisHO1 which sought to determine whether Debt to equity ratio had no
statistical significant effect on the profitability of agricultural firms listed at the Nairobi securities
exchange, linear regression was computed, and the findings were as presented in this
subsection. The section includes a model summary, ANOVA and resultant coefficients.
Table 4: Model Summary
Model R R Square Adjusted R Square Std. Error of the Estimate
1 .289a .083 -.100 325.42209
a. Predictors: (Constant), Debt to Equity
The R Square value in the Model Summary table shows the amount of variance in the
dependent variable that can be explained by the independent variable. In this case the
independent variable of debt to equity ratio accounts for 28.9 per cent of the variability in
profitability. The R value (0.289) indicates that as debt to equity ratio increases profitability also
increases, and this is a positive correlation, with r = 0.289.
Analysis of Variances (ANOVA)
Table 5: Analysis of Variances (ANOVA)
Model Sum of
Squares
df Mean Square F Sig.
1 Regression 558295.416 1 558295.416 143.577 .000b
Residual 19442.303 5 3888.461
Total 577737.719 6
a. Dependent Variable: Profit before tax b. Predictors: (Constant), Retained Earnings
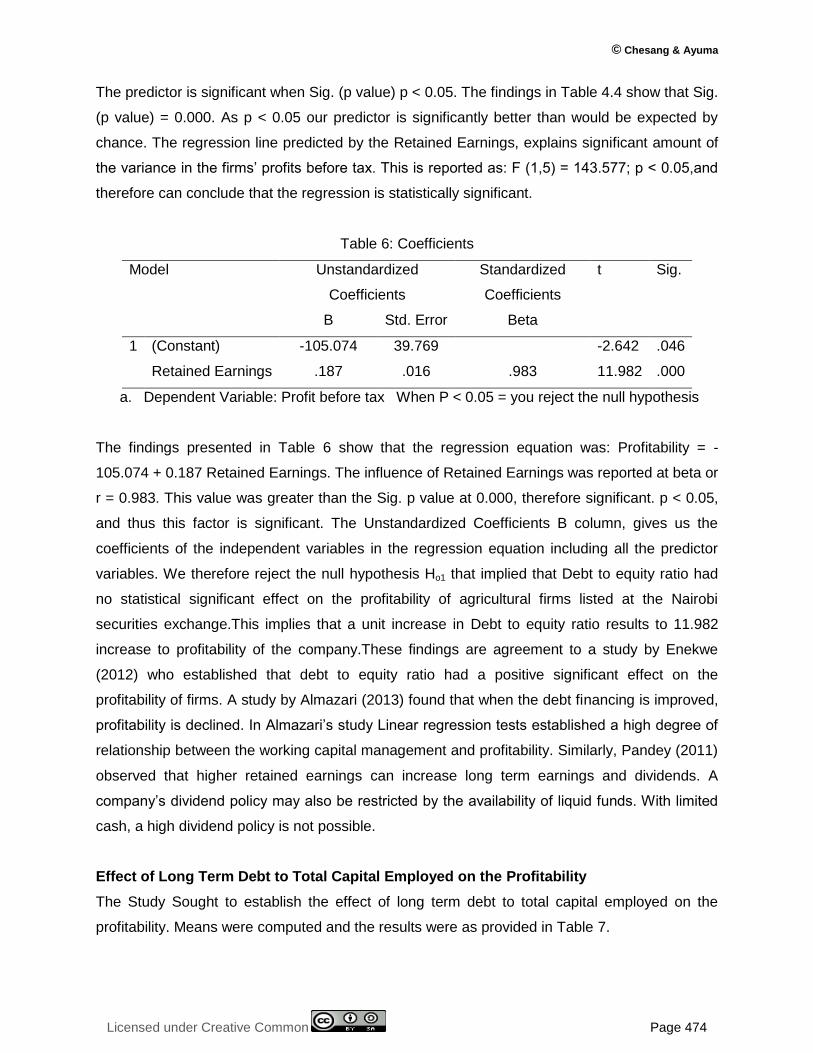
© Chesang & Ayuma
Licensed under Creative Common Page 474
The predictor is significant when Sig. (p value) p < 0.05. The findings in Table 4.4 show that Sig.
(p value) = 0.000. As p < 0.05 our predictor is significantly better than would be expected by
chance. The regression line predicted by the Retained Earnings, explains significant amount of
the variance in the firms‟ profits before tax. This is reported as: F (1,5) = 143.577; p < 0.05,and
therefore can conclude that the regression is statistically significant.
Table 6: Coefficients
Model Unstandardized
Coefficients
Standardized
Coefficients
t Sig.
B Std. Error Beta
1 (Constant) -105.074 39.769 -2.642 .046
Retained Earnings .187 .016 .983 11.982 .000
a. Dependent Variable: Profit before tax When P < 0.05 = you reject the null hypothesis
The findings presented in Table 6 show that the regression equation was: Profitability = -
105.074 + 0.187 Retained Earnings. The influence of Retained Earnings was reported at beta or
r = 0.983. This value was greater than the Sig. p value at 0.000, therefore significant. p < 0.05,
and thus this factor is significant. The Unstandardized Coefficients B column, gives us the
coefficients of the independent variables in the regression equation including all the predictor
variables. We therefore reject the null hypothesis Ho1 that implied that Debt to equity ratio had
no statistical significant effect on the profitability of agricultural firms listed at the Nairobi
securities exchange.This implies that a unit increase in Debt to equity ratio results to 11.982
increase to profitability of the company.These findings are agreement to a study by Enekwe
(2012) who established that debt to equity ratio had a positive significant effect on the
profitability of firms. A study by Almazari (2013) found that when the debt financing is improved,
profitability is declined. In Almazari‟s study Linear regression tests established a high degree of
relationship between the working capital management and profitability. Similarly, Pandey (2011)
observed that higher retained earnings can increase long term earnings and dividends. A
company‟s dividend policy may also be restricted by the availability of liquid funds. With limited
cash, a high dividend policy is not possible.
Effect of Long Term Debt to Total Capital Employed on the Profitability
The Study Sought to establish the effect of long term debt to total capital employed on the
profitability. Means were computed and the results were as provided in Table 7.
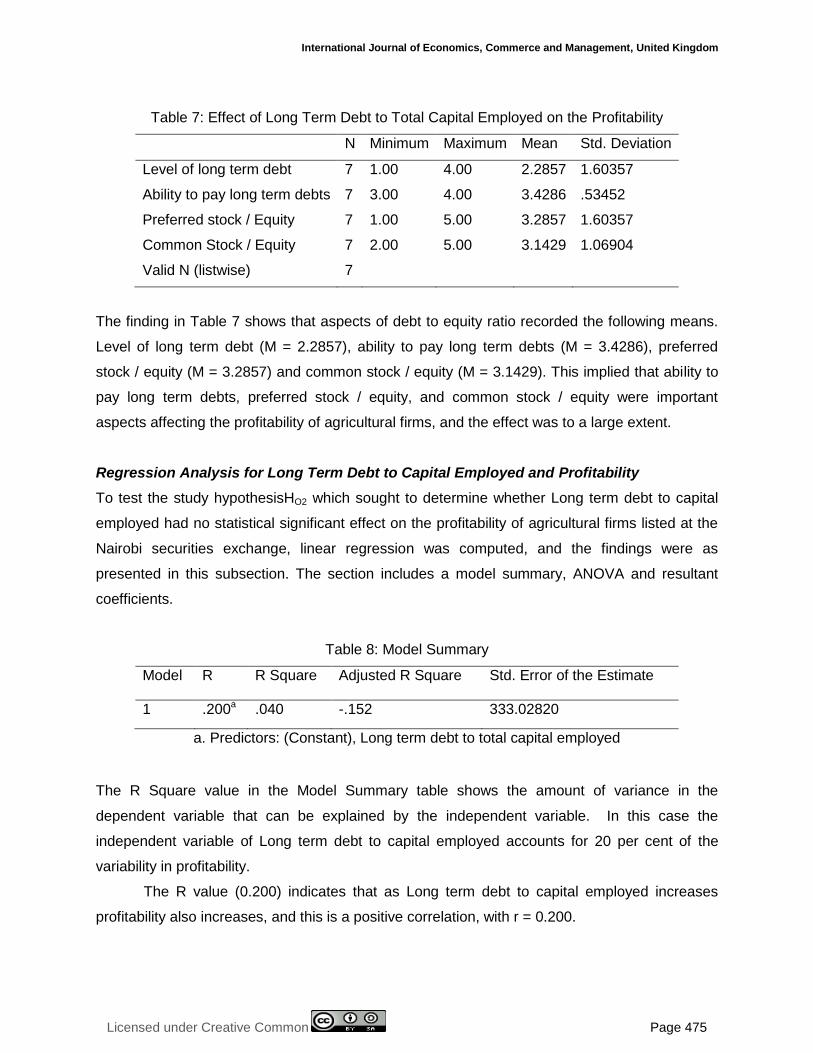
International Journal of Economics, Commerce and Management, United Kingdom
Licensed under Creative Common Page 475
Table 7: Effect of Long Term Debt to Total Capital Employed on the Profitability
N Minimum Maximum Mean Std. Deviation
Level of long term debt 7 1.00 4.00 2.2857 1.60357
Ability to pay long term debts 7 3.00 4.00 3.4286 .53452
Preferred stock / Equity 7 1.00 5.00 3.2857 1.60357
Common Stock / Equity 7 2.00 5.00 3.1429 1.06904
Valid N (listwise) 7
The finding in Table 7 shows that aspects of debt to equity ratio recorded the following means.
Level of long term debt (M = 2.2857), ability to pay long term debts (M = 3.4286), preferred
stock / equity (M = 3.2857) and common stock / equity (M = 3.1429). This implied that ability to
pay long term debts, preferred stock / equity, and common stock / equity were important
aspects affecting the profitability of agricultural firms, and the effect was to a large extent.
Regression Analysis for Long Term Debt to Capital Employed and Profitability
To test the study hypothesisHO2 which sought to determine whether Long term debt to capital
employed had no statistical significant effect on the profitability of agricultural firms listed at the
Nairobi securities exchange, linear regression was computed, and the findings were as
presented in this subsection. The section includes a model summary, ANOVA and resultant
coefficients.
Table 8: Model Summary
Model R R Square Adjusted R Square Std. Error of the Estimate
1 .200a .040 -.152 333.02820
a. Predictors: (Constant), Long term debt to total capital employed
The R Square value in the Model Summary table shows the amount of variance in the
dependent variable that can be explained by the independent variable. In this case the
independent variable of Long term debt to capital employed accounts for 20 per cent of the
variability in profitability.
The R value (0.200) indicates that as Long term debt to capital employed increases
profitability also increases, and this is a positive correlation, with r = 0.200.
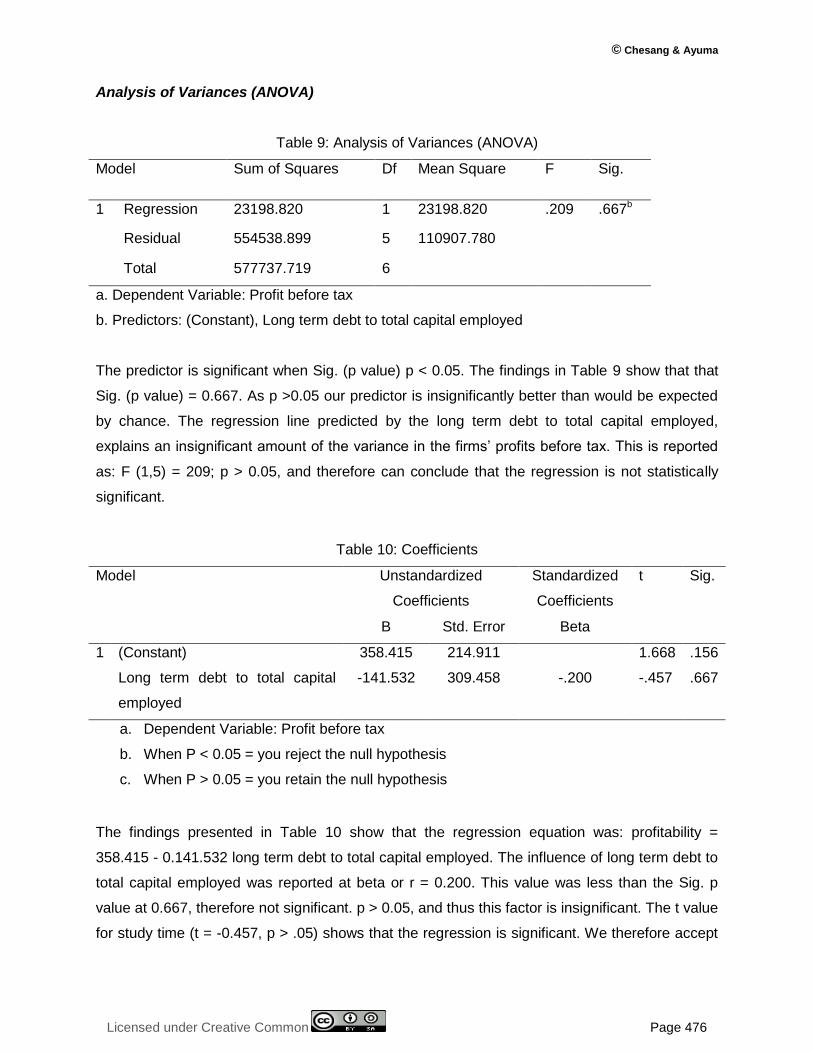
© Chesang & Ayuma
Licensed under Creative Common Page 476
Analysis of Variances (ANOVA)
Table 9: Analysis of Variances (ANOVA)
Model Sum of Squares Df Mean Square F Sig.
1 Regression 23198.820 1 23198.820 .209 .667b
Residual 554538.899 5 110907.780
Total 577737.719 6
a. Dependent Variable: Profit before tax
b. Predictors: (Constant), Long term debt to total capital employed
The predictor is significant when Sig. (p value) p < 0.05. The findings in Table 9 show that that
Sig. (p value) = 0.667. As p >0.05 our predictor is insignificantly better than would be expected
by chance. The regression line predicted by the long term debt to total capital employed,
explains an insignificant amount of the variance in the firms‟ profits before tax. This is reported
as: F (1,5) = 209; p > 0.05, and therefore can conclude that the regression is not statistically
significant.
Table 10: Coefficients
Model Unstandardized
Coefficients
Standardized
Coefficients
t Sig.
B Std. Error Beta
1 (Constant) 358.415 214.911 1.668 .156
Long term debt to total capital
employed
-141.532 309.458 -.200 -.457 .667
a. Dependent Variable: Profit before tax
b. When P < 0.05 = you reject the null hypothesis
c. When P > 0.05 = you retain the null hypothesis
The findings presented in Table 10 show that the regression equation was: profitability =
358.415 - 0.141.532 long term debt to total capital employed. The influence of long term debt to
total capital employed was reported at beta or r = 0.200. This value was less than the Sig. p
value at 0.667, therefore not significant. p > 0.05, and thus this factor is insignificant. The t value
for study time (t = -0.457, p > .05) shows that the regression is significant. We therefore accept
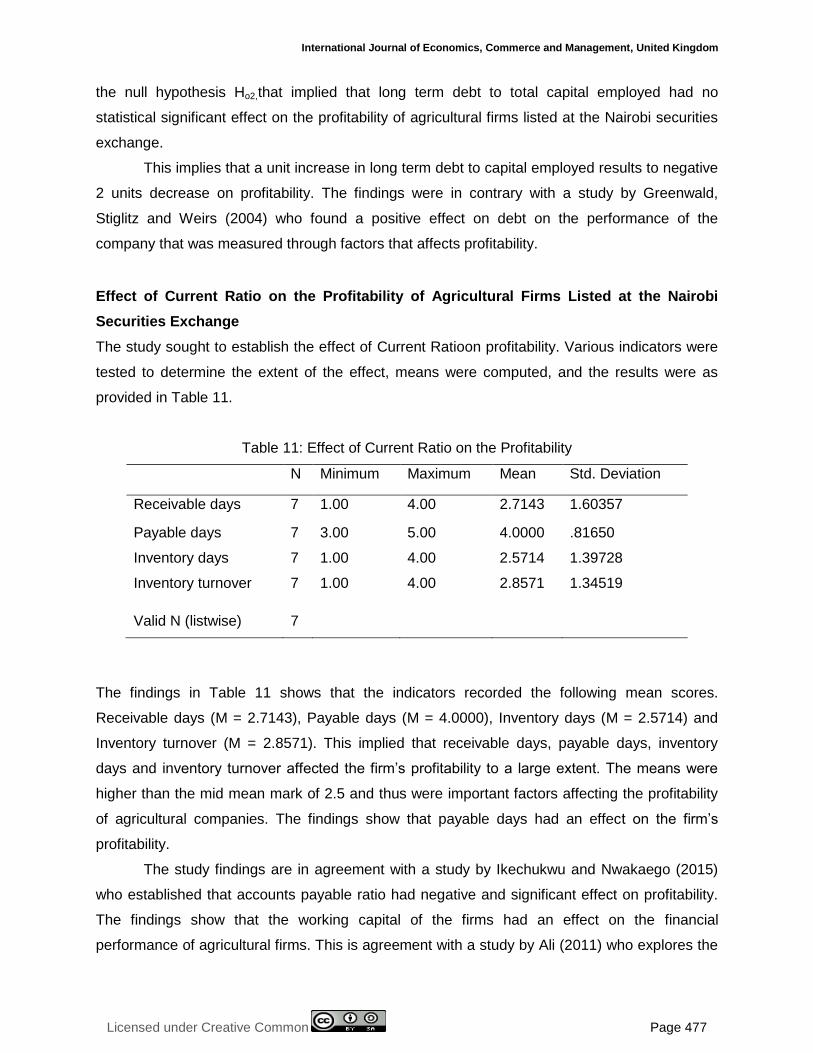
International Journal of Economics, Commerce and Management, United Kingdom
Licensed under Creative Common Page 477
the null hypothesis Ho2,that implied that long term debt to total capital employed had no
statistical significant effect on the profitability of agricultural firms listed at the Nairobi securities
exchange.
This implies that a unit increase in long term debt to capital employed results to negative
2 units decrease on profitability. The findings were in contrary with a study by Greenwald,
Stiglitz and Weirs (2004) who found a positive effect on debt on the performance of the
company that was measured through factors that affects profitability.
Effect of Current Ratio on the Profitability of Agricultural Firms Listed at the Nairobi
Securities Exchange
The study sought to establish the effect of Current Ratioon profitability. Various indicators were
tested to determine the extent of the effect, means were computed, and the results were as
provided in Table 11.
Table 11: Effect of Current Ratio on the Profitability
N Minimum Maximum Mean Std. Deviation
Receivable days 7 1.00 4.00 2.7143 1.60357
Payable days 7 3.00 5.00 4.0000 .81650
Inventory days 7 1.00 4.00 2.5714 1.39728
Inventory turnover 7 1.00 4.00 2.8571 1.34519
Valid N (listwise) 7
The findings in Table 11 shows that the indicators recorded the following mean scores.
Receivable days (M = 2.7143), Payable days (M = 4.0000), Inventory days (M = 2.5714) and
Inventory turnover (M = 2.8571). This implied that receivable days, payable days, inventory
days and inventory turnover affected the firm‟s profitability to a large extent. The means were
higher than the mid mean mark of 2.5 and thus were important factors affecting the profitability
of agricultural companies. The findings show that payable days had an effect on the firm‟s
profitability.
The study findings are in agreement with a study by Ikechukwu and Nwakaego (2015)
who established that accounts payable ratio had negative and significant effect on profitability.
The findings show that the working capital of the firms had an effect on the financial
performance of agricultural firms. This is agreement with a study by Ali (2011) who explores the
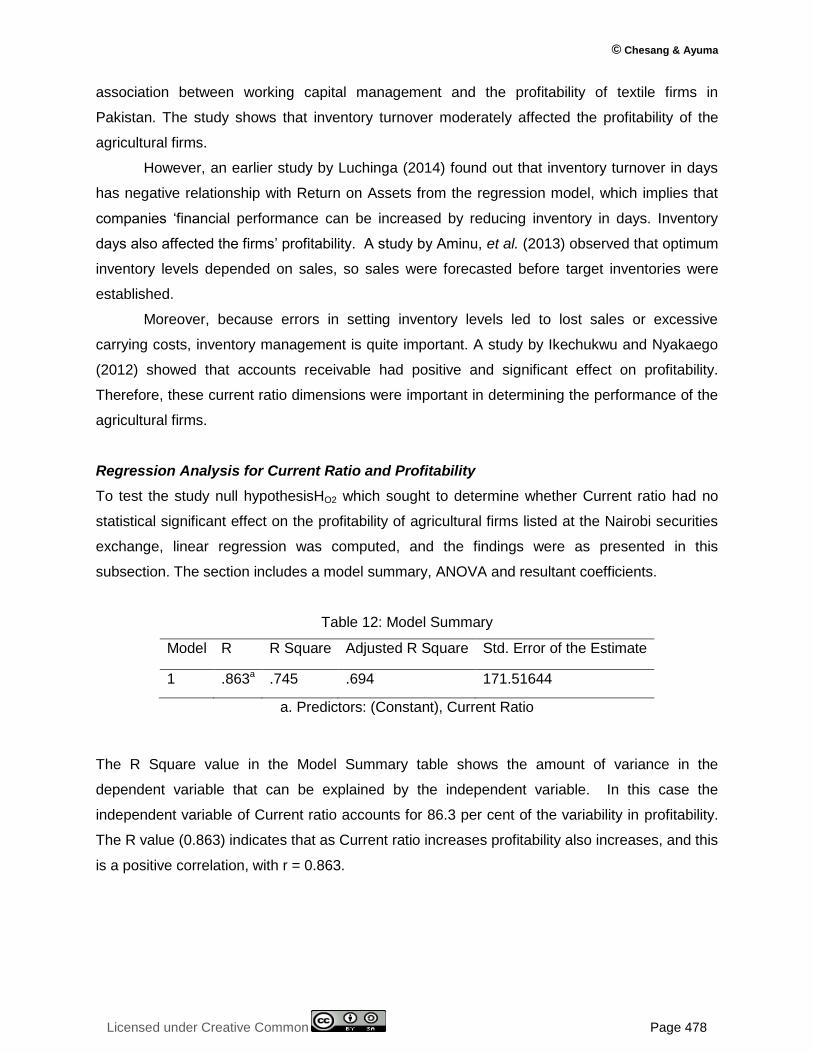
© Chesang & Ayuma
Licensed under Creative Common Page 478
association between working capital management and the profitability of textile firms in
Pakistan. The study shows that inventory turnover moderately affected the profitability of the
agricultural firms.
However, an earlier study by Luchinga (2014) found out that inventory turnover in days
has negative relationship with Return on Assets from the regression model, which implies that
companies „financial performance can be increased by reducing inventory in days. Inventory
days also affected the firms‟ profitability. A study by Aminu, et al. (2013) observed that optimum
inventory levels depended on sales, so sales were forecasted before target inventories were
established.
Moreover, because errors in setting inventory levels led to lost sales or excessive
carrying costs, inventory management is quite important. A study by Ikechukwu and Nyakaego
(2012) showed that accounts receivable had positive and significant effect on profitability.
Therefore, these current ratio dimensions were important in determining the performance of the
agricultural firms.
Regression Analysis for Current Ratio and Profitability
To test the study null hypothesisHO2 which sought to determine whether Current ratio had no
statistical significant effect on the profitability of agricultural firms listed at the Nairobi securities
exchange, linear regression was computed, and the findings were as presented in this
subsection. The section includes a model summary, ANOVA and resultant coefficients.
Table 12: Model Summary
Model R R Square Adjusted R Square Std. Error of the Estimate
1 .863a .745 .694 171.51644
a. Predictors: (Constant), Current Ratio
The R Square value in the Model Summary table shows the amount of variance in the
dependent variable that can be explained by the independent variable. In this case the
independent variable of Current ratio accounts for 86.3 per cent of the variability in profitability.
The R value (0.863) indicates that as Current ratio increases profitability also increases, and this
is a positive correlation, with r = 0.863.

International Journal of Economics, Commerce and Management, United Kingdom
Licensed under Creative Common Page 479
Analysis of Variances (ANOVA)
Table 13: Analysis of Variances (ANOVA)
Model Sum of Squares df Mean Square F Sig.
1 Regression 430648.282 1 430648.282 14.639 .012b
Residual 147089.437 5 29417.887
Total 577737.719 6
a. Dependent Variable: Profit before tax b. Predictors: (Constant), Current Ratio
In the study, the predictor is significant when Sig. (p value) p < 0.05. The findings in Table 4.10
show that that Sig. (p value) = 0.012. As p <0.05 our predictor is significantly better to
profitability than would be expected by chance. The regression line predicted by the current
ratio, explains a significant amount of the variance in the firms‟ profits before tax. This is
reported as: F (1,5) = 14.639; p < 0.05, and therefore can conclude that the regression is
statistically significant.
Table 14: Coefficients
Model Unstandardized Coefficients Standardized Coefficients t Sig.
B Std. Error Beta
1 (Constant) 761.586 141.873 5.368 .003
Current Ratio -1408.2
79
368.072 -.863 -3.826 .012
a. Dependent Variable: Profit before tax
b. When p< 0.05 = you reject the null hypothesis
c. When p > 0.05 = you retain the null hypothesis
The findings presented in Table 14 show that the regression equation was: profitability =
761.586 - 1408.279 Current Ratio. The influence of Current Ratio employed was reported at
beta or r = -0.863. This value was less than the Sig. p value at 0.012, therefore significant. p <
0.05, and thus this factor is significant in relation to profitability of the firm. The t value for current
ratio (t = -3.826, p < .05) this shows that the regression is significant to firms profitability. We
therefore reject the null hypothesis Ho3that implied that Current Ratio had no statistical
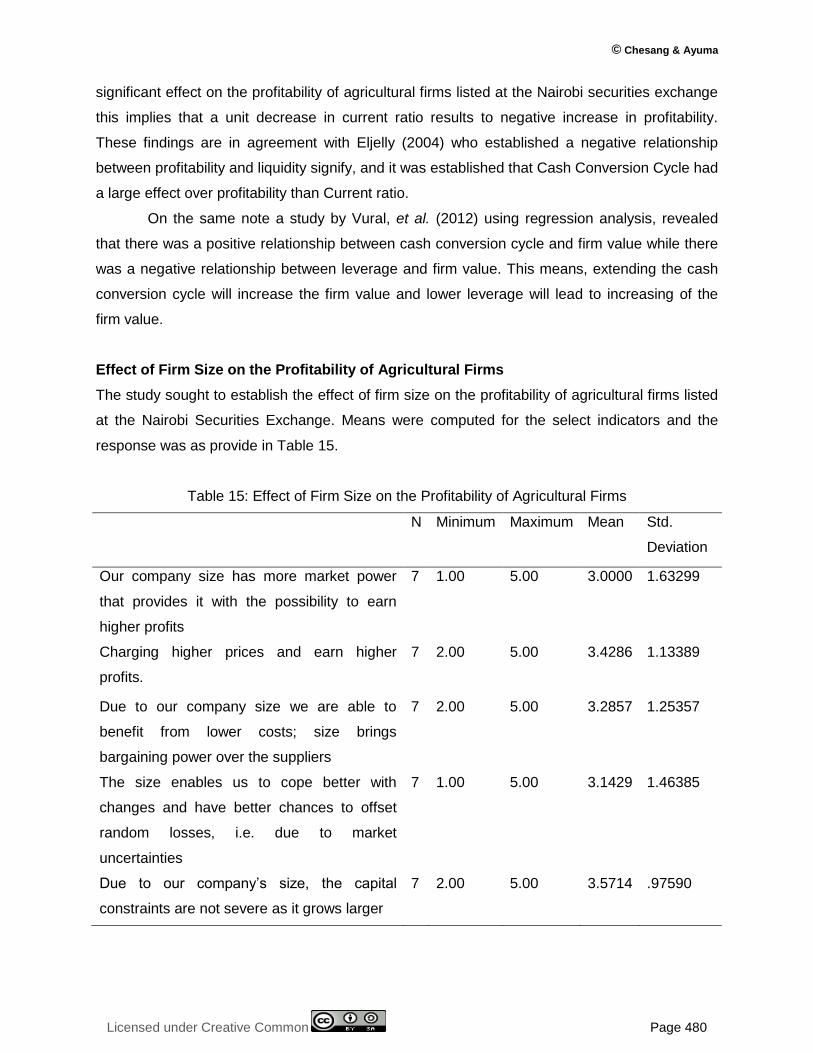
© Chesang & Ayuma
Licensed under Creative Common Page 480
significant effect on the profitability of agricultural firms listed at the Nairobi securities exchange
this implies that a unit decrease in current ratio results to negative increase in profitability.
These findings are in agreement with Eljelly (2004) who established a negative relationship
between profitability and liquidity signify, and it was established that Cash Conversion Cycle had
a large effect over profitability than Current ratio.
On the same note a study by Vural, et al. (2012) using regression analysis, revealed
that there was a positive relationship between cash conversion cycle and firm value while there
was a negative relationship between leverage and firm value. This means, extending the cash
conversion cycle will increase the firm value and lower leverage will lead to increasing of the
firm value.
Effect of Firm Size on the Profitability of Agricultural Firms
The study sought to establish the effect of firm size on the profitability of agricultural firms listed
at the Nairobi Securities Exchange. Means were computed for the select indicators and the
response was as provide in Table 15.
Table 15: Effect of Firm Size on the Profitability of Agricultural Firms
N Minimum Maximum Mean Std.
Deviation
Our company size has more market power
that provides it with the possibility to earn
higher profits
7 1.00 5.00 3.0000 1.63299
Charging higher prices and earn higher
profits.
7 2.00 5.00 3.4286 1.13389
Due to our company size we are able to
benefit from lower costs; size brings
bargaining power over the suppliers
7 2.00 5.00 3.2857 1.25357
The size enables us to cope better with
changes and have better chances to offset
random losses, i.e. due to market
uncertainties
7 1.00 5.00 3.1429 1.46385
Due to our company‟s size, the capital
constraints are not severe as it grows larger
7 2.00 5.00 3.5714 .97590
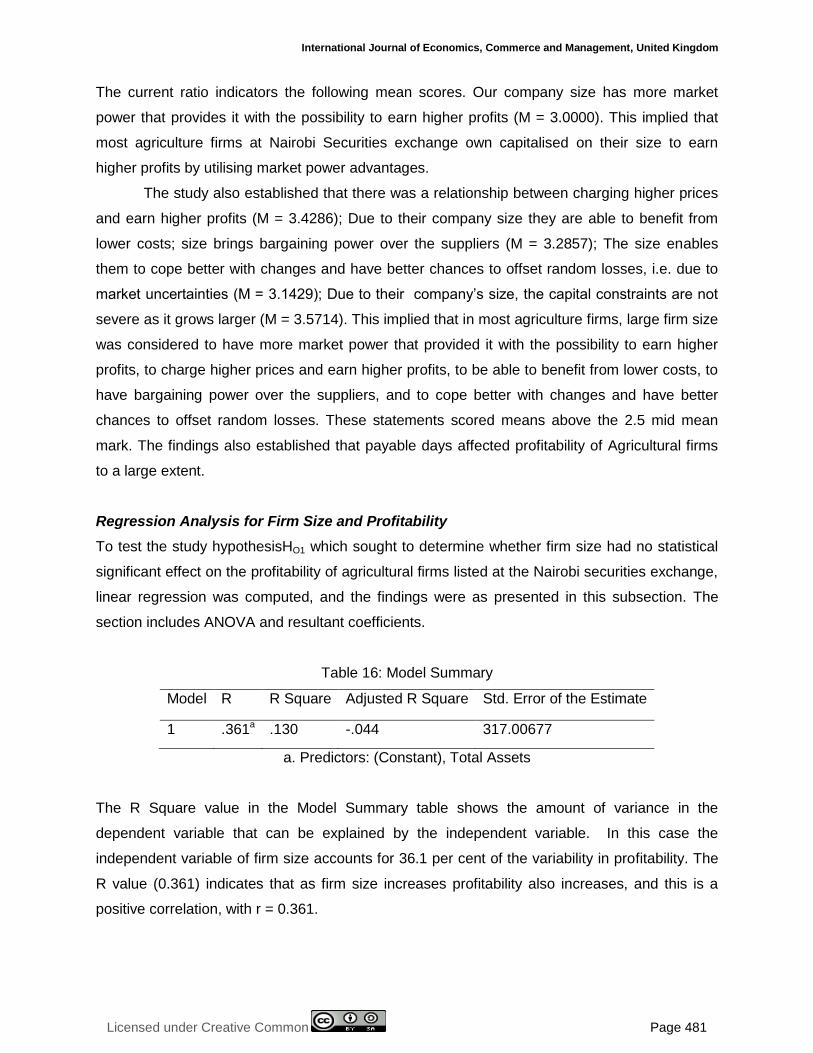
International Journal of Economics, Commerce and Management, United Kingdom
Licensed under Creative Common Page 481
The current ratio indicators the following mean scores. Our company size has more market
power that provides it with the possibility to earn higher profits (M = 3.0000). This implied that
most agriculture firms at Nairobi Securities exchange own capitalised on their size to earn
higher profits by utilising market power advantages.
The study also established that there was a relationship between charging higher prices
and earn higher profits (M = 3.4286); Due to their company size they are able to benefit from
lower costs; size brings bargaining power over the suppliers (M = 3.2857); The size enables
them to cope better with changes and have better chances to offset random losses, i.e. due to
market uncertainties (M = 3.1429); Due to their company‟s size, the capital constraints are not
severe as it grows larger (M = 3.5714). This implied that in most agriculture firms, large firm size
was considered to have more market power that provided it with the possibility to earn higher
profits, to charge higher prices and earn higher profits, to be able to benefit from lower costs, to
have bargaining power over the suppliers, and to cope better with changes and have better
chances to offset random losses. These statements scored means above the 2.5 mid mean
mark. The findings also established that payable days affected profitability of Agricultural firms
to a large extent.
Regression Analysis for Firm Size and Profitability
To test the study hypothesisHO1 which sought to determine whether firm size had no statistical
significant effect on the profitability of agricultural firms listed at the Nairobi securities exchange,
linear regression was computed, and the findings were as presented in this subsection. The
section includes ANOVA and resultant coefficients.
Table 16: Model Summary
Model R R Square Adjusted R Square Std. Error of the Estimate
1 .361a .130 -.044 317.00677
a. Predictors: (Constant), Total Assets
The R Square value in the Model Summary table shows the amount of variance in the
dependent variable that can be explained by the independent variable. In this case the
independent variable of firm size accounts for 36.1 per cent of the variability in profitability. The
R value (0.361) indicates that as firm size increases profitability also increases, and this is a
positive correlation, with r = 0.361.
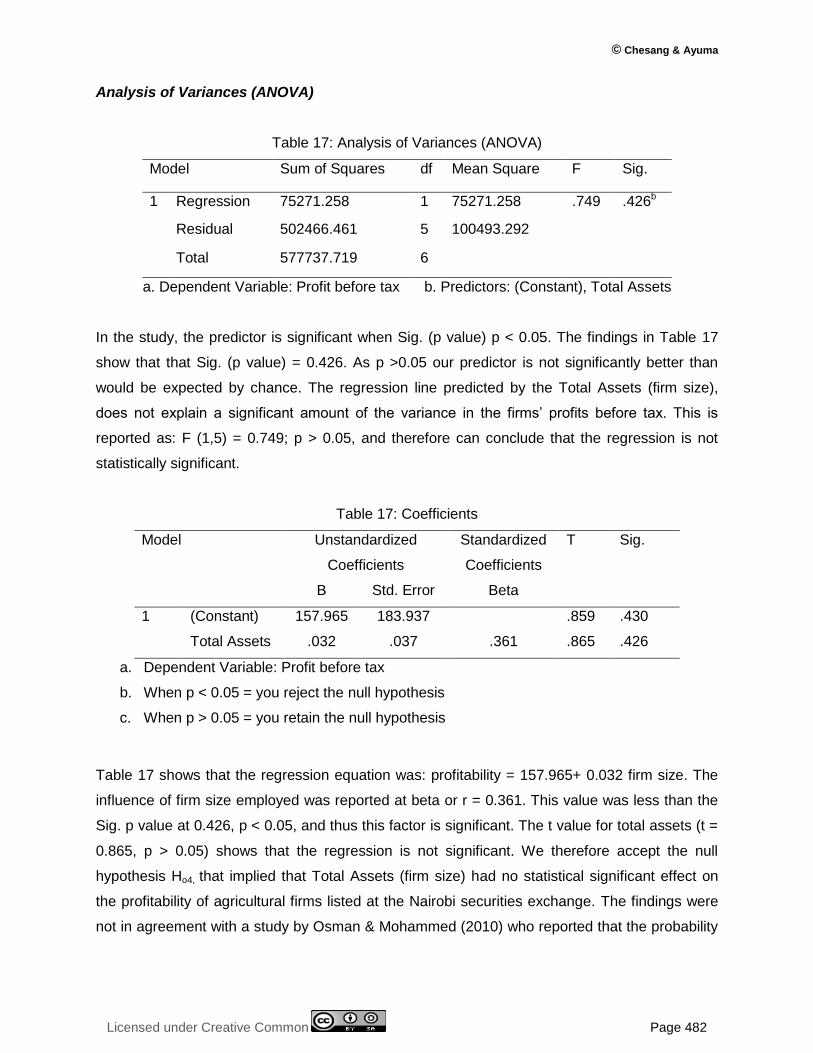
© Chesang & Ayuma
Licensed under Creative Common Page 482
Analysis of Variances (ANOVA)
Table 17: Analysis of Variances (ANOVA)
Model Sum of Squares df Mean Square F Sig.
1 Regression 75271.258 1 75271.258 .749 .426b
Residual 502466.461 5 100493.292
Total 577737.719 6
a. Dependent Variable: Profit before tax b. Predictors: (Constant), Total Assets
In the study, the predictor is significant when Sig. (p value) p < 0.05. The findings in Table 17
show that that Sig. (p value) = 0.426. As p >0.05 our predictor is not significantly better than
would be expected by chance. The regression line predicted by the Total Assets (firm size),
does not explain a significant amount of the variance in the firms‟ profits before tax. This is
reported as: F (1,5) = 0.749; p > 0.05, and therefore can conclude that the regression is not
statistically significant.
Table 17: Coefficients
Model Unstandardized
Coefficients
Standardized
Coefficients
T Sig.
B Std. Error Beta
1 (Constant) 157.965 183.937 .859 .430
Total Assets .032 .037 .361 .865 .426
a. Dependent Variable: Profit before tax
b. When p < 0.05 = you reject the null hypothesis
c. When p > 0.05 = you retain the null hypothesis
Table 17 shows that the regression equation was: profitability = 157.965+ 0.032 firm size. The
influence of firm size employed was reported at beta or r = 0.361. This value was less than the
Sig. p value at 0.426, p < 0.05, and thus this factor is significant. The t value for total assets (t =
0.865, p > 0.05) shows that the regression is not significant. We therefore accept the null
hypothesis Ho4, that implied that Total Assets (firm size) had no statistical significant effect on
the profitability of agricultural firms listed at the Nairobi securities exchange. The findings were
not in agreement with a study by Osman & Mohammed (2010) who reported that the probability
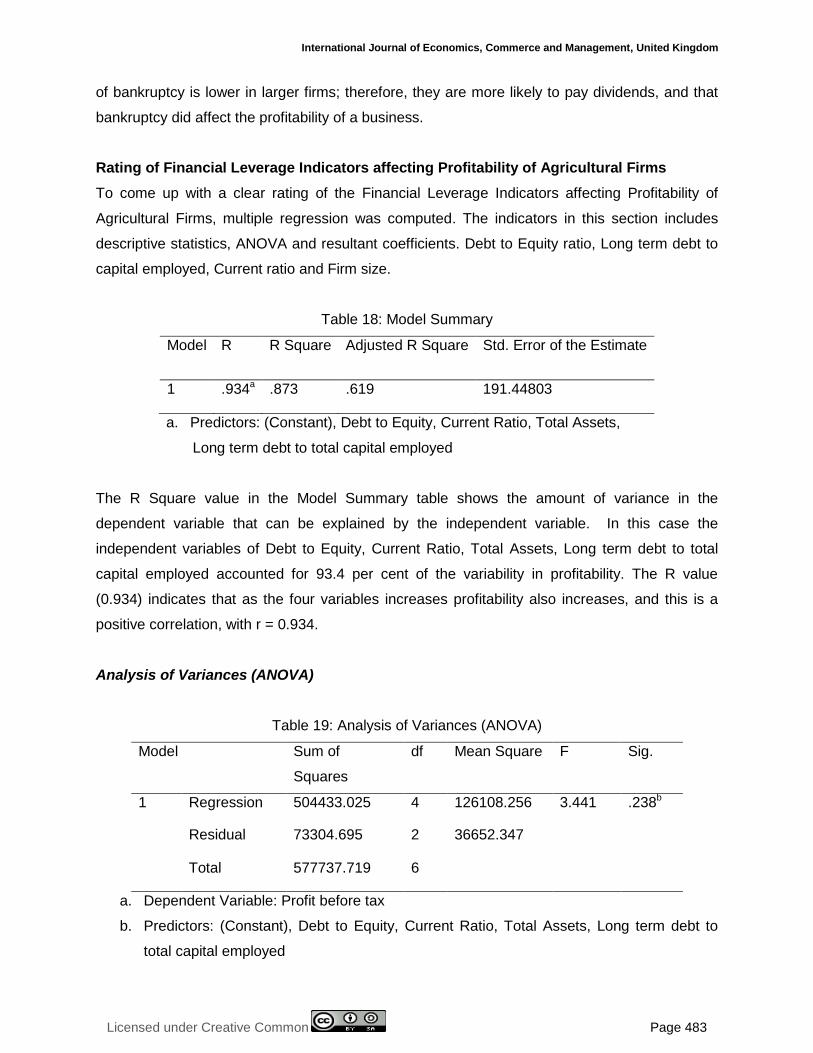
International Journal of Economics, Commerce and Management, United Kingdom
Licensed under Creative Common Page 483
of bankruptcy is lower in larger firms; therefore, they are more likely to pay dividends, and that
bankruptcy did affect the profitability of a business.
Rating of Financial Leverage Indicators affecting Profitability of Agricultural Firms
To come up with a clear rating of the Financial Leverage Indicators affecting Profitability of
Agricultural Firms, multiple regression was computed. The indicators in this section includes
descriptive statistics, ANOVA and resultant coefficients. Debt to Equity ratio, Long term debt to
capital employed, Current ratio and Firm size.
Table 18: Model Summary
Model R R Square Adjusted R Square Std. Error of the Estimate
1 .934a .873 .619 191.44803
a. Predictors: (Constant), Debt to Equity, Current Ratio, Total Assets,
Long term debt to total capital employed
The R Square value in the Model Summary table shows the amount of variance in the
dependent variable that can be explained by the independent variable. In this case the
independent variables of Debt to Equity, Current Ratio, Total Assets, Long term debt to total
capital employed accounted for 93.4 per cent of the variability in profitability. The R value
(0.934) indicates that as the four variables increases profitability also increases, and this is a
positive correlation, with r = 0.934.
Analysis of Variances (ANOVA)
Table 19: Analysis of Variances (ANOVA)
Model Sum of
Squares
df Mean Square F Sig.
1 Regression 504433.025 4 126108.256 3.441 .238b
Residual 73304.695 2 36652.347
Total 577737.719 6
a. Dependent Variable: Profit before tax
b. Predictors: (Constant), Debt to Equity, Current Ratio, Total Assets, Long term debt to
total capital employed
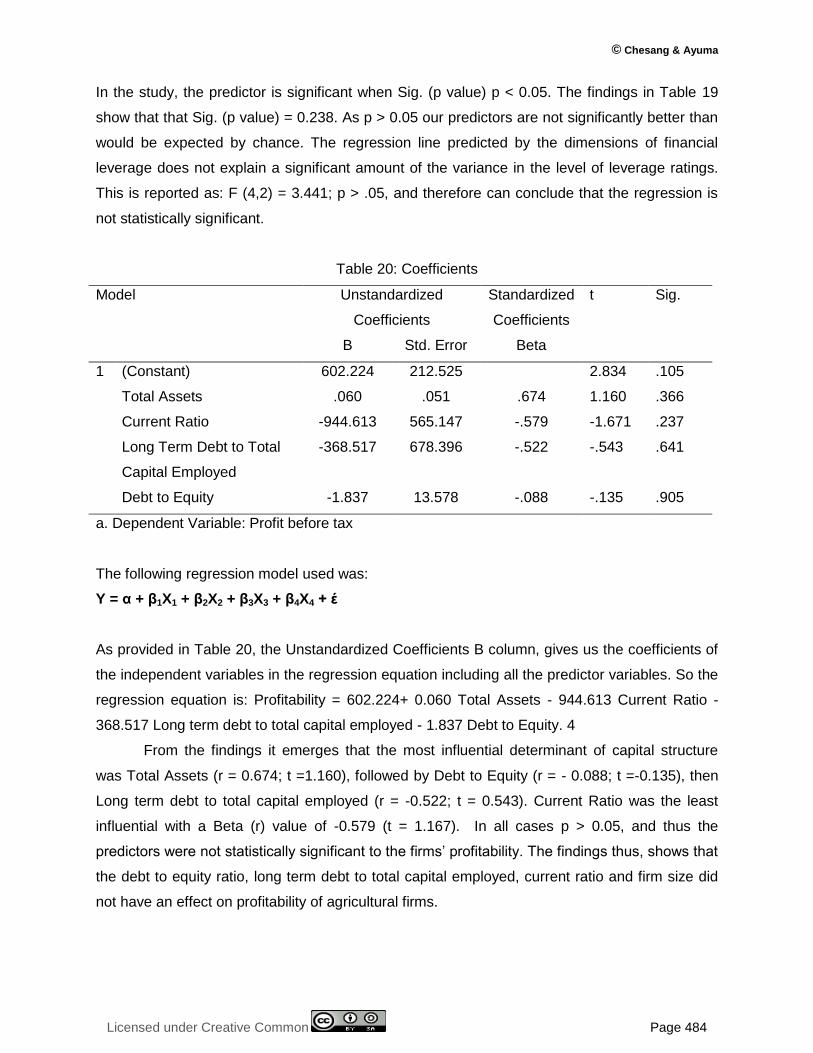
© Chesang & Ayuma
Licensed under Creative Common Page 484
In the study, the predictor is significant when Sig. (p value) p < 0.05. The findings in Table 19
show that that Sig. (p value) = 0.238. As p > 0.05 our predictors are not significantly better than
would be expected by chance. The regression line predicted by the dimensions of financial
leverage does not explain a significant amount of the variance in the level of leverage ratings.
This is reported as: F (4,2) = 3.441; p > .05, and therefore can conclude that the regression is
not statistically significant.
Table 20: Coefficients
Model Unstandardized
Coefficients
Standardized
Coefficients
t Sig.
B Std. Error Beta
1 (Constant) 602.224 212.525 2.834 .105
Total Assets .060 .051 .674 1.160 .366
Current Ratio -944.613 565.147 -.579 -1.671 .237
Long Term Debt to Total
Capital Employed
-368.517 678.396 -.522 -.543 .641
Debt to Equity -1.837 13.578 -.088 -.135 .905
a. Dependent Variable: Profit before tax
The following regression model used was:
Y = α + β1X1 + β2X2 + β3X3 + β4X4 + έ
As provided in Table 20, the Unstandardized Coefficients B column, gives us the coefficients of
the independent variables in the regression equation including all the predictor variables. So the
regression equation is: Profitability = 602.224+ 0.060 Total Assets - 944.613 Current Ratio -
368.517 Long term debt to total capital employed - 1.837 Debt to Equity. 4
From the findings it emerges that the most influential determinant of capital structure
was Total Assets (r = 0.674; t =1.160), followed by Debt to Equity (r = - 0.088; t =-0.135), then
Long term debt to total capital employed (r = -0.522; t = 0.543). Current Ratio was the least
influential with a Beta (r) value of -0.579 (t = 1.167). In all cases p > 0.05, and thus the
predictors were not statistically significant to the firms‟ profitability. The findings thus, shows that
the debt to equity ratio, long term debt to total capital employed, current ratio and firm size did
not have an effect on profitability of agricultural firms.
International Journal of Economics, Commerce and Management, United Kingdom
Licensed under Creative Common Page 485
CONCLUSIONS
Even though most accounting officers believed that debt to equity ratio had some positive effect
on the profitability of the firms, secondary data revealed otherwise. Secondary data analysis
revealed that though there was some effect, it was statistically significant. The study therefore,
concluded that debt to equity ratio did not significantly affect statistically the profitability of
agricultural firms listed at the Nairobi Securities Exchange. Important indicators such as
convertible debt, operating liabilities- accounts payable, operating liabilities - accrued liabilities,
leases and deferred taxes that are reported to positively affect profitability were not found to
work well in agricultural firms in Kenya. In most of the agricultural firms, debt to equity ratio had
no statistical significant effect on the profitability of agricultural firms listed at the Nairobi
securities exchange.
The findings show that even though most accounting officers indicated that long term
debt to total capital employed affected the profitability of agricultural firms, the effect was
statistically insignificant as shown by the regression analysis. The study therefore concluded
that long term debt to total capital employed as measured through indicators such as ability to
pay long term debts, preferred stock / equity, and common stock / equity, did not have a
statistically significant effect on the profitability of agricultural firms listed at the Nairobi
Securities exchange.
The study also concludes that current ratio did not have a statistically significant effect
on the profitability of agricultural firms listed at the Nairobi Securities Exchange. According to
most of the respondents‟ receivable days, payable days, inventory days and inventory turnover
affected the firm‟s profitability to a large extent. This was the view held by most of the
accounting officers; however, this view was not true as proven through data analyzed through
secondary data. It can be concluded that much has not been done by the firms to come up with
an effective ratio that contributes to profitability. It can therefore be concluded that Current Ratio
had a statistical significant effect on the profitability of agricultural firms listed at the Nairobi
Securities Exchange
The study also concluded that firm size was an important factor in the profitability of
agricultural firms listed at the Nairobi Securities Exchange. According to most of the
respondents‟ firm size had capacity advantages over small firms. However, despite this
advantage was not utilized well by agricultural firms. The officers were aware of such benefits,
however the effect according to the analysis revealed that firm size did not have a statistical
significant effect on the profitability of agricultural firms listed at the Nairobi Securities Exchange
in Kenya. It is concluded that Total Assets (firm size) had no statistical significant effect on the
profitability of agricultural firms listed at the Nairobi Securities Exchange
© Chesang & Ayuma
Licensed under Creative Common Page 486
RECOMMENDATIONS
Agricultural firms should consider investing in research to find out the best mix of capital
structure that does not negatively affect profitability. The research can also focus on findings
cheaper sources of debt finance as well as alternatives of debt finance.
Agricultural firms should consider where possible, using their internally generated funds
to finance their projects and only go for debt financing when they have fully exhausted their
internal funds.
Managers of listed Agricultural firms must ensure cash conversion cycles are reduced,
bargain for better payment terms with suppliers and collect receivables as soon as possible
from their clients in order to be more profitable.
Small agricultural firms need to consider mobilizing resources for firm expansion, while
large firms need to devise strategies on how to reap best from the associated size benefits in
the quest of making more profits.
The firms need to consider mobilizing resources for non-current assets / fixed assets so
as to enhance their long term loan borrowing capacity. There is also the need to work on
reduction of long term debt to total capital employed ratio, since this affects profit before tax and
even earnings per share.
The management of agricultural firms needs to consider ensuring that the current ratio is
maintained at most minimum since for this can help boost the firms‟ profitability. These can be
ensured by closely monitoring the receivable days, payable days, inventory days and inventory
turnover and periodically making appropriate adjustments.
SUGGESTIONS FOR FURTHER STUDIES
The study focused on agricultural firms listed at the Nairobi Stock Exchange that means unlisted
agricultural firms were not studied. A similar study on the effect of financial leverage on
profitability of unlisted agricultural firms needs to be carried out to compare if the results will
show similar effects.
The study recommends that future researchers interested in this field of research might
consider investigating all the firms and increase the period of study to ten years. The study was
based on a period of six years, 2010 to 2015, which may not have been conclusive for a firm
that started making low profits over the last three years.
A similar study needs to be carried out using different analytical tools to enable it find out
whether the findings of this study will still hold or shed more light for the firms on the relationship
that exist between leverage and profitability.
International Journal of Economics, Commerce and Management, United Kingdom
Licensed under Creative Common Page 487
REFERENCES
Adekunle, P. (2009), Determinants of capital structure: empirical evidence from the Czech Republic, Czech Journal of Economics and Finance, 54, (7): 2-21.
Akhtar, S., Maryam, J.B., & Sadia, H. (2012). Relationship between Financial Leverage and Financial Performance: Evidence from Fuel and Energy Sector of Pakistan. European Journal of Business and Management, 4 (11), 1- 12.
Alila, P. and Atieno R. (2006). Agricultural Policy in Kenya: Issues and Processes. Institute for Development Studies, University of Nairobi
Almazari, A.A. (2013).The Relationship between Working Capital Management and Profitability:Evidence from Saudi Cement Companies. British Journal of Economics, Management & Trade,4(1).
Al-Shamaileh, M. and Khanfar S. (2014). The Effect of the Financial Leverage on the Profitability in the Tourism Companies (Analytical Study- Tourism Sector- Jordan). Business and Economic Research. Vol. 4, No. 2. 251 – 264.
Al-Taani, K. (2013). The Relationship between Capital Structure and Firm Performance: Evidence from Jordan. Journal of Finance and Accounting, 1 (3), 41- 45.
Al-Tally, H.A. (2014). An Investigation of the Effects of Financial Leverage on Firm Performance in Saudi Arabia‟s Public Listed Companies (Doctoral Thesis, Victoria Graduate School of Business, College of Business, Victoria University, Melbourne, Australia). Available from Vuir.vu.au/24843/1/Hassan%20Ahmed%20Al.Tally.
Araduman, H.A; Akbas, H.E; Caliskan, A.O and Durers (2011). The relationship between working capital management and profitability: Evidence from an emerging market International Research Journal of Finance and Economics 62: 61 – 67.
Arowoshegbe, A. O., & Emeni, F.K. (2014). Shareholders‟ Wealth and Debt –Equity Mix of QuotedCompanies in Nigeria. International Journal of Financial Research, 5 (1), 107- 113
Babbie, Wagner & Zaino, (2015). Adventures in Social Research. 9th edition. SAGE Publications, Inc., California.
Banchuenvijit, W. (2011). Determinants of Capital Structure of Listed Companies in Thailand. University of the Thai Chamber of Commerce
Bancel, F., & Mittoo, U. R. (2004). Why do European firms issue convertible debt? European Financial Management, 10, 339 – 374.
Boachie, R. Boachie, R. Ezidisi, E. Nyanese, E. and Gyabeng, S. (2013). The Impact of Leverage On Firms Profitability; Evidence from Quoted Banks on the Ghana Stock Exchange. Christian Service University College.
Brealey, R.A., & Myers, S.C. (1991). Principles of Corporate Finance. New York: Mc Graw- Hill
Brooks, I. Weatherston, J and Wilkinson, et al. (2009). Globalization, Challenges and Changes. The International Business Environment 307-336
Bulan, LT & Yan, Z 2009, Tests of the pecking order theory and the firm life cycle, SocialScience Research Network, viewed 10 August 2010, http://ssrn.com/abstract=1347430
Chen, J. J. (2004), “Determinants of capital structure of Chinese-listed companies”.Journal of Business Research 57, 1341-1351.
Chinaemerem, O.C., & Anthony, O. (2012). Impact of Capital Structure on the Financial Performance of Nigerian Firms. Arabian Journal of Business and Management Review (OMAN Chapter), 1 (12), 43- 61.
Dalbor, M. C., & Upneja, A. (2002). Factors affecting the long-term debt decision of restaurant firms. Journal of Hospitality & Tourism Research, 26(4), 422-432.
Damouri, D; Khanagha, J.B and Kaffash, M (2013). The relationship between changes in the financial leverage and the values of the Tehran listed firms.
© Chesang & Ayuma
Licensed under Creative Common Page 488
Deloof, M (2003). Does working Capital Management affect Profitability of Belgian firms? Journal of Business Finance and Accountancy 30(3) and (4).
Ebaid, E.I. (2009). The Impact of Capital Structure Choice on Firm Performance: Empirical Evidence from Egypt. The Journal of Risk Finance, 10 (5), 477- 487.
Ekwe, M.C and Duru, A.N (2012). Liquidity Management and Corporate profitability in Nigeria ESUT Journal of Accountancy 3(1): 22 – 28
Eljelly,A.M.A. (2004),"Liquidity - profitability tradeoff: an empirical investigation in an emerging market",International Journal of Commerce and Management, Vol. 14 No. 2, pp. 48 – 61.
Emekekwue, P.E (2008). Corporate Financial Management. 5th Revised ed; Kinshasha: African Bureau of Educational Sciences.
Enekwe, C. Agu, C. and Eziedo, K. (2014). The Effect of Financial Leverage on Financial Performance: Evidence of Quoted Pharmaceutical Companies in Nigeria. IOSR Journal of Economics and Finance (IOSR-JEF). Volume 5, Issue 3. pp 17-25
Enekwe, C.I (2012). Financial ratio Analysis as a planning tool for corporate profitability: A study of selected quoted pharmaceutical companies in Nigeria Unpublished M.Sc dissertation Department of Accountancy ESUT Enugu.
Etyang, D. (2012). The Determinants of Capital Structure of Private Hospitals in Nairobi, Kenya. University of Nairobi.
Evans, D 1987, „The relationship between firm growth, size, and age: estimates for 100 manufacturing industries‟, The Journal of Industrial Economics, vol. 35, no. 4, pp. 567–581
Falope, O and Ajilore, O.T (2009). Working Capital management and corporate profitability: Evidence from panel data analysis of selected quoted firms in Nigeria Research Journal of Business Management 3(3): 73 – 84.
Fengju, X. Fard, R. Maher, L. Akhteghan, N. (2013). The relationship between financial leverage and profitability with an emphasis on income smoothing in Iran‟s capital market. European Online Journal of Natural and Social Sciences; vol.2, No. 3(s), pp. 156-164
Fraenkel, J. R., & Wallen, N. E. (2000). How to Design and Evaluate Research in Education: McGraw-Hill Higher Education.
Frank, M. Z., & Goyal, V. K. (2003). Testing the pecking order theory of capital structure. Journal of Financial Economics, 67, 217-248.
Gweji, M.O., & Karanja, J. (2014). Effect of Financial Leverage on Financial Performance of Deposit Taking Savings and Credit Co-operative in Kenya. International Journal of Academic Research in Accounting, Finance and Management Sciences, 4 (2), 180- 188.
Hassan, H, Khan, F.and Wazir, M. (2016). Impact of Debt on Profitability of Firms;Evidence from Non-Financial Sector of Pakistan. City University Research Journal Vol. 06 No. 01, pp 70-80
Hovakimian, A., Opler, T. and Titman, S. (2004).The Debt-Equity Choice. The Journal of
Financial and Quantitative Analysis, 36, (1): 1-24.
Innocent, E.C., Ikechukwu, A.C., & Nnagbogu, E.K. (2014). The Effect of Financial Leverage On Financial Performance: Evidence of Quoted Pharmaceutical Companies in Nigeria. IOSR Journal of Economics and Finance, 5 (3), 17- 25.
Ishuza, E. (2015). The Effect of Financial Leverage on Commercial Banks‟ Profitability in Tanzania.Open University of Tanzania.
Jang, S., & Tang, C.-H. (2009). Simultaneous impacts of international diversification and financial leverage of profitability. Journal of Hospitality & Tourism Research, 33(3), 347-368.
Jensen, M. C., & Meckling, W. H. (1976). Theory of the firm: Managerial behavior, agency costs and ownership structure. Journal of Financial Economics, 3(4), 305-360.
International Journal of Economics, Commerce and Management, United Kingdom
Licensed under Creative Common Page 489
Kale, A. (2014). The Impact of Financial Leverage On Firm Performance: The Case of Non-Financial Firms in Kenya. University of Nairobi
Kaumbuthu,A.J. (2011) The relationship between capital structure and financial performance: a study of firms listed under industrial and allied sector at the NSE,(MBA Dissertation, university of Nairobi, 2011).Retrieved from http://erepository.uonbi.ac.ke.
Kayo, E. K. and H. Kimura (2011). "Hierarchical Determinants of Capital Structure." Journal of Banking & Finance 35(2): 358-371.
Kholdy, S &Sohrabian, A 2001, „Internal finance and corporate investment‟, The Financial Review, vol. 36, no. 2, pp. 97–114.
Koech, S. K., 2013. The Effect of Capital Structure on Profitability of Financial Firms Listed at Nairobi Stock Exchange, Nairobi: Kenyatta University.
Kombo D. K Tromp L.A (2006); Proposal and Thesis Writing an Introduction. Nairobi – Pauline, Publication Africa.
Lazaridis, I and Tryfonidis, D (2006). Relationship between working capital management and profitability of listed companies in the Athens Stock Exchange Journal of Financial Management and Analysis 19(5): 26 – 35.
Luchinga, L. (2014). The Effect of Working Capital Management on the Profitability of Agricultural Firms Listed in Nairobi Securities Exchange. University of Nairobi.
Maina, L., & Kondongo, O. (2013). Capital Structure and Financial Performance in Kenya: Evidence from Firms Listed at the Nairobi Securities Exchange. Paper Presented at the Jomo Kenyatta University of Science & Technology Research Conference. Kenya.
Maroa, J. and Kioko, C. (2016).Determinants of Profitability ofAgricultural Firms Listed at theNairobi Securities Exchange, Kenya.International Journal of Economics, Commerce and ManagementVol. IV, Issue 9, 225 - 235
Maroko, P.M. (2014). Influence of Capital Structure on Organizational Financial Performance.International Scientific Research Journal in Business and Management, 1(1), 25- 36.
Modigliani, F., & Miller, M. (1963). Corporate Income Taxes and the Cost of Capital: A Correction. American Economic Review, 53, 443- 453.
Modigliani, F., & Miller, M. H. (1958). The cost of capital, corporate finance, and the theory of investment. American Economic Review, 48(3), 261-297.
Mogaka Makori Ambrose Jagongo (2013). Working Capital Management and Firm Profitability: Empirical Evidence from Manufacturing and Construction Firms Listed on Nairobi Securities Exchange, Kenya
Moses O.G, Edna M.M and Newton C.L (2013), Determinant of Leverage of Savings andCredit Co-Operatives in Kenya.International Journal of Business and Commerce 2 (10) 58 – 65
Mohammed, D. (2010). Capital Structure and Business Risk in Nigeria: Evidence from a Panel Data Analysis (Unpublished Doctoral Thesis), Salford Business School (SBC) Research: The University of Salford, Greater Manchester, UK.
Mugenda, O.M, & Mugenda A.G, (2003). Research Methods: Quantitative and Qualitative Approaches. Nairobi, ACT Press.
Mule, K. (2015). Financial leverage and performance of listed firms in a frontier market: panel evidence from Kenya. European Scientific Journal. vol.11, No.7, 534 -550
Mwangi, L.W., Makau, M.S., & Kosimbei, G. (2014). Relationship between Capital Structures and Performance of Non-Financial Companies Listed in Nairobi Securities Exchange, Kenya. Global Journal of Contemporary Research in Accounting, Auditing and Business Ethics (GJCRA), 1 (2), 72- 90.
Myers, S. C. (1984). The capital structure puzzle. The Journal of Finance, 39(3), 575- 592.
Myers, S. C. (2001). Capital Structure. Journal of Economic Perspectives, 15 (2), 81- 102.
© Chesang & Ayuma
Licensed under Creative Common Page 490
Myers, S.C. and Majluf, N.S., (2004). Corporate financing and investment decisions when firms have information that investors do not have‟, Journal of Financial Economics, 13(7): 187-221.Nadeem A.S and Zongjun W. (2011), Determinant of Capital Structure, an empiricalstudy of firms in manufacturing industry of Pakistan, A Journal of Managerial Finance 37 (2) 117-133
Nairobi Stock Exchange (2014). Histofrary of NSE. Retrieved on 20th July, 2016. Available at https://www.nse.co.ke/nse/history-of-nse.html
Nawaz, A. Salman, A. and Shamsi, A. (2015). Impact of Financial Leverage on Firms‟ Profitability: An Investigation from Cement Sector of Pakistan. Research Journal of Finance and Accounting, Vol. 6, No. 7
Nduati, M. (2010). The Relationship between Leverage and Financial Performance of Companies Quoted at the Nairobi Stock Exchange, Unpublished MBA Project,University of Nairobi
Njagi, C. (2013). The Relationship Between Capital Structure and Financial Performance of Agricultural Firms Listed at Nairobi Securities Exchange. University of Nairobi.
Nuri, J., & Archer, S. (2001). Target adjustment model against pecking order model of capital structure. Paper presented at the European Financial Management Association Annual Meeting.
Nwude, C (2003). Basic Principles of Financial Management. Enugu: Chuke Nwabude Nigeria
Nyaboga E.K. (2008). Relationship between Capital Structure and Agency Cost, unpublished MBA project, University of Nairobi
Ogebe, P., Ogebe, J., & Alewi, K. (2013). The Impact of Capital Structure on Firms‟ Performance in Nigeria. Munich Personal RePEc Archive (MPRA). Retrieved from http://mpra.ub.unimuenchen.de/46173/MPRA Paper No. 46173.
Ogula, P. A. (2005). Research Methods. Nairobi: Catholic University of Eastern AfricaPublications.
Onaolapo, A.A., & Kajola, S.O. (2010). Capital Structure and Firm Performance: Evidence from Nigeria. Journal of Economics, Finance and Administrative Sciences, 25, 70- 82.
Osman, D & Mohammed, E 2010, „Dividend policy in Saudi Arabia‟, International Journalof Business and Finance Research, vol. 4, no. 1, pp. 99–113.
Padron, Y.G., Apolinario, M.C., & Santana, O. (2005). Determinant factors ofleverage: An empirical analysis of Spanish corporations.Journal of Risk Management, 6, 60-68.
Pandey, I. M. (2011). Financial Management (10th ed). New Delhi: Vikas Publishing House Pvt Ltd
Phillips, P. A., & Sipahioglu, M. A. (2004). Performance implication of capital structure: Evidence from quoted UK organizations with hotel interests. The Service Industries Journal, 24(5), 31-51.
Pouraghajan, A., & Bagheri, M. (2012). The Relationship between capital structure andfirm performance evaluation measures: Evidence from the Tehran StockExchange, International Journal of Business and Commerce, 1(9): 166-181.
Qureshi, M.A., Imdadullah, M., Ahsan, T. (2012). What determines leverage in Pakistan? A panel data analysis. African Journal of Business Management, 6, 3, 978-985.
Srivastava, N. (2014). Determinants of leverage of Indian companies: An empirical analysis (A study of Cement Industry in India). Merit Research Journal of Art, Social Science and Humanities. Vol. 2(2) pp. 021-024.
Suhaila, M. (2014). The Effect of Liquidity and Leverage on Financial Performance of Commercial State Corporations in the Tourism Industry in Kenya. University of Nairobi.
Taani, K. (2012). Impact of working capital management policy and financial leverage on financial performance: Evidence from Amman Stock Exchange listed companies International Journal of management sciences and Business Research 1 (8): 10 – 17
Tang, C.-H. H., & Jang, S. S. (2007). Revisit to the determinants of capital structure: A comparison between lodging firms and software firms. Hospitality Management, 26, 175-87.
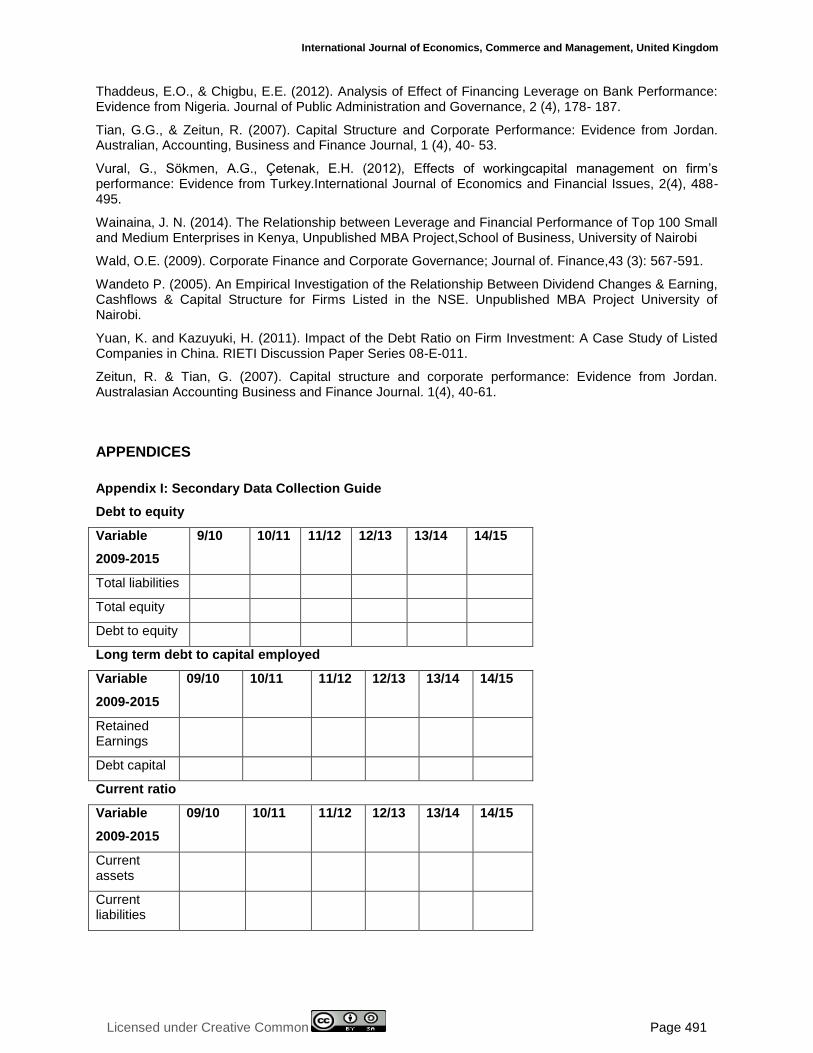
International Journal of Economics, Commerce and Management, United Kingdom
Licensed under Creative Common Page 491
Thaddeus, E.O., & Chigbu, E.E. (2012). Analysis of Effect of Financing Leverage on Bank Performance: Evidence from Nigeria. Journal of Public Administration and Governance, 2 (4), 178- 187.
Tian, G.G., & Zeitun, R. (2007). Capital Structure and Corporate Performance: Evidence from Jordan. Australian, Accounting, Business and Finance Journal, 1 (4), 40- 53.
Vural, G., Sökmen, A.G., Çetenak, E.H. (2012), Effects of workingcapital management on firm‟s performance: Evidence from Turkey.International Journal of Economics and Financial Issues, 2(4), 488-495.
Wainaina, J. N. (2014). The Relationship between Leverage and Financial Performance of Top 100 Small and Medium Enterprises in Kenya, Unpublished MBA Project,School of Business, University of Nairobi
Wald, O.E. (2009). Corporate Finance and Corporate Governance; Journal of. Finance,43 (3): 567-591.
Wandeto P. (2005). An Empirical Investigation of the Relationship Between Dividend Changes & Earning, Cashflows & Capital Structure for Firms Listed in the NSE. Unpublished MBA Project University of Nairobi.
Yuan, K. and Kazuyuki, H. (2011). Impact of the Debt Ratio on Firm Investment: A Case Study of Listed Companies in China. RIETI Discussion Paper Series 08-E-011.
Zeitun, R. & Tian, G. (2007). Capital structure and corporate performance: Evidence from Jordan. Australasian Accounting Business and Finance Journal. 1(4), 40-61.
APPENDICES
Appendix I: Secondary Data Collection Guide
Debt to equity
Variable
2009-2015
9/10 10/11 11/12 12/13 13/14 14/15
Total liabilities
Total equity
Debt to equity
Long term debt to capital employed
Variable
2009-2015
09/10 10/11 11/12 12/13 13/14 14/15
Retained Earnings
Debt capital
Current ratio
Variable
2009-2015
09/10 10/11 11/12 12/13 13/14 14/15
Current assets
Current liabilities
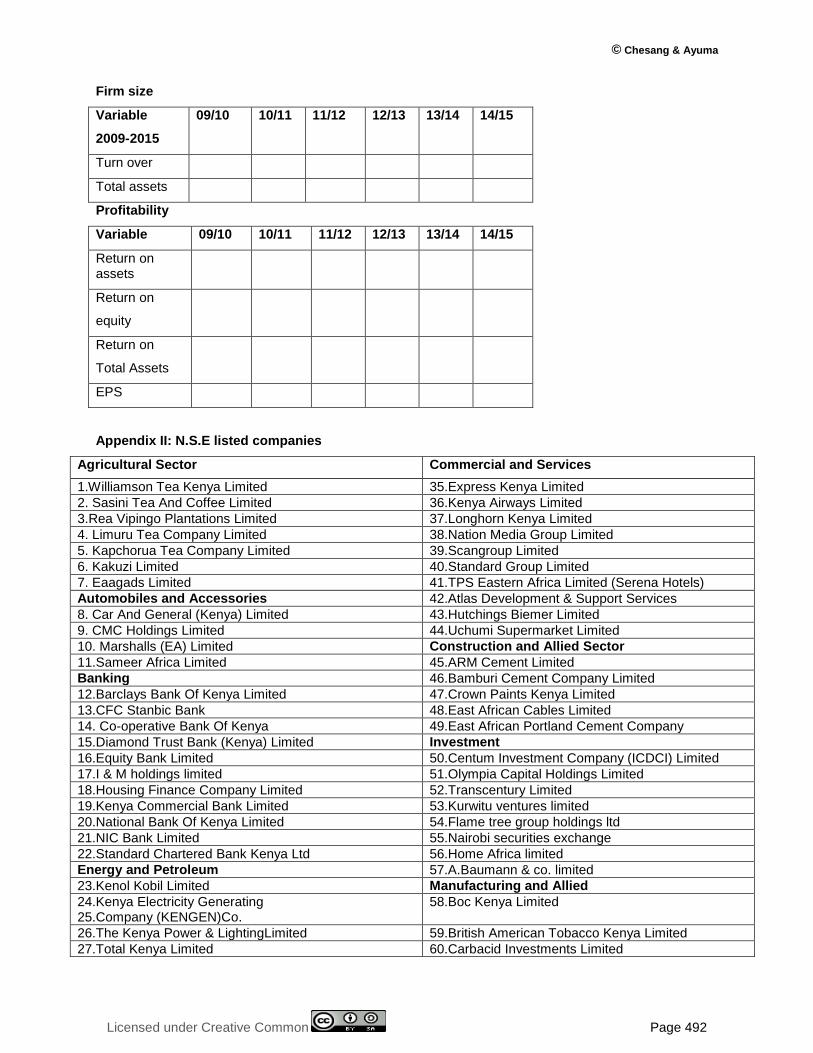
© Chesang & Ayuma
Licensed under Creative Common Page 492
Firm size
Variable
2009-2015
09/10 10/11 11/12 12/13 13/14 14/15
Turn over
Total assets
Profitability
Variable 09/10 10/11 11/12 12/13 13/14 14/15
Return on assets
Return on
equity
Return on
Total Assets
EPS
Appendix II: N.S.E listed companies
Agricultural Sector Commercial and Services
1.Williamson Tea Kenya Limited 35.Express Kenya Limited
2. Sasini Tea And Coffee Limited 36.Kenya Airways Limited
3.Rea Vipingo Plantations Limited 37.Longhorn Kenya Limited
4. Limuru Tea Company Limited 38.Nation Media Group Limited
5. Kapchorua Tea Company Limited 39.Scangroup Limited
6. Kakuzi Limited 40.Standard Group Limited
7. Eaagads Limited 41.TPS Eastern Africa Limited (Serena Hotels)
Automobiles and Accessories 42.Atlas Development & Support Services
8. Car And General (Kenya) Limited 43.Hutchings Biemer Limited
9. CMC Holdings Limited 44.Uchumi Supermarket Limited
10. Marshalls (EA) Limited Construction and Allied Sector
11.Sameer Africa Limited 45.ARM Cement Limited
Banking 46.Bamburi Cement Company Limited
12.Barclays Bank Of Kenya Limited 47.Crown Paints Kenya Limited
13.CFC Stanbic Bank 48.East African Cables Limited
14. Co-operative Bank Of Kenya 49.East African Portland Cement Company
15.Diamond Trust Bank (Kenya) Limited Investment
16.Equity Bank Limited 50.Centum Investment Company (ICDCI) Limited
17.I & M holdings limited 51.Olympia Capital Holdings Limited
18.Housing Finance Company Limited 52.Transcentury Limited
19.Kenya Commercial Bank Limited 53.Kurwitu ventures limited
20.National Bank Of Kenya Limited 54.Flame tree group holdings ltd
21.NIC Bank Limited 55.Nairobi securities exchange
22.Standard Chartered Bank Kenya Ltd 56.Home Africa limited
Energy and Petroleum 57.A.Baumann & co. limited
23.Kenol Kobil Limited Manufacturing and Allied
24.Kenya Electricity Generating 25.Company (KENGEN)Co.
58.Boc Kenya Limited
26.The Kenya Power & LightingLimited 59.British American Tobacco Kenya Limited
27.Total Kenya Limited 60.Carbacid Investments Limited
International Journal of Economics, Commerce and Management, United Kingdom
Licensed under Creative Common Page 493
28.Umeme Limited 61.East African Breweries Limited
Insurance 62.Eveready East Africa Limited
29.Britam Limited 63.Mumias Sugar Company Limited
30.CIC Insurance Limited 64.Unga Group Limited
31.Jubilee Holdings Limited Telecommunication And Technology
32.Kenya Reinsurance Corporation Limited 65.Accesskenya Group
33.Liberty Kenya Holdings Limited 66.Safaricom limited
34.Pan Africa Insurance Company Limited
Source: www.nse.co.ke -Nairobi Securities Exchange (NSE) (2014)
Appendix III: Measurement
Variable Formulae Interpretation
Profitability-Return on Assets
Profit b4 tax /total Assets Measures return on profit to shareholders
Debt to Equity Ratio Total debt /total equity measure how much debt is employed in relation to equity
Current Ratio Current Assets/Current Liabilities Measures liquidity position of the company
Total debt/Total Capital Employed ratio
Total long term Debts/Total Capital Employed
Measures how the firms employs long term debt in relation to total capital
Firm Size Capitalization Measures total capital
Appendix IV: Measurement
Variable Formulae Interpretation
Profitability-Return on Assets
Profit b4 tax /total Assets Measures return on profit to shareholders
Debt to Equity Ratio Total debt /total equity measure how much debt is employed in relation to equity
Current Ratio Current Assets/Current Liabilities Measures liquidity position of the company
Total debt/Total Capital Employed ratio
Total long term Debts/Total Capital Employed
Measures how the firms employs long term debt in relation to total capital
Firm Size Capitalization Measures total capital
Appendix V: List of Abbreviations and Acronyms
CDSC Central Depository and Settlement Corporation CMA Capital Market Authority DER Debt-Equity Ratio EPS Earning Per Share ICR Interest Coverage Ratio LTDTA Long Term Debt to Total Assets MBVR Market Value of Equity to Book Value of Equity NSE Nairobi Securities Market ROA Return on Assets ROE Return on Equity ROI Return on Investment RONA Return on Net Assets STDTA Short Term Debt to Total Assets TDE Total Debt Equity CCC Cash conversion cycle C.E.O Chief executive officer N.P.V Net present value EBIT Earnings before interest and tax FGLS Feasible generalized least square NSE Nigeria stock exchange