Embed Size (px)
Citation preview
South Dakota State University South Dakota State University
Open PRAIRIE: Open Public Research Access Institutional Open PRAIRIE: Open Public Research Access Institutional
Repository and Information Exchange Repository and Information Exchange
Electronic Theses and Dissertations
2015
Effect of Extrusion Pre-Treatment on Physical Properties and Effect of Extrusion Pre-Treatment on Physical Properties and
Sugar Recovery of Cold Press and Solvent Extracted Canola, Sugar Recovery of Cold Press and Solvent Extracted Canola,
Camelina and Carinata Meal Camelina and Carinata Meal
Jasmeen Kaur
Follow this and additional works at: https://openprairie.sdstate.edu/etd
Recommended Citation Recommended Citation Kaur, Jasmeen, "Effect of Extrusion Pre-Treatment on Physical Properties and Sugar Recovery of Cold Press and Solvent Extracted Canola, Camelina and Carinata Meal" (2015). Electronic Theses and Dissertations. 1829. https://openprairie.sdstate.edu/etd/1829
This Thesis - Open Access is brought to you for free and open access by Open PRAIRIE: Open Public Research Access Institutional Repository and Information Exchange. It has been accepted for inclusion in Electronic Theses and Dissertations by an authorized administrator of Open PRAIRIE: Open Public Research Access Institutional Repository and Information Exchange. For more information, please contact [email protected].
EFFECT OF EXTRUSION PRE-TREATMENT ON PHYSICAL PROPERTIES
AND SUGAR RECOVERY OF COLD PRESS AND SOLVENT EXTRACTED
CANOLA, CAMELINA AND CARINATA MEAL
BY
JASMEEN KAUR
A thesis submitted in partial fulfillment of the requirements for the
Master of Science
Major in Agriculture and Biosystems Engineering
South Dakota State University
2015
iii
ACKNOWLEDGEMENTS
I would like to thank all people who helped me in the research and thesis. The
journey as a graduate student at South Dakota State University would not have been
possible without these amazing people who helped me to get through during hard times.
Of foremost importance is to state that my time here and my successful graduate student
career would not have been possible without my advisor, Dr. K. Muthukumarappan. As a
result of his time and dedicated effort, I became a better researcher, student, and a
professional. He made himself available when I needed assistance in my research and
schooling, and guided my academic career here at the University. It was because of him
that I got an opportunity to enroll into this great institution and, as a result, was given an
opportunity to do research on this emerging and important field of study.
I would also like to thank Dr. Bishnu Karki, post doc research fellow in our lab
who helped me a lot in taking my research to next step. Her patience and advice in the
research work assisted me to complete my objectives. She was always happy to give a
career advice as well. And she is a great human being and an amazing friend to have
when you are away from home.
I want to take the time and thank my amazing friends, here in Brookings who
helped me a lot in my personal and professional life. They stood by me all the times.
Without them, I don’t think I would have been able to finish my degree. A great shout out
to Sheetal Dave, Joy Schumacher, Gungeet Kaur, Yamini Mohan and Priya Sravanan for
being there. I want to thank all my lab mates, Umesh Lohani, Sushil Singh, Vijay
Sundaram, Poonam Singha and Arash, for their moral support and whenever they have

iv
helped me in my research and Dr. Gary Anderson for always being a friendly face in the
department. As a result of them, my experience here became one that I will never forget.
Finally, none of this would have been at all possible without the love and support
of my family back home in India. My parents have always encouraged me to achieve my
goals. I want to thank them for believing in me. I want to thank my brother for always
listening to all my research problems.
v
CONTENTS
ABBREVIATIONS…………………………………………………………………….xiii
LIST OF FIGURES…………………………………………………………………….xiv
LIST OF TABLES……………………………………………………………………...xv
ABSTRACT…………………………………………………………………………....xvii
1. Introduction and Objectives……………………………………………………..1
1.1 Introduction……………………………………………………………….....1
1.2 Objectives……………………………………………………………………4
2. Literature review………………………………………………………………....6
2.1 Oilseed meals………………………………………………………………...6
2.1.1 Canola meal………………………………………………………...6
2.1.2 Camelina meal………………………………………………….......8
2.1.3 Carinata meal………………………………………………………10
2.2 Oil extraction methods………………………………………………………12
2.2.1 Cold press method…………………………………………………12
2.2.2 Accelerated solvent extraction…………………………………….13
2.2.3 Supercritical fluid extraction……………………………………….13
2.2.4 Gas supported screw pressing (GSSP)……………………………..14
2.2.5 Microwave extraction……………………………………………...15
2.3 Pre-treatment…………………………………………………………………15
vi
2.3.1 Extrusion pre-treatment……………………………………………15
2.3.2 Microwave pre-treatment………………………………………….17
2.3.3 Acid pre-treatment………………………………………………....18
2.3.4 Alkaline pre-treatment……………………………………………..19
2.4 Enzymatic hydrolysis………………………………………………………..20
2.5 Physical properties…………………………………………………………..21
2.5.1 Moisture content…………………………………………………..21
2.5.2 Water Absorption Index (WAI) and Water Solubility
Index (WSI)……………………………………………………..22
2.5.3 Water activity……………………………………………………...23
2.5.4 Thermal properties………………………………………………...23
2.5.5 Bulk density and True density…………………………………….24
2.5.6 Color………………………………………………………………25
3. Effect of extrusion pre-treatment on extrudate’s physical properties and
sugar recovery of cold press and accelerated solvent extracted canola meal…………...27
3.1 Abstract……………………………………………………………………..27
3.2 Introduction…………………………………………………………………27
3.2.1 Objectives…………………………………………………………30
vii
3.3 Material and Methods……………………………………………………..30
3.3.1 Sample preparation……………………………………………...30
3.3.2 Extrusion pre-treatment………………………………………....30
3.3.3 Grinding…………………………………………………………31
3.3.4 Moisture content………………………………………………....31
3.3.5 Physical properties…………………………………………….....31
3.3.5.1 Water activity………………………………………….31
3.3.5.2 Water Absorption Index (WAI) and Water
Solubility Index (WSI)…………………………………32
3.3.5.3 Bulk density and True density………………………….32
3.3.5.4 Thermal properties……………………………………...33
3.3.5.5 Color……………………………………………………33
3.3.6 Enzymatic hydrolysis…………………………………………….33
3.3.7 Extruder processing parameters optimization……………………34
3.3.8 Statistical Analysis……………………………………………….34
3.4 Result and Discussion……………………………………………………...35
3.4.1 Water Absorption Index (WAI) and Water Solubility
Index (WSI)…………………………………………………….35
3.4.2 Color……………………………………………………………...35
viii
3.4.3 MC, (db%) and Water activity…………………………………..36
3.4.4 Thermal properties……………………………………………….37
3.4.5 Bulk density and True density…………………………………...38
3.4.6 Interaction effects of independent variables on physical
properties of canola meal………………………………………………38
3.4.7 Interaction effects of independent variables on thermal
properties of canola meal……………………………………………….39
3.4.8 Enzyme dosage optimization……………………………………..39
3.4.9 Sugar recovery…………………………………………………....40
3.4.10 Interaction effects of independent variables on sugar
recovery of canola meal………………………………………………..41
3.4.11 Extruder processing parameters optimization…………………..41
3.5 Conclusions………………………………………………………………...42
4. Effect of extrusion pre-treatment on extrudate’s physical properties and
sugar recovery of cold press and accelerated solvent extracted camelina meal………..53
4.1 Abstract……………………………………………………………………..53
4.2 Introduction………………………………………………………………...53
4.2.1 Objectives………………………………………………………...56
4.3 Material and Methods………………………………………………………56
4.3.1 Sample preparation……………………………………………….56
ix
4.3.2 Extrusion pre-treatment…………………………………………56
4.3.3 Grinding…………………………………………………………57
4.3.4 Moisture content…………………………………………………57
4.3.5 Physical properties………………………………………………57
4.3.5.1 Water activity…………………………………………57
4.3.5.2 Water Absorption Index (WAI) and Water
Solubility Index (WSI)………………………………………..58
4.3.5.3 Bulk density and True density………………………...58
4.3.5.4 Thermal properties…………………………………….59
4.3.5.5 Color…………………………………………………..59
4.3.6 Enzymatic hydrolysis……………………………………………60
4.3.7 Extruder processing parameters optimization…………………...60
4.3.8 Statistical Analysis………………………………………………61
4.4 Result and Discussion……………………………………………………...61
4.4.1 Water Absorption Index (WAI) and Water Solubility
Index (WSI)…………………………………………………………....61
4.4.2 Color……………………………………………………………..62
4.4.3 MC, (db%) and Water activity…………………………………..63
4.4.4 Thermal properties……………………………………………....64
x
4.4.5 Bulk density and True density……………………………………65
4.4.6 Interaction effects of independent variables on
physical properties of camelina meal…………………………………...66
4.4.7 Interaction effects of independent variables on
thermal properties of camelina meal……………………………………66
4.4.8 Enzyme dosage optimization……………………………………..67
4.4.9 Sugar recovery……………………………………………………67
4.4.10 Interaction effects of independent variables on sugar
recovery of camelina meal………………………………………………68
4.4.11 Extruder processing parameters optimization……………………69
4.5 Conclusions………………………………………………………………….69
5. Effect of extrusion pre-treatment on extrudate’s physical properties and
sugar recovery of cold press and accelerated solvent extracted carinata meal………….80
5.1 Abstract………………………………………………………………………80
5.2 Introduction………………………………………………………………….81
5.2.1 Objectives…………………………………………………………83
5.3 Material and Methods……………………………………………………….83
5.3.1 Sample preparation………………………………………………..83
5.3.2 Extrusion pre-treatment……………………………………………83
5.3.3 Grinding……………………………………………………………84
xi
5.3.4 Moisture content………………………………………………….84
5.3.5 Physical properties………………………………………………..84
5.3.5.1 Water activity…………………………………………..84
5.3.5.2 Water Absorption Index (WAI) and Water
Solubility Index (WSI)………………………………………...85
5.3.5.3 Bulk density and True density…………………………85
5.3.5.4 Thermal properties…………………………………….86
5.3.5.5 Color…………………………………………………..86
5.3.6 Enzymatic hydrolysis……………………………………………86
5.3.7 Extruder processing parameters optimization…………………...87
5.3.8 Statistical Analysis………………………………………………88
5.4 Result and Discussion……………………………………………………..88
5.4.1 Water Absorption Index (WAI) and Water Solubility
Index (WSI)……………………………………………………………88
5.4.2 Color……………………………………………………………..89
5.4.3 MC, (db%) and Water activity…………………………………..90
5.4.4 Thermal properties……………………………………………….90
5.4.5 Bulk density and True density……………………………………91
5.4.6 Interaction effects of independent variables on
physical properties of carinata meal……………………………………92
xii
5.4.7 Interaction effects of independent variables on thermal
properties of carinata meal……………………………………………..92
5.4.8 Sugar recovery……………………………………………………93
5.4.9 Interaction effects of independent variables on sugar
recovery of carinata meal……………………………………………….94
5.4.10 Enzyme dosage optimization…………………………………….94
5.4.11 Extruder processing parameters optimization……………………95
5.5 Conclusions………………………………………………………………….95
6. Conclusions and Future Recommendations………………………………………….107
6.1 Conclusions…………………………………………………………………107
6.2 Future Recommendations…………………………………………………..108
7. References……………………………………………………………………………110
xiii
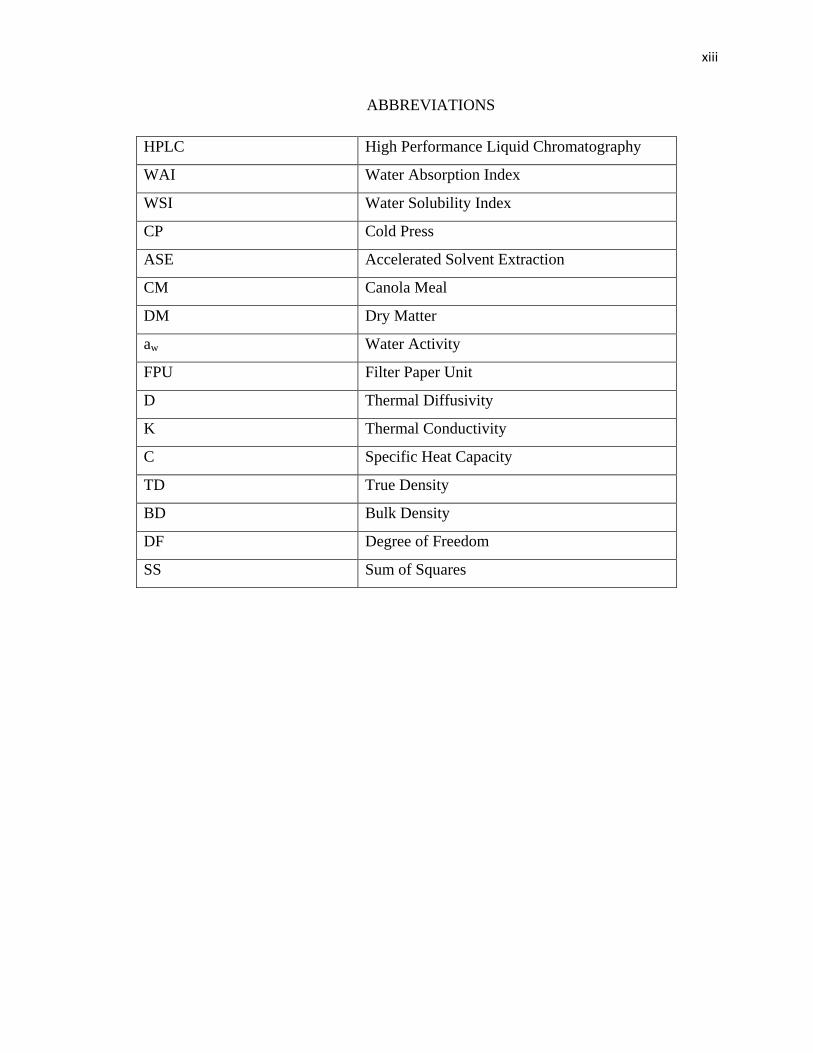
ABBREVIATIONS
HPLC High Performance Liquid Chromatography
WAI Water Absorption Index
WSI Water Solubility Index
CP Cold Press
ASE Accelerated Solvent Extraction
CM Canola Meal
DM Dry Matter
aw Water Activity
FPU Filter Paper Unit
D Thermal Diffusivity
K Thermal Conductivity
C Specific Heat Capacity
TD True Density
BD Bulk Density
DF Degree of Freedom
SS Sum of Squares
xiv
LIST OF FIGURES
Figure 3.1. Effect of extruder processing parameters on WAI of CP and ASE canola
meal extrudates………………………………………………………………...43
Figure 3.2 Effect of extruder processing parameters on WSI of CP and ASE canola
meal extrudates…………………………………………………………………44
Figure 3.3. Effect of extruder processing parameters on sugar recovery (glucose,
galactose and arabinose) of CP and ASE canola meal extrudates……......45
Figure 4.1. Effect of extruder processing parameters on WAI of CP and ASE camelina
meal extrudates…………………………………………………………………70
Figure 4.2 Effect of extruder processing parameters on WSI of CP and ASE camelina
meal extrudates…………………………………………………………………71
Figure 4.3. Effect of extruder processing parameters on sugar recovery (glucose,
galactose and arabinose) of CP and ASE camelina meal extrudates…………..72
Figure 5.1. Effect of extruder processing parameters on WAI of CP and ASE carinata
meal extrudates…………………………………………………………………97
Figure 5.2 Effect of extruder processing parameters on WSI of CP and ASE carinata
meal extrudates………………………………………………………………….98
Figure 5.3. Effect of extruder processing parameters on sugar recovery (glucose,
galactose and arabinose) of CP and ASE carinata meal extrudates…………….99
xv
LIST OF TABLES
Table 2.1 Typical chemical composition of canola meal (12% moisture basis)……….8
Table 2.2: The chemical composition of camelina meal……………………………….10
Table 2.3: Chemical composition of ASE carinata meal………………………………11
Table 3.1: Effect of extruder processing conditions on color (L, a and b) of CP and ASE
canola meal extrudates…………………………………………………………46
Table 3.2: Effect of extruder processing conditions on MC, (db%) and water activity of
CP and ASE canola meal extrudates…………………………………………..47
Table 3.3: Effect of extruder processing conditions on thermal properties (D, K and C) of
CP and ASE canola meal extrudates…………………………………………..48
Table 3.4: Effect of extruder processing conditions on true density (TD) and bulk density
(BD) of CP and ASE canola meal extrudates………………………………….49
Table 3.5: Interaction effects of independent variables on physical properties
(WAI, WSI, water activity, L value and bulk density) of canola meal………...50
Table 3.6: Interaction effects of independent variables on thermal properties (D and K)
of canola meal………………………………………………………………….51
Table 3.7: Interaction effects of independent variables on sugar recovery of canola
meal…………………………………………………………………………….52
Table 4.1: Effect of extruder processing conditions on color (L, a and b) of CP and ASE
camelina meal extrudates………………………………………………………73
Table 4.2: Effect of extruder processing conditions on MC, (db%) and water activity of
CP and ASE camelina meal extrudates…………………………………………74
Table 4.3: Effect of extruder processing conditions on thermal properties (D, K and C) of
CP and ASE camelina meal extrudates…………………………………………75
Table 4.4: Effect of extruder processing conditions on true density (TD) and bulk density
(BD) of CP and ASE camelina meal
extrudates………………………………………………………………………..76
xvi
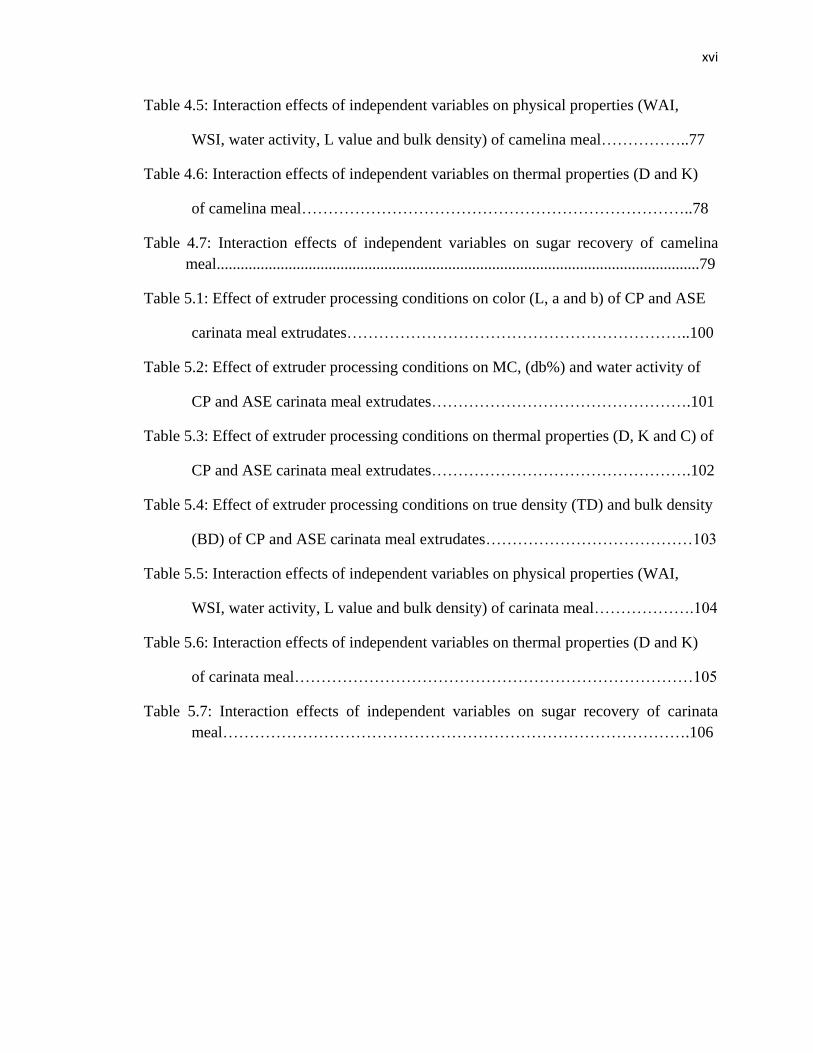
Table 4.5: Interaction effects of independent variables on physical properties (WAI,
WSI, water activity, L value and bulk density) of camelina meal……………..77
Table 4.6: Interaction effects of independent variables on thermal properties (D and K)
of camelina meal………………………………………………………………..78
Table 4.7: Interaction effects of independent variables on sugar recovery of camelina
meal.........................................................................................................................79
Table 5.1: Effect of extruder processing conditions on color (L, a and b) of CP and ASE
carinata meal extrudates………………………………………………………..100
Table 5.2: Effect of extruder processing conditions on MC, (db%) and water activity of
CP and ASE carinata meal extrudates………………………………………….101
Table 5.3: Effect of extruder processing conditions on thermal properties (D, K and C) of
CP and ASE carinata meal extrudates………………………………………….102
Table 5.4: Effect of extruder processing conditions on true density (TD) and bulk density
(BD) of CP and ASE carinata meal extrudates…………………………………103
Table 5.5: Interaction effects of independent variables on physical properties (WAI,
WSI, water activity, L value and bulk density) of carinata meal……………….104
Table 5.6: Interaction effects of independent variables on thermal properties (D and K)
of carinata meal…………………………………………………………………105
Table 5.7: Interaction effects of independent variables on sugar recovery of carinata
meal…………………………………………………………………………….106
xvii
ABSTRACT
EFFECT OF EXTRUSION PRE-TREATMENT ON PHYSICAL PROPERTIES AND
SUGAR RECOVERY OF COLD PRESS AND SOLVENT EXTRACTED CANOLA,
CAMELINA AND CARINATA MEAL
JASMEEN KAUR
2015
Canola/rapeseed meal (CM) ranks second behind soybeans in global production of
protein from oil cakes and meals. Commercial CM has been investigated as a feed
ingredient in diets of a number of fish species. Camelina (Camelina sativa) has been a
potential oilseed crop. The fat extracted meal contains over 40% protein. Camelina yields
an average of 420–640 L/ha, and the protein and fiber content in its meal byproduct is
comparable to that of soybean meal. Brassica carinata possesses many positive
agronomic traits, and it can grow well in hot, dry, and semiarid climates and seed oil
from these species and its byproduct (carinata meal) may have potential applications in
the food, biofuel, and feed industries. The sugars present in the canola, camelina and
carinata meal can be used as a source for production of feed for the fish: the sugars can be
converted into a high protein diet with the help of fermentation. Due to comparatively
low sugar content in oilseed meals, this issue needed to be resolved.
To solve this issue, the canola, camelina and carinata meal needs to increase their sugar
level by using a pre-treatment. First of all, two different types of meals were prepared by
using cold press oil extractor and accelerated solvent extractor. After extraction using two
different methods, pre-treatment was done. Extrusion was used as a pre-treatment. The
xviii
canola, camelina and carinata meal were extruded using a total of 9 combinations of
temperature and screw speed. Three different temperature including 80°C, 130°C and
180°C and screw speed of 50, 100 and 150 rpm were used. In order to measure the
increased sugar recovery, enzymatic hydrolysis was done followed by the HPLC
analysis. The enzymes were added at 50, 60, 70, 80 and 90 FPU/g cellulose in order to
optimize the enzyme dosage. The sugar recovery was measured in terms of glucose,
galactose and arabinose recovery. The extruder processing conditions were optimized
based on the amount of sugar recovery. Enzyme dosage and extruder processing
conditions played a major role in increasing the sugar recovery of canola, camelina and
carinata meal. Higher sugar recovery was recorded for accelerated solvent extracted
(ASE) canola meal versus to the cold press (CP) extracted canola meal. A significant
increase in ASE galactose recovery and glucose recovery (CP&ASE) was observed due
to extrusion temperature of camelina meal. It was observed that during extrusion, for
camelina meal, temperature had a greater effect than screw speed. Higher sugar recovery
was recorded for CP carinata meal than ASE carinata meal.
Physical properties can show characteristics of the transition and storage of these plant
materials (canola, camelina and carinata meal). These physical properties, include
moisture content, bulk density, true density, water absorption index (WAI), water
solubility index (WSI), water activity and color and were measured. Thermal properties
like thermal conductivity, thermal diffusivity and specific heat capacity were also
measured. Extruder temperature had a significant effect (p<0.05) on WAI, water activity,
color and bulk density of ASE canola meal. There was a significant increase (p<0.05) in
WSI and thermal properties of CP camelina meal and WAI of ASE camelina meal.
xix
Extrusion caused a significant (p<0.05) decrease in the values of WAI of CP camelina
meal and bulk density, water activity and L (color) of ASE camelina meal. It was
observed that during extrusion, temperature had a greater effect than screw speed.
Extruder temperature had a significant effect (p<0.05) on WAI, WSI, water activity, color
and moisture content at dry basis (MCdb) of CP and ASE carinata meal extrudates. No
significant effect (p>0.05) of extruder temperature and screw speed was observed on bulk
density and true density of CP and ASE carinata meal extrudates.
Overall, extruder temperature had a more significant effect versus screw speed on sugar
recovery, physical properties and thermal properties of canola, camelina and carinata
meal. Extrusion and enzyme dosage played a significant role in increasing the total %
sugar recovery of canola, camelina and carinata meals.
1
CHAPTER 1
INTRODUCTION AND OBJECTIVES
1.1 Introduction
Historically fish meal has been the most important protein source in commercial feeds for
fish. Protein quality, component concentration and palatability are some of the factors
that make it important. Currently worldwide production of fish meal is approximately 6–
7 million tons annually. The level of production is expected to remain stable over the next
10 years (New and Wijkstrom, 2002) and rapid expansion of aquaculture during this
period will require the replacement of fish meal in aquafeeds with plant-based protein
sources. There are certain problems of replacing fish meal with plant proteins, as the
quality and concentration of proteins from plant sources is generally inferior to fish meal
because the palatability of most plant proteins fish meal is low. However, the low cost of
plant proteins and availability of plant proteins in abundant may allow processing of plant
proteins to improve their nutritive value in fish.
The plant proteins must be compared to the fish meal in terms of protein quality for fish
growth performance and health, and cost. Fish meal is produced either from fish that are
harvested specifically for production of fish meal or from byproducts of fish destined for
human consumption. Another important concern for replacing fish meal with plant based
proteins is contamination of fish meal and oil with organochlorine compounds. Hites et
al. (2004) reported that the concentration of organochlorine contaminants was higher in
farmed salmon versus wild salmon. It was also reported that the high concentrations of
organochlorine compounds in aquafeeds based primarily on fish meal and oil was the
source of contamination. Replacement of fish meal and oil in aquafeeds might therefore
2
decrease the level of organochlorine compounds in farmed salmon and increase consumer
acceptance. Thus increasing cost and potential contamination with organochlorines give a
strong reason for the replacement of fish meal in aquaculture feeds.
After soyabean, canola/rapeseed meal (CM) ranks second in global production of protein
from oil cakes and meals. The cost of CM protein is approximately half that of fish meal
per unit protein basis (Sarwar et al., 1984). Investigations has been done for CM as a feed
ingredient in diets of a number of fish species (Hilton and Slinger, 1986; Leatherland and
Hilton, 1988; Satoh et al., 1998; Mwachireya et al., 1999; Soares et al., 2001). Lower
growth performance of Chinook salmon was observed when fish meal was replaced by
commercial CM (Satoh et al., 1998) but, the growth was not different than those fed with
fish meal diet when the CM was extruded at 90 or 150 ◦C.
Camelina [Camelina sativa (L.) Crantz], also known as false flax, is a spring annual
broadleaf oilseed herb of the Brassicaceae family that grows well in temperate climates.
Several positive agronomic attributes were observed for camelina as compared to other
oilseed crops. Some of them were low agricultural inputs, cold-weather tolerance, short
growing season (85–100 days), compatibility with existing farm equipment, and grows
well in semiarid regions and in low-fertility or saline soils. These qualities are unusual for
an oilseed crop (Putnam et al., 1993; Retka-Schill, 2008b; Sawyer, 2008). Moreover,
camelina, unlike soybean, can grow easily in cold regions and is nicely adapted to the
more northerly regions of North America, Europe, and Asia. The seeds of camelina
contain 28–40 wt.% of vegetable oil (Putnam et al., 1993; Budin et al., 1995), which is
higher than what is found in soybeans (18–22 wt.%). Camelina has already been used for
other purposes such as culinary oil, cosmetics, and animal feed (Sawyer, 2008).
3
Brassica carinata is also known as Ethiopian mustard and originated from a cross
between B. nigra and B. oleracea. The plant has been widely used for oil extraction and
is of great importance, economically and nutritionally. The defatted meal that is left after
oil extraction is rich in protein. Because of some anti-nutritional components such as
glucosinolates and phytates, and a high cellulose content, the defatted meal presents some
problems for human consumption. For this reason, the Brassica defatted meal is only
used for animal feeding and as an organic fertilizer (Duncan, 1991; Pedroche et al 2004).
To remove the oil from the oilseeds, there are different types of oil extraction methods.
The cold-press procedure involves neither heat nor chemical treatments. Natural and safe
food products can be obtained using cold press extraction method (Parker et al., 2003).
Accelerated solvent extraction (ASE) technique uses pressure and temperature to extract
solid samples (Ezzell, et al., 1995). The organic solvents that are used during extraction
process works at temperatures above the normal boiling-point.
To utilize the oilseed meals more widely, it is important to consider the shelf life of these
meals. The low bulk density is the key parameter that leads to the higher cost of handling
and storage (Sokhansanj et al. 2006). Physical properties describe the basic
characteristics of meals, which are indispensable for the handling and storage. Safe
storage is important in supplying oilseed meals to conversion facilities. The surrounding
conditions such as environment temperature and the relative humidity can influence the
storage life of oilseed meals as they are directly related to the moisture content via
moisture adsorption (Jamali, 2006). The storage life of biomass depends on the
relationship of the moisture content of the oilseed meals, the temperature and relative
4
humidity of the environment and these factors can help to predict the stability of the
oilseed meals and help to prolong the storage life of biomass.
Feed rate, feed moisture, screw speed and barrel temperature effect the various extrudate
properties in significant way. Bulk density has significant effect on material handling and
storage aspects and it depends on certain factors like moisture content, particle size,
shape. So, it is necessary to find these characterizations which are important for the
handling and storage of the oilseed meals and may lead to the possibility of cost
reduction in aquaculture production and further develop the feed industry. As a result,
there is a great need for this study.
1.2 Objectives:
The primary objective of this study will be to understand the influence of plant protein
and extruder parameters on the sugar recovery from different biomasses (canola,
camelina and carinata meal). Most of the literature was reported on the use of protein
content present in the oilseed meals. No systematic carbohydrate hydrolysis of oilseed
meals and pretreatment to increase the sugar recovery of oilseed meals was found in the
literature. The objectives of the study were:
1. Understand the effect of extruder (barrel temperature and screw speed) and
varying the enzyme dosage for maximizing sugar recovery
2. Determine the physical properties of cold press extracted and solvent extracted
oilseed meals (canola, camelina and carinata meal)
3. Optimize the enzyme dosage for maximum sugar recovery from different oilseed
meals

5
4. Optimize the extruder parameters to predict the maximum sugar recovery from
different oilseed meals
5. To compare the effect of oil extraction methods on sugar recovery from different
oilseed meals
6. To compare the physical properties of cold press extracted meals and solvent
extracted meals
6
CHAPTER 2
LITERATURE REVIEW
2.1 Oilseed meals
The protein from vegetable origin can be an alternative to the animal protein for food and
cosmetics applications, due to the availability, low cost, renewability of raw material and
widespread and variety of sources (especially legumes, cereals and oilseeds). Some of the
oilseed meals like soybeans, rapeseed, cottonseed, sunflower seed and peanut are the
most abundant protein meal and it represents a 69%, 12.4%, 6.9%, 5.3% and 2.8% of
world protein meal production (Ash & Dohlman, 2006). Different authors have studied
the functionality of oilseed proteins like protein isolates in relation to food applications,
the emphasis of their work being focused on different industrial crops (cereals, oilseeds,
legume seeds) (Gueguen, Sanchez- Vioque, & Malabat, 1999; Lampart-Szczapa, 2001),
soybean (Barraquio & Van de Voort, 1988), sunflower (Sosulski & Fleming, 1977),
peanut (El-Zalaki et al., 1995), and legumes (Braudo et al., 2001; Singh, 2001).
2.1.1 Canola meal
Canola is the name given to the species produced by Brassica napus and Brassica
campestris species and they are low in glucosinolates and erucic acid. Canola ranks
second to soyabean for global production of protein (Higgs et al., 1996). Further, the
chemical composition of the meal and other protein products was consistent and the cost
of the meal is more economical on a per kilogram protein basis (Higgs et al., 1996).
7
Because of good balanced ratio of protein and amino acid, canola meal is considered as
an important fodder crop (Uruakpa and Arntfield 2005a; Canola Council of Canada
2009). Canola protein concentrate (Anjou and Fecske, 1974) and rapeseed protein isolate
(Gillberg and Tornell, 1977) may be useful for human consumption. Some previous
studies have focused on utilisation of canola protein for production of bioactive peptides
(BAPs) with the aims of improving human health or to supply nutritional benefits
(Cumby, Zhong, Naczk, & Shahidi, 2008; Marczak et al., 2003).
Earlier studies with Brassica rapa (campestris) canola have determined that among
different varieties for seeds (black and yellow), they differed significantly in their
chemical composition such as oil, protein, and fiber contents, with yellow seeds
containing more oil and protein and less fiber (Bell and Shires 1982). High amount of
fiber is found in the canola meal due to the high content (30 %) of hull (Bell and Shires,
1982). The chemical composition of canola meal derived from black seeded canola
(%DM) was: Crude protein – 43.8, Fat – 1.8, Non starch polysaccharide – 20.2, Dietary
fiber – 30.1, Ash – 7.3 (Slominski et al., 2012).
The annual production of canola has been increasing and is measured as 15 million
tonnes in 2015 (Canola Council of Canada 2009). As a result of increased oil extraction,
more meal will be produced as the demand for canola meal is increasing as well.
According to Australian Oilseeds Federation (2009), Australian oilseeds (canola) industry
has grown in an excellent way. This leads to understand canola proteins in a better way
which is the major constituents in the meal. The canola meal can be used as a substitution
for fish meal because fish meal is very expensive and canola meal can prove as more
economical for the industries.
8
Various studies has been done for the enzymatic hydrolysis of protein content of canola,
in this study enzymatic hydrolysis of canola meal were done after pre-treatment with an
objective to increase the sugar recovery of the canola meal and how the sugar recovery
differs with different oil extraction methods i.e. cold press extraction and accelerated
solvent extraction.
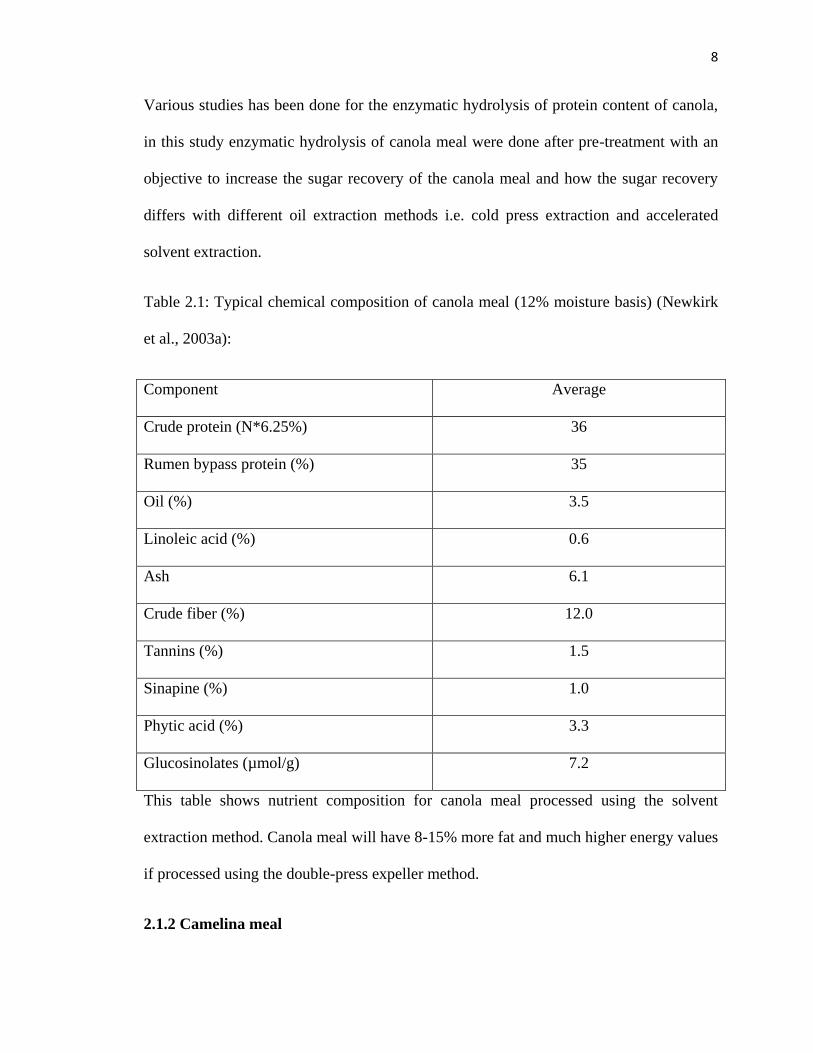
Table 2.1: Typical chemical composition of canola meal (12% moisture basis) (Newkirk
et al., 2003a):
Component Average
Crude protein (N*6.25%) 36
Rumen bypass protein (%) 35
Oil (%) 3.5
Linoleic acid (%) 0.6
Ash 6.1
Crude fiber (%) 12.0
Tannins (%) 1.5
Sinapine (%) 1.0
Phytic acid (%) 3.3
Glucosinolates (µmol/g) 7.2
This table shows nutrient composition for canola meal processed using the solvent
extraction method. Canola meal will have 8-15% more fat and much higher energy values
if processed using the double-press expeller method.
2.1.2 Camelina meal
9
Camelina, popularly known as false flax or gold of pleasure, belongs to the family
Brassicaceae and grows in Mediterranean to Central Asia and is very adaptable to
climate and soil types. Camelina is rich in linolenic acid and has a fatty acid profile very
much similar to flaxseed. The fatty acid camelina oil profile contains 20 to 40% C18:3,
10 to 20% C18:2, 12 to 25% C18:1, 13 to 21% C20:1, and between 2 and 5% C22:1.
Studies have shown that camelina could be used for applications other than food such as
skincare products, soaps and soft detergents, production of lipopeptides and
lipoaminoacids, and in paints (Bonjean and Le Goffic, 1999; Hurtaud and Payraud 2007).
The protein-rich camelina pressed cake is also a valuable livestockfeed. The chemical
composition of camelina meal is 10% oil, 13% fiber, 5% minerals, and 45% protein
(Bonjean and Le Goffic, 1999; Hurtaud and Payraud 2007).
Compared to other crops, camelina has more advantages as it is much less weather
dependent, has more consistent yields, and is cheaper to produce (Moloney et al., 1998).
Camelina seeds yields an average of 420–640 L/ha and the chemical composition like
protein and fiber in the meal byproduct can be compared to soybean meal (Retka-Schill,
2008b; Sawyer, 2008). The chemical composition of defatted camelina meal could be
used for different applications like food, feed, and agricultural applications (Gugel and
Falk, 2006; Zubr, 2010). Camelina seed meal contains chemical composition like 5–10%
residual fat (which contains fairly high levels of omega 3 fatty acids), high-quality
protein, and some potentially functional phytochemicals, which can be exploited to
develop new feed and food uses (Gugel and Falk, 2006; Zubr, 2010).
10
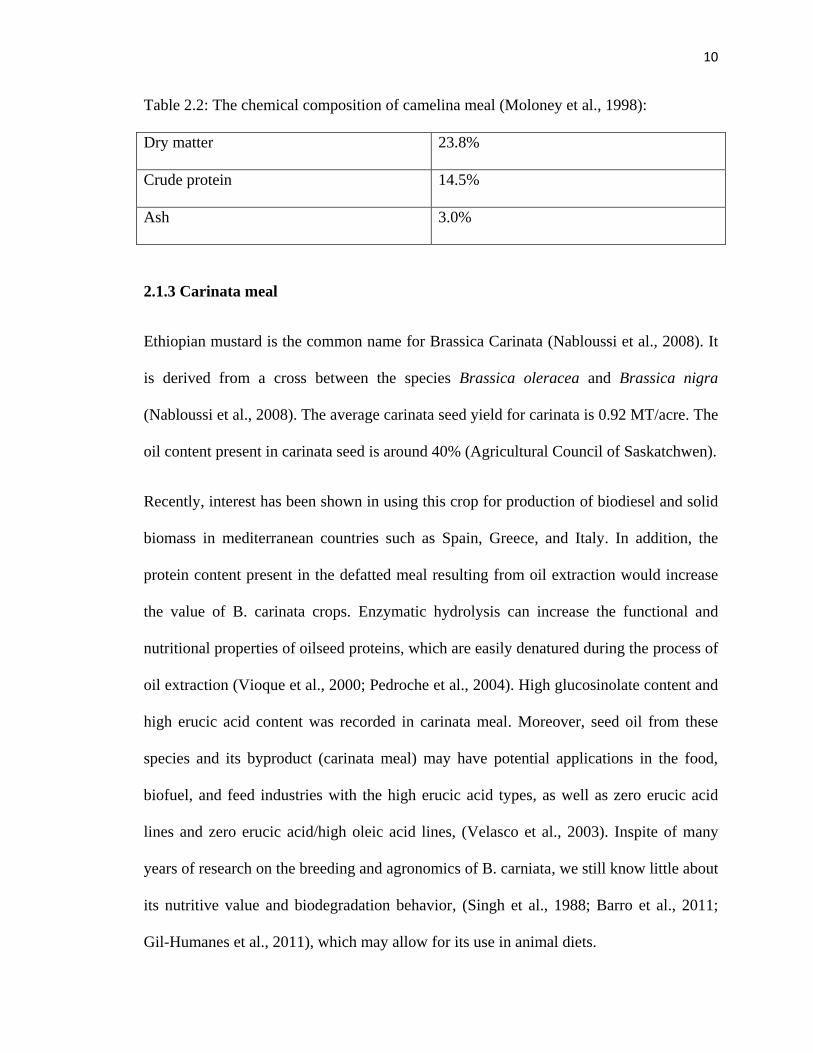
Table 2.2: The chemical composition of camelina meal (Moloney et al., 1998):
Dry matter 23.8%
Crude protein 14.5%
Ash 3.0%
2.1.3 Carinata meal
Ethiopian mustard is the common name for Brassica Carinata (Nabloussi et al., 2008). It
is derived from a cross between the species Brassica oleracea and Brassica nigra
(Nabloussi et al., 2008). The average carinata seed yield for carinata is 0.92 MT/acre. The
oil content present in carinata seed is around 40% (Agricultural Council of Saskatchwen).
Recently, interest has been shown in using this crop for production of biodiesel and solid
biomass in mediterranean countries such as Spain, Greece, and Italy. In addition, the
protein content present in the defatted meal resulting from oil extraction would increase
the value of B. carinata crops. Enzymatic hydrolysis can increase the functional and
nutritional properties of oilseed proteins, which are easily denatured during the process of
oil extraction (Vioque et al., 2000; Pedroche et al., 2004). High glucosinolate content and
high erucic acid content was recorded in carinata meal. Moreover, seed oil from these
species and its byproduct (carinata meal) may have potential applications in the food,
biofuel, and feed industries with the high erucic acid types, as well as zero erucic acid
lines and zero erucic acid/high oleic acid lines, (Velasco et al., 2003). Inspite of many
years of research on the breeding and agronomics of B. carniata, we still know little about
its nutritive value and biodegradation behavior, (Singh et al., 1988; Barro et al., 2011;
Gil-Humanes et al., 2011), which may allow for its use in animal diets.
11
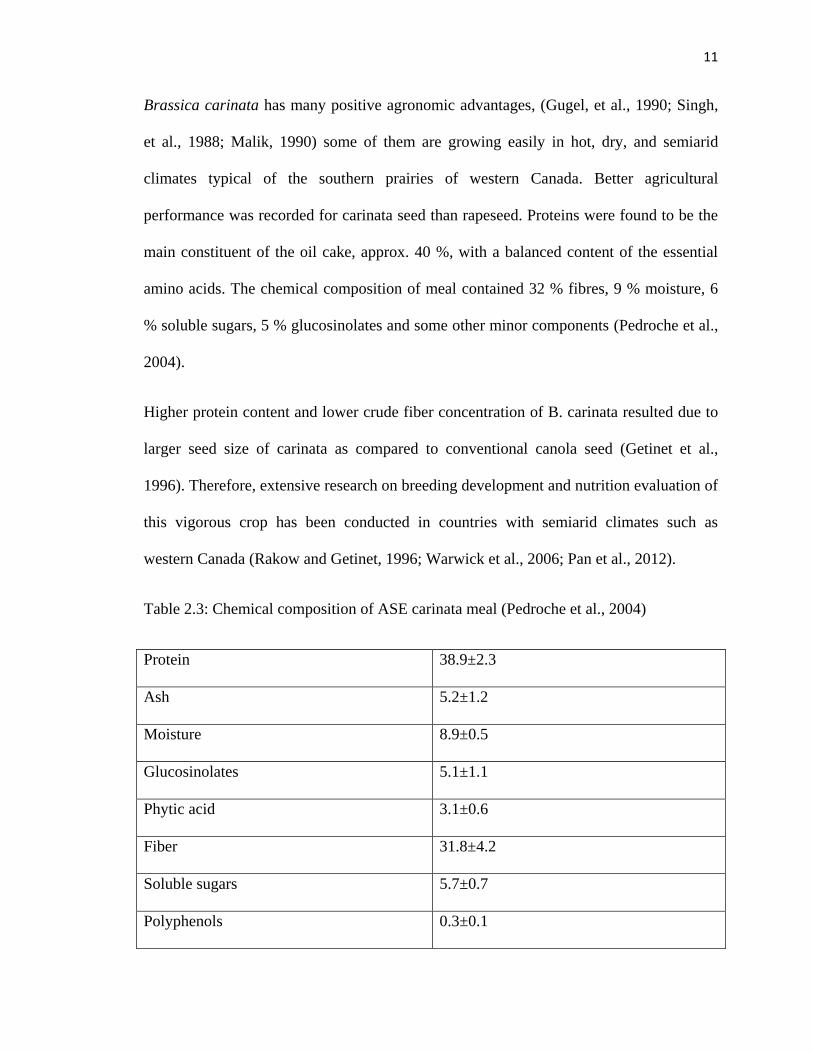
Brassica carinata has many positive agronomic advantages, (Gugel, et al., 1990; Singh,
et al., 1988; Malik, 1990) some of them are growing easily in hot, dry, and semiarid
climates typical of the southern prairies of western Canada. Better agricultural
performance was recorded for carinata seed than rapeseed. Proteins were found to be the
main constituent of the oil cake, approx. 40 %, with a balanced content of the essential
amino acids. The chemical composition of meal contained 32 % fibres, 9 % moisture, 6
% soluble sugars, 5 % glucosinolates and some other minor components (Pedroche et al.,
2004).
Higher protein content and lower crude fiber concentration of B. carinata resulted due to
larger seed size of carinata as compared to conventional canola seed (Getinet et al.,
1996). Therefore, extensive research on breeding development and nutrition evaluation of
this vigorous crop has been conducted in countries with semiarid climates such as
western Canada (Rakow and Getinet, 1996; Warwick et al., 2006; Pan et al., 2012).
Table 2.3: Chemical composition of ASE carinata meal (Pedroche et al., 2004)
Protein 38.9±2.3
Ash 5.2±1.2
Moisture 8.9±0.5
Glucosinolates 5.1±1.1
Phytic acid 3.1±0.6
Fiber 31.8±4.2
Soluble sugars 5.7±0.7
Polyphenols 0.3±0.1
12
2.2 Oil extraction methods:
Oil extraction was done to remove oil from canola, camelina and carinata seeds. The
meal obtained after extraction is rich in protein and the research was conducted with the
objective of replacing the fish meal, which is rich in protein as well by these oilseed
meals.
2.2.1 Cold press method
The cold-pressing procedure doesn’t involve any heat or chemical treatments and is
therefore popular among consumers for being safe and natural (Parker et al., 2003).
Therefore, cold-pressed seed oil may retain more phytochemicals including natural
antioxidants. Cold pressed oils could lead to better human health and prevention of
certain diseases.
Over the last few years, increased interest in cold-pressed plant oils has been observed as
these oils have better nutritive properties than those after refining. The advantages of cold
press method is that the process is simple, ecological and does not require much energy.
Low productivity and difficulties in obtaining a product of constant quality are some of
the disadvantage of this process (Rotkiewicz et al., 1999). Various factors that affect the
final chemical composition of plant oils are geographical location, species and processing
technique (Beardsell et al., 2002). Other compounds that are present in plant oils are
small amounts of free fatty acids, phenolic compounds, tocopherols, sterols, stanols,
phospholipids, waxes, squalene and other hydrocarbons (Lecker and Rodriguez-Estrada,
2000).
13
Cold-pressed oils may have the potential for applications in the promotion of health and
prevention of oxidative damages caused by radicals. Cold-pressed oils contain more polar
phenols, the concentration of which varies from 18 to 99ppm caffeic acid equivalents
(CAEs) (Koski et al., 2003).
2.2.2 Accelerated solvent extraction
Accelerated solvent extraction (ASE) technique uses pressure and temperature to extract
solid samples (Ezzell, et al., 1995). Extraction time and solvent consumption is greatly
reduced during the solvent extraction process. Automation or semi-automation can be
achieved to extract analytes from different matrices. Static or dynamic extractions can be
performed separately or in combination. The equipment is available commercially but the
cost might be high for most laboratories. The solvent temperature that are used during the
extraction process are above the normal boiling-point. The solvent is kept in the liquid
phase owing to high pressure temperatures much above the boiling-point. The elevated
temperature at which the extraction is conducted helps to solubilize the analyte. Due to
increased temperature, the bonds between the analyte and the matrix begin to weaken,
which further results in an increased extraction yield (Ezzell et al., 1996).
With ASE, a solid sample is enclosed in a sample cartridge that is filled with an
extraction fluid and the sample is extracted under elevated temperature (50-200 °C) and
pressure (500-3000 psi) conditions for short time periods (5-10 min). compressed gas is
used to purge the sample extract from the cell into a collection vessel. Currently, ASE is
applicable to solid or semisolid samples that can be retained in the cell during extraction
14
2.2.3 Supercritical fluid extraction
Supercritical fluid extraction (SFE) uses carbon dioxide as the extractant and is
considered environmental safe because it replaces hazardous solvent consumption.
Supercritical C02 has been used extensively because of advantages like low toxicity, high
purity, and a good ability to solvate a range of organics. However, it is becoming
increasingly apparent that by using pure C02 at "normal" extraction conditions (e.g., 400
atm at 50-80°C) it is difficult to efficiently extract many organics from heterogeneous
environmental solids such as soils, sludges, and air particulate matter. However, there are
several disadvantages to SFE such as CO2 is nonpolar, which limits it uses; less stable
extracted oils and subject to oxidation, and initial cost and maintenance cost of equipment
are high (List et al., 1989; Calvo et al., 1994; Ganzler et al., 1986).
SC-CO2 extraction can be used to extract isoflavones from soybean meals but it is more
applicable to the extraction of acetylglucoside and aglycone. The results obtained were
lower total isoflavone yield when compared to solvent extraction, (Kao et al., 2008). Yu
et al., 2007 were able to produce isoflavone-rich soy protein isolate from SC-CO2
defatted soy meal. The phospholipids present in a defatted soybean meal was completely
extracted by 10% SC-CO2/ethanol mixture (Montanari et al., 1997).
2.2.4 Gas-supported screw-pressing (GSSP)
GSSP is a recently developed process by Crown Iron Works (St. Paul, MN, USA) and
Safe Soy Technologies (Ellsworth, IA, USA). CO2 is injected into a screw press as a
displacement fluid thereby achieving low residual oil contents in meal (3-6% db) and an
increased oil yield. The CO2 flashes when exiting the press to atmospheric pressure
15
cooling the meal to achieve low protein denaturation and high PDIs (>70). GSSP meal
was used to produce soy protein isolate in high yields because of it’s unique functional
properties (Deak et al., 2008).
2.2.5 Microwave extraction
Microwave extraction reduces usage of solvent and generally affords complete extraction
(Chen and Spiro, 1995). This method becomes labor-intensive because samples must cool
before further processing. However, there are difficulties in automation of the process. In
order to separate the solvent from the solid material, the analyte must then filter,
centrifuge, or decant the samples. Time saved due to the fast microwave extraction is lost
in the cooling process, re-extraction, and preparation of the analyte for further analysis.
2.3 Pre-treatment
The development of effective pretreatment methods to increase the susceptibility of
cellulose to enzyme attack is a major technological challenge for process
commercialization. In order to improve the rate of enzymatic hydrolysis and increase the
yields of fermentable sugars from cellulose, different pretreatment methods can be used.
Extrusion pre-treatment method was used in this research.
2.3.1 Extrusion pretreatment
Extrusion cooking is an popular food processing technique based on a high
temperature/short time process to produce fiber-rich products (Gaosong & Vasanthan,
2000). In the extruder, due to high temperature and pressure, shear stress is generated in
the screw-barrel assembly, which makes the food mix cook thermo mechanically. The
16
cooked melt is then texturized and shaped in the die (Arhaliass et al., 2003). The
thermomechanical changes that occur during extrusion are gelatinization of starch,
denaturation of protein and inactivation of enzymes, microbes and many anti-nutritional
factors; all these actions take place in a shear environment, which results in a plasticized
continuous mass (Bhattacharya & Prakash, 1994).
Extrusion processing has been evaluated as a method for preparation of aquaculture feed.
Because extrusion processing is a high temperature process, the starch-based products
form an elastic melt inside the barrel, which results in a more expanded final product (Ilo
et al., 1996; Alves et al., 1999; Lin et al., 2000). However, a plastic melt that is formed
during processing of protein based products results in a more porous and textured final
product (Cumming et al., 1973; Gwiazda et al., 1987; Singh et al., 1991; Sandra and Jose,
1993). Moisture content (MC) of the mix and temperature gradient in the barrel are the
two most important factors to be considered during extrusion processing as they affect
the development of proper viscosity of the melt and final product characteristics (Kokini
et al., 1992; Chevanan et al., 2007a, c). Aquaculture feeds require high proportions of
both protein and starch, but very little information is currently available on extrusion
processing of these types of ingredient blends.
Chevanan et al., 2009 studied the effect of extrusion while adding distillers dried grains
with soluble (DDGS) and whey on aquaculture feed and concluded that an increase in
moisture content, durability, and redness was observed by increasing the moisture content
of the ingredient blends from 15 to 25% but a decrease of 9.8 and 5.6% was observed in
brightness and yellowness of the extrudates.
17
Cruz-Suarez et al., 2001 assessed differently processed feed pea meals and canola meal in
diets for blue shrimp and found out that extrusion cooking had no effect on growth and
survival but significantly improved feed conversion and protein efficiency ratio. The
micronized pea diet produced the highest feed intake and growth rate. Response to the
diet containing extruded canola meal was similar to that of the control diet.
Muthukumarappan and Julson, 2007 conducted experiments in a twin screw extruder as
biomass pretreatment method. Blue stem, big bluestem, switchgrass and indian grass (15-
40% moisture content) were pretreated in a twin screw extruder at temperature of 25 and
100°C and screw speeds of 200 and 400 rpm. Fine ground big bluestem showed the
highest (35.5%) glucose recovery at 25°C with 20% moisture content and screw speed of
200 rpm. Authors reported, of the four grasses, big bluestem yielded the highest glucose
recovery followed by indian grass (31.7%), blue stem (27%) and switchgrass (24.5%)
2.3.2 Microwave pretreatment
Microwaves belong to the electromagnetic spectrum with wavelengths varying from 1
mm to 1 m with their corresponding frequencies between 300 MHz and 300 GHz. Within
this portion of the electromagnetic spectrum the frequencies are used for various different
applications like cellular phones, radar, and television satellite communications. The two
most commonly used frequencies are 0.915 and 2.45 GHz. Recently, 0.9 to 18 GHz
microwave frequency have been used for development of material processing (Lauf et al.,
1993).
Over the years, a number of studies have been performed to recognize how microwaves
affect the pretreatment process of biomass for producing bioethanol. For example, in the
18
earlier study of Ooshima et al., 1984 microwave irradiation pre-treatment was used by
placing rice straw and bagasse with water in sealed glass vessels. They addressed that the
materials were more accessible for enzymatic hydrolysis as the biomass was pretreated
by microwaves. Zhu et al. (2005, 2006) employed microwaves and alkali to pretreat rice
straw and wheat straw and compared with the alkali-alone pretreated processes. The
results indicated that the biomass pretreated by microwaves and alkali had a higher
hydrolysis rate and glucose contents in hydrolysate. Hu and Wen, 2008 highlighted the
pretreatment of switchgrass using microwaves. The total sugar yield was 53% higher
when given microwave-assisted alkali pretreatment than that obtained from conventional
heating. Ma et al., 2009 used Box–Behnken design and response surface methodology to
evaluate the optimal microwave pretreatment of rice straw. They found that the
maximum efficiencies of cellulose, hemicellulose and total saccharification of rice straw
were increased by 30.6%, 43.3% and 30.3%, respectively when the optimal conditions of
microwave pretreatment were carried out.
2.3.3 Acid pre-treatment
Acid hydrolysis of biomass has been well known since the eighteenth century. This
treatment could be done using dilute acid or concentrated acid. Acid pretreatments
effectively solubilize hemicellulose and disrupt covalent bond, hydrogen bonds and
vander wall forces that hold the cellulose, hemicellulose and lignin together in the
biomass. This disruption can further result in separation of the lignin from the cellulose to
some extent (Li et al., 2010; Sun and Cheng, 2005). Applying concentrated acids in
moderate temperatures and dilute acid pretreatments at high temperature may result in
achieving improved cellulose hydrolysis (McMillan, 1994).
19
Varga et al., 2004 reported that mixing the biomass with 2% (w/w) sulfuric acid for one
night followed by steam treatment at 190°C for 2 min could result in 85% hemicellulose
reduction in lignocellulosic feedstocks, such as corn stover. Lignin degradation is
however not as extensive as with alkaline pretreatments (Sun and Cheng, 2002; Wyman
et al., 2005). Relative to switchgrass, Torget et al., 1990 found that 92% solubilization of
switchgrass xylan takes place with pretreatment of 0.5%(v/v) sulfuric acid at 140°C for
60min or at 160°C for 10 min.
2.3.4 Alkaline pretreatment
Alkali pretreatment of lignocellulosic materials results from the degradation of lignin
content of the materials (Fan et al., 1987; McMillan, 1994). The alkaline hydrolysis
disrupts intermolecular ester bonds that cross links together xylan hemicelluloses and
other components, for example, lignin and other hemicellulose. As we remove the
crosslinks, the porosity of the lignocellulosic materials increases (Tarkow and Feist,
1969). Swelling, increase in internal surface area, a decrease in the degree of
polymerization, cellulose crystallinity, separation of structural linkages between lignin
and carbohydrates, and disruption of the lignin structure are the changes that are
experienced by treating the lignocellulosic materials with dilute NaOH (Fan et al., 1987).
The digestibility of NaOH-treated hardwood increased from 14% to 55% with the
decrease of lignin content from 24–55% to 20%. However, no effect of dilute NaOH
pretreatment was observed for softwoods with lignin content greater than 26%, (Millet et
al., 1976). Hydrolysis of straws with relatively low lignin content of 10–18% were
effected by dilute NaOH pretreatment (Bjerre et al., 1996). The combination of
irradiation and 2% NaOH for pretreatment of corn stalk, cassava bark and peanut husk
20
was used by Chosdu et al., 1993. The glucose yield of corn stalk was higher than the
cassava bark and peanut husk, the values recorded for corn stalk was 20% in untreated
samples compared to 43% after treatment with electron beam irradiation at the dose of
500 kGy and 2% NaOH, but the glucose yields of cassava bark and peanut husk were
only 3.5% and 2.5%, respectively.
2.4 Enzymatic hydrolysis
Enzymatic hydrolysis of cellulose is carried out by cellulase enzymes which are highly
specific (Beguin and Aubert, 1994). The products of the hydrolysis are usually reducing
sugars including glucose, galactose, xylose and arabinose. The utility cost of enzymatic
hydrolysis is lower as compared to acid or alkaline hydrolysis because it’s usually
conducted at mild conditions (pH 4.8 and temperature 45– 50°C) and does not have a
corrosion problem (Duff and Murray, 1996). During hydrolysis of lignocellulosic
materials, cellulases are produced by both bacteria and fungi. Cellulases are usually a
mixture of several enzymes. The three major groups of cellulases involved in the
hydrolysis process are: (1) endoglucanase attacking amorphous cellulose fiber and
creating free chain-ends; (2) exoglucanase or cellobiohydrolase which leads to further
degradation by removing cellobiose units from the free chain-ends; (3) β-glucosidase
which hydrolyzes cellobiose to produce glucose (Coughlan and Ljungdahl, 1988). During
the enzymatic hydrolysis, cellulases helps in the degradation of cellulose to reducing
sugars which are fermented by yeasts bacteria to ethanol.
Substrates, cellulase activity, and reaction conditions (temperature, pH, as well as other
parameters) are the factors that affect the enzymatic hydrolysis of cellulose. Research has
21
focused on the optimization of hydrolysis process and enhancement of cellulase activity
to increase the yield and rate of the enzymatic hydrolysis (Cantwell et al., 1988; Durand
et al., 1988; Orpin, 1988)
2.5 Physical properties:
2.5.1 Moisture content
Moisture content is one of many factors affecting biomass quality, material texture,
microbial growth, and storage stability. In previous studies, the relationship of the wet
based (w) and dry (d) bulk density of the samples is represented as a mixture equation in
two forms of Eq. (1) (Peleg, 1988) or Eq. (2) (Hollenbach et al., 1982).
(1)
(2)
where ρb is the wet based bulk density of the samples (kg/m3) at moisture content of Mw,
ρd is the dry based bulk density (kg/m3) at bone dry sample. Mw is the moisture content of
the wet samples (decimal wet basis), ρw is the bulk density of water 1000 kg/m3. A
previous study mentioned that the pellet density of corn stover and switchgrass was
significantly affected by moisture content (Mani et al., 2004). At the moisture content of
8%wb, the bulk densities of corn stover and switchgrass pellets were 147 kg/m3 and 150
kg/m3. It was concluded that the following mixture equation could be used for estimating
bulk density of the same size material from particle moisture content
wd
w
b
M
111
)1(wb M
22
(3)
where ρb is the wet bulk density of biomass at a moisture content of Mw (decimal fraction
wet basis), x is particle length, a and b are biomass species constants, and ρw is the
density of water (roughly 1000 kg/m3) (Lam and Sokhansanj, 2007). For four different
particle sizes, when the moisture content range of 8 to 60%, loose bulk density of
switchgrass varied from 49.44 to 266.52 kg/m3 (Kaliyan and Morey, 2009). A similar
trend was also observed for the wheat straw (Lam, 2008).
2.5.2 Water Absorption Index (WAI) and Water Solubility Index (WSI)
Water absorption index (WAI) is the weight of gel obtained per gram of dry sample
through a modification of the method described by Kite et al., 1957 for measuring the
swelling power of starch. WAI shows the amount of water the sample can absorb. Water
solubility index (WSI) shows the amount of dried solids recovered by evaporating the
supernatant from the water absorption test, which is expressed as a ratio of dry solids got
from the supernatant to the amount of original amount. WAI and WSI are influenced by
the temperature and moisture content, and vary in different samples as well as different
pretreated samples (Anderson, 1982). Jin et al., 1994 studied effects of soy fiber, salt,
sugar and screw speed on physical properties and microstructure of corn meal extrudate.
It was observed that with increasing screw speed, WAI decreased but increased WSI.
WAI was decreased but WSI was increased by increasing the fiber content from 0-20%.
The trends were reversed with further increases in fiber content. According to Ding et al.,
w
w
b
w
b
M
ax
M
11
23
2005, extrudates with a higher density, lower expansion, higher WAI, lower WSI, higher
hardness and lower crispness results with an increase in feed moisture content. During
extrusion, it was observed that due to higher barrel temperature, lower WAI and higher
WSI was observed (Ding et al., 2006).
2.5.3 Water activity
Water activity or aw is developed to account for the intensity with which water associates
with various non-aqueous constituents and solids. Simply stated, it is a measure of the
energy status of the water in a system. The growth of bacteria, yeasts, and molds could be
predicted with water activity (aw). Water activity helps food designers to formulate
products that are shelf stable. Water activity also helps in determining the shelf life of the
product for example if a product is kept below a certain water activity, the shelf-life
increases due to inhibition of mold growth. In the literature, food product design, shelf
life and food product design are important considerations for determining the water
activity (Igathinathane, 2009). Water activity is related to moisture content in a non-linear
relationship known as a moisture sorption isotherm curve. These isotherms can be used
for prediction of product stability during storage and are temperature specific.
2.5.4 Thermal properties
Thermal properties are related to heat transfer control in specified samples and can be
classified as thermodynamic properties (enthalpy and entropy) and heat transport
properties (thermal conductivity and thermal diffusivity). Thermal properties are mainly
used in the research of food production. These properties play an important role in the
24
design and prediction of heat transfer operations during the handling, processing,
canning, storing, and distribution of foods (Choi and Okos, 1983).
Thermal conductivity (κ), is the property of a material's ability to conduct heat, which
represents the quantity of heat Q that flows per unit time through a food of unit thickness
and unit area having unit temperature difference between faces. SI units for thermal
conductivity are W/mK (Van der Held and Van Drunen, 1949).
Thermal diffusivity (usually denoted α) is the thermal conductivity divided by density
and specific heat capacity at constant pressure. It has the SI unit of m²/s.
Thermal diffusivity determines the speed with which the heat travels through a three-
dimensional material or diffusion through the material (Ingersoll et al., 1954). Physically,
it relates the ability of the material to conduct heat to its ability to store heat (Choi and
Okos, 1983).
2.5.5 Bulk density and True density
Bulk density is an important characteristic of biomass that influences directly the cost of
feedstock delivered to a biorefinery and storage cost (Sokhansanj and Fenton, 2006).
Various factors that are affected by bulk density are storage requirements, material
handling size system and material behavior during subsequent thermo‐chemical and
biological processes (McKendry, 2002). Bulk density and flow characteristics of
feedstock affect the engineering design and operation of transport equipment, storages,
and conversion processes (Woodcock and Mason, 1987). A recent study by Ryu et al.,
2006 investigated the effect of bulk density on the combustion characteristics of biomass.
25
They found that the ignition front speed was inversely proportional to bulk density, while
the burning rate tends to decrease linearly.
The important factors after grinding for downstream processing were moisture content,
bulk density, true density, particle size and shape of biomass particles. Ebeling and
Jenkins, 1985, determined the heating value and performed fuel proximate analysis for 62
kinds of biomass. Combustion characteristics of pelleted switchgrass were studied by
Samson et al., 2001. They compared the combustion quality of switchgrass pellets with
coal and natural gas. They reported that carbon dioxide emission from switchgrass pellets
was very much lower than the fossil fuel.
2.5.6 Color
Color is associated with every aspect of our lives and influences many of our day-to-day
decisions, including those involving food. The various factors affected by color are
esthetics, safety, sensory characteristics, and acceptability of food. There have been a
number of other studies that have shown an effect of color on other sensory
characteristics, indicating an interrelationship that would account for its effect on food
intake. Studies reviewed by Clydesdale, 1984 and other individual investigations (Gifford
and Clydesdale, 1986; Gifford et al., 1987; Johnson and Clydesdale, 1982; Johnson et al.,
1983; Johnson et al., 1982; Roth et al., 1988; Tourila-Ollikainen, 1982) found that other
sensory characteristics such as sweetness, salt, and flavor was affected by color. Another
study (Christensen, 1985) found that aroma and flavor were not affected by color in
paired samples. Dubose et al., 1980 evaluated the effect of color on acceptability in soft
drinks and cake. The overall acceptability of both the cherry and orange beverages was
26
significantly affected by color and flavor. It was found (Christensen, 1985) that once
again the color in the cake significantly affected overall acceptability. Maga, 1973
evaluated the influence of color on potato chip sensory preference and found that when
given a visual choice, dark chips were preferred less compared to the regularly colored
chips most of the time.
27
CHAPTER 3
EFFECT OF EXTRUSION PRE-TREATMENT ON EXTRUDATE’S
PHYSICAL PROPERTIES AND SUGAR RECOVERY OF COLD PRESS
AND ACCELERATED SOLVENT EXTRACTED CANOLA MEAL
3.1 Abstract: The study on the effect of extrusion as a pre-treatment on the sugar
recovery and physical properties of canola meal was performed. The oil from canola seed
was extracted from cold press (CP) and accelerated solvent extraction (ASE) methods
and the meal obtained from these processes were used for the extrusion pretreatment
study. Meals were then extruded at temperature of 80, 130 and 180°C and at a screw
speed of 50, 100 and 150 rpm. Temperature at feeding and barrel zone was kept constant
(80°C). The physical properties like water activity, water absorption index (WAI), water
solubility index (WSI), moisture content, bulk density, true density, thermal properties
and color were measured. Sugar recovery following enzymatic hydrolysis was also
determined. Enzyme dosage and extruder processing conditions played a major role in
increasing the sugar recovery of canola meals. Higher sugar recovery was recorded for
ASE canola meal. The highest total percentage of sugars observed for ASE canola meal
was 17.89% at temperature of 80°C and 100 rpm screw speed and for CP canola meal, it
was 15.62% at 80°C temperature and screw speed of 50 rpm. Extruder temperature had a
significant effect (p<0.05) on WAI, water activity, color and bulk density of ASE canola
meal.
3.2 Introduction:
The name canola was introduced in Canada in 1979 and was similar to rapeseed whose
oil contains less than 2% erucic acid and less than 30 μmol/g meal of total glucosinolates
28
(Canola Council of Canada 1990). Typically, canola seed contains more than 40% oil
(Kimber and McGregor 1995) and in Australia, the average oil content for the year 2008
was 41.8% (Seberry and others 2008). The annual worldwide growth of canola
production was excellent and the production of canola for 2015 is 15 million
tones.(Canola Council of Canada 2009). Australia is the world’s 2nd
largest exporter of
canola seed after Canada with production rate of 1.5 million tones and contributing upto
96% of the total oilseeds production since 2000. The protein rich meal, extracted from the
seed, is currently used as a protein source in livestock and aquaculture industries
(Uruakpa and Arntfield 2005a; Canola Council of Canada 2009). It is known for it’s high
biological value (Campbell and others 1981) and good protein and amino acid
composition (Sosulski 1983; Pastuszewska and others 2000).
The cold press method is becoming an interesting substitute for conventional methods
because it doesn’t involve any heat or chemical treatments (Parker et al., 2003). Cold
press method is popular due to its simple technique and low energy requirement and
consumer’s desire for natural and safe food products. Some of the disadvantages of the
process are difficulties in obtaining a consistent quality and low productivity (Rotkiewicz
et al., 1999). Another method for oil extraction is accelerated solvent extraction (ASE).
Pressure and temperature are used to extract oil in ASE (Ezzell et al., 1995). Reduced
extraction time and less solvent consumption are some of the advantages of ASE. The
extraction process can be done automated or semi automated.
Extrusion cooking is the process of forcing a material to flow under a variety of
conditions through a shaped hole (die) at a predetermined rate to achieve various
resulting products. Extruder is considered a high temperature-short time bioreactor that
29
transforms raw ingredients into modified intermediate and finished products. An extruder
could be considered as a bioreactor in which thermal and shear energies are applied to
raw food materials. The materials undergo many structural, chemical, and nutritional
transformations (Camire et al., 1990; Camire, 2003; Singh et al., 2007; Riaz et al., 2009).
Various extrusion pretreatment studies show a significant improvement on sugar recovery
from different biomasses such as corn stover, miscanthus, switchgrass, big blueatem,
prairie cord grass and Douglas fir wood (Dale et al., 1999; de Vrije et al., 2002;
Karunanithy et al., 2009a-c; Lee et al., 2009; Jurusic et al., 2009). Soya white flakes and
soyabean hulls had also been studied for extrusion pre-treatment (Karuppuchamy and
Muthukumarappan, 2009). In the present work, extrusion is used as a pre-treatment to
investigate how it affects the canola meal.
The oilseed meal has high protein and carbohydrate which makes them attractive raw
material for various applications. The oilseed meals are largely available and are low in
cost. In this research, cold press and accelerated solvent extraction was used to extract oil
from the canola seeds and extrusion was done at different processing conditions. The
effect of extrusion as a pre-treatment has been studied on the physical properties, thermal
properties and sugar recovery of these meals.
Enzymatic hydrolysis of CP and ASE canola meal was done in order to breakdown the
complex structure of carbohydrates. The sugars are desired in the form of simple
carbohydrate structure so that they are easily accessible by the particular micro-
organisms during fermentation to convert them into protein. This converted protein then
can be used as fish feed. This study will give an insight view for the efforts that has been
made as how the oilseed meals can replace the fish meal.
30
3.2.1 Objectives
1. Optimize the extruder parameters to predict the maximum sugar recovery in CP
and ASE canola meal
2. Optimize the enzyme dosage for maximum sugar recovery in CP and ASE canola
meal
3. Determine the physical properties, thermal properties and sugar recovery of CP
and ASE canola meal
3.3 Materials and Methods:
3.3.1 Sample preparation:
The canola seeds were obtained from consumer supply distributing Co. (Oregon). Two
methods were used to extract the oil: cold press extraction and accelerated solvent
extraction. The cold press extraction (M70 oil press co.) consisting VFD motor (2HP,
1.5KW) was done at a temperature of 90°C, frequency of 20 Hz and die size of 0.22
inches. Time-temperature combination used for ASE was 100°C/90 min. The solvent
used was hexane. Two different samples of 1.5 Kg were prepared according to two
different oil extraction methods in order to compare the effect of different oil extraction
methods on the sugar recovery and physical properties of canola meal.
3.3.2 Extrusion pre-treatment
Single screw extruder (Brabender Plasti-Corder, Model PL2000, South Hackensack, NJ)
powered by a 7.5HP motor with an operating range of screw speeds from 0-210 rpms (0-
22rad/sec) was used for extrusion of CP and ASE canola meal samples. The extruder had
31
a barrel with length to diameter ratio of 20:1 and a barrel diameter of 19 mm. ASE canola
meal was moisture balanced to 20% db. Three different temperature and screw speed
combination were used: 80°C, 130°C, 180°C and 50 rpm, 100 rpm, 150 rpm. A total of 9
combinations were extruded. The extrudates obtained were dried overnight. The sample
size extruded at each condition was approximately 150g.
3.3.3 Grinding:
Grinding of extruded samples was done using a hammer mill (Speedy Jr, Winona
Attrition Mill Co, MN). Particle size of 2 mm was obtained and then stored in zip lock
bags in refrigerator at a temperature of 4°C. The samples were ground to a uniform size
in order to obtain effective enzymatic hydrolysis and physical properties of canola meal.
3.3.4 Moisture content:
Moisture content of the control and extruded (CP and ASE) samples were measured
according to the official methods of analysis (AOAC, 1984) using a laboratory oven
(Thelco Precision, Jovan Inc., Wincester, VA).
3.3.5 Physical Properties:
Three replications were studied for each property.
3.3.5.1 Water activity:
Water activity of the samples was measured by using the AquaLab water activity meter
(4TE, version 10, Decagon Devices, Inc., Pullman WA). The sample was placed in a
plastic cup of the water activity meter and the lid was closed. The equipment showed the
32
water activity reading on the screen after 5 to 10 minutes. For each sample, three
replications were done.
3.3.5.2 Water absorption index (WAI) and Water solubility index (WSI):
2.5 g sample was taken in a tarred 50 ml centrifuge tube. 30 ml of distilled water was
added to it. This was stirred intermittently for a period of 30 min and centrifuged at 3000
rpm for 10 minutes. The supernatant liquid was transferred into an aluminum dish, placed
in the oven for 2 hr at 135oC (AACC method 44-19, 1995), and then desiccated for 20
min before weighing the dry solids of the supernatant. The mass of the remaining gel was
weighed, and WAI (-) was calculated as the ratio of gel mass to the original sample mass.
WSI (%), on the other hand was determined as the ratio of mass of dry solids in the
extract to the original sample mass.
3.3.5.3 Bulk density and true density:
True density of the samples was measured using Micromeritics Multivolume Pycnometer
(No.1305, Micromeritics Instrument Corporation, Norcross, GA). The canola meal
sample was filled up to the brim and then placed into the pycnometer. The unit works on
the basis of helium gas replacement in the void space of the biomass sample. The values
were measured in the form of P1 when the knob was in the prep position and P2 when the
knob was in test position measured in psi. True density of the material was measured by
the equation
12
1
exp
PP
VV
MTD
cell
sample
33
Where TD is the true density, Msample is the mass of the biomass sample that used to fill
the alumnium cup, Vcell and Vexp are two constant numbers provided by the micromeritics
multivolume pycnometer.
3.3.5.4 Thermal properties:
Thermal properties (thermal conductivity, thermal diffusivity, and specific heat capacity)
were determined with a thermal properties meter (KD2, Decagon Devices, Pullman, WA)
that utilized the line heat source probe technique. The probe used was SH-1-00571.
3.3.5.5 Color:
The color was measured using a Spectrophotometer (CM-2500d, Minolta Co., Ltd.,
Japan). The color was described by value of ‘L’, ‘a’ and ‘b’ where L indicates intensity of
color i.e. lightness which varies from L=100 for perfect white to L=0 for black. ‘a’ and
‘b’ are chromaticity dimensions which give understandable designations of color i.e. the
value of ‘a’ measured redness when positive, grey when zero and greenness when
negative and the value of ‘b’ measured yellowness when positive, grey when zero and
blueness when negative.
3.3.6 Enzymatic hydrolysis:
The enzymatic hydrolysis was conducted in a hungate glass tube (Bellco glass, Inc, NJ,
USA). The sample weight of canola meal extrudates taken was 2.0g. 8 ml of citrate buffer
(0.1M, pH 4.8) was taken. Sodium azide (0.02g/l) was added to inhibit microbial
contamination during incubation. CTec2 and HTec2 enzymes were added during
enzymatic hydrolysis. The enzyme activity for CTec2 was 128 FPU/ml and for HTec2
was 4465 IU/ml. The enzyme dosage was optimized by adding varying enzyme dosage of
34
40, 50, 60, 70, 80, 90 and 100 FPU/g cellulase. CTec2 and HTec2 were added in the ratio
of 9:1. Hydrolysis was carried out for 72 hrs at 50°C and 150 rpm. After hydrolysis, the
samples were kept in boiling water for 10 min to inactivate the enzyme action. The
supernatant was centrifuged at 13,000 rpm for 15 min and frozen and thawed. This
process was repeated twice to remove impurities which contribute to the pressure
increase in the HPLC system. The supernatant was then filtered into HPLC vials and then
injected into the HPLC. Soluble sugars were quantified using HPLC (Agilent
technologies, Santa Clara, CA; Bio-Rad Aminex 87H column, Hercules, CA) with a
mobile phase of 0.005M H2SO4 at a flow rate of 0.6 ml/min at 65°C and a sample volume
of 20µl as mentioned by Sluiter et al (2006). The sugar concentration obtained from the
chromatogram was divided by the dry weight of biomass of pretreated material and
multiplied by the total volume taken to get the percentage of that compound in the
sample. The percentage was calculated by multiplying the value by 100.
3.3.7 Extruder processing parameters optimization
The extruder processing parameters were optimized by using design of expert8 (Version
8.0.7.1) software. General Factorial Design was applied to optimize the temperature and
screw speed for maximum sugar recovery of cold press canola meal extrudaes and
solvent extracted canola meal extrudates.
3.3.8 Statistical analysis
All the collected data were analyzed with SAS v.9 (SAS Institute, Cary, NC). The Proc
GLM procedure was used to determine the main, treatment and interaction effects using a
35
Type I error rate (α) of 0.05. Post-hoc Duncan Multiple Range Test (DMRT) tests were
used to identify where the significant differences occurred.
3.4 Result and discussion:
3.4.1 Water absorption index (WAI) and Water solubility index (WSI):
Extrusion of CP canola meal and ASE canola meal was done at different temperature and
screw speed of 80°C, 130°C and 180°C; 50, 100 and 150 rpm. Fig. 3.1 and Fig. 3.2
represents the WAI and WSI of canola meal (CP and ASE) as affected by the extruder
processing conditions. The control value of WAI & WSI for CP canola meal (3.95% &
23.18%) is higher than the ASE canola meal (3.27% & 21.11%). The values of WAI &
WSI decreased after extrusion for CP canola meal. Several researchers suggested that any
change in WAI can be due to structural modifications of the blend composition, such as
starch gelatinization and protein denaturation (Badrie and Mellowes, 1991; Chevanan et
al., 2007a; Rosentrater et al.,2009a, b). Unlike water absorption index, WSI indicates
degradation extent of macromolecule components of a feed blend, mainly starch and
protein molecules (Govindasamy, 1996; Colonna Mercier, 1983). Therefore, WAI is
inversely related to WSI (Anderson et al., 1982). Almost similar values of WAI & WSI
were observed during extrusion of CP canola meal. For ASE canola meal, WAI increased
with extrusion and WSI decreased with extrusion. At the same temperature, WAI
increased with screw speed. Temperature and screw speed had a significant effect
(p<0.05) on WAI of ASE canola meal. The WSI for ASE canola meal decreased
significantly (p<0.05) with increase in screw speed at the same temperature.
36
3.4.2 Color
Table 3.1 shows the color (L, a and b) of canola meal extrudates (CP and ASE) as
affected by the extruder processing conditions. The control L value for ASE canola meal
(65.98) is higher than the CP canola meal (59.84). Almost similar values of L were
observed for extrusion at different temperature and screw speed. Screw speed had no
significant effect (p>0.05) on the L values of CP canola meal. For ASE canola meal,
temperature and screw speed both had a significant effect (p<0.05) on the L value. The L
value of ASE canola meal extrudates is lower than the control value, which means the
extrudates are darker in color than the control ASE canola meal. Change in color of
extrudates can be an indication of nutrients degradation during extrusion processing
(Bjorck & Asp, 1983). Almost similar ‘a’ values were observed for the control and
extrudates of CP and ASE canola meal. The highest ‘a’ value for CP and ASE canola
meal extrudates were 5.29 at temperature of 80°C and screw speed of 50 rpm and 6.12 at
130°C temperature and screw speed of 50 rpm. The CP canola meal (control and
extrudates) had higher values of ‘b’ than ASE canola meal (control and extrudates).
Extrusion didn’t had a significant effect (p>0.05) on the ‘b’ value for CP canola meal
extrudates. Almost similar ‘b’ values were observed for control and extrudates of CP
canola meal. The ‘b’ values for ASE canola meal extrudates were quite lower than the
control ASE canola meal.
3.4.3 MC, (db%) and water activity
The values observed for MC, (db%) and water activity of CP and ASE canola meal are
shown in Table 3.2. The moisture content at dry basis MC, (db%) for control sample of
37
ASE canola meal (19.88%) was much higher than the control sample of CP canola meal
(7.58%). For CP canola meal, keeping the screw speed constant during extrusion, as the
temperature increased, the MC, (db%) decreased. At 50 rpm, the MC, (db%) of CP
canola meal extrudates recorded at the temperature of 80°C, 130°C and 180°C were
6.39%, 5.77% and 5.27%. For ASE canola meal, the MC, (db%) decreased as the
temperature and screw speed increased during extrusion. As for water activity, the ASE
canola meal (control and extrudates) have higher values than the CP canola meal (control
and extrudates). The control water activity value for CP and ASE canola meal were 0.41
and 0.77. The temperature and screw speed had a significant effect (p<0.05) on the water
activity of CP and ASE canola meal extrudates. As the temperature and screw speed
increased, the water activity values for ASE canola meal extrudates decreased.
3.4.4 Thermal properties
The values of thermal properties measured are shown in Table 3.3. The thermal
properties were measured in terms of thermal diffusivity (D value), thermal conductivity
(K value) and specific heat capacity (C value). The D value, K value and C value for
control CP canola meal (0.77), (0.12), (1.14) was quite higher than the control ASE
canola meal (0.10), (0.12), (1.12). Extrusion significantly (p<0.05) decreased the D value
for CP canola meal extrudates as compared to the control value. Almost similar D values
were observed for the control and ASE canola meal extrudates. As the temperature and
screw speed increased, the K value increased for the CP canola meal extrudates. Heldman
(2003) postulated that the k value of a heat processed material decreased due to the
material changes, primarily because of protein and starch transformations. The presence
of hydrophobic constituents in the feed blend affects the density and thus thermal
38
conductivity of the extruded feed (Mariama et al., 2008). There was not much difference
among the K value of ASE canola meal extrudates. The highest and lowest K value
recorded for the ASE canola meal extrudate was 0.13 at 130°C temperature and 50 rpm
screw speed and 0.12 at 80°C temperature and screw speed of 150 rpm. Higher C values
were observed for ASE canola meal extrudates as compared to the control value. As the
extruder temperature increased, the C value for ASE canola meal extrudates decreased.
3.4.5 Bulk density and True density
Table 3.4 shows the bulk density and true density of CP and ASE canola meal (control
and extruded). The ASE canola meal (control and extrudates) had a higher bulk density
and true density values as compared to the CP canola meal (control and extrudates). The
bulk density of canola meal extracted by CP and ASE method significantly (p<0.05)
increased with extrusion. The highest bulk density values recorded for CP and ASE
canola meal extrudates were 370.13 at 80°C temperature and a screw speed of 150 rpm
and 559.37 at temperature of 180°C and screw speed of 100 rpm. The true density values
for CP canola meal extrudates were lower than the control CP canola meal. For ASE
canola meal extrudates, the true density values first decreased than the control value at
temperature of 80°C and then increased at a temperature of 130°C and 180°C.
3.4.6 Interaction effects of independent variables on physical properties of canola
meal
The interaction effects of independent variables on physical properties of canola meal are
given in Table 3.5. The combined interaction of temperature and screw speed had the
significant effect (p<0.05) on WAI of CP and ASE canola meal. Screw speed alone had a
39
significant effect (p<0.05) on WSI of ASE canola meal. The water activity, color (L
value) and bulk density of CP and ASE canola meal was significantly affected (p<0.05)
by the temperature, screw speed, combined interaction of temperature and screw speed.
3.4.7 Interaction effects of independent variables on thermal properties of canola
meal
The interaction effects of independent variables on thermal properties of canola meal are
given in Table 3.6. The thermal diffusivity (D value) and thermal conductivity (K value)
of CP canola meal was significantly (p<0.05) effected by the temperature and combined
interaction of temperature and screw speed. Only extruder temperature had a significant
effect (p<0.05) on D value of ASE canola meal. The K value of ASE canola meal was not
significantly affected (p>0.05) by extrusion.
3.4.8 Enzyme dosage optimization
The enzymes were added at 50, 60, 70, 80 and 90 FPU/g cellulose to control and
extrudate of cold press and solvent extracted samples. The hydrolysis was done and each
sample was measured for the sugar recovery using HPLC. The % total sugars was almost
similar for the control CP sample at enzyme dosage of 50 (16.07%), 60 (16.53), 70
(16.61) and 80 (16.90). The % total sugars for CP control sample were not much
increased for even a higher dosage of 90 FPU/g cellulose (17.41). The glucose recovery
significantly increased (p<0.05) with extrusion for CP and ASE canola meal extrudates.
The values obtained for CP extrudates were almost similar at 50, 60 and 70 FPU/g
cellulose. For ASE canola meal extrudates, the %total recovery at 50, 60, 70, 80 and 90
FPU/g cellulose was 16.71, 17.37, 17.99, 18.18 and 18.33. Although sugar recovery was
40
higher at 90 FPU/g cellulose compared to other dosage, the optimized enzyme dosage for
CP and ASE canola meal was 60 FPU/g cellulose. The reasons were that higher enzyme
dosage will be costly and it might overcome the extrusion effect.
3.4.9 Sugar recovery
The effect of different extrusion conditions on sugar recovery of CP and ASE canola
meal (control and extruded) is shown in Fig. 3.3. The screw speed and temperature had a
significant effect (p<0.05) on the glucose recovery of ASE canola meal extrudates. The
control CP canola meal (6.80%) had higher glucose recovery than control ASE canola
meal (5.92%). The % increase in glucose recovery for ASE extrudates is higher than the
CP extrudates. The glucose recovery for CP and ASE canola meal extrudates increased
significantly (p<0.05) with extrusion. Karuppuchamy et al., 2011 also got the similar
results for defatted soybean meal, with increase in temperature the glucose yield
increased. The control galactose and arabinose recovery for ASE canola meal (8.22%;
1.23%) is higher than the control CP canola meal (7.68%; 0.91%). The temperature had a
significant effect (p<0.05) on the galactose recovery of CP and ASE canola meal
extrudates. The highest galactose recovery for CP and ASE canola meal extrudates were
7.49% at 80°C temperature and 50 rpm screw speed and 8.19% at 80°C temperature and
screw speed of 100 rpm. The control arabinose recovery for CP and ASE canola meal
were 0.91% and 1.23%. The screw speed and temperature had a significant effect
(p<0.05) on the arabinose recovery of CP and ASE canola meal. As the temperature and
screw speed increased, the arabinose recovery increased for CP and ASE canola meal
extrudates.
41
The CP and ASE canola meal samples were also checked for the presence of any
formaldehyde which might be present as a result of pre-treatment. The samples were run
for duration of 60 minutes and no peaks were found after 20 minutes which shows the
absence of any formaldehyde in the samples.
3.4.10 Interaction effects of independent variables on sugar recovery of canola meal
The interaction effects of independent variables on sugar recovery of canola meal are
given in Table 3.7. Temperature and combined interaction of temperature and screw
speed had a significant effect (p<0.05) on the glucose recovery of CP canola meal. A
significant effect (p<0.05) on glucose recovery was observed for temperature, screw
speed and combined interaction of temperature and screw speed in case of extrusion of
ASE canola meal. The galactose recovery of CP and ASE canola meal was significantly
(p<0.05) effected by the temperature, combined interaction of temperature and screw
speed. Temperature, screw speed and combined interaction of temperature and screw
speed had a significant effect (p<0.05) on the arabinose recovery of CP and ASE canola
meal.
3.4.11 Extruder processing parameters optimization
For CP canola meal extrudates, the optimized extruder conditions obtained using the
design of expert 8 were temperature of 80°C and screw speed of 150 rpm and a
desirability of 0.955. The maximum sugar recovery obtained was 15.83%. For ASE
canola meal extrudates, the optimized extruder conditions obtained were temperature of
180°C and screw speed of 50 rpm. The desirability obtained was 0.637 which is due to
the reason that there was not much variation in the values of total sugar recovery for
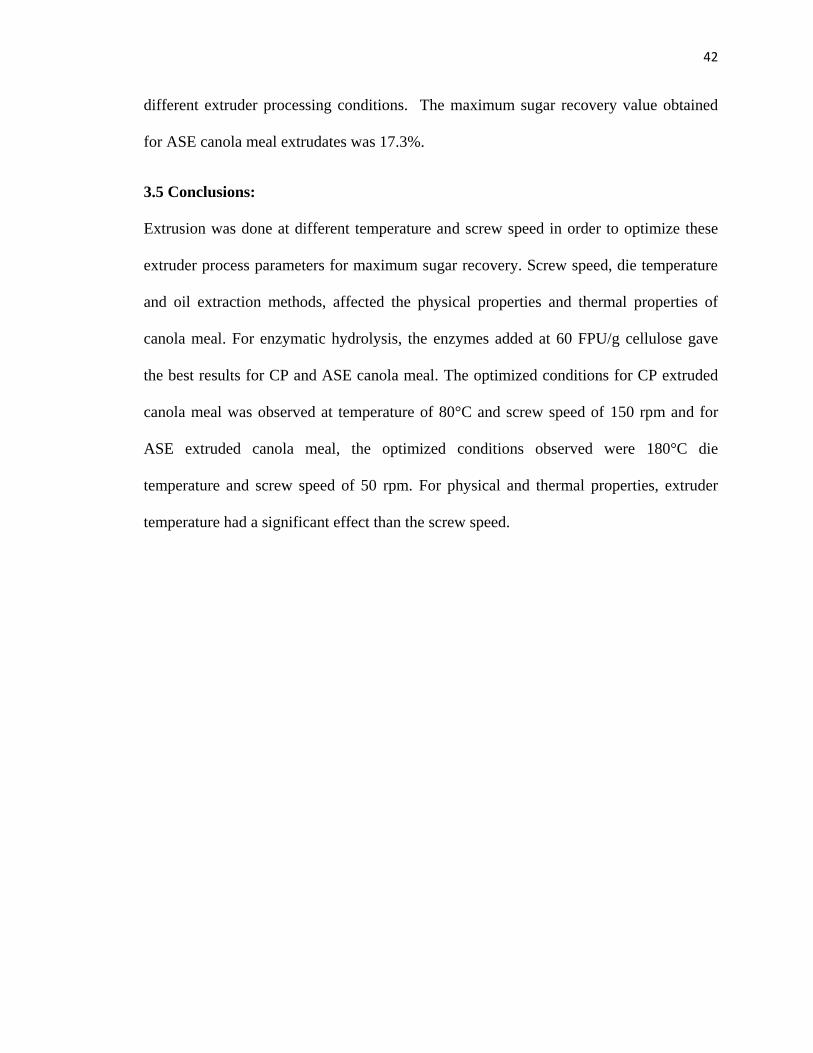
42
different extruder processing conditions. The maximum sugar recovery value obtained
for ASE canola meal extrudates was 17.3%.
3.5 Conclusions:
Extrusion was done at different temperature and screw speed in order to optimize these
extruder process parameters for maximum sugar recovery. Screw speed, die temperature
and oil extraction methods, affected the physical properties and thermal properties of
canola meal. For enzymatic hydrolysis, the enzymes added at 60 FPU/g cellulose gave
the best results for CP and ASE canola meal. The optimized conditions for CP extruded
canola meal was observed at temperature of 80°C and screw speed of 150 rpm and for
ASE extruded canola meal, the optimized conditions observed were 180°C die
temperature and screw speed of 50 rpm. For physical and thermal properties, extruder
temperature had a significant effect than the screw speed.
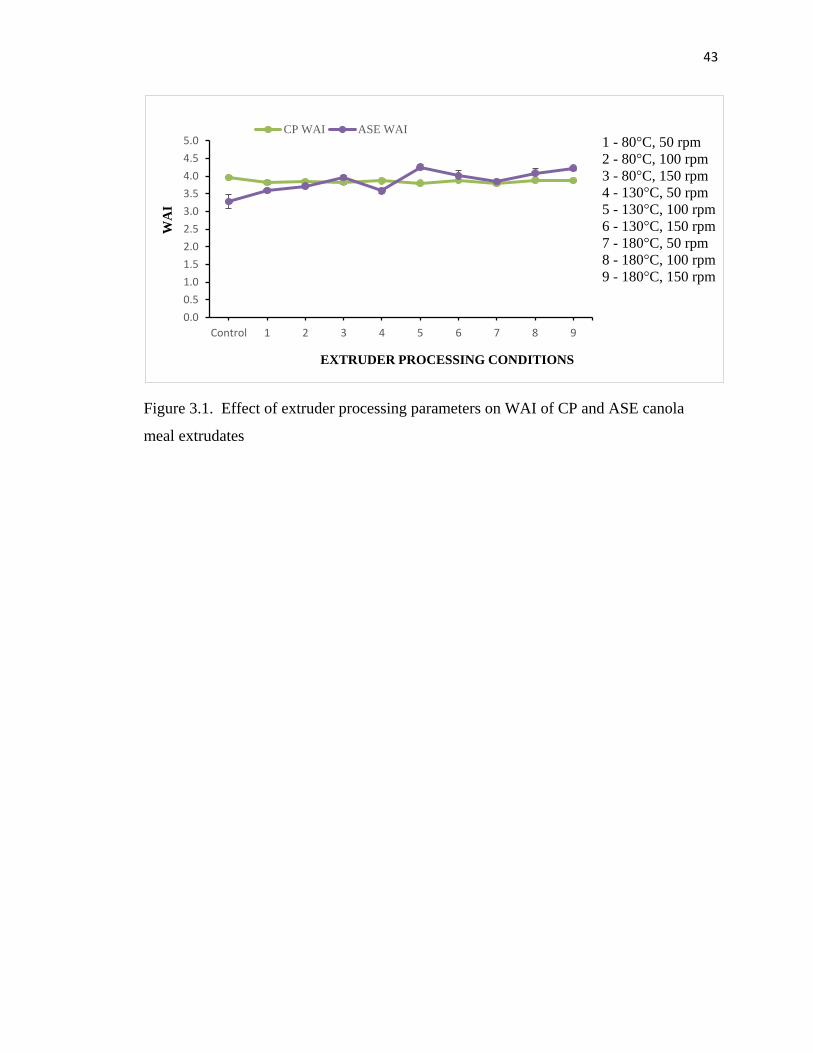
43
Figure 3.1. Effect of extruder processing parameters on WAI of CP and ASE canola
meal extrudates
0.0
0.5
1.0
1.5
2.0
2.5
3.0
3.5
4.0
4.5
5.0
Control 1 2 3 4 5 6 7 8 9
WA
I
EXTRUDER PROCESSING CONDITIONS
CP WAI ASE WAI
1 - 80°C, 50 rpm
2 - 80°C, 100 rpm
3 - 80°C, 150 rpm
4 - 130°C, 50 rpm
5 - 130°C, 100 rpm
6 - 130°C, 150 rpm
7 - 180°C, 50 rpm
8 - 180°C, 100 rpm
9 - 180°C, 150 rpm
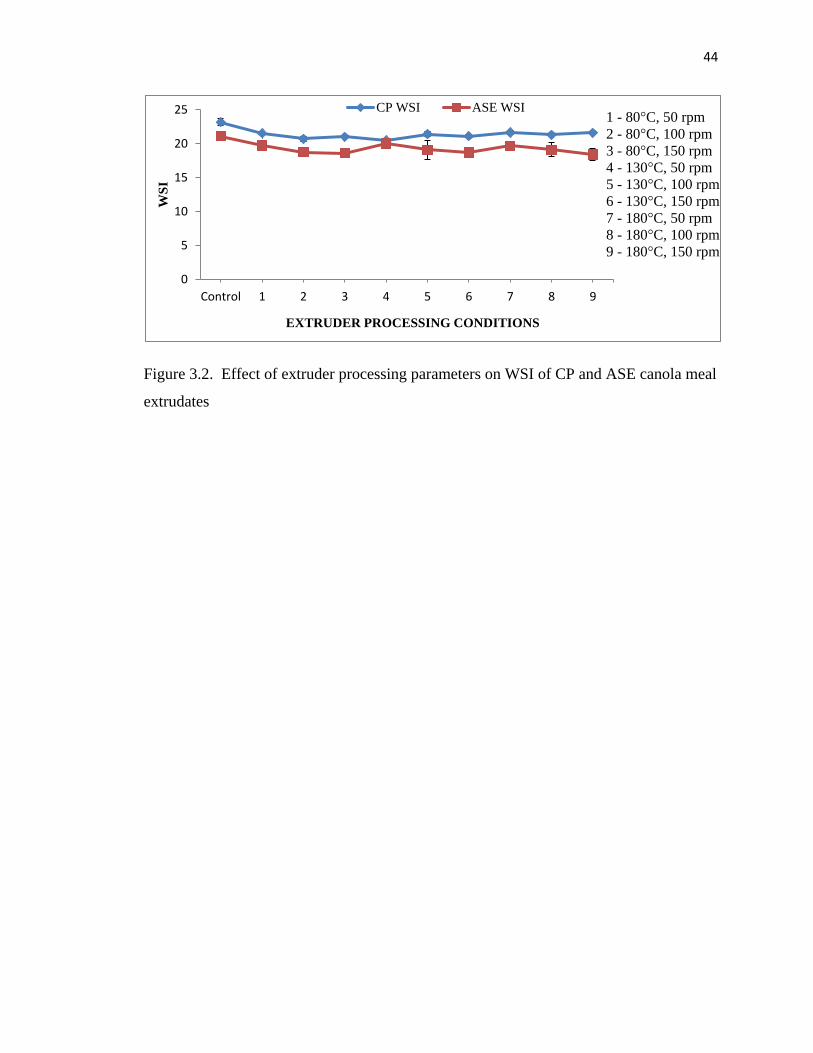
44
Figure 3.2. Effect of extruder processing parameters on WSI of CP and ASE canola meal
extrudates
0
5
10
15
20
25
Control 1 2 3 4 5 6 7 8 9
WS
I
EXTRUDER PROCESSING CONDITIONS
CP WSI ASE WSI1 - 80°C, 50 rpm
2 - 80°C, 100 rpm
3 - 80°C, 150 rpm
4 - 130°C, 50 rpm
5 - 130°C, 100 rpm
6 - 130°C, 150 rpm
7 - 180°C, 50 rpm
8 - 180°C, 100 rpm
9 - 180°C, 150 rpm
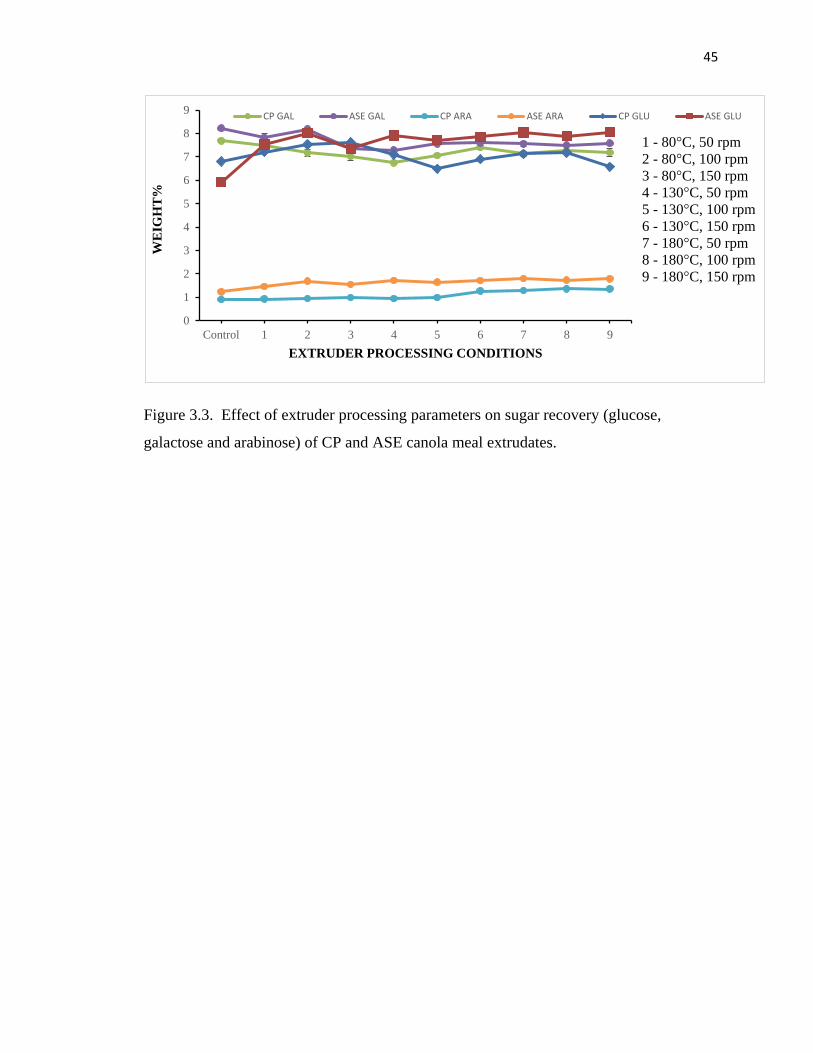
45
Figure 3.3. Effect of extruder processing parameters on sugar recovery (glucose,
galactose and arabinose) of CP and ASE canola meal extrudates.
0
1
2
3
4
5
6
7
8
9
Control 1 2 3 4 5 6 7 8 9
WE
IGH
T%
EXTRUDER PROCESSING CONDITIONS
CP GAL ASE GAL CP ARA ASE ARA CP GLU ASE GLU
1 - 80°C, 50 rpm
2 - 80°C, 100 rpm
3 - 80°C, 150 rpm
4 - 130°C, 50 rpm
5 - 130°C, 100 rpm
6 - 130°C, 150 rpm
7 - 180°C, 50 rpm
8 - 180°C, 100 rpm
9 - 180°C, 150 rpm
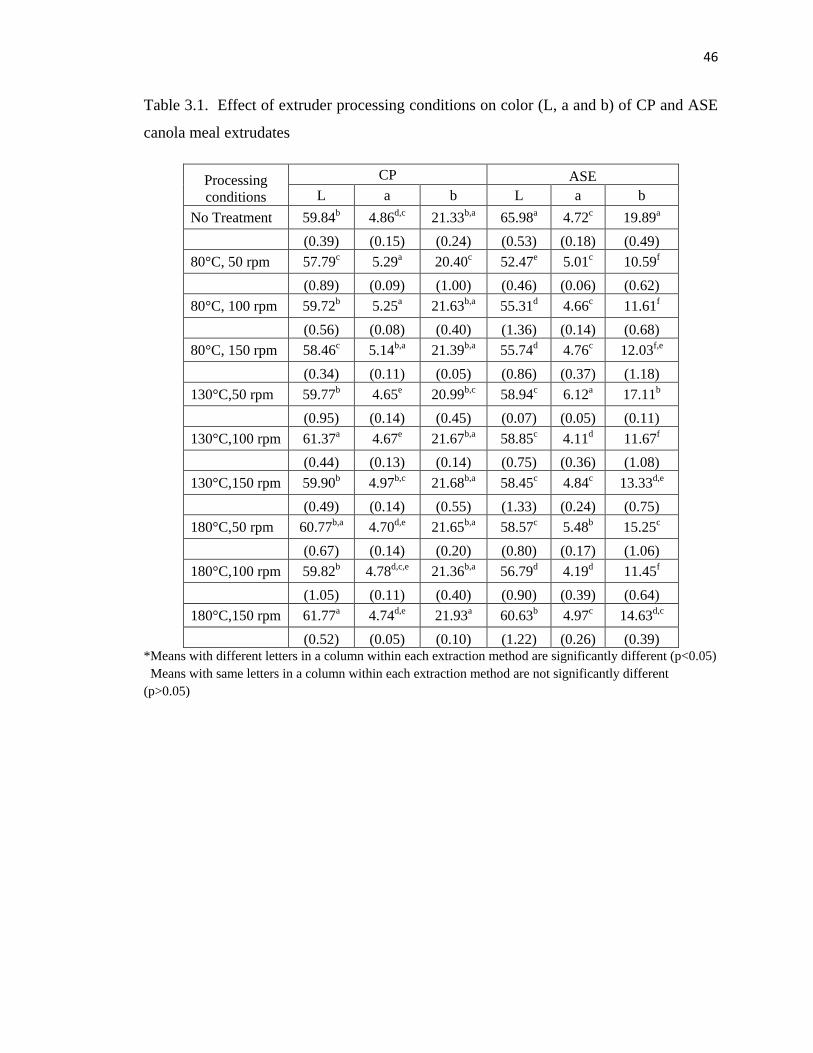
46
Table 3.1. Effect of extruder processing conditions on color (L, a and b) of CP and ASE
canola meal extrudates
Processing
conditions
CP ASE
L a b L a b
No Treatment 59.84b 4.86d,c 21.33b,a 65.98a 4.72c 19.89a
(0.39) (0.15) (0.24) (0.53) (0.18) (0.49)
80°C, 50 rpm 57.79c 5.29a 20.40c 52.47e 5.01c 10.59f
(0.89) (0.09) (1.00) (0.46) (0.06) (0.62)
80°C, 100 rpm 59.72b 5.25a 21.63b,a 55.31d 4.66c 11.61f
(0.56) (0.08) (0.40) (1.36) (0.14) (0.68)
80°C, 150 rpm 58.46c 5.14b,a 21.39b,a 55.74d 4.76c 12.03f,e
(0.34) (0.11) (0.05) (0.86) (0.37) (1.18)
130°C,50 rpm 59.77b 4.65e 20.99b,c 58.94c 6.12a 17.11b
(0.95) (0.14) (0.45) (0.07) (0.05) (0.11)
130°C,100 rpm 61.37a 4.67e 21.67b,a 58.85c 4.11d 11.67f
(0.44) (0.13) (0.14) (0.75) (0.36) (1.08)
130°C,150 rpm 59.90b 4.97b,c 21.68b,a 58.45c 4.84c 13.33d,e
(0.49) (0.14) (0.55) (1.33) (0.24) (0.75)
180°C,50 rpm 60.77b,a 4.70d,e 21.65b,a 58.57c 5.48b 15.25c
(0.67) (0.14) (0.20) (0.80) (0.17) (1.06)
180°C,100 rpm 59.82b 4.78d,c,e 21.36b,a 56.79d 4.19d 11.45f
(1.05) (0.11) (0.40) (0.90) (0.39) (0.64)
180°C,150 rpm 61.77a 4.74d,e 21.93a 60.63b 4.97c 14.63d,c
(0.52) (0.05) (0.10) (1.22) (0.26) (0.39) *Means with different letters in a column within each extraction method are significantly different (p<0.05)
Means with same letters in a column within each extraction method are not significantly different
(p>0.05)
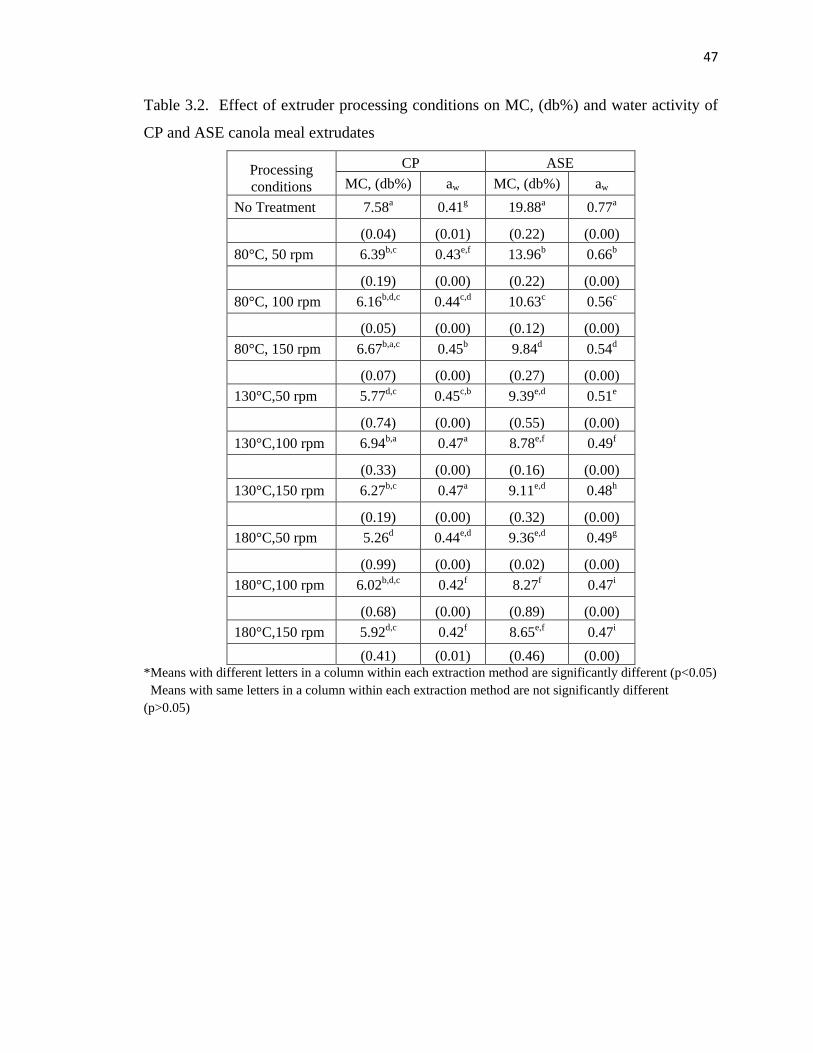
47
Table 3.2. Effect of extruder processing conditions on MC, (db%) and water activity of
CP and ASE canola meal extrudates
Processing
conditions
CP ASE
MC, (db%) aw MC, (db%) aw
No Treatment 7.58a 0.41g 19.88a 0.77a
(0.04) (0.01) (0.22) (0.00)
80°C, 50 rpm 6.39b,c 0.43e,f 13.96b 0.66b
(0.19) (0.00) (0.22) (0.00)
80°C, 100 rpm 6.16b,d,c 0.44c,d 10.63c 0.56c
(0.05) (0.00) (0.12) (0.00)
80°C, 150 rpm 6.67b,a,c 0.45b 9.84d 0.54d
(0.07) (0.00) (0.27) (0.00)
130°C,50 rpm 5.77d,c 0.45c,b 9.39e,d 0.51e
(0.74) (0.00) (0.55) (0.00)
130°C,100 rpm 6.94b,a 0.47a 8.78e,f 0.49f
(0.33) (0.00) (0.16) (0.00)
130°C,150 rpm 6.27b,c 0.47a 9.11e,d 0.48h
(0.19) (0.00) (0.32) (0.00)
180°C,50 rpm 5.26d 0.44e,d 9.36e,d 0.49g
(0.99) (0.00) (0.02) (0.00)
180°C,100 rpm 6.02b,d,c 0.42f 8.27f 0.47i
(0.68) (0.00) (0.89) (0.00)
180°C,150 rpm 5.92d,c 0.42f 8.65e,f 0.47i
(0.41) (0.01) (0.46) (0.00) *Means with different letters in a column within each extraction method are significantly different (p<0.05)
Means with same letters in a column within each extraction method are not significantly different
(p>0.05)
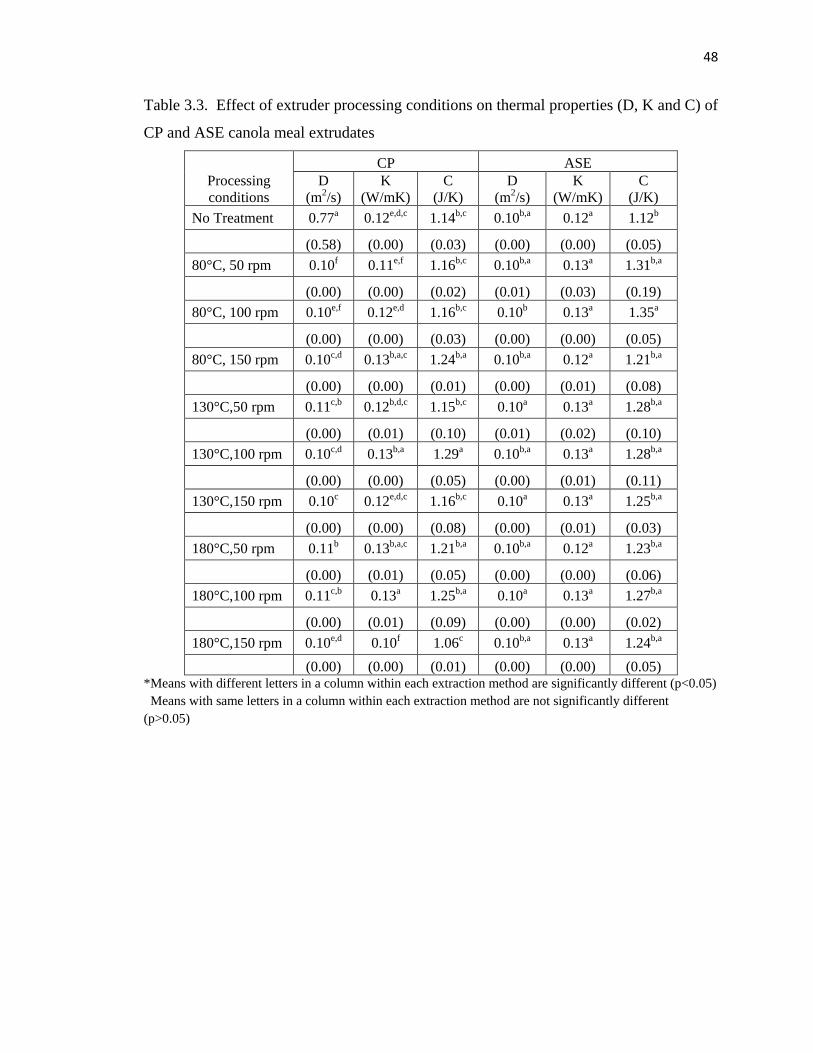
48
Table 3.3. Effect of extruder processing conditions on thermal properties (D, K and C) of
CP and ASE canola meal extrudates
Processing
conditions
CP ASE
D
(m2/s)
K
(W/mK)
C
(J/K)
D
(m2/s)
K
(W/mK)
C
(J/K)
No Treatment 0.77a 0.12e,d,c 1.14b,c 0.10b,a 0.12a 1.12b
(0.58) (0.00) (0.03) (0.00) (0.00) (0.05)
80°C, 50 rpm 0.10f 0.11e,f 1.16b,c 0.10b,a 0.13a 1.31b,a
(0.00) (0.00) (0.02) (0.01) (0.03) (0.19)
80°C, 100 rpm 0.10e,f 0.12e,d 1.16b,c 0.10b 0.13a 1.35a
(0.00) (0.00) (0.03) (0.00) (0.00) (0.05)
80°C, 150 rpm 0.10c,d 0.13b,a,c 1.24b,a 0.10b,a 0.12a 1.21b,a
(0.00) (0.00) (0.01) (0.00) (0.01) (0.08)
130°C,50 rpm 0.11c,b 0.12b,d,c 1.15b,c 0.10a 0.13a 1.28b,a
(0.00) (0.01) (0.10) (0.01) (0.02) (0.10)
130°C,100 rpm 0.10c,d 0.13b,a 1.29a 0.10b,a 0.13a 1.28b,a
(0.00) (0.00) (0.05) (0.00) (0.01) (0.11)
130°C,150 rpm 0.10c 0.12e,d,c 1.16b,c 0.10a 0.13a 1.25b,a
(0.00) (0.00) (0.08) (0.00) (0.01) (0.03)
180°C,50 rpm 0.11b 0.13b,a,c 1.21b,a 0.10b,a 0.12a 1.23b,a
(0.00) (0.01) (0.05) (0.00) (0.00) (0.06)
180°C,100 rpm 0.11c,b 0.13a 1.25b,a 0.10a 0.13a 1.27b,a
(0.00) (0.01) (0.09) (0.00) (0.00) (0.02)
180°C,150 rpm 0.10e,d 0.10f 1.06c 0.10b,a 0.13a 1.24b,a
(0.00) (0.00) (0.01) (0.00) (0.00) (0.05) *Means with different letters in a column within each extraction method are significantly different (p<0.05)
Means with same letters in a column within each extraction method are not significantly different
(p>0.05)
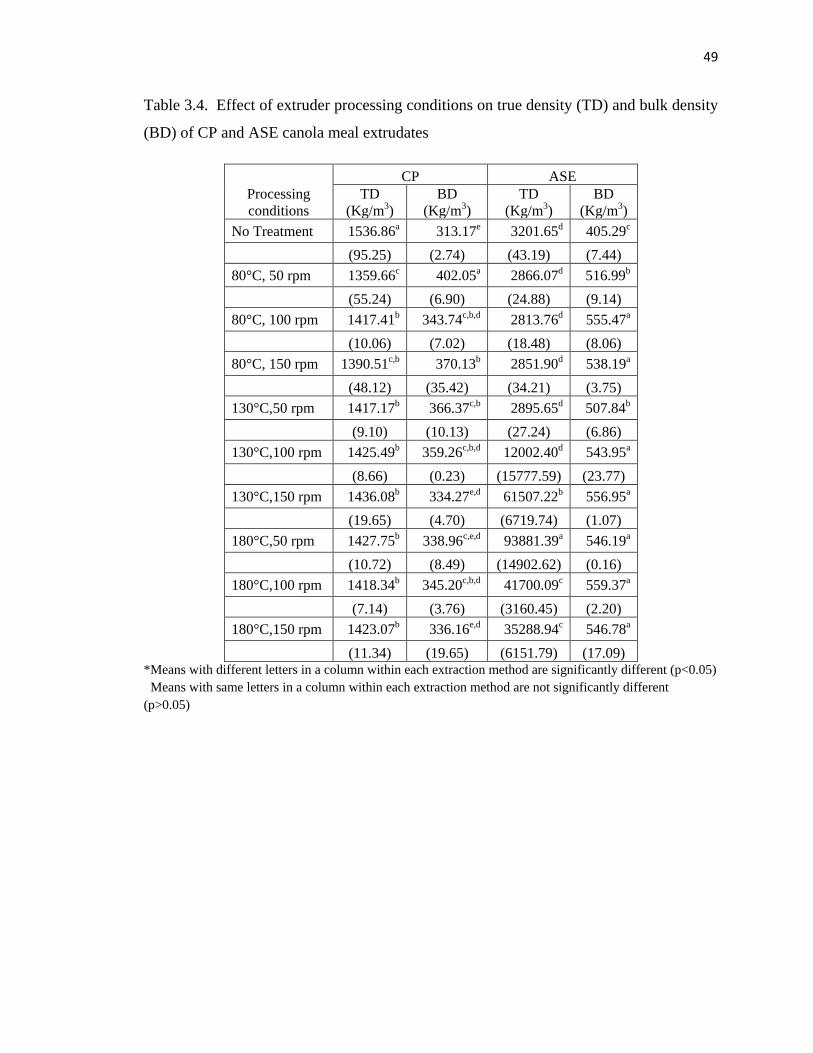
49
Table 3.4. Effect of extruder processing conditions on true density (TD) and bulk density
(BD) of CP and ASE canola meal extrudates
Processing
conditions
CP ASE
TD
(Kg/m3)
BD
(Kg/m3)
TD
(Kg/m3)
BD
(Kg/m3)
No Treatment 1536.86a 313.17e 3201.65d 405.29c
(95.25) (2.74) (43.19) (7.44)
80°C, 50 rpm 1359.66c 402.05a 2866.07d 516.99b
(55.24) (6.90) (24.88) (9.14)
80°C, 100 rpm 1417.41b 343.74c,b,d 2813.76d 555.47a
(10.06) (7.02) (18.48) (8.06)
80°C, 150 rpm 1390.51c,b 370.13b 2851.90d 538.19a
(48.12) (35.42) (34.21) (3.75)
130°C,50 rpm 1417.17b 366.37c,b 2895.65d 507.84b
(9.10) (10.13) (27.24) (6.86)
130°C,100 rpm 1425.49b 359.26c,b,d 12002.40d 543.95a
(8.66) (0.23) (15777.59) (23.77)
130°C,150 rpm 1436.08b 334.27e,d 61507.22b 556.95a
(19.65) (4.70) (6719.74) (1.07)
180°C,50 rpm 1427.75b 338.96c,e,d 93881.39a 546.19a
(10.72) (8.49) (14902.62) (0.16)
180°C,100 rpm 1418.34b 345.20c,b,d 41700.09c 559.37a
(7.14) (3.76) (3160.45) (2.20)
180°C,150 rpm 1423.07b 336.16e,d 35288.94c 546.78a
(11.34) (19.65) (6151.79) (17.09) *Means with different letters in a column within each extraction method are significantly different (p<0.05)
Means with same letters in a column within each extraction method are not significantly different
(p>0.05)
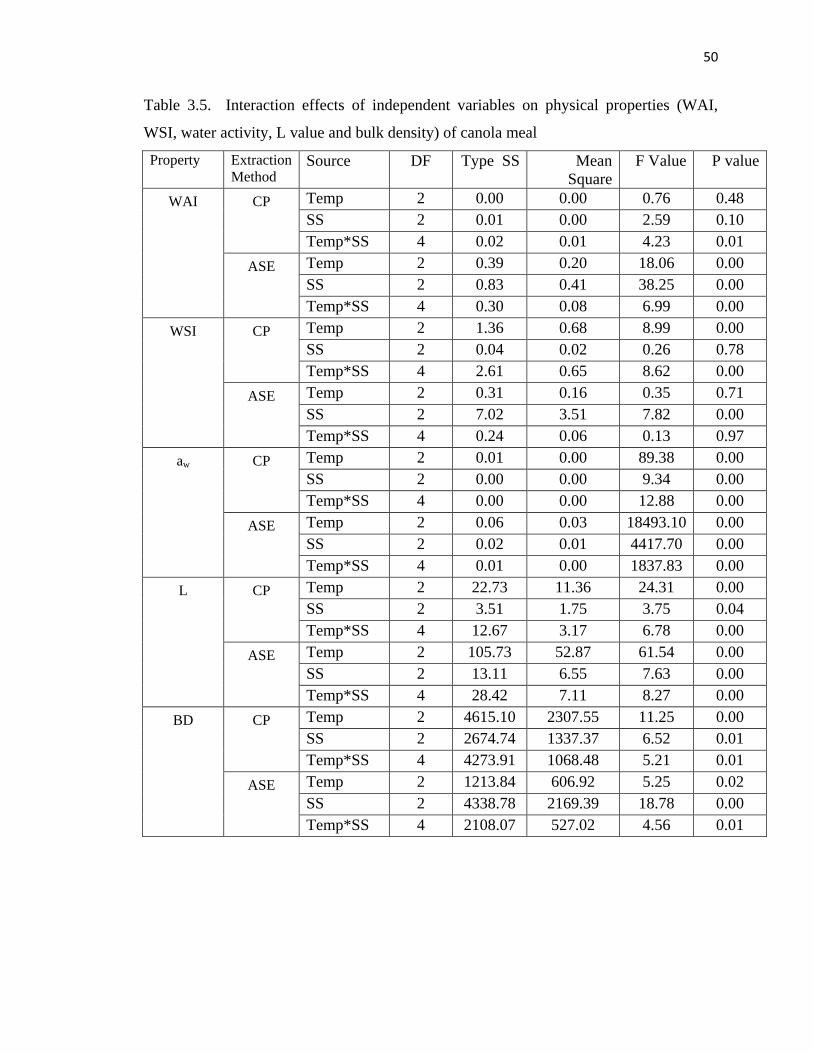
50
Table 3.5. Interaction effects of independent variables on physical properties (WAI,
WSI, water activity, L value and bulk density) of canola meal
Property Extraction
Method Source DF Type SS Mean
Square
F Value P value
WAI CP Temp 2 0.00 0.00 0.76 0.48
SS 2 0.01 0.00 2.59 0.10
Temp*SS 4 0.02 0.01 4.23 0.01
ASE Temp 2 0.39 0.20 18.06 0.00
SS 2 0.83 0.41 38.25 0.00
Temp*SS 4 0.30 0.08 6.99 0.00
WSI CP Temp 2 1.36 0.68 8.99 0.00
SS 2 0.04 0.02 0.26 0.78
Temp*SS 4 2.61 0.65 8.62 0.00
ASE Temp 2 0.31 0.16 0.35 0.71
SS 2 7.02 3.51 7.82 0.00
Temp*SS 4 0.24 0.06 0.13 0.97
aw CP Temp 2 0.01 0.00 89.38 0.00
SS 2 0.00 0.00 9.34 0.00
Temp*SS 4 0.00 0.00 12.88 0.00
ASE Temp 2 0.06 0.03 18493.10 0.00
SS 2 0.02 0.01 4417.70 0.00
Temp*SS 4 0.01 0.00 1837.83 0.00
L CP Temp 2 22.73 11.36 24.31 0.00
SS 2 3.51 1.75 3.75 0.04
Temp*SS 4 12.67 3.17 6.78 0.00
ASE Temp 2 105.73 52.87 61.54 0.00
SS 2 13.11 6.55 7.63 0.00
Temp*SS 4 28.42 7.11 8.27 0.00
BD CP Temp 2 4615.10 2307.55 11.25 0.00
SS 2 2674.74 1337.37 6.52 0.01
Temp*SS 4 4273.91 1068.48 5.21 0.01
ASE Temp 2 1213.84 606.92 5.25 0.02
SS 2 4338.78 2169.39 18.78 0.00
Temp*SS 4 2108.07 527.02 4.56 0.01
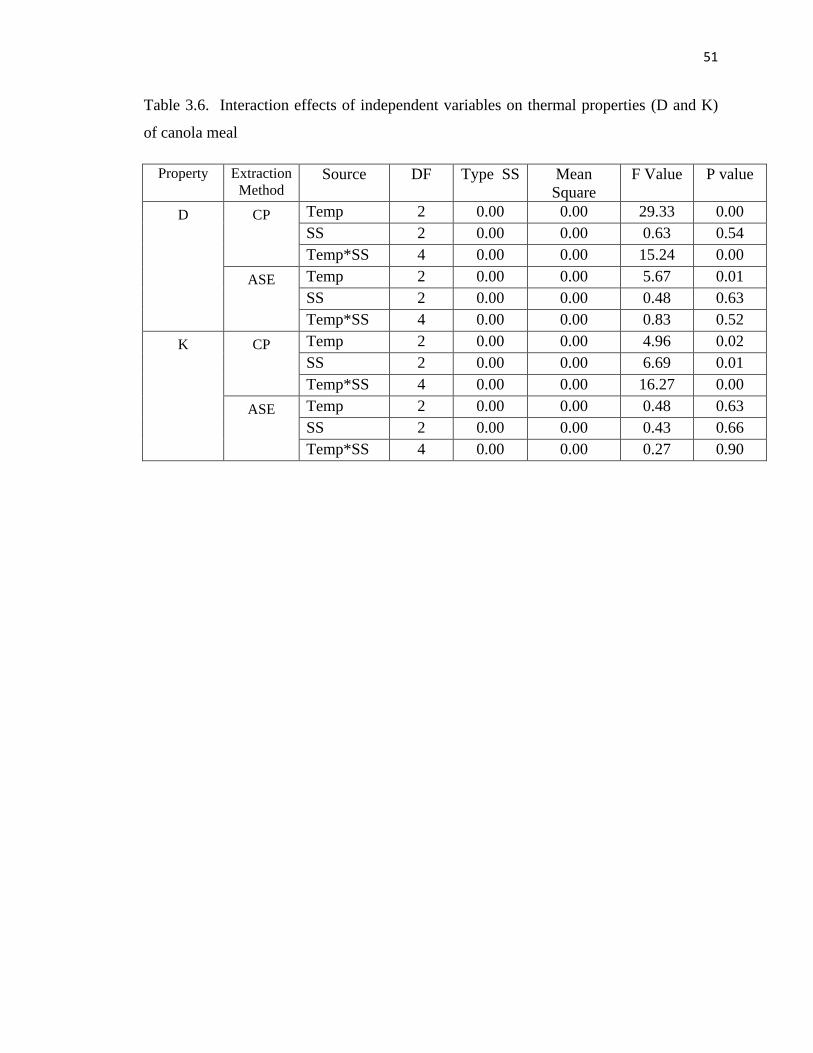
51
Table 3.6. Interaction effects of independent variables on thermal properties (D and K)
of canola meal
Property Extraction
Method Source DF Type SS Mean
Square
F Value P value
D CP Temp 2 0.00 0.00 29.33 0.00
SS 2 0.00 0.00 0.63 0.54
Temp*SS 4 0.00 0.00 15.24 0.00
ASE Temp 2 0.00 0.00 5.67 0.01
SS 2 0.00 0.00 0.48 0.63
Temp*SS 4 0.00 0.00 0.83 0.52
K CP Temp 2 0.00 0.00 4.96 0.02
SS 2 0.00 0.00 6.69 0.01
Temp*SS 4 0.00 0.00 16.27 0.00
ASE Temp 2 0.00 0.00 0.48 0.63
SS 2 0.00 0.00 0.43 0.66
Temp*SS 4 0.00 0.00 0.27 0.90
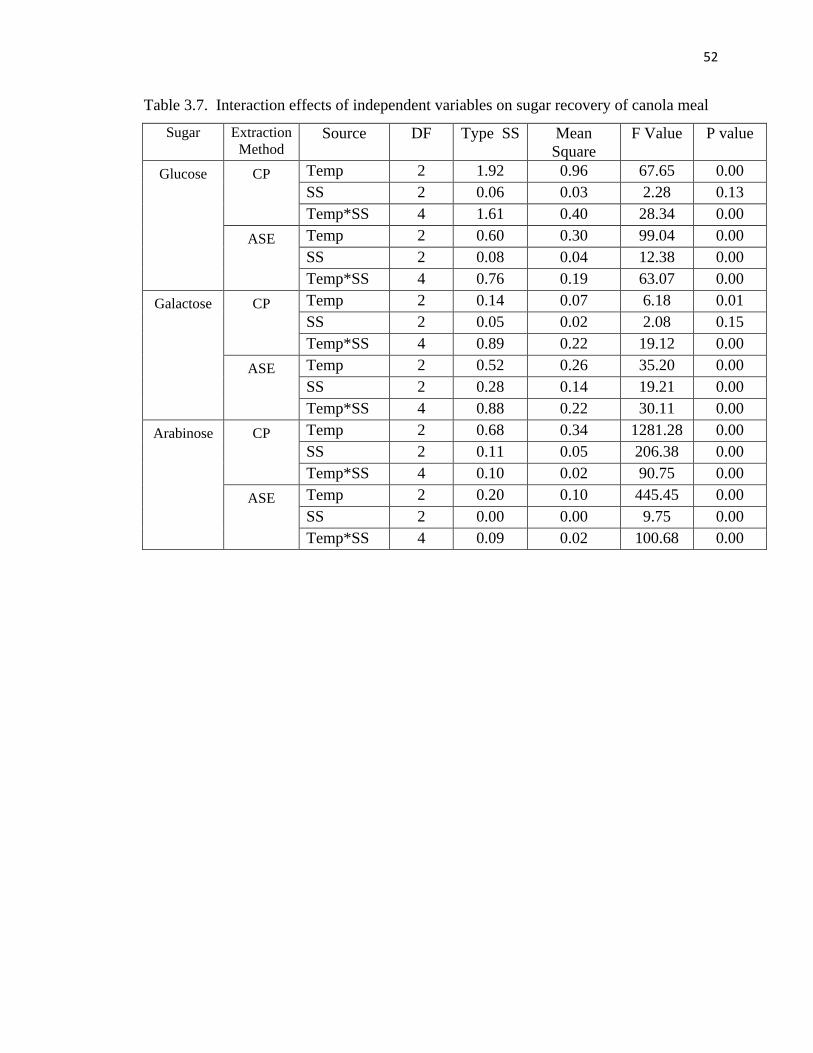
52
Table 3.7. Interaction effects of independent variables on sugar recovery of canola meal
Sugar Extraction
Method Source DF Type SS Mean
Square
F Value P value
Glucose CP Temp 2 1.92 0.96 67.65 0.00
SS 2 0.06 0.03 2.28 0.13
Temp*SS 4 1.61 0.40 28.34 0.00
ASE Temp 2 0.60 0.30 99.04 0.00
SS 2 0.08 0.04 12.38 0.00
Temp*SS 4 0.76 0.19 63.07 0.00
Galactose CP Temp 2 0.14 0.07 6.18 0.01
SS 2 0.05 0.02 2.08 0.15
Temp*SS 4 0.89 0.22 19.12 0.00
ASE Temp 2 0.52 0.26 35.20 0.00
SS 2 0.28 0.14 19.21 0.00
Temp*SS 4 0.88 0.22 30.11 0.00
Arabinose CP Temp 2 0.68 0.34 1281.28 0.00
SS 2 0.11 0.05 206.38 0.00
Temp*SS 4 0.10 0.02 90.75 0.00
ASE Temp 2 0.20 0.10 445.45 0.00
SS 2 0.00 0.00 9.75 0.00
Temp*SS 4 0.09 0.02 100.68 0.00
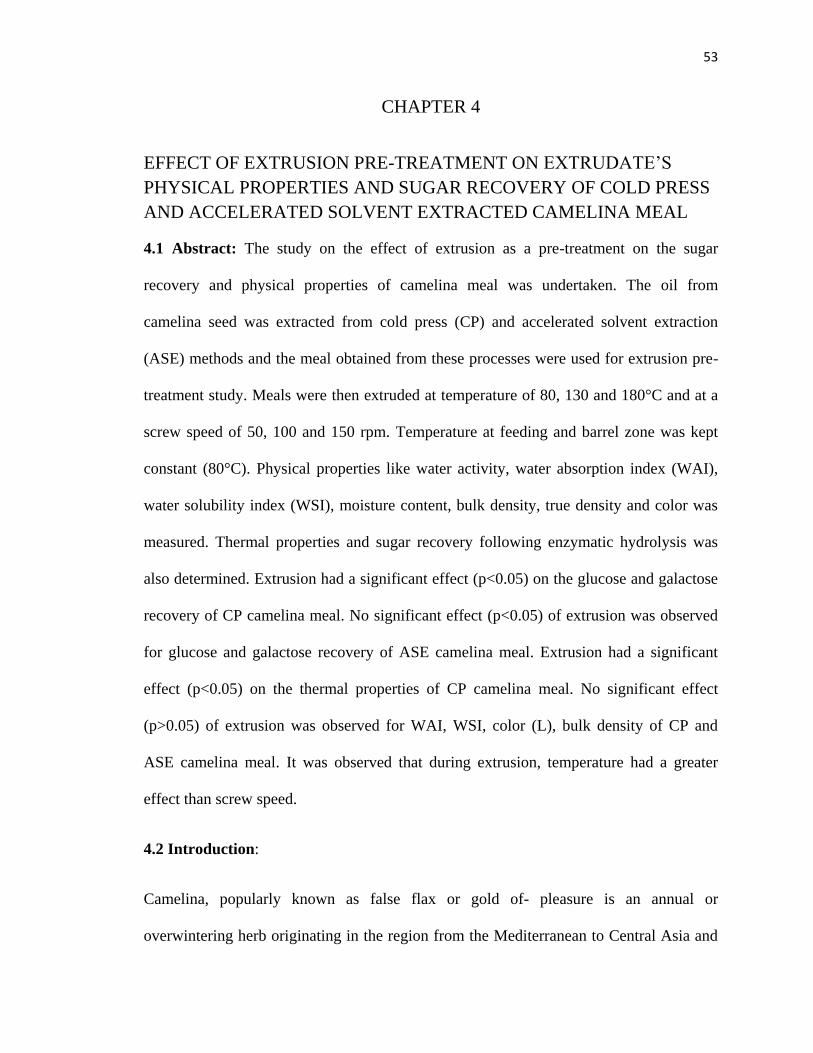
53
CHAPTER 4
EFFECT OF EXTRUSION PRE-TREATMENT ON EXTRUDATE’S
PHYSICAL PROPERTIES AND SUGAR RECOVERY OF COLD PRESS
AND ACCELERATED SOLVENT EXTRACTED CAMELINA MEAL
4.1 Abstract: The study on the effect of extrusion as a pre-treatment on the sugar
recovery and physical properties of camelina meal was undertaken. The oil from
camelina seed was extracted from cold press (CP) and accelerated solvent extraction
(ASE) methods and the meal obtained from these processes were used for extrusion pre-
treatment study. Meals were then extruded at temperature of 80, 130 and 180°C and at a
screw speed of 50, 100 and 150 rpm. Temperature at feeding and barrel zone was kept
constant (80°C). Physical properties like water activity, water absorption index (WAI),
water solubility index (WSI), moisture content, bulk density, true density and color was
measured. Thermal properties and sugar recovery following enzymatic hydrolysis was
also determined. Extrusion had a significant effect (p<0.05) on the glucose and galactose
recovery of CP camelina meal. No significant effect (p<0.05) of extrusion was observed
for glucose and galactose recovery of ASE camelina meal. Extrusion had a significant
effect (p<0.05) on the thermal properties of CP camelina meal. No significant effect
(p>0.05) of extrusion was observed for WAI, WSI, color (L), bulk density of CP and
ASE camelina meal. It was observed that during extrusion, temperature had a greater
effect than screw speed.
4.2 Introduction:
Camelina, popularly known as false flax or gold of- pleasure is an annual or
overwintering herb originating in the region from the Mediterranean to Central Asia and
54
is very adaptable to climate and soil type (Putnam et al.,1993). It presents a similar fatty
acid profile to flaxseed and is rich in linolenic acid. The protein-rich cold pressed cake is
also a valuable livestock food. This oilseed meal still contains 10% oil, 13% fiber, 5%
minerals, and 45% protein (Bonjean and Le Goffic, 1999; Hurtaud and Payraud 2007).
Camelina has several positive agronomic attributes: low agricultural inputs, cold-weather
tolerance, short growing season (85–100 days), compatibility with existing farm
equipment, and grows well in semiarid regions and in low-fertility or saline soils. These
qualities are unusual for an oilseed crop (Putnam et al., 1993; Retka-Schill, 2008b;
Sawyer, 2008). Moreover, camelina, unlike soybean, thrives in cool, arid climates and is
nicely adapted to the more northern regions of North America, Europe, and Asia. As
such, it may serve as a rotational crop for winter, which would facilitate disrupting
undesirable weed and pest cycles (Retka-Schill, 2008b). Camelina yields an average of
420–640 L of oil/ha and the protein and fiber content in its meal byproduct is comparable
to that of soybean meal (Retka-Schill, 2008b; Sawyer, 2008). Camelina has traditionally
been used for relatively high value products such as culinary oil, cosmetics, and animal
feed (Sawyer, 2008).
Because of consumers’ desire for natural and safe food products, the cold-pressing
procedure is becoming an interesting substitute for conventional practices as it involves
neither heat nor chemical treatments (Parker et al., 2003). Cold pressing is simple,
ecological and does not require much energy. Low productivity and difficulties in
obtaining a product of constant quality are some of the disadvantage of this process
(Rotkiewicz et al., 1999). Accelerated solvent extraction (ASE) technique uses pressure
and temperature to extract oil (Ezzell, et al., 1995). Some of the advantages are greatly
55
reducing extraction time and solvent consumption. Automation or semi-automation can
be achieved to extract analytes from different matrices. Static or dynamic extractions can
be performed separately or in combination (Ezzell, et al., 1995).
A viable continuous pretreatment method might be found through extrusion. When the
feed material passes through the extruder barrel, physico-chemical changes occur to the
blend due to high shear, rapid mixing, heating, and so on. A few advantages of extruder
are moderate temperature, short residence time, high shear, rapid heat transfer, ability to
add or remove chemical or material during extrusion-all in a continuous process; no
further conditioning is required as in acid or alkali pretreatment. Extrusion pretreatment
studies (Dale et al., 1999; de Vrije et al., 2002; Karunanithy et al., 2008a-c; Lee et al.,
2009; Jurusic et al., 2009) shows that sugar recovery significantly improved from
different biomasses such as corn stover, miscanthus, switchgrass, big bluestem, prairie
cord grass and Douglas fir wood. Extrusion pretreatment has also been studied for soya
white flakes and soyabean hulls (Karuppuchamy and Muthukumarappan, 2009). In this
work, extrusion is used as a pre-treatment to investigate how it affects the camelina meal.
The large availability and low cost make oilseed meals attractive raw materials,
especially the proteins and carbohydrates, for various applications. Efforts have been
made to utilize the co- products for various applications. In this research camelina meal
has been extracted by cold press and accelerated solvent extraction and the effect of
extrusion as a pre-treatment has been studied on the sugar recovery of these meals.
Enzymatic hydrolysis of CP and ASE camelina meal was done in order to convert the
polysaccharides to monosaccharides. The sugars are desired in the form of
56
monosaccharides so that they are easily accessible by the particular micro-organisms
during fermentation to convert them into protein. This converted protein then can be fed
to the fish as a feed. This study will give an insight view for the efforts that has been
made to replace the fish meal by the oilseed meals.
4.2.1 Objectives:
1. Optimize the extruder parameters to predict the maximum sugar recovery in CP
and ASE camelina meal
2. Optimize the enzyme dosage for maximum sugar recovery in CP and ASE
camelina meal
3. Determine the physical properties, thermal properties and sugar recovery of CP
and ASE camelina meal
4.3 Materials and methods:
4.3.1 Sample preparation:
The camelina seeds were obtained from consumer supply distributing Co. (Oregon). The
oil was extracted from the seeds using two methods: cold press extraction and accelerated
solvent extraction. The cold press extraction (M70 oil press co.) consisting VFD motor
(2HP, 1.5KW) was done at a temperature of 90°C, frequency of 20 Hz and die size of
0.22 inches. ASE was done at a time-temperature combination of 100°C/90 min. The
solvent used was Hexane. approximately 1.5 Kg of meal was produced from two
different oil extraction methods in order to compare the effect of different oil extraction
methods on the sugar recovery and physical properties of camelina meal.
4.3.2 Extrusion pre-treatment:
57
The CP and ASE camelina meal samples prepared were extruded using single screw
extruder (Brabender Plasti-Corder, Model PL2000, South Hackensack, NJ) which was
powered by a 7.5HP motor with an operating range of screw speeds from 0-210 rpms (0-
22rad/sec). The extruder had a barrel with length to diameter ratio of 20:1 and a barrel
diameter of 19 mm. The extrusion was done at 3 different temperature and screw speed of
80, 130 and 180°C; 50, 100 and 150 rpm, respectively. In total, 9 combinations were
formed from temperature and screw speed. The extrudates obtained were dried overnight.
Approximately 150g was the sample size used for each combination.
4.3.3 Grinding:
The extruded samples were further grounded using a hammer mill (Speedy Jr, Winona
Attrition Mill Co, MN) to mesh size of 2 mm and then stored in zip lock bags in
refrigerator at 4°C. The samples were ground to a uniform size in order to obtain
effective enzymatic hydrolysis and physical properties of camelina meal.
4.3.4 Moisture content:
Moisture content of the control and extruded (CP and ASE) samples were measured
according to the official methods of analysis (AOAC, 1984) using a laboratory oven
(Thelco Precision, Jovan Inc., Wincester, VA).
4.3.5 Physical properties
Three replications were studied for each property.
4.3.5.1 Water activity:
58
Water activity of the samples was measured by using the AquaLab water activity meter
(4TE, version 10, Decagon Devices, Inc., Pullman WA) where the sample was placed in
a plastic cup of the water activity meter and the lid was closed. After 5 to 10 minutes, the
water activity value of the sample was shown on the screen. For each sample, three
replications were done.
4.3.5.2 Water absorption index (WAI) and Water solubility index (WSI):
2.5 g sample was suspended in 30 ml of distilled water in a tarred 50 ml centrifuge tube.
The centrifuge tube was placed in a laboratory oven (Thelco precision, Jovan Inc.,
Winchester, VA) at 30oC. This was stirred intermittently for a period of 30 min and
centrifuged at 3000 rpm for 10 minutes. The supernatant liquid was transferred into an
aluminum dish, placed in the oven for 2 hr at 135oC (AACC method 44-19, 1995), and
then desiccated for 20 min before weighing the dry solids of the supernatant. The mass of
the remaining gel was weighed, and WAI (-) was calculated as the ratio of gel mass to the
original sample mass. WSI (%), on the other hand was determined as the ratio of mass of
dry solids in the extract to the original sample mass.
4.3.5.3 Bulk density and true density:
Micromeritics Multivolume Pycnometer (No.1305, Micromeritics Instrument
Corporation, Norcross, GA) was used for the measurement of the true density of the
samples. The biomass sample was filled full into an aluminum cup provided together
with the pycnometer and then placed into the pycnometer. The unit works on the basis of
helium gas replacement in the void space of the biomass sample. The values were
measured in the form of P1 when the knob was in the prep position and P2 when the knob
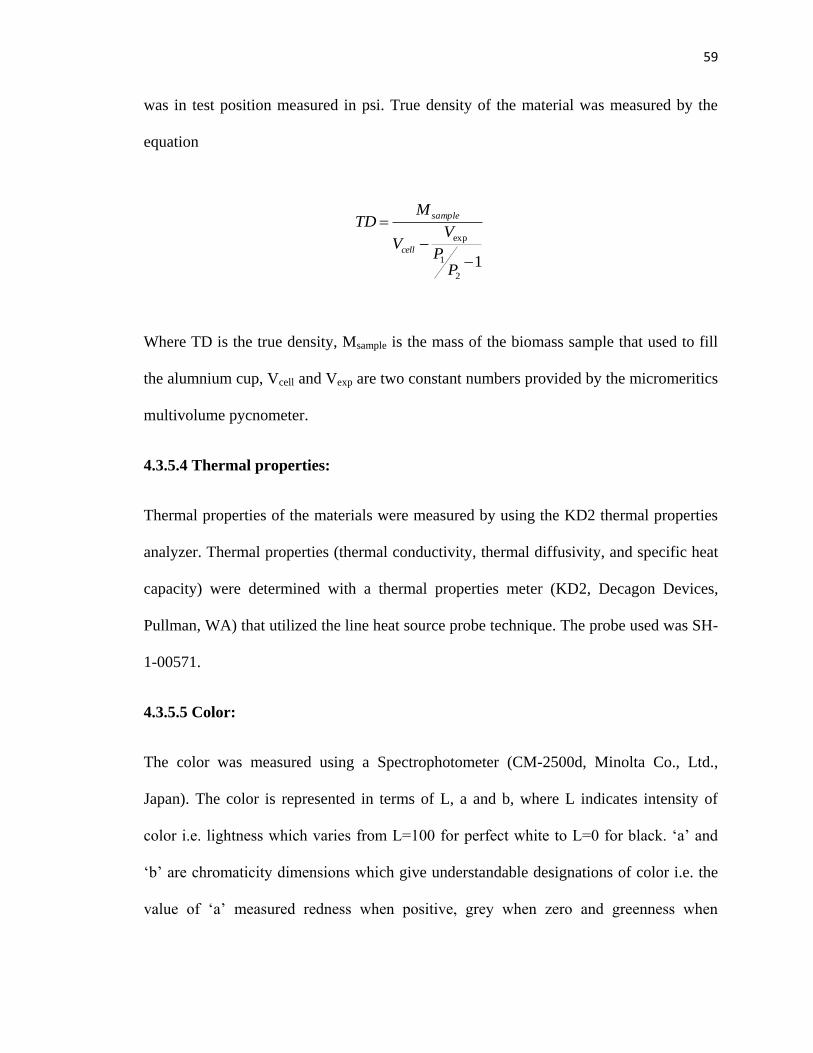
59
was in test position measured in psi. True density of the material was measured by the
equation
Where TD is the true density, Msample is the mass of the biomass sample that used to fill
the alumnium cup, Vcell and Vexp are two constant numbers provided by the micromeritics
multivolume pycnometer.
4.3.5.4 Thermal properties:
Thermal properties of the materials were measured by using the KD2 thermal properties
analyzer. Thermal properties (thermal conductivity, thermal diffusivity, and specific heat
capacity) were determined with a thermal properties meter (KD2, Decagon Devices,
Pullman, WA) that utilized the line heat source probe technique. The probe used was SH-
1-00571.
4.3.5.5 Color:
The color was measured using a Spectrophotometer (CM-2500d, Minolta Co., Ltd.,
Japan). The color is represented in terms of L, a and b, where L indicates intensity of
color i.e. lightness which varies from L=100 for perfect white to L=0 for black. ‘a’ and
‘b’ are chromaticity dimensions which give understandable designations of color i.e. the
value of ‘a’ measured redness when positive, grey when zero and greenness when
12
1
exp
PP
VV
MTD
cell
sample
60
negative and the value of ‘b’ measured yellowness when positive, grey when zero and
blueness when negative.
4.3.6 Enzymatic hydrolysis:
The enzymatic hydrolysis was conducted in a hungate glass tube (Bellco glass, Inc, NJ,
USA) with 0.51g dry weight of pre-treated biomass in a solution of citrate buffer (0.1M,
pH 4.8) and sodium azide (0.02g/l) to inhibit microbial contamination during incubation.
The enzymes, CTec2 and HTec2, added during enzymatic hydrolysis were bought from
Novozymes. The enzyme activity for CTec2 was 128 FPU/ml and for HTec2 was 4465
IU/ml. The enzyme dosage was optimized by adding varying enzyme dosage of 40, 50,
60, 70, 80, 90 and 100 FPU/g cellulose. CTec2 and HTec2 were added in the ratio of 9:1.
Hydrolysis was carried out for 72 hrs at 50°C and 150 rpm. After hydrolysis, the samples
were kept in boiling water for 10 min to inactivate the enzyme action. The supernatant
was centrifuged at 13,000 rpm for 15 min and frozen and thawed. This process was
repeated twice before injecting into the HPLC to remove impurities which contribute to
the pressure increase in the HPLC system. Soluble sugars were quantified using HPLC
(Agilent technologies, Santa Clara, CA; Bio-Rad Aminex 87H column, Hercules, CA)
with a mobile phase of 0.005M H2SO4 at a flow rate of 0.6 ml/min at 65°C and a sample
volume of 20µl as mentioned by Sluiter et al (2006). The sugar concentration obtained
from the chromatogram was divided by the dry weight of biomass of pretreated material
and multiplied by the total volume taken to get the percentage of that compound in the
sample. The percentage was calculated by multiplying the value by 100.
4.3.7 Extruder processing parameters optimization
61
The extruder processing parameters were optimized by using design of expert8 (Version
8.0.7.1) software. General Factorial Design was applied to optimize the temperature and
screw speed for maximum sugar recovery of cold press camelina meal extrudaes and
solvent extracted camelina meal extrudates.
4.3.8 Statistical Analysis
All the collected data were analyzed with SAS v.9 (SAS Institute, Cary, NC). The Proc
GLM procedure was used to determine the main, treatment and interaction effects using a
Type I error rate (α) of 0.05. Post-hoc Duncan Multiple Range Test (DMRT) tests were
used to identify where the significant differences occurred.
4.4 Result and discussion:
4.4.1 Water absorption index (WAI) and Water solubility index (WSI)
The effect of different extruder processing parameters on WAI and WSI is shown in Fig.
4.1 and Fig. 4.2. The WAI and WSI of control ASE camelina meal (17.16%); (18.47%)
are higher than the control CP camelina meal (13.96%); (12.25%). Lower values of WAI
were observed for ASE camelina meal extrudates than the control ASE camelina meal.
No significant effect (p<0.05) of extrusion on WAI of CP and ASE camelina meal
extrudates was observed. Almost similar values of WAI for CP and ASE camelina meal
extrudates were recorded. Several researchers suggested that any change in WAI can be
due to structural modifications of the blend composition, such as starch gelatinization and
protein denaturation (Badrie and Mellowes, 1991; Chevanan et al., 2007a; Rosentrater et
al.,2009a, b). Unlike water absorption index, WSI indicates degradation extent of
macromolecule components of a feed blend, mainly starch and protein molecules
62
(Govindasamy, 1996; Colonna Mercier, 1983). Therefore, WAI is inversely related to
WSI (Anderson et al., 1982). Generally, extrusion processing increases WSI (Menegassi
et al. (2011); Anderson et al., 1982), which occurs due to the combination effects of high
temperature, pressure, and shear forces on starch and protein degradations. The WSI
values of CP camelina meal extrudates were higher than the control value of CP camelina
meal. With increase in extruder temperature, the WSI values increased significantly
(p<0.05). For ASE camelina meal, the extrudates had lower WSI values than the control
ASE camelina meal. The extruder temperature and screw speed had a significant effect
(p<0.05) on the WSI of ASE camelina meal extrudates. The highest and lowest value of
WSI recorded for ASE camelina meal extrudates were 17.37% at 130°C temperature and
150 rpm screw speed and 13.82 at temperature of 80°C and screw speed of 50 rpm.
Almost similar values were observed for control CP camelina meal and CP camelina
meal extrudates. The lower WAI and higher WSI of extrudate with increasing screw
speed might be related to the increased shear rate, resulting in the structural modification
of starch (Diosady et al., 1985). Wen et al., 1990 indicated that screw speed had a direct
effect on polysaccharide size distribution, and a higher screw speed resulted in more
fragmentation than a lower screw speed.
4.4.2 Color
The color of CP and ASE camelina meal extrudates is shown in Table 4.1. The control L
value of ASE camelina meal (73.73) is higher than the CP camelina meal (65.12). There
is no significant effect (p>0.05) of extrusion on the L value, ‘a’ value and ‘b’ value of CP
camelina meal extrudates. Almost similar L, ‘a’ and ‘b’ values were recorded for the
control CP camelina meal and CP camelina meal extrudates. The highest L, a and b value
63
observed for CP camelina meal extrudates was 64.24 at temperature of 80°C and screw
speed of 150 rpm; 6.86 at 180°C temperature and 100 rpm screw speed; 22.26 at 80°C
temperature and 150 rpm screw speed. The L value for ASE camelina meal extrudates
significantly (p<0.05) increased with extrusion. Change in color of extrudates can be an
indication of nutrients degradation during extrusion processing (Bjorck & Asp, 1983).
The extrudates became darker with increase in temperature. This may be due to fact that
the temperature is increasing but the residence time remains same. The control L value
for ASE camelina meal is higher than the ASE camelina meal extrudates, whereas the ‘a’
value for ASE camelina meal extrudates is higher than the control ‘a’ value of ASE
camelina meal. Extrusion had a significant effect (p<0.05) on the ‘a’ value of ASE
camelina meal extrudates. Almost similar values of ‘b’ were observed for ASE camelina
meal extrudates.
4.4.3 MC, (db%) and Water Activity
Table 4.2 represents the water activity and MC, (db%) of CP and ASE camelina meal
extrudates. For ASE camelina meal extrudates, lower MC, (db%) values were observed
as compared to the control ASE camelina meal. As the temperature and screw speed
increased, the MC, (db%) for ASE camelina meal extrudates decreased significantly
(p<0.05).The water activity value for control ASE camelina meal (0.36) was higher than
the control CP camelina meal (0.32). Extrusion had a significant effect (p<0.05) on the
water activity of CP and ASE camelina meal extrudates. As the temperature and screw
speed increased, the water activity values decreased significantly (p<0.05) for CP and
ASE camelina meal extrudates. The highest and lowest water activity value recorded for
CP and ASE camelina meal extrudates were 0.37 at 130°C temperature and 150 rpm
64
screw speed and 0.28 at 180°C temperature and 150 rpm screw speed; 0.25 at
temperature of 80°C and screw speed of 50 rpm and 0.12 at temperature of 180°C and
screw speed of 50 rpm. The ASE camelina meal extrudates had lower water activity than
the CP camelina meal extrudates, this may be due to lower amount of oil content in the
ASE meal and therefore it’s easy to remove the moisture in the bonded form.
4.4.4 Thermal properties
The thermal properties for camelina meal were recorded in terms of thermal diffusivity
(D value), thermal conductivity (K value) and specific heat capacity (C value). D, K and
C values for CP and ASE camelina meal extrudates is shown in Table 4.3. Thermal
properties were measured in terms of thermal diffusivity (D value), thermal conductivity
(K value) and specific heat capacity (C value). Knowledge about the relation between the
thermal properties of both raw ingredient blend and extruded feed allow us to anticipate
the materials thermal behaviors, and thus to improve the feed formulation and control the
process conditions better in order to achieve a high quality product (Blanche and Sun,
2004). Almost similar values of D were observed for the control and extruded samples
(CP and ASE camelina meal). Extrusion had a significant effect (p<0.05) on CP camelina
meal extrudates while no significant effect (p<0.05) of extrusion was observed on ASE
camelina meal extrudates. Thermal conductivity of a material indicates its potential for
transferring heat through itself due to conduction only, and the driving force is just the
temperature gradient. Thermal conductivity of a substance varies depending on its
temperature and density; therefore, the required times for post-extrusion drying and
cooling processes could be predicted by determining the extrudate thermal conductivity
during the heat transfer between the extrudate surface and center, the correspondent
65
temperature difference, and the void spaces of the extrudate (i.e. porosity) (Bouvier and
Brisset, 2006). Thus, the k value of a material is also dependent on its composition. For
example, the k value of air is 0.029 W/m.°C at 30°C, while reported values for starch and
protein are 0.28 W/m.°C, and 0.25 W/m.°C, respectively (Choi et al., 1985). It is clear
that, the more an extrudate expands, the lower thermal conductivity (Mariama, 2008). In
another study, Heldman (2003) postulated that the k value of a heat processed material
decreased due to the material changes, primarily because of protein and starch
transformations. The presence of hydrophobic constituents in the feed blend affects the
density and thus thermal conductivity of the extruded feed (Mariam, 2008). The K value
of CP camelina meal extrudates was significantly increased (p<0.05) with increase in
temperature. For ASE camelina meal extrudates, almost similar values of K were
observed with increase in temperature and screw speed. Higher C value was observed for
control CP camelina meal (1.07) as compared to the control ASE camelina meal (1.04).
The extruder temperature had a significant effect (p<0.05) on the C value of CP and ASE
camelina meal extrudates. The highest C value observed for CP and ASE camelina meal
extrudates were 1.19 at 180°C temperature and screw speed of 100 rpm and 1.11 at 80°C
temperature and screw speed of 150 rpm.
4.4.5 Bulk density and True density
The effect of extruder processing parameters (temperature and screw speed) on bulk
density and true density of CP and ASE camelina meal extrudates is shown in Table 4.4.
The bulk density and true density of control ASE camelina meal (515.68 and 2190.04) is
quite higher than the control CP camelina meal (443.55 and 1505.81). Extrusion had no
significant effect (p>0.05) on the bulk density of CP camelina meal extrudates. The ASE
66
camelina meal extrudates had higher bulk density values than the control ASE camelina
meal. The extruder temperature had a significant effect (p<0.05) on the bulk density and
true density of ASE camelina meal extrudates. Higher true density values were observed
for CP and ASE camelina meal extrudates as compared to their control samples. The
highest bulk density and true density values for CP and ASE camelina meal extrudates
were 452.24 and 1525.93 at 80°C temperature and 100 rpm screw speed; 569.51 at 80°C
temperature and 50 rpm screw speed and 2709.87 at 130°C temperature and 50 rpm
screw speed.
4.4.6 Interaction effects of independent variables on physical properties of camelina
meal
The combined interaction effects of independent variables on physical properties of
camelina meal are shown in Table 4.5. The interaction of temperature and screw speed
had no significant (p>0.05) effect on WAI, WSI and bulk density of CP and ASE
camelina meal. The water activity for CP and ASE camelina meal was significantly
(p<0.05) effected by the combined interaction of temperature and screw speed.
4.4.7 Interaction effects of independent variables on thermal properties of camelina
meal
The combined interaction effects of independent variables on thermal properties of
camelina meal are shown in Table 4.6. The combined interaction of temperature and
screw speed had a significant (p<0.05) effect on the thermal conductivity and thermal
diffusivity of CP camelina meal and a non significant (p>0.05) effect was determined for
the thermal conductivity and thermal diffusivity of ASE camelina meal.
67
4.4.8 Enzyme dosage optimization
The enzymes were added at 50, 60, 70, 80, 90, 100, 110 and 120 FPU/g cellulose to
control and extrudate of cold press and 50, 60, 70, 80 and 90 FPU/g cellulose to control
and extrudate of solvent extracted samples. The hydrolysis was done and each sample
was measured for the sugar recovery using HPLC. The % total sugars for CP camelina
meal extrudates for 50 (14.6%) and 60 (14.7%) FPU/g cellulose was almost similar.
Higher % total sugars were obtained at 70 (17.37%), 80 (17.34%) and 90 (21.38%)
FPU/g cellulose for CP camelina meal extrudates. Almost similar values of % total sugar
was obtained at 100 (21.93%) and 110 (21.82%) FPU/g cellulose. For ASE camelina
meal extrudates, there was a significant increase (p<0.05) in % total sugars with increase
in enzyme concentration. Although sugar recovery was increasing with increase in
enzyme dosage, the optimized conditions for CP and ASE camelina meal was 70 FPU/g
cellulose. The reasons for choosing this enzyme dosage were that higher enzyme dosage
will be costly and it might overcome the extrusion effect.
4.4.9 Sugar recovery
Fig. 4.3 represents the effect of extruder temperature and screw speed on sugar recovery
i.e. glucose, galactose and arabinose recovery of CP and ASE camelina meal extrudates.
The sugar recovery for CP and ASE camelina meal was measured in terms of glucose,
galactose and arabinose recovery. The glucose recovery for control ASE camelina meal
(12.52%) is higher than the control CP camelina meal (12.04%). There was a significant
(p<0.05) increase in the glucose recovery for ASE camelina meal extrudates with
extrusion. Karuppuchamyet al., 2011 also got the similar results for defatted soyabean
68
meal, with increase in temperature the glucose yield increased. For CP camelina meal
extrudates, glucose recovery values were similar to the control CP camelina meal. The
highest glucose recovery value for CP camelina meal extrudate was 12.95% at
temperature of 130°C and screw speed of 100 rpm. A significant increase (p<0.05) in
galactose and arabinose recovery was observed for CP and ASE camelina meal
extrudates with extrusion. The control galactose recovery for ASE camelina meal
(9.18%) is higher than the CP camelina meal (6.22%). As the temperature increased
during extrusion, the galactose and arabinose recovery increased for ASE camelina meal
extrudates. The highest galactose and arabinose recovery for CP and ASE camelina meal
extrudates were 7.69% and 1.70% at temperature of 80°C and screw speed of 50 rpm;
10.77% and 1.75% at 180°C temperature and 100 rpm screw speed.
The CP and ASE camelina meal samples were also checked for the presence of any
formaldehyde which might be present as a result of pre-treatment. The samples were run
for a duration of 60 minutes and no peaks were found after 20 minutes which shows the
absence of any formaldehyde in the samples.
4.4.10 Interaction effects of independent variables on sugar recovery of camelina
meal
The interaction effects of independent variables on sugar recovery of camelina meal are
given in Table 4.7. The combined interaction of temperature and screw speed had a
significant effect (p<0.05) on glucose, galactose and arabinose recovery of CP camelina
meal. For ASE camelina meal, no significant effect (p>0.05) of temperature and screw
speed was observed for glucose and galactose recovery. Arabinose recovery for ASE
69
camelina meal was significantly (p<0.05) effected by the combined interaction of
temperature and screw speed.
4.4.11 Extruder process parameters optimization
For CP camelina meal extrudates, the optimized extruder conditions were temperature of
80°C and screw speed of 50 rpm at a desirability of 0.81 using the design of expert8
software. 21.001% was the maximum sugar recovery value obtained for CP camelina
meal. For ASE camelina meal extrudates, the optimized extruder conditions were
temperature of 180°C and screw speed of 50, with a desirability of 0.797. The desirability
obtained was less, which might be due to the reason that the sugar recovery values
obtained were almost similar for different extruder processing parameters. The optimized
conditions selected for ASE camelina meal extrudates was 27.78%.
4.5 Conclusions:
Screw speed, die temperature and oil extraction methods, affected the physical properties,
thermal properties and sugar recovery of camelina meal. ASE control camelina meal had
higher values than CP control camelina meal for WAI, WSI, water activity, color (L),
true density and bulk density. For enzymatic hydrolysis, the enzymes added at 70 FPU/g
cellulose for CP camelina meal and 70 FPU/g cellulose for ASE camelina meal gave the
best results. Optimized conditions recorded for CP extruded camelina meal was
temperature of 80°C and screw speed of 50 rpm and for ASE extruded camelina meal, the
optimized conditions observed were 180°C die temperature and screw speed of 50 rpm.
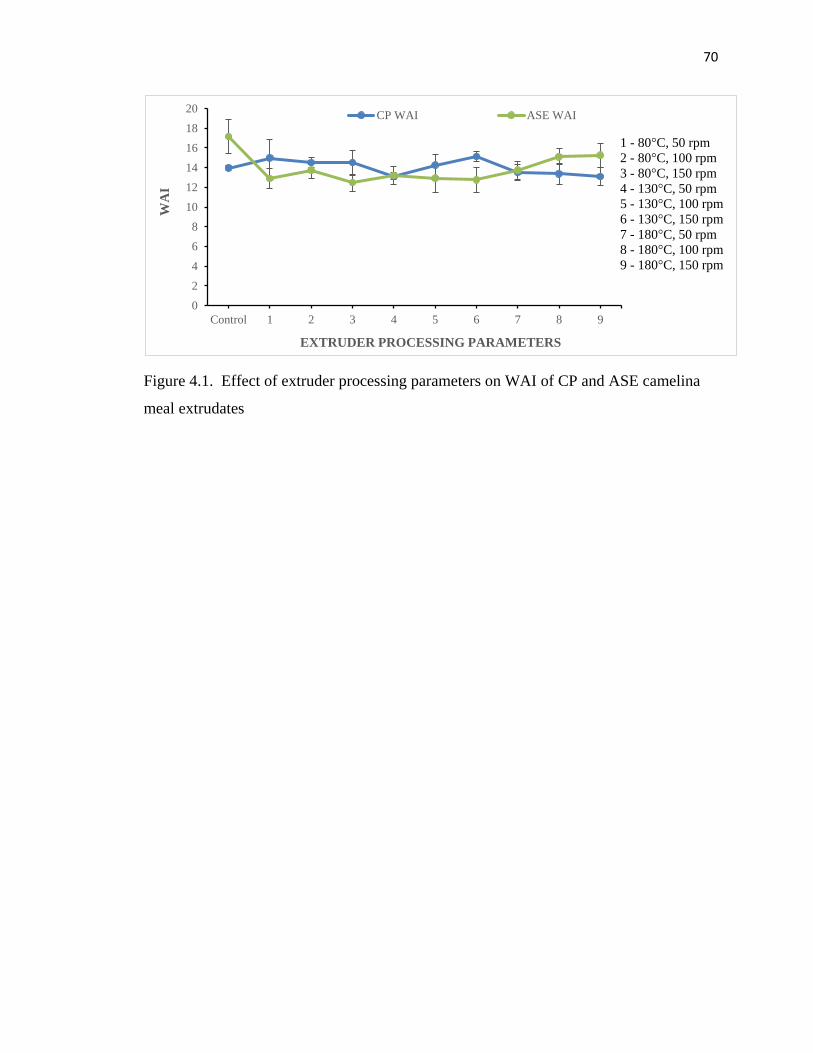
70
Figure 4.1. Effect of extruder processing parameters on WAI of CP and ASE camelina
meal extrudates
0
2
4
6
8
10
12
14
16
18
20
Control 1 2 3 4 5 6 7 8 9
WA
I
EXTRUDER PROCESSING PARAMETERS
CP WAI ASE WAI
1 - 80°C, 50 rpm
2 - 80°C, 100 rpm
3 - 80°C, 150 rpm
4 - 130°C, 50 rpm
5 - 130°C, 100 rpm
6 - 130°C, 150 rpm
7 - 180°C, 50 rpm
8 - 180°C, 100 rpm
9 - 180°C, 150 rpm
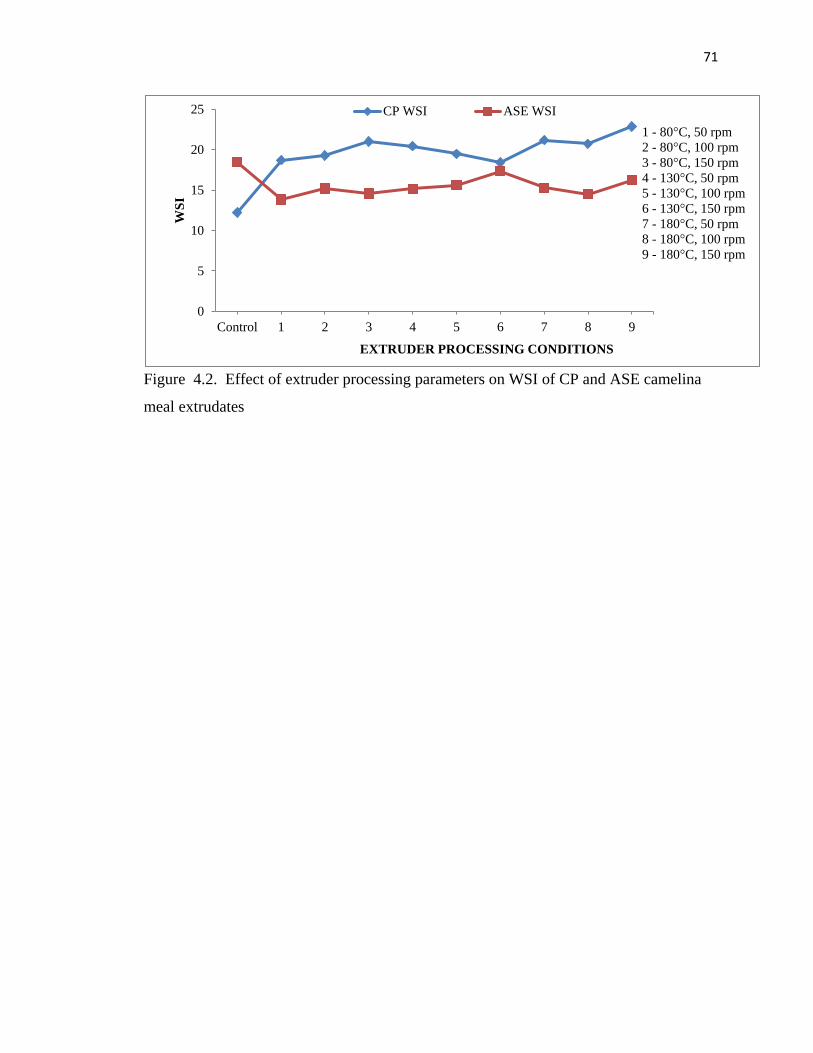
71
Figure 4.2. Effect of extruder processing parameters on WSI of CP and ASE camelina
meal extrudates
0
5
10
15
20
25
Control 1 2 3 4 5 6 7 8 9
WS
I
EXTRUDER PROCESSING CONDITIONS
CP WSI ASE WSI
1 - 80°C, 50 rpm
2 - 80°C, 100 rpm
3 - 80°C, 150 rpm
4 - 130°C, 50 rpm
5 - 130°C, 100 rpm
6 - 130°C, 150 rpm
7 - 180°C, 50 rpm
8 - 180°C, 100 rpm
9 - 180°C, 150 rpm
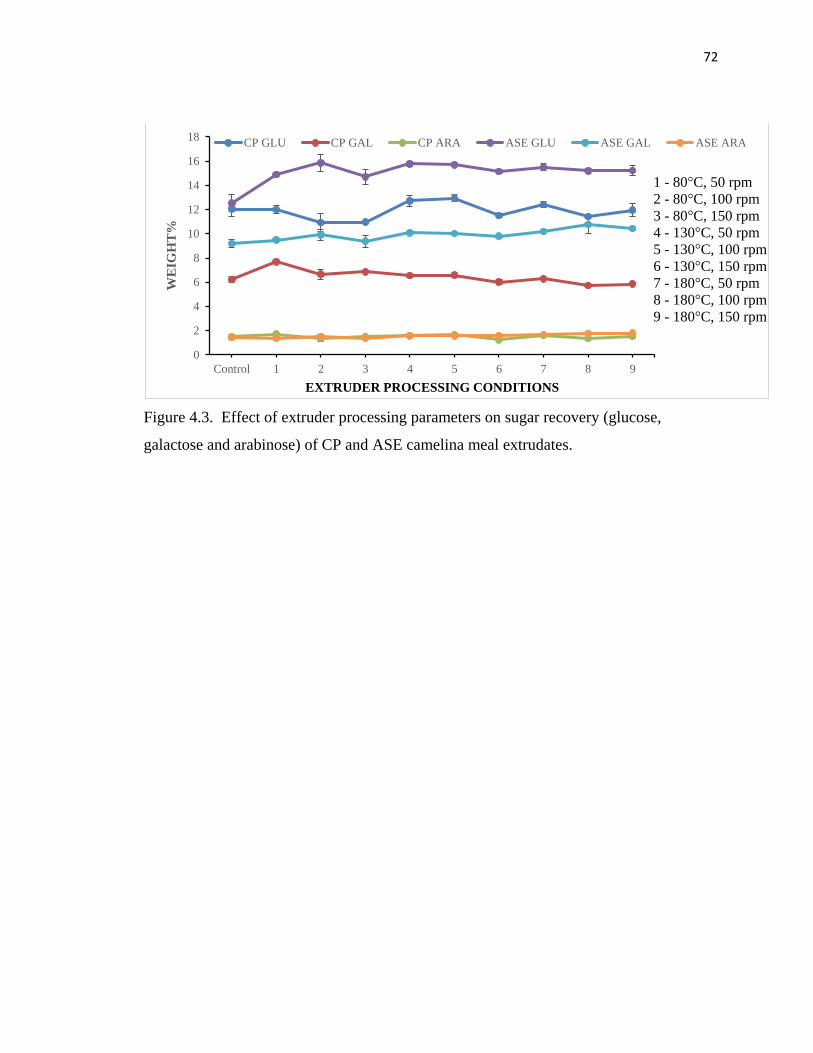
72
Figure 4.3. Effect of extruder processing parameters on sugar recovery (glucose,
galactose and arabinose) of CP and ASE camelina meal extrudates.
0
2
4
6
8
10
12
14
16
18
Control 1 2 3 4 5 6 7 8 9
WE
IGH
T%
EXTRUDER PROCESSING CONDITIONS
CP GLU CP GAL CP ARA ASE GLU ASE GAL ASE ARA
1 - 80°C, 50 rpm
2 - 80°C, 100 rpm
3 - 80°C, 150 rpm
4 - 130°C, 50 rpm
5 - 130°C, 100 rpm
6 - 130°C, 150 rpm
7 - 180°C, 50 rpm
8 - 180°C, 100 rpm
9 - 180°C, 150 rpm
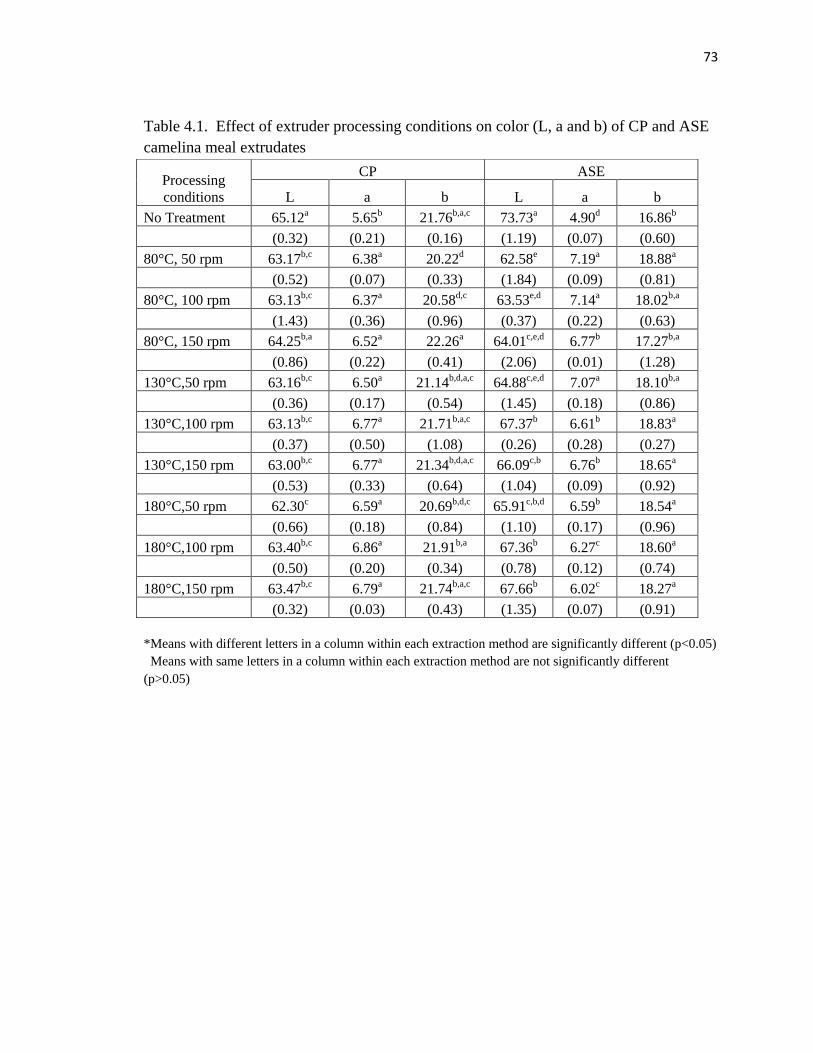
73
Table 4.1. Effect of extruder processing conditions on color (L, a and b) of CP and ASE
camelina meal extrudates
*Means with different letters in a column within each extraction method are significantly different (p<0.05)
Means with same letters in a column within each extraction method are not significantly different
(p>0.05)
Processing
conditions
CP ASE
L a b L a b
No Treatment 65.12a 5.65b 21.76b,a,c 73.73a 4.90d 16.86b
(0.32) (0.21) (0.16) (1.19) (0.07) (0.60)
80°C, 50 rpm 63.17b,c 6.38a 20.22d 62.58e 7.19a 18.88a
(0.52) (0.07) (0.33) (1.84) (0.09) (0.81)
80°C, 100 rpm 63.13b,c 6.37a 20.58d,c 63.53e,d 7.14a 18.02b,a
(1.43) (0.36) (0.96) (0.37) (0.22) (0.63)
80°C, 150 rpm 64.25b,a 6.52a 22.26a 64.01c,e,d 6.77b 17.27b,a
(0.86) (0.22) (0.41) (2.06) (0.01) (1.28)
130°C,50 rpm 63.16b,c 6.50a 21.14b,d,a,c 64.88c,e,d 7.07a 18.10b,a
(0.36) (0.17) (0.54) (1.45) (0.18) (0.86)
130°C,100 rpm 63.13b,c 6.77a 21.71b,a,c 67.37b 6.61b 18.83a
(0.37) (0.50) (1.08) (0.26) (0.28) (0.27)
130°C,150 rpm 63.00b,c 6.77a 21.34b,d,a,c 66.09c,b 6.76b 18.65a
(0.53) (0.33) (0.64) (1.04) (0.09) (0.92)
180°C,50 rpm 62.30c 6.59a 20.69b,d,c 65.91c,b,d 6.59b 18.54a
(0.66) (0.18) (0.84) (1.10) (0.17) (0.96)
180°C,100 rpm 63.40b,c 6.86a 21.91b,a 67.36b 6.27c 18.60a
(0.50) (0.20) (0.34) (0.78) (0.12) (0.74)
180°C,150 rpm 63.47b,c 6.79a 21.74b,a,c 67.66b 6.02c 18.27a
(0.32) (0.03) (0.43) (1.35) (0.07) (0.91)
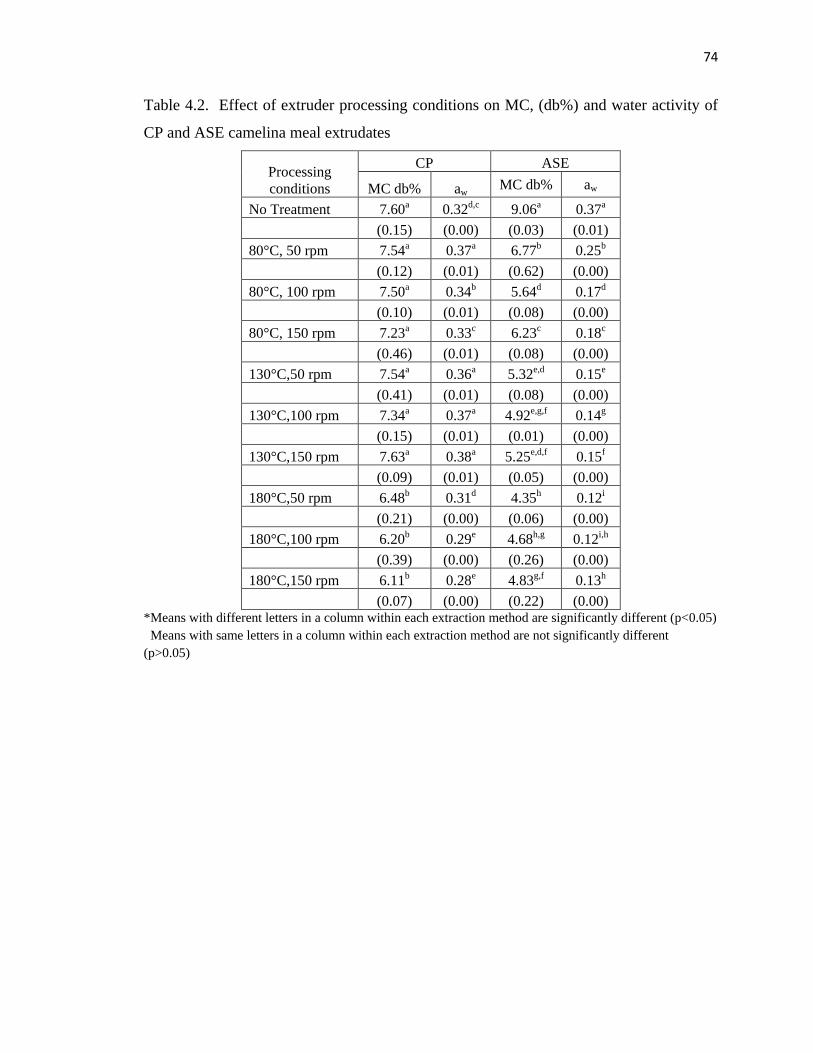
74
Table 4.2. Effect of extruder processing conditions on MC, (db%) and water activity of
CP and ASE camelina meal extrudates
Processing
conditions
CP ASE
MC db% aw MC db% aw
No Treatment 7.60a 0.32d,c 9.06a 0.37a
(0.15) (0.00) (0.03) (0.01)
80°C, 50 rpm 7.54a 0.37a 6.77b 0.25b
(0.12) (0.01) (0.62) (0.00)
80°C, 100 rpm 7.50a 0.34b 5.64d 0.17d
(0.10) (0.01) (0.08) (0.00)
80°C, 150 rpm 7.23a 0.33c 6.23c 0.18c
(0.46) (0.01) (0.08) (0.00)
130°C,50 rpm 7.54a 0.36a 5.32e,d 0.15e
(0.41) (0.01) (0.08) (0.00)
130°C,100 rpm 7.34a 0.37a 4.92e,g,f 0.14g
(0.15) (0.01) (0.01) (0.00)
130°C,150 rpm 7.63a 0.38a 5.25e,d,f 0.15f
(0.09) (0.01) (0.05) (0.00)
180°C,50 rpm 6.48b 0.31d 4.35h 0.12i
(0.21) (0.00) (0.06) (0.00)
180°C,100 rpm 6.20b 0.29e 4.68h,g 0.12i,h
(0.39) (0.00) (0.26) (0.00)
180°C,150 rpm 6.11b 0.28e 4.83g,f 0.13h
(0.07) (0.00) (0.22) (0.00) *Means with different letters in a column within each extraction method are significantly different (p<0.05)
Means with same letters in a column within each extraction method are not significantly different
(p>0.05)
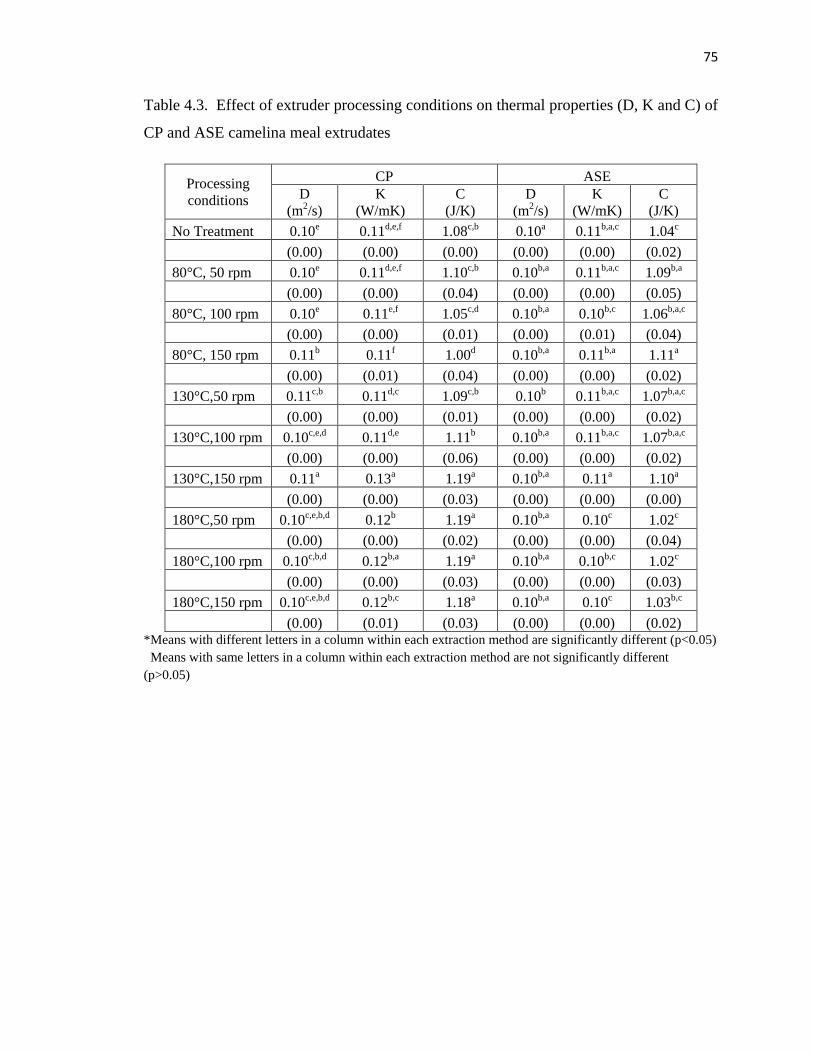
75
Table 4.3. Effect of extruder processing conditions on thermal properties (D, K and C) of
CP and ASE camelina meal extrudates
Processing
conditions
CP ASE
D
(m2/s)
K
(W/mK)
C
(J/K)
D
(m2/s)
K
(W/mK)
C
(J/K)
No Treatment 0.10e 0.11d,e,f 1.08c,b 0.10a 0.11b,a,c 1.04c
(0.00) (0.00) (0.00) (0.00) (0.00) (0.02)
80°C, 50 rpm 0.10e 0.11d,e,f 1.10c,b 0.10b,a 0.11b,a,c 1.09b,a
(0.00) (0.00) (0.04) (0.00) (0.00) (0.05)
80°C, 100 rpm 0.10e 0.11e,f 1.05c,d 0.10b,a 0.10b,c 1.06b,a,c
(0.00) (0.00) (0.01) (0.00) (0.01) (0.04)
80°C, 150 rpm 0.11b 0.11f 1.00d 0.10b,a 0.11b,a 1.11a
(0.00) (0.01) (0.04) (0.00) (0.00) (0.02)
130°C,50 rpm 0.11c,b 0.11d,c 1.09c,b 0.10b 0.11b,a,c 1.07b,a,c
(0.00) (0.00) (0.01) (0.00) (0.00) (0.02)
130°C,100 rpm 0.10c,e,d 0.11d,e 1.11b 0.10b,a 0.11b,a,c 1.07b,a,c
(0.00) (0.00) (0.06) (0.00) (0.00) (0.02)
130°C,150 rpm 0.11a 0.13a 1.19a 0.10b,a 0.11a 1.10a
(0.00) (0.00) (0.03) (0.00) (0.00) (0.00)
180°C,50 rpm 0.10c,e,b,d 0.12b 1.19a 0.10b,a 0.10c 1.02c
(0.00) (0.00) (0.02) (0.00) (0.00) (0.04)
180°C,100 rpm 0.10c,b,d 0.12b,a 1.19a 0.10b,a 0.10b,c 1.02c
(0.00) (0.00) (0.03) (0.00) (0.00) (0.03)
180°C,150 rpm 0.10c,e,b,d 0.12b,c 1.18a 0.10b,a 0.10c 1.03b,c
(0.00) (0.01) (0.03) (0.00) (0.00) (0.02) *Means with different letters in a column within each extraction method are significantly different (p<0.05)
Means with same letters in a column within each extraction method are not significantly different
(p>0.05)
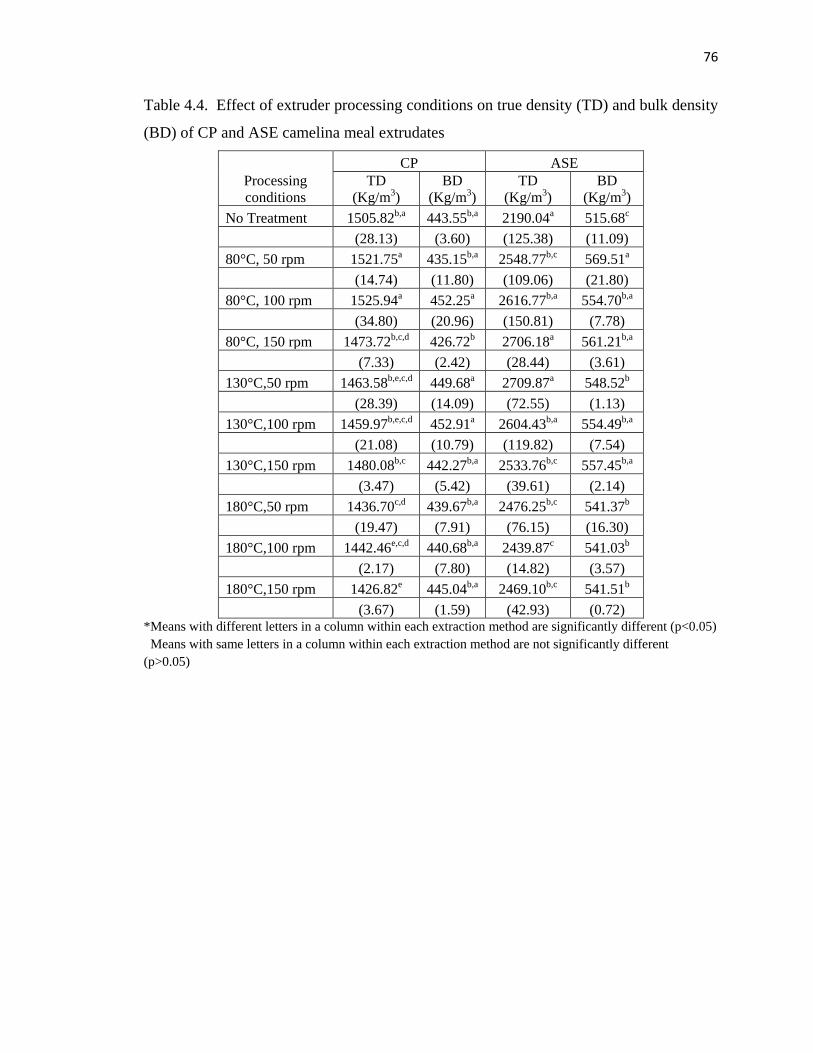
76
Table 4.4. Effect of extruder processing conditions on true density (TD) and bulk density
(BD) of CP and ASE camelina meal extrudates
Processing
conditions
CP ASE
TD
(Kg/m3)
BD
(Kg/m3)
TD
(Kg/m3)
BD
(Kg/m3)
No Treatment 1505.82b,a 443.55b,a 2190.04a 515.68c
(28.13) (3.60) (125.38) (11.09)
80°C, 50 rpm 1521.75a 435.15b,a 2548.77b,c 569.51a
(14.74) (11.80) (109.06) (21.80)
80°C, 100 rpm 1525.94a 452.25a 2616.77b,a 554.70b,a
(34.80) (20.96) (150.81) (7.78)
80°C, 150 rpm 1473.72b,c,d 426.72b 2706.18a 561.21b,a
(7.33) (2.42) (28.44) (3.61)
130°C,50 rpm 1463.58b,e,c,d 449.68a 2709.87a 548.52b
(28.39) (14.09) (72.55) (1.13)
130°C,100 rpm 1459.97b,e,c,d 452.91a 2604.43b,a 554.49b,a
(21.08) (10.79) (119.82) (7.54)
130°C,150 rpm 1480.08b,c 442.27b,a 2533.76b,c 557.45b,a
(3.47) (5.42) (39.61) (2.14)
180°C,50 rpm 1436.70c,d 439.67b,a 2476.25b,c 541.37b
(19.47) (7.91) (76.15) (16.30)
180°C,100 rpm 1442.46e,c,d 440.68b,a 2439.87c 541.03b
(2.17) (7.80) (14.82) (3.57)
180°C,150 rpm 1426.82e 445.04b,a 2469.10b,c 541.51b
(3.67) (1.59) (42.93) (0.72) *Means with different letters in a column within each extraction method are significantly different (p<0.05)
Means with same letters in a column within each extraction method are not significantly different
(p>0.05)
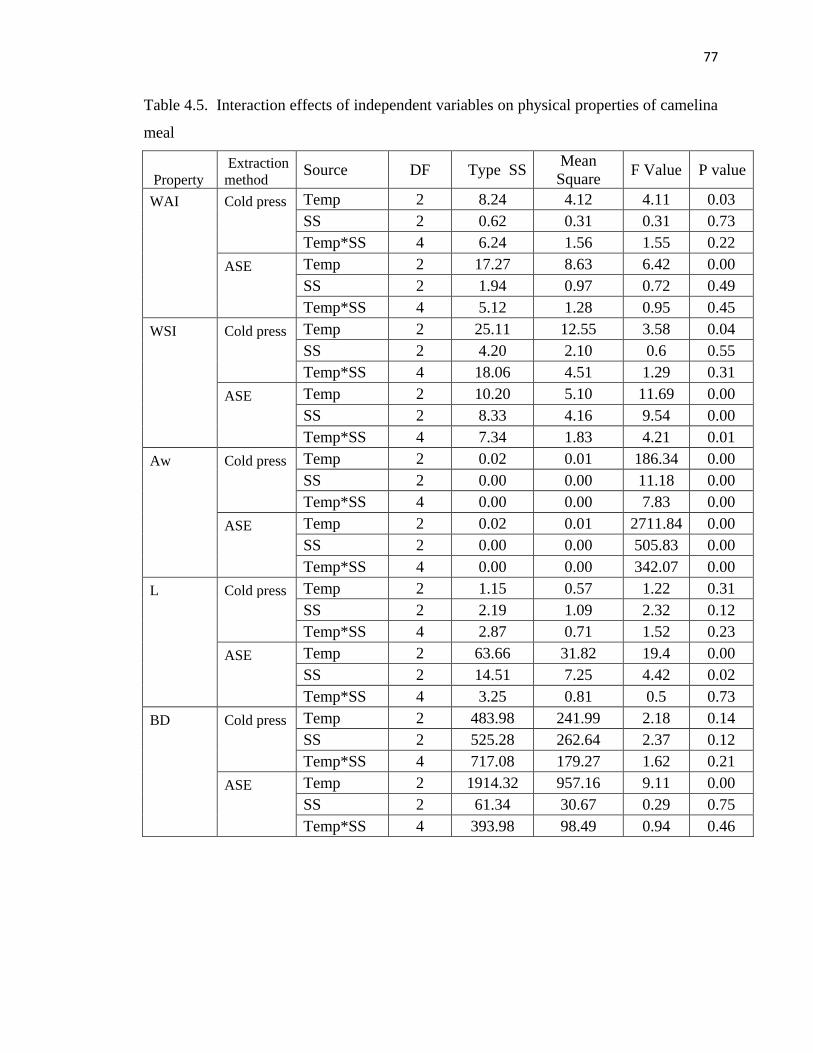
77
Table 4.5. Interaction effects of independent variables on physical properties of camelina
meal
Property
Extraction
method Source DF Type SS
Mean
Square F Value P value
WAI Cold press Temp 2 8.24 4.12 4.11 0.03
SS 2 0.62 0.31 0.31 0.73
Temp*SS 4 6.24 1.56 1.55 0.22
ASE Temp 2 17.27 8.63 6.42 0.00
SS 2 1.94 0.97 0.72 0.49
Temp*SS 4 5.12 1.28 0.95 0.45
WSI Cold press Temp 2 25.11 12.55 3.58 0.04
SS 2 4.20 2.10 0.6 0.55
Temp*SS 4 18.06 4.51 1.29 0.31
ASE Temp 2 10.20 5.10 11.69 0.00
SS 2 8.33 4.16 9.54 0.00
Temp*SS 4 7.34 1.83 4.21 0.01
Aw Cold press Temp 2 0.02 0.01 186.34 0.00
SS 2 0.00 0.00 11.18 0.00
Temp*SS 4 0.00 0.00 7.83 0.00
ASE Temp 2 0.02 0.01 2711.84 0.00
SS 2 0.00 0.00 505.83 0.00
Temp*SS 4 0.00 0.00 342.07 0.00
L Cold press Temp 2 1.15 0.57 1.22 0.31
SS 2 2.19 1.09 2.32 0.12
Temp*SS 4 2.87 0.71 1.52 0.23
ASE Temp 2 63.66 31.82 19.4 0.00
SS 2 14.51 7.25 4.42 0.02
Temp*SS 4 3.25 0.81 0.5 0.73
BD Cold press Temp 2 483.98 241.99 2.18 0.14
SS 2 525.28 262.64 2.37 0.12
Temp*SS 4 717.08 179.27 1.62 0.21
ASE Temp 2 1914.32 957.16 9.11 0.00
SS 2 61.34 30.67 0.29 0.75
Temp*SS 4 393.98 98.49 0.94 0.46
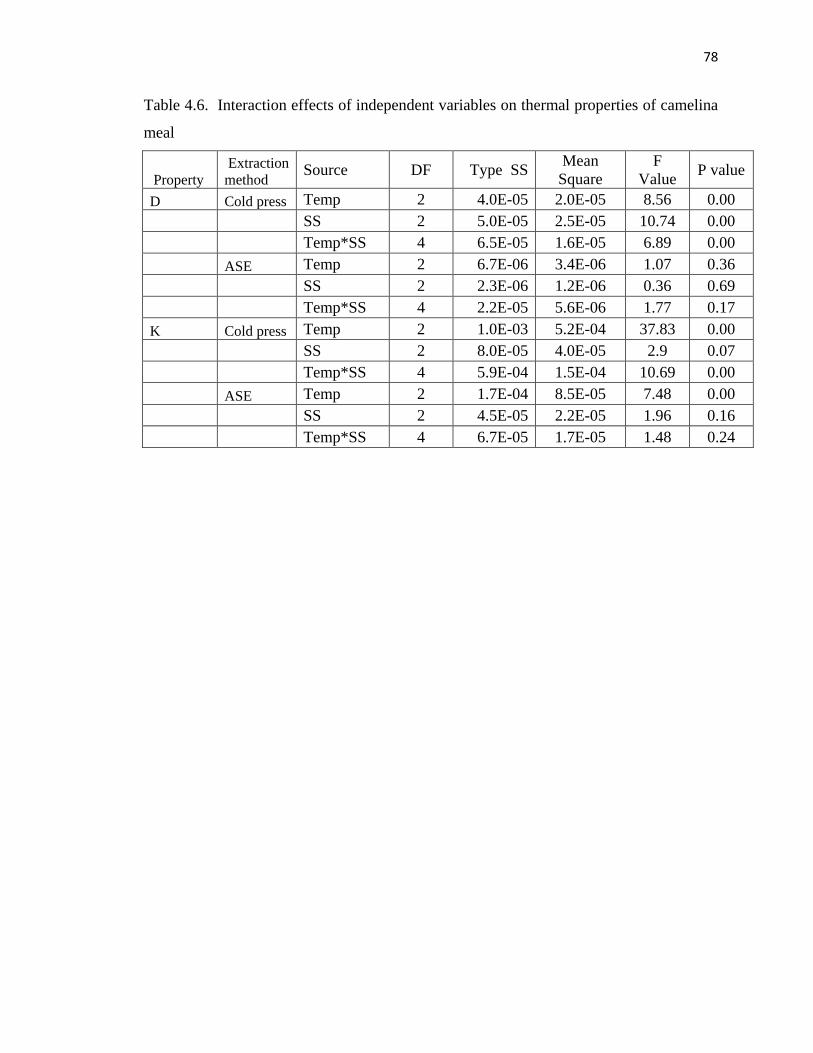
78
Table 4.6. Interaction effects of independent variables on thermal properties of camelina
meal
Property
Extraction
method Source DF Type SS
Mean
Square
F
Value P value
D Cold press Temp 2 4.0E-05 2.0E-05 8.56 0.00
SS 2 5.0E-05 2.5E-05 10.74 0.00
Temp*SS 4 6.5E-05 1.6E-05 6.89 0.00
ASE Temp 2 6.7E-06 3.4E-06 1.07 0.36
SS 2 2.3E-06 1.2E-06 0.36 0.69
Temp*SS 4 2.2E-05 5.6E-06 1.77 0.17
K Cold press Temp 2 1.0E-03 5.2E-04 37.83 0.00
SS 2 8.0E-05 4.0E-05 2.9 0.07
Temp*SS 4 5.9E-04 1.5E-04 10.69 0.00
ASE Temp 2 1.7E-04 8.5E-05 7.48 0.00
SS 2 4.5E-05 2.2E-05 1.96 0.16
Temp*SS 4 6.7E-05 1.7E-05 1.48 0.24
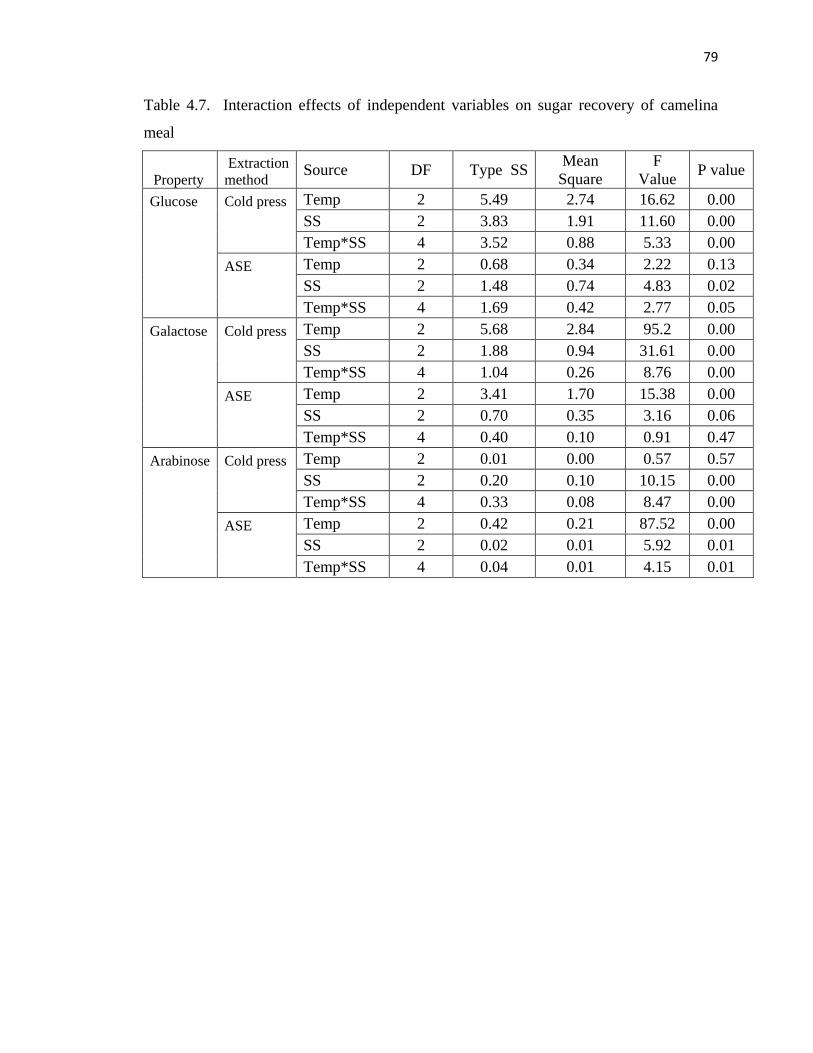
79
Table 4.7. Interaction effects of independent variables on sugar recovery of camelina
meal
Property
Extraction
method Source DF Type SS
Mean
Square
F
Value P value
Glucose Cold press Temp 2 5.49 2.74 16.62 0.00
SS 2 3.83 1.91 11.60 0.00
Temp*SS 4 3.52 0.88 5.33 0.00
ASE Temp 2 0.68 0.34 2.22 0.13
SS 2 1.48 0.74 4.83 0.02
Temp*SS 4 1.69 0.42 2.77 0.05
Galactose Cold press Temp 2 5.68 2.84 95.2 0.00
SS 2 1.88 0.94 31.61 0.00
Temp*SS 4 1.04 0.26 8.76 0.00
ASE Temp 2 3.41 1.70 15.38 0.00
SS 2 0.70 0.35 3.16 0.06
Temp*SS 4 0.40 0.10 0.91 0.47
Arabinose Cold press Temp 2 0.01 0.00 0.57 0.57
SS 2 0.20 0.10 10.15 0.00
Temp*SS 4 0.33 0.08 8.47 0.00
ASE Temp 2 0.42 0.21 87.52 0.00
SS 2 0.02 0.01 5.92 0.01
Temp*SS 4 0.04 0.01 4.15 0.01
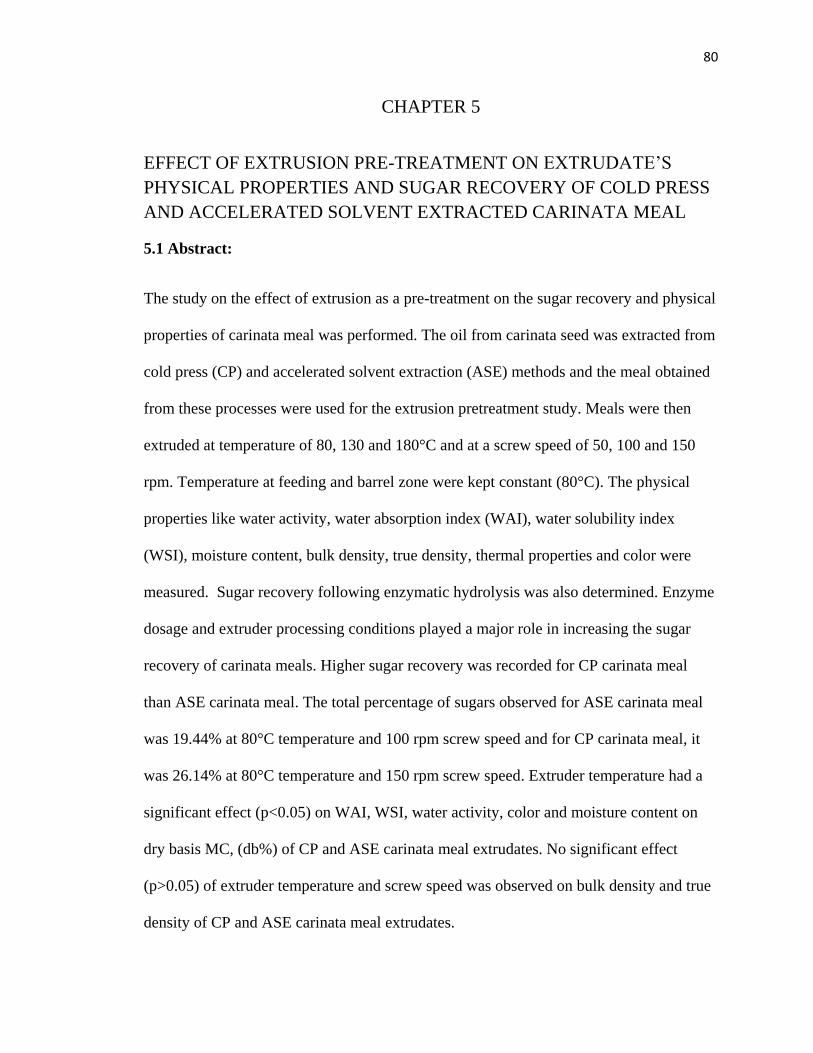
80
CHAPTER 5
EFFECT OF EXTRUSION PRE-TREATMENT ON EXTRUDATE’S
PHYSICAL PROPERTIES AND SUGAR RECOVERY OF COLD PRESS
AND ACCELERATED SOLVENT EXTRACTED CARINATA MEAL
5.1 Abstract:
The study on the effect of extrusion as a pre-treatment on the sugar recovery and physical
properties of carinata meal was performed. The oil from carinata seed was extracted from
cold press (CP) and accelerated solvent extraction (ASE) methods and the meal obtained
from these processes were used for the extrusion pretreatment study. Meals were then
extruded at temperature of 80, 130 and 180°C and at a screw speed of 50, 100 and 150
rpm. Temperature at feeding and barrel zone were kept constant (80°C). The physical
properties like water activity, water absorption index (WAI), water solubility index
(WSI), moisture content, bulk density, true density, thermal properties and color were
measured. Sugar recovery following enzymatic hydrolysis was also determined. Enzyme
dosage and extruder processing conditions played a major role in increasing the sugar
recovery of carinata meals. Higher sugar recovery was recorded for CP carinata meal
than ASE carinata meal. The total percentage of sugars observed for ASE carinata meal
was 19.44% at 80°C temperature and 100 rpm screw speed and for CP carinata meal, it
was 26.14% at 80°C temperature and 150 rpm screw speed. Extruder temperature had a
significant effect (p<0.05) on WAI, WSI, water activity, color and moisture content on
dry basis MC, (db%) of CP and ASE carinata meal extrudates. No significant effect
(p>0.05) of extruder temperature and screw speed was observed on bulk density and true
density of CP and ASE carinata meal extrudates.
81
5.2 Introduction
B. carinata (Ethiopian mustard) is related to rapeseed (B. napus) and originated from a
cross between B. nigra and B. oleracea. B. carinata seeds are consumed in Ethiopia.
Brassica carinata possesses many positive agronomic traits (Gugel et al., 1990; Singh et
al., 1988; Malik, 1990), and it can grow well in hot, dry, and semiarid climates typical of
the southern prairies of western Canada. Moreover, with the development of high erucic
acid types for industrial uses, as well as zero erucic acid lines (Getinet et al., 1994) and
zero erucic acid/high oleic acid lines, (Velasco et al., 2003) seed oil from these species
and its byproduct (carinata meal) may have potential applications in the food, biofuel,
and feed industries. The defatted meal resulting from oil extraction could represent an
important source of protein, which would increase the value of B. carinata crops.
Enzymatic hydrolysis can be used to improve the functional and nutritional properties of
oilseed proteins, which are easily denatured during the process of oil extraction (Vioque
et al., 2000).
Heat or chemical treatments can be avoided by using the cold press method and also it’s
safe and natural as per the consumer desire (Parker et al., 2003). The process is simple,
ecological and does not require much energy. Some of the disadvantages of the system
are low productivity and not having a consistent quality (Rotkiewicz et al., 1999).
Pressure and temperature are two important parameters to extract oil in Accelerated
Solvent Extraction (ASE) (Ezzell, et al., 1995). Extraction times are reduced in ASE.
More information regarding oil extraction methods could be found in Section 3.2.
82
Extruder is a high temperature short residence time reactor where the feed material passes
through the extruder barrel and due to high shear rate and heating, physico-chemical
changes occur. A few advantages of extruder are moderate temperature, short residence
time, high shear, rapid heat transfer. Chemicals can be added or removed during
extrusion-all in a continuous process. More information on extrusion can be found in
Section 3.2 and 4.2. Extrusion pretreatment studies (Dale et al., 1999; de Vrije et al.,
2002; Karunanithy et al., 2009a-c; Lee et al., 2009; Jurusic et al., 2009) show a
significant improvement on sugar recovery from different biomasses such as corn stover,
miscanthus, switchgrass, big blueatem, prairie cord grass and Douglas fir wood.
Extrusion pretreatment has also been studied for soya white flakes and soyabean hulls
(Karuppuchamy and Muthukumarappan, 2009).
The large availability and low cost make oilseed meals attractive raw materials,
especially the proteins and carbohydrates, for various applications. Efforts have been
made to utilize the co products for various applications. In this research carinata meal has
been extracted by cold press and accelerated solvent extraction and the effect of extrusion
as a pre-treatment has been studied on the sugar recovery of these meals.
Enzymatic hydrolysis of CP and ASE carinata meal was done in order to convert the
polysaccharides to monosaccharides. The sugars are desired in the form of
monosaccharides so that they are easily accessible by the particular micro-organisms
during fermentation to convert them into protein. This converted protein then can be fed
to the fish as a feed. This study will give an insight view for the efforts that has been
made to replace the fish meal by the oilseed meals.
83
5.2.1 Objectives:
1. Optimize the extruder parameters to predict the maximum sugar recovery in CP
and ASE carinata meal
2. Optimize the enzyme dosage for maximum sugar recovery in CP and ASE
carinata meal
3. Determine the physical properties, thermal properties and sugar recovery of CP
and ASE carinata meal
5.3 Materials and methods:
5.3.1 Sample preparation:
The carinata seeds were obtained from consumer supply distributing Co. (Oregon). Two
different methods were used to extract oil: cold press extraction and accelerated solvent
extraction. The cold press extraction (M70 oil press co.) consisting VFD motor (2HP,
1.5KW) was done at a temperature of 90°C, frequency of 20 Hz and die size of 0.22
inches. ASE was done at a time-temperature combination of 100°C/90 min. The solvent
used was Hexane. Two samples of 1.5 Kg each were prepared according to cold press
extraction and accelerated solvent extraction in order to study their effect on sugar
recovery, physical properties and thermal properties of carinata meal extrudates.
5.3.2 Extrusion pretreatment:
The CP and ASE carinata meal samples prepared were extruded using single screw
extruder (Brabender Plasti-Corder, Model PL2000, South Hackensack, NJ) which was
powered by a 7.5HP motor with an operating range of screw speeds from 0-210 rpms (0-
22rad/sec). The extruder had a barrel with length to diameter ratio of 20:1 and a barrel
84
diameter of 19 mm. The extrusion was done at 3 different temperature and screw speed of
80, 130 and 180°C; 50, 100 and 150 rpm, respectively. In total, 9 combinations were
formed from temperature and screw speed. The extrudates obtained were dried overnight.
The sample size used for extrusion for every combination was approximately 150g.
5.3.3 Grinding:
The extruded samples were further grounded using a hammer mill (Speedy Jr, Winona
Attrition Mill Co, MN) to mesh size of 2 mm and then stored in zip lock bags in
refrigerator at 4°C. The samples were ground to a uniform size in order to obtain
effective enzymatic hydrolysis and physical properties of carinata meal.
5.3.4 Moisture content:
Moisture content of the control and extruded (CP and ASE) samples were measured
according to the official methods of analysis (AOAC, 1984) using a laboratory oven
(Thelco Precision, Jovan Inc., Wincester, VA).
5.3.5 Physical Properties
Three replications were studied for each property.
5.3.5.1 Water activity:
Water activity of the samples was measured by using the AquaLab water activity meter
(4TE, version 10, Decagon Devices, Inc., Pullman WA) where the sample was placed in
a plastic cup of the water activity meter and the lid was closed. After 5 to 10 minutes, the
water activity value of the sample was shown on the screen. For each sample, three
replications were done.
85
5.3.5.2 Water absorption index (WAI) and Water solubility index (WSI):
Different authors used different procedures to determine the WAI and WSI. Jones et al.,
2000 used the following procedure to determine the WAI and WSI. 2.5 g sample was
suspended in 30 ml of distilled water in a tarred 50 ml centrifuge tube. The centrifuge
tube was placed in a laboratory oven (Thelco precision, Jovan Inc., Winchester, VA) at
30oC. This was stirred intermittently for a period of 30 min and centrifuged at 3000 rpm
for 10 minutes. The supernatant liquid was transferred into an aluminum dish, placed in
the oven for 2 hr at 135oC (AACC method 44-19, 1995), and then desiccated for 20 min
before weighing the dry solids of the supernatant. The mass of the remaining gel was
weighed, and WAI (-) was calculated as the ratio of gel mass to the original sample mass.
WSI (%), on the other hand was determined as the ratio of mass of dry solids in the
extract to the original sample mass.
5.3.5.3 Bulk density and true density:
Micromeritics Multivolume Pycnometer (No.1305, Micromeritics Instrument
Corporation, Norcross, GA) was used for the measurement of the true density of the
samples. The biomass sample was filled full into an aluminum cup provided together
with the pycnometer and then placed into the pycnometer. The unit works on the basis of
helium gas replacement in the void space of the biomass sample. The values were
measured in the form of P1 when the knob was in the prep position and P2 when the knob
was in test position measured in psi. True density of the material was measured by the
equation
86
Where TD is the true density, Msample is the mass of the biomass sample that used to fill
the alumnium cup, Vcell and Vexp are two constant numbers provided by the micromeritics
multivolume pycnometer.
5.3.5.4 Thermal properties:
Thermal properties of the materials were measured by using the KD2 thermal properties
analyzer. Thermal properties (thermal conductivity, thermal diffusivity, and specific heat
capacity) were determined with a thermal properties meter (KD2, Decagon Devices,
Pullman, WA) that utilized the line heat source probe technique. The probe used was SH-
1-00571.
5.3.5.5 Color:
The color was measured using a Spectrophotometer (CM-2500d, Minolta Co., Ltd.,
Japan). The color was described by value of ‘L’, ‘a’ and ‘b’ where L indicates intensity of
color i.e. lightness which varies from L=100 for perfect white to L=0 for black. ‘a’ and
‘b’ are chromaticity dimensions which give understandable designations of color i.e. the
value of ‘a’ measured redness when positive, grey when zero and greenness when
negative and the value of ‘b’ measured yellowness when positive, grey when zero and
blueness when negative.
5.3.6 Enzymatic hydrolysis:
12
1
exp
PP
VV
MTD
cell
sample
87
The enzymatic hydrolysis was conducted in a hungate glass tube (Bellco glass, Inc, NJ,
USA) with 1.1g dry weight of pre-treated biomass in a solution of citrate buffer (0.1M,
pH 4.8) and sodium azide (0.02g/l) to inhibit microbial contamination during incubation.
The enzymes used during enzymatic hydrolysis were CTec2 and HTec2, were purchased
from Novozymes. The enzyme activity for CTec2 was 128 FPU/ml and for HTec2 was
4465 IU/ml. The enzyme dosage was optimized by adding varying enzyme dosage of 40,
50, 60, 70, 80 and 90 FPU/g cellulose. CTec2 and HTec2 were added in the ratio of 9:1.
Hydrolysis was carried out for 72 hrs at 50°C and 150 rpm. After hydrolysis, the samples
were kept in boiling water for 10 min to inactivate the enzyme action. The supernatant
was centrifuged at 13,000 rpm for 15 min and frozen and thawed. This process was
repeated twice before injecting into the HPLC to remove impurities which contribute to
the pressure increase in the HPLC system. Soluble sugars were quantified using HPLC
(Agilent technologies, Santa Clara, CA; Bio-Rad Aminex 87H column, Hercules, CA)
with a mobile phase of 0.005M H2SO4 at a flow rate of 0.6 ml/min at 65°C and a sample
volume of 20µl as mentioned by Sluiter et al (2006). The sugar concentration obtained
from the chromatogram was divided by the dry weight of biomass of pretreated material
and multiplied by the total volume taken to get the percentage of that compound in the
sample. The percentage was calculated by multiplying the value by 100.
5.3.7 Extruder processing parameters optimization
The extruder processing parameters were optimized by using design of expert8 (Version
8.0.7.1) software. General Factorial Design was applied to optimize the temperature and
screw speed for maximum sugar recovery of cold press carinata meal extrudaes and
solvent extracted carinata meal extrudates.
88
5.3.8 Statistical Analysis
All the collected data were analyzed with SAS v.9 (SAS Institute, Cary, NC). The Proc
GLM procedure was used to determine the main, treatment and interaction effects using a
Type I error rate (α) of 0.05. Post-hoc Duncan Multiple Range Test (DMRT) tests were
used to identify where the significant differences occurred.
5.4 Result and discussion
5.4.1 Water absorption index and Water solubility index (WAI and WSI)
The effect of different extruder processing parameters on WAI and WSI is shown in Fig.
5.1 and Fig. 5.2. The control value of WAI and WSI is almost similar for CP (3.84% and
26.62%) and ASE (3.62% and 25.58%) carinata meal. As the temperature increased
during extrusion, the WAI and WSI for CP carinata meal extrudates significantly
(p<0.05) decreased. In case of ASE carinata meal extrudates, the temperature had a
significant (p<0.05) effect on WAI and WSI. The highest WAI and WSI value observed
for CP carinata meal was 3.84% at 80°C temperature and 50 rpm screw speed; 27.32% at
80°C temperature and screw speed of 150 rpm. Several researchers suggested that any
change in WAI can be due to structural modifications of the blend composition, such as
starch gelatinization and protein denaturation (Badrie and Mellowes, 1991; Chevanan et
al., 2007a; Rosentrater et al., 2009a, b). Unlike water absorption index, WSI indicates
degradation extent of macromolecule components of a feed blend, mainly starch and
protein molecules (Govindasamy, 1996; Colonna Mercier, 1983). Therefore, WAI is
inversely related to WSI (Anderson et al., 1982). Generally, extrusion processing
increases WSI (Menegassi et al. (2011); Anderson et al., 1982), which occurs due to the
89
combination effects of high temperature, pressure, and shear forces on starch and protein
degradations.
5.4.2 Color
The color of CP and ASE carinata meal extrudates is shown in Table 5.1. The color is
represented in terms of L, a, and b, where L indicates intensity of color i.e. lightness
which varies from L=100 for perfect white to L=0 for black. ‘a’ and ‘b’ are chromaticity
dimensions which give understandable designations of color i.e. the value of ‘a’
measured redness when positive, grey when zero and greenness when negative and the
value of ‘b’ measured yellowness when positive, grey when zero and blueness when
negative. The control value of CP (70.95) and ASE (69.23) carinata meal extrudates had
similar L values. The extruder temperature had a significant (p<0.05) effect on the L
value of CP and ASE carinata meal extrudates. Change in color of extrudates can be an
indication of nutrients degradation during extrusion processing (Bjorck & Asp, 1983).
The highest L value recorded for CP and ASE carinata meal extrudates was 72.27 at 80°C
and 150 rpm; 61.14 at 180°C and 50 rpm. The control ‘a’ value for ASE carinata meal
(4.69) is higher than the CP carinata meal (1.30) and the control ‘b’ value for ASE
carinata meal (25.24) is lower than the CP carinata meal (28.37). The extruder
temperature had a significant (p<0.05) effect on the ‘a’ and ‘b’ values of CP carinata
meal extrudates. No significant effect (p>0.05) of extruder temperature was observed for
the ‘a’ and ‘b’ values of ASE carinata meal extrudates. The highest and lowest ‘a’ and ‘b’
values recorded for CP carinata meal extrudates were 2.72 at 180°C and 100 rpm and
1.51 at 80°C and 150 rpm; 30.76 at 130°C and 100 rpm and 27.91 at 180°C and 100 rpm.
90
5.4.3 MC, (db%) and Water activity:
Table 5.2 represents the MC, (db%) and water activity of CP and ASE carinata meal
extrudates. The moisture content at dry basis MC, (db%) for control ASE carinata meal
(20.37%) is quite higher than the control CP carinata meal (8.52%). Almost similar
values of MC, (db%) were observed for CP carinata meal extrudates. For ASE carinata
meal extrudates, keeping the screw speed constant as the temperature increased, the MC,
(db%) decreased significantly (p<0.05). At 50 rpm screw speed, MC, (db%) was 14.32%
at 80°C, 11.65% at 130°C and 9.74% at 180°C.
The water activity value of control (0.79) and extrudates of ASE carinata meal is higher
than the control (0.42) and extrudates of CP carinata meal. Extruder temperature and
screw speed had a significant effect (p<0.05) on the water activity of CP and ASE
carinata meal extrudates. As the temperature and screw speed increased, the water
activity values for ASE carinata meal extrudates decreased significantly (p<0.05). The
lowest water activity value recorded for CP and ASE carinata meal extrudates were 0.32
at 80°C and 150 rpm and 0.55 at 180°C and 50 rpm.
5.4.4 Thermal properties:
The thermal properties for carinata meal were recorded in terms of thermal diffusivity (D
value), thermal conductivity (K value) and specific heat capacity (C value). D, K and C
values for CP and ASE carinata meal extrudates is shown in Table 5.3. The control value
of D (0.09), K (0.12) and C value (1.16) for ASE carinata meal is higher than the D
(0.09), K (0.08) and C value (0.84) for CP carinata meal. The extruder temperature had a
significant effect (p<0.05) on the D, K and C value of ASE carinata meal extrudates.
91
Thermal conductivity of a substance varies depending on its temperature and density;
therefore, the required times for post-extrusion drying and cooling processes could be
predicted by determining the extrudate thermal conductivity during the heat transfer
between the extrudate surface and center, the correspondent temperature difference, and
the void spaces of the extrudate (i.e. porosity) (Bouvier and Brisset, 2006). Thus, the k
value of a material is also dependent on its composition. It is clear that, the more an
extrudate expands the lower thermal conductivity (Mariama, 2008). In another study,
Heldman (2003) postulated that the k value of a heat processed material decreased due to
the material changes, primarily because of protein and starch transformations. The
extruder temperature and screw speed had no significant effect (p>0.05) on the K and C
value of CP carinata meal extrudates. As the extruder temperature increased, the D value
increased significantly (p<0.05) and C value decreased significantly (p<0.05) for ASE
carinata meal extrudates. The D value and C value of ASE carinata meal extrudates
observed at temperature of 80°C, 130°C and 180°C, keeping the screw speed constant at
50 rpm were 0.09, 0.10 and 0.11; 1.41, 1.35 and 1.26.
5.4.5 Bulk density and true density:
The effect of extruder processing parameters (temperature and screw speed) on bulk
density and true density of CP and ASE carinata meal extrudates is shown in Table 5.4.
The control bulk density value for CP carinata meal (496.13) was higher than the control
ASE carinata meal (453.01). The true density control value for ASE carinata meal
(4213.77) was higher than the control value of CP carinata meal (3013.04). Extrusion
temperature and screw speed had no significant effect (p>0.05) on the bulk density and
true density of CP and ASE carinata meal extrudates. Almost similar bulk density values
92
were observed for CP and ASE carinata meal extrudates at different extruder processing
conditions. The highest bulk density and true density observed for CP and ASE carinata
meal extrudates were 498.78 at 80°C and 100 rpm and 2977.79 at 130°C and 150 rpm;
569.15 at 130°C and 150 rpm and 3154.66 at 80°C and 50 rpm.
5.4.6 Interaction effects of independent variables on physical properties of carinata
meal
The interaction effects of independent variables on physical properties of carinata meal
are given in Table 5.5. The temperature and combined interaction of temperature and
screw speed had the significant effect (p<0.05) on WAI of CP and ASE carinata meal.
Temperature had a significant effect (p<0.05) on WSI of CP and ASE carinata meal. The
water activity of CP and ASE carinata meal is significantly effected (p<0.05) by the
temperature, screw speed, combined interaction of temperature and screw speed. The
color of CP and ASE carinata meal extrudates was significantly effected (p<0.05) by the
temperature and combined interaction of temperature and screw speed. There was no
significant effect (p<0.05) of temperature and screw speed on the bulk density of CP and
ASE carinata meal extrudates.
5.4.7 Interaction effects of independent variables on thermal properties of carinata
meal
The interaction effects of independent variables on thermal properties of carinata meal
are given in Table 5.6. The thermal diffusivity (D value) of CP and ASE carinata meal
was significantly (p<0.05) effected by the temperature alone. The thermal conductivity
(K value) of CP carinata meal was not significantly affected (p>0.05) by extrusion. For
93
ASE carinata meal, extruder temperature, screw speed and combined interaction of
temperature and screw speed had a significant effect (p<0.05) on the thermal diffusivity.
5.4.8 Sugar recovery:
Fig. 5.3 represents the effect of extruder temperature and screw speed on sugar recovery
i.e. glucose, galactose and arabinose recovery of CP and ASE carinata meal extrudates.
The sugar recovery for CP and ASE carinata meal was measured in terms of glucose,
galactose and arabinose recovery. The control glucose and galactose recovery of CP
carinata meal (12.12% and 7.44%) was higher than the control ASE carinata meal (9.79%
and 6.62%). The glucose and galactose recovery of CP carinata meal extrudates was
significantly effected (p<0.05) by extrusion. Veeramani and Muthukumarappan, 2011
also got the similar results for defatted soyabean meal, with increase in temperature the
glucose yield increased. On the other hand, extrusion had no significant effect (p>0.05)
on the glucose and galactose recovery of ASE carinata meal extrudates. As the
temperature increased, glucose and galactose recovery of CP carinata meal extrudates
increased significantly (p<0.05). No galactose recovery was observed for ASE carinata
meal extrudates. The highest glucose recovery for CP and ASE carinata meal extrudates
was 21.87% at 180°C and 150 rpm and 16.72% at 80°C and 100 rpm. The control
arabinose recovery for ASE carinata meal (2.59%) was higher than the control CP
carinata meal (1.50%). As the extruder temperature and screw speed increased, arabinose
recovery for CP carinata meal increased significantly (p<0.05). For ASE carinata meal
extrudates, no significant effect (p>0.05) of extrusion was observed for arabinose
recovery.
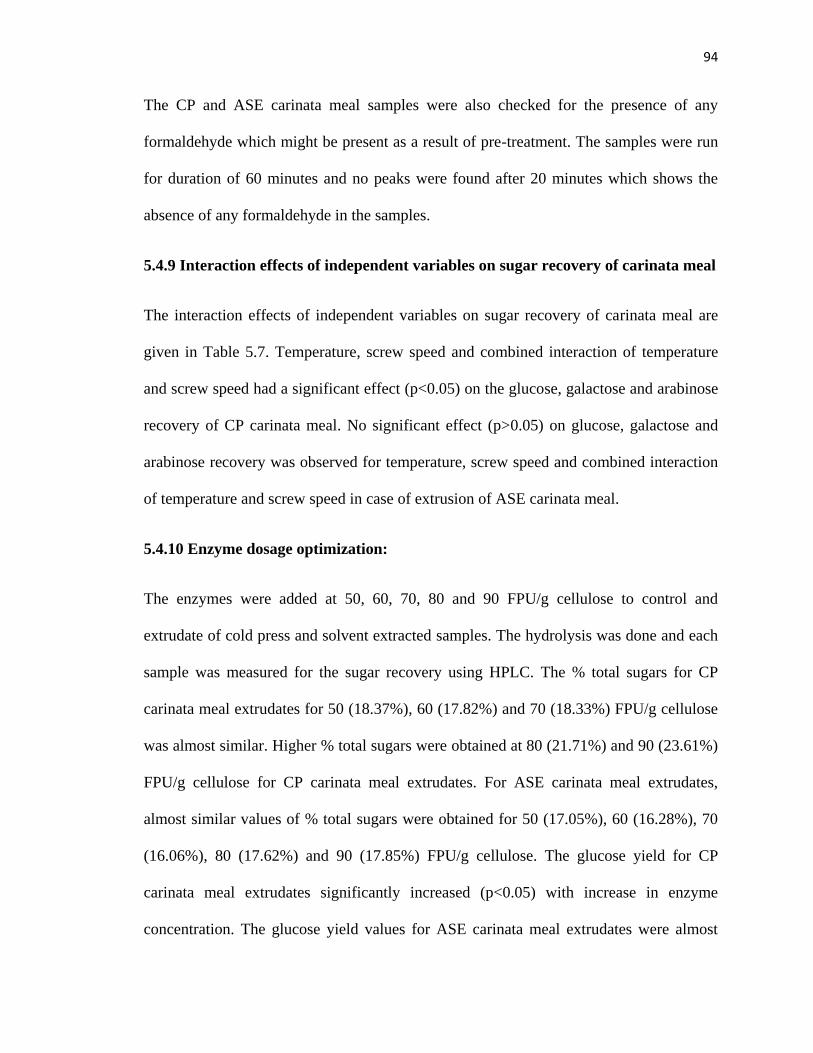
94
The CP and ASE carinata meal samples were also checked for the presence of any
formaldehyde which might be present as a result of pre-treatment. The samples were run
for duration of 60 minutes and no peaks were found after 20 minutes which shows the
absence of any formaldehyde in the samples.
5.4.9 Interaction effects of independent variables on sugar recovery of carinata meal
The interaction effects of independent variables on sugar recovery of carinata meal are
given in Table 5.7. Temperature, screw speed and combined interaction of temperature
and screw speed had a significant effect (p<0.05) on the glucose, galactose and arabinose
recovery of CP carinata meal. No significant effect (p>0.05) on glucose, galactose and
arabinose recovery was observed for temperature, screw speed and combined interaction
of temperature and screw speed in case of extrusion of ASE carinata meal.
5.4.10 Enzyme dosage optimization:
The enzymes were added at 50, 60, 70, 80 and 90 FPU/g cellulose to control and
extrudate of cold press and solvent extracted samples. The hydrolysis was done and each
sample was measured for the sugar recovery using HPLC. The % total sugars for CP
carinata meal extrudates for 50 (18.37%), 60 (17.82%) and 70 (18.33%) FPU/g cellulose
was almost similar. Higher % total sugars were obtained at 80 (21.71%) and 90 (23.61%)
FPU/g cellulose for CP carinata meal extrudates. For ASE carinata meal extrudates,
almost similar values of % total sugars were obtained for 50 (17.05%), 60 (16.28%), 70
(16.06%), 80 (17.62%) and 90 (17.85%) FPU/g cellulose. The glucose yield for CP
carinata meal extrudates significantly increased (p<0.05) with increase in enzyme
concentration. The glucose yield values for ASE carinata meal extrudates were almost
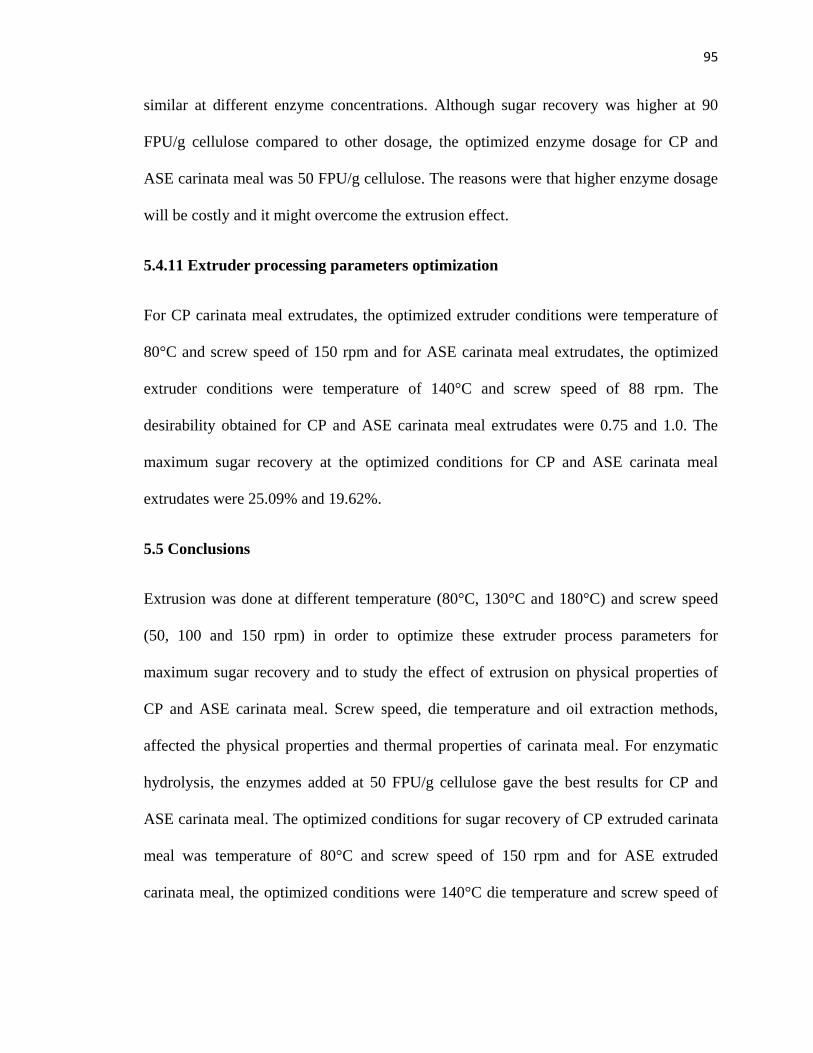
95
similar at different enzyme concentrations. Although sugar recovery was higher at 90
FPU/g cellulose compared to other dosage, the optimized enzyme dosage for CP and
ASE carinata meal was 50 FPU/g cellulose. The reasons were that higher enzyme dosage
will be costly and it might overcome the extrusion effect.
5.4.11 Extruder processing parameters optimization
For CP carinata meal extrudates, the optimized extruder conditions were temperature of
80°C and screw speed of 150 rpm and for ASE carinata meal extrudates, the optimized
extruder conditions were temperature of 140°C and screw speed of 88 rpm. The
desirability obtained for CP and ASE carinata meal extrudates were 0.75 and 1.0. The
maximum sugar recovery at the optimized conditions for CP and ASE carinata meal
extrudates were 25.09% and 19.62%.
5.5 Conclusions
Extrusion was done at different temperature (80°C, 130°C and 180°C) and screw speed
(50, 100 and 150 rpm) in order to optimize these extruder process parameters for
maximum sugar recovery and to study the effect of extrusion on physical properties of
CP and ASE carinata meal. Screw speed, die temperature and oil extraction methods,
affected the physical properties and thermal properties of carinata meal. For enzymatic
hydrolysis, the enzymes added at 50 FPU/g cellulose gave the best results for CP and
ASE carinata meal. The optimized conditions for sugar recovery of CP extruded carinata
meal was temperature of 80°C and screw speed of 150 rpm and for ASE extruded
carinata meal, the optimized conditions were 140°C die temperature and screw speed of

96
88 rpm. For physical and thermal properties, extruder temperature had a more significant
effect (p<0.05) than the screw speed.
97
Figure 5.1. Effect of extruder processing parameters on WAI of CP and ASE carinata
meal extrudates
0.0
0.5
1.0
1.5
2.0
2.5
3.0
3.5
4.0
4.5
5.0
Control 1 2 3 4 5 6 7 8 9
WA
I
EXTRUDER PROCESSING CONDITIONS
CP WAI ASE WAI 1 - 80°C, 50 rpm
2 - 80°C, 100 rpm
3 - 80°C, 150 rpm
4 - 130°C, 50 rpm
5 - 130°C, 100 rpm
6 - 130°C, 150 rpm
7 - 180°C, 50 rpm
8 - 180°C, 100 rpm
9 - 180°C, 150 rpm
98
Figure 5.2. Effect of extruder processing parameters on WSI of CP and ASE carinata
meal extrudates
0
10
20
30
40
50
60
Control 1 2 3 4 5 6 7 8 9
WS
I
EXTRUDER PROCESSING CONDITIONS
ASE WSI CP WSI 1 - 80°C, 50 rpm
2 - 80°C, 100 rpm
3 - 80°C, 150 rpm
4 - 130°C, 50 rpm
5 - 130°C, 100 rpm
6 - 130°C, 150 rpm
7 - 180°C, 50 rpm
8 - 180°C, 100 rpm
9 - 180°C, 150 rpm
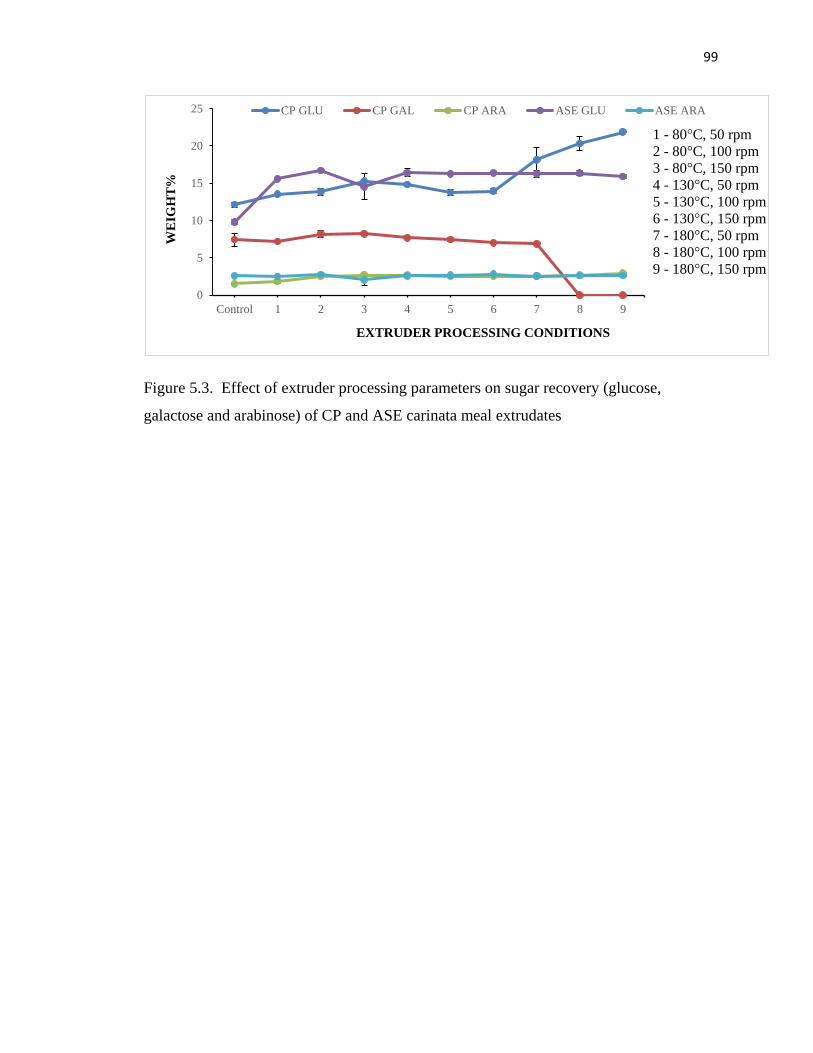
99
Figure 5.3. Effect of extruder processing parameters on sugar recovery (glucose,
galactose and arabinose) of CP and ASE carinata meal extrudates
0
5
10
15
20
25
Control 1 2 3 4 5 6 7 8 9
WE
IGH
T%
EXTRUDER PROCESSING CONDITIONS
CP GLU CP GAL CP ARA ASE GLU ASE ARA
1 - 80°C, 50 rpm
2 - 80°C, 100 rpm
3 - 80°C, 150 rpm
4 - 130°C, 50 rpm
5 - 130°C, 100 rpm
6 - 130°C, 150 rpm
7 - 180°C, 50 rpm
8 - 180°C, 100 rpm
9 - 180°C, 150 rpm
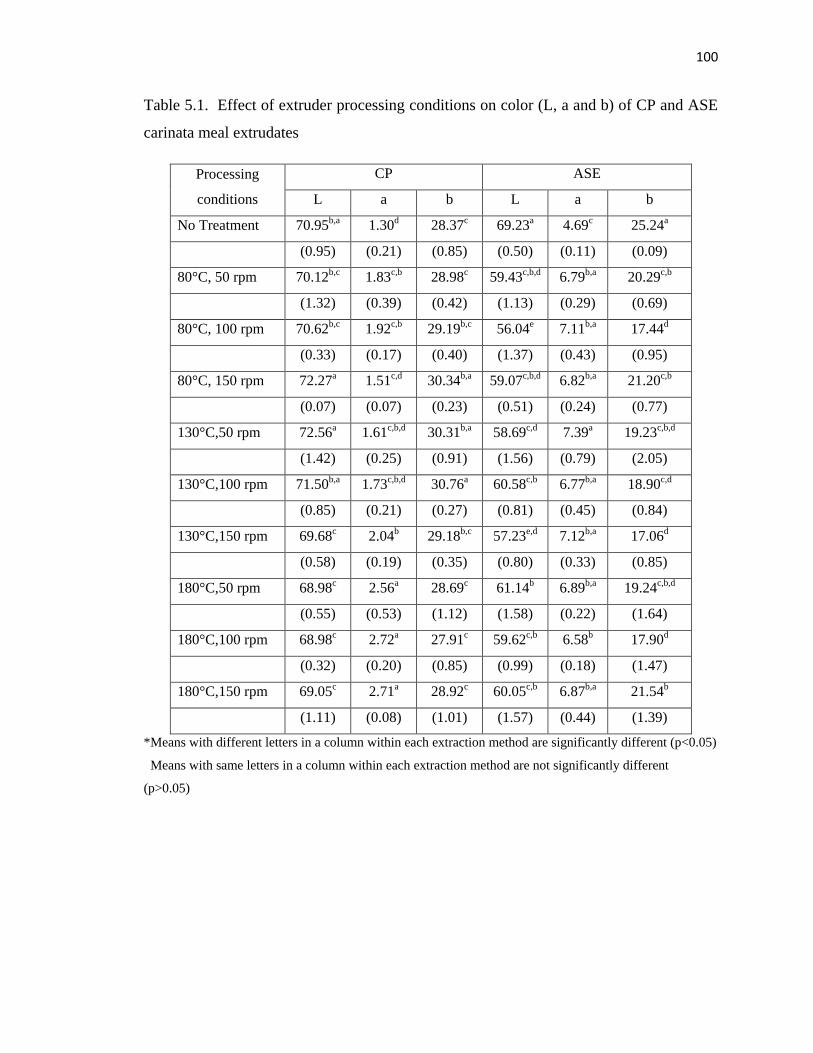
100
Table 5.1. Effect of extruder processing conditions on color (L, a and b) of CP and ASE
carinata meal extrudates
Processing
conditions
CP ASE
L a b L a b
No Treatment 70.95b,a 1.30d 28.37c 69.23a 4.69c 25.24a
(0.95) (0.21) (0.85) (0.50) (0.11) (0.09)
80°C, 50 rpm 70.12b,c 1.83c,b 28.98c 59.43c,b,d 6.79b,a 20.29c,b
(1.32) (0.39) (0.42) (1.13) (0.29) (0.69)
80°C, 100 rpm 70.62b,c 1.92c,b 29.19b,c 56.04e 7.11b,a 17.44d
(0.33) (0.17) (0.40) (1.37) (0.43) (0.95)
80°C, 150 rpm 72.27a 1.51c,d 30.34b,a 59.07c,b,d 6.82b,a 21.20c,b
(0.07) (0.07) (0.23) (0.51) (0.24) (0.77)
130°C,50 rpm 72.56a 1.61c,b,d 30.31b,a 58.69c,d 7.39a 19.23c,b,d
(1.42) (0.25) (0.91) (1.56) (0.79) (2.05)
130°C,100 rpm 71.50b,a 1.73c,b,d 30.76a 60.58c,b 6.77b,a 18.90c,d
(0.85) (0.21) (0.27) (0.81) (0.45) (0.84)
130°C,150 rpm 69.68c 2.04b 29.18b,c 57.23e,d 7.12b,a 17.06d
(0.58) (0.19) (0.35) (0.80) (0.33) (0.85)
180°C,50 rpm 68.98c 2.56a 28.69c 61.14b 6.89b,a 19.24c,b,d
(0.55) (0.53) (1.12) (1.58) (0.22) (1.64)
180°C,100 rpm 68.98c 2.72a 27.91c 59.62c,b 6.58b 17.90d
(0.32) (0.20) (0.85) (0.99) (0.18) (1.47)
180°C,150 rpm 69.05c 2.71a 28.92c 60.05c,b 6.87b,a 21.54b
(1.11) (0.08) (1.01) (1.57) (0.44) (1.39)
*Means with different letters in a column within each extraction method are significantly different (p<0.05)
Means with same letters in a column within each extraction method are not significantly different
(p>0.05)
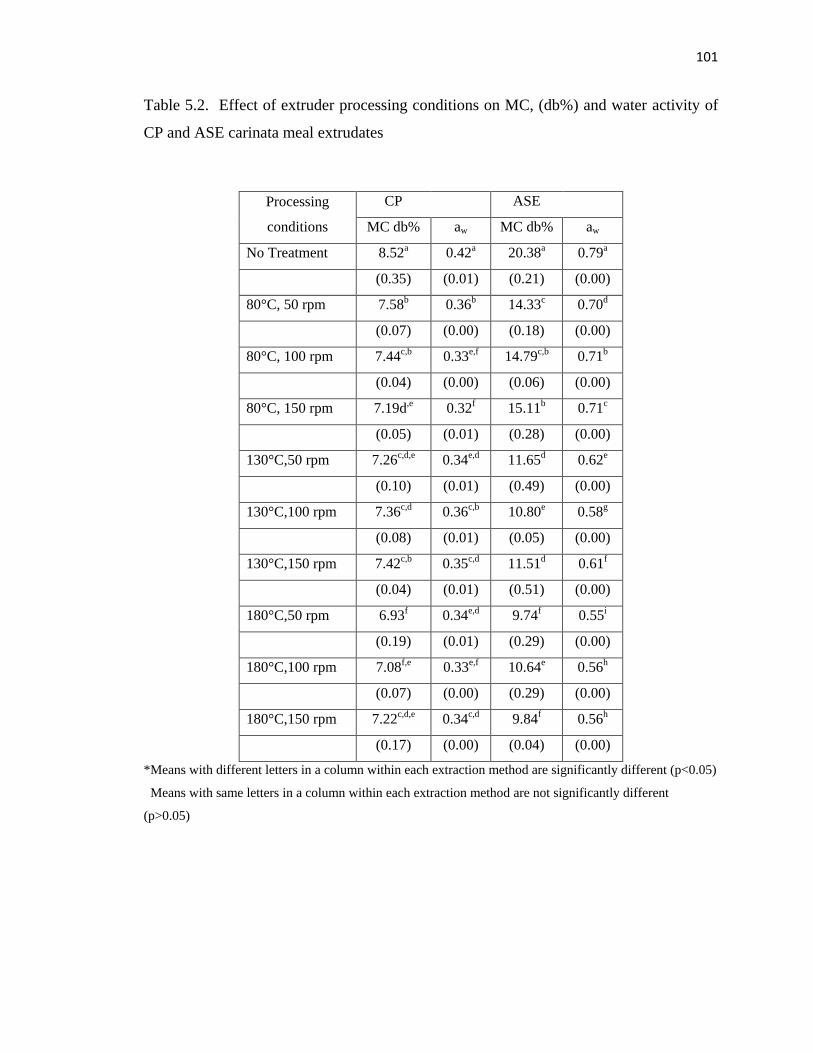
101
Table 5.2. Effect of extruder processing conditions on MC, (db%) and water activity of
CP and ASE carinata meal extrudates
Processing
conditions
CP ASE
MC db% aw MC db% aw
No Treatment 8.52a 0.42a 20.38a 0.79a
(0.35) (0.01) (0.21) (0.00)
80°C, 50 rpm 7.58b 0.36b 14.33c 0.70d
(0.07) (0.00) (0.18) (0.00)
80°C, 100 rpm 7.44c,b 0.33e,f 14.79c,b 0.71b
(0.04) (0.00) (0.06) (0.00)
80°C, 150 rpm 7.19d,e 0.32f 15.11b 0.71c
(0.05) (0.01) (0.28) (0.00)
130°C,50 rpm 7.26c,d,e 0.34e,d 11.65d 0.62e
(0.10) (0.01) (0.49) (0.00)
130°C,100 rpm 7.36c,d 0.36c,b 10.80e 0.58g
(0.08) (0.01) (0.05) (0.00)
130°C,150 rpm 7.42c,b 0.35c,d 11.51d 0.61f
(0.04) (0.01) (0.51) (0.00)
180°C,50 rpm 6.93f 0.34e,d 9.74f 0.55i
(0.19) (0.01) (0.29) (0.00)
180°C,100 rpm 7.08f,e 0.33e,f 10.64e 0.56h
(0.07) (0.00) (0.29) (0.00)
180°C,150 rpm 7.22c,d,e 0.34c,d 9.84f 0.56h
(0.17) (0.00) (0.04) (0.00)
*Means with different letters in a column within each extraction method are significantly different (p<0.05)
Means with same letters in a column within each extraction method are not significantly different
(p>0.05)
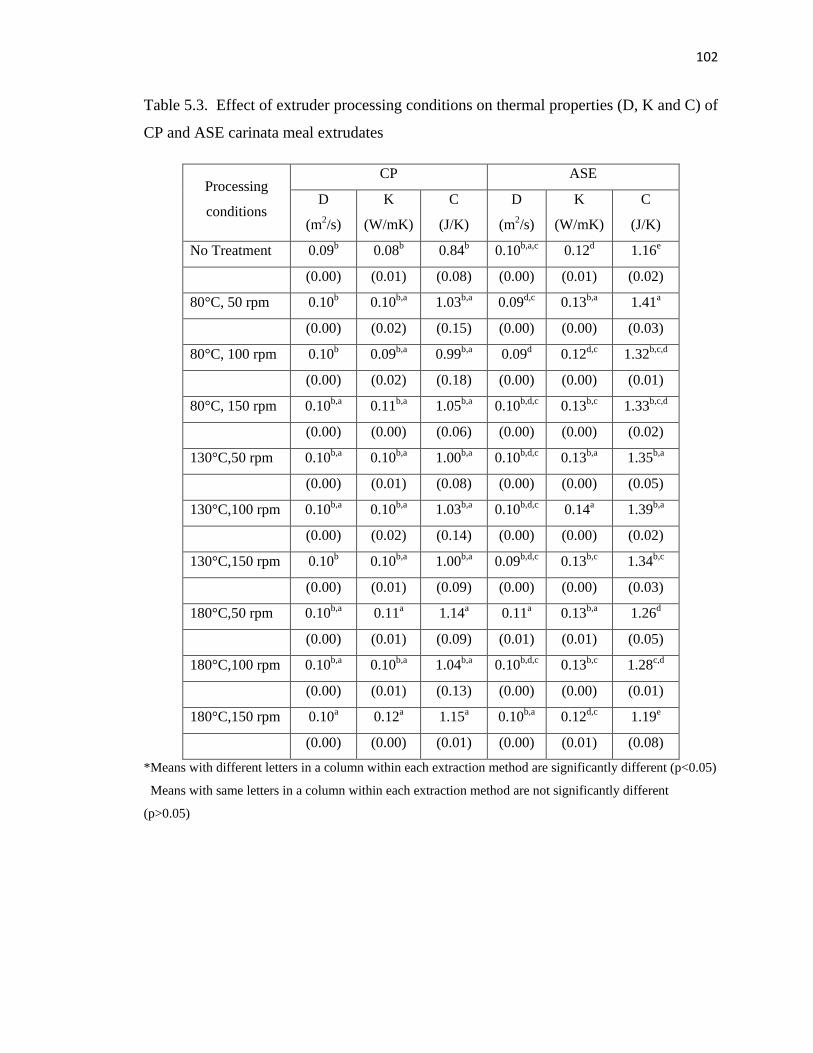
102
Table 5.3. Effect of extruder processing conditions on thermal properties (D, K and C) of
CP and ASE carinata meal extrudates
Processing
conditions
CP ASE
D
(m2/s)
K
(W/mK)
C
(J/K)
D
(m2/s)
K
(W/mK)
C
(J/K)
No Treatment 0.09b 0.08b 0.84b 0.10b,a,c 0.12d 1.16e
(0.00) (0.01) (0.08) (0.00) (0.01) (0.02)
80°C, 50 rpm 0.10b 0.10b,a 1.03b,a 0.09d,c 0.13b,a 1.41a
(0.00) (0.02) (0.15) (0.00) (0.00) (0.03)
80°C, 100 rpm 0.10b 0.09b,a 0.99b,a 0.09d 0.12d,c 1.32b,c,d
(0.00) (0.02) (0.18) (0.00) (0.00) (0.01)
80°C, 150 rpm 0.10b,a 0.11b,a 1.05b,a 0.10b,d,c 0.13b,c 1.33b,c,d
(0.00) (0.00) (0.06) (0.00) (0.00) (0.02)
130°C,50 rpm 0.10b,a 0.10b,a 1.00b,a 0.10b,d,c 0.13b,a 1.35b,a
(0.00) (0.01) (0.08) (0.00) (0.00) (0.05)
130°C,100 rpm 0.10b,a 0.10b,a 1.03b,a 0.10b,d,c 0.14a 1.39b,a
(0.00) (0.02) (0.14) (0.00) (0.00) (0.02)
130°C,150 rpm 0.10b 0.10b,a 1.00b,a 0.09b,d,c 0.13b,c 1.34b,c
(0.00) (0.01) (0.09) (0.00) (0.00) (0.03)
180°C,50 rpm 0.10b,a 0.11a 1.14a 0.11a 0.13b,a 1.26d
(0.00) (0.01) (0.09) (0.01) (0.01) (0.05)
180°C,100 rpm 0.10b,a 0.10b,a 1.04b,a 0.10b,d,c 0.13b,c 1.28c,d
(0.00) (0.01) (0.13) (0.00) (0.00) (0.01)
180°C,150 rpm 0.10a 0.12a 1.15a 0.10b,a 0.12d,c 1.19e
(0.00) (0.00) (0.01) (0.00) (0.01) (0.08)
*Means with different letters in a column within each extraction method are significantly different (p<0.05)
Means with same letters in a column within each extraction method are not significantly different
(p>0.05)
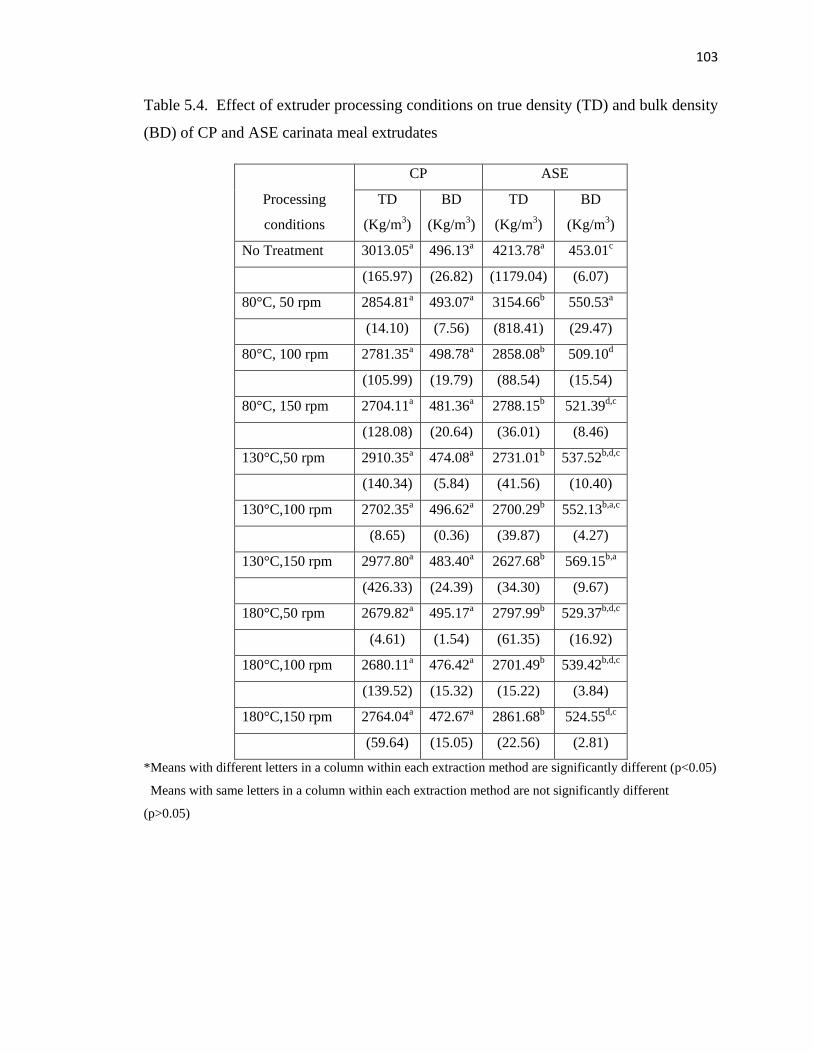
103
Table 5.4. Effect of extruder processing conditions on true density (TD) and bulk density
(BD) of CP and ASE carinata meal extrudates
Processing
conditions
CP ASE
TD
(Kg/m3)
BD
(Kg/m3)
TD
(Kg/m3)
BD
(Kg/m3)
No Treatment 3013.05a 496.13a 4213.78a 453.01c
(165.97) (26.82) (1179.04) (6.07)
80°C, 50 rpm 2854.81a 493.07a 3154.66b 550.53a
(14.10) (7.56) (818.41) (29.47)
80°C, 100 rpm 2781.35a 498.78a 2858.08b 509.10d
(105.99) (19.79) (88.54) (15.54)
80°C, 150 rpm 2704.11a 481.36a 2788.15b 521.39d,c
(128.08) (20.64) (36.01) (8.46)
130°C,50 rpm 2910.35a 474.08a 2731.01b 537.52b,d,c
(140.34) (5.84) (41.56) (10.40)
130°C,100 rpm 2702.35a 496.62a 2700.29b 552.13b,a,c
(8.65) (0.36) (39.87) (4.27)
130°C,150 rpm 2977.80a 483.40a 2627.68b 569.15b,a
(426.33) (24.39) (34.30) (9.67)
180°C,50 rpm 2679.82a 495.17a 2797.99b 529.37b,d,c
(4.61) (1.54) (61.35) (16.92)
180°C,100 rpm 2680.11a 476.42a 2701.49b 539.42b,d,c
(139.52) (15.32) (15.22) (3.84)
180°C,150 rpm 2764.04a 472.67a 2861.68b 524.55d,c
(59.64) (15.05) (22.56) (2.81)
*Means with different letters in a column within each extraction method are significantly different (p<0.05)
Means with same letters in a column within each extraction method are not significantly different
(p>0.05)
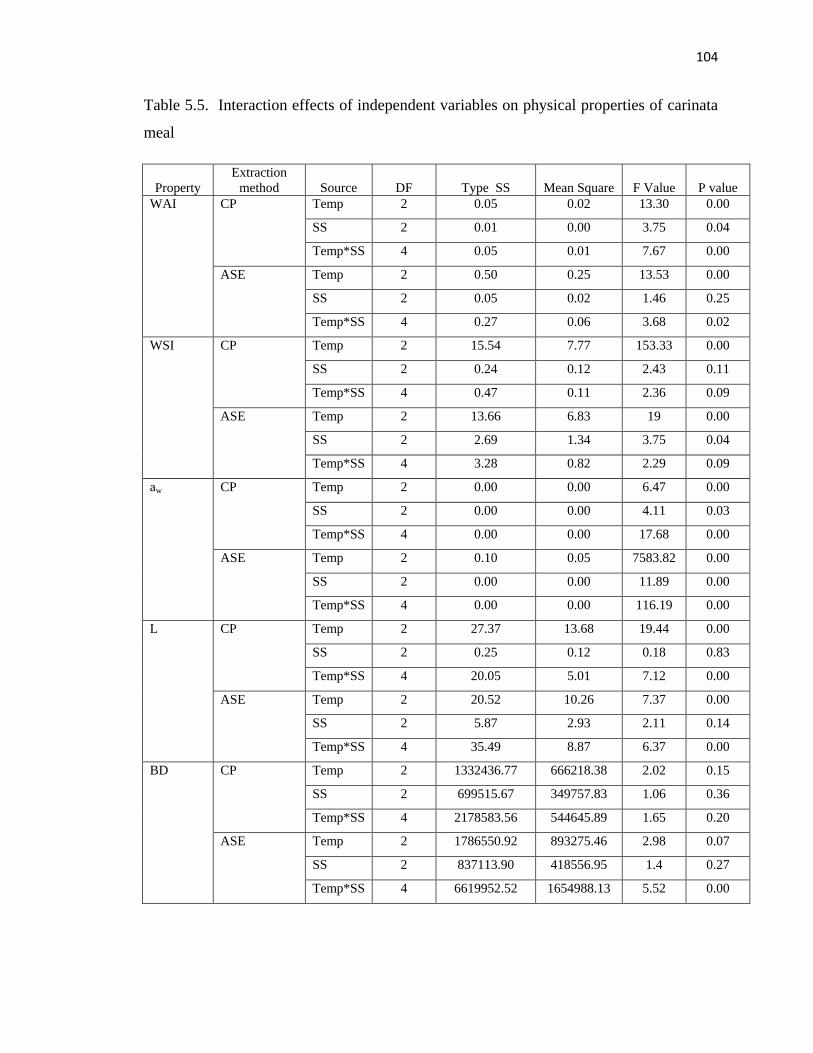
104
Table 5.5. Interaction effects of independent variables on physical properties of carinata
meal
Property
Extraction
method Source DF Type SS Mean Square F Value P value
WAI CP Temp 2 0.05 0.02 13.30 0.00
SS 2 0.01 0.00 3.75 0.04
Temp*SS 4 0.05 0.01 7.67 0.00
ASE Temp 2 0.50 0.25 13.53 0.00
SS 2 0.05 0.02 1.46 0.25
Temp*SS 4 0.27 0.06 3.68 0.02
WSI CP Temp 2 15.54 7.77 153.33 0.00
SS 2 0.24 0.12 2.43 0.11
Temp*SS 4 0.47 0.11 2.36 0.09
ASE Temp 2 13.66 6.83 19 0.00
SS 2 2.69 1.34 3.75 0.04
Temp*SS 4 3.28 0.82 2.29 0.09
aw CP Temp 2 0.00 0.00 6.47 0.00
SS 2 0.00 0.00 4.11 0.03
Temp*SS 4 0.00 0.00 17.68 0.00
ASE Temp 2 0.10 0.05 7583.82 0.00
SS 2 0.00 0.00 11.89 0.00
Temp*SS 4 0.00 0.00 116.19 0.00
L CP Temp 2 27.37 13.68 19.44 0.00
SS 2 0.25 0.12 0.18 0.83
Temp*SS 4 20.05 5.01 7.12 0.00
ASE Temp 2 20.52 10.26 7.37 0.00
SS 2 5.87 2.93 2.11 0.14
Temp*SS 4 35.49 8.87 6.37 0.00
BD CP Temp 2 1332436.77 666218.38 2.02 0.15
SS 2 699515.67 349757.83 1.06 0.36
Temp*SS 4 2178583.56 544645.89 1.65 0.20
ASE Temp 2 1786550.92 893275.46 2.98 0.07
SS 2 837113.90 418556.95 1.4 0.27
Temp*SS 4 6619952.52 1654988.13 5.52 0.00
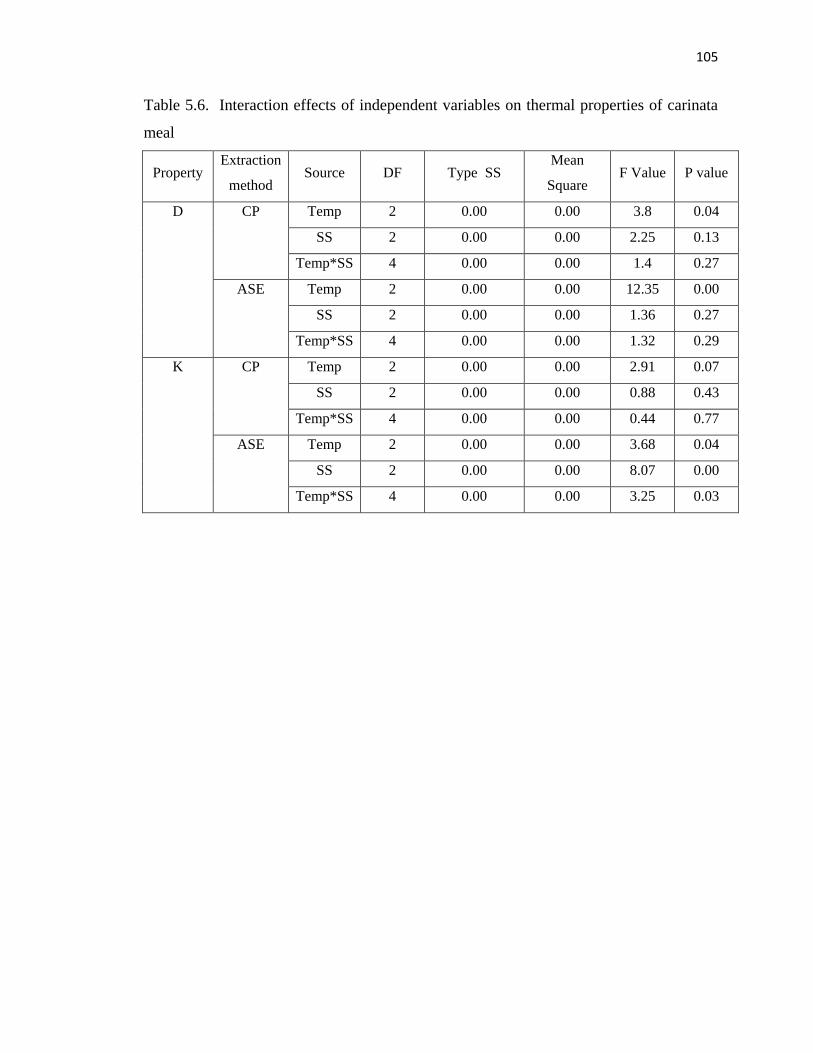
105
Table 5.6. Interaction effects of independent variables on thermal properties of carinata
meal
Property Extraction
method Source DF Type SS
Mean
Square F Value P value
D CP Temp 2 0.00 0.00 3.8 0.04
SS 2 0.00 0.00 2.25 0.13
Temp*SS 4 0.00 0.00 1.4 0.27
ASE Temp 2 0.00 0.00 12.35 0.00
SS 2 0.00 0.00 1.36 0.27
Temp*SS 4 0.00 0.00 1.32 0.29
K CP Temp 2 0.00 0.00 2.91 0.07
SS 2 0.00 0.00 0.88 0.43
Temp*SS 4 0.00 0.00 0.44 0.77
ASE Temp 2 0.00 0.00 3.68 0.04
SS 2 0.00 0.00 8.07 0.00
Temp*SS 4 0.00 0.00 3.25 0.03
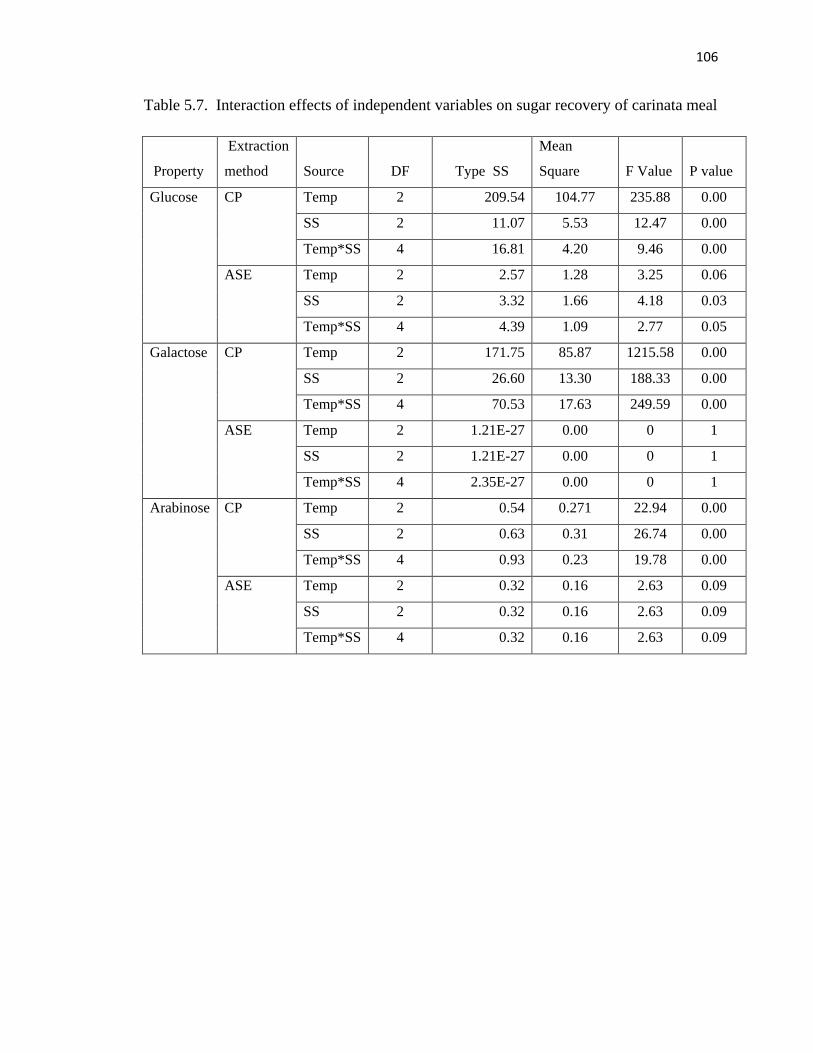
106
Table 5.7. Interaction effects of independent variables on sugar recovery of carinata meal
Property
Extraction
method Source DF Type SS
Mean
Square F Value P value
Glucose CP Temp 2 209.54 104.77 235.88 0.00
SS 2 11.07 5.53 12.47 0.00
Temp*SS 4 16.81 4.20 9.46 0.00
ASE Temp 2 2.57 1.28 3.25 0.06
SS 2 3.32 1.66 4.18 0.03
Temp*SS 4 4.39 1.09 2.77 0.05
Galactose CP Temp 2 171.75 85.87 1215.58 0.00
SS 2 26.60 13.30 188.33 0.00
Temp*SS 4 70.53 17.63 249.59 0.00
ASE Temp 2 1.21E-27 0.00 0 1
SS 2 1.21E-27 0.00 0 1
Temp*SS 4 2.35E-27 0.00 0 1
Arabinose CP Temp 2 0.54 0.271 22.94 0.00
SS 2 0.63 0.31 26.74 0.00
Temp*SS 4 0.93 0.23 19.78 0.00
ASE Temp 2 0.32 0.16 2.63 0.09
SS 2 0.32 0.16 2.63 0.09
Temp*SS 4 0.32 0.16 2.63 0.09
107
CHAPTER 6
CONCLUSIONS AND FUTURE RECOMMENDATIONS
6.1 Conclusions
Enzyme optimization:
1. Canola meal: 60 FPU/g cellulose gave the best results for CP canola meal and
ASE canola meal
2. Camelina meal: 70 FPU/g cellulose gave the best results for CP camelina meal
and ASE camelina meal
3. Carinata meal: 50 FPU/g cellulose gave the best results for CP carinata meal and
ASE carinata meal
Extruder processing parameters optimization:
1. Canola meal: Maximum sugar recovery for CP extruded canola meal was
observed at temperature of 80°C and screw speed of 50 rpm and for ASE
extruded canola meal, 80°C die temperature and screw speed of 100 rpm
2. Camelina meal: CP extruded camelina meal showed maximum sugar recovery
results at temperature of 80°C and screw speed of 50 rpm and for ASE extruded
camelina meal, the optimized conditions observed were 80°C die temperature and
screw speed of 100 rpm.
3. Carinata meal: Temperature of 80°C and screw speed of 150 rpm showed the
maximum sugar recovery for CP extruded carinata meal and for ASE extruded
carinata meal, the optimized conditions recorded were 80°C die temperature and
screw speed of 100 rpm.
108
Physical properties and Thermal properties:
1. Canola meal: Extruder temperature had a significant effect (p<0.05) on physical
properties and thermal properties of CP and ASE canola meal than the screw
speed. Extruder temperature had a significant effect (p<0.05) on WAI, water
activity, color and bulk density of ASE canola meal.
2. Camelina meal: Extrusion had a significant effect (p<0.05) on the thermal
properties of CP camelina meal. No significant effect (p>0.05) of extrusion was
observed for WAI, WSI, color (L), bulk density of CP and ASE camelina meal. It
was observed that during extrusion, extruder temperature had a greater effect than
screw speed.
3. Carinata meal: For physical and thermal properties of carinata meal extrudates,
extruder temperature had a more significant effect (p<0.05) than the screw speed.
Extruder temperature had a significant effect (p<0.05) on WAI, WSI, water
activity, color and moisture content on dry basis MC, (db%) of CP and ASE
carinata meal extrudates. No significant effect (p>0.05) of extruder temperature
and screw speed was observed on bulk density and true density of CP and ASE
carinata meal extrudates.
6.2 Future recommendations
1. Physical properties of cold press extracted and solvent extracted canola, camelina
and carinata meal extrudates should be compared
2. Sugar recovery of cold press extracted and solvent extracted canola, camelina and
carinata meal extrudates should be compared
109
3. Pre-treatment of oilseed meals using microwave treatment should be studied
4. Fermentation of pre-treated oilseed meals (canola, camelina and carinata) using
particular micro-organisms to convert the sugars into protein should be
investigated
5. Feeding the prepared fish feed of canola, camelina and carinata meal to different
fish and how they react to the feed should be studied
110
REFRENCES
AACC 44-19. 1995. Mosture - Air Oven Method, Drying at 135oC. AACC Approved
Methods (9th edition). St. Paul, MN, USA.
Alves, R. M. L., Grossmann, M. V. E. and Silva, R. S. S. 1999. Gelling properties of
extruded yam (Dioscorea alota) starch. Food Chemistry, 67: 123–127.
Anderson, R. A. 1982. Water absorption and solubility and amylograph characteristics on
roll cooked small grain products. Cereal Chemistry, 59: 265-269.
Anjou, K. and Fecske, A., 1974. The production of rapeseed protein concentrate. Proc. 4.
Intern. Rapskongr., Giessen, 659.
AOAC 1984. Official Methods of Analysis. Washington DC: Association of Official
Analytical Chemists.
Arhaliass, A., Bouvier, J.M. and Legrand, J. 2003. Melt growth and shrinkage at the exit
of the dye in the extrusion cooking process. Journal of Food Engg., 60(2): 185-
192.
Ash, M., and Dohlman, E. 2006. Oil crops situation and outlook yearbook. Electronic
outlook report from the Economic Research Service. United States Department of
Agriculture.
Badrie, N. and W., Mellowes. 1991. Effect of extrusion variables on cassava extrudate.
Journal of Food Science, 56(5): 1334–1337. http://dx.doi.org/10.1111/j.1365-
2621.1991.tb04766.x.
Barraquio, V. L., and Van de Voort, F. R. 1988. Milk and soy proteins: their status in
review. Canadian Institute of Food Science and Technology Journal, 21(5): 477–
493.
Barro, F.; Fernandez-Escobar, J.; De La Vega, M. and Martín, A. 2011. Doubled haploid
lines of Brassica carinata with modified erucic acid content through mutagenesis
by EMS treatment of isolated microspores. Plant Breed. 120: 262−264.
111
Beardsell, D., Francis, J. and Ridley, D. 2002. Health promoting constituents in plant
derived edible oils. Journal of Food Lipids 9: 1–34.
Beguin, P., and Aubert, J.-P., 1994. The biological degradation of cellulose. FEMS
Microbiol. Rev. 13: 25–58.
Bell, J. M. and Shires, A., 1982. Composition and Digestibility by Pigs of Hull Fractions
from Rapeseed Cultivars with Yellow or Brown Seed Coats. Can. J. Anim. Sci.62:
557-565.
Bhattacharya, S. and Prakash, M. 1994. Extrusion cooking of blends of rice and chickpea
flour: A response surface analysis. Journal of Food Eng. 21:315-330.
Bjerre, A.B., Olesen, A.B., and Fernqvist, T., 1996. Pretreatment of wheat straw using
combined wet oxidation and alkaline hydrolysis resulting in convertible cellulose
and hemicellulose. Biotechnol. Bioeng. 49: 568–577.
Bjorck, I., and Asp, N. G. 1983. The effects of extrusion cooking on nutritional value - A
literature review. Journal of Food Engineering, 2(4): 281-308.
http://dx.doi.org/10.1016/02608774(83)90016-X
Blanche, S., Sun, X. 2004. Physical characterization of starch extrudates as a function of
melting transitions and extrusion conditions. Advances in Polymer Technology
23(4): 277–290. http://dx.doi.org/10.1002/adv.20017.
Bonjean, A., and F. Le Goffic. 1999. La came´line—Camelina sativa (L.) Crantz: Une
opportunite´ pour l’agriculture et l’industrie Europe´ennes. Oleagineux Corps gras
Lipides 1:28–34.
Bouvier, J.M. and Brisset, A. 2006. Aquafeed twin screw extrusion processing. Asian
Aquafeeds: Current Developments in the Aquaculture Feed Industry. Malaysian
Fisheries Society Occasional Publication No. 13, Kuala Lumpur, Malaysia. pp.
76-104. Available at: http://affris.org/tilapia/tables/pdf/bouvier.pdf. 1 May, 2012.
112
Braudo, E. E., Plashchina, I. G., & Schwenke, K. D. 2001. Plant protein interactions with
polysaccharides and their influence on legume functionality. A review. Nahrung,
45(6): 382–384.
Budin, J.T., Breene, W.M., Putnam, D.H., 1995. Some compositional properties of
Camelina (Camelina sativa L. Crantz) seeds and oils. J. Am. Oil Chem. Soc. 72:
309–315.
Calvo, L., M.J. Cocero, and J.M. Diez,. 1994. Oxidative Stability of Sunflower Oil
Extracted with Supercritical Carbon Dioxide, Ibid. 71:1251–1254.
Camire, M. E., Caminre, A. and Krumhar, K. 1990. Chemical and nutritional changes in
foods
during extrusion. Critical Reviews in Food Science Nutrition. 29(1):35–57.
Camire, M. E., Chaovanalikit, A., Dougherty, M. P. and Briggs, J. L. 2003. Blueberry
and anthocyanins as breakfast cereal colorants. Journal of Food Science. 67(1):
438-441.
Canola Council of Canada. 1990. Canola oil and meal: standards and regulations.
Winnipeg, Manitoba: Canola Council of Canada Publication. 4 p.
Canola Council of Canada. 2009. Canadian Canola Industry. Overview of Canada’s
Canola Industry [Internet]. Winnipeg, Manitoba: Canola Council of Canada.
Available from: http://www.canolacouncil.org/ind_overview.aspx. Accessed Oct
16, 2009.
Cantwell, B.A., Sharp, P.M., Gormley, E., Mcconnell, D.J., 1988. Molecular cloning of
bacillus b-glucanases. In: Aubert, J.P., Beguin, P., Millet, J. (Eds.), Biochemistry
and Genetics of Cellulose Degradation. Academic Press, San Diego, CA, pp. 181–
201.
Chen, S.S. and Spiro, M. 1995. Kinetics of microwave extraction of Rosemary leaves in
Hexane, Ethanol and a Hexane + Ethanol mixture. Flavor and Fragrance Journal,
10: 101-112.
113
Chevanan, N., K., Muthukumarappan, K.A., Rosentrater, and J.L., Julson. 2007a. Effect
of die dimensions on extrusion processing parameters and properties of DDGS-
based aquaculture feeds. Cereal Chemistry, 84: 389-398. DOI: 10.1094/CCHEM-
84-4-0389.
Chevanan, N., Rosentrater, K. A., and Muthukumarappan, K. A. 2007c. Effect of DDGS,
moisture content, and screw speed on the physical properties of extrudates in
single screw extrusion. Cereal Chemistry, 85 (2): 132-139.
Chevanan, N., K., Muthukumarappan and K.A., Rosentrater. 2009. Extrusion Studies of
Aquaculture Feed using Distillers Dried Grains with Solubles and Whey. Food
Bioprocess Technol 2:177–185
Choi, Y., and M. R. Okos. 1983. The Thermal Properties of Tomato Juice Concentrates.
Transaction of the ASAE.
Choi, Y., and Okos, M. R. 1986. Effects of temperature and composition on the thermal
properties of foods. In: Food Engineering and Process Applications: Transport
Phenomena, Vol. 1. Rao, M.A., and Rizvi, S.S.H. (Eds) Elsevier Applied Science
Publishers, Great Britain, London. pp. 93-101.
Chosdu, R., Hilmy, N., Erizal, Erlinda, T.B., and Abbas, B., 1993. Radiation and
chemical pretreatment of cellulosic waste. Radiat. Phys. Chem. 42: 695–698.
Christensen, C. 1985 Effect of color on judgments of food aroma and flavor intensity in
young and elderly adults, Perception, 14: 755.
Clydesdale, F. M. 1984. Influence of colour on sensory perception and food choices, in
Developments in Food Colours — 2, Walford, J., Ed., Elsevier Applied Science,
New York, 75.
Colonna, P. and C., Mercier. 1983. Macromolecular modifications of manioc starch
components by extrusion-cooking with and without lipids. Carbohydrate
Polymers, 3(2): 87-108. http://dx.doi.org/10.1016/0144-8617(83)90001-2.
114
Coughlan, M.P., and Ljungdahl, L.G., 1988. Comparative biochemistry of fungal and
bacterial cellulolytic enzyme system. In: Aubert, J.-P., Beguin, P., Millet, J.
(Eds.), Biochemistry and Genetics of Cellulose Degradation, pp. 11–30.
Cruz-Suarez, L.E., Ricque-Marie, D., Tapia-Salazar, M., McCallum, I.M. and Hickling,
D. 2001. Assessment of differently processed feed pea (Pisum sativum) meals and
canola meal Brassica sp. in diets for blue shrimp (Litopenaeus stylirostris).
Aquaculture 196: 87–104
Cumby, N., Zhong, Y., Naczk, M., and Shahidi, F. 2008. Antioxidant activity and water-
holding capacity of canola protein hydrolysates. Food Chemistry, 109: 144–148.
Cumming, D. B., Stanley, D. W., and Deman, J. M. 1973. Fate of water soluble soy
protein during thermoplastic extrusion. Journal of Food Science, 38(2): 320.
Dale, B.E., J.Weaver and F.M.Byers. 1999. Extrusion Processing for Ammonia Fiber
Explosion (AFEX). Applied Biochemistry and Biotechnology . 77-79:35-45.
de Vrije, T., G.G. de Haas, G.B. Tan, E.R.P. Keijsers, and P.A.M. Claassen. 2002.
Pretreatment of Miscanthus for hydrogen production by Thermotoga elfi.
International Journal of Hydrogen Energy. 27:1381-1390.
Deak, N.A., Johnson, L.A., Lusas, E.W. and Rhee, K.C. 2008. Soy protein products,
processing, and utilization. In: Johnson LA, White PJ, Galloway R (eds)
Soybeans: Chemistry, Production, Processing, and Utilization. AOCS Press.
Urbana, IL. pp 661-724
Ding, Q., Paul A., Andrew P., Gregory T. and Hayley M., 2006. The effect of extrusion
conditions on the functional and physical properties of wheat-based expanded
snacks. Journal of Food Engineering 73: 142–148
Diosady, L. L., Paton, D., Rosen, N., Rubin, L. J. and Athanassoulias, C. 1985. Journal
of Food Science 50: 1697-1699, 1706.
115
Dubose, C. N., Cardello, A. V., and Muller, O. 1980. Effects of colorants and flavorants
on identification, perceived flavor intensity and hedonic quality of fruit flavored
beverages and cake, Journal of Food Science., 45: 1393.
Duff, S.J.B. and Murray, W.D., 1996. Bioconversion of forest products industry waste
cellulosics to fuel ethanol: a review. Bioresour. Technol. 55: 1–33.
Duncan, A. J. 1991. Glucosinolates. In F. J. P. D’Mello, J. P. Duffus, & C. M. Duffus
(Eds.), Toxic substances in crop plants (pp. 126–147). Cambridge, Science Park:
The Royal Society of Chemistry, Thomas Graham House.
Durand, H., Baron, M., Calmels, T. and Tiraby, G., 1988. Classical and molecular
genetics applied to Trichoderma reesei for the selection of improved cellulolytic
industrial strains. In: Aubert, J.P., Beguin, P., Millet, J. (Eds.), Biochemistry and
Genetics of Cellulose Degradation. Academic Press, San Diego, CA, pp. 135–
151.
Ebling, J.M. and Jenkins, B.M. 1985. Physical and chemical properties of biomass fuels.
Transactions of the ASAE 28(3): 898–902.
El-Zalaki, L. M., Gomaa, E. G., and Abdel-Rahman, A. Y. 1995. Peanut protein:
Functional properties and nutritional studies. Rivista Italiana delle Sostanze
Grasse, 72(11): 505–508.
Ezzell, J.L., Richter, B.E., Felix, W.D., Black, S.R. and Meikle, J.E. 1995. A
Comparison of Accelerated Solvent Extraction with Conventional Solvent
Extraction for Organophosphorus. Pesticides and Herbicides, LC-GC 13:390–398
Ezzell, J., B. Richter and E. Frances, 1996. Am. Environ. Lab. 8, 12
Fan, L.T., Gharpuray, M.M. and Lee, Y.-H., 1987. In: Cellulose Hydrolysis
Biotechnology Monographs. Springer, Berlin, p. 57.
Gaosong, J. and Vasanthan, T. 2000. Effect of the extrusion cooking on the primary
structure and water solubility of β-glucans from regular and waxy barley. Cereal
Chem, 77(3): 396-400.
116
Ganzler, K., A. Salgo, and K. Valko. 1986. Microwave Extraction: A Novel Sample
Preparation Method for Chromatography, J. Chromatogr. 371:299–306.
Getinet, A., Rakow, G., Raney, J. P. and Downey, R. K. 1994. Development of zero
erucic acid Ethiopian mustard through an interspecific cross with zero erucic acid
Oriental mustard. Can. J. Plant Sci. 74: 793−795.
Getinet, A.; Rakow, G. and Downey, R. K. 1996. Agronomic performance and seed
quality of Ethiopian mustard in Saskatchewan. Can. J. Plant Sci. 76: 387−392.
Gifford, S. R. and Clydesdale, F. M. 1986. The psychophysical relationship between
color and sodium chloride concentrations in model systems, J. Food Prot.,
49:977.
Gifford, S. R., Clydesdale, F. M., and Damon, R. A., Jr. 1987. The psychophysical
relationship between color and salt concentration in chicken flavored broths, J.
Sensory Stud., 2: 137.
Gillberg L. and Tornell, B. 1977. Preparation of rapeseed protein isolates: Dissolution
and precipitation behavior of rapeseed proteins. J. Food Sci. 41: 1063.
Gil-Humanes, J.; Martín, A. and Barro, F. 2011. Characterization of a collection of
Brassica carinata genotypes for in vitro culture response and mode of shoot
regeneration. Am. J. Plant Sci. 2: 27−34.
Govindasamy, S., O.H., Campanellab, and C.G., Oatesa. 1996. High moisture twin-screw
extrusion of sago starch: 1. Influence on granule morphology and structure.
Carbohydrate. Polymers, 30(4): 275-286. http://dx.doi.org/10.1016/S0144-
8617(96)00024-0.
Gueguen, J., Sanchez-Vioque, R., & Malabat, C. 1999. Plant proteins: a source of
multifunctional macromolecules. Oleagineux, Corps Gras, Lipides, 6(6): 498–
504.
117
Gugel, R. K., Seguin-Swartz, G. and Petrie, G. A. 1990 Pathogenicity of three isolates of
grape Leptosphaeria maculans on Brassica species and other crucifers. Can. J.
Plant Pathol. 12: 75−82.
Gugel, R.K. and Falk, K.C., 2006. Agronomic and seed quality evaluation of Camelina
sativa in western Canada. Can. J. Plant Sci. 86: 1047–1058.
Gwiazda, S., Noguchi, A., and Saio, K. 1987. Microstructural studies of texturized
vegetable protein products: Effects of oil addition and transformation of raw
materials in various sections of a twin screw extruder. Food Microstructure, 6:
57–61.
Heldman, D. R. 2003. Encyclopedia of Agricultural, food, and Biological Engineering.
CRC Press, Technology and Engineering. pp. 1004.
Higl, B., Kurtmann, L., Carlsen, C.U., Ratjen, J., Först, P., Skibsted, H. L., Kulozik, U.,
and Risbo, J. 2007. Impact of water activity, temperature, and physical state on
the storage stability of Lactobacillus paracasei ssp. paracasei freeze-dried in a
lactose matrix. Biotechnology Progress. 23(4): 794-800.
Higgs, D.A., Dosanjh, B.S., Prendergast, A.F., Beames, R.M., Hardy, R.W., Riley, W.,
Deacon, G., 1996. Use of rapeseed/canola protein products in finfish diets. In:
Lim, C.E., Sessa, D.J. (Eds.), Nutrition and Utilization Technology in
Aquaculture. AOCS Press, Champaign, IL, USA, pp. 130–156.
Hilton, J.W. and Slinger, S.J., 1986. Digestibility and utilization of canola meal in
practical-type diets for rainbow trout (Salmo gairdneri). Can. J. Fish. Aquat. Sci.
43: 1149–1155.
Hites, R.A., Foran, J.A., Carpenter, D.O., Hamilton, M.C., Knuth, B.A. and Schwager,
S.J., 2004. Global assessment of organic contaminants in farmed salmon. Science
303: 226–229.
Hollenbach, A. M., M. Peleg, and R. Rufner. 1982. Effect of four anticaking agents on
the bulk characteristics of ground sugar. Journal of Food Science, 47: 538-544
118
Hu, Z.H. and Wen, Z.Y. 2008. Enhancing enzymatic digestibility of switchgrass by
microwave-assisted alkali pretreatment. BiochemEng J 38:369–78.
Igathinathane, C., et. al. 2009. Hygroscopic Moisture Sorption Kinetics Modeling of
Corn Stover and its Fractions. Applied Engineering in Agriculture, 25(1): 65-73.
Ilo, S., Tomschik, E. U., Berghofer, U., and Mundigler, N. 1996. The effects of extrusion
operating conditions on the apparent viscosity and properties of extrudates in twin
screw extrusion cooking of maize grits. Lebensmittel-Wissenschaft und-
Technologie, 29: 593–598.
Ingersoli, L. R., O. J. Zobel and A. C. Ingersoll. 1954. Heat conduction with engineering
and geological applications. McGraw-Hill Book Co., New York. pp. 143-147.
Jamali, A., M. Kouhila, L. Ait Mohamed, J.T. Jaouhari, A. Idlimam and N. Abdenouri,
2006. Sorption isotherms of Chenopodium ambrosioides leaves at three
temperatures. Food Engineering Journal, 72: 77-84.
Jin, Z., F. Hsiehl, and H. E. Huff, 1994. Effects of soy fiber, salt, sugar and screw speed
on physical properties and microstructure of corn meal extrudate. Journal of
Cereal Science 22: 185-194
Johnson, J. L. and Clydesdale, F. M. 1982. Perceived sweetness and redness in colored
sucrose solutions, J. Food Sci., 47: 747.
Johnson, J. L., Dzendolet, E., and Clydesdale, F. M. 1983. Psychophysical relationship
between sweetness and redness in strawberry flavored drinks, J. Food Prot., 46:
21, 28.
Johnson, J. L., Dzendolet, E., Damon, E., Sawyer, M., and Clydesdale, F. M. 1982.
Psychophysical relationships between perceived sweetness and color in cherry
flavored beverages, J. Food Prot., 45: 606.
Jurisic, V., Karunanithy, C., Julson, J.L. and Kricka, T. 2009. Effect of extrusion
pretreatment on enzymatic hydrolysis of miscanthus. ASABE Paper No. 097178.
St. Joseph, Mich.: ASABE.
119
Kaliyan, N. and Morey. R.V., 2009. Densification Characteristics of Corn Stover and
Switchgrass. Transactions of the ASABE,52(3): 907-920
Kao, T.H., Chien, J.T. and Chen, B.H. 2008. Extraction yield of isoflavones from
soybean cake as affected by solvent and supercritical carbon dioxide. Food Chem
107(4):1728-1736
Karunanithy, C. and Muthukumarappan, K. 2009a. Influence of extruder temperature and
screw speed on pretreatment of corn stover while varying enzymes and their
ratios. Applied Biochemistry and Biotechnology DOI:10.1007/s12010-009-8757-
y.
Karunanithy, C. and Muthukumarappan, K. 2009b. Effect of compression ratio on
biomass pretreatment. ASABE Paper No. 096759. St. Joseph, Mich.: ASABE.
Karunanithy, C. and Muthukumarappan, K. 2009c. Optimization of biomass and high
shear bioreactor parameters for enzymatic hydrolysis using response surface
methodology. ASABE Paper No. 096677. St. Joseph, Mich.: ASABE.
Karuppuchamy, V. and Muthukumarappan, K. 2009 Extrusion Pretreatment and
Enzymatic Hydrolysis of Soybean Hulls. ASABE Paper No: BIO-097989: 2009
Bioenergy Engineering Conference, October 11-14, 2009.
Karuppuchamy, V., Muthukumarappan, K. and Karunanithy, C. 2011. Ultrasonication of
Defatted Soybean Meal to Improve Sugar Release. ASABE Annual International
Meeting, Louisville, Kentucky, August 7-10, 2011, Paper Number: 1110968.
Kimber, D.S. and McGregor, D.I. 1995. The species and their origin, cultivation and
world production. In: Kimber DS, McGregor DI, editors. Brassica oilseeds:
production and utilization. Wallingford, England: CAB Intl. p 1–7.
Kite, F. E., Schoch, T. J., and Leach, H. W. 1957. Granule swelling and paste viscosity of
thick boiling starches. Bakers Dig. 31 (4): 42-44.
Kokini, J. L., Ho, C. T., & Karwe, M. V. 1992. Food extrusion science and technology.
New York, USA: Marcel Dekker.
120
Koski, A., Pekkarinen, S., Hopia, A., Wähälä, K. and Heinonen, M. 2003. Processing of
rapeseed oil: Effects on sinapic acid derivative content and oxidative stability.
Eur. Food Res. Technol. 217: 110–114.
Lam, P.S. 2008. Effect of Particle Size and Shape on Physical Properties of Biomass
Grinds. Presentation Paper (080014) - 2008 ASABE Annual International
Meeting -Providence, RI.
Lam, P.S., et. al. 2007. Physical Characterization of Wet and Dry Wheat Straw and
Switchgrass-Bulk and Specific Density. Presentation Paper (076058) - 2007
ASABE Annual International Meeting - Minneapolis, MN.
Lampart-Szczapa, E. 2001. Legume and oilseed proteins. In Z. E. Sikorski (Ed.),
Chemical and functional properties of food proteins (pp. 407–436). Technomic
Publishing Company.
Lauf RJ, Bible DW, Johnson AC and Everliegh CA. 1993. 2–18 GHz broadband
microwave heating systems. Microwave Journal, 36(11):24–27.
Leatherland, J.F. and Hilton, J.W., 1988. Thyroidal compensation in rainbow trout
(Salmo gairdneri) fed canola meal. Fish Phys. Biochem. 5: 199–207.
Lecker, G. and Rodriguez-estrada, M.T. 2000. Chromatographic analysis of
unsaponifiable compounds of olive oils and fat-containing foods. J. Chromatogr.
A 881: 105–129.
Lee, S.H., Teramoto, Y., and Endo,T. 2009. Enzymatic saccharification of woody
biomass micro/nanofibrillated by continuous extrusion process I – Effect of
additives with cellulose affinity. Bioresource Technology. 100:275-279.
Li, C., Knierim, B., Manisseri, C., Arora, R., Scheller, H.V., Auer, M., Vogel, KP.,
Simmons, BA., and Singh, S. 2010. Comparison of dilute acid and ionic liquid
pretreatment of switchgrass: Biomass recalcitrance, delignification and enzymatic
saccharification, Biores Technol, 101 (13): 4900-4906.
121
Lin, S., Huff, H. E., and Hsieh, F. 2000. Texture and chemical characteristics of soy
protein meat analog extruded at high moisture. Journal of Food Science, 65: 264–
269.
List, G.R., and J.P. Friedrich, 1989. Oxidative Stability of Seed Oils Extracted with
Supercritical Carbon Dioxide, J. Am. Oil Chem. Soc. 66:98–100.
Ma, H., Liu, W.W., Chen, X. 2009. Enhanced enzymatic saccharification of rice straw
by microwave pretreatment. Bioresource Technol 100:1279–84.
Maga, J. A., 1973. Influence of freshness and color on potato chip sensory preferences, J.
Food Sci., 38, 1251.
Malik, R. S. 1990. Prospects for Brassica carinata as an oilseed crop in India. Exp. Agric.
26,: 125−129.
Mani, S., Tabil, L. and Sokhansanj, S. 2004. Grinding performance and physical
properties of wheat and barley straws, corn stover and switchgrass. Biomass and
Bioenergy, 27: 339–352.
Marczak, E. D., Usui, H., Fujita, H., Yang, Y., Yokoo, M., Lipkowski, A. W., et al. 2003.
New antihypertensive peptides isolated from rapeseed. Peptides, 24: 791–798.
Mariama, I., Choa, K. Y., & Rizvia, S. S. H. 2008. Thermal properties of starch-based
biodegradable foams produced using supercritical fluid extrusion (SCFX).
International J Food Properties, 11(2):415-426.
McKendry, P. 2002. Energy production from biomass (part 1): Overview of biomass.
Bioresour. Technol. 83(1): 37‐46.
McMillan, J.D., 1994. Pretreatment of lignocellulosic biomass. In Himmel ME, baker
JO., and Overend RP (Eds) Enzymatic conversion of biomass for fuels
production, American Chemical Society, Washington, DC, pp 292-324.
122
Menegassi, B., A.M.R., Pilosofb, and A.G. José. 2011. Comparison of properties of
native and extruded amaranth (Amaranthus cruentus L. – BRS Alegria) flour.
LWT - Food Science and Technology, 44(9): 1915-1921.
Millet, M.A., Baker, A.J. and Scatter, L.D. 1976. Physical and chemical pretreatment for
enhancing cellulose saccharification. Biotech. Bioeng. Symp. 6, 125–153.
Moloney, A.P., Woods, V.B. and Crowley, J.G. 1998. A note on the nutritive value of
camelina meal for beef cattle. Irish Journal of Agricultural and Food Research
37: 243-247.
Montanari, L., Fantozzi, P., Snyder, J.M. and King, J.W. 1997 Selective extraction of
phospholipids from soybeans with supercritical carbon dioxide and ethanol. 4th
Italian Conference on Supercritical Fluids and Their Applications. Capri, Italy.
pp. 87-93
Muthukumarappan, K. and Julson, J.L. 2007. Pretreatment of biomass using a novel
extrusion process. 15th
European Biomass Conference & Exhibition from
Research to Market Development, Berlin, Germany, 7-11 May 2007.
Mwachireya, S.A., Beames, R.M., Higgs, D.A. and Dosanjh, B.S., 1999. Digestibility of
canola protein products derived from the physical, enzymatic and chemical
processing of commercial canola meal in rainbow trout Oncorhynchus mykiss
(Walbaum) held in fresh water. Aquacult. Nutr. 5: 73–82.
Nabloussi, A. , A. Márquez-Lema, J. M. Fernández-Martínez, and L. Velasco, 2008.
Novel seed oil types of Ethiopian mustard contaning high levels of
polyunsaturated fatty acids, Industrial Crops and Products, 27: 359-363
New, M.B.,Wijkstr¨om, U.N., 2002. Use of Fishmeal and Fishoil in Aquafeeds: Further
Thoughts on the Fishmeal Trap, FAO Fish Circ. No. 975. FAO, Rome, Italy.
Newkirk, R. W., H. L. Classen, and M. J. Edney 2003a. Effects of prepress-solvent
extraction on the nutritional value of canola meal for broiler chickens. Anim. Feed
Sci. Technol. 104:111–119.
123
Ooshima, H., Aso, K., and Harano, Y. 1984. Microwave treatment of cellulosic materials
for their enzymatic hydrolysis. BiotechnolLett 5:289–94.
Orpin, C.G., 1988. Genetic approaches to the improvement of lignocellulose degradation
in the rumen. In: Aubert, J.P., Beguin, P., Millet, J. (Eds.), Biochemistry and
Genetics of Cellulose Degradation. Academic Press, London, pp. 171–179.
Pan, X.; Caldwell, C. D.; Falk, K. C. and Lada, R. 2012. The effect of cultivar, seeding
rate and applied nitrogen on Brassica carinata seed yield and quality in contrasting
environments. Can. J. Plant Sci. 92: 961−971.
Parker, T. D., Adams, D. A., Zhou, K., Harris, M. and Yu, L. 2003. Fatty acid
composition and oxidative stability of cold-pressed edible seed oils. J. Food Sci.
68: 1240-1243.
Pastuszewska, B., Ochtabinska, A. and Morawski, A. 2000. A note on the nutritional
adequacy of stock diets for laboratory rats and mice. J Anim Feed Sci 9(3):533–
42.
Pedroche, J. , M.M. Yust, H Lqari, J. Girón-Calle, M. Alaiz, J. Vioque and F. Millán,
2004. Brassica carinata protein isolates: chemical composition, protein
characterization and improvement of functional properties by protein hydrolysis,
Food Chemistry, 88: 337-346
Peleg, M. 1988. An empirical model for description of moisture sorption curves. Journal
of Food Science. 53:1216-1219.
Putnam, D.H., Budin, J.T., Field, L.A., Breene, W.M., 1993. Camelina: a promising low
input oilseed. In: Janick, J., Simon, J. (Eds.), New Crops. John Wiley and Sons,
New York, pp. 314–322.
Rakow, G. and Getinet, A. 1998. Brassica carinata an oilseed crop for Canada (abstract).
International symposium Brassica. Acta Hortic. 495: 419−426.
Retka-Schill, S., 2008b. Oilseed comes of age. Biodiesel Mag. 5 (11): 44–49.
124
Riaz, M., Asif, M. and Ali, R. 2009. Stability of vitamins during extrusion. Critical
Reviews in
Food Science and Nutrition. 49:361–368.
Rosentrater, K. A., K., Muthukumarappan, and S., Kannadhason. 2009a. Effects of
ingredients and extrusion parameters on aquafeeds containing DDGS and potato
starch. Journal of Aquaculture Feed Science and Nutrition, 1: 22-38.
Rosentrater, K. A., K., Muthukumarappan, S., Kannadhason. 2009b. Effects of
ingredients and extrusion parameters on properties of aquafeeds containing
DDGS and corn starch. Journal of Aquaculture Feed Science and Nutrition, 1: 39-
43.
Roth, H. A., Radle, L., Gifford, S. R., and Clydesdale, F. M. 1988. Psychophysical
relationships between perceived sweetness and color in lemon and lime flavored
beverages, J. Food Sci., 53: 1116, 1162.
Rotkiewicz, D., Konopka, I. and Zylik, S. 1999. State of works on the rapeseed oil
processing optimalization. I. Oil obtaining. Ros´liny Oleiste/Oilseed Crops XX,
151–168 (in Polish).
Ryu, C., Y. B. Yang, A. Bhor, N. E. Yates, V. N. Sharifi, and J. Switenbank. 2006. Effect
of fuel properties on biomass combustion: Part 1. Experiments‐fuel type,
equivalence ratio and particle size. Fuel 85(7‐8): 1039‐1046.
Samson P,Duxbury P,Drisdelle M,Lapointe C. Assessment of pelletized biofuels.
http://reap.ca/reports/pelletaug2000. html; 2000 accessed on June 20, 2001.
Sandra, H. P. F., and Jose, A. G. A. 1993. Effect of phospholipid on protein structure and
solubility in the extrusion of lung proteins. Food Chemistry, 47: 111–119.
Sarwar, G., Blair, R., Friedman, M., Gumbmann, M.R., Hackler, L.R., Pellett, P.L. and
Smith, T.K., 1984. Inter- and intralaboratory variability in rat growth assays for
estimating protein quality in foods. J. Assoc. Off. Anal. Chem. 67: 976–981.
125
Satoh, S., Higgs, D.A., Dosanjh, B.S., Hardy, R.W., Eales, J.G. and Deacon, G., 1998.
Effect of extrusion processing on the nutritive value of canola meal for chinook
salmon (Oncorhynchus tshawytscha) in seawater. Aquacult. Nutr. 4: 115–122.
Sawyer, K., 2008. Is there room for camelina? Biodiesel Mag. 5 (7): 83–87.
Seberry, D.E., Mailer, R.J. and Parker, P.A. 2008. The quality of Australian canola.
Australia: Australian Oilseeds Federation, NSW Dept. of Primary Industries.
Singh, B., Sekhon, K. S. and Singh, N. 2007. Effects of moisture, temperature and level
of pea
grits on extrusion behaviour and product characteristics of rice. Food Chemistry.
100: 198–202.
Singh, H., Singh, D. and Yadava, T. P. 1988. Comparative performance of the genotypes
of Indian and Ethiopian mustard under semi-arid region of India. Cruciferae
Newsl. 13: 36−37.
Singh, R. K., Nielsen, S. S., and Chambers, J. V. 1991. Selected characteristics of
extruded blends of milk protein raffinate or nonfat dry milk with corn flour.
Journal of Food Processing and Preservation, 15: 285–302.
Slominski, B.A., Jia, W., Rogiewicz, A., Nyachoti, C.M. and Hickling, D. 2012. Low-
fiber canola. Part 1. Chemical and nutritive composition of the meal. J. agric.
Food Chem, 60:12,225-12,230.
Soares, C.M., Hayashi, C, de Faria, A.C.E.A. and Furuya, W.M., 2001. Replacement of
soybean meal protein by canola meal protein in diets for Nile tilapia
(Oreochromis niloticus) in the growing phase. Rev. Bras. Zootecn. 30: 1172–
1177.
Sokhansanj, S., and A. F. Turhollow. 2004. Biomass densification –cubing operations
and costs for corn stover. Applied Engineering in Agriculture 20(4): 495-499.
126
Sokhansanj, S., and J. Fenton. 2006. Cost benefit of biomass supply and pre‐processing,
BIOCAP research integration program synthesis paper. Ottawa, Canada: BIOCAP
Canada Foundation.
Sosulski, F. W., and Fleming, S. E. 1977. Chemical, functional, and nutritional properties
of sunflower protein products. Journal of the American Oil Chemists’ Society,
54(2): 100–104.
Sosulski, F.W. 1983. Rapeseed protein for food use. In: Hudson BJF, editor.
Developments in food proteins. London and New York: Applied Science
Publishers. p 109–32.
Sun, Y. and Cheng, J.J., 2005. Dilute acid pretreatment of rye straw and bermudsgrass for
ethanol production. Biores technol. 96 (14): 1599-1606.
Sun, Y. and Cheng, J. J. 2002. Hydrolysis of lignocellulosic materials for ethanol
production: A review. Bioresour. Technol. 83: 1–11.
Tarkow, H. and Feist, W.C., 1969. In: A Mechanism for Improving the Digestibility of
Lignocellulosic Materials with Dilute Alkali and Liquid NH3 Advance Chemistry
Series 95. American Chemical Society, Washington, DC, pp. 197–218.
Torget, R.; Werdene, P.; Himmel, M. and Grohmann,K. 1990. Dilute acid pretreatment of
short rotation woody and herbaceous crops. Appl. Biochem. Biotechnol. 24/25:
115–126.
Tourila-Ollikainen, H. 1982. Pleasantness of colorless and colored soft drinks and
consumer attitudes to artificial food colors, Appetite, 3: 369.
Uruakpa, F.O. and Arntfield, S.D. 2005a. The physico-chemical properties of commercial
canola protein isolate-guar gum gels. Int J Food Sci Technol 40(6):643–53.
Van der Held, E. F. M. and F. G. Van Drunen. 1949. A method of measuring the thermal
conductivity of liquids. Physica. 15:865-881
127
Varga, E.; Reczey, K. and Zacchi, G. 2004. Optimization of steam pretreatment of corn
stover to enhance enzymatic digestibility. Appl. Biochem. Biotechnol. 113-116:
509–523.
Velasco, L., Nabloussi, A., De Haro, A. and Fernandez-Martínez, J. M. 2003.
Development of high-oleic, low-linolenic acid Ethiopian-mustard (Brassica
carinata) germplasm. Theor. Appl. Genet. 107: 823− 830.
Vioque, J., Sa´nchez-Vioque, R., Clemente, A., Pedroche, J. and Milla´n, F. 2000.
Partially hydrolyzed rapeseed protein isolates with improved functional
properties. J. Am. Oil Chem. Soc. 77: 447-450.
Warwick, S. I.; Gugel, R. K.; McDonald, T. and Falk, K. C. 2006. Genetic variation of
Ethiopian mustard (Brassica carinata A. Braun) germplasm in western Canada.
Genet. Resour. Crop Evol. 53: 297−312.
Wen, L., Rodis, P. and Wasserman, B. P. 1990. Cereal Chemistry 67: 268-275.
Woodcock, C. R., and J. S. Mason. 1987. Bulk Solids Handling: An Introduction to the
Practice and Technology. Glasgow, Scotland: Blackie and Son Ltd.
Wyman, C. E.; Dale, B. E.; Elander, R. T.; Holtzapple, M.; Ladisch, M. R. and Lee, Y. Y.
2005. Coordinated development of leading biomass pretreatment technologies.
Bioresour. Technol. 96: 1959–1966.
Yu, J., Liu, Y.F., Qiu, A.Y. and Wang, X.G. 2007. Preparation of isoflavones enriched
soy protein isolate from defatted soy hypocotyls by supercritical CO2. Lwt-Food
Sci Technol 40(5):800-806.
Zhu, S.D.,Wu, Y.X. andYu, Z.N. 2006. Microwave-assisted alkali pre-treatment of wheat
straw and its enzymatic hydrolysis. Biosys Eng 94:437–42.
Zhu, S.D.,Wu, Y.X. andYu, Z.N. 2005. Pretreatment by microwave/alkali of rice straw
and its enzymic hydrolysis. Process Biochem 40:3082–6.

128
Zubr, J., 2010. Cabohydrates, vitamins, and minerals of Camelina sativa seed. Nutr. Food
Sci. 40: 523–531.