Embed Size (px)
Citation preview
Roland van den Tillaar
Effect of different constraints on coordination
and performance in overarm throwing
Dr. polit. avhandling 2003
Program for idrettsvitenskap
Fakultet for samfunnsvitenskap og teknologiledelse
Norges teknisk-naturvitenskapelige universitet, NTNU
Trondheim

ISBN-nummer 82-471-5201-0
i
Roland van den Tillaar
Effect of different constraints on coordination and
performance in overarm throwing
Ph.D. thesis 2003
Section for Human Movement Science
Faculty of Social Sciences and Technology Management
Norwegian University of Science and Technology
Trondheim, Norway
ii
Contents
List of papers iii
Acknowledgements iv
1) Introduction 1
2) Influence of instruction on velocity and accuracy of overarm throwing 14
3) Effect of instruction on velocity, accuracy and coordination of overarm throwing 29
4) Effect of body size and gender in overarm throwing performance 42
5) Force-velocity relationship and coordination patterns in overarm throwing 59
6) Effect of different training programs on the velocity of overarm throwing 75
7) Conclusions and suggestions for further research 104
iii
List of papers
This thesis presents a collection of papers dealing with influences of different constraints on
the coordination and performance of overarm throwing.
Paper 1: Van den Tillaar, R., Ettema, G. (2003) Influence of instruction on velocity and
accuracy of overarm throwing. Perceptual and motor skills, 96, 423-434.
Paper 2: Van den Tillaar, R., Ettema, G. (2003) Effect of instruction on velocity, accuracy and
coordination of overarm throwing. Perceptual and motor skills (submitted)
Paper 3: Van den Tillaar, R., Ettema, G. (2003) Effect of body size and gender in overarm
throwing performance. European Journal of Applied Physiology (submitted)
Paper 4: Van den Tillaar, R., Ettema, G. (2003) Force-velocity relationship and coordination
patterns in overarm throwing. Journal of Applied Biomechanics (submitted)
Paper 5: Van den Tillaar, R (2003) Effect of different training programs on the velocity of
overarm throwing. Journal of Strength and Conditioning (submitted)

iv
Acknowledgements
The work in this thesis was carried out at the section for human movement sciences,
department of Sports Sciences, Norwegian University of Science and Technology (NTNU) in
Trondheim. I wish to thank the VSB bank and the research council in Norway for their
financial support for parts of my studentship and Buro Zondag-Stam for the financial
guarantee, which enabled me to start with my study.
This thesis could not have been written without the help of a number of people to whom I
would like to express my gratitude and appreciation:
In the first place my supervisor Professor Gertjan Ettema for his support, friendship and
interesting discussions, which taught me much more than I could ever imagine.
John Whiting for his inspiration and support, which motivated me to follow my ideas.
My parents and my brother who have always supported and closely followed my studies in
the far north (Norway).
And last, but not least, my family, Anke and Daphne. In her own way Daphne has been a sort
of deadline, which I unfortunately could not keep. Her happy nature gave me the energy to
fulfil my study. Anke gave me the opportunity to study for a Ph.D. degree. Moreover, she has
contributed to my thesis through her critical questions, which forced me to explain my
research in simple words. My family has had to make many sacrifices during my thesis
period, for which I am very thankful.
1
1. Introduction
Fast discrete complex movements.
Different aspects of daily life, sport, work, and play demand different kind of movements,
varying in terms of muscle activity, duration and cyclical nature. Body movements can be
classified in three types: discrete, serial and continuous movements (Schmidt and Lee, 1999).
This classification is based upon the particular movements that are made and the open/closed
dimension, which is determined by the perceptual attributes of the task (Schmidt and Lee,
1999). On one end of the classification scheme are discrete movements. These are movements
with a recognisable beginning and end. Generally, these are movements with high intensity
and short duration, which can be observed in for example, throwing objects, hitting objects,
jumping, reaching, grabbing objects etc. In the literature, these types of movements are also
referred to as explosive or ballistic movements. This type of movement differs essentially
from so-called continuous or cyclic movements, in which a distinct beginning and end can not
be identified as in, for example rowing, running and cycling. These movements are often
described in cycles, but it is theoretically impossible to identify a beginning and end of a
cycle. For example, in running, does a cycle begin with the supporting phase, which consists
of the braking, amortization and propulsion part or with the aerial phase? Continuous
movements also tend to have longer movement times than discrete movements. The
mechanics and control of a fast discrete action is essentially different from cyclical
movements in that one cannot rely on information and mechanical characteristics of the
previous cycle to help in executing and controlling the next one. In between these two
categories, serial movements can be classified. This type of movement is neither discrete nor
continuous, but rather seems to be made up of a series of individual discrete movements tied
2
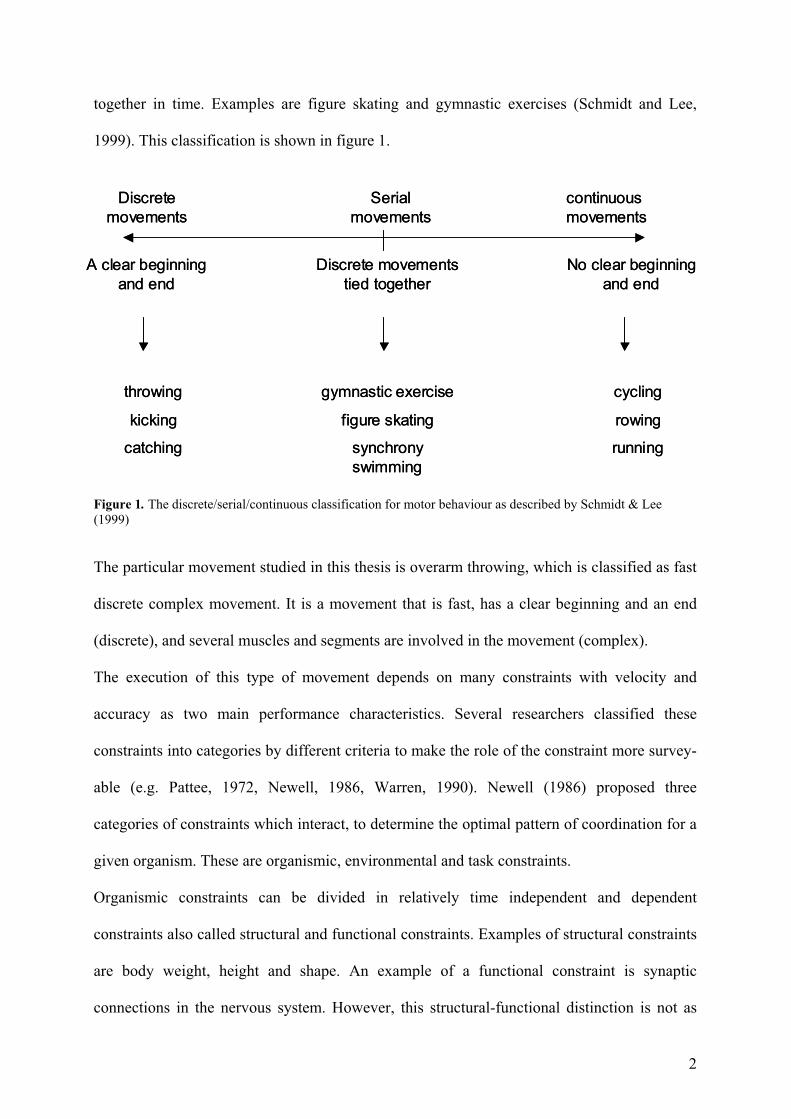
together in time. Examples are figure skating and gymnastic exercises (Schmidt and Lee,
1999). This classification is shown in figure 1.
Figure 1. The discrete/serial/continuous classification for motor behaviour as described by Schmidt & Lee (1999)
The particular movement studied in this thesis is overarm throwing, which is classified as fast
discrete complex movement. It is a movement that is fast, has a clear beginning and an end
(discrete), and several muscles and segments are involved in the movement (complex).
The execution of this type of movement depends on many constraints with velocity and
accuracy as two main performance characteristics. Several researchers classified these
constraints into categories by different criteria to make the role of the constraint more survey-
able (e.g. Pattee, 1972, Newell, 1986, Warren, 1990). Newell (1986) proposed three
categories of constraints which interact, to determine the optimal pattern of coordination for a
given organism. These are organismic, environmental and task constraints.
Organismic constraints can be divided in relatively time independent and dependent
constraints also called structural and functional constraints. Examples of structural constraints
are body weight, height and shape. An example of a functional constraint is synaptic
connections in the nervous system. However, this structural-functional distinction is not as
Discrete
movements
Serial
movements
continuous
movements
A clear beginning
and end
Discrete movements
tied together
No clear beginning
and end
throwing
kicking
catching
gymnastic exercise
figure skating
synchrony
swimming
cycling
rowing
running
Discrete
movements
Serial
movements
continuous
movements
A clear beginning
and end
Discrete movements
tied together
No clear beginning
and end
throwing
kicking
catching
gymnastic exercise
figure skating
synchrony
swimming
cycling
rowing
running
3
qualitative as it first appears, due to the qualification that the constraints may be relatively
time dependent or independent (Newell, 1986).
Environmental constraints are generally defined as those constraints that are external to the
organism and are usually not manipulated by the researcher and are relatively time
independent. Examples of environmental constraints are natural ambient temperature, gravity,
natural light and other natural features that are not essential for the task at hand.
In task constraints the focus is on the goal of the activity and the specific constraints imposed.
Three categories of task constraints can be proposed. These are related to: 1) the goal of the
task; 2) rules specifying or constraining response dynamics and 3) implements of machines
specifying or constraining response dynamics (Newel, 1986). An handball match covers
various categories. In handball the goal of the task is to score more goals than the opposite
team. This results in attacking the other goal and defending your own (category 1). In this
game rules about how to defend and how to handle the ball are prescribed. For example it is
prohibited to kick the ball with your foot (category 2). The game would be different if another
type of ball is used, for example a tennis or rugby ball. This will probably result in another
type of throwing to each other and on the goal (category 3).
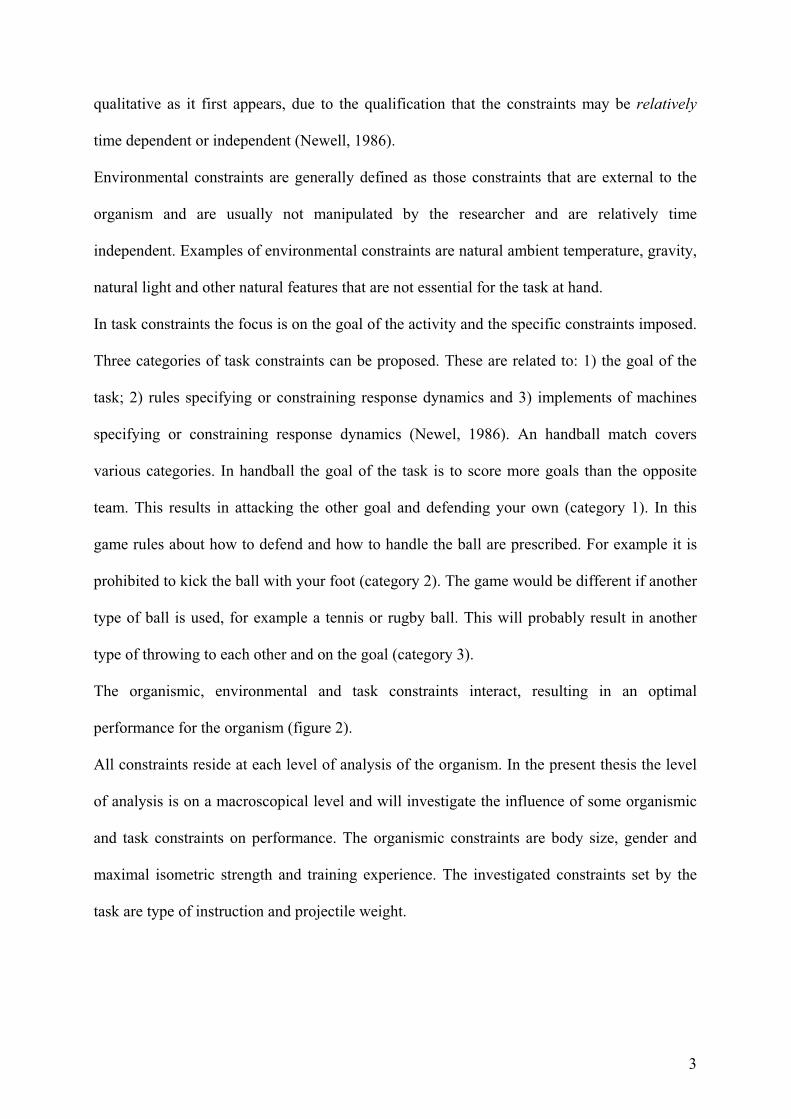
The organismic, environmental and task constraints interact, resulting in an optimal
performance for the organism (figure 2).
All constraints reside at each level of analysis of the organism. In the present thesis the level
of analysis is on a macroscopical level and will investigate the influence of some organismic
and task constraints on performance. The organismic constraints are body size, gender and
maximal isometric strength and training experience. The investigated constraints set by the
task are type of instruction and projectile weight.
4
Figure 2. A schematic diagram of the categories of constraints that specify the performance.
Organismic constraints
The structural organismic constraints (body size parameters) are known to affect physical
performance. Anthropometrics and body composition variables discriminate between
adolescent track and field competitors in different events (Housh, Thorland, Johnson, Tharp
& Cisar, 1984). Athletes specialized in throwing events are significantly taller, heavier and
more muscular build than the control group (Sidhu, Kansal & Kanda, 1975). Upper body
strength correlates (r>.60) with performance for discus throwers; fat weight correlates (r=-.80)
with hammer performance and leg strength correlates (r=.72) with shot put performance
(Morrow, Disch, Ward, Donovan, Katch, Katch, Weltman & Tellez, 1982).
Two models regarding body size investigate the structural and functional consequences of
changes in size among otherwise similar organisms, i.e. isometric and allometric scaling
models (Schmidt-Nielsen, 1984). Isometric scaling is based on the assumption that differently
sized bodies are geometrically similar (isometric), i.e. that all linear dimensions are related in
the same proportion (only differ in ratio). This means that with increasing length (L), the
Organism
structural - functional
Task
goal – rules - implements
Environmental
Performance
Organism
structural - functional
Task
goal – rules - implements
Environmental
Performance
5
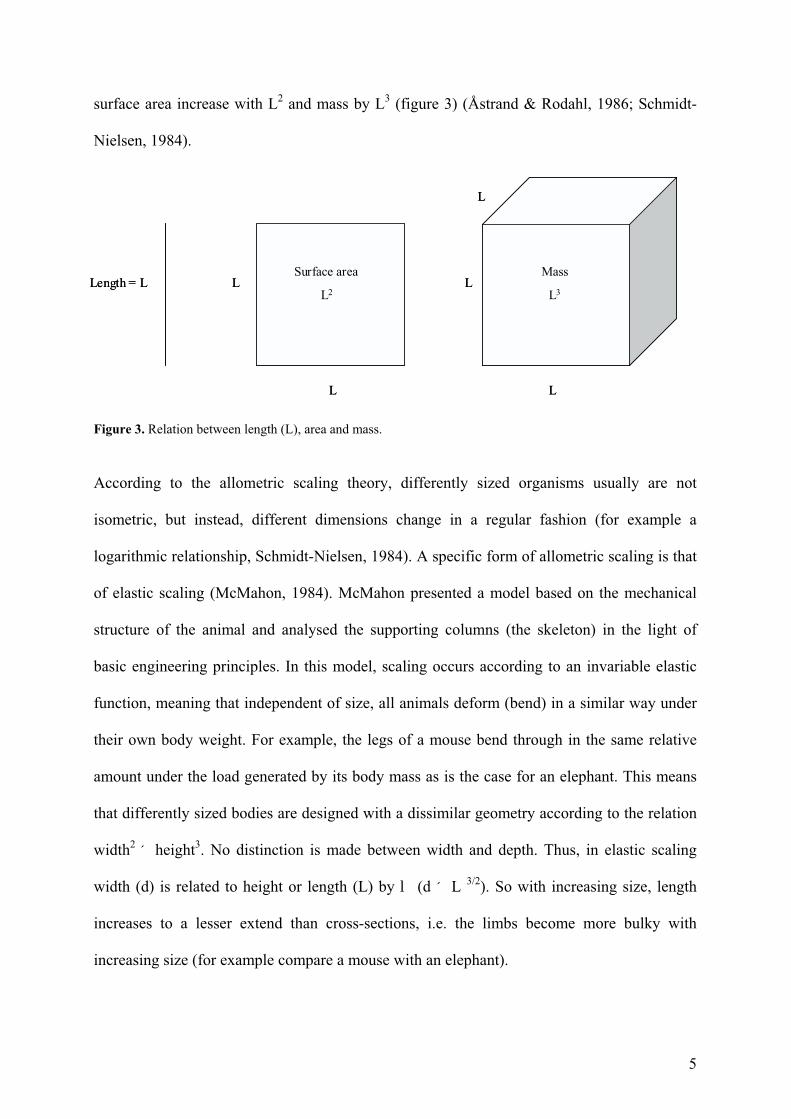
surface area increase with L2 and mass by L3 (figure 3) (Åstrand & Rodahl, 1986; Schmidt-
Nielsen, 1984).
Figure 3. Relation between length (L), area and mass.
According to the allometric scaling theory, differently sized organisms usually are not
isometric, but instead, different dimensions change in a regular fashion (for example a
logarithmic relationship, Schmidt-Nielsen, 1984). A specific form of allometric scaling is that
of elastic scaling (McMahon, 1984). McMahon presented a model based on the mechanical
structure of the animal and analysed the supporting columns (the skeleton) in the light of
basic engineering principles. In this model, scaling occurs according to an invariable elastic
function, meaning that independent of size, all animals deform (bend) in a similar way under
their own body weight. For example, the legs of a mouse bend through in the same relative
amount under the load generated by its body mass as is the case for an elephant. This means
that differently sized bodies are designed with a dissimilar geometry according to the relation
width2 ´ height3. No distinction is made between width and depth. Thus, in elastic scaling
width (d) is related to height or length (L) by ӏ (d ´ L 3/2). So with increasing size, length
increases to a lesser extend than cross-sections, i.e. the limbs become more bulky with
increasing size (for example compare a mouse with an elephant).
Length = L
L
LL
L
L
Surface area
L2
Mass
L3Length = L
L
LL
L
L
Surface area
L2
Mass
L3
6
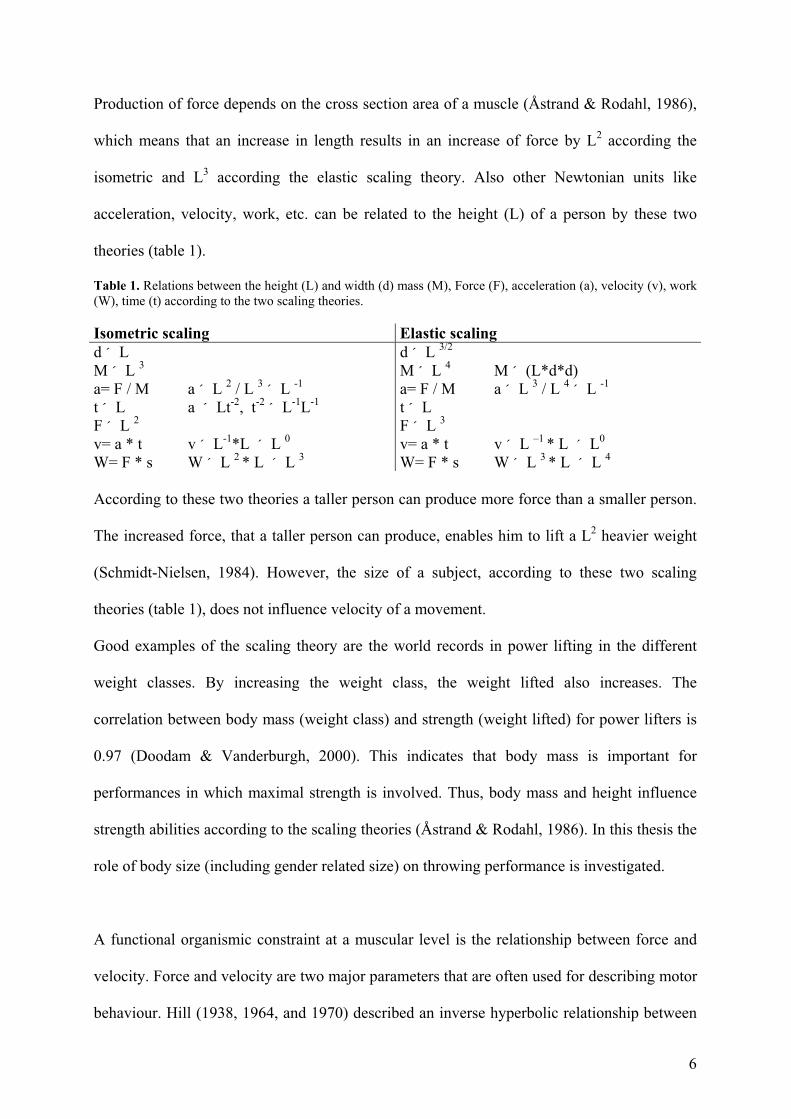
Production of force depends on the cross section area of a muscle (Åstrand & Rodahl, 1986),
which means that an increase in length results in an increase of force by L2 according the
isometric and L3 according the elastic scaling theory. Also other Newtonian units like
acceleration, velocity, work, etc. can be related to the height (L) of a person by these two
theories (table 1).
Table 1. Relations between the height (L) and width (d) mass (M), Force (F), acceleration (a), velocity (v), work (W), time (t) according to the two scaling theories.
Isometric scaling Elastic scaling
d ´ L d ´ L 3/2
M ´ L 3 M ´ L 4 M ´ (L*d*d) a= F / M a ´ L 2 / L 3 ´ L -1 a= F / M a ´ L 3 / L 4 ´ L -1
t ´ L a ´ Lt-2, t-2 ´ L-1L-1 t ´ L F ´ L 2 F ´ L 3
v= a * t v ´ L-1*L ´ L 0 v= a * t v ´ L –1 * L ´ L0
W= F * s W ´ L 2 * L ´ L 3 W= F * s W ´ L 3 * L ´ L 4
According to these two theories a taller person can produce more force than a smaller person.
The increased force, that a taller person can produce, enables him to lift a L2 heavier weight
(Schmidt-Nielsen, 1984). However, the size of a subject, according to these two scaling
theories (table 1), does not influence velocity of a movement.
Good examples of the scaling theory are the world records in power lifting in the different
weight classes. By increasing the weight class, the weight lifted also increases. The
correlation between body mass (weight class) and strength (weight lifted) for power lifters is
0.97 (Doodam & Vanderburgh, 2000). This indicates that body mass is important for
performances in which maximal strength is involved. Thus, body mass and height influence
strength abilities according to the scaling theories (Åstrand & Rodahl, 1986). In this thesis the
role of body size (including gender related size) on throwing performance is investigated.
A functional organismic constraint at a muscular level is the relationship between force and
velocity. Force and velocity are two major parameters that are often used for describing motor
behaviour. Hill (1938, 1964, and 1970) described an inverse hyperbolic relationship between
7
force and velocity for an isolated muscle, which is now referred to as the so-called Hill curve.
According to Hill, the basic characteristics of muscles could be described by this relationship.
This relationship is used by many other researchers in muscle physiology used to describe and
explain phenomena of muscle contraction. Also researchers in the more applied sciences as
for example sport sciences use this approach. In many research projects in sports the
relationship is used to explain how a subject has to train to become stronger and/or faster.
Many training experiments, designed to enhance the performance of the athlete, are based on
the force-velocity relationship of Hill (e.g. Komi and Häkkinen, 1988). In this thesis the force
and velocity on the macroscopical level of a fast discrete complex movement is investigated
by a task constraint: projectile weight. Thus task and organismic constraints are linked.
Another functional organismic constraint that influences the force and/or velocity and thereby
the performance of fast discrete complex movements is training experience. Novices in a
complex task perform usually worse than an expert in that task (e.g. Marques-Bruna &
Grimshaw, 1998; Etnyre, 1998). A novice learns the task by the law of practice, which means
that by practice the performance increases by a decelerated relationship. Thus, a subject
improves much in the beginning of learning the task and the rate of improvement changes
towards zero as practice continues (Fleichman & Rich, 1963; Quesada & Schmidt, 1970).
Two important principles in training practice are the principle of overload and specificity. The
principle of overload can be described as physical training exposing the organism to a training
load or work stress of sufficient intensity, duration and frequency. This stress is associated
with some catabolic processes, such as molecular breakdown, followed by an overshoot or
anabolic response that causes an increased deposition of the molecules, which were mobilized
or broken down during exposure to the training load (Åstrand & Rodahl, 1986). There are
different views on the type of overload needed to become faster. Firstly, there is training
based upon the principle of an overload of force (e.g. throwing with overweight balls;
8
Edwards van Muijen et. al. 1991; Barata, 1992; DeRenne et. al. 1985; 1990, 1994). Secondly,
there is training based upon the principle of an overload of velocity (e.g. throwing with
underweight balls; Edwards van Muijen et. al. 1991; DeRenne et. al. 1985; 1990; 1994).
Another training principle is the principle of specificity. This principle can be described as the
adaptation of the human body to the activity that the individual is exposed to (Åstrand &
Rodahl, 1986, Fox & Matthews, 1981). This means that when some one wants to enhance his
performance in running, he has to train running and not cycling. In overarm throwing,
variable resistance training on the shoulder rotation is more specific for a baseball pitcher than
isokinetic resistance training (Wooden, Greenfield, Johanson, Litzelman, Mundrane &
Donatelli, 1992). In this thesis the role of different training experiences on throwing
performance is investigated by a literature study (Chapter 6). To avoid any effect of
inadequate coordination patterns in throwing (see Roberton, 1977), players with at least 10
years of training experience and experience on national level of competition were used in the
experiments of the other studies.
Task constraints
A task constraint which is investigated is the influence of the specification of task goals by the
type of instruction. Most fast discrete actions require a certain level of accuracy of execution.
It is generally accepted that a trade-off (information processing guided) exists between the
accuracy and velocity at which a task is performed. The basis of this assumption lies in the
work of Fitts (1954). However, Fitts findings were based on fast cyclical tasks, not discrete,
and thus Fitts findings do not necessarily apply to this study. Indeed, some tasks seem to show
an optimum of intensity of execution (measured in e.g. velocity or force) leading to the most
accurate performance (e.g. hitting a specific target) (Sherwood and Schmidt, 1980). Such an
optimum was also recently found in soccer kicking (Corrigan, 2000). Instructions with
9
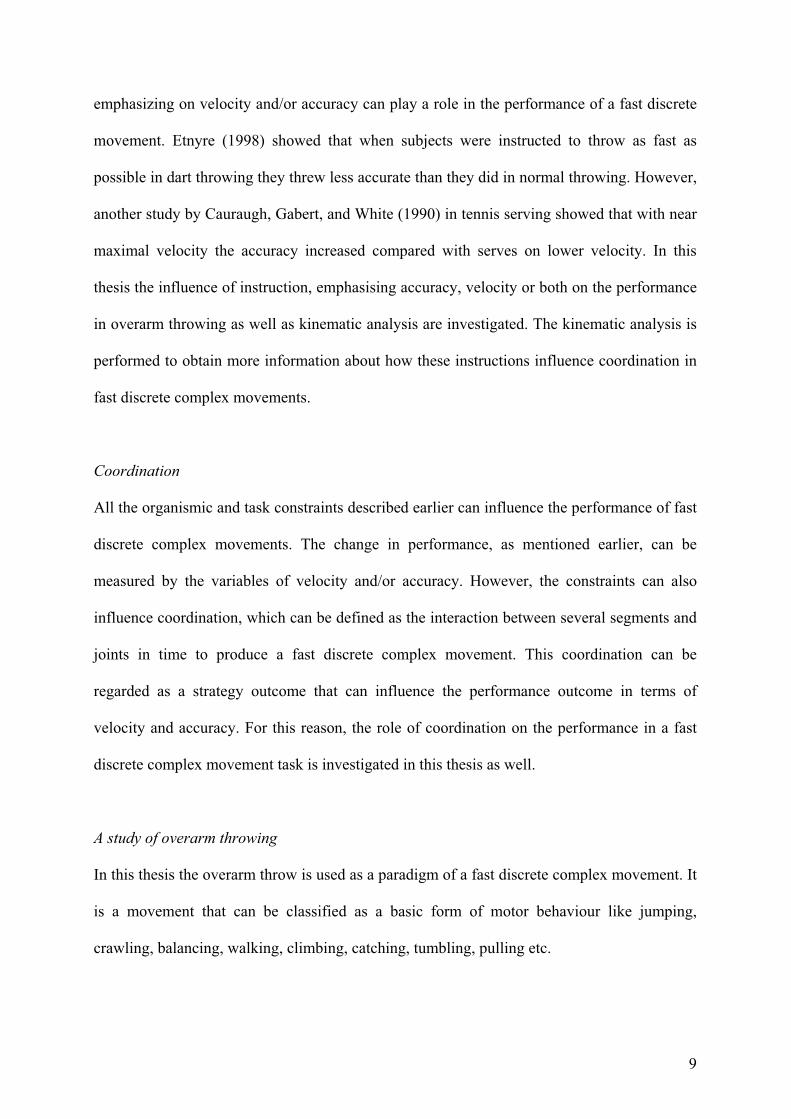
emphasizing on velocity and/or accuracy can play a role in the performance of a fast discrete
movement. Etnyre (1998) showed that when subjects were instructed to throw as fast as
possible in dart throwing they threw less accurate than they did in normal throwing. However,
another study by Cauraugh, Gabert, and White (1990) in tennis serving showed that with near
maximal velocity the accuracy increased compared with serves on lower velocity. In this
thesis the influence of instruction, emphasising accuracy, velocity or both on the performance
in overarm throwing as well as kinematic analysis are investigated. The kinematic analysis is
performed to obtain more information about how these instructions influence coordination in
fast discrete complex movements.
Coordination
All the organismic and task constraints described earlier can influence the performance of fast
discrete complex movements. The change in performance, as mentioned earlier, can be
measured by the variables of velocity and/or accuracy. However, the constraints can also
influence coordination, which can be defined as the interaction between several segments and
joints in time to produce a fast discrete complex movement. This coordination can be
regarded as a strategy outcome that can influence the performance outcome in terms of
velocity and accuracy. For this reason, the role of coordination on the performance in a fast
discrete complex movement task is investigated in this thesis as well.
A study of overarm throwing
In this thesis the overarm throw is used as a paradigm of a fast discrete complex movement. It
is a movement that can be classified as a basic form of motor behaviour like jumping,
crawling, balancing, walking, climbing, catching, tumbling, pulling etc.
10
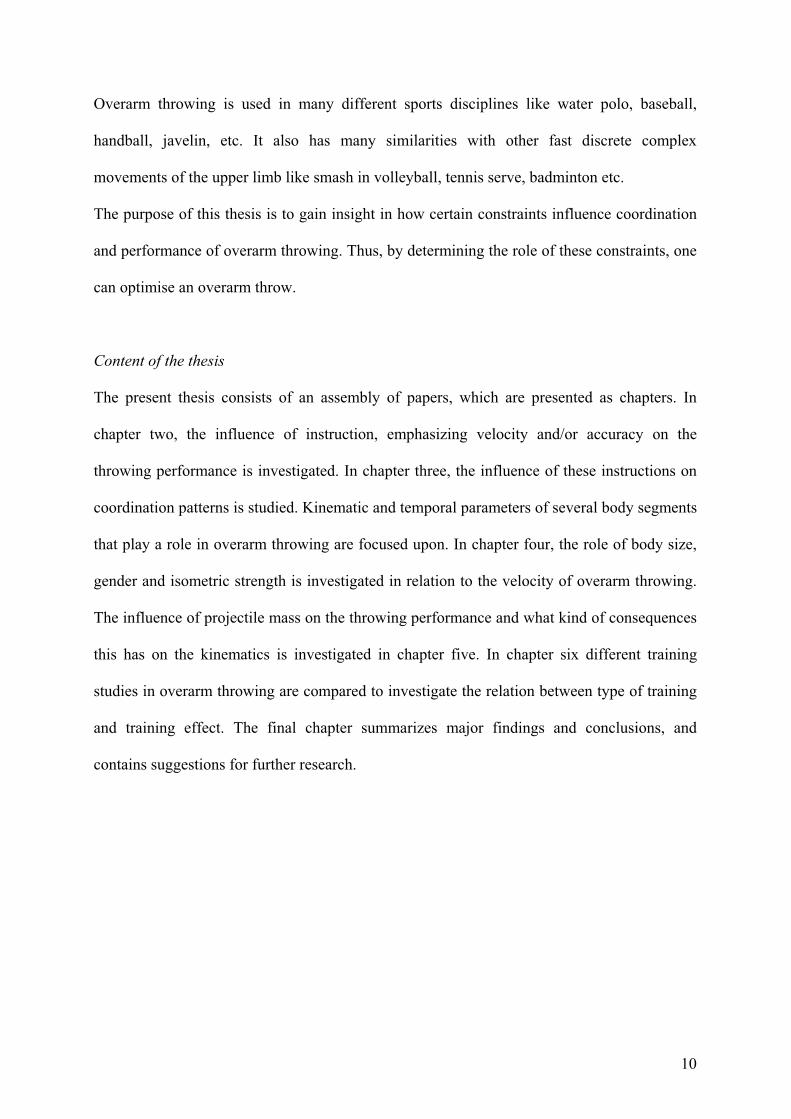
Overarm throwing is used in many different sports disciplines like water polo, baseball,
handball, javelin, etc. It also has many similarities with other fast discrete complex
movements of the upper limb like smash in volleyball, tennis serve, badminton etc.
The purpose of this thesis is to gain insight in how certain constraints influence coordination
and performance of overarm throwing. Thus, by determining the role of these constraints, one
can optimise an overarm throw.
Content of the thesis
The present thesis consists of an assembly of papers, which are presented as chapters. In
chapter two, the influence of instruction, emphasizing velocity and/or accuracy on the
throwing performance is investigated. In chapter three, the influence of these instructions on
coordination patterns is studied. Kinematic and temporal parameters of several body segments
that play a role in overarm throwing are focused upon. In chapter four, the role of body size,
gender and isometric strength is investigated in relation to the velocity of overarm throwing.
The influence of projectile mass on the throwing performance and what kind of consequences
this has on the kinematics is investigated in chapter five. In chapter six different training
studies in overarm throwing are compared to investigate the relation between type of training
and training effect. The final chapter summarizes major findings and conclusions, and
contains suggestions for further research.
11
References
Åstrand, P., Rodahl, K. (1986) Textbook of work physiology; physiological bases of exercise.
(3rd ed.) Singapore: McGraw-Hill Book Co.
Barata, J. (1992) Changes in ball velocity in the handball free throw, induced by two different
speed-strength training programs. Portuguese Journal of Human Performance, 8, 45-55.
Cauraugh, J. H., Gabert, T. E., White, J. J. (1990) Tennis serving velocity and accuracy.
Perceptual and Motor Skills, 70, 719-722.
Corrigan, P. E. L. (2000) Speed and accuracy in soccer kick. Masters thesis, Trondheim:
NTNU.
DeRenne, C., Buxton, B. P., Hetzler, R. K. and Ho, K. (1994). Effects of under- and
overweighted implement training on pitching velocity. Journal of Strength and
Conditioning Research, 8 (4), 247-250.
DeRenne, C., Ho, K. and Blitzblau, A. (1990). Effects of weighted implement training on
throwing velocity. Journal of Applied Sport Science Research, 4 (1), 16-19.
DeRenne, C., Tracy, R. and Dunn-Rankin, P. (1985). Increasing throwing velocity. Athletic
Journal, 36-39.
Doodam, C. S., Vanderburgh, P. M. (2000) Allometric modelling of the bench press and
squat: Who is the strongest regardless of body mass? Journal of Strength and
Conditioning Research, 14, 32-36.
Edwards van Muijen, A. J., Jöris, H. J. J., Kemper, H. C. G. and van Ingen Schenau, G. J.
(1991). Throwing practice with different ball weights: effects on throwing velocity and
muscle strength in female handball players. Sports training, Medicine. and
Rehabilitation, 2, 103-113.
Etnyre, B. R. (1998) Accuracy characteristics of throwing as a result of maximum force
effort. Perceptual and Motor Skills, 86, 1211-1217.
Fitts, P. M. (1954) The information capacity of the human motor system in controlling the
amplitude of movement. Journal of Experimental Psychology, 47, 381-391.
Fleichman, E. A., Rich, S. (1963) Role of kinaesthetic and spatial-visual abilities in
perceptual-motor learning. Journal of Experimental Psychology, 66, 6-11.
Fox, E. L., Matthews, D. K. (1981) The physiological basis of physical education and
athletics (3rd ed.). Philadelphia: Saunders College Publishing.
Hill A. V. (1938) The heat of shortening and dynamic constants of muscle. Proc. Roy. Soc.
Series B 126, 136-195.
Hill, A. V. (1964) The efficiency of mechanical power development during muscular
shortening and its relation to load. Proc. Roy. Soc. B, 159, 319-325.
12
Hill, A. V. (1970) First and last experiments in muscle mechanics. Cambridge: Cambridge
University Press.
Housh, T. J., Thorland, W. E., Johnson, G. O., Tharp, G. D., Cisar, C J. (1984)
Anthropometric and body build variables as discriminators of event participation in elite
adolescent male track and field athletes. Journal of Sports Sciences, 2, 3-11.
Komi, P. V., Häkkinen, K. (1988). Strength and power. In A. Dirix, H. G. Knuttgen, K. Tittel
(Eds.) The Olympic book of sports medicine; volume I of the encyclopaedia of sport
medicine. Oxford: Blackwell Scientific Publications, 181-193.
Marques-Bruna, P., Grimshaw, P. N. (1998) Variability in development of overarm throwing:
a longitudinal case study over the first 6 months of throwing. Perceptual and Motor
Skills, 86, 1403-1418.
McMahon TA.(1984) Chapter 9: Effect of scaling. In: Muscles, reflexes, and locomotion.
New Jersey: Princeton University Press, 34-296.
Morrow, J. R., Disch, J. G., Ward, J. G., Donovan, T. J., Katch, F. I., Katch, V. L., Weltman,
A. L., Tellez, T. (1982) Anthropometric, strength, and performance characteristics of
American world class throwers Journal of Sports Medicine and Physical Fitness 1, 73-
79.
Newel, K. M. (1986) Constraints on the development of coordination. In M. Wade & H. T. A.
Whiting (Eds.) Motor development in children: aspects of coordination and control.
Dordrecht: Martinus Nijhoff, 341-360.
Pattee, H. H.(1972) Laws and constraints, symbols and language. In C. H. Waddington (Ed.)
Towards a theoretical Biology Vol 4. Chicago: Aldine, 248-258.
Quesada, D. C., Schmidt, R. A. (1970) A test of the Adams-Creamer decay hypothesis for the
timing of motor responses. Journal of Motor Behavior, 2, 273-283.
Roberton M. A. (1977) Stability of stage categorizations across trails: implications for the
'stage theory' of overarm throw development. Journal of Human Movement Studies, 1,
49-59.
Schmidt, R. A., Lee, T. D. (1999) Motor control and learning; A behavioral emphasis. (3rd
ed.) Champaign, IL: Human Kinetics.
Schmidt-Nielsen, K. (1984) Scaling; Why is animal size so important? Cambridge:
Cambridge University Press.
Sherwood, D. E., Schmidt, R. A. (1980) The relationship between force and force variability
in minimal and near-maximal static and dynamic contractions. Journal of Motor
Behavior, 12, 75-89.
13
Sidhu, L. S., Kansal, D. K., Kanda, B. S. (1975) Anthropometric and roentgenogrammetric
assessment of physique and body composition of athletes specialising in throwing
events. Journal of Sports Medicine, 15, 192-198.
Warren, W. H. (1990) The perception-action coupling. In H. Bloch & B. I. Berenthal (Eds.)
Sensory-motor organizations and development in infancy and early childhood.
Dordrecht: Kluwer Academic Publishers, 22-37.
Wooden, M. J., Greenfield, B., Johanson, M., Litzelman, L., Mundrane, M., Donatelli R. A.
(1992) Effects of strength training on throwing velocity and shoulder muscle
performance in teenage baseball players. Journal of Orthopaedic and Sports Physical
Therapy, 15, 223-228.

2. The Influence of instruction on velocity and accuracy of overarm throwing Is not included due to copyright

3. Effect of instruction on velocity, accuracy and coordination of overarm throwing Is not included due to copyright
42
4. Effect of body size and gender in overarm throwing
performance.
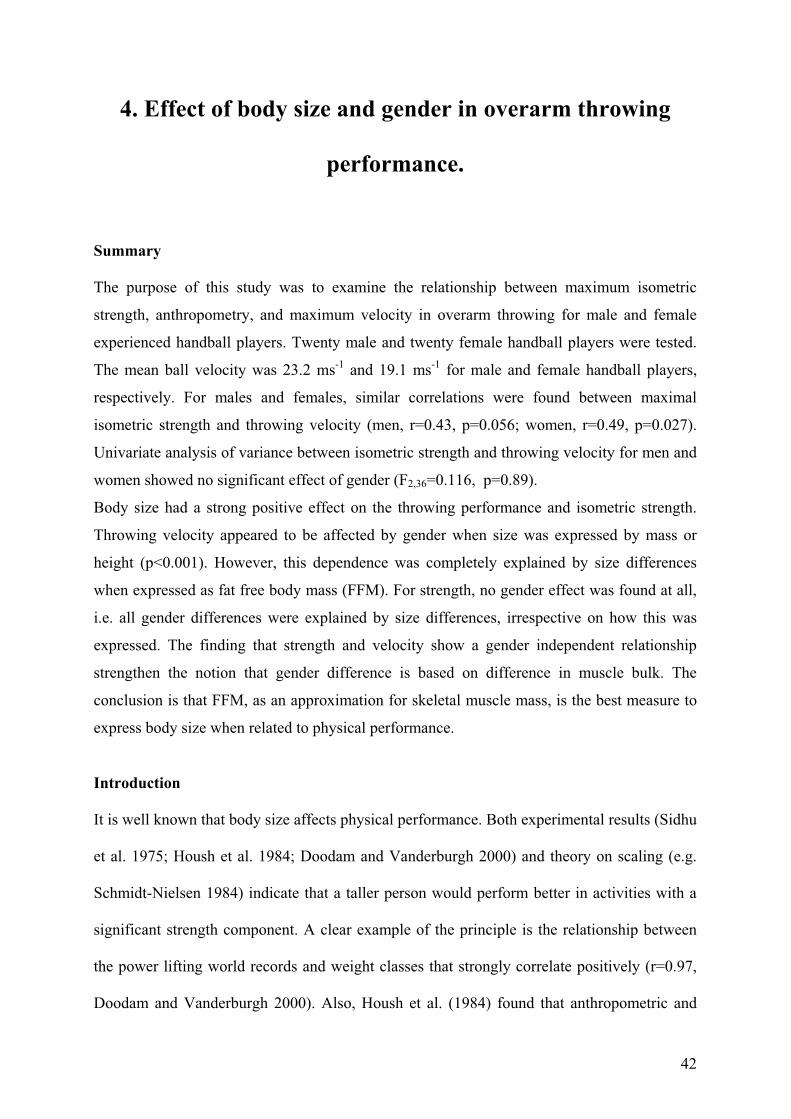
Summary
The purpose of this study was to examine the relationship between maximum isometric
strength, anthropometry, and maximum velocity in overarm throwing for male and female
experienced handball players. Twenty male and twenty female handball players were tested.
The mean ball velocity was 23.2 ms-1 and 19.1 ms-1 for male and female handball players,
respectively. For males and females, similar correlations were found between maximal
isometric strength and throwing velocity (men, r=0.43, p=0.056; women, r=0.49, p=0.027).
Univariate analysis of variance between isometric strength and throwing velocity for men and
women showed no significant effect of gender (F2,36=0.116, p=0.89).
Body size had a strong positive effect on the throwing performance and isometric strength.
Throwing velocity appeared to be affected by gender when size was expressed by mass or
height (p<0.001). However, this dependence was completely explained by size differences
when expressed as fat free body mass (FFM). For strength, no gender effect was found at all,
i.e. all gender differences were explained by size differences, irrespective on how this was
expressed. The finding that strength and velocity show a gender independent relationship
strengthen the notion that gender difference is based on difference in muscle bulk. The
conclusion is that FFM, as an approximation for skeletal muscle mass, is the best measure to
express body size when related to physical performance.
Introduction
It is well known that body size affects physical performance. Both experimental results (Sidhu
et al. 1975; Housh et al. 1984; Doodam and Vanderburgh 2000) and theory on scaling (e.g.
Schmidt-Nielsen 1984) indicate that a taller person would perform better in activities with a
significant strength component. A clear example of the principle is the relationship between
the power lifting world records and weight classes that strongly correlate positively (r=0.97,
Doodam and Vanderburgh 2000). Also, Housh et al. (1984) found that anthropometric and
43
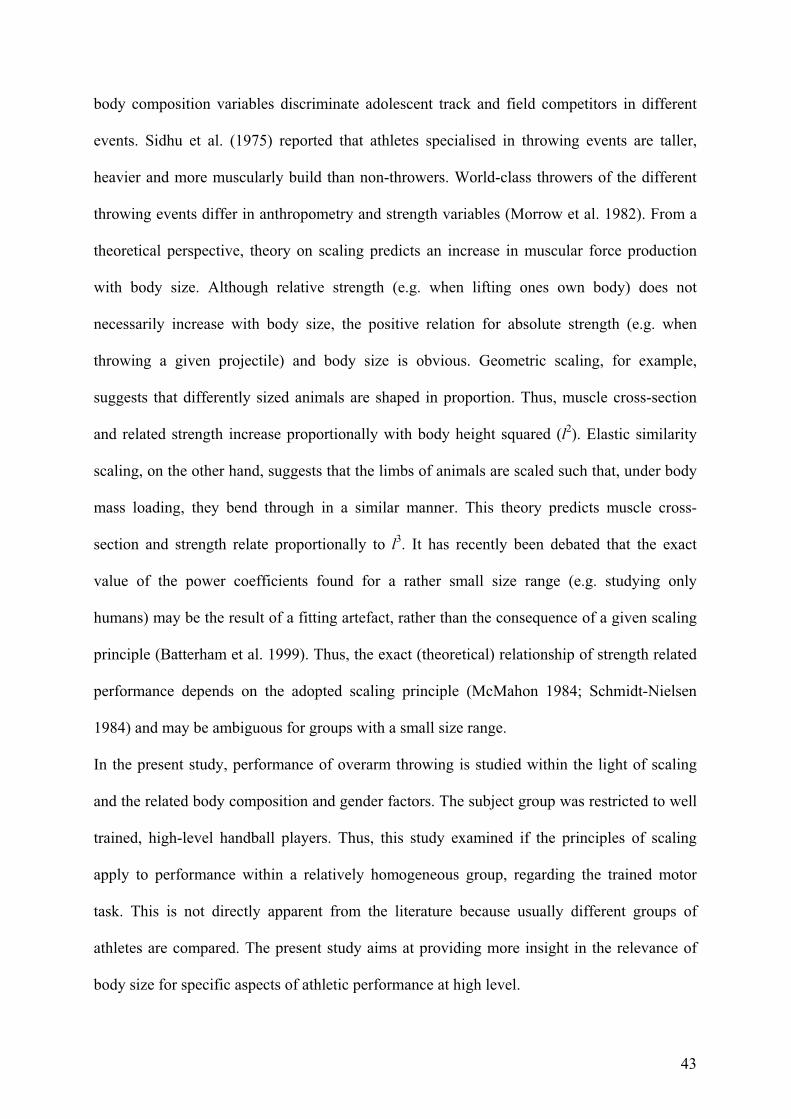
body composition variables discriminate adolescent track and field competitors in different
events. Sidhu et al. (1975) reported that athletes specialised in throwing events are taller,
heavier and more muscularly build than non-throwers. World-class throwers of the different
throwing events differ in anthropometry and strength variables (Morrow et al. 1982). From a
theoretical perspective, theory on scaling predicts an increase in muscular force production
with body size. Although relative strength (e.g. when lifting ones own body) does not
necessarily increase with body size, the positive relation for absolute strength (e.g. when
throwing a given projectile) and body size is obvious. Geometric scaling, for example,
suggests that differently sized animals are shaped in proportion. Thus, muscle cross-section
and related strength increase proportionally with body height squared (l2). Elastic similarity
scaling, on the other hand, suggests that the limbs of animals are scaled such that, under body
mass loading, they bend through in a similar manner. This theory predicts muscle cross-
section and strength relate proportionally to l3. It has recently been debated that the exact
value of the power coefficients found for a rather small size range (e.g. studying only
humans) may be the result of a fitting artefact, rather than the consequence of a given scaling
principle (Batterham et al. 1999). Thus, the exact (theoretical) relationship of strength related
performance depends on the adopted scaling principle (McMahon 1984; Schmidt-Nielsen
1984) and may be ambiguous for groups with a small size range.
In the present study, performance of overarm throwing is studied within the light of scaling
and the related body composition and gender factors. The subject group was restricted to well
trained, high-level handball players. Thus, this study examined if the principles of scaling
apply to performance within a relatively homogeneous group, regarding the trained motor
task. This is not directly apparent from the literature because usually different groups of
athletes are compared. The present study aims at providing more insight in the relevance of
body size for specific aspects of athletic performance at high level.
44
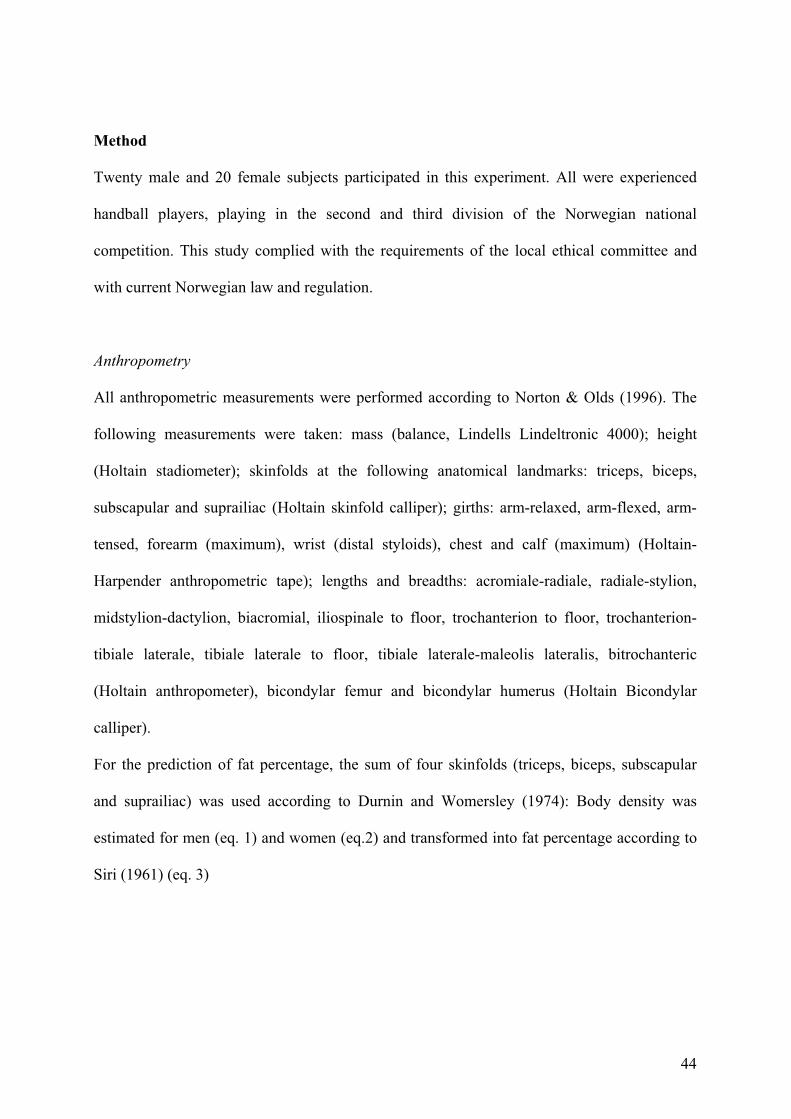
Method
Twenty male and 20 female subjects participated in this experiment. All were experienced
handball players, playing in the second and third division of the Norwegian national
competition. This study complied with the requirements of the local ethical committee and
with current Norwegian law and regulation.
Anthropometry
All anthropometric measurements were performed according to Norton & Olds (1996). The
following measurements were taken: mass (balance, Lindells Lindeltronic 4000); height
(Holtain stadiometer); skinfolds at the following anatomical landmarks: triceps, biceps,
subscapular and suprailiac (Holtain skinfold calliper); girths: arm-relaxed, arm-flexed, arm-
tensed, forearm (maximum), wrist (distal styloids), chest and calf (maximum) (Holtain-
Harpender anthropometric tape); lengths and breadths: acromiale-radiale, radiale-stylion,
midstylion-dactylion, biacromial, iliospinale to floor, trochanterion to floor, trochanterion-
tibiale laterale, tibiale laterale to floor, tibiale laterale-maleolis lateralis, bitrochanteric
(Holtain anthropometer), bicondylar femur and bicondylar humerus (Holtain Bicondylar
calliper).
For the prediction of fat percentage, the sum of four skinfolds (triceps, biceps, subscapular
and suprailiac) was used according to Durnin and Womersley (1974): Body density was
estimated for men (eq. 1) and women (eq.2) and transformed into fat percentage according to
Siri (1961) (eq. 3)
45
1.1631 0.0632log( 4skinfolds)maleBD = - ä (1)
1.1599 0.0717 log( 4skinfolds)femaleBD = - ä (2)
495% 450F
BD= - (3)
Fat free body mass (FFM) was calculated as the total body mass minus fat mass. All
measurements were taken twice, the bilateral ones twice on each side of the body. The mean
of the two measurements was taken for further analysis. Difference between the two
measurements of 5% for the skinfolds, 3% for girths (Ross and Marfell-jones, 1991) and 0.5%
for length and breadths was allowed (Quinney, Pettersen, Gledhill & Jamnik, 1984).
Otherwise a third measurement was performed and the median of these three measurements
was used (Norton & Olds, 1996).
Maximal ball velocity
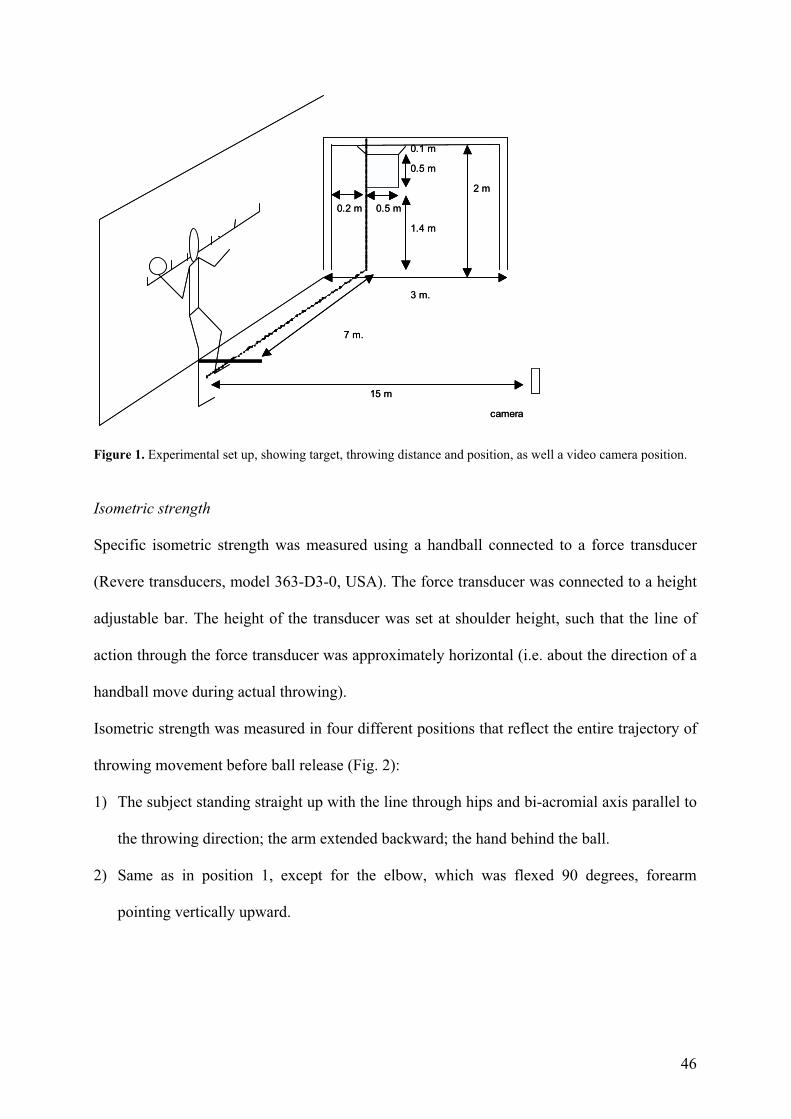
After a general warming up of 15 minutes, throwing performance was tested in an overarm
throw towards a target at 7 m distance, using a standard handball (male 450 g, circumference
0.58 m; female 360g, circumference 0.54 m). The subjects performed a standing throw with
keeping the front foot on the floor during throwing (Fig. 1). The instruction was to throw as
fast as possible aiming at a target of a 0.5 by 0.5m positioned in a handball goal. Each subject
performed five throws in total. In order to obtain an accurate measure of maximal throwing
speed that could be produced repeatedly by each subject, the fastest three throws were used
further for calculating the mean velocity. A digital video camera (JVC, model: GR-DVL9600)
positioned, at 15 meters from the subject, was used for data recording at a sample rate of 100
Hz. The ball velocity was calculated from the distance covered by the first five frames after
ball release.
46
Figure 1. Experimental set up, showing target, throwing distance and position, as well a video camera position.
Isometric strength
Specific isometric strength was measured using a handball connected to a force transducer
(Revere transducers, model 363-D3-0, USA). The force transducer was connected to a height
adjustable bar. The height of the transducer was set at shoulder height, such that the line of
action through the force transducer was approximately horizontal (i.e. about the direction of a
handball move during actual throwing).
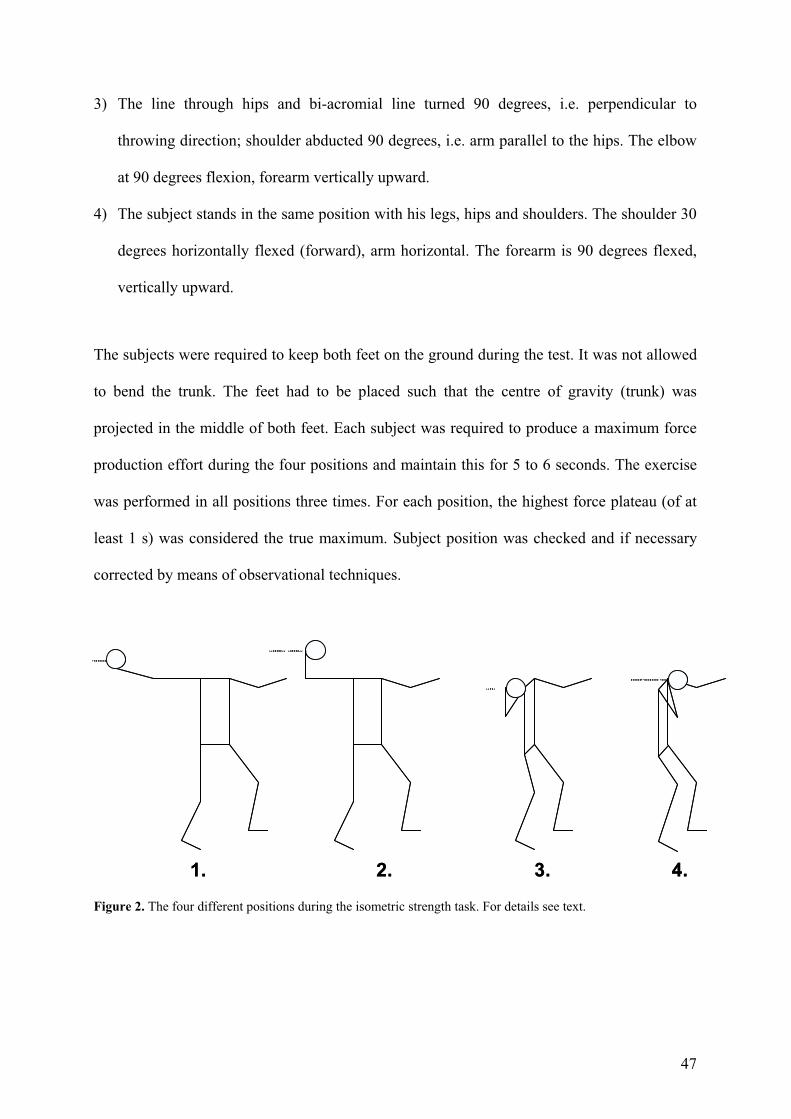
Isometric strength was measured in four different positions that reflect the entire trajectory of
throwing movement before ball release (Fig. 2):
1) The subject standing straight up with the line through hips and bi-acromial axis parallel to
the throwing direction; the arm extended backward; the hand behind the ball.
2) Same as in position 1, except for the elbow, which was flexed 90 degrees, forearm
pointing vertically upward.
0.1 m
0.5 m
2 m
0.2 m 0.5 m
1.4 m
3 m.
7 m.
15 m
camera
0.1 m
0.5 m
2 m
0.2 m 0.5 m
1.4 m
3 m.
7 m.
15 m
camera
47
3) The line through hips and bi-acromial line turned 90 degrees, i.e. perpendicular to
throwing direction; shoulder abducted 90 degrees, i.e. arm parallel to the hips. The elbow
at 90 degrees flexion, forearm vertically upward.
4) The subject stands in the same position with his legs, hips and shoulders. The shoulder 30
degrees horizontally flexed (forward), arm horizontal. The forearm is 90 degrees flexed,
vertically upward.
The subjects were required to keep both feet on the ground during the test. It was not allowed
to bend the trunk. The feet had to be placed such that the centre of gravity (trunk) was
projected in the middle of both feet. Each subject was required to produce a maximum force
production effort during the four positions and maintain this for 5 to 6 seconds. The exercise
was performed in all positions three times. For each position, the highest force plateau (of at
least 1 s) was considered the true maximum. Subject position was checked and if necessary
corrected by means of observational techniques.
Figure 2. The four different positions during the isometric strength task. For details see text.
1. 2. 3. 4.1. 2. 3. 4.
48
Statistics
To assess effects of isometric strength and body size on throwing performance linear and
power functions were compared. To assess gender effect, the regression lines on the two
gender groups were compared using an F-test as described by Crowder and Hand (1990). The
effect of position on isometric strength was tested by a oneway ANOVA with repeated
measures. A post hoc test (using Bonferroni probability adjustments) was used to locate
significant differences.
Results
Table 1 shows anthropometrical results, maximal isometric strength (of all positions) and
throwing performance results averaged for male and female subjects. Significant effects of
arm position on isometric strength were found for both men (p<0.001) and women (p<0.001).
Post hoc comparison (Bonferroni) indicated significant differences between all positions
except between positions 3 and 4. The highest forces were measured in position 1 and the
lowest in position 3 and 4 (Fig. 3). Thus, the forces recorded in position 1 are used as
maximal strength values. Both men and women showed the same position-strength
relationship. Men, however, produced significantly more isometric strength in each position
than women (p<0.01).
49
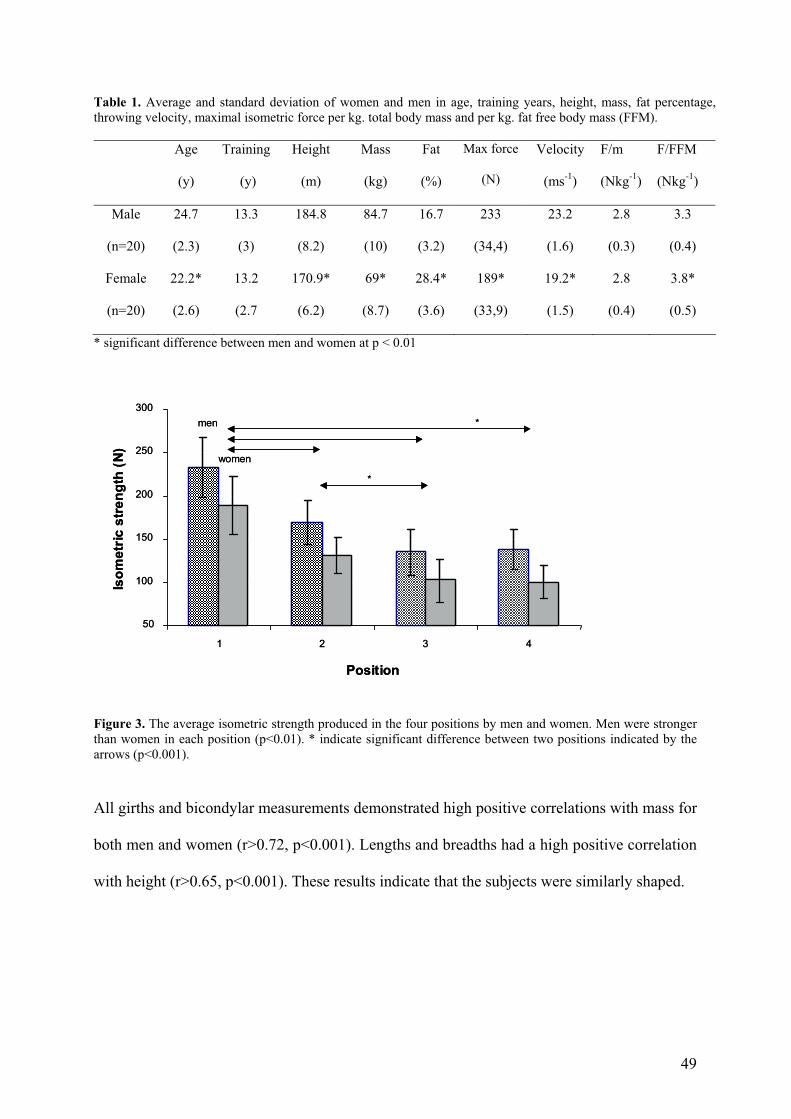
Table 1. Average and standard deviation of women and men in age, training years, height, mass, fat percentage, throwing velocity, maximal isometric force per kg. total body mass and per kg. fat free body mass (FFM).
Age
(y)
Training
(y)
Height
(m)
Mass
(kg)
Fat
(%)
Max force
(N)
Velocity
(ms-1)
F/m
(Nkg-1)
F/FFM
(Nkg-1)
Male
(n=20)
24.7
(2.3)
13.3
(3)
184.8
(8.2)
84.7
(10)
16.7
(3.2)
233
(34,4)
23.2
(1.6)
2.8
(0.3)
3.3
(0.4)
Female
(n=20)
22.2*
(2.6)
13.2
(2.7
170.9*
(6.2)
69*
(8.7)
28.4*
(3.6)
189*
(33,9)
19.2*
(1.5)
2.8
(0.4)
3.8*
(0.5)
* significant difference between men and women at p < 0.01
Figure 3. The average isometric strength produced in the four positions by men and women. Men were stronger than women in each position (p<0.01). * indicate significant difference between two positions indicated by the arrows (p<0.001).
All girths and bicondylar measurements demonstrated high positive correlations with mass for
both men and women (r>0.72, p<0.001). Lengths and breadths had a high positive correlation
with height (r>0.65, p<0.001). These results indicate that the subjects were similarly shaped.
50
100
150
200
250
300
1 2 3 4
Position
Iso
me
tric
str
en
gth
(N
)
men
women
*
*
50
100
150
200
250
300
1 2 3 4
Position
Iso
me
tric
str
en
gth
(N
)
men
women
*
*
50
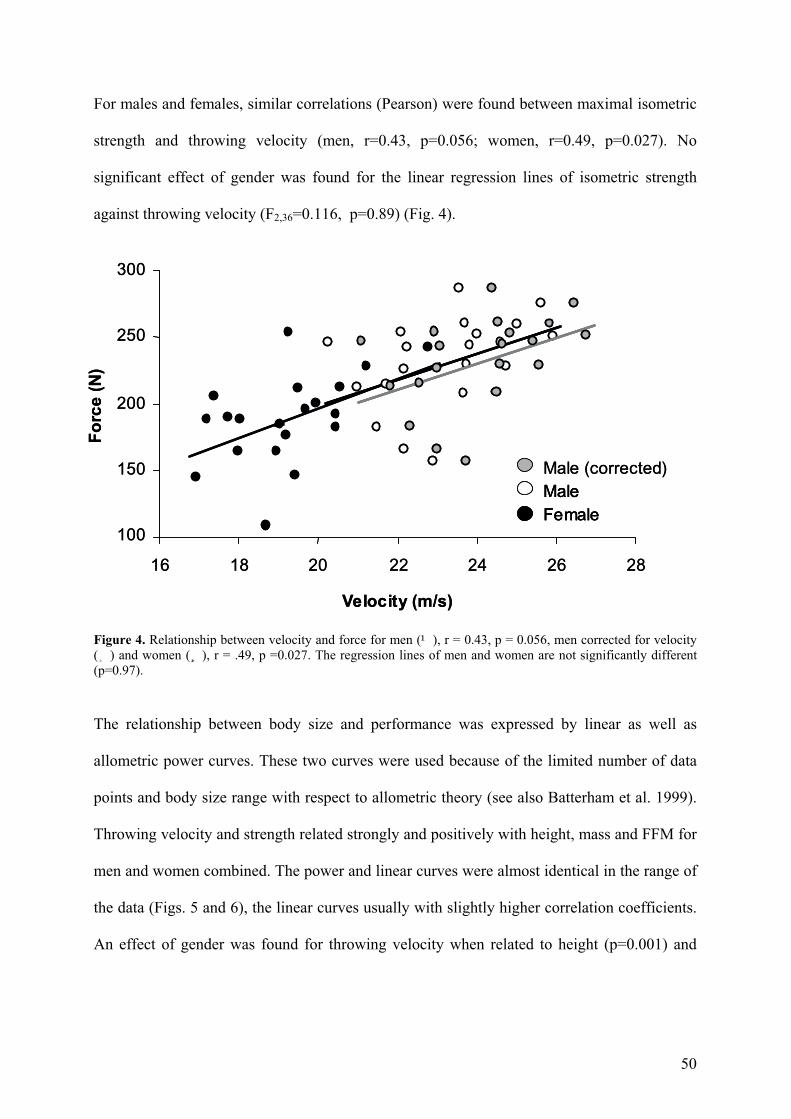
For males and females, similar correlations (Pearson) were found between maximal isometric
strength and throwing velocity (men, r=0.43, p=0.056; women, r=0.49, p=0.027). No
significant effect of gender was found for the linear regression lines of isometric strength
against throwing velocity (F2,36=0.116, p=0.89) (Fig. 4).
Figure 4. Relationship between velocity and force for men (¹), r = 0.43, p = 0.056, men corrected for velocity (¸) and women (¸), r = .49, p =0.027. The regression lines of men and women are not significantly different (p=0.97).
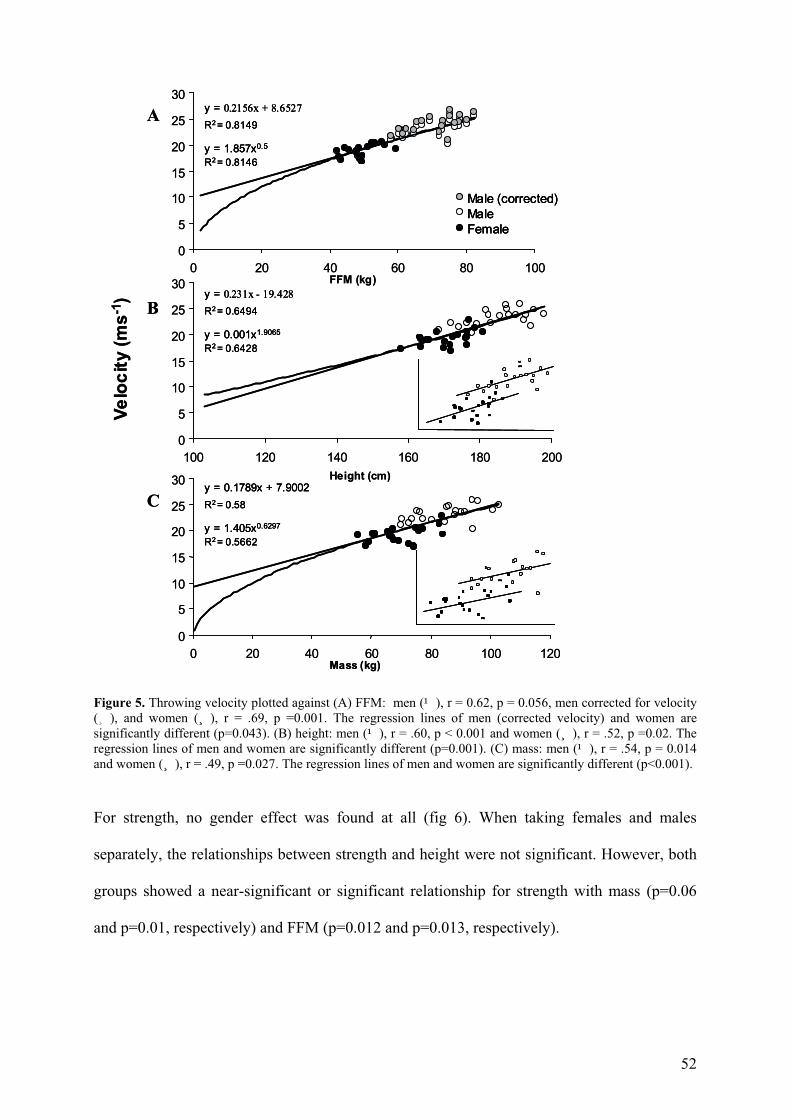
The relationship between body size and performance was expressed by linear as well as
allometric power curves. These two curves were used because of the limited number of data
points and body size range with respect to allometric theory (see also Batterham et al. 1999).
Throwing velocity and strength related strongly and positively with height, mass and FFM for
men and women combined. The power and linear curves were almost identical in the range of
the data (Figs. 5 and 6), the linear curves usually with slightly higher correlation coefficients.
An effect of gender was found for throwing velocity when related to height (p=0.001) and
100
150
200
250
300
16 18 20 22 24 26 28
Velocity (m/s)
Fo
rce
(N
)
Male
Female
Male (corrected)
100
150
200
250
300
16 18 20 22 24 26 28
Velocity (m/s)
Fo
rce
(N
)
MaleMale
FemaleFemale
Male (corrected)
51
mass (p< 0.001) (fig 5 B and C inset), but not when plotted against FFM (fig. 5 A). Thus, the
fitting values on the entire population as shown in Figs. 5B and 5C must be treated cautiously.
The male and female subjects threw with balls of different mass, being regular balls according
to the rules of the international handball federation (360g and 450g for females and males,
respectively). This was done because they were used to throwing with these balls and thus
possible effects of throwing with unusual balls were avoided. However, the ball mass
difference may have contaminated gender effects as found in this study. To check this,
correction on throwing velocity for males was performed based on van den Tillaar and Ettema
(2002). They determined the relationship between ball mass and throwing velocity in men,
indicating that a difference of 90 grams results in a 0.86 m/s throwing velocity difference.
Using the corrected velocities, a significant gender effect between velocity and FFM was
found (F2,36=3.43, p=0.043).
52
Figure 5. Throwing velocity plotted against (A) FFM: men (¹), r = 0.62, p = 0.056, men corrected for velocity (¸), and women (¸), r = .69, p =0.001. The regression lines of men (corrected velocity) and women are significantly different (p=0.043). (B) height: men (¹), r = .60, p < 0.001 and women (¸), r = .52, p =0.02. The regression lines of men and women are significantly different (p=0.001). (C) mass: men (¹), r = .54, p = 0.014 and women (¸), r = .49, p =0.027. The regression lines of men and women are significantly different (p<0.001).
For strength, no gender effect was found at all (fig 6). When taking females and males
separately, the relationships between strength and height were not significant. However, both
groups showed a near-significant or significant relationship for strength with mass (p=0.06
and p=0.01, respectively) and FFM (p=0.012 and p=0.013, respectively).
FFM (kg)
Height (cm)
Mass (kg)
Ve
loc
ity (
ms
-1)
A
C
B
0
5
10
15
20
25
30
0 20 40 60 80 100 120
0
5
10
15
20
25
30
100 120 140 160 180 200
0
5
10
15
20
25
30
0 20 40 60 80 100
Male
Female
y = 1.857x0.5
y = 0.2156x + 8.6527
R2 = 0.8149
R2 = 0.8146
y = 0.001x1.9065
y = 0.231x - 19.428
R2 = 0.6494
R2 = 0.6428
y = 1.405x0.6297
y = 0.1789x + 7.9002
R2 = 0.58
R2 = 0.5662
Male (corrected)
FFM (kg)
Height (cm)
Mass (kg)
Ve
loc
ity (
ms
-1)
A
C
B
0
5
10
15
20
25
30
0 20 40 60 80 100 120
0
5
10
15
20
25
30
100 120 140 160 180 200
0
5
10
15
20
25
30
0 20 40 60 80 100
MaleMale
FemaleFemale
y = 1.857x0.5
y = 0.2156x + 8.6527
R2 = 0.8149
R2 = 0.8146
y = 1.857x0.5
y = 0.2156x + 8.6527
R2 = 0.8149
R2 = 0.8146
y = 0.001x1.9065
y = 0.231x - 19.428
R2 = 0.6494
R2 = 0.6428
y = 0.001x1.9065
y = 0.231x - 19.428
R2 = 0.6494
R2 = 0.6428
y = 1.405x0.6297
y = 0.1789x + 7.9002
R2 = 0.58
R2 = 0.5662
y = 1.405x0.6297
y = 0.1789x + 7.9002
R2 = 0.58
R2 = 0.5662
Male (corrected)Male (corrected)
53
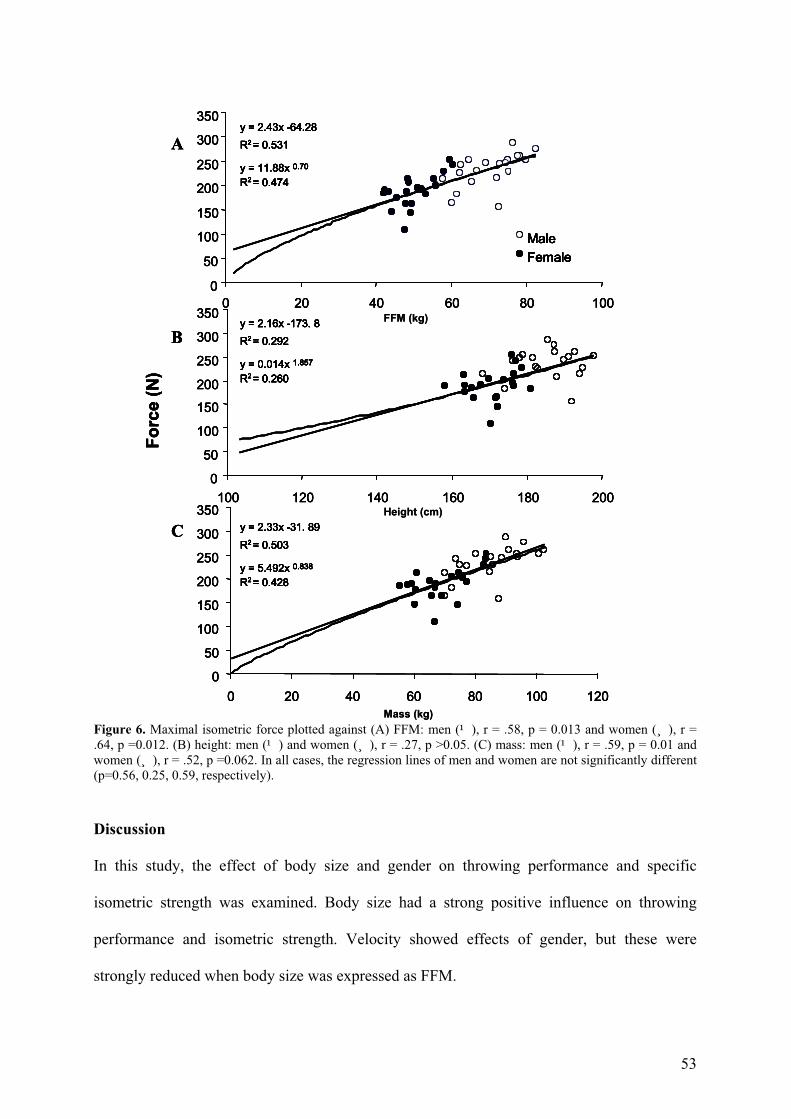
Figure 6. Maximal isometric force plotted against (A) FFM: men (¹), r = .58, p = 0.013 and women (¸), r = .64, p =0.012. (B) height: men (¹) and women (¸), r = .27, p >0.05. (C) mass: men (¹), r = .59, p = 0.01 and women (¸), r = .52, p =0.062. In all cases, the regression lines of men and women are not significantly different (p=0.56, 0.25, 0.59, respectively).
Discussion
In this study, the effect of body size and gender on throwing performance and specific
isometric strength was examined. Body size had a strong positive influence on throwing
performance and isometric strength. Velocity showed effects of gender, but these were
strongly reduced when body size was expressed as FFM.
0
50
100
150
200
250
300
350
0 20 40 60 80 100
0
50
100
150
200
250
300
350
100 120 140 160 180 200
0
50
100
150
200
250
300
350
0 20 40 60 80 100 120
Height (cm)
Fo
rce (
N)
A
C
B
Male
Female
y = 5.492x 0.838
y = 2.33x -31. 89
R2 = 0.503
R2 = 0.428
y = 11.88x 0.70
y = 2.43x -64.28
R2 = 0.531
R2 = 0.474
y = 0.014x 1.857
y = 2.16x -173. 8
R2 = 0.292
R2 = 0.260
0
50
100
150
200
250
300
350
0 20 40 60 80 100
0
50
100
150
200
250
300
350
100 120 140 160 180 200
0
50
100
150
200
250
300
350
0 20 40 60 80 100 120
Mass (kg)
FFM (kg)
Fo
rce (
N)
A
C
B
Male
Female
Male
Female
y = 5.492x 0.838
y = 2.33x -31. 89
R2 = 0.503
R2 = 0.428
y = 5.492x 0.838
y = 2.33x -31. 89
R2 = 0.503
R2 = 0.428
y = 11.88x 0.70
y = 2.43x -64.28
R2 = 0.531
R2 = 0.474
y = 11.88x 0.70
y = 2.43x -64.28
R2 = 0.531
R2 = 0.474
y = 0.014x 1.857
y = 2.16x -173. 8
R2 = 0.292
R2 = 0.260
y = 0.014x 1.857
y = 2.16x -173. 8
R2 = 0.292
R2 = 0.260
0
50
100
150
200
250
300
350
0 20 40 60 80 100
0
50
100
150
200
250
300
350
100 120 140 160 180 200
0
50
100
150
200
250
300
350
0 20 40 60 80 100 120
Height (cm)
Fo
rce (
N)
A
C
B
Male
Female
Male
Female
y = 5.492x 0.838
y = 2.33x -31. 89
R2 = 0.503
R2 = 0.428
y = 5.492x 0.838
y = 2.33x -31. 89
R2 = 0.503
R2 = 0.428
y = 11.88x 0.70
y = 2.43x -64.28
R2 = 0.531
R2 = 0.474
y = 11.88x 0.70
y = 2.43x -64.28
R2 = 0.531
R2 = 0.474
y = 0.014x 1.857
y = 2.16x -173. 8
R2 = 0.292
R2 = 0.260
y = 0.014x 1.857
y = 2.16x -173. 8
R2 = 0.292
R2 = 0.260
0
50
100
150
200
250
300
350
0 20 40 60 80 100
0
50
100
150
200
250
300
350
100 120 140 160 180 200
0
50
100
150
200
250
300
350
0 20 40 60 80 100 120
Mass (kg)
FFM (kg)
Fo
rce (
N)
A
C
B
Male
Female
Male
Female
y = 5.492x 0.838
y = 2.33x -31. 89
R2 = 0.503
R2 = 0.428
y = 5.492x 0.838
y = 2.33x -31. 89
R2 = 0.503
R2 = 0.428
y = 11.88x 0.70
y = 2.43x -64.28
R2 = 0.531
R2 = 0.474
y = 11.88x 0.70
y = 2.43x -64.28
R2 = 0.531
R2 = 0.474
y = 0.014x 1.857
y = 2.16x -173. 8
R2 = 0.292
R2 = 0.260
y = 0.014x 1.857
y = 2.16x -173. 8
R2 = 0.292
R2 = 0.260
54
Isometric strength test
The strength test performed in the study was a whole extremity test rather than an isolated
joint test. Thus the findings are more difficult to explain than with regular joint strength tests.
In the position 1, where the ball was held with a straight arm, the highest forces were
measured. When the throwing arm was bend 90 degrees the force (position 2) was less than in
the first position. However, it was higher than in the last two positions, where the hips and
shoulders had an angle of 90 degrees with the throwing direction. This difference in isometric
strength can be explained by the principle that the strength of a chain is as strong as its
weakest link. In this experiment, the difference between the first and second position was the
flexed elbow (90 degrees). This flexed elbow introduces an extra link in the chain enhancing
the chance of strength decrement, especially when the shoulder joint configuration is not
changed between positions. The higher force in position 2 compared to the last two positions
can also be explained by the introduction of more (and possibly weaker) links. The position in
which the hip and shoulder girdle form a 90 degrees angle with the throwing direction,
introduces a large leverage of the upper limb at these girdles. Thus, large internal torques
(resisting the one from the upper limb pulling the girdles back into the throwing plane) must
emerge.
Effect of size
The present fitting results indicate that data in a relatively small size range cannot be used to
identify allometric relationships. As Batterham et al. (1999) found for a sample of over 1000
human subjects, this study, on a much smaller sample, suggests that using allometric curves
may result in fitting artefacts because the fitting curve is forced through the origin, a purely
theoretical combination of zero size and zero value of the dependent variable. In our study,
the allometric relationship (power curve) was compared with a linear regression, leading to
55
nearly identical curves within the range of measurement. Thus, we support the view by
Batterham et al. (1999) that a study of a single species (human) and a relative small size range
using allometric curves (power curves) may lead to scaling parameters that are misleading.
Still, clear significant positive trends were indicated between size and performance. With
regard to the general trends, the type of curve used did not affect the comparison of males and
females.
Effect of gender
The significant difference in throwing velocity between men and women (23.2 ms-1 for men
and 19,. ms-1 for women) is in line with other studies (Toyoshima & Miyashita 1973; Ohnishi
et al. 1980; Jöris et al. 1985; Barata 1992; Fleck et al. 1992; Hoff and Almåsbakk 1995; Tuma
and Zahalka 1997). These differences in throwing performance between genders can be
explained by two components: the size and the non-size component. The non-size component
is identified by comparing scaling curves. No gender effect was found for strength,
irrespective what measure for size was used. Throwing velocity showed gender influence, but
only to a small extend when size was expressed as FFM. These results are in agreement with
Batterham et al. (1999) with regard to the choice of measure of size. They found that when
using FFM, the different scaling procedures lead to the same scaling coefficient for peak
oxygen uptake ( 2VO peak# ), which was unity (i.e. 2VO peak
# ´ mass1). Using FFM removed all
uncertainty on the effect of size on 2VO peak# . In the present study, FFM also seems to be the
best estimate for body size with regard to physical performance. Of the measures used, FFM
is the best measure for the amount of muscle, the prime organ for physical performance. The
other measures, therefore, introduce gender differences such as females having a higher
percentage of fat and being shorter than men. The finding that strength and velocity show a
gender independent relationship strengthens the simple idea that any gender difference is
56
based on difference in muscle bulk. Effects of other gender aspects then only become
apparent when these aspects are introduced in the measure for size (e.g. mass, including fat;
height, representing only one dimension of a 3-D parameter). Anderson et al. (1979)
suggested that the difference in movement velocities between men and women could be
explained by the difference in distribution of muscle fibre types and by different coordination
patterns between men and women. However, in this study the difference in throwing velocity
is completely explained by the difference in FFM. This indicates that abovementioned non-
size gender differences are proposed possibly on the basis of biased measures for size. Force
per kilogram FFM is significantly higher for women than men (table 1). However, no effect
for gender was found on the FFM-strength relationship (Fig 6A). This discrepancy can be
explained by the choice of method. By expressing strength as force per FFM, one disregards
the non-proportional scaling effect of size on strength, regardless whether that is expressed as
a power coefficient unequal to unity or an intercept in a linear regression. The expression of
strength per kg FFM is, in fact, the slope of a linear regression through the origin, which
clearly is not appropriate when scaling effects are taken into consideration.
In summary, body size (FFM) explains the difference in throwing velocity and isometric
strength of the upper limb between men and women. Men throw faster and produce more
force because they have a higher fat free body mass. The finding that strength and velocity
show a gender independent relationship strengthens the notion that any gender difference is
based on difference in muscle bulk.
57
References
Anderson, Coté, Coyle, Robe (1979) Leg power, muscle strength and peak EMG activity in
physically active college men and women. Medicine Science and Sports, 11, 81-82.
Barata, J. (1992) Changes in ball velocity in the handball free throw, induced by two different
speed-strength training programs. Motricidade humana: Portuguese journal of human
performance studies, 8, 45-55.
Batterham, A. M., Vanderburgh, P. M., Mahar, M. T., Jackson, A. S. (1999) Modelling the
influence of body size on VO2peak: effects of model choice and body composition.
Journal of Applied Physiology, 87, 1317–1325.
Crowder, M. J., Hand, D. J. (1990) Analysis of repeated measures. London: Chapman & Hall,
chapter 2.
Doodam, C. S., Vanderburgh, P. M. (2000) Allometric modelling of the bench press and
squat: Who is the strongest regardless of body mass? Journal of Strength and
Conditioning Research, 14, 32-36.
Durnin, J. V. G. A., Womersley, J. (1974) Body fat assessed from total body density and its
estimation from skin fold thickness: measurements on 481 men and women aged from
16 to 72 years. British Journal of Nutrition, 32, 77-97.
Fleck, S. J., Smith, S. L., Craib, M.W., Denahan, T., Snow, R.E., Mitchell, M.L. (1992)
Upper extremity isokinetic torque and throwing velocity in team handball. Journal of
Applied Sport Science Research, 6, 120-124.
Hoff, J., Almåsbakk, B. (1995) The effect of maximum strength training on throwing velocity
and muscle strength in female team-handball players. Journal of Strength and
Conditioning Research, 9, 255-258.
Housh, T. J., Thorland, W. E., Johnson, G. O., Tharp, G. D., Cisar, C. J. (1984)
Anthropometric and body build variables as discriminators of event participation in elite
adolescent male track and field athletes. Journal of Sports Sciences, 2, 3-11.
Jöris, H. J. J., Edwards van Muijen, A. J., van Ingen Schenau, G. J., Kemper, H. C.G. (1985)
Force velocity and energy flow during the overarm throw in female handball players.
Journal of Biomechanics, 18, 409-414.
McMahon, T. A. (1984) Effect of scaling. In Muscles, reflexes, and locomotion. New Jersey:
Princeton University Press, Chapter 9: 234-296.
Morrow, J. R., Dische, J. G., Ward, J. G., Donovan, T. J., Katch, F. I., Katch, V., Weltman, A.
L., Tellez, T. (1982) Anthropometric, strength, and performance characteristics of
American world class throwers. Journal of Sports Medicine and Physical Fitness, 1, 73-
79.
58
Norton K, Olds T. (1996) Anthropometrica; A textbook of body measurement for sports and
health courses. Sidney: UNSW Press.
Ohnishi, T., Mizukami, H., Kawamura, L. (1980) A study of jumping shoot in handball.
Japanese Society of Physical Education (abstract), 31, 586.
Quinney, H. A., Pettersen, S. R., Gledhill, N., Jamnik, V. (1984) Accreditation of élite athlete
testing laboratories in Canada. In T Reilly, J Watkins, J. Borms (Eds.)
Kinanthropometry III. E & F.N. London: Spon, 233-238.
Ross, W. D., Marfell-jones, M. T. (1991) Kinanthropometry. In J. D. Macdougall , H. A.
Wenger, H. J. Green (Eds.) Physiological testing of the high performance athlete. (2nd
ed.) Champaign, Ill: Human Kinetics, 223-308.
Schmidt-Nielsen, K. (1984) Scaling; Why is animal size so important? Cambridge:
Cambridge University Press.
Sidhu, L. S., Kansal, D. K., Kanda, B. S. (1975) Anthropometric and roentgenogrammetric
assessment of physique and body composition of athletes specialising in throwing
events. Journal of Sports Medicine, 15, 192-198.
Siri, W. E. (1961) Body Volume measurement by gas dilution. In J. Brozek & A. Henschel
(Eds.) Techniques for measuring body composition. Washington, DC: National
Academy of Sciences, National Research Council, 108-117.
Toyoshima, S., Miyashita, M. (1973) Force-velocity relation in throwing. Research Quaterly,
44, 86-95
Tuma, M., Zahalka, F. (1997) Three dimensional analysis of jump shot in handball. Acta
Universitatis Carolinae Kinanthropologica, 33, 81-86.
Van den Tillaar, R., Ettema, E. (2002) A Force-velocity relationship and coordination patterns
in overarm throwing. In Journal of Applied Biomechanics, submitted.
59
5. A Force-velocity relationship and coordination patterns
in overarm throwing.
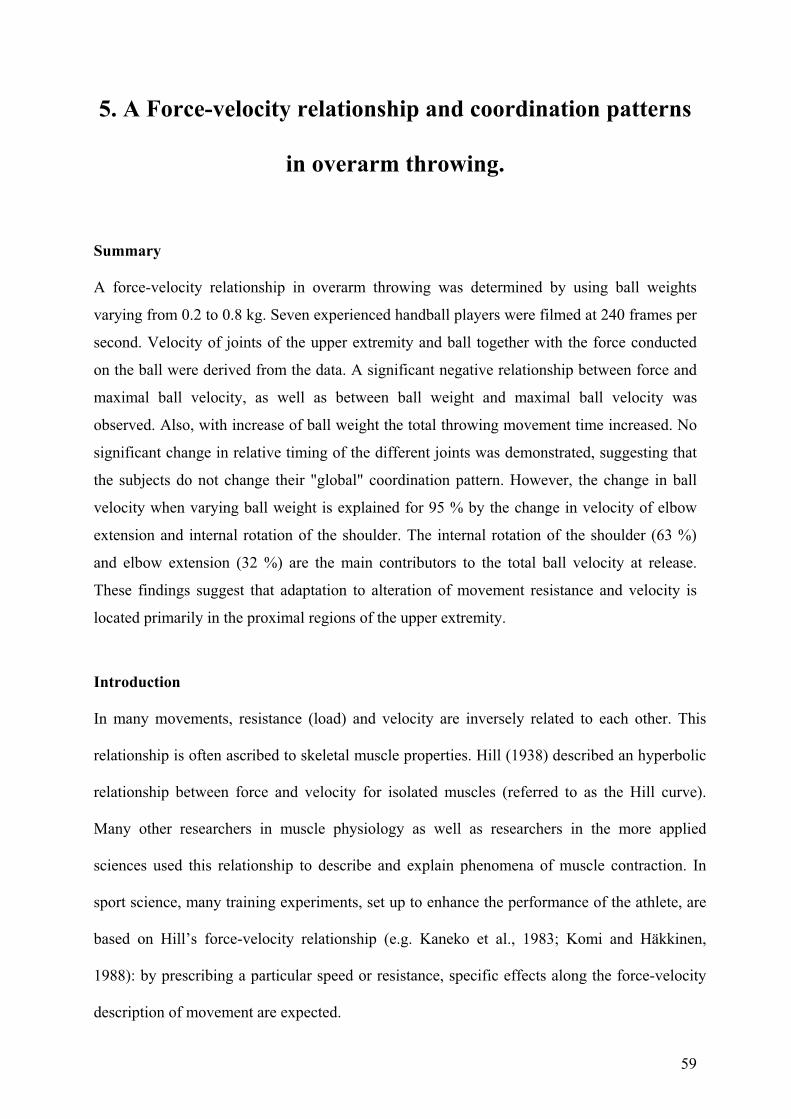
Summary
A force-velocity relationship in overarm throwing was determined by using ball weights
varying from 0.2 to 0.8 kg. Seven experienced handball players were filmed at 240 frames per
second. Velocity of joints of the upper extremity and ball together with the force conducted
on the ball were derived from the data. A significant negative relationship between force and
maximal ball velocity, as well as between ball weight and maximal ball velocity was
observed. Also, with increase of ball weight the total throwing movement time increased. No
significant change in relative timing of the different joints was demonstrated, suggesting that
the subjects do not change their "global" coordination pattern. However, the change in ball
velocity when varying ball weight is explained for 95 % by the change in velocity of elbow
extension and internal rotation of the shoulder. The internal rotation of the shoulder (63 %)
and elbow extension (32 %) are the main contributors to the total ball velocity at release.
These findings suggest that adaptation to alteration of movement resistance and velocity is
located primarily in the proximal regions of the upper extremity.
Introduction
In many movements, resistance (load) and velocity are inversely related to each other. This
relationship is often ascribed to skeletal muscle properties. Hill (1938) described an hyperbolic
relationship between force and velocity for isolated muscles (referred to as the Hill curve).
Many other researchers in muscle physiology as well as researchers in the more applied
sciences used this relationship to describe and explain phenomena of muscle contraction. In
sport science, many training experiments, set up to enhance the performance of the athlete, are
based on Hill’s force-velocity relationship (e.g. Kaneko et al., 1983; Komi and Häkkinen,
1988): by prescribing a particular speed or resistance, specific effects along the force-velocity
description of movement are expected.
60
For overarm throwing, several studies showed that by increasing ball weight the ball velocity
decreases (Toyoshima and Miyashita, 1973; Kunz, 1974; Toyoshima et al., 1976). Toyoshima
and Miyashita (1973) and Toyoshima et al. (1976) determined the relationship between
maximal ball velocity and ball weight using ball weights varying from 0.1 to 0.5 kg. Kunz
(1974) used a larger domain of ball weights varying from 0.08 to 0.8 kg, but with a low
resolution (0.08, 0.4 and 0.8 kg). Another aspect studied by several researchers is the
contribution of the body segments to the throwing performance. Toyoshima and Miyashita
(1973) showed that by constraining more body segments during the throwing task, the
maximal ball velocity decreases in the whole range of ball weights, which were used. To our
knowledge no data is available regarding changes in coordination due to ball weights. No
relationship between force production and movement velocity has been described. Thus, the
aim of this study was to describe the force-velocity relationship in overarm throwing with
different ball weights. The description had to be expressed as velocity and force applied to the
ball, not merely ball weight; in this form, a description would reveal more information
regarding neuromuscular characteristics. Furthermore, the aim was to examine if coordination
of the throwing technique changes due to these different ball weights. A possible lack of
coordinative changes would indicate the importance of muscular force-velocity properties for
such explosive movements as the overarm throw.
Methods
Seven subjects participated in this experiment. The subjects were experienced male handball
players, playing in the second division of the Norwegian national competition (mean age 25 ±
2.5 years, weight: 84.4 ± 9.9 kg., length: 1.84 ± 0.08 m.). The study complied with the
requirements of the local Committee for Medical Research Ethics and current Norwegian law
and regulations.
61
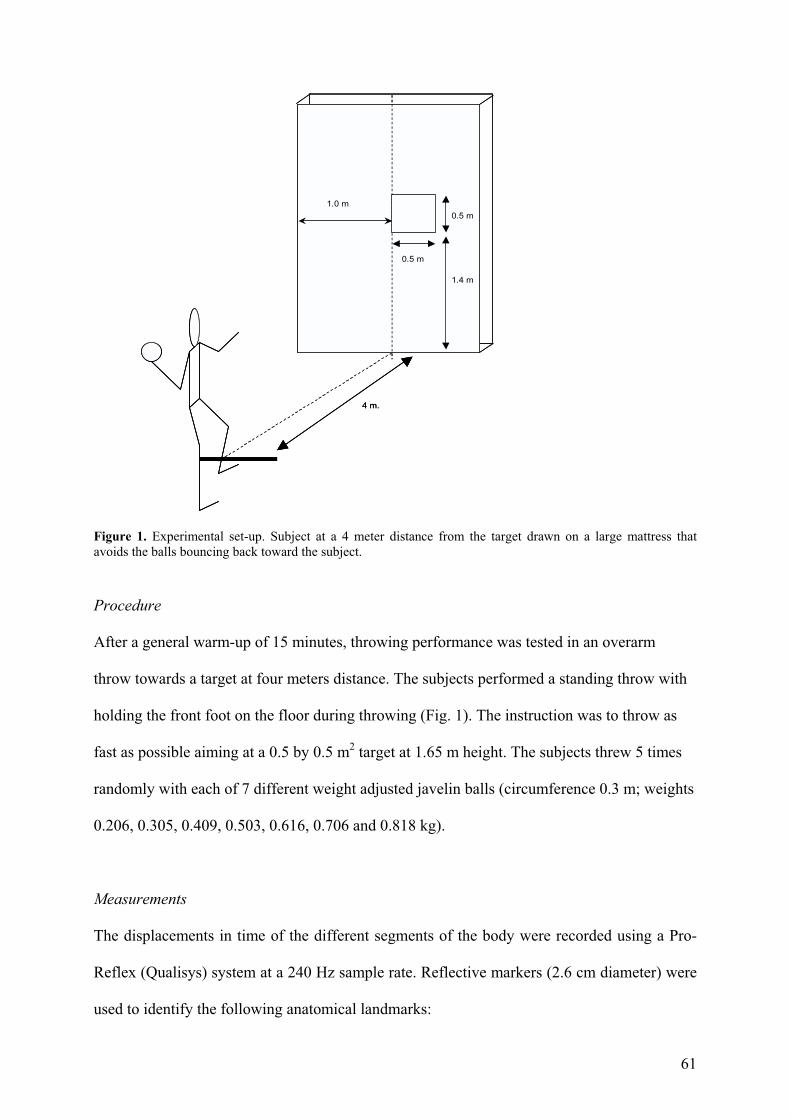
Figure 1. Experimental set-up. Subject at a 4 meter distance from the target drawn on a large mattress that avoids the balls bouncing back toward the subject.
Procedure
After a general warm-up of 15 minutes, throwing performance was tested in an overarm
throw towards a target at four meters distance. The subjects performed a standing throw with
holding the front foot on the floor during throwing (Fig. 1). The instruction was to throw as
fast as possible aiming at a 0.5 by 0.5 m2 target at 1.65 m height. The subjects threw 5 times
randomly with each of 7 different weight adjusted javelin balls (circumference 0.3 m; weights
0.206, 0.305, 0.409, 0.503, 0.616, 0.706 and 0.818 kg).
Measurements
The displacements in time of the different segments of the body were recorded using a Pro-
Reflex (Qualisys) system at a 240 Hz sample rate. Reflective markers (2.6 cm diameter) were
used to identify the following anatomical landmarks:
4 m.
1.0 m
0.5 m
0.5 m
1.4 m
4 m.
1.0 m
0.5 m
0.5 m
1.4 m
62
a) Hip: Greater trochanter on the side of the throwing arm
b) Shoulder: Acromion process on the side of the throwing arm
c) Elbow: Lateral epicondyle of the throwing arm
d) Wrist: Styloid process of the throwing arm
e) Ball: the ball was taped with reflective tape, which made it possible to identify the centre
of the ball during the attempts.
It was not possible to identify a marker on a finger, as the ball and finger marker were too
close to each other. Computation of velocity of the different joints and the ball was done
using a five point differential filter. The force on the ball was calculated by differentiating
velocity which was then multiplied by the ball mass. The velocity at ball release and the
moment of release were derived from the change in distance between the wrist and the ball.
At the moment the ball leaves the hand the distance between the wrist marker and the ball
marker increases abruptly and dramatically.
The total movement time of the throw was defined by the time at which the hip reached the
maximal linear velocity (begin of the throw) and the time at which the ball released the hand.
Maximal hip velocity was taken as an early and clearly identifiable moment in the goal
directed movement. This was done because the actual onset of goal directed movement was
hard to identify. Furthermore, at about this moment, the ball velocity started to increase
dramatically (Fig. 4; van den Tillaar and Ettema, 2002). Timing of events was presented as
time before ball release.
The angular movement of elbow extension and wrist flexion were derived from relative
positions between shoulder, elbow, and wrist marker and between elbow, wrist, and ball
marker, respectively. External and internal rotation of the shoulder were derived from
positions of shoulder, elbow and wrist marker: the orthogonal coordinate system was first
translated to centre the system in the shoulder (origin); subsequently, it was rotated to align
63
the shoulder-elbow line with the x-axis; the shoulder rotation angle was calculated as the
angle between the shoulder-elbow-wrist plane and the horizontal plane.
Statistics
To assess effects of ball weight on the velocity of the ball and joints, as well as timing, a
oneway ANOVA for repeated measures was used. Polynomial contrasts analysis was used to
identify trend characteristics. For the force-velocity relationship a linear regression procedure
was employed.
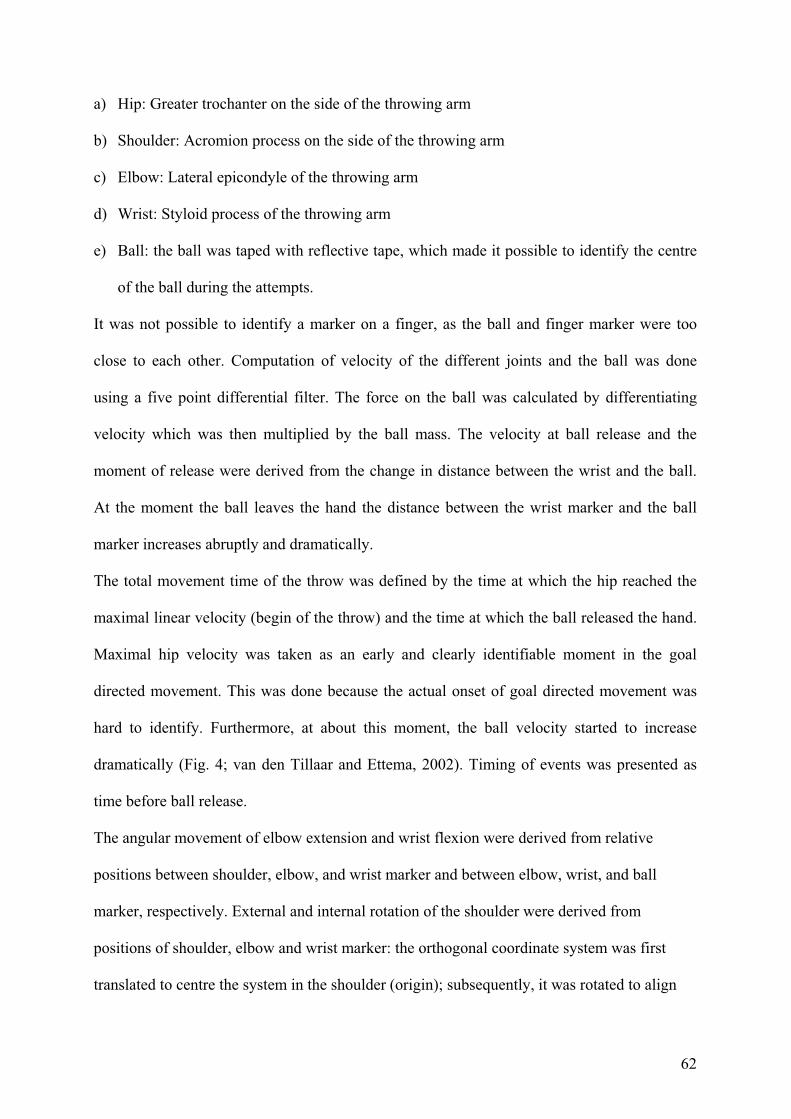
Figure 2. Relationship between ball weight and total throwing time (A) and release velocity (B) averaged over all subjects. Vertical bars indicate standard error of the mean (sem).
A
-0.14
-0.13
-0.12
-0.11
-0.10
0.1 0.2 0.3 0.4 0.5 0.6 0.7 0.8 0.9
Ball weight (kg)
Tim
e b
efo
re r
ele
as
e (
s) A
-0.14
-0.13
-0.12
-0.11
-0.10
0.1 0.2 0.3 0.4 0.5 0.6 0.7 0.8 0.9
Ball weight (kg)
Tim
e b
efo
re r
ele
as
e (
s)
B
17
18
19
20
21
22
23
24
25
0.1 0.2 0.3 0.4 0.5 0.6 0.7 0.8 0.9
Ball weight (kg)
Ve
loc
ity (
ms
-1)
B
17
18
19
20
21
22
23
24
25
0.1 0.2 0.3 0.4 0.5 0.6 0.7 0.8 0.9
Ball weight (kg)
Ve
loc
ity (
ms
-1)
64
Results
The total movement time increased and ball velocity decreased significantly with increased
ball weight (F(6,36)=2.95; p=0.017 Fig. 2A; (F(6,36)=134; p<0.001 Fig. 2B, respectively).
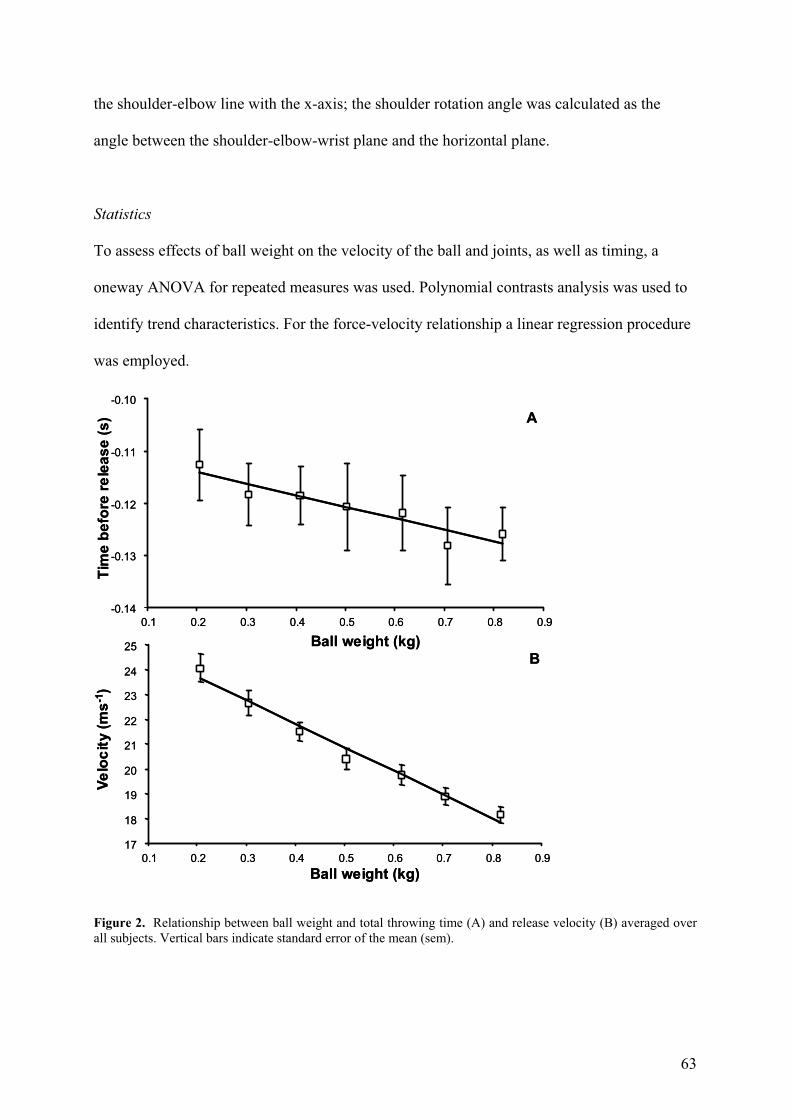
Each subject showed a significant negative linear relationship for ball velocity against both
ball weight (F(1,5)Ó103; p<0.001, rÓ0.98) and applied force (F(1.5)Ó14; p<0.012, rÓ0.87).
When all observations were used in a pooled manner, i.e. irrespective of subject, still a linear
relationship for ball velocity against both ball weight (F(1,236)=510; p<0.001, r=0.83) and
applied force (F(1.226)=156; p<0.001, r=0.64) (Fig. 3 inset) was found.
Figure 3. Relation between peak forces on the ball and release velocity of the ball Symbols indicate subjects; mean data are indicated by (͛). Inset: all observations.
Joint velocity
Figure 4 shows the development of angular velocity of the different joints and ball over time.
The vertical lines indicate the time at which the hip segment (start of movement) and different
joints reached the maximal linear velocity and angular velocity during the throw.
15
17
19
21
23
25
27
50 70 90 110 130 150 170 190 210 230
Peak force (N)
Ve
loc
ity (
ms
-1)
15
17
19
21
23
25
27
50 70 90 110 130 150 170 190 210 230
Peak force (N)
Ve
loc
ity (
ms
-1)
15
17
19
21
23
25
27
50 70 90 110 130 150 170 190 210 230
Peak force (N)
Ve
loc
ity (
ms
-1)
65
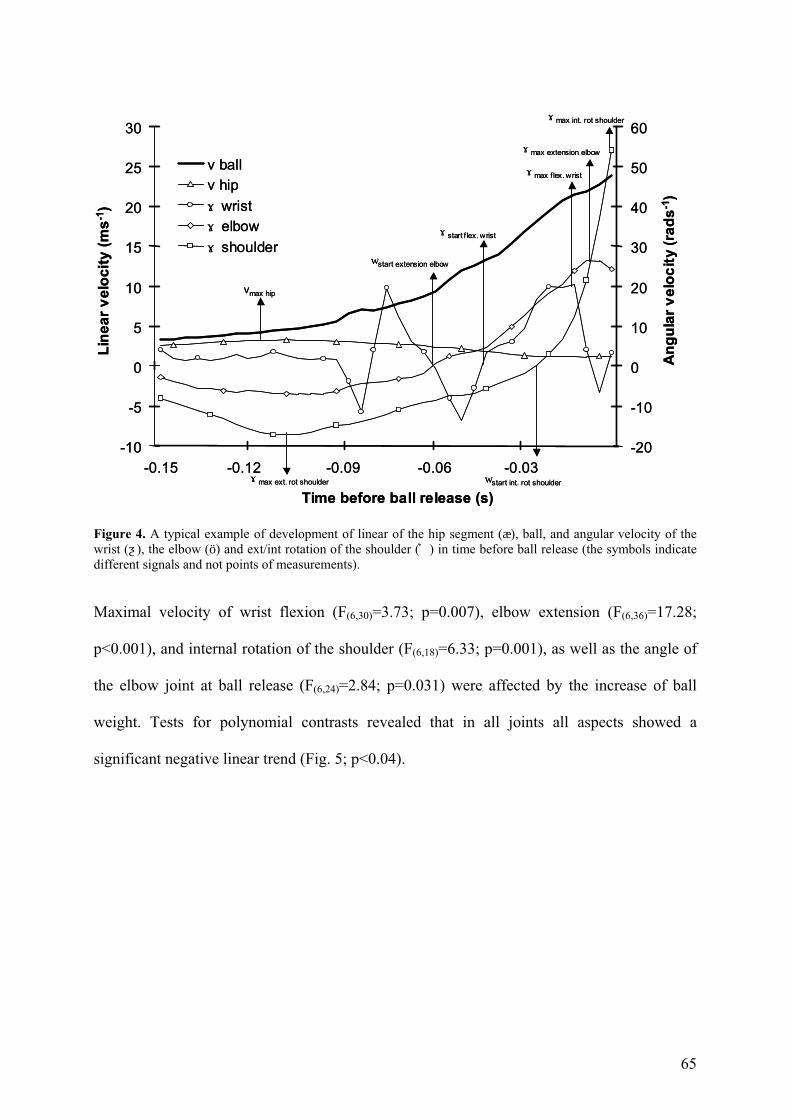
Figure 4. A typical example of development of linear of the hip segment (æ), ball, and angular velocity of the wrist (ƺ), the elbow (ö) and ext/int rotation of the shoulder (͛) in time before ball release (the symbols indicate different signals and not points of measurements).
Maximal velocity of wrist flexion (F(6,30)=3.73; p=0.007), elbow extension (F(6,36)=17.28;
p<0.001), and internal rotation of the shoulder (F(6,18)=6.33; p=0.001), as well as the angle of
the elbow joint at ball release (F(6,24)=2.84; p=0.031) were affected by the increase of ball
weight. Tests for polynomial contrasts revealed that in all joints all aspects showed a
significant negative linear trend (Fig. 5; p<0.04).
vmax hip
ɤmax ext. rot shoulder
ɤmax flex. wrist
ɤmax extension elbow
wstart extension elbow
wstart int. rot shoulder
ɤstart f lex. wrist
ɤmax int. rot shoulder
-10
-5
0
5
10
15
20
25
30
Time before ball release (s)
Lin
ea
r v
elo
cit
y (
ms
-1)
-20
-10
0
10
20
30
40
50
60
An
gu
lar
ve
loc
ity (
rad
s-1
)
v ball
v hip
ɤ wrist
ɤ elbow
ɤ shoulder
-0.15 -0.06 -0.03-0.12 -0.09
66
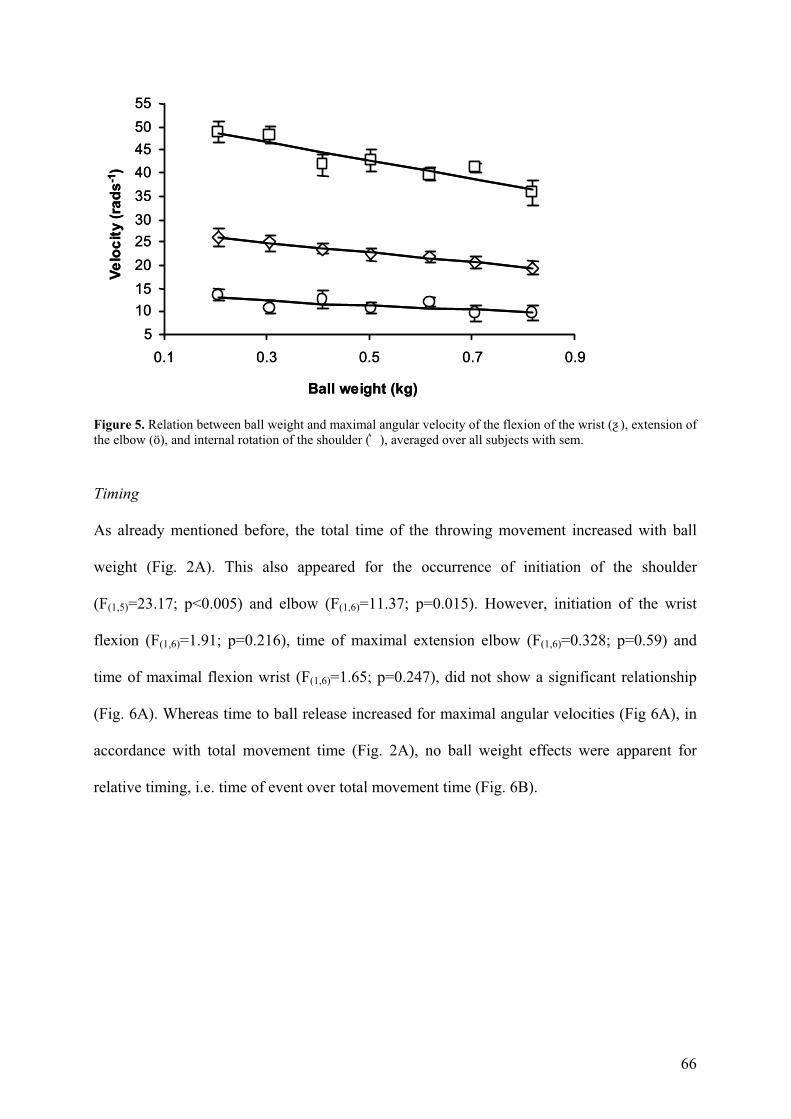
Figure 5. Relation between ball weight and maximal angular velocity of the flexion of the wrist (ƺ), extension of the elbow (ö), and internal rotation of the shoulder (͛), averaged over all subjects with sem.
Timing
As already mentioned before, the total time of the throwing movement increased with ball
weight (Fig. 2A). This also appeared for the occurrence of initiation of the shoulder
(F(1,5)=23.17; p<0.005) and elbow (F(1,6)=11.37; p=0.015). However, initiation of the wrist
flexion (F(1,6)=1.91; p=0.216), time of maximal extension elbow (F(1,6)=0.328; p=0.59) and
time of maximal flexion wrist (F(1,6)=1.65; p=0.247), did not show a significant relationship
(Fig. 6A). Whereas time to ball release increased for maximal angular velocities (Fig 6A), in
accordance with total movement time (Fig. 2A), no ball weight effects were apparent for
relative timing, i.e. time of event over total movement time (Fig. 6B).
5
10
15
20
25
30
35
40
45
50
55
0.1 0.3 0.5 0.7 0.9
Ball weight (kg)
Ve
loc
ity (
rad
s-1
)
5
10
15
20
25
30
35
40
45
50
55
0.1 0.3 0.5 0.7 0.9
Ball weight (kg)
Ve
loc
ity (
rad
s-1
)
67
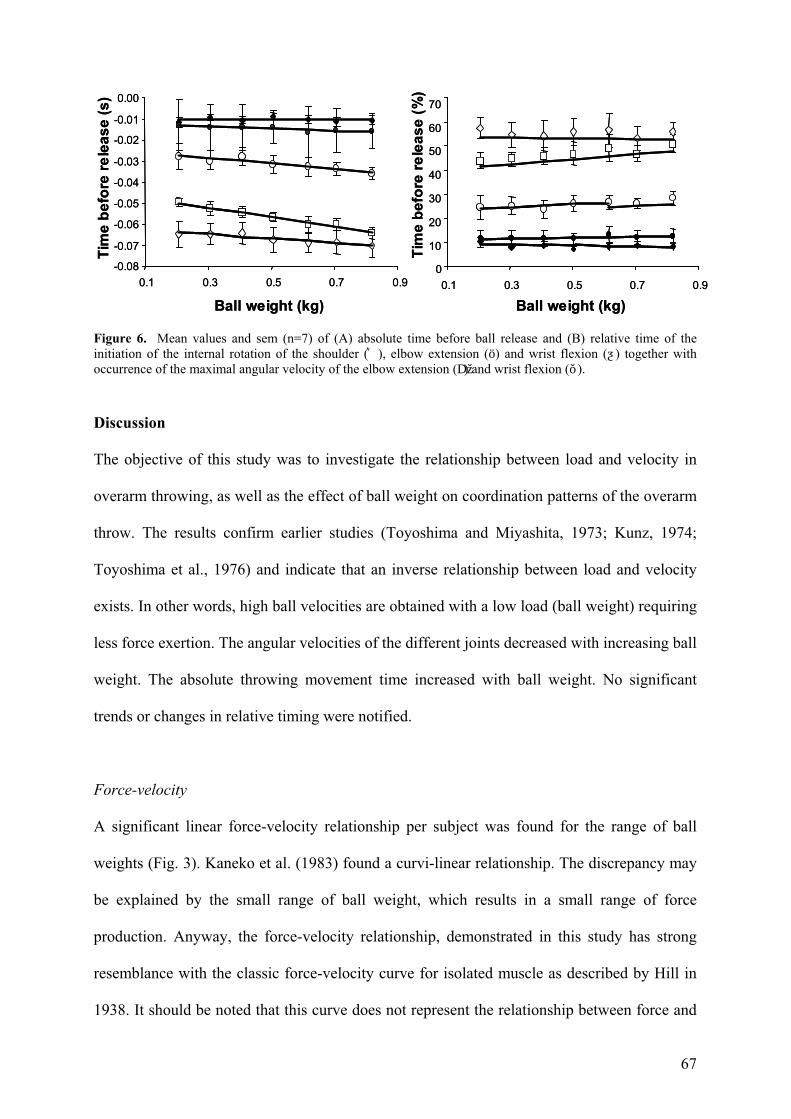
Figure 6. Mean values and sem (n=7) of (A) absolute time before ball release and (B) relative time of the initiation of the internal rotation of the shoulder (͛), elbow extension (ö) and wrist flexion (ƺ) together with occurrence of the maximal angular velocity of the elbow extension (Dž) and wrist flexion (ǒ).
Discussion
The objective of this study was to investigate the relationship between load and velocity in
overarm throwing, as well as the effect of ball weight on coordination patterns of the overarm
throw. The results confirm earlier studies (Toyoshima and Miyashita, 1973; Kunz, 1974;
Toyoshima et al., 1976) and indicate that an inverse relationship between load and velocity
exists. In other words, high ball velocities are obtained with a low load (ball weight) requiring
less force exertion. The angular velocities of the different joints decreased with increasing ball
weight. The absolute throwing movement time increased with ball weight. No significant
trends or changes in relative timing were notified.
Force-velocity
A significant linear force-velocity relationship per subject was found for the range of ball
weights (Fig. 3). Kaneko et al. (1983) found a curvi-linear relationship. The discrepancy may
be explained by the small range of ball weight, which results in a small range of force
production. Anyway, the force-velocity relationship, demonstrated in this study has strong
resemblance with the classic force-velocity curve for isolated muscle as described by Hill in
1938. It should be noted that this curve does not represent the relationship between force and
-0.08
-0.07
-0.06
-0.05
-0.04
-0.03
-0.02
-0.01
0.00
0.1 0.3 0.5 0.7 0.9
Ball weight (kg)
Tim
e b
efo
re r
ele
as
e (
s)
0
10
20
30
40
50
60
70
0.1 0.3 0.5 0.7 0.9
Ball weight (kg)
Tim
e b
efo
re r
ele
as
e (
%)
-0.08
-0.07
-0.06
-0.05
-0.04
-0.03
-0.02
-0.01
0.00
0.1 0.3 0.5 0.7 0.9
Ball weight (kg)
Tim
e b
efo
re r
ele
as
e (
s)
0
10
20
30
40
50
60
70
0.1 0.3 0.5 0.7 0.9
Ball weight (kg)
Tim
e b
efo
re r
ele
as
e (
%)
68
velocity during a single movement. Rather, for several movements in which one parameter
was systematically altered (ball weight), standard points in the time traces of two variables
(force and velocity) was determined and plotted against each other. Although the curves for
throwing and isolated muscle contraction may be similar, the systems and actions from which
these performance curves arise are quite different: complexity of the movement, the number
of factors [e.g. motivation, muscle activity levels, muscle synergies and coordination] and
system elements [e.g. nervous system, various muscles and joints] that are involved). One
should therefore take extreme care by interpreting the current force-velocity curve as being
mainly determined by muscle properties. Still the overall coordination pattern (relative
timing) seems independent of load. For example, no changes in the relative timing of the
different joints were found. This was also found in an earlier study (van den Tillaar and
Ettema 2000a, b; van den Tillaar and Ettema 2003) regarding effects of instruction regarding
accuracy and speed. Thus, with reservation, one may suggest that a force-velocity curve was
obtained for a single synergistic musculoskeletal system in overarm throwing with an
unaltered neural input. It should be noted that, although the effort was maximal, the muscular
effort may not have been maximal as the time to build up a maximal contractile state may
have exceeded the total time available to do so in all muscles in a rapid movement as an
overarm throw (Bobbert and van Ingen Schenau, 1990). Future studies, including for example
electromyography, may elucidate if with varying ball weight the neural input and muscular
coordination pattern is unaltered and if maximal contractile state is affected by the short
duration of muscular activation.
In figure 4 it was shown that the maximal internal rotation of the shoulder occurred at ball
release and that the maximal extension of the elbow occurred on average only 0.010 seconds
before ball release. The angular velocity of these two joints (mean: 42.5 rads-1: internal
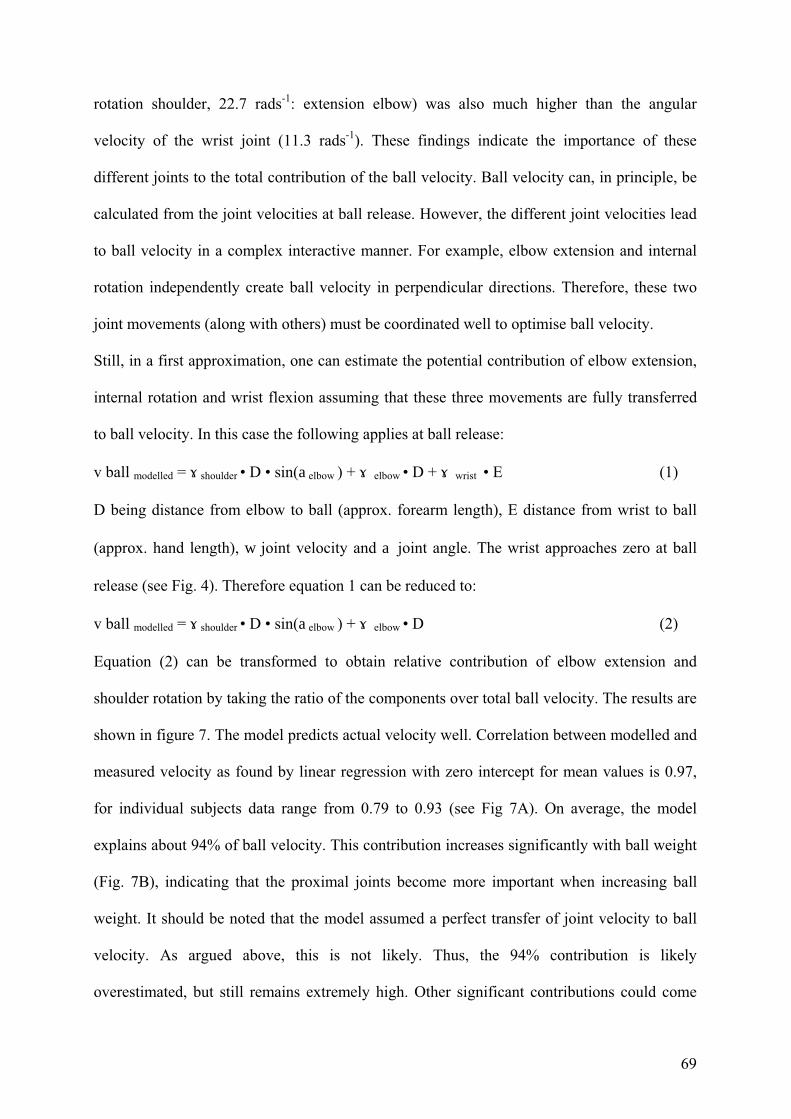
69
rotation shoulder, 22.7 rads-1: extension elbow) was also much higher than the angular
velocity of the wrist joint (11.3 rads-1). These findings indicate the importance of these
different joints to the total contribution of the ball velocity. Ball velocity can, in principle, be
calculated from the joint velocities at ball release. However, the different joint velocities lead
to ball velocity in a complex interactive manner. For example, elbow extension and internal
rotation independently create ball velocity in perpendicular directions. Therefore, these two
joint movements (along with others) must be coordinated well to optimise ball velocity.
Still, in a first approximation, one can estimate the potential contribution of elbow extension,
internal rotation and wrist flexion assuming that these three movements are fully transferred
to ball velocity. In this case the following applies at ball release:
v ball modelled = ɤshoulder • D • sin(aelbow ) + ɤ elbow • D + ɤ wrist • E (1)
D being distance from elbow to ball (approx. forearm length), E distance from wrist to ball
(approx. hand length), w joint velocity and a joint angle. The wrist approaches zero at ball
release (see Fig. 4). Therefore equation 1 can be reduced to:
v ball modelled = ɤshoulder • D • sin(aelbow ) + ɤ elbow • D (2)
Equation (2) can be transformed to obtain relative contribution of elbow extension and
shoulder rotation by taking the ratio of the components over total ball velocity. The results are
shown in figure 7. The model predicts actual velocity well. Correlation between modelled and
measured velocity as found by linear regression with zero intercept for mean values is 0.97,
for individual subjects data range from 0.79 to 0.93 (see Fig 7A). On average, the model
explains about 94% of ball velocity. This contribution increases significantly with ball weight
(Fig. 7B), indicating that the proximal joints become more important when increasing ball
weight. It should be noted that the model assumed a perfect transfer of joint velocity to ball
velocity. As argued above, this is not likely. Thus, the 94% contribution is likely
overestimated, but still remains extremely high. Other significant contributions could come
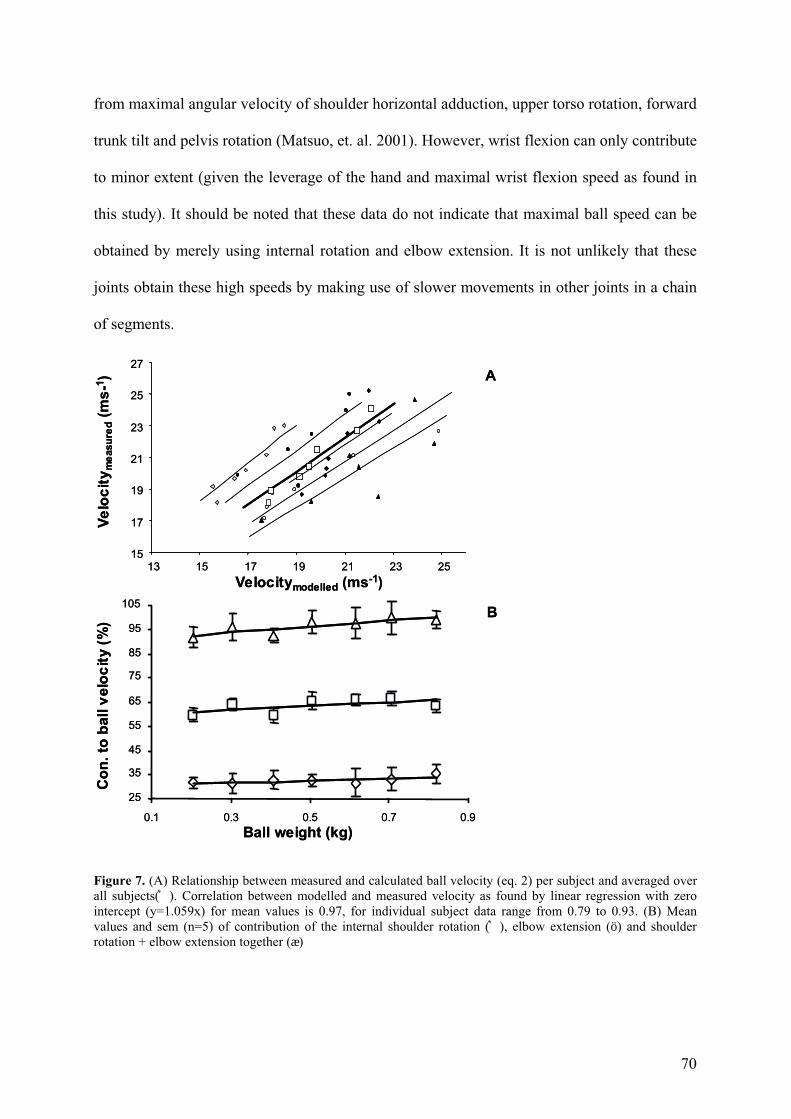
70
from maximal angular velocity of shoulder horizontal adduction, upper torso rotation, forward
trunk tilt and pelvis rotation (Matsuo, et. al. 2001). However, wrist flexion can only contribute
to minor extent (given the leverage of the hand and maximal wrist flexion speed as found in
this study). It should be noted that these data do not indicate that maximal ball speed can be
obtained by merely using internal rotation and elbow extension. It is not unlikely that these
joints obtain these high speeds by making use of slower movements in other joints in a chain
of segments.
Figure 7. (A) Relationship between measured and calculated ball velocity (eq. 2) per subject and averaged over all subjects(͛). Correlation between modelled and measured velocity as found by linear regression with zero intercept (y=1.059x) for mean values is 0.97, for individual subject data range from 0.79 to 0.93. (B) Mean values and sem (n=5) of contribution of the internal shoulder rotation (͛), elbow extension (ö) and shoulder rotation + elbow extension together (æ)
15
17
19
21
23
25
27
13 15 17 19 21 23 25
Ve
loc
ity
me
asu
red
(ms
-1) A
Velocitymodelled (ms-1)
B
25
35
45
55
65
75
85
95
105
0.1 0.3 0.5 0.7 0.9
Ball weight (kg)
Co
n.
to b
all v
elo
cit
y (
%)
15
17
19
21
23
25
27
13 15 17 19 21 23 25
Ve
loc
ity
me
asu
red
(ms
-1) A
Velocitymodelled (ms-1)
B
25
35
45
55
65
75
85
95
105
0.1 0.3 0.5 0.7 0.9
Ball weight (kg)
Co
n.
to b
all v
elo
cit
y (
%)
71
The shoulder appears to be the major contributor with a mean of 62 % (elbow 33 %).
Toyoshima et al. (1976) argued that elbow extension at different ball weights (0.1-0.5 kg.)
contributed less than 42.5 %, which is in line with the current findings.
Proximal distal sequence
In earlier studies on overarm throwing in handball, a proximal-distal sequence was found
(Jöris et. al., 1985; Tuma and Zahalka, 1997). The proximal-distal sequence is the
phenomenon of a time lag between movements of proximal and distal joints and segments,
where the distal movements are delayed with regard to the proximal movements. Herring and
Chapman (1992) showed that the proximal-distal sequence in timing of the segments may be
due to anatomical-mechanical principles and appeared to be the most effective strategy in
reaching high throwing speeds. In the present findings not all movement characteristics were
conform this principle. For example, the onset of the elbow extension preceded the onset of
the internal shoulder rotation, (Fig. 4 and 6A). Hong et al. (2001) also stated that the onset of
torques was not strictly in a successive proximal-distal order. Hong et al. (2001) found that
the forearm extensors and the internal rotators were recruited at almost the same time and kept
acting until shortly before release. Another characteristic found here (Fig. 4 and 6A) and by
Hong et al. (2001) that is not in line with the proximal-distal sequence is the earlier
occurrence of maximal angular velocity of the wrist than that of elbow extension. This early
wrist flexion may be explained by the bi-articular function of the wrist flexors. The flexor
carpi ulnaris and flexor carpi radialis have a flexor moment on the elbow and a flexor moment
in the wrist (Ettema, Styles, and Kippers, 1998). Thus, wrist flexion may be enhanced by the
strong elbow extension if these wrist flexors are active and by doing so counteract the original
elbow extension movement.
72
Conclusion
In conclusion it can be stated that there is a linear force-velocity relationship in overarm
throwing with ball weights varying from 0.2 to 0.8 kg. Qualitatively, no changes in
coordination pattern (relative timing) occur with increasing ball weight. Quantitatively, the
internal rotation of the shoulder and elbow extension are the main contributors to the total ball
velocity at release. With increased ball weight this contribution enhances indicating that the
proximal joints become more important with increased ball weight.
73
References.
Bobbert, M. van Ingen Schenau, G. J. (1990) Isokinetic plantar flexion: experimental results
and model calculations. Journal of Biomechanics, 23, 105-119.
Dempster, W. T., Gaughran, G. R. L. (1967) Properties of body segments based on size and
weight. American Journal of Anatomy, 120, 33-54.
Edwards Van Muijen, A., Jöris, H., Kemper, H. C. G., van Ingen Schenau, G. J. (1991)
Throwing practice with different ball weights: effects on throwing velocity and muscle
strength in female handball players. Sports Training, Medicine and Rehabilitation, 2,
103-113.
Ettema, G. J., Meijer, K. (2000) Muscle contraction history: modified Hill versus an
exponential decay model. Biological Cybernetics, 83, 491-500.
Ettema, G. J. C., Styles, G., Kippers, V. (1998) The moment arms of 23 muscle segments of
the upper limb with varying elbow and forearm positions: Implications for motor
control. Human Movement Science, 17, 201-220.
Herring, R. M., Chapman, A. E. (1992) Effects of changes in segmental values and timing of
both torque and torque reversal in simulated throws. Journal of Biomechanics, 25, 1173-
1184.
Hill A. V. (1938) The heat of shortening and dynamic constants of muscle. Proc. Rohal. Soc.
Series B 126, 136-195.
Hill A. V.(1964) The efficiency of mechanical power development during muscular
shortening and its relation to load. Proc. Rohal. Soc. Series B 159, 319-324
Hill, A. V. (1970) First and last experiments in muscle mechanics. Cambridge: Cambridge
University Press.
Hong, D., Cheung, T. K., Roberts, E. M. (2001) A three-dimensional, six-segment chain
analysis of forceful overarm throwing. Journal of Electromyography and Kinesiology
11, 95-112.
Hoshikawa, T., Toyoshima, S. (1976) Contribution of body segments to ball velocity during
throwing with non-preferred hand. In P. V. Komi (Ed.) Biomechanics V-B. Baltimore:
University Park Press, 109-117.
Huijing, P. A. (1995) Parameter interdependence and success of skeletal muscle modelling.
Human Movement Sciences, 14, 443-486.
Huijing, P. A. (1998) Muscle, the motor of movement: properties in function, experiment and
modelling. Journal of Electromyography and Kinesiology, 8, 61-77.
Jöris, H. J. J., Edwards van Muijen, A. J., van Ingen Schenau, G. J., Kemper, H. C. G. (1985)
Force velocity and energy flow during the overarm throw in female handball players.
Journal of Biomechanics, 18, 409-414.
74
Kaneko, M., Fuchimoto, T., Toji, H., Suei, k. (1983) training effect of different loads on the
force-velocity relationship and mechanical power output in human muscle.
Scandinavian Journal of Sports Sciences, 5, 50-55.
Komi, P. V., Häkkinen, K. (1988). Strength and power. In A. Dirix, H. G. Knuttgen, K. Tittel
(Eds.) The Olympic book of sports medicine; volume I of the encyclopaedia of sport
medicine,181-193, Oxford: Blackwell Scientific Publications.
Kunz, H. (1974) Effects of ball mass and movement pattern on release velocity in throwing.
In R. C. Nelson, C. A. Morehouse (Eds.) Biomechanics IV. Baltimore: University Park
Press, 163-168.
Matsuo, T., Escamilla, R. F., Fleisig, G. S., Barrentine, S. W., Andrews, J. R. (2001)
Comparison of kinematic and temporal parameters between different pitch velocity
groups. Journal of Applied Biomechanics, 17, 1-13.
Toyoshima, S., Hoshikawa, T., Miyashita, M., Oguri, T. (1976) Contribution of the body parts
to throwing performance. In P. V. Komi (Ed.) Biomechanics V-B. Baltimore: University
Park Press, 169-175.
Toyoshima, S., Miyashita, M. (1973) Force-velocity relation in throwing. Research
Quarterly, 44, 86-95.
Van den Tillaar, R., Ettema, E. (2000a) Influence of instruction on velocity and accuracy of
overarm throwing. In J. Avela, P. V. Komi, J. Komulainen (Eds.) Proceedings of the 5th
Annual Congress of the European College of Sport Science, Jyväskylä Finland, 19-23
July 2000. Jyväkylä: Gummerus Kirjapaino Oy, 769.
Van den Tillaar, R., Ettema, G. (2000b) Influence of instruction on velocity and coordination
of overarm throwing in handball. In J. Raczek, Z. Wakiewicz, G. Juras (Eds.) Current
research in motor control. Katowice: Interaktiv SC, 210-214.
Van den Tillaar, R., Ettema, G. (2002) The proximal-distal sequence in overarm throwing and
the effect of ball weight. In: Proceedings CD IV World congress of biomechanics,
Calgary, 4-9 August 2002.
Van den Tillaar, R., Ettema, G. (2003) Influence of instruction on velocity and accuracy of
overarm throwing. Perceptual and motor skills, 96, 423-434.
Van Ingen Schenau, G. J., Bobbert, M. F., Ettema, G. J., de Graaf, J. B., Huijing, P.A. (1988)
A simulation of rat EDL force output based on intrinsic muscle properties. Journal of
Biomechanics, 21 (10), 815-824.
Yamamoto, S., Sonoshita, A., Yamamoto, H. (1974) Biomechanical analysis on shooting
capability of an elite Japanese junior female team handball athlete. In R. C. Nelson, C.
A. Morehouse (Eds.) Biomechanics IV. London: Macmillan, 237-242.

6. Effect of different training programs on the velocity of overarm throwing Is not included due to copyright
104
7. Conclusions and suggestions for further research
In this thesis, the role of several constraints on coordination and performance in fast discrete
complex movements was investigated. Overarm throwing was used as the paradigm example
for this type of movement. Accuracy and velocity were used as measures for performance in
overarm throwing. The general finding was that the constraints that were investigated
(instruction, body size, gender, ball mass and level of training or experience) affected
performance (i.e. release velocity) but not coordination.
The type of instruction plays an evident role in the performance (Chapter 2). When the
instruction emphasises accuracy, velocity decreases. Accuracy, however, does not seem to
improve when subjects are instructed to prioritise accuracy. A possible explanation for this
finding lies in the specific subject group. The subjects were highly experienced handball
players. Thus, the accuracy they demonstrated at high velocity might have been extremely
high already and difficult to improve upon when reducing throwing velocity. Furthermore,
the velocity of throwing, when instructed with the emphasis on accuracy was around 85 % of
the maximal velocity. This suggests that experienced handball players are trained to throw
accurately at a relatively high velocity.
Regarding body composition and gender, body size has a strong positive effect on throwing
performance and isometric strength (Chapter 4). Throwing velocity appears to be affected by
gender if size is expressed as mass or height. However, this gender effect disappears to a large
extent when size is expressed as fat free body mass (FFM). For strength, no gender effect is
indicated, that is, all gender differences can be explained by size differences, irrespective of
how this is expressed. These findings strengthen the notion that gender differences are based
on a difference in muscle bulk. It is concluded that FFM, as an approximation for musculo-
skeletal mass, is the best measure to express body size with regard to physical performance.
105
Regarding mechanical constraints of the throwing task, projectile mass affects the release
velocity (Chapter 5). A linear negative relationship between ball mass and maximal ball
velocity, as well as between force and maximal ball velocity is observed. Also, with increase
of ball mass the total throwing movement time increases.
No clear answer can be given to the question which type of strength training increases the
throwing performance (velocity) most effectively and if there is any significant improvement
at all. However, training that involves throwing with underweight balls seems to have a clear
positive effect on the throwing velocity. Neural adaptation can be the reason for the increase
in this type of training regimes. Training with just overweight balls, medicine balls or general
strength training with load lower than 12 RM gives conflicting results. A possible reason for
this can be that workload is a determining factor (Gløsen, 2001), which was not always
controlled in training studies.
Generally speaking, the kinematic movement patterns (coordination) are unaffected by the
constraints investigated. The difference in ball velocity, due to instruction, is a result of the
difference in maximal linear velocity of the wrist, elbow and hip segments together with their
absolute timing before ball release. However, the subjects do not change technique (as
indicated by the invariance of the relative timing of the different body segments (Chapter 3).
Essentially the same is found when altering projectile mass (Chapter 5). When varying ball
mass, 95% of the change in ball velocity was explained by the change in velocity of elbow
extension and internal rotation of the shoulder. The internal rotation of the shoulder (63 %)
and elbow extension (32 %) are the main contributors to the total ball velocity at release.
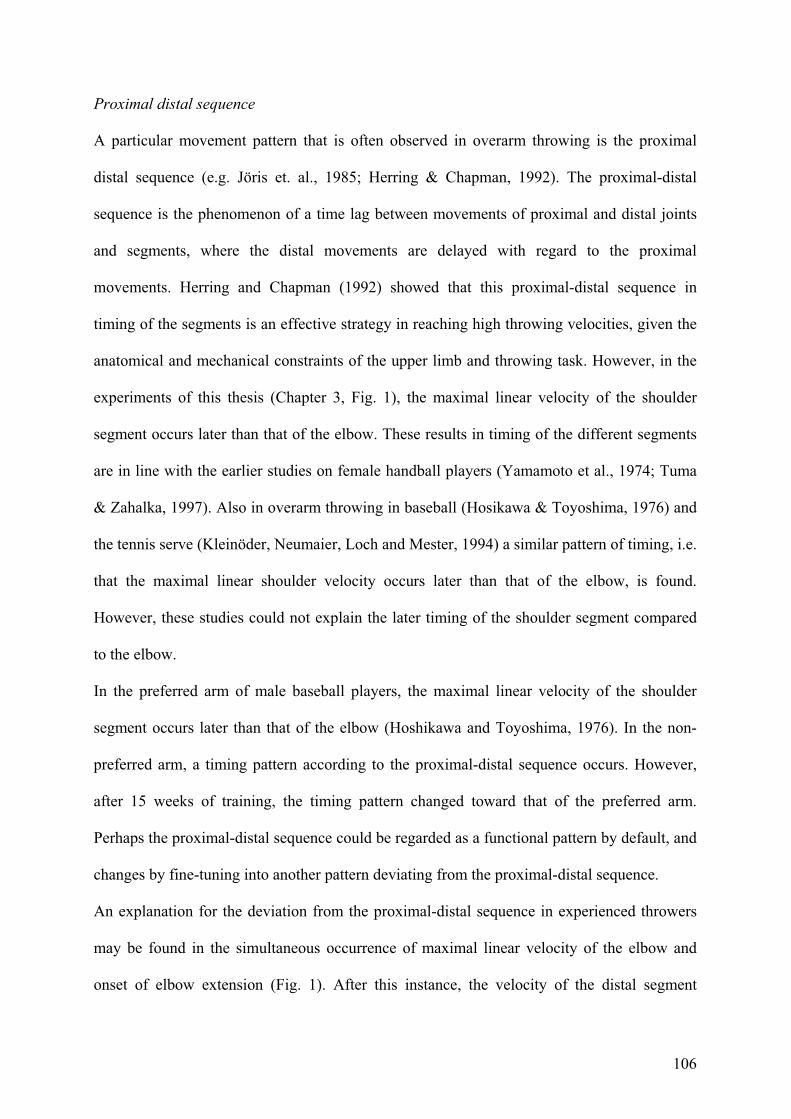
106
Proximal distal sequence
A particular movement pattern that is often observed in overarm throwing is the proximal
distal sequence (e.g. Jöris et. al., 1985; Herring & Chapman, 1992). The proximal-distal
sequence is the phenomenon of a time lag between movements of proximal and distal joints
and segments, where the distal movements are delayed with regard to the proximal
movements. Herring and Chapman (1992) showed that this proximal-distal sequence in
timing of the segments is an effective strategy in reaching high throwing velocities, given the
anatomical and mechanical constraints of the upper limb and throwing task. However, in the
experiments of this thesis (Chapter 3, Fig. 1), the maximal linear velocity of the shoulder
segment occurs later than that of the elbow. These results in timing of the different segments
are in line with the earlier studies on female handball players (Yamamoto et al., 1974; Tuma
& Zahalka, 1997). Also in overarm throwing in baseball (Hosikawa & Toyoshima, 1976) and
the tennis serve (Kleinöder, Neumaier, Loch and Mester, 1994) a similar pattern of timing, i.e.
that the maximal linear shoulder velocity occurs later than that of the elbow, is found.
However, these studies could not explain the later timing of the shoulder segment compared
to the elbow.
In the preferred arm of male baseball players, the maximal linear velocity of the shoulder
segment occurs later than that of the elbow (Hoshikawa and Toyoshima, 1976). In the non-
preferred arm, a timing pattern according to the proximal-distal sequence occurs. However,
after 15 weeks of training, the timing pattern changed toward that of the preferred arm.
Perhaps the proximal-distal sequence could be regarded as a functional pattern by default, and
changes by fine-tuning into another pattern deviating from the proximal-distal sequence.
An explanation for the deviation from the proximal-distal sequence in experienced throwers
may be found in the simultaneous occurrence of maximal linear velocity of the elbow and
onset of elbow extension (Fig. 1). After this instance, the velocity of the distal segment
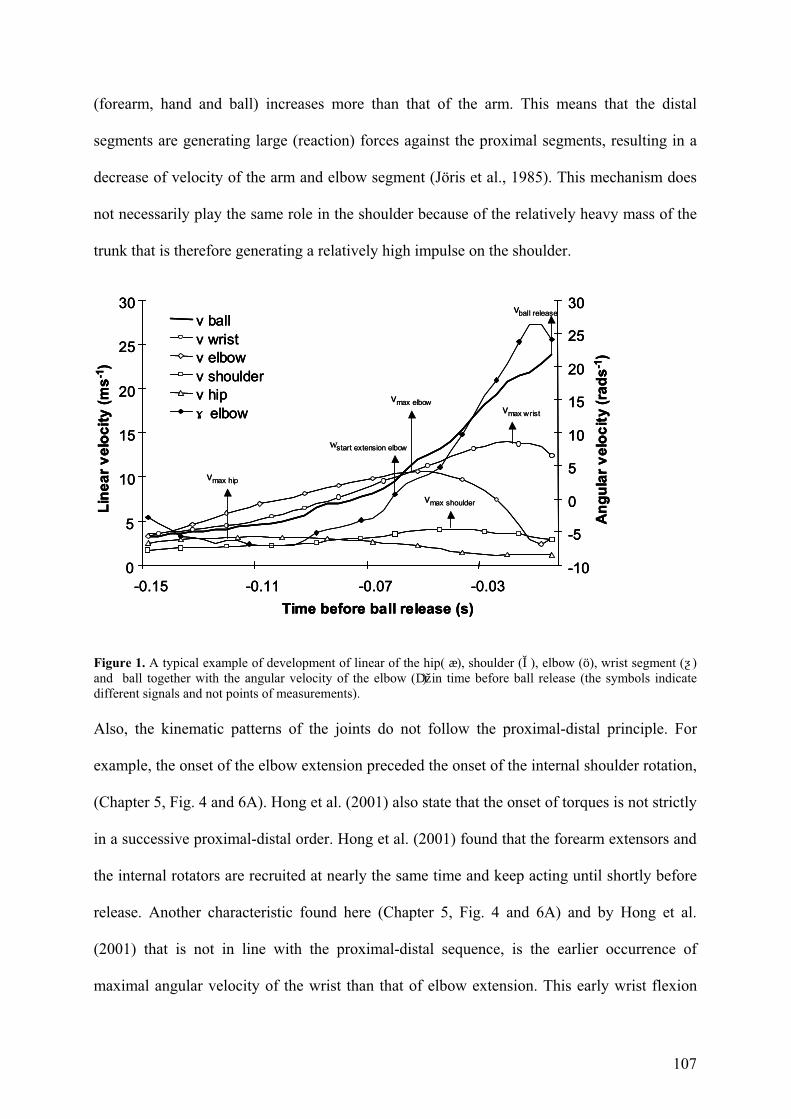
107
(forearm, hand and ball) increases more than that of the arm. This means that the distal
segments are generating large (reaction) forces against the proximal segments, resulting in a
decrease of velocity of the arm and elbow segment (Jöris et al., 1985). This mechanism does
not necessarily play the same role in the shoulder because of the relatively heavy mass of the
trunk that is therefore generating a relatively high impulse on the shoulder.
Figure 1. A typical example of development of linear of the hip( æ), shoulder (Ǐ), elbow (ö), wrist segment (ƺ)and ball together with the angular velocity of the elbow (Dž) in time before ball release (the symbols indicate different signals and not points of measurements).
Also, the kinematic patterns of the joints do not follow the proximal-distal principle. For
example, the onset of the elbow extension preceded the onset of the internal shoulder rotation,
(Chapter 5, Fig. 4 and 6A). Hong et al. (2001) also state that the onset of torques is not strictly
in a successive proximal-distal order. Hong et al. (2001) found that the forearm extensors and
the internal rotators are recruited at nearly the same time and keep acting until shortly before
release. Another characteristic found here (Chapter 5, Fig. 4 and 6A) and by Hong et al.
(2001) that is not in line with the proximal-distal sequence, is the earlier occurrence of
maximal angular velocity of the wrist than that of elbow extension. This early wrist flexion
0
5
10
15
20
25
30
-0.15 -0.11 -0.07 -0.03
Time before ball release (s)
Lin
ea
r v
elo
cit
y (
ms
-1)
-10
-5
0
5
10
15
20
25
30
An
gu
lar
ve
loc
ity (
rad
s-1
)
v ball
v wrist
v elbow
v shoulder
v hip
ɤ elbow
wstart extension elbow
vmax hip
vmax elbowvmax wrist
vmax shoulder
vball release
0
5
10
15
20
25
30
-0.15 -0.11 -0.07 -0.03
Time before ball release (s)
Lin
ea
r v
elo
cit
y (
ms
-1)
-10
-5
0
5
10
15
20
25
30
An
gu
lar
ve
loc
ity (
rad
s-1
)
v ball
v wrist
v elbow
v shoulder
v hip
ɤ elbow
0
5
10
15
20
25
30
-0.15 -0.11 -0.07 -0.03
Time before ball release (s)
Lin
ea
r v
elo
cit
y (
ms
-1)
-10
-5
0
5
10
15
20
25
30
An
gu
lar
ve
loc
ity (
rad
s-1
)
v ball
v wrist
v elbow
v shoulder
v hip
ɤ elbow
wstart extension elbow
vmax hip
vmax elbowvmax wrist
vmax shoulder
vball release
108
may be explained by the bi-articular function of the wrist flexors. The flexor carpi ulnaris and
flexor carpi radialis generate a flexor moment at the elbow and a flexor moment at the wrist
(Ettema, Styles, and Kippers, 1998). Thus, wrist flexion may be enhanced by the strong elbow
extension if these wrist flexors are active. This mechanism may thus shift the occurrence of
the maximal velocity of the wrist flexion earlier in time.
Directions for further research
The findings in this thesis have implications for further research and there is a limitation with
regard to generalisation. For example, in this study experienced handball players were used to
avoid the possible effect of inadequate coordination patterns on the findings. Thus, the
findings do not necessarily apply to another population. Ignico (1991), studying kindergarten
children (6 years old) , found conflicting results with regard to the effect of instruction, that is,
that there is no difference in either throwing velocity or accuracy between groups that trained
with emphasis on velocity, accuracy or both. It was shown that age and thereby level of
experience influenced throwing velocity (Roberton, 1978; Roberton, Halverson, Langendorf
and Williams, 1979; Halverson, Roberton and Langendorf, 1982; Williams, Haywood and
Vansant, 1991; 1998; Elliott & Anderson, 1990). Roberton (1978), Roberton et al. (1979),
Halverson et al. (1982) observed that the velocity increased with age from kindergarten age
(±6 years) to seven graders (±13 years) and that boys threw faster than girls. The boys also
increased more in throwing velocity than the girls did from kindergarten age to seven graders.
The explanation that was given for this difference was that boys were further in their
development of the throw due to the greater participation in throwing of boys than girls over
the elementary/middle school years (7-16 years) (Halverson, et al., 1982). Williams et al.
(1991, 1998) tested older adults (mean age: 70 years) and found that the throwing velocity of
these subjects was lower than that of a seven grader (±13 years) (Halverson, et al., 1982).
109
Their coordination pattern and throwing velocity was comparable with a third grader (±9
years), which was also explained by the lack of opportunity or interest (level of experience) in
throwing. Halvorson et al. (1982) also described that an average 13 year old subject does not
show a fully developed overarm throw. However, Elliott and Anderson (1990) found that 13-
and 15-years-old experienced subjects showed a mature throwing pattern compared to
experienced adolescents, which explains the effect of throwing experience.
Differences in accuracy, due to level of expertise, were also found in dart throwing (Etnyre,
1998). Also, in that study it was observed that throwing with maximal force resulted in more
variability. This indicated that the type of fast discrete complex movement is important as
well. In this thesis the overarm throw was used as a paradigm for fast discrete complex
movements. In many ways the overarm throw shows similarities with other fast discrete
complex movements like volleyball spiking and soccer kicking. In the research on volleyball
spiking (Chung, Choi, Shin, 1990, Coleman, 1993, Chengfu, Gin-Chang, Tai-Yen, 1999) the
observed maximal extension of the elbow was of the same amount as in this study (25.8 rad/s-
270 grams: chapter 5). The maximal ball velocity in volleyball spiking for females was also
comparable with the velocity in overarm throwing (Chung, 1988, Chenfu, Gin-Chang, Tai-
Yen, 1998, Christopher & Ricard, 2002). However, the maximal ball velocity and internal
rotation measured in volleyball spiking and overarm throwing differed much (ball velocity: 27
vs. 24 m/s, int. rot. shoulder: 25 vs. 48 rad/s). These differences can be caused by the type of
fast discrete complex movement task. In the tennis serve and volleyball spiking the impact
aspect and thereby perception is of importance, which is not the case in non-impact
movements (throwing). This could also be the case in movements of the upper limb versus
lower limb (soccer kick). Amos and Morag (2002) showed that by increasing shoe mass the
foot velocity decreases in soccer kicking, which is similar to the findings on overarm
throwing in chapter 5. However, the ball velocity did not change with the use of different shoe
110
masses. Thus, the studies in this thesis could give other results in other type of fast discrete
complex movements, which makes it difficult to generalize the findings from this research to
other fast discrete complex movements. The scientific challenge is to find out to what extent
the constraints imposed upon these movements has similar effects on performance.
Coordination and muscle activity patterns
In this study, the throwing performance (velocity and accuracy) was the main dependent
variable. However, to obtain information on how this performance was achieved, coordination
was examined as well. Kinematic analysis was used for this purpose. The findings in timing
of segments and joints that were observed are not conform the proximal-distal sequence that
is regarded as a highly effective strategy. Further research needs to be performed to better
understand the reason for this disconformity. It would be interesting to measure muscle
activity (EMG) of the major muscles of shoulder and upper limb including important bi-
articular muscles of the forearm during the throw and to perform a more detailed kinematic
analysis of the wrist and finger joints. This may provide useful information at the neuro-
muscular level regarding the proximal-distal sequence and the total contribution of the
different joints and muscles to the development of the throw. Research at this level may
provide answers to this question that cannot be found at the kinematic level of analysis.
111
References
Amos, M. S. Morag, E. (2002) Effect of shoe mass on soccer kicking velocity. In:
Proceedings CD IV World congress of biomechanics, Calgary, 4-9 August 2002.
Chenfu, H., Gin-Chang, L., Tai-Yen, S. (1998). A three-dimensional analysis of the volleyball
one-foot jump spike. In: Proceeding of the ISBS Symposium XVI 1998, Konstanz,
Germany.
Chenfu, H., Gin-Chang, L., Tai-Yen, S. (1999). Kinematic analysis of the volleyball back row
jump spike. In: Proceeding of the ISBS Symposium XVII 1999, Perth, Australia.
Christopher, G. A., Ricard, M. D. (2002) Shoulder biomechanics in volleyball spiking:
implications for injuries. In: Proceedings CD IV World congress of biomechanics,
Calgary, 4-9 August 2002.
Chung, C. S. (1988). Three-dimensional analysis of the shoulder and elbow joints during the
volleyball spike. Unpublished doctoral dissertation, University of Indiana, Bloomington.
Chung, C. S., Choi, K. J., Shin, I. S. (1990). Three-dimensional analysis of the striking arm
during the volleyball spike. Korean Journal of Sport Science, 2, 124-151.
Coleman, S. G. S., Benham, A. S., & Northcott, S. R. (1993) A three-dimensional
cinematographical analysis of the volleyball spike. Journal of Sports Sciences, 11, 295-
302.
Elliott, B., Anderson, G. (1990) Age related references in high performance overarm throwing
patterns. Journal of Human movement studies, 18, 1-24.
Etnyre, B. R. (1998) Accuracy characteristics of throwing as a result of maximum force
effort. Perceptual and Motor Skills, 86, 1211-1217.
Ettema, G. J. C., Styles, G., Kippers, V. (1998) The moment arms of 23 muscle segments of
the upper limb with varying elbow and forearm positions: Implications for motor
control. Human Movement Science, 17, 201-220.
Gløsen, T. (2001) Trening studiet for å se effekten av spesifikk styrke og variable teknikk
trening på skuddhastigheten I handballskuddet. Master thesis, Trondheim: Norwegian
University of Science and Technology.
Halverson, L. E., Roberton, M. A. and Langendorf, S. (1982) Development of the overarm
throw: movement and ball velocity changes by seventh grade. Research Quarterly for
Exercise and Sport, 53, 198-205.
Herring, R. M., Chapman, A. E. (1992) Effects of changes in segmental values and timing of
both torque and torque reversal in simulated throws. Journal of Biomechanics, 25, 1173-
1184.
112
Hong, D., Cheung, T. K., Roberts, E. M. (2001) A three-dimensional, six-segment chain
analysis of forceful overarm throwing. Journal of Electromyography and Kinesiology,
11, 95-112.
Hoshikawa, T., Toyoshima, S. (1976) Contribution of body segments to ball velocity during
throwing with non-preferred hand. In P. V. Komi (Ed.) Biomechanics V-B. Baltimore:
University Park Press, 109-117.
Ignico, A. A. (1991) Relative effects of speed-accuracy emphasis on kindergarten children's
learning of the overarm throw. Journal of the International Council for Health, Physical
Education and Recreation, 27, 12-15.
Jöris, H. J. J., Edwards van Muijen, A. J., van Ingen Schenau, G. J., Kemper, H. C. G. (1985)
Force velocity and energy flow during the overarm throw in female handball players.
Journal of Biomechanics, 18, 409-414.
Kleinöder, H., Neumaier, A., Loch, M. and Mester, J. (1994) Untersuchungen zur variation
im aufschlag, in P. Koch & P. Maier (Eds.) Tennisvermittlung als interpretation und
auswertung sportwissenschaftlicher erkenntnisse. St. Augustin: Academica Verlag, 41-
64
Roberton, A. (1978) Longitudinal evidence for developmental stages in the forceful overarm
throw. Journal of Human Movement Studies, 4, 167-175.
Roberton, A., Halverson, L. E., Langendorf, S. and Williams, K. (1979) Longitudinal changes
in children's overarm throw ball velocities. Research Quarterly, 50, 256-264.
Tuma, M., Zahalka, F. (1997) Three dimensional analysis of jump shot in handball. Acta
Universitatis Carolinae Kinanthropologica, 33, 81-86.
Williams K., Haywood K. and VanSant A. (1991) Throwing patterns of older adults: a
follow-up investigation. International Journal Aging and Human Development, 33 (4),
279-294.
Williams K., Haywood, K. and VanSant A. (1998) Changes in throwing by older adults: a
longitudinal investigation. Research Quarterly for Exercise and Sport, 69, 1-10.
Yamamoto, S., Sonoshita, A., Yamamoto, H. (1974) Biomechanical analysis on shooting
capability of an elite Japanese junior female team handball athlete. In R. C. Nelson & C.
A. Morehouse (Eds.) Biomechanics IV. London: Macmillan, 237-242.