Embed Size (px)
Citation preview

1-Joseph Scianna, PMC Manager, USDA-NRCS, Bridger, MT [email protected]; 2-Robert Kilian, Rangeland Specialist (retired), Bridger, MT; 3-Jennifer Muscha, Rangeland Management Specialist, USDA-ARS, Miles City, MT; 4-Jim Jacobs, Plant Materials Specialist (retired), USDA-NRCS, Bozeman, MT
Effect of Container Size on the Survival and Growth of Plains Cottonwood Populus deltoides ssp. monilifera Seedlings in a Riparian Planting in Eastern
Montana
(MTPMC-10-009) Joseph Scianna1, Robert Kilian2, Jennifer Muscha3, and Jim Jacobs4
ABSTRACT Plains cottonwood [Populus deltoides W. Bartram ex Marshall ssp. monilifera (Aiton) Eckenwalder] is an important component of many riparian plant communities in the Great Plains and mid-Atlantic states, but natural recruitment is low, and failure rates of conservation plantings are relatively high. Additionally, competition from invasive woody species such as Russian olive (Elaeagnus angustifolia) and saltcedar (Tamarix ramosissima) has significantly reduced cottonwood regeneration in areas where these invasive species have established. The goal of this study was to determine if seedlings propagated in deep pots (tall, narrow containers), and therefore containing long and extensive root systems, survive and grow better than plants propagated in more shallow, conventional pots. Additionally, planting distance and elevation relative to the river, and soil moisture relations, were investigated. Survival and growth of plains cottonwood seedlings propagated in conventional 2.5-inch by 10-inch deep containers, 2.5-inch by 24-inch deep PVC (polyvinyl chloride) tubing, and 2.5-inch by 36-inch deep PVC tubing, were compared. In 2011, a replicated study was installed along the Yellowstone River at the Fort Keogh Livestock and Range Research Laboratory near Miles City, Montana. After four growing seasons, there was a statistical difference in percent survival between the 10-inch containers (80%) and 24- and 36-inch containers (96.7 and 100%, respectively) at the 85% confidence interval. There was no statistical difference in survival with distance from and elevation relative to the river. There was inconsistent but improved height and caliper growth with increasing distance from the river, presumably reflective of soil characteristics. Soil moisture tension data indicated wide differences in tension, and therefore moisture availability, over time. Differences were noted with depth in the soil profile and with distance and elevation from the river. Results suggest a greater likelihood of plant-available soil moisture at all depths from March through July. The longest intervals of optimum plant-available soil moisture (<100 centibars) occurred at the 4-foot depth, whereas the greatest intervals of tension greater than or equal to 200 centibars occurred at the 2-foot depth. Benefits from deep pot plantings are recognized but cost analyses are needed to determine if the additional production and installation expenses associated with deep pots is offset by increased seedling survival and growth.
FINAL STUDY REPORT Bridger Plant Materials Center, Bridger, Montana

2
INTRODUCTION Plains cottonwood (Populus deltoides ssp. monilifera) is an important native tree species found growing in many riparian areas across vast regions of the western and central United States (PLANTS, 2017). Classified as a phreatophyte, plains cottonwood has roots growing in the water table or capillary fringe during all or some of the growing season. The capillary fringe is the zone immediately above the water table where soil moisture is consistently and readily available, and soil aeration supports roots and their growth (Dreesen and Fenchel, 2010). Plains cottonwood has relatively specific recruitment requirements limited by irregular and inconsistent seed production, water flow regulation, land clearing, wildlife and livestock browsing, beaver predation, ice damage, and fire (Pearce and Smith, 2001). Additionally, competition from invasive, introduced species, including Russian olive (Elaeagnus angustifolia) and saltcedar (Tamarix ramosissima) may limit recruitment of plains cottonwood in floodplains and riparian corridors, especially where flow regulation (such as that caused by dams) occurs (Lesica and Miles, 1999; Lesica and Miles, 2001). In many cases, improper planning, installation, and maintenance of woody plantings has resulted in poor plant establishment and growth. Deep pot techniques could potentially reduce or eliminate the need for supplemental irrigation after planting, a time consuming and costly practice required in many arid and semi-arid regions for early plant survival and establishment. Previous studies with woody riparian species have tested various methods of deep-planting in an attempt to place vegetative cuttings or seedling roots in close proximity to the capillary fringe in order to enhance adventitious rooting of cuttings or seedling establishment and persistence. Various deep-planting techniques have been tested including dormant pole cuttings, deep-planting of whip cuttings, deep-planting of long-stemmed container stock, and use of deep pots (Dreesen and Fenchel, 2010). After considering various options, the authors decided to test deep pots using plains cottonwood propagated from seed. It was felt that the use of seedlings in habitat restoration projects would promote greater genetic diversity than clonal cuttings, and propagation facilities at the Bridger Plant Materials Center (BPMC) were well-suited for deep pot production. The study goals were to investigate the effectiveness of deep pot planting technology using plains cottonwood, and to determine if this technique is a practical and superior method of establishing this species as compared to conventional plant containers.
MATERIALS AND METHODS Seed was collected in 2009 from plains cottonwood trees growing in the Miles City, Montana, area and sent to the BPMC for cleaning and sowing. Seedlings were started in mid-summer 2009 in a peat based potting mix, Sunshine #1® (Sun Gro Horticulture, Agawam, MA) in 7-cubic-inch Ray Leach cone-tainers® (Stuewe & Sons, Inc., Tangent, OR) in a greenhouse maintained for 16-hour photoperiods at 75 to 80ºF (day) and 65 to 70ºF (night). The seedlings were moved outdoors in late summer to a partially shaded area to harden off, and over-wintered in a coldframe maintained at approximately 35ºF. In spring 2010, seedlings were transplanted into conventional D40 Deepots®, 2.5-inch by 10-inch deep containers (Stuewe & Sons Inc., Tangent, OR), 2.5-inch by 24-inch deep PVC (polyvinyl chloride) tubing, and 2.5-inch by 36-inch deep PVC tubing in Sunshine #1® potting mix. There were 30 seedlings transplanted into each container size for a
3
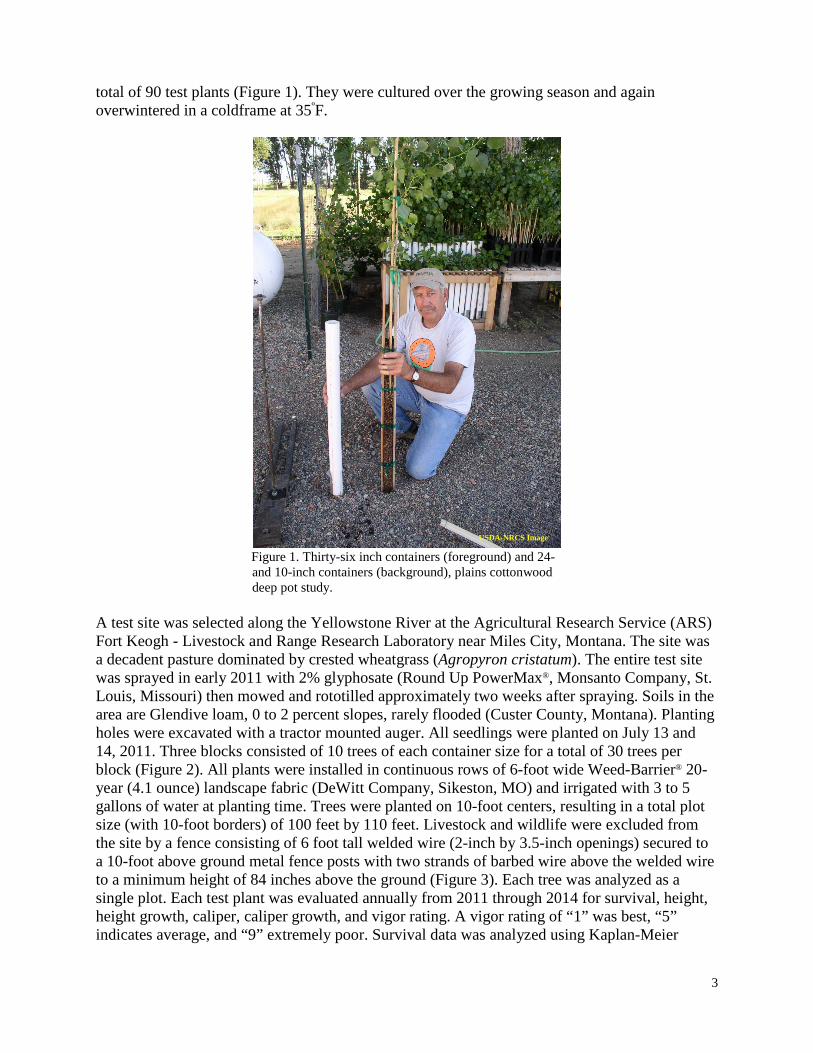
total of 90 test plants (Figure 1). They were cultured over the growing season and again overwintered in a coldframe at 35ºF.
Figure 1. Thirty-six inch containers (foreground) and 24- and 10-inch containers (background), plains cottonwood deep pot study. A test site was selected along the Yellowstone River at the Agricultural Research Service (ARS) Fort Keogh - Livestock and Range Research Laboratory near Miles City, Montana. The site was a decadent pasture dominated by crested wheatgrass (Agropyron cristatum). The entire test site was sprayed in early 2011 with 2% glyphosate (Round Up PowerMax®, Monsanto Company, St. Louis, Missouri) then mowed and rototilled approximately two weeks after spraying. Soils in the area are Glendive loam, 0 to 2 percent slopes, rarely flooded (Custer County, Montana). Planting holes were excavated with a tractor mounted auger. All seedlings were planted on July 13 and 14, 2011. Three blocks consisted of 10 trees of each container size for a total of 30 trees per block (Figure 2). All plants were installed in continuous rows of 6-foot wide Weed-Barrier® 20-year (4.1 ounce) landscape fabric (DeWitt Company, Sikeston, MO) and irrigated with 3 to 5 gallons of water at planting time. Trees were planted on 10-foot centers, resulting in a total plot size (with 10-foot borders) of 100 feet by 110 feet. Livestock and wildlife were excluded from the site by a fence consisting of 6 foot tall welded wire (2-inch by 3.5-inch openings) secured to a 10-foot above ground metal fence posts with two strands of barbed wire above the welded wire to a minimum height of 84 inches above the ground (Figure 3). Each tree was analyzed as a single plot. Each test plant was evaluated annually from 2011 through 2014 for survival, height, height growth, caliper, caliper growth, and vigor rating. A vigor rating of “1” was best, “5” indicates average, and “9” extremely poor. Survival data was analyzed using Kaplan-Meier
USDA-NRCS Image

4
Product-Limit Survival Distribution (time variable: time; event variable: death; group variable: root length), and growth data using ANOVA and Tukey’s multiple comparisons test (Statistix® 8, Analytical Software – Tallahassee, FL).
Figure 2. Plot layout, cottonwood deep pot study, Miles City, Montana.
Figure 3. Completed installation of test plot, plains cottonwood deep pot study, Miles City, Montana.
USDA-NRCS Image

5
Monthly and annual precipitation data over the course of the study was provided by the National Oceanic and Atmospheric Administration (NOAA) weather station located at the Miles City, Montana airport (Table 1). Long-term growing season and annual precipitation (~14 inches) were well below average in 2012 and above average in 2013. Table 1. Monthly and annual precipitation, plains cottonwood deep pot study, Miles City, Montana. 2012-2014.
Year
Growing Season Precipitation
(May-August) Total Annual Precipitation
---------------inches------------- 2012 2.99 6.16 2013 12.02 17.11 2014 10.10 13.21
In 2012, depth to gravel and percent clay data were collected at random locations in each subplot; subplot I – six samples (closest to the river), subplot II – 4 samples, and subplot III – 7 samples (farthest from the river) (Table 2). Depth to gravel and percent clay increased with distance from the river. Percent clay in each subplot increased with depth in the soil profile, with the exception of subplot III where it decreased slightly from 24 to 36 inches. Table 2. Mean depth to gravel and percent clay, plains cottonwood deep pot study, Miles City, Montana. 2012.
Rep Depth to Gravel
Mean Percent Clay at <~10"
Mean Percent Clay at <~24"
Mean Percent Clay at <~36"
--inches-- ---------------------------%------------------------ Subplot I 31.3 8.8 14.3 17.0 Subplot II 32.8 10.6 17.7 NA Subplot III 39.9 14.7 22.2 20.0
In July 2013, Watermark® Model 900M Data Logger soil tensiometers (Irrometer®, Riverside, CA) were installed in each subplot, with two sensors (Model 200SS Watermark®) at 1-, 2-, 3-foot depths, and one sensor at a 4-foot depth. These sensors measured soil water tension, and a separate probe measured soil temperature at one foot deep.
RESULTS AND DISCUSSION Overall (all container sizes) seedling performance data by year is presented in Table 3. Seedling survival stabilized after 2012, and all other plant growth parameters continued to increase or improve over time, with the exception of height growth in 2014. By fall of 2011, mean percent survival measured 80% (10-inch containers), 96.7% (24-inch containers), and 100% (36-inch containers) (Figure 1). One 36-inch container died in 2012, but appeared to be the result of insect predation. Using an 85% Confidence Interval, there was a statistical difference in survival between 10-inch containers and the 24- and 36-inch containers. There were no statistical differences in survival at the 95% confidence interval. There was no statistical difference for seedling survival among the three subplots (total elevation differential of approximately 0.45 feet).

6
Table 3. Mean seedling performance over time, plains cottonwood deep pot study, Miles City. MT.
Year
All Seedlings Percent Survival
All Seedlings
Mean Height
All Seedlings
Mean Height Growth
All Seedlings
Mean Caliper
All Seedlings
Mean Caliper Growth
All Seedlings
Mean Vigor Rating
--%-- ----------cm---------- ----------mm--------- (1-9) 2011 92.22 121.4 48.9 16.9 11.3 4.6 2012 91.11 166.4 43.0 35.9 19.0 3.7 2013 91.11 298.2 131.8 59.1 23.2 3.5 2014 91.11 400.1 101.9 83.8 25.3 3.5
Figure 1. Mean percent seedling survival over time, plains cottonwood deep pot study, Miles City, Montana. Mean seedling height (cm) and mean seedling annual height growth (cm) over time appear in Figures 2 and 3, respectively. The three-way interaction for height growth suggests initially (2011) only trees in the 10-inch containers grew significantly greater in subplot III (farthest from the river, greatest elevation) than subplots I and II (relatively closer to the river and lower elevation). In 2012, seedling height growth was greater in subplot III than subplot II, but not than subplot I. This was driven mainly by the 36-inch container seedlings having greater height growth in subplot III than subplots II and I. In 2013, seedlings growing in subplot III produced greater height growth than seedlings growing in subplots II and I. This was driven by 24-inch container seedlings producing greater growth in subplot III than subplot I, but not different than subplot II (although the interaction of elevation and pot size P>0.4). In 2014, all seedlings had greater height growth in subplot III and II than subplot I, regardless of pot size (although interaction P >0.6).
0102030405060708090
100
Spring 2011 Fall 2011 2012 2013 2014Perc
enta
ge S
eedl
ing
Surv
ival
(%)
Year
10-inch deep pots 24-inch deep pots 36-inch deep pots

7
Figure 2. Mean seedling height over time, plains cottonwood deep pot study, Miles City, Montana.
Figure 3. Mean seedling annual height growth over time, plains cottonwood deep pot study, Miles City, Montana. Mean seedling basal caliper (millimeters) and basal caliper growth (millimeters) over time appear in Figures 4 and 5, respectively. Caliper data was not normally distributed and transformation did not normalize the data. The results may suggest year and elevation affected caliper growth but container size did not. Elevation affected caliper growth only in 2012, when seedlings had greater caliper growth in subplot III than subplot II.
0
50
100
150
200
250
300
350
400
450
2011 2012 2013 2014
Mea
n H
eigh
t (cm
)
Year
10-inch deep pots 24-inch deep pots 36-inch deep pots
0
20
40
60
80
100
120
140
160
2011 2012 2013 2014
Mea
n H
eigh
t Gro
wth
(cm
)
Year
10-inch deep pots 24-inch deep pots 36-inch deep pots

8
Figure 4. Mean seedling basal caliper over time, plains cottonwood deep pot study, Miles City, Montana.
Figure 5. Mean seedling basal caliper growth over time, plains cottonwood deep pot study, Miles City, Montana.
Mean seedling vigor rating (1 through 9) over time appears in Figure 6. Differences among container sizes were relatively small, and all means suggested good vigor, which improved with time. Vigor as a predictor of height and caliper growth using regression analysis with annual growth measures suggest vigor ratings are at best approximately 40% accurate in estimating height and caliper growth, and there are sizeable differences among years.
0102030405060708090
100
2011 2012 2013 2014
Mea
n B
asal
Cal
iper
(mm
)
Year
10-inch deep pots 24-inch deep pots 36-inch deep pots
0.0
5.0
10.0
15.0
20.0
25.0
30.0
2011 2012 2013 2014Mea
n B
asal
Cal
iper
Gro
wth
(mm
)
Year
10-inch deep pots 24-inch deep pots 36-inch deep pots

9
Figure 6. Mean seedling vigor rating over time, plains cottonwood deep pot study, Miles City, Montana.
Figure 7. Monthly precipitation from July 2013 through March 2015, plains cottonwood deep pot study, Miles City, Montana.
0.00.51.01.52.02.53.03.54.04.55.0
2011 2012 2013 2014
Mea
n V
igor
Rat
ing
(1-9
)
Year
(1-9; 1=best)
10-inch deep pots 24-inch deep pots 36-inch deep pots
0.0
0.5
1.0
1.5
2.0
2.5
3.0
3.5
4.0
4.5
5.0
Jul-1
3A
ug-1
3Se
p-13
Oct
-13
Nov
-13
Dec
-13
Jan-
14Fe
b-14
Mar
-14
Apr
-14
May
-14
Jun-
14Ju
l-14
Aug
-14
Sep-
14O
ct-1
4N
ov-1
4D
ec-1
4Ja
n-15
Feb-
15M
ar-1
5
Prec
ipita
tion
(inch
es)
Month & Year
10
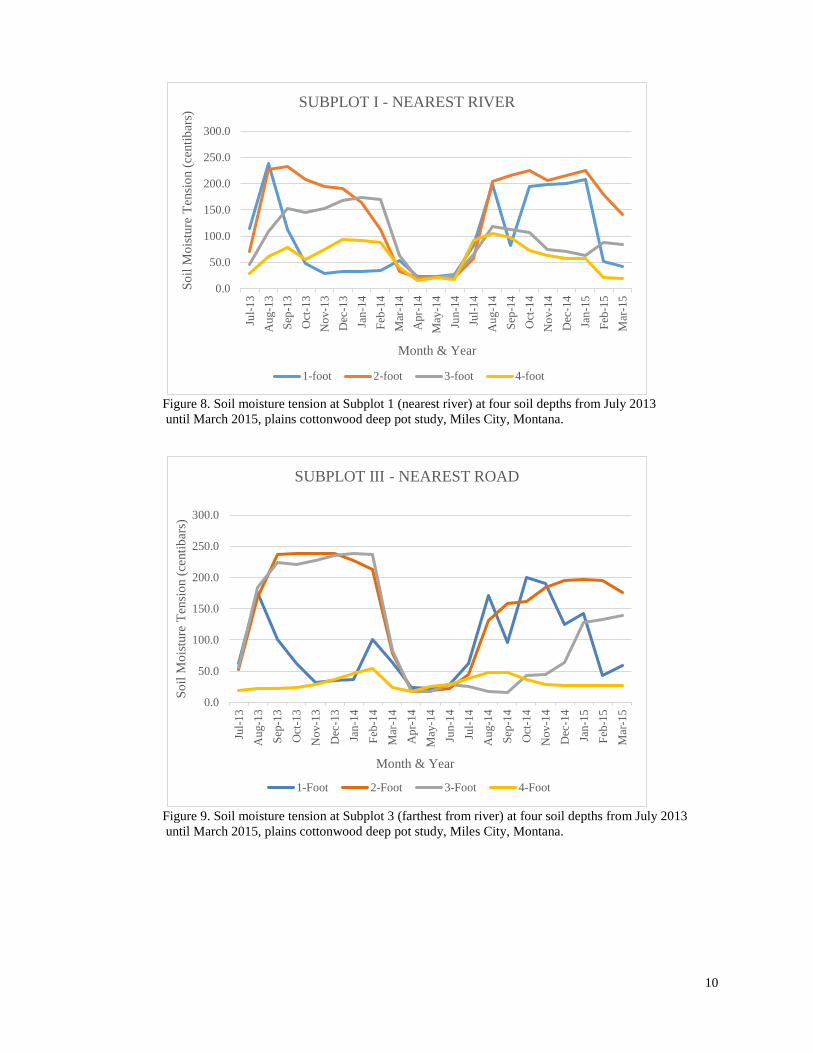
Figure 8. Soil moisture tension at Subplot 1 (nearest river) at four soil depths from July 2013 until March 2015, plains cottonwood deep pot study, Miles City, Montana.
Figure 9. Soil moisture tension at Subplot 3 (farthest from river) at four soil depths from July 2013 until March 2015, plains cottonwood deep pot study, Miles City, Montana.
0.0
50.0
100.0
150.0
200.0
250.0
300.0
Jul-1
3A
ug-1
3Se
p-13
Oct
-13
Nov
-13
Dec
-13
Jan-
14Fe
b-14
Mar
-14
Apr
-14
May
-14
Jun-
14Ju
l-14
Aug
-14
Sep-
14O
ct-1
4N
ov-1
4D
ec-1
4Ja
n-15
Feb-
15M
ar-1
5
Soil
Moi
stur
e Te
nsio
n (c
entib
ars)
Month & Year
SUBPLOT I - NEAREST RIVER
1-foot 2-foot 3-foot 4-foot
0.0
50.0
100.0
150.0
200.0
250.0
300.0
Jul-1
3A
ug-1
3Se
p-13
Oct
-13
Nov
-13
Dec
-13
Jan-
14Fe
b-14
Mar
-14
Apr
-14
May
-14
Jun-
14Ju
l-14
Aug
-14
Sep-
14O
ct-1
4N
ov-1
4D
ec-1
4Ja
n-15
Feb-
15M
ar-1
5
Soil
Moi
stur
e Te
nsio
n (c
entib
ars)
Month & Year
SUBPLOT III - NEAREST ROAD
1-Foot 2-Foot 3-Foot 4-Foot
11
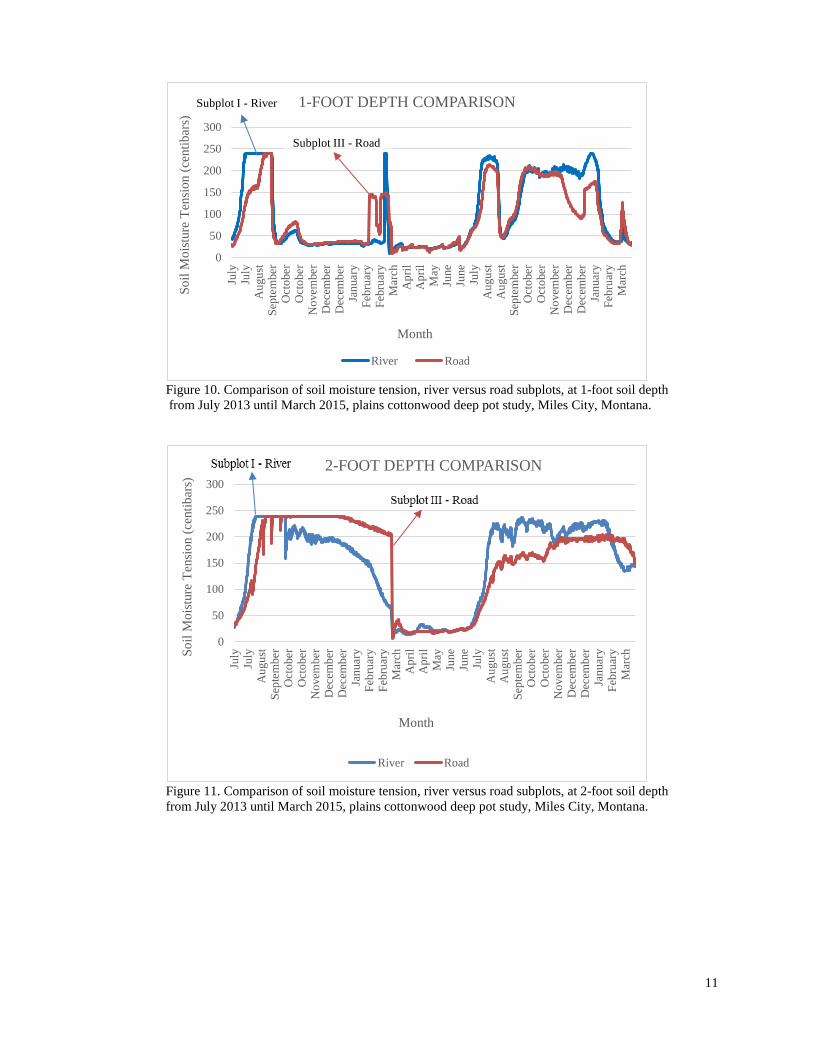
Figure 10. Comparison of soil moisture tension, river versus road subplots, at 1-foot soil depth from July 2013 until March 2015, plains cottonwood deep pot study, Miles City, Montana.
Figure 11. Comparison of soil moisture tension, river versus road subplots, at 2-foot soil depth from July 2013 until March 2015, plains cottonwood deep pot study, Miles City, Montana.
0
50
100
150
200
250
300
July
July
Aug
ust
Sept
embe
rO
ctob
erO
ctob
erN
ovem
ber
Dec
embe
rD
ecem
ber
Janu
ary
Febr
uary
Febr
uary
Mar
chA
pril
Apr
ilM
ayJu
neJu
neJu
lyA
ugus
tA
ugus
tSe
ptem
ber
Oct
ober
Oct
ober
Nov
embe
rD
ecem
ber
Dec
embe
rJa
nuar
yFe
brua
ryM
arch
Soil
Moi
stur
e Te
nsio
n (c
entib
ars)
Month
1-FOOT DEPTH COMPARISON
River Road
Subplot I - River
Subplot III - Road
0
50
100
150
200
250
300
July
July
Aug
ust
Sept
embe
rO
ctob
erO
ctob
erN
ovem
ber
Dec
embe
rD
ecem
ber
Janu
ary
Febr
uary
Febr
uary
Mar
chA
pril
Apr
ilM
ayJu
neJu
neJu
lyA
ugus
tA
ugus
tSe
ptem
ber
Oct
ober
Oct
ober
Nov
embe
rD
ecem
ber
Dec
embe
rJa
nuar
yFe
brua
ryM
archSo
il M
oist
ure
Tens
ion
(cen
tibar
s)
Month
2-FOOT DEPTH COMPARISON
River Road

12
Figure 12. Comparison of soil moisture tension, river versus road subplots, at 3-foot soil depth from July 2013 until March 2015, plains cottonwood deep pot study, Miles City, Montana.
Figure 13. Comparison of soil moisture tension, river versus road subplots, at 4-foot soil depth from July 2013 until March 2015, plains cottonwood deep pot study, Miles City, Montana.
0
50
100
150
200
250
300
July
July
Aug
ust
Sept
embe
rO
ctob
erO
ctob
erN
ovem
ber
Dec
embe
rD
ecem
ber
Janu
ary
Febr
uary
Febr
uary
Mar
chA
pril
Apr
ilM
ayJu
neJu
neJu
lyA
ugus
tA
ugus
tSe
ptem
ber
Oct
ober
Oct
ober
Nov
embe
rD
ecem
ber
Dec
embe
rJa
nuar
yFe
brua
ryM
arch
Soil
Mos
iture
Ten
sion
(cen
tibar
s)
Month
3-FOOT DEPTH COMPARISON
River Road
0
20
40
60
80
100
120
140
160
180
July
July
Aug
ust
Sept
embe
rO
ctob
erO
ctob
erN
ovem
ber
Dec
embe
rD
ecem
ber
Janu
ary
Febr
uary
Febr
uary
Mar
chA
pril
Apr
ilM
ayJu
neJu
neJu
lyA
ugus
tA
ugus
tSe
ptem
ber
Oct
ober
Oct
ober
Nov
embe
rD
ecem
ber
Dec
embe
rJa
nuar
yFe
brua
ryM
arch
Soil
Moi
stur
e Te
nsio
n (c
entib
ars)
Month
4-FOOT DEPTH COMPARISON
River Road

13
Table 4. Percent of sample points below 100 centibars, or equal to or greater than 200 centibars, plains cottonwood deep pot study, Miles City, MT.
----------From July 2013 - March 2015----------- ------------From May 1 - August 31, 2014---------- Probe Depth
-----<100 centibars----- ----->200 centibars-----
-----<100 centibars----- ----->200 centibars----- Subplot I Subplot III Subplot I Subplot III
Subplot I Subplot III Subplot I Subplot III
feet ---------------------------------------------------------------%----------------------------------------------------------------- 1 64.08 67.33 22.48 14.33
71.93 76.16 20.71 8.99
2 31.55 28.85 46.21 38.65
72.62 80.16 17.44 0 3 48.13 55.93 1.82 32.65
70.98 100 0 0
4 88.25 100 0 0
70.30 100 0 0
Precipitation over time from July 2013 through March 2015 appears in Figure 7. Soil tensiometer results appear in Figures 8 through 13 and Table 4. Soil moisture tension patterns indicate wide annual and seasonal fluctuations, differences with soil depth, and change in elevation, which in this case, included distance from the river and changes in soil composition. Results suggest even light rain events influence soil moisture tension readings at the 1-foot depth, but that light and/or infrequent showers have little apparent effect below one foot (Figures 7, 8, and 9). It appears seasonal showers from March through June reduced soil moisture tension at the 1- and 2-foot depths, whereas a rising water table and capillary fringe during this period where more likely the cause of reduced tension at the 3- and 4-foot depths, although this was not verified with water table measurements. Overall, soil tension was lower and the range less at the 3- and 4-foot depths than at the 1- and 2-foot depths. Differences in tension at the 1-foot depth between subplot I (closest to river) and subplot III (farthest from river, closest to road) were generally minimal (Figure 10). Correlation of subplot I and subplot III soil moisture tension readings at 1-foot measured R2 = 0.8898. Differences in tension at the 2-foot depth between subplot I and subplot III were somewhat less consistent than at the 1-foot depth, with generally greater soil moisture tension in subplot III from October 2013 to early March 2014, and greater tension in subplot I from August 2014 through January 2015 (Figure 11). Correlation of subplot I and subplot III soil moisture tension readings at 2-foot measured R2 = 0.81902. Differences in tension at the 3-foot depth between subplot I and subplot III were fairly similar to the 2-foot results, with an R2 = 0.8013 between subplot I and subplot III readings (Figure 12). Soil moisture tension readings in subplots I and III at four feet were significantly lower than at the other depths (Figure 13). Differences between soil moisture tension readings between subplot I and subplot III were often greater at a given period of time than at other depths (R2 = 0.6363). The average soil moisture tension and range of tension readings of subplot III at four feet was the lowest of any depth or location tested. Table 4 describes the percent of sample data, analyzed over the entire sampling interval (July 2013 through March 2015) versus the approximate 2014 growing season (May 1 through August 31, 2014) that measured under 100 centibars (considered optimum for plant growth) versus equal to or greater than 200 centibars (considered to cause plant stress) (Brady, 1984). Subplot I (closest to the river) and subplot III (farthest from the river) results at depths of 1, 2, 3, and 4 feet

14
were compared. With minor exception, the percent of data samples under 100 centibars was greater for the growing season versus entire sample interval, for each respective subplot and depth. The lowest percent of samples under 100 centibars occurred over the entire sample period in both subplots at the 2-foot depth, reflecting non-growing season soil moisture tension. As expected, the percent of data samples equal to or greater than 200 centibars was less for the growing season interval versus the entire sampling interval, for each respective subplot and depth. Subplots I and III at 2-foot depth had the greatest percent equal to or greater than 200 centibars over the entire sampling period (46.21 and 38.65%, respectively), whereas subplot I had the greatest percent at 1- and 2-foot depths (20.71 and 17.44%, respectively).
CONCLUSION Although percent seedling survival was greater with the 24- and 36-inch containers, the survival of plants in 10-inch containers (80%) was adequate for meeting plant survival requirements in Tree and Shrub Establishment (612) and Riparian Forest Buffer (390) conservation practices. The high proportion of dead seedlings in subplot III cannot be explained by measured soil attributes, and it is theorized that, since planting began in subplot I and ended in subplot III, perhaps experimental error, such as drying nursery stock, may have been involved. Inconsistent but improved height and caliper growth associated with increasing distance and elevation away from the river probably reflects the increasing percent of fine soil particles in the soil profile there, presumably resulting in increased water holding and nutrient exchange capacities, among other factors. Overall good seedling survival, growth, and vigor may reflect a complex of positive factors, including proper site preparation and maintenance, control of herbaceous plant competition, the use of weed fabric, animal exclusion, and possibly the use of a local, well-adapted seed source for nursery test stock. Soil tension results support planting of dormant nursery stock beginning in April (assuming thawed soil) when the likelihood of available soil moisture is greatest, and that deep pot plantings with roots placed four feet deep (deeper than our test plants) will have access to the most consistently plant-available soil moisture over time. Shallow planting may support early survival and growth of preatophyte species, but interruption in available soil moisture before roots access the capillary fringe may result in plant mortality if supplemental water is not applied. Other variables, such as thorough herbaceous weed control and the use of weed fabric, may offset the need for deep planting. Study results suggest that implementation of established NRCS practices and procedures for woody plant establishment such as using well-adapted seed sources, proper site preparation, proper seedling handling, weed control, and other practices may be adequate for maintaining high survival rates and desirable growth (NRCS Tree/Shrub Establishment Code 612 and NRCS Tree/Shrub Site Preparation Code 490). Site selection may be an establishment factor and may effect plant height and caliper growth in some cases. Benefits from deep pot planting are likely but cost analyses are needed to determine if the additional production and installation expenses associated with deep pots is offset by increased seedling survival, and potentially growth. Further research is suggested testing deep planting techniques on sites where control of aggressive herbaceous and woody plant competition is poor or non-existent, a scenario that is possible in many planting situations.
15
LITERATURE CITED
Brady, N.C. 1984. The Nature and Properties of Soils, Ninth Edition. MacMillan Publishing Company. New York, NY. 750 p.
Dreesen, D.R. and G.A. Fenchel. 2010. Deep-planting techniques to establish riparian vegetation in arid and semiarid regions. Native Plants Journal 11(1):15-22.
Pearce, C.M. and D.G. Smith. 2001. Plains cottonwood’s last stand: Can it survive invasion of Russian olive onto the Milk River, Montana floodplain? Environmental Management 28(5):623-637.
Lesica, P. and S. Miles. 1999. Russian olive invasion into cottonwood forests along a regulated river in north-central Montana. Canadian Journal of Botany 77:1077-1083.
Lesica, P. and S. Miles. 2001. Natural history and invasion of Russian olive along eastern Montana rivers. Western North American Naturalist 61(1):1-10.
[USDA-NRCS] USDA, Natural Resources Conservation Service, 2017. The PLANTS database. URL: https://plants.usda.gov/core/profile?symbol=PODEM. (accessed 14 December 2017). Baton Rouge (LA): National Plant Data Center.
[USDA-NRCS] USDA, Natural Resources Conservation Service, 2018. Montana Conservation Practice Standard, Tree/Shrub Establishment – Code 612. URL: https://efotg.sc.egov.usda.gov/references/public/MT/612_standard_June_2011.pdf. (accessed 18 January 2018).
[USDA-NRCS] USDA, Natural Resources Conservation Service, 2018. Montana Conservation Practice Standard, Tree/Shrub Site Preparation – Code 490. The PLANTS database. URL: https://efotg.sc.egov.usda.gov/references/public/MT/490_standard_2006.pdf. (accessed 18 January 2018).
Helping People Help the Land
USDA IS AN EQUAL OPPORTUNITY PROVIDER, EMPLOYER and LENDER