Embed Size (px)
Citation preview
Construction and Building Materials 36 (2012) 501–507
Contents lists available at SciVerse ScienceDirect
Construction and Building Materials
journal homepage: www.elsevier .com/locate /conbui ldmat
Effect of composition on characteristics of thin film transistor liquid crystal display(TFT-LCD) waste glass-metakaolin-based geopolymers
Kae-Long Lin a,⇑, Hau-Shing Shiu a, Je-Lueng Shie a, Ta-Wui Cheng b, Chao-Lung Hwang c
a Department of Environmental Engineering, National Ilan University, Ilan City 260, Taiwanb Department of Institute of Mineral Resources Engineering, National Taipei University of Technology, Taipei City 106, Taiwanc Department of Institute of Construction Engineering, National Taiwan University of Science and Technology, Taipei City 106, Taiwan
h i g h l i g h t s
" TFT-LCD waste glass comprises mainly SiO2 and Al2O3 and can be used to produce geopolymers." The effects of the solid/liquid and SiO2/Na2O ratios on the properties of metakaolin-based geopolymers." The geopolymerization products filled the pores, producing a denser structure." TFT-LCD waste glass has the potential to partially replace metakaolin as a geopolymer material.
a r t i c l e i n f o
Article history:Received 9 January 2012Received in revised form 8 May 2012Accepted 10 May 2012
Keywords:Compressive strengthGeopolymerMetakaolinThin-film transistor liquid-crystal displaywaste glass
0950-0618/$ - see front matter � 2012 Elsevier Ltd. Ahttp://dx.doi.org/10.1016/j.conbuildmat.2012.05.018
⇑ Corresponding author. Tel.: +886 3 9357400x757E-mail address: [email protected] (K.-L. Lin).
a b s t r a c t
By 2013 the demand for thin-film transistor liquid-crystal display (TFT-LCD) panels will be approxi-mately 364 million m2, or approximately 9.8 � 106 ton. According to the Waste Electrical and ElectronicEquipment directive, electrical and electronic equipment waste must be reused and recycled to reducethe amount of e-waste deposited in landfills. TFT-LCD waste glass comprises mainly SiO2 and Al2O3
and can be used to produce geopolymers. This study investigates the effects of the solid/liquid andSiO2/Na2O ratios on the properties of metakaolin-based geopolymers. Recycled TFT-LCD waste glass(0–40%) replaces metakaolin, thereby reducing the amount of metakaolin produced. This study testssamples to determine their quality, including setting time and compressive strength. These tests includemercury intrusion porosimetry, Fourier transform infrared spectroscopy, and scanning electron micros-copy. Results indicate that TFT-LCD waste glass consists of SiO2 and Al2O3. The geopolymer based on10% waste glass and 90% metakaolin had a compressive strength of 62 MPa after 60 days of curing.The geopolymerization products filled the pores, producing a denser structure. TFT-LCD waste glasshas the potential to partially replace metakaolin as a geopolymer material because of its useful mechan-ical characteristics.
� 2012 Elsevier Ltd. All rights reserved.
1. Introduction
Inorganic polymers (geopolymers) comprise SiO4 and AlO4 tet-rahedral units linked by shared oxygen atoms. Davidovits first usedthe term geopolymer in the 1970s. Geopolymers are generallysynthesized from an aluminosilicate material (e.g. metakaolin, flyash, or glass) in a highly alkaline environment. The geopolymeriza-tion reaction occurs at an atmospheric pressure at temperaturesbelow 100 �C [1]. The geopolymer structure is similar to the zeolitestructure, but without regular long-range ordering. A geopolymeris an amorphous material. It has excellent mechanical propertiesand chemical resistance and can be produced with little carbon
ll rights reserved.
9; fax: +886 3 9364277.
emission [2–4]. Therefore, geopolymers are the primary replace-ment of Ordinary Portland Cement (OPC). OPC is the most exten-sively used building material worldwide, with 1.6 billion tonproduced annually [5]. However, OPC production requires largeamounts of energy and emits much anthropogenic CO2 [6,7].Increasing awareness of current global economic and environmen-tal issues has made geopolymers the preferred building materialfor future use. Producing geopolymeric source material consumeslittle energy. Metakaolin is a common industrial mineral that canbe used to produce geopolymers. Its degradation is estimated toemit 80–90% less CO2 than OPC. Metakaolin is therefore moreenvironmentally friendly than OPC [8,9]. The formation of geopoly-meric material involves the following stages: (i) aluminosilicatesolid materials dissolve in a highly alkaline environment; (ii) olig-omers (geopolymer precursors) form—sharing the oxygen atoms in
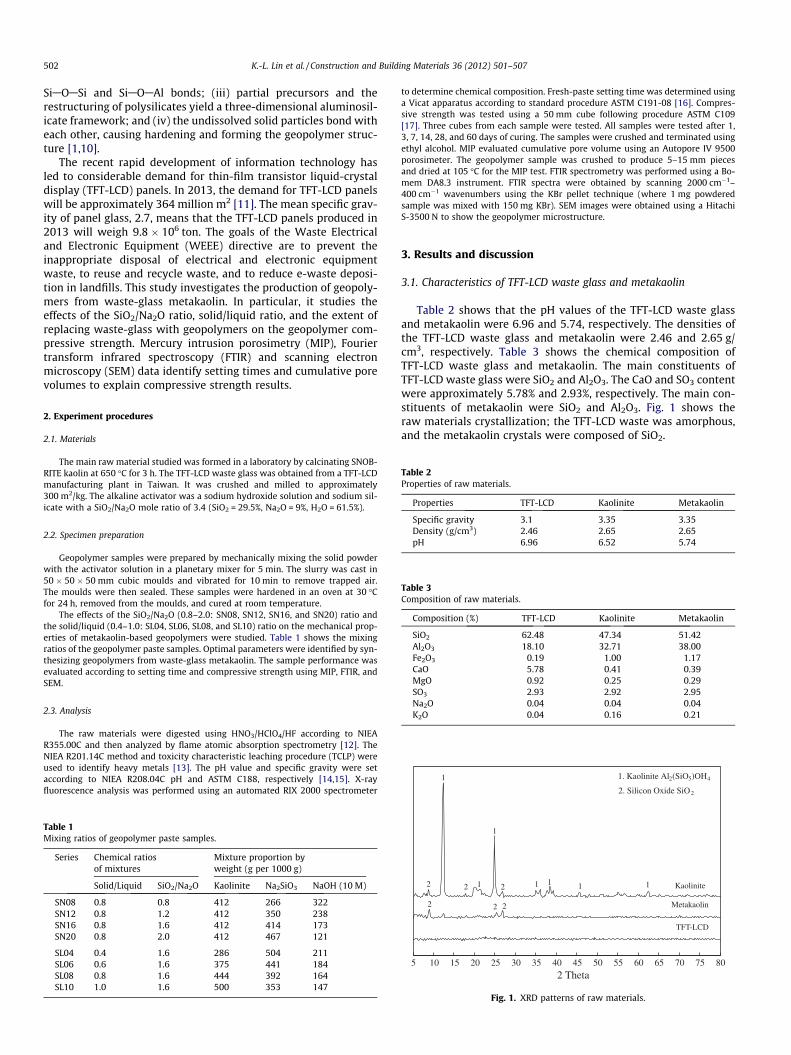
Table 2Properties of raw materials.
Properties TFT-LCD Kaolinite Metakaolin
Specific gravity 3.1 3.35 3.35Density (g/cm3) 2.46 2.65 2.65pH 6.96 6.52 5.74
Table 3Composition of raw materials.
Composition (%) TFT-LCD Kaolinite Metakaolin
SiO2 62.48 47.34 51.42Al2O3 18.10 32.71 38.00Fe2O3 0.19 1.00 1.17CaO 5.78 0.41 0.39MgO 0.92 0.25 0.29SO3 2.93 2.92 2.95Na2O 0.04 0.04 0.04K2O 0.04 0.16 0.21
1. Kaolinite Al2(SiO5)OH4
2. Silicon Oxide SiO2
1
502 K.-L. Lin et al. / Construction and Building Materials 36 (2012) 501–507
SiAOASi and SiAOAAl bonds; (iii) partial precursors and therestructuring of polysilicates yield a three-dimensional aluminosil-icate framework; and (iv) the undissolved solid particles bond witheach other, causing hardening and forming the geopolymer struc-ture [1,10].
The recent rapid development of information technology hasled to considerable demand for thin-film transistor liquid-crystaldisplay (TFT-LCD) panels. In 2013, the demand for TFT-LCD panelswill be approximately 364 million m2 [11]. The mean specific grav-ity of panel glass, 2.7, means that the TFT-LCD panels produced in2013 will weigh 9.8 � 106 ton. The goals of the Waste Electricaland Electronic Equipment (WEEE) directive are to prevent theinappropriate disposal of electrical and electronic equipmentwaste, to reuse and recycle waste, and to reduce e-waste deposi-tion in landfills. This study investigates the production of geopoly-mers from waste-glass metakaolin. In particular, it studies theeffects of the SiO2/Na2O ratio, solid/liquid ratio, and the extent ofreplacing waste-glass with geopolymers on the geopolymer com-pressive strength. Mercury intrusion porosimetry (MIP), Fouriertransform infrared spectroscopy (FTIR) and scanning electronmicroscopy (SEM) data identify setting times and cumulative porevolumes to explain compressive strength results.
2. Experiment procedures
2.1. Materials
The main raw material studied was formed in a laboratory by calcinating SNOB-RITE kaolin at 650 �C for 3 h. The TFT-LCD waste glass was obtained from a TFT-LCDmanufacturing plant in Taiwan. It was crushed and milled to approximately300 m2/kg. The alkaline activator was a sodium hydroxide solution and sodium sil-icate with a SiO2/Na2O mole ratio of 3.4 (SiO2 = 29.5%, Na2O = 9%, H2O = 61.5%).
2.2. Specimen preparation
Geopolymer samples were prepared by mechanically mixing the solid powderwith the activator solution in a planetary mixer for 5 min. The slurry was cast in50 � 50 � 50 mm cubic moulds and vibrated for 10 min to remove trapped air.The moulds were then sealed. These samples were hardened in an oven at 30 �Cfor 24 h, removed from the moulds, and cured at room temperature.
The effects of the SiO2/Na2O (0.8–2.0: SN08, SN12, SN16, and SN20) ratio andthe solid/liquid (0.4–1.0: SL04, SL06, SL08, and SL10) ratio on the mechanical prop-erties of metakaolin-based geopolymers were studied. Table 1 shows the mixingratios of the geopolymer paste samples. Optimal parameters were identified by syn-thesizing geopolymers from waste-glass metakaolin. The sample performance wasevaluated according to setting time and compressive strength using MIP, FTIR, andSEM.
2.3. Analysis
The raw materials were digested using HNO3/HClO4/HF according to NIEAR355.00C and then analyzed by flame atomic absorption spectrometry [12]. TheNIEA R201.14C method and toxicity characteristic leaching procedure (TCLP) wereused to identify heavy metals [13]. The pH value and specific gravity were setaccording to NIEA R208.04C pH and ASTM C188, respectively [14,15]. X-rayfluorescence analysis was performed using an automated RIX 2000 spectrometer
Table 1Mixing ratios of geopolymer paste samples.
Series Chemical ratiosof mixtures
Mixture proportion byweight (g per 1000 g)
Solid/Liquid SiO2/Na2O Kaolinite Na2SiO3 NaOH (10 M)
SN08 0.8 0.8 412 266 322SN12 0.8 1.2 412 350 238SN16 0.8 1.6 412 414 173SN20 0.8 2.0 412 467 121
SL04 0.4 1.6 286 504 211SL06 0.6 1.6 375 441 184SL08 0.8 1.6 444 392 164SL10 1.0 1.6 500 353 147
to determine chemical composition. Fresh-paste setting time was determined usinga Vicat apparatus according to standard procedure ASTM C191-08 [16]. Compres-sive strength was tested using a 50 mm cube following procedure ASTM C109[17]. Three cubes from each sample were tested. All samples were tested after 1,3, 7, 14, 28, and 60 days of curing. The samples were crushed and terminated usingethyl alcohol. MIP evaluated cumulative pore volume using an Autopore IV 9500porosimeter. The geopolymer sample was crushed to produce 5–15 mm piecesand dried at 105 �C for the MIP test. FTIR spectrometry was performed using a Bo-mem DA8.3 instrument. FTIR spectra were obtained by scanning 2000 cm�1–400 cm�1 wavenumbers using the KBr pellet technique (where 1 mg powderedsample was mixed with 150 mg KBr). SEM images were obtained using a HitachiS-3500 N to show the geopolymer microstructure.
3. Results and discussion
3.1. Characteristics of TFT-LCD waste glass and metakaolin
Table 2 shows that the pH values of the TFT-LCD waste glassand metakaolin were 6.96 and 5.74, respectively. The densities ofthe TFT-LCD waste glass and metakaolin were 2.46 and 2.65 g/cm3, respectively. Table 3 shows the chemical composition ofTFT-LCD waste glass and metakaolin. The main constituents ofTFT-LCD waste glass were SiO2 and Al2O3. The CaO and SO3 contentwere approximately 5.78% and 2.93%, respectively. The main con-stituents of metakaolin were SiO2 and Al2O3. Fig. 1 shows theraw materials crystallization; the TFT-LCD waste was amorphous,and the metakaolin crystals were composed of SiO2.
5 10 15 20 25 30 35 40 45 50 55 60 65 70 75 802 Theta
2
1
1 Kaolinite
Metakaolin
TFT-LCD
11
2 2 2
12 2 1
Fig. 1. XRD patterns of raw materials.
0
10
20
30
40
50
60
0 10 20 30 40 50 60 70
Com
pres
sive
Str
engt
h (M
Pa)
Curing Time (days)
SN08 SN12 SN16 SN20
Fig. 2. Compressive strength of metakaolin-based geopolymers with various SiO2/Na2O ratios.
0
10
20
30
40
50
60
70
0 10 20 30 40 50 60 70
Com
pres
sive
Str
engt
h (M
Pa)
Curing Time (days)
SL04 SL06 SL08 SL10
Fig. 3. Compressive strength of metakaolin-based geopolymers with various solid/liquid ratios.
0
10
20
30
40
50
60
0 200 400 600 800 1000 1200 1400
Dep
th o
f Pe
netr
atio
n (m
m)
Setting Time (min)
0%
10%
20%
30%
40%
Fig. 4. Setting times of waste-glass metakaolin-based geopolymers.
Table 5Setting time of waste-glass metakaolin-based geopolymers.
Sample (%) Initial setting (min) Final setting (min)
0 533 61510 666 76520 768 90030 998 109540 1158 1245
0
10
20
30
40
50
60
70
0 10 20 30 40 50 60 70
Com
pres
sive
Str
engt
h (M
Pa)
Curing Time (days)
0% 10% 20% 30% 40%
Fig. 5. Development of compressive strength of waste-glass metakaolin-basedgeopolymers.
Table 4TCLP leaching concentrations from raw materials.
TCLP (mg/L) TFT-LCD Metakaolin Kaolinite Regulatory limits
Cu 0.04 0.02 0.02 –Pb N.D. N.D. N.D. 5.0Zn 0.26 0.16 0.08 –Ni N.D. 0.01 N.D. –Cr 0.07 N.D. N.D. 5.0Cd N.D. N.D. N.D. 1.0
K.-L. Lin et al. / Construction and Building Materials 36 (2012) 501–507 503
Table 4 shows that the TFT-LCD waste glass leached Cu, Zn, andCr at concentrations of 0.02 mg/L, 0.26 mg/L, and 0.07 mg/L,respectively. Metakaolin leached Cu, Zn, and Cr at concentrationsof 0.02 mg/L, 0.16 mg/L, and 0.01 mg/L, respectively. These concen-trations all met current Taiwanese EPA regulatory thresholds.
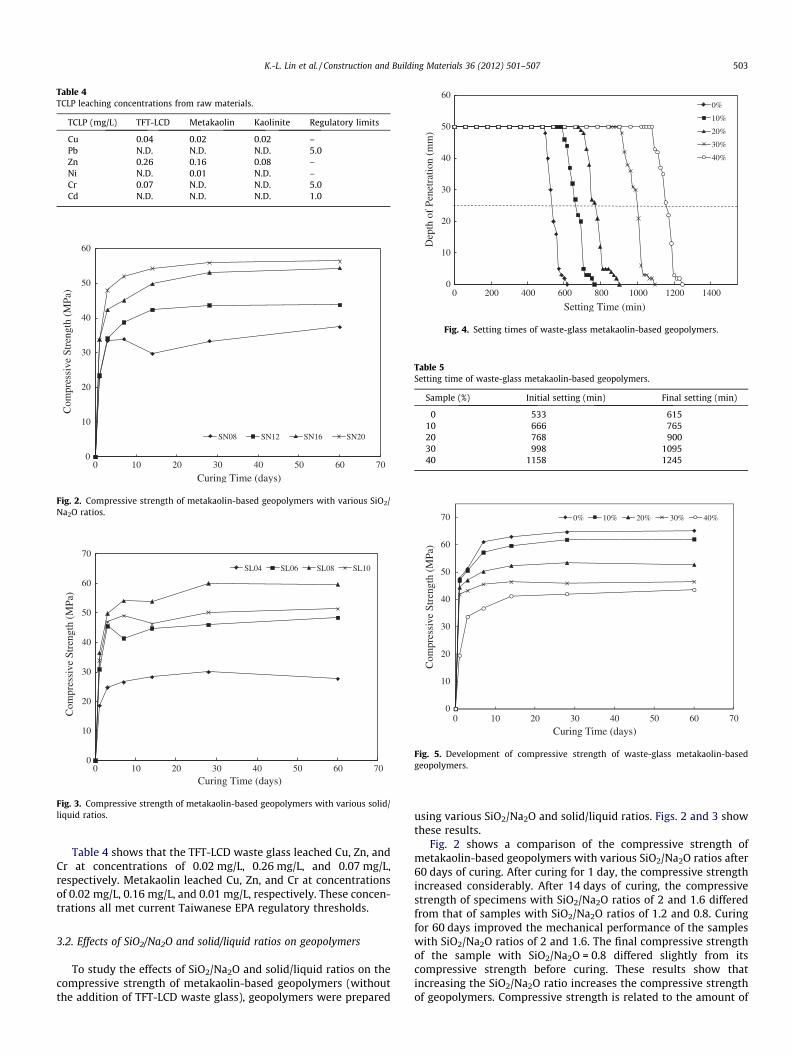
3.2. Effects of SiO2/Na2O and solid/liquid ratios on geopolymers
To study the effects of SiO2/Na2O and solid/liquid ratios on thecompressive strength of metakaolin-based geopolymers (withoutthe addition of TFT-LCD waste glass), geopolymers were prepared
using various SiO2/Na2O and solid/liquid ratios. Figs. 2 and 3 showthese results.
Fig. 2 shows a comparison of the compressive strength ofmetakaolin-based geopolymers with various SiO2/Na2O ratios after60 days of curing. After curing for 1 day, the compressive strengthincreased considerably. After 14 days of curing, the compressivestrength of specimens with SiO2/Na2O ratios of 2 and 1.6 differedfrom that of samples with SiO2/Na2O ratios of 1.2 and 0.8. Curingfor 60 days improved the mechanical performance of the sampleswith SiO2/Na2O ratios of 2 and 1.6. The final compressive strengthof the sample with SiO2/Na2O = 0.8 differed slightly from itscompressive strength before curing. These results show thatincreasing the SiO2/Na2O ratio increases the compressive strengthof geopolymers. Compressive strength is related to the amount of
0
0.1
0.2
0.3
110100100010000100000
Incr
emen
tal I
ntru
sion
(m
L/g
)
Pore Diameter (nm)
1 day
7 days
28 days
60 days
Replacement Level= 0%
0
0.1
0.2
0.3
110100100010000100000
Incr
emen
tal I
ntru
sion
(m
L/g
)
Pore Diameter (nm)
1 day
7 days
28 days
60 days
Replacement Level= 10%
0
0.1
0.2
0.3
110100100010000100000
Incr
emen
tal I
ntru
sion
(m
L/g
)
Pore Diameter (nm)
1 day
7 days
28 days
60 days
Replacement Level= 20%
0
0.1
0.2
0.3
110100100010000100000
Incr
emen
tal I
ntru
sion
(m
L/g
)
Pore Diameter (nm)
1 day
7 days
28 days
60 days
Replacement Level= 30%
0
0.1
0.2
0.3
110100100010000100000
Incr
emen
tal I
ntru
sion
(m
L/g
)
Pore Diameter (nm)
1 day
7 days
28 days
60 days
Replacement Level= 40%
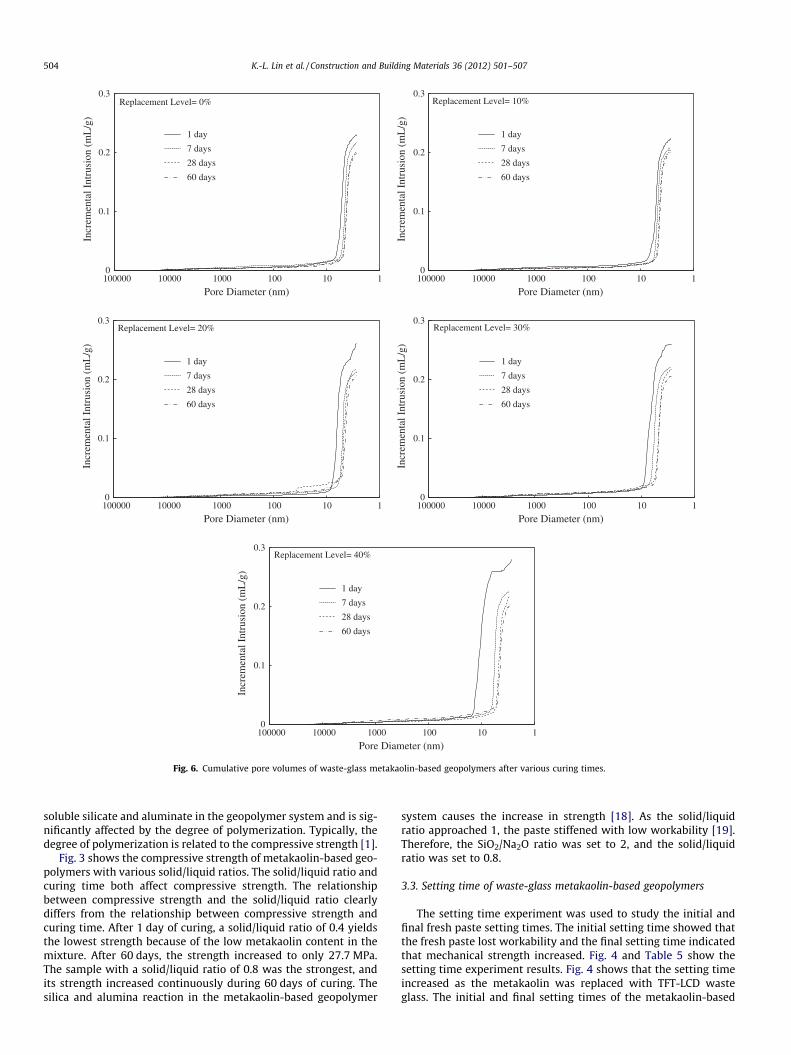
Fig. 6. Cumulative pore volumes of waste-glass metakaolin-based geopolymers after various curing times.
504 K.-L. Lin et al. / Construction and Building Materials 36 (2012) 501–507
soluble silicate and aluminate in the geopolymer system and is sig-nificantly affected by the degree of polymerization. Typically, thedegree of polymerization is related to the compressive strength [1].
Fig. 3 shows the compressive strength of metakaolin-based geo-polymers with various solid/liquid ratios. The solid/liquid ratio andcuring time both affect compressive strength. The relationshipbetween compressive strength and the solid/liquid ratio clearlydiffers from the relationship between compressive strength andcuring time. After 1 day of curing, a solid/liquid ratio of 0.4 yieldsthe lowest strength because of the low metakaolin content in themixture. After 60 days, the strength increased to only 27.7 MPa.The sample with a solid/liquid ratio of 0.8 was the strongest, andits strength increased continuously during 60 days of curing. Thesilica and alumina reaction in the metakaolin-based geopolymer
system causes the increase in strength [18]. As the solid/liquidratio approached 1, the paste stiffened with low workability [19].Therefore, the SiO2/Na2O ratio was set to 2, and the solid/liquidratio was set to 0.8.
3.3. Setting time of waste-glass metakaolin-based geopolymers
The setting time experiment was used to study the initial andfinal fresh paste setting times. The initial setting time showed thatthe fresh paste lost workability and the final setting time indicatedthat mechanical strength increased. Fig. 4 and Table 5 show thesetting time experiment results. Fig. 4 shows that the setting timeincreased as the metakaolin was replaced with TFT-LCD wasteglass. The initial and final setting times of the metakaolin-based
30080013001800
Tra
nsm
ittan
ce
Wavenumber (cm-1)
0%
40%
30%
20%
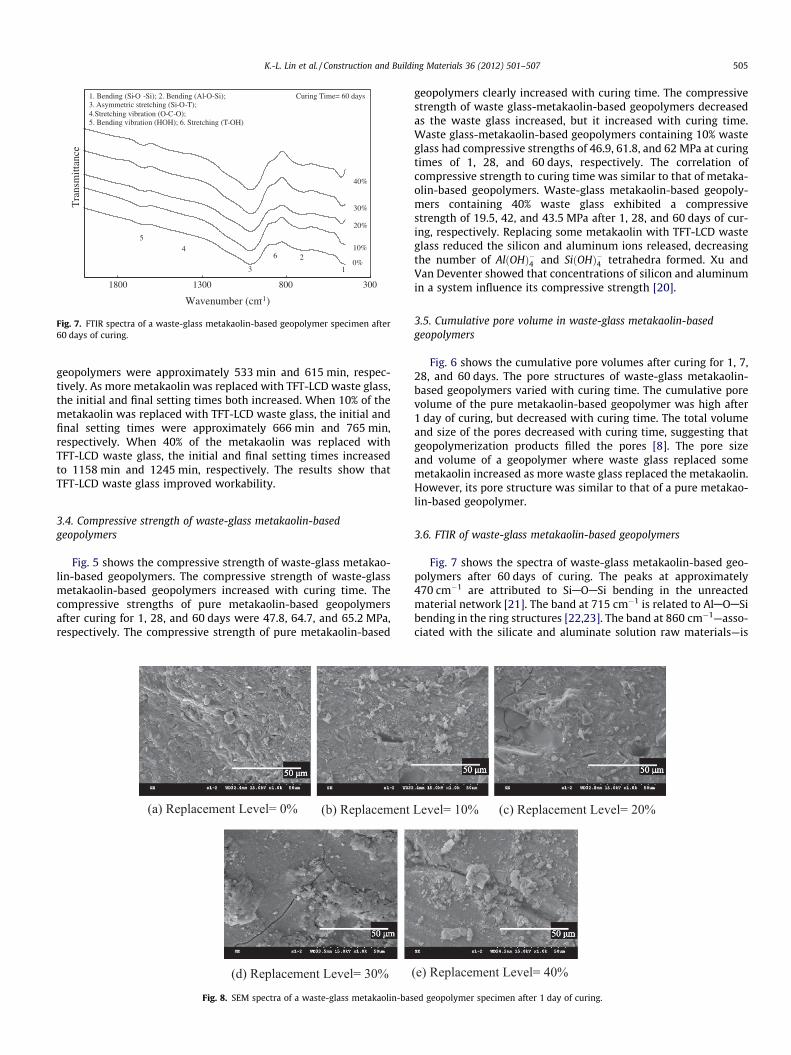
10%
1. Bending (Si-O -Si); 2. Bending (Al-O-Si);3. Asymmetric stretching (Si-O-T);4.Stretching vibration (O-C-O);5. Bending vibration (HOH); 6. Stretching (T-OH)
Curing Time= 60 days
5
4
3
6 2
1
Fig. 7. FTIR spectra of a waste-glass metakaolin-based geopolymer specimen after60 days of curing.
K.-L. Lin et al. / Construction and Building Materials 36 (2012) 501–507 505
geopolymers were approximately 533 min and 615 min, respec-tively. As more metakaolin was replaced with TFT-LCD waste glass,the initial and final setting times both increased. When 10% of themetakaolin was replaced with TFT-LCD waste glass, the initial andfinal setting times were approximately 666 min and 765 min,respectively. When 40% of the metakaolin was replaced withTFT-LCD waste glass, the initial and final setting times increasedto 1158 min and 1245 min, respectively. The results show thatTFT-LCD waste glass improved workability.
3.4. Compressive strength of waste-glass metakaolin-basedgeopolymers
Fig. 5 shows the compressive strength of waste-glass metakao-lin-based geopolymers. The compressive strength of waste-glassmetakaolin-based geopolymers increased with curing time. Thecompressive strengths of pure metakaolin-based geopolymersafter curing for 1, 28, and 60 days were 47.8, 64.7, and 65.2 MPa,respectively. The compressive strength of pure metakaolin-based
Fig. 8. SEM spectra of a waste-glass metakaolin-bas
geopolymers clearly increased with curing time. The compressivestrength of waste glass-metakaolin-based geopolymers decreasedas the waste glass increased, but it increased with curing time.Waste glass-metakaolin-based geopolymers containing 10% wasteglass had compressive strengths of 46.9, 61.8, and 62 MPa at curingtimes of 1, 28, and 60 days, respectively. The correlation ofcompressive strength to curing time was similar to that of metaka-olin-based geopolymers. Waste-glass metakaolin-based geopoly-mers containing 40% waste glass exhibited a compressivestrength of 19.5, 42, and 43.5 MPa after 1, 28, and 60 days of cur-ing, respectively. Replacing some metakaolin with TFT-LCD wasteglass reduced the silicon and aluminum ions released, decreasingthe number of AlðOHÞ�4 and SiðOHÞ�4 tetrahedra formed. Xu andVan Deventer showed that concentrations of silicon and aluminumin a system influence its compressive strength [20].
3.5. Cumulative pore volume in waste-glass metakaolin-basedgeopolymers
Fig. 6 shows the cumulative pore volumes after curing for 1, 7,28, and 60 days. The pore structures of waste-glass metakaolin-based geopolymers varied with curing time. The cumulative porevolume of the pure metakaolin-based geopolymer was high after1 day of curing, but decreased with curing time. The total volumeand size of the pores decreased with curing time, suggesting thatgeopolymerization products filled the pores [8]. The pore sizeand volume of a geopolymer where waste glass replaced somemetakaolin increased as more waste glass replaced the metakaolin.However, its pore structure was similar to that of a pure metakao-lin-based geopolymer.
3.6. FTIR of waste-glass metakaolin-based geopolymers
Fig. 7 shows the spectra of waste-glass metakaolin-based geo-polymers after 60 days of curing. The peaks at approximately470 cm�1 are attributed to SiAOASi bending in the unreactedmaterial network [21]. The band at 715 cm�1 is related to AlAOASibending in the ring structures [22,23]. The band at 860 cm�1—asso-ciated with the silicate and aluminate solution raw materials—is
ed geopolymer specimen after 1 day of curing.
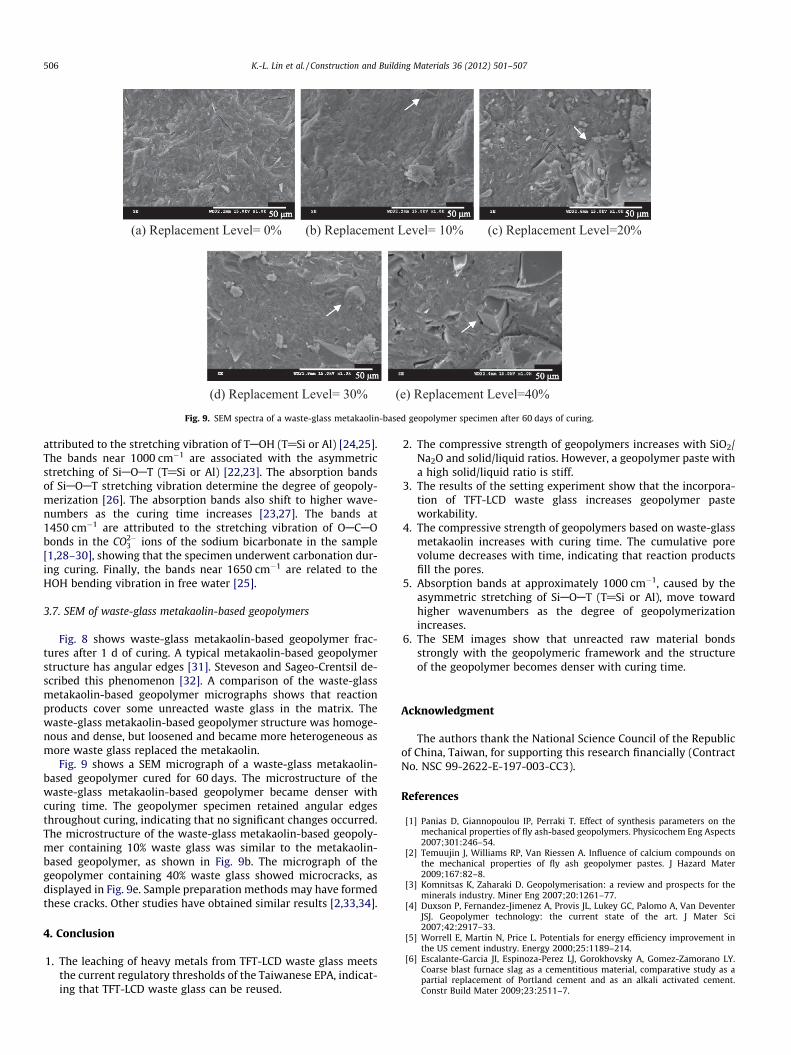
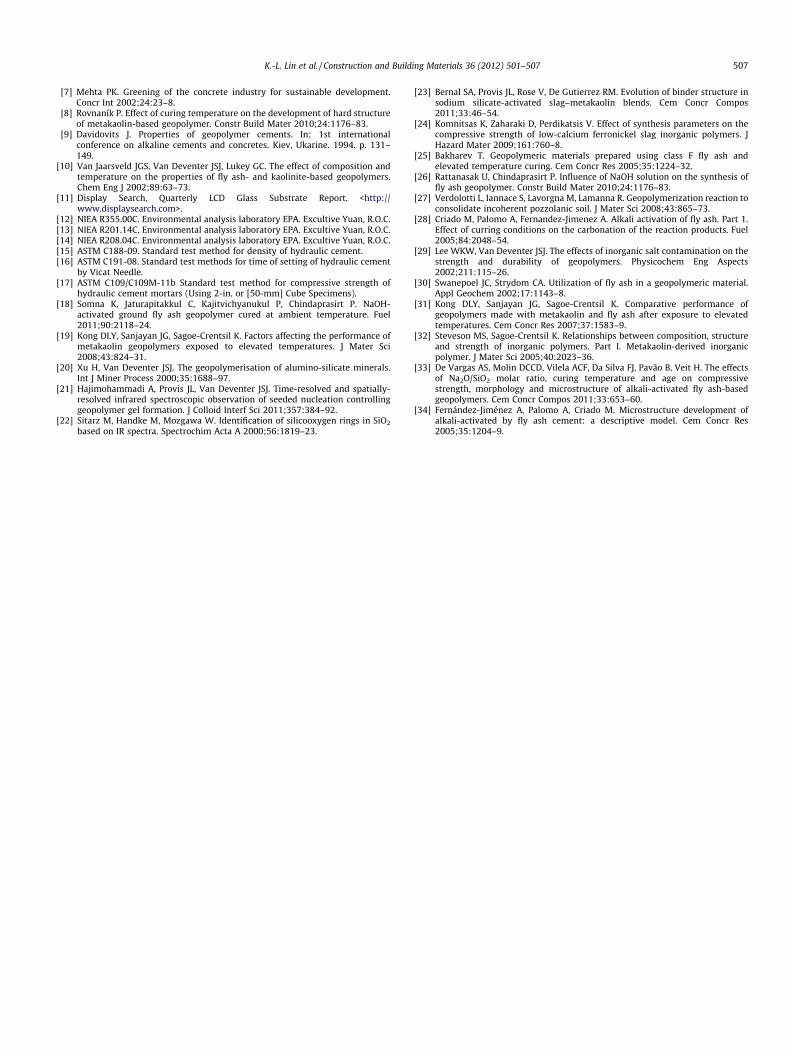
Fig. 9. SEM spectra of a waste-glass metakaolin-based geopolymer specimen after 60 days of curing.
506 K.-L. Lin et al. / Construction and Building Materials 36 (2012) 501–507
attributed to the stretching vibration of TAOH (T@Si or Al) [24,25].The bands near 1000 cm�1 are associated with the asymmetricstretching of SiAOAT (T@Si or Al) [22,23]. The absorption bandsof SiAOAT stretching vibration determine the degree of geopoly-merization [26]. The absorption bands also shift to higher wave-numbers as the curing time increases [23,27]. The bands at1450 cm�1 are attributed to the stretching vibration of OACAObonds in the CO2�
3 ions of the sodium bicarbonate in the sample[1,28–30], showing that the specimen underwent carbonation dur-ing curing. Finally, the bands near 1650 cm�1 are related to theHOH bending vibration in free water [25].
3.7. SEM of waste-glass metakaolin-based geopolymers
Fig. 8 shows waste-glass metakaolin-based geopolymer frac-tures after 1 d of curing. A typical metakaolin-based geopolymerstructure has angular edges [31]. Steveson and Sageo-Crentsil de-scribed this phenomenon [32]. A comparison of the waste-glassmetakaolin-based geopolymer micrographs shows that reactionproducts cover some unreacted waste glass in the matrix. Thewaste-glass metakaolin-based geopolymer structure was homoge-nous and dense, but loosened and became more heterogeneous asmore waste glass replaced the metakaolin.
Fig. 9 shows a SEM micrograph of a waste-glass metakaolin-based geopolymer cured for 60 days. The microstructure of thewaste-glass metakaolin-based geopolymer became denser withcuring time. The geopolymer specimen retained angular edgesthroughout curing, indicating that no significant changes occurred.The microstructure of the waste-glass metakaolin-based geopoly-mer containing 10% waste glass was similar to the metakaolin-based geopolymer, as shown in Fig. 9b. The micrograph of thegeopolymer containing 40% waste glass showed microcracks, asdisplayed in Fig. 9e. Sample preparation methods may have formedthese cracks. Other studies have obtained similar results [2,33,34].
4. Conclusion
1. The leaching of heavy metals from TFT-LCD waste glass meetsthe current regulatory thresholds of the Taiwanese EPA, indicat-ing that TFT-LCD waste glass can be reused.
2. The compressive strength of geopolymers increases with SiO2/Na2O and solid/liquid ratios. However, a geopolymer paste witha high solid/liquid ratio is stiff.
3. The results of the setting experiment show that the incorpora-tion of TFT-LCD waste glass increases geopolymer pasteworkability.
4. The compressive strength of geopolymers based on waste-glassmetakaolin increases with curing time. The cumulative porevolume decreases with time, indicating that reaction productsfill the pores.
5. Absorption bands at approximately 1000 cm�1, caused by theasymmetric stretching of SiAOAT (T@Si or Al), move towardhigher wavenumbers as the degree of geopolymerizationincreases.
6. The SEM images show that unreacted raw material bondsstrongly with the geopolymeric framework and the structureof the geopolymer becomes denser with curing time.
Acknowledgment
The authors thank the National Science Council of the Republicof China, Taiwan, for supporting this research financially (ContractNo. NSC 99-2622-E-197-003-CC3).
References
[1] Panias D, Giannopoulou IP, Perraki T. Effect of synthesis parameters on themechanical properties of fly ash-based geopolymers. Physicochem Eng Aspects2007;301:246–54.
[2] Temuujin J, Williams RP, Van Riessen A. Influence of calcium compounds onthe mechanical properties of fly ash geopolymer pastes. J Hazard Mater2009;167:82–8.
[3] Komnitsas K, Zaharaki D. Geopolymerisation: a review and prospects for theminerals industry. Miner Eng 2007;20:1261–77.
[4] Duxson P, Fernandez-Jimenez A, Provis JL, Lukey GC, Palomo A, Van DeventerJSJ. Geopolymer technology: the current state of the art. J Mater Sci2007;42:2917–33.
[5] Worrell E, Martin N, Price L. Potentials for energy efficiency improvement inthe US cement industry. Energy 2000;25:1189–214.
[6] Escalante-Garcia JI, Espinoza-Perez LJ, Gorokhovsky A, Gomez-Zamorano LY.Coarse blast furnace slag as a cementitious material, comparative study as apartial replacement of Portland cement and as an alkali activated cement.Constr Build Mater 2009;23:2511–7.
K.-L. Lin et al. / Construction and Building Materials 36 (2012) 501–507 507
[7] Mehta PK. Greening of the concrete industry for sustainable development.Concr Int 2002;24:23–8.
[8] Rovnaník P. Effect of curing temperature on the development of hard structureof metakaolin-based geopolymer. Constr Build Mater 2010;24:1176–83.
[9] Davidovits J. Properties of geopolymer cements. In: 1st internationalconference on alkaline cements and concretes. Kiev, Ukarine. 1994. p. 131–149.
[10] Van Jaarsveld JGS, Van Deventer JSJ, Lukey GC. The effect of composition andtemperature on the properties of fly ash- and kaolinite-based geopolymers.Chem Eng J 2002;89:63–73.
[11] Display Search, Quarterly LCD Glass Substrate Report. <http://www.displaysearch.com>.
[12] NIEA R355.00C. Environmental analysis laboratory EPA. Excultive Yuan, R.O.C.[13] NIEA R201.14C. Environmental analysis laboratory EPA. Excultive Yuan, R.O.C.[14] NIEA R208.04C. Environmental analysis laboratory EPA. Excultive Yuan, R.O.C.[15] ASTM C188-09. Standard test method for density of hydraulic cement.[16] ASTM C191-08. Standard test methods for time of setting of hydraulic cement
by Vicat Needle.[17] ASTM C109/C109M-11b Standard test method for compressive strength of
hydraulic cement mortars (Using 2-in. or [50-mm] Cube Specimens).[18] Somna K, Jaturapitakkul C, Kajitvichyanukul P, Chindaprasirt P. NaOH-
activated ground fly ash geopolymer cured at ambient temperature. Fuel2011;90:2118–24.
[19] Kong DLY, Sanjayan JG, Sagoe-Crentsil K. Factors affecting the performance ofmetakaolin geopolymers exposed to elevated temperatures. J Mater Sci2008;43:824–31.
[20] Xu H, Van Deventer JSJ. The geopolymerisation of alumino-silicate minerals.Int J Miner Process 2000;35:1688–97.
[21] Hajimohammadi A, Provis JL, Van Deventer JSJ. Time-resolved and spatially-resolved infrared spectroscopic observation of seeded nucleation controllinggeopolymer gel formation. J Colloid Interf Sci 2011;357:384–92.
[22] Sitarz M, Handke M, Mozgawa W. Identification of silicooxygen rings in SiO2
based on IR spectra. Spectrochim Acta A 2000;56:1819–23.
[23] Bernal SA, Provis JL, Rose V, De Gutierrez RM. Evolution of binder structure insodium silicate-activated slag–metakaolin blends. Cem Concr Compos2011;33:46–54.
[24] Komnitsas K, Zaharaki D, Perdikatsis V. Effect of synthesis parameters on thecompressive strength of low-calcium ferronickel slag inorganic polymers. JHazard Mater 2009;161:760–8.
[25] Bakharev T. Geopolymeric materials prepared using class F fly ash andelevated temperature curing. Cem Concr Res 2005;35:1224–32.
[26] Rattanasak U, Chindaprasirt P. Influence of NaOH solution on the synthesis offly ash geopolymer. Constr Build Mater 2010;24:1176–83.
[27] Verdolotti L, Iannace S, Lavorgna M, Lamanna R. Geopolymerization reaction toconsolidate incoherent pozzolanic soil. J Mater Sci 2008;43:865–73.
[28] Criado M, Palomo A, Fernandez-Jimenez A. Alkali activation of fly ash. Part 1.Effect of curring conditions on the carbonation of the reaction products. Fuel2005;84:2048–54.
[29] Lee WKW, Van Deventer JSJ. The effects of inorganic salt contamination on thestrength and durability of geopolymers. Physicochem Eng Aspects2002;211:115–26.
[30] Swanepoel JC, Strydom CA. Utilization of fly ash in a geopolymeric material.Appl Geochem 2002;17:1143–8.
[31] Kong DLY, Sanjayan JG, Sagoe-Crentsil K. Comparative performance ofgeopolymers made with metakaolin and fly ash after exposure to elevatedtemperatures. Cem Concr Res 2007;37:1583–9.
[32] Steveson MS, Sagoe-Crentsil K. Relationships between composition, structureand strength of inorganic polymers. Part I. Metakaolin-derived inorganicpolymer. J Mater Sci 2005;40:2023–36.
[33] De Vargas AS, Molin DCCD, Vilela ACF, Da Silva FJ, Pavão B, Veit H. The effectsof Na2O/SiO2 molar ratio, curing temperature and age on compressivestrength, morphology and microstructure of alkali-activated fly ash-basedgeopolymers. Cem Concr Compos 2011;33:653–60.
[34] Fernández-Jiménez A, Palomo A, Criado M. Microstructure development ofalkali-activated by fly ash cement: a descriptive model. Cem Concr Res2005;35:1204–9.