Embed Size (px)
Citation preview

EFFECT OF ASPIRIN ON OSTEOGENIC DIFFERENTIATION
AND GENE EXPRESSION PROFILES IN PERIODONTAL
LIGAMENT STEM CELLS
FAZLINY BT ABD. RAHMAN
THESIS SUBMITTED IN FULFILMENT OF THE
REQUIREMENTS FOR THE DEGREE OF DOCTOR OF
PHILOSOPHY
FACULTY OF DENTISTRY
UNIVERSITY OF MALAYA
KUALA LUMPUR
2017
UNIVERSITY OF MALAYA
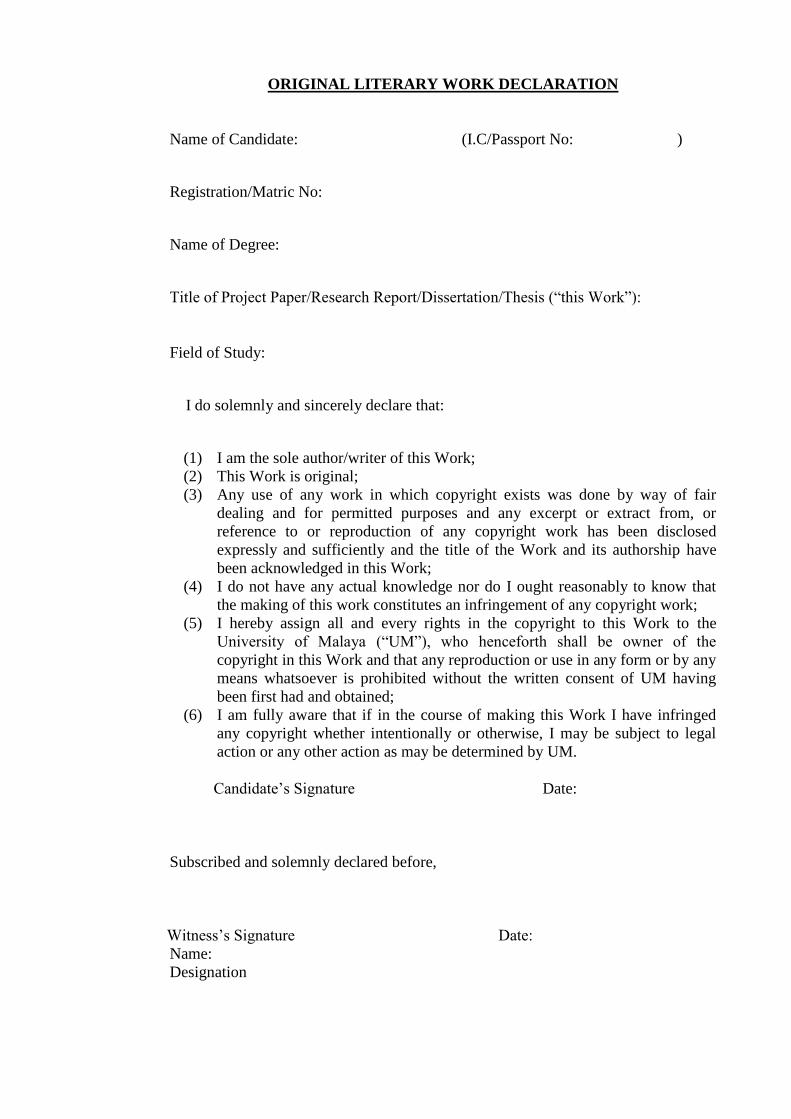
ORIGINAL LITERARY WORK DECLARATION
Name of Candidate: (I.C/Passport No: )
Registration/Matric No:
Name of Degree:
Title of Project Paper/Research Report/Dissertation/Thesis (“this Work”):
Field of Study:
I do solemnly and sincerely declare that:
(1) I am the sole author/writer of this Work;
(2) This Work is original;
(3) Any use of any work in which copyright exists was done by way of fair
dealing and for permitted purposes and any excerpt or extract from, or
reference to or reproduction of any copyright work has been disclosed
expressly and sufficiently and the title of the Work and its authorship have
been acknowledged in this Work;
(4) I do not have any actual knowledge nor do I ought reasonably to know that
the making of this work constitutes an infringement of any copyright work;
(5) I hereby assign all and every rights in the copyright to this Work to the
University of Malaya (“UM”), who henceforth shall be owner of the
copyright in this Work and that any reproduction or use in any form or by any
means whatsoever is prohibited without the written consent of UM having
been first had and obtained;
(6) I am fully aware that if in the course of making this Work I have infringed
any copyright whether intentionally or otherwise, I may be subject to legal
action or any other action as may be determined by UM.
Candidate’s Signature Date:
Subscribed and solemnly declared before,
Witness’s Signature Date:
Name:
Designation
iii
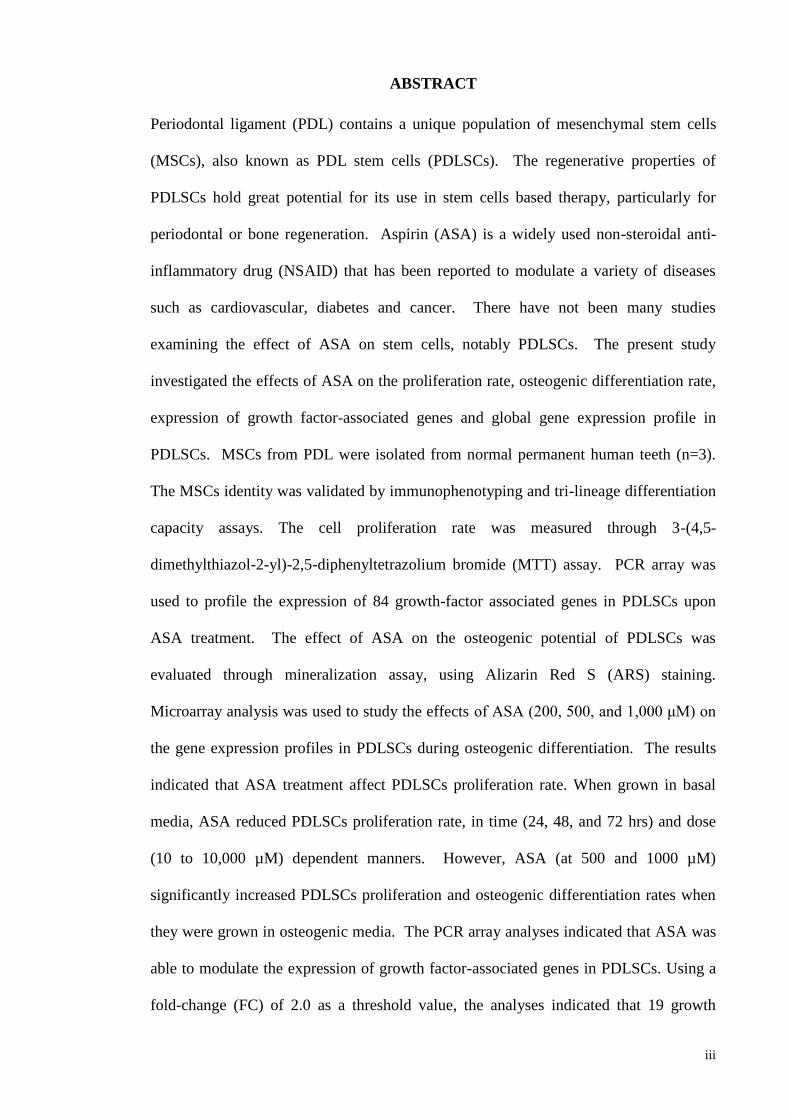
ABSTRACT
Periodontal ligament (PDL) contains a unique population of mesenchymal stem cells
(MSCs), also known as PDL stem cells (PDLSCs). The regenerative properties of
PDLSCs hold great potential for its use in stem cells based therapy, particularly for
periodontal or bone regeneration. Aspirin (ASA) is a widely used non-steroidal anti-
inflammatory drug (NSAID) that has been reported to modulate a variety of diseases
such as cardiovascular, diabetes and cancer. There have not been many studies
examining the effect of ASA on stem cells, notably PDLSCs. The present study
investigated the effects of ASA on the proliferation rate, osteogenic differentiation rate,
expression of growth factor-associated genes and global gene expression profile in
PDLSCs. MSCs from PDL were isolated from normal permanent human teeth (n=3).
The MSCs identity was validated by immunophenotyping and tri-lineage differentiation
capacity assays. The cell proliferation rate was measured through 3-(4,5-
dimethylthiazol-2-yl)-2,5-diphenyltetrazolium bromide (MTT) assay. PCR array was
used to profile the expression of 84 growth-factor associated genes in PDLSCs upon
ASA treatment. The effect of ASA on the osteogenic potential of PDLSCs was
evaluated through mineralization assay, using Alizarin Red S (ARS) staining.
Microarray analysis was used to study the effects of ASA (200, 500, and 1,000 μM) on
the gene expression profiles in PDLSCs during osteogenic differentiation. The results
indicated that ASA treatment affect PDLSCs proliferation rate. When grown in basal
media, ASA reduced PDLSCs proliferation rate, in time (24, 48, and 72 hrs) and dose
(10 to 10,000 µM) dependent manners. However, ASA (at 500 and 1000 µM)
significantly increased PDLSCs proliferation and osteogenic differentiation rates when
they were grown in osteogenic media. The PCR array analyses indicated that ASA was
able to modulate the expression of growth factor-associated genes in PDLSCs. Using a
fold-change (FC) of 2.0 as a threshold value, the analyses indicated that 19 growth
iv
factor-associated genes were differentially expressed (DE), of which 12 were
upregulated and 7 were downregulated. Microarray study revealed that ASA was able
to modulate PDLSCs gene expression profile. At 200 µM, 315 genes were DE,
involving 151 upregulated and 164 downregulated genes. At 500 µM, 794 genes were
DE, involving of 364 upregulated and 430 downregulated genes. At 1000 µM, the
number of DE genes increased to 2035, of which 735 were upregulated and 1300 were
downregulated. Bioinformatics analyses of the gene expression data revealed that the
majority of DE genes (for 500 and 1,000 µM ASA treatment) are involved in osteogenic
differentiation. The gene network analysis was carried out using Ingenuity Pathway
Analysis (IPA) software, and this revealed that the number of gene groups involved in
cell adhesion and extracellular matrix components were increased. Functional
enrichment analysis using DAVID and PANTHER revealed a similar finding as
revealed by IPA. The present study showed that ASA was able to modulate the
expression of growth-factor associated genes and enhance osteogenic potential in
PDLSCs. This study indicated that ASA could enhance PDLSCs functions and provide
evidence for the potential use of ASA with PDLSCs for regenerative dentistry
applications, particularly in the areas of periodontal health and regeneration.
v
ABSTRAK
Periodontal ligamen (PDL) mengandungi populasi sel stem mesenkima (MSC) yang
unik, juga dikenali sebagai sel stem PDL (PDLSCs). Sifat-sifat regeneratif PDLSCs
mempunyai potensi yang besar untuk digunakan dalam sel-sel stem terapi, terutamanya
bagi regenerative periodontal atau tulang. Aspirin (ASA) digunakan secara meluas
sebagai Ubat antiradang bukan steroid (NSAIDs) untuk memodulasi pelbagai penyakit
seperti jantung, diabetes dan kanser. Tidak banyak kajian yang telah dijalankan untuk
mengkaji kesan ASA terhadap sel-sel stem, terutamanya PDLSCs. Kajian ini telah
dijalankan untuk mengkaji kesan aspirin (ASA) terhadap kapasiti proliferatif ligamen
periodontal sel stem (PDLSCs), pengekspresan pertumbuhan gen faktor berkaitan di
dalam PDLSCs dan pembezaan pengekpresan profil gen terhadap kesan ASA dalam
pembezaan osteogenik daripada PDLSCs. MSCs daripada periodontal ligamen tisu
diekstrak daripada gigi kekal manusia yang normal (n=3). Identiti MSCs telah
dikenalpasti melalui kaedah immunophenotyping dan tri-lineage differentiation asai.
Sel proliferasi aktiviti dinilai melalui asai 3-(4,5-dimethylthiazol-2-yl)-2,5-
diphenyltetrazolium bromide (MTT). PCR array telah digunakan untuk menilai ekspresi
profil 84 gen pengekspresan pertumbuhan gen faktor berkaitan. Potensi osteogenik
dinilai melalui nodul mineral dengan menggunakan Alizarin Red S (ARS) pewarnaan
dan data mikroatur analisis untuk mengkaji perbezaan gene ekspresi di dalam
osteogenesis pembezaan di dalam PDLSCs. Hasil kajian menunjukkan kesan ASA
menjejaskan kadar proliferasi PDLSCs. Di dalam basal media, ASA mengurangkan
kadar proliferasi PDLSCs di setiap perbezaan masa (24, 48, dan 72 jam) dan dos (10
hingga 10, 000 μM). Walau bagaimanapun, ASA (500 dan 1000 μM) meningkat dengan
ketara dalam kadar proliferasi PDLSCs dan kadar pembezaan osteogenik di dalam
media osteogenik. PCR array analisis menunujukkan bahawa ASA berkebolehan
memodulasi pengekpresan pertumbuhan gen faktor berkaitan dalam PDLSCs. Dengan
vi
menggunakan perubahan gandaan (FC) 2 sebagai nilai ambang, pembezaan
pengekspresan gen analisis menunjukkan 19 gen adalah yang berbeza secara signifikan
(DE) di mana 12 gen beregulasi menaik dan 7 gen beregulasi menurun. Kajian
mikroatur analisis mendedahkan bahawa ASA dapat memodulasi PDLSCs profil
ekspresi gen. Pada rawatan dos 200 µM, 315 gen adalah DE dikenalpasti termasuk 151
gen beregulasi menaik dan 164 gen beregulasi menurun. Pada rawatan dos 500 µM, 794
DE dikenalpasti, termasuk 364 gen beregulasi menaik dan 430 gen beregulasi menurun.
Manakala pada rawatan dos 1,000 µM, bilangan nombor gen DE menaik kepada 2035.
Di mana 735 adalah beregulasi menaik dan 1300 adalah beregulasi menurun.
Bioinformatik analisis gen pengekpresan mendedahkan bahawa majoriti gen DE (untuk
500 dan 1,000 µM untuk rawatan ASA) terlibat dalam pembezaan osteogenik. Analisis
rangkaian gen telah dijalankan dengan menggunakan perisian Ingenuity Analisis
Pathway (IPA), dan ini menunjukkan bahawa bilangan kumpulan gen yang terlibat
dalam sel lekatan dan komponen matriks extracellular telah meningkat. Functional
enrichment analisis dengan menggunakan DAVID dan PANTHER menunjukkan
keputusan yang sama seperti yang dinyatakan oleh IPA. Kajian ini mendapati bahawa
ASA berkebolehan memodulasi pengekpresan pertumbuhan gen faktor berkaitan dan
meningkatkan potensi osteogenik dalam ungkapan pertumbuhan faktor-gen yang
dikaitkan dan meningkatkan potensi. Hasil kajian ini menunjukkan bahawa ASA
meningkatkan potensi penggunaaan PDLSCs di dalam aplikasi regeneratif pergigian,
terutamanya dalam bidang kesihatan periodontal dan pertumbuhan semula.
vii
ACKNOWLEDGEMENTS
Undertaking this PhD has been a truly life-changing experience for me and it
would not have been possible without the support and guidance that I received from
many.
First and foremost, my deepest gratitude goes to my supervisor Assoc. Prof. Dr.
Mariam Bt. Abdullah not only for her tremendous academic support but also for the
many wonderful opportunities she provided to me. Special thanks are also due to my co-
supervisor, Dr. Johari Md. Ali who acted as my mentor in this PhD journey. I learned
much from him and without his constant assistance and guidance completing my PhD
would have been an even more formidable endeavour. I am also very grateful to my
other co-supervisor, Prof. Dr. Tariqur Rahman for his scientific advice and valuable
inputs.
My thanks also for the support I received from the Regenerative dentistry group
members (RedReg) especially Assoc. Prof. Dr. Norhayaty Abu Kasim and Assoc. Prof.
Dr. Sabri Musa. Not to forget, my colleagues from the RedReg group including Ashley,
Pukana, Punitha, Lou, Naresh, and Wijen who were always so helpful and encouraging.
I gratefully acknowledge the financial support received from University Malaya
Fellowship Scheme (SBUM), IPPP and HIR Canseleri grant (University Malaya).
I would like to thank my parents, brothers, and sister in-law for the continuous
support and sacrifices that they made on my behalf and all my friends who supported
me in so many ways during the completion of the thesis. Finally, I would like express
my appreciation to my stranger friend, Asyraf, whom I could always turn to when there
was no one else to help answer my queries.
viii
TABLE OF CONTENTS
Abstract iii
Abstrak v
Acknowledgement vii
Table of Contents viii
List of Figures xiv
List of Tables xviii
List of Symbols and Abbreviations xx
List of Appendices xxix
CHAPTER 1: INTRODUCTION 1
1.1 Objectives 3
CHAPTER 2: LITERATURE REVIEW 4
2.1 Definition and types of stem cells 4
2.2 Mesenchymal stem cells (MCSs) and their characteristics 5
2.3 Tissue sources of MSCs 6
2.3.1 Dental Pulp Stem Cells (DPSCs) 7
2.3.2 Human Exfoliated Deciduous Teeth (SHED) 7
2.3.3 Dental Follicle Stem Cell (DFPC) 8
2.3.4 Stem Cell from the Apical Papilla (SCAP) 8
2.3.5 Gingiva-derived MSCs (GMSCs) 9
2.4 Identification and characterization of periodontal ligament stem
cells (PDLSCs)
10
2.4.1 Growth Potential of PDLSCS 12
2.4.2 Periodontal Regeneration using PDLSCs 12
2.5 Bone 15
ix
2.5.1 Osteoblast 15
2.5.2 Bone Lining Cells 16
2.5.3 Osteocytes 16
2.5.4 Osteoclasts 17
2.5.5 Bone Extracellular Matrix 17
2.6 Osteoblastogenesis 18
2.7 Growth Factors (GFs): regulation of proliferation and
differentiation of MSCs
21
2.7.1 Molecular characteristics of bone morphogenic protein
(BMPs) family member and their roles in osteogenic
differentiation
21
2.7.2 Vascular endothelial growth factors (VEGFs) 24
2.7.3 Platelet derived Growth Factor (PDGF-FF) 24
2.7.4 Fibroblast growth factors (FGFs) 25
2.8 Mechanism of MSCs osteogenic differentiation 26
2.8.1 FGF signaling controls osteoblast gene expression 26
2.8.2
Signal transduction pathways for BMP-induced
osteoinductive differentiation
30
2.9 Integrin–Extracellular Matrix (ECM) interactions to direct MSCs
differentiation via cell adhesion/transduction
32
2.10 Prostaglandin (PG), Cyclooxygenase and their roles in bone
metabolism
33
2.11 Aspirin (ASA) and its mechanism 34
2.12 Effect of NSAIDs on osteoblast cell culture and osteoblast
precursor cells or MSCs
35
2.13 Beneficial impact of ASA on stem cell and the potential application 38
x
CHAPTER 3: METHODOLOGY 40
3.1 Isolation and culturing of human PDLSCs from periodontal
ligament tissue
40
3.1.1 Growth kinetics of PDLSCs 41
3.1.2 Trilineage differentiation capacity 41
3.1.3 Flow cytometry 42
3.2 MTT cell proliferation assay 43
3.3 Growth factors gene expression profiling utilizing RT2 PCR array 43
3.4 Array Validation 45
3.5 ASA treatment and evaluation of PDLSCs proliferation rate during
osteogenic differentiation
47
3.6 Effect of ASA on PDLSCs osteogenic potential 48
3.7 Microarray based gene expression profiling: effect of ASA on
PDLSCs during osteogenic differentiation
48
3.7.1 Functional enrichment analyses 50
3.7.2 Functional Annotation and Pathway Analysis 51
3.8 Validation microarray 52
3.8.1 Real-time PCR (qPCR) 52
3.8.2 Double immunofluorescene 52
3.8.3 Western blotting 54
3.9 Statistical Analysis 55
CHAPTER 4: RESULTS 56
4.1 Characterization of the stem cells derived from periodontal
ligament (PDL)
56
4.2 Growth Curve of PDLSCs 57
4.3 Effects of ASA on PDLSCs morphology and proliferation rate 58
xi
4.4 The effect of ASA on the expression of growth factors-associated
genes in PDLSCs
60
4.5 Validation of RT2 PCR array result by qRT-PCR 62
4.6 Ingenuity Pathway Analyses (IPA) 63
4.7 Effect of ASA on cell proliferation rate during osteogenic
differentiation of PDLSCs
65
4.8 ASA treatment and evaluation of osteogenic potential of PDLSCs 66
4.9 Microarray based gene expression study: effect of ASA during
osteogenic differentiation of PDLSCs
68
4.9.1 Quality and Quantity of RNA for samples 68
4.9.2 Analysis of microarray gene expressions 69
4.9.3 Principle Component Analysis (PCA) 72
4.9.4 ASA modulation of gene expression profile during
PDLSCs osteogenic differentiation
73
4.9.5 Gene expression profilling in PDLSCs for ASA treatment
at 200 μM: upregulated genes (FC>1.5)
77
4.9.6 Gene expression profilling in PDLSCs for ASA treatment
at 500 μM: upregulated genes (FC>1.5)
78
4.9.7 Gene expression profilling in PDLSCs for ASA treatment
at 1000 μM: upregulated genes (FC>1.5)
79
4.9.8 Gene expression profilling in PDLSCs for ASA treatment
at 200 μM: downregulated genes (FC<-1.5)
81
4.9.9 Gene expression profilling in PDLSCs for ASA treatment
at 500 μM: downregulated genes (FC<-1.5)
82
4.9.10 Gene expression profilling in PDLSCs for ASA treatment
at 1000 μM: downregulated genes (FC<-1.5)
83
xii
4.10 Comparison differentially expressed genes in PDLSCs: effect
of growth media and ASA concentrations
85
4.11 Gene ontology (GO) analyses : PANTHER 87
4.11.1 Gene ontology for Biological Processes (BP) 87
4.11.2 Gene ontology for Molecular Functions (MFs) 90
4.11.3 Gene ontology for cellular componenents (CC) 92
4.12 Functional enrichment analysis using DAVID 94
4.12.1 DAVID functional enrichment analysis : Gene expression
profile for 200 µM ASA treatment
94
4.12.2 DAVID functional enrichment analysis : Gene expression
profile for 500 µM ASA treatment
96
4.12.3 DAVID functional enrichment analysis : Gene expression
profile for 1,000 µM ASA treatment
99
4.13 IPA analyses : molecular and cellular functions (MCFs) at 200, 500
and 1,000 μM of ASA treatments
103
4.13.1 IPA analyses: significantly regulated MCFs at 200 μM
ASA treatment
103
4.13.2 IPA analyses: significantly regulated MCFs at 500 μM of
ASA treatment
106
4.13.3 IPA analyses: significantly regulated MCFs at 1,000 μM
of ASA treatment
108
4.14 IPA prediction on the effect of ASA treatment on physiological
system and development functions (PSDF) in PDLSCs
110
4.14.1 IPA analyses: PSD for 200 μM ASA treatment 110
4.14.2 IPA analyses: PSDFs for 500 μM ASA treatment 111
xiii
4.14.3 IPA analyses: PSDFs at 1,000 μM ASA treatment 113
4.15 Upstream regulators analysis (URA) 115
4.15.1 Heat map of up-stream regulators – combined picture 118
4.16 Canonical pathways 121
4.16.1 The Canonical Pathway enrichment of ASA treatments
based on z-score
123
4.16.2 The canonical pathway enrichment of ASA treatments 128
4.17 Disease and function network by IPA 131
4.18 Validation of microarray data by qRT-PCR, immunofluorescence
and western blotting analyses
141
4.18.1 qPCR analysis 141
4.18.2 Western blotting analyses 143
4.18.3 Double immunofluorescene 144
CHAPTER 5: DISCUSSION 146
CHAPTER 6: CONCLUSIONS 176
REFERENCES 177
LIST OF PUBLICATIONS AND PAPER PRESENTED 200
APPENDICES 203
xiv
LIST OF FIGURES
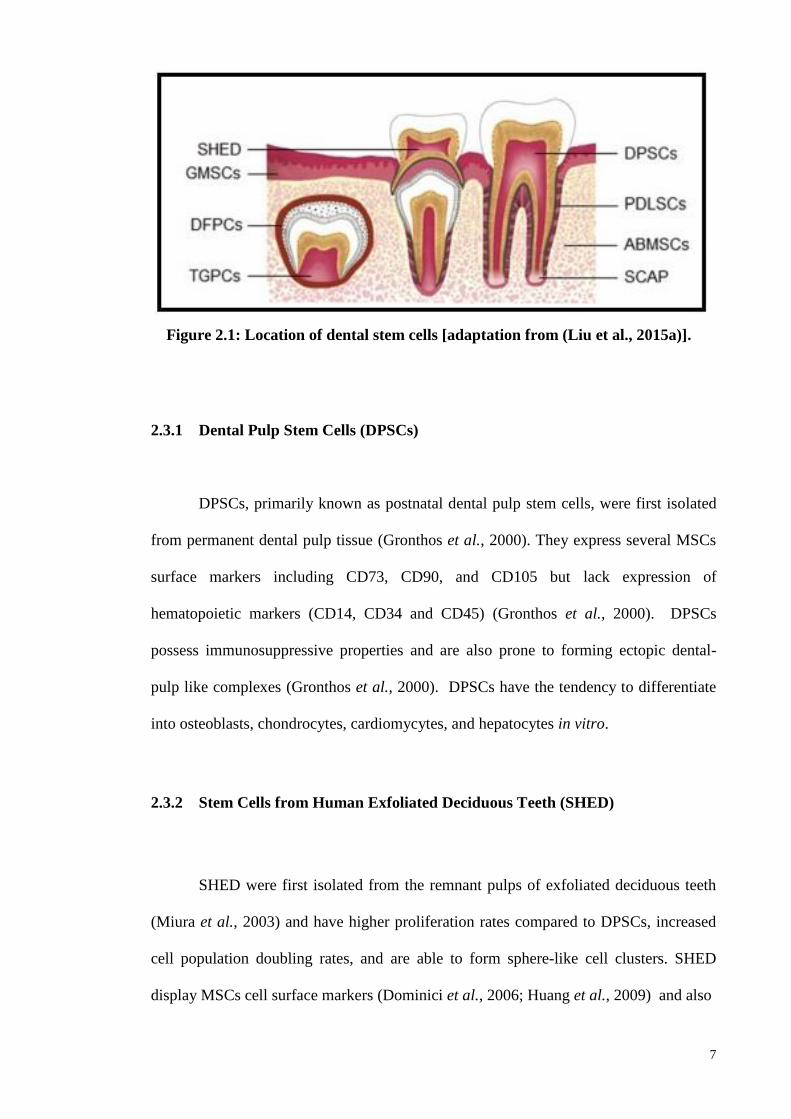
Figure 2.1 Location of dental stem cells. 7
Figure 2.2 Location of periodontal ligament tissue. 10
Figure 2.3 Types of bone cells. 16
Figure 2.4 The bone formation process. 19
Figure 2.5 BMPs play a role in osteoblast formation. 24
Figure 2.6 Roles of FGF and FGR molecules in osteoblast
differentiation and fate.
28
Figure 2.7 Classical BMPs signal transduction pathway 32
Figure 4.1 Basic characterization of periodontal ligament stem cells
(PDLSCs).
57
Figure 4.2 Growth kinetics of PDLSCs (n=3) at passage 3. 58
Figure 4.3 MTT cell viability assay. 59
Figure 4.4 Ingenuity Pathway Analyses: the impact of 1,000 μM ASA
treatment on biological functions and canonical pathways
in PDLCS.
64
Figure 4.5 The proliferation rate of PDLSCs (n=3) during osteogenic
differentiation assay was assessed through MTT assay.
65
Figure 4.6 PDLSCs osteogenic potential assay. 67
Figure 4.7 Total area stained by Alizarin Red S (ARS) staining was
used to assess the PDLSCs osteogenic potential at the
designated days.
68
Figure 4.8 Box-and-Whisker plots (BWP). 71
Figure 4.9 Principle Component Analysis (PCA) plots. 73
Figure 4.10 Venn diagram representing the number of DEGs that are
shared among the 200, 500 and 1,000 μM ASA treated
76
xv
samples.
Figure 4.11 Functional analyses of differentially expressed genes by
PANTHER. Representative GO terms of Biological
Processes (BP) at A) 200 μM, B) 500 μM and C) 1,000
μM of ASA treatments.
89
Figure 4.12 Functional analyses of differentially expressed genes by
PANTHER. Representative GO terms of Molecular
Functions (MFs) at A) 200 μM, B) 500 μM and C) 1,000
μM of ASA treatments.
91
Figure 4.13: Functional analyses of differentially expressed genes by
PANTHER. Representative GO terms of Cellular
Components (CCs) at A) 200 μM, B) 500 μM and C)
1,000 μM of ASA treatments.
93
Figure 4.14 MCSFs, z-score for (A) Cellular movement and (B)
Cellular growth and proliferation for 200 μM of ASA
treatment.
105
Figure 4.15 MCSFs, z-score for (A) Cellular growth and proliferation;
(B) Cellular movement and (C) Cell death and survival for
500 μM of ASA treatments
107
Figure 4.16 MCSFs: z-scores for (A) Gene Expression; (B) Cell death
and survival; (C) Cellular Growth and proliferation and
(D) Post-translational modification for 1,000 μM of ASA
treatments
109
Figure 4.17 PSDFs: z-scores for tissue development functions for 200
μM ASA treatment.
111
Figure 4.18 PSDFs: z-scores for (A) tissue development functions; (B) 112
xvi
cardiovascular system and tissue development functions
and (C) organismal development functions for 500 μM
ASA treatment.
Figure 4.19 PSDFs: z-scores for; (A) Hematological system
development and function; (B) Cardiovascular system
development and function for 1000 μM of ASA treatment.
114
Figure 4.20 z-scores for Up stream regulators (URA): A) 200 μM; B)
500 μM and C) 1,000 μM ASA treatments.
117
Figure 4.21 Relevant up-stream transcription regulators at 200, 500 and
1,000 μM of ASA treatments.
119
Figure 4.22 Top 20 of canonical pathways significantly regulated by A)
200 μM of ASA treatment; B) 500 μM of ASA treatment
and C) 1, 000 μM of ASA treatment.
122
Figure 4.23 Heat map representing the relevant canonical pathways of
ASA treatments at 200, 500 and 1,000 μM.
129
Figure 4.24 Network of formation of adhesion of extracellular matrix
and connective tissue cells for A) 500 μM and B) 1,000 μM
of ASA treatments.
132
Figure 4.25 Network analysis of gene expression changes at 1,000 μM
of ASA treatment.
136
Figure 4.26 Network analysis of cell and death and survival at 500 μM
of ASA treatment.
139
Figure 4.27 Network analysis of cell and death and survival at 200 μM
of ASA treatment.
140
Figure 4.28 Real Time RT-PCR analyses of FN1, Igα5, FGF1, FGF5,
FGFRL1, BMP4 and BMPER on effect of ASA at 1,000
142
xvii
μM in osteogenic differentiation of PDLSCs (n=3).
Figure 4.29 Western blot analyses. FN1, FGF-1, FGFRL-1 and Itgα5
proteins for control (non-treated) and 1,000 μM of ASA
treatments in osteogenic differentiation of PDLSCs (n=3).
143
Figure 4.30 Double immunofluorescene analyses for Fibronectin and
Itgα5: effect of ASA on PDLSCs at the following
concentrations in osteogenic differentiation: (A) Control
(Untreated); (B) 200 μM (C) 500 μM and (D) 1,000 μM.
144
Figure 4.31 Double immunofluorescene analyses for FGF1 and
FGFRL1: effect of ASA on PDLSCs at the following
concentrations in osteogenic differentiation: (A) Control
(Untreated); (B) 200 μM (C) 500 μM and (D) 1,000 μM.
145
xviii
LIST OF TABLES
Table 2.1 Gene regulation by FGF/ FGF signaling in bone 30
Table 3.1 Reaction mix of PCR array 44
Table 3.2 Reaction mixture of an optical plate 44
Table 3.3 Thermal cycling parameters 45
Table 3.4 PCR reaction mix 45
Table 3.5 Thermal cycling conditions 46
Table 3.6 List of the Taqman primers used for validation of RT2 PCR
array
47
Table 3.7 List of TaqMan primers for microarray validation 52
Table 3.8 List of the antibodies for immunofluorescence study 53
Table 3.9 List of antibodies for Western blot 54
Table 4.1 List of genes that were significantly up (+) or downregulated (-)
in PDLSCs upon ASA treatment
61
Table 4.2 Validation of PCR array data by qRT-PCR 62
Table 4.3 Quality and quantity of RNA samples in the study 69
Table 4.4 List of donors 70
Table 4.5 ASA and DE genes during osteogenic differentiation of
PDLSCs (p<0.05)
75
Table 4.6 Up-regulated genes in PDLSCs for 200 μM ASA treatment 77
Table 4.7 Up-regulated genes in PDLSCs for 500 μM ASA treatment 78
Table 4.8 Up-regulated genes in PDLSCs for 1,000 μM ASA treatment 80
Table 4.9 Downregulated genes in PDLSCs for 200 μM ASA treatment 81
Table 4.10 Downregulated genes in PDLSCs for 500 μM ASA treatment 82
Table 4.11 Downregulated genes in PDLSCs for 1,000 μM ASA treatment 84
Table 4.12 The list of comparison genes significant at PCR array vs 86
xix
microarray
Table 4.13 DAVID functional enrichment scores for 200 μM ASA
treatment
95
Table 4.14 DAVID functional enrichment scores for 500 μM ASA
treatment
96
Table 4.15 DAVID functional enrichment scores for 1,000 μM ASA
treatment
100
Table 4.16 Top five MCFs predicted by IPA for 200 μM of ASA treatment
(p<0.05)
103
Table 4.17 Top five MCFs as predicted by IPA for 500 μM ASA treatment 106
Table 4.18 Top five MCFs predicted by IPA for 1,000 μM ASA treatment 108
Table 4.19 Top five PSDFs predicted by IPA for 200 μM of ASA treatment 110
Table 4.20 Top five PSDFs predicted by IPA for 500 μM ASA treatment 112
Table 4.21 Top five PSDFs predicted by IPA for 1,000 μM ASA treatment 113
Table 4.22 Relevant up-stream transcription regulators at 200, 500 and
1,000 μM of ASA treatments
120
Table 4.23 The most significant canonical pathway for 500 μM of ASA
treatment
124
Table 4.24 The most significant canonical pathway for 1,000 μM of ASA
treatment
126
Table 4.25 Summary of the heatmap relevant canonical pathways of ASA
treatments at 200, 500 and 1,000 μM of ASA treatment
130
Table 4.26 Top network signaling enriched at 1,000 μM ASA treatment 133
Table 4.27 Top network signaling at 500 μM of ASA treatment 137
Table 4.28 Top network signaling at 200 μM of ASA treatment 137
xx
LIST OF SYMBOLS AND ABBREVIATIONS
ABMSCs : Alveolar bone-derived MSCs
ACAN : Aggrecan
ADH1A : Alcohol dehydrogenase 1A (class I), alpha polypeptide
ADRA2C : Adrenoceptor alpha 2C
a-FGF : Acidic-FGF
ALP : Alkaline phosphatase
AMH : Anti-Mullerian hormone
ANGPTL1 : Angiopoietin-like 1
ARS : Alizarin Red S
ARSA : Alizarin Red S positive area
ASA : Aspirin
BCL2L11 : BCL2-like 11 (apoptosis facilitator)
BDNF : Brain-derived neurotrotrophic factor
b-FGF : Basic-FGF
BM : Bone marrow
BMMSCs : Bone marrow mesenchymal stem cells
BMP10 : Bone morphogenetic protein 10
BMP2 : Bone morphogenetic protein 2
BMPER : BMP binding endothelial regulator
BMPR-I : BMP-type I
BMPs : Bone morphogenic proteins
BMRPR-II : BMP-type II receptor
BMS1P5 : BMS1 pseudogene 5

xxi
BP : Biological processes
BSA : Bovine serum albumin
C3 : Complement component 3
cbfa1 : Core binding factor alpha 1 and
CC : Cellular components
CD : Cluster of differentiation
CDH2 : Cadherin 2, type 1, N-cadherin (neuronal)
CDKN1C : Cyclin-dependent kinase inhibitor 1C (p57, Kip2)
cDNA : Complementary deoxyribonucleic acid
CFU : Colony forming unit
CHRDL1 : Chordin-like 1
CLC : Chloride ion channel
CLIC6 : Chloride intracellular channel 6
CLSTN3 : Calsyntenin 3
COX-1 : Cyclooxygenase-1
COX-2 : Cyclooxygenase-2
CSF2 : Colony stimulating factor (CSF2)
CSF3 : Colony stimulating factor (CSF3)
CXCL12 : Chemokine (C-X-C motif) ligand 12
DAPI : 4',6-Diamidino-2-Phenylindole, Dihydrochloride
DBSCs : Dental bud stem cells
DEG : Differentially expressed genes
DFPCs : Dental follicles progenitor cells
DIO2 : Deiodinase, iodothyronine, type II
DKK1 : Dickkopf-related protein 1
xxii
DLK2 : Delta-like 2 homolog (Drosophila)
DLX5 : Distal–less homebox
DMSO : Dimethyl sulfoxide
DOK3 : Docking protein 3
DPP9-AS1 : DPP9 antisense RNA 1
DPRXP4 : Divergent-paired related homeobox pseudogene 4
DPSCs : Dental pulp stem cells
E2F7 : E2F transcription factor 7
ECM : Extracellular matrix
EFTUD1 : Elongation factor Tu GTP binding domain containing 1
ELOVL3 : ELOVL fatty acid elongase 3
ENDOV : Endonuclease V
EPGN : Epithelial mitogen
EREG : Epiregulin
ESCs : Embryonic stem cells
FABP5 : Fatty acid binding protein 5 (psoriasis-associated)
FAM107A : Family with sequence similarity 107, member A
FAM169A : Family with sequence similarity 169, member A
FBS : Fetal bovine serum
FC : Fold change
FGF5 : Fibroblast growth factor 5
FGF9 : Fibroblast growth factor 9
FGFs : Fibroblast growth factor
FITC : Fluorescein Isothiocyanate
FMO1 : Flavin containing monooxygenase 1
xxiii
FMO3 : Flavin containing monooxygenase 3
FN1 : Fibronectin 1
GAPDH : Glyceraldehyde-3-Phosphate
GCHFR : GTP cyclohydrolase I feedback regulator
GDF10 : Growth Differentiation Factor 10
GDF11 : Growth Differentiation Factor 11
GF : Growth Factor
GGT5 : Gamma-glutamyltransferase 5 (GGT5)
GMSCs : Gingiva-derived MSCs
GO : Gene ontology
GOLGA8O : Golgin A8 family, member O
GPRC5B : G protein-coupled receptor, class C, group 5, member B
GRB14 : Growth factor receptor-bound protein 14
GTPBP6 : GTP binding protein 6
HA/TCP : Hydroxyapatite/tricalcium phosphate
HDGF : Hepatoma-derived growth factor
HLA-DR : Human Leukocyte Antigen - antigen D Related
HLH : Helix-loop-helix factors
HR : Hair growth associated
hUCMs : Human umbilical cord matrix-derived mesenchymal stem cells
IBMX : 3-isobutyl-1-methyxanthine
IBSP : Bone sialoprotein
ICAM1 : Intercellular adhesion molecule 1
IFIH1 : Interferon induced with helicase C domain 1
xxiv
IFIT1 : Interferon-induced protein with tetratricopeptide repeats1
IFN- γ : Interferon gamma
IGF2 : Insulin-Like Growth Factor 2
IL : Interleukin
IL2 : Interleukin 2
IL6 : Interleukin 6
INA : Internexin neuronal intermediate filament protein, alpha
INHBA : Inhibin beta A
INHBB : Inhibin beta B
IPA : Ingenuity Pathways Analysis
IRF5 : Interferon regulatory factor 5
ISLR : Immunoglobulin superfamily containing leucine-rich repeat
ITGA5 : Integrin, alpha 5 (fibronectin receptor, alpha polypeptide)
JAG1 : Jagged 1
JAG2 : Jagged-2
KCNJ8 : Potassium inwardly-rectifying channel, subfamily J, member 8
KCNMA1 :
Potassium large conductance calcium-activated channel, subfamily
M, alpha member 1
KIRREL3 : Kin of IRRE like 3 (Drosophila)
KRTAP1-5 : Keratin associated protein 1-5
KRTAP19-8 : Keratin associated protein 19-8
LEFTY1 : Left-right determination factors1
LEFTY2 : Left-right determination factors1
LFNG : LFNG O-fucosylpeptide 3-beta-N-acetylglucosaminyltransferase
LIF : Leukemia inhibitory factor
xxv
LILRA1 :
Leukocyte immunoglobulin-like receptor, subfamily A (with TM
domain), member 1
LSP1 : Lymphocyte-specific protein 1
LTBP4 : Latent Transforming Growth Factor Beta Binding Protein 4
M-CSF : Macrophage colony-stimulating factor
MDK : Midkine (Neurite Growth-Promoting Factor 2)
METTL15 : Methyltransferase like 15
MF : Molecular functions
MGP : Matrix Gla protein
MI : Myocardial infarction
MSC : Mesenchymal stem cells
Msx-2 : Msh homebox homologue-2
MT1E : Metallothionein 1E
MTT : 3-(4,5-dimethylthiazohl-2-yl)-2,5-diphenyltetrazolium bromide
MYBPHL : Myosin binding protein H-like
MyoD : Myosin D
ND4 : Mitochondrially encoded NADH dehydrogenase 4
ND5 : Mitochondrially encoded NADH dehydrogenase 5
NDP : Norrie Disease (Pseudoglioma)
NETO2 : Neuropilin (NRP) and tolloid (TLL)-like 2
NPAS1 : Neuronal PAS domain protein 1
NRG1 : Neuregulin 1
NRG2 : Neuregulin 2
NRG3 : Neuregulin 3
NRTN : Neurturin
xxvi
NSAIDs : Non-steroidal anti-inflammatory drugs
OCN : Osteocalcin
OD : Optical density (OD)
OPN : Osteopontin
OR5L2 : Olfactory receptor, family 5, subfamily L, member 2
OSGIN1 : Oxidative stress induced growth inhibitor 1
OTUD6A : OTU deubiquitinase 6A
P2RY2 : Purinergic receptor P2Y, G-protein coupled, 2
PANTHER : Protein Analysis Through Evolutionary Relationships
PBS : Phosphate-buffered saline
PCA : Principle component analysis
PDE1A : Phosphodiesterase 1A, calmodulin-dependent
PDGF-BB : Platelet derived growth factor-BB
PDGFRL : Platelet-derived growth factor receptor-like
PDL : Periodontal ligament
PDLSCs : Periodontal ligament stem cells
PGE2 : Prostaglandin E2
PHLPP2 : PH domain and leucine rich repeat protein phosphatase 2
PITPNM3 : PITPNM family member 3
PITPNM3 : PITPNM family member 3
PLCB2 : Phospholipase C, beta 2
PPARγ2 : Peroxisome proliferator-activated receptor γ2
PSPN : Persephin
PTH : Parathyroid hormone
PTN : Pleiotrophin
xxvii
qRT-PCR : Quantitative real-time PCR
RANKL : Nuclear factor kappa B-ligand
RGMA : Repulsive guidance molecule family member a
RGS4 : Regulator of G-protein signaling 4
RUNX2 : Runt-related transcription factor 2
SAA1 : Serum amyloid A1
SAA2 : Serum amyloid A2
SCAP : Stem cells from apical papilla
SCARA5 : Scavenger receptor class A, member 5 (putative)
SCs : Stem cells
SEMA7A : Semaphorin 7A, GPI membrane anchor
SEPP1 : Selenoprotein P, plasma, 1
SERPINA6 :
Serpin peptidase inhibitor, clade A (alpha-1 antiproteinase,
antitrypsin), member 6
SERTAD4 : SERTA domain containing 4
sGAG : Sulphated glycosaminoglycans
SHED : Human exfoliated deciduous teeth
SLC35F5 : Solute carrier family 35, member F5
SLC43A2 : Solute carrier family 43 (amino acid system L transporter), member 2
SLCO1A2 : Solute Carrier Organic Anion Transporter Family, Member 1A2
SPP1 : Secreted phosphoprotein 1
TDGF1 : Teratocarcinoma-derived growth factor 1
TERT : Telomerase reverse transcriptase
TGF-β : Transforming growth factor-β
TGPCs : Tooth germ progenitor cells
THPO : Thrombopoietin

xxviii
TMEM151A : Transmembrane protein 151A
TNF-α : Tumor necrosis factor alpha
TR : Telomerase RNA
TRIL : TLR4 interactor with leucine-rich repeats
TRITC : Tetramethylrhodamine
TYMP : Thymidine phosphorylase
VEGFA : Vascular endothelial growth factors-A
VEGFC : Vascular endothelial growth factors-C
VEGFs : Vascular endothelial growth factors
VIT : Vitrin
WISP2 : WNT1 inducible signaling pathway protein 2
ZDHHC11 : Zinc finger, DHHC-type containing 11
ZNF157 : Zinc finger protein 157
ZNF316 : Zinc finger protein 316
xxix
LIST OF APPENDICES
Appendix 1.1 The list of up-regulated genes for 200 μM of ASA
treatments (FC≥2)
203
Appendix 1.2 The list of up-regulated genes for 500 μM of ASA
treatments (FC≥2)
204
Appendix 1.3 The list of up-regulated genes for 1,000 μM of ASA
treatments (FC≥2)
207
Appendix 1.4 The list of down-regulated genes for 200 μM of ASA
treatments (FC≤2)
218
Appendix 1.5 The list of down-regulated genes for 500 μM of ASA
treatments (FC≤2)
218
Appendix 1.6 The list of down-regulated genes for 1,000 μM of ASA
treatments (FC≤2)
224
Appendix 1.7 The list of canonical pathway for 200 μM of ASA
treatments
234
Appendix 1.8 The list of canonical pathway for 500 μM of ASA
treatments
235
Appendix 1.9 The list of canonical pathway for 1,000 μM of ASA
treatments
237
Appendix 1.10 Physiological and molecular functions 239
1.10.1
Connective tissue and development at 200 μM of ASA
treatments
239
1.10.2 Tissue development for 200 μM of ASA treatments 239
1.10.3 Organ development for 200 μM of ASA treatments 240
1.10.4
Skeletal and muscular development for 200 μM of ASA 240
xxx
treatments
1.10.5
Hematological system development and function for
500 μM of ASA treatments
241
1.10.6 Organ development for 500 μM of ASA treatments 241
1.10.7 Skeletal muscular for 500 μM of ASA treatments 241
1.10.8 Tissue development for 500 μM of ASA treatments 242
1.10.9 Cardiovascular for 500 μM of ASA treatments 242
1.10.10 Organismal development for 500 μM of ASA treatments 243
1.10.11
Hematological system development and function for
1000µM of ASA treatments
243
1.10.12 Hematopoiesis for 1000µM of ASA treatments 243
1.10.13 Cardiovascular for 1000µM of ASA treatments 244
Appendix 1.11 molecular and cellular functions 244
1.11.1 Cellular movement at 200 μM of ASA treatments
(p<0.05)
244
1.11.2 Cellular compromise for 200 μM of ASA treatments 244
1.11.3
Cellular growth and proliferation for 200 μM of ASA
treatments
245
1.11.4 Lipid metabolism for 200 μM of ASA treatments 245
1.11.5 Cellular movement for 500 μM of ASA treatments 245
1.11.6
Cellular growth and proliferation for 500 μM of ASA
treatment.
246
1.11.7 Cell death and survival for 500 μM of ASA treatments 246
1.11.8 Gene expression for 1000 μM of ASA treatments 247
1.11.9 Cell death and survival for 1000 μM of ASA treatments 247
1.11.10 Cellular growth and proliferation for 1000 μM of ASA 247

xxxi
treatments
1.11.11
Post-translational modification for 1,000 μM of ASA
treatments
248
1.11.12 Protein synthesis for 1,000 μM of ASA treatments 248
1
CHAPTER 1: INTRODUCTION
Mesenchymal stem cells (MSC) are adult stem cells that have two remarkable
features, namely the capacity of self-renewal and ability to differentiate into a number
of different tissues (multipotency), including differentiation into cells of the
mesenchymal lineage such as osteoblasts, chondrocytes, and adipocytes. MSCs can
also differentiate into ectodermal (neural cells) and endoderm (hepatic cells) cell
lineages (Gronthos et al., 2000; Miura et al., 2003; Seo et al., 2004). The minimal
criteria in defining MSCs include: 1) the ability to adhere to plastic surfaces under
culture conditions; 2) the cells are positive for the following cell surface markers CD73,
CD90, and CD105, and negative for CD14, CD19, CD34, CD45, or CD11b, CD79α and
HLA-DR; and 3) be capable of differentiating into osteoblasts, adipocytes, and
chondrocytes in vitro (Dominici et al., 2006).
MSCs can be isolated from many tissues including bone marrow, umbilical
cords (Wharton’s jelly), adipose and dental tissues. MSCs were first discovered by
Friedenstein and his associates in the rodent bone marrow, which they called bone
marrow mesenchymal stem cells (BMMSCs) (Friedenstein, 1970). Since then,
knowledge from the study of BMMSCs has been used as the “gold standard” in the
approach to the study of stem cells (Ullah et al., 2015). The therapeutic potential of
BMMSCs has been well established in in vitro and in vivo studies (Colnot, 2011; Ma et
al., 2014). However, the procedure for obtaining BMMSCs is invasive and the
harvesting yield is low (Huang et al., 2009). Thus, the isolation of MSCs from dental
tissues as an alternative to BMMSCs provides an appealing alternative. The dental stem
cells can be obtained with ease as they are readily accessible in the oral environment
and can even be obtained from extracted teeth that are usually discarded.
2
To date, eight unique populations of dental-derived MSCs have been isolated
and characterized (Liu et al., 2015a). Dental pulp stem cells (DPSCs) are the first type
of MSCs isolated from human dental tissue (Gronthos et al., 2000). Since then, the
isolation of various dental MSCs have been reported, such as human exfoliated
deciduous teeth (SHED) (Miura et al., 2003), periodontal ligament stem cells
(PDLSCs) (Seo et al., 2004), dental follicle progenitor cells (DFPCs) (Morsczeck et al.,
2005), alveolar bone-derived MSCs (ABMSCs) (Matsubara et al., 2005), gingiva-
derived MSCs (GMSCs) (Zhang et al., 2009), stem cells from apical papilla (SCAP)
and tooth germ progenitor cells (TGPCs) (Ikeda et al., 2008). The PDLSCs are able to
generate cementum-forming cells (cementoblast) or bone-forming cells, thus
highlighting their potential use in cell based therapy for periodontal/bone regeneration
(Huang et al., 2009).
Periodontal regeneration is a method of regenerative therapy to return the
periodontal tissues (including gingiva, root cementum, alveolar bone, and the
periodontal ligament) to their original healthy condition through restoration of form and
function of lost structures (Bosshardt & Sculean, 2009). Non-steroidal anti-
inflammatory drugs (NSAID) are widely used as an analgesic agent in healthcare. It
may be used in managing orthopaedic patients pre/post-surgery, to address acute or
chronic inflammation. However, such use of NSAIDs may have undesirable impact on
stem cells function, particularly in periodontal or bone regeneration (Chang et al., 2007;
Chang et al., 2005; De Luna-Bertos et al., 2012; Ho et al., 1999; Ho et al., 2001).
Aspirin (ASA) is renowned NSAID which has been used for decades. ASA has
been reported to modulate a variety of conditions related to human disease, such as
cardiovascular disease, periodontal health, cancer and diabetes (Heasman & Hughes,
3
2014; Sutcliffe et al., 2013). The impact of ASA on stem cells properties has been
reported in a number of studies (Liu et al., 2011a; Cao et al., 2015; Liu et al., 2015b).
However, not many studies have examined the effects of ASA on MSCs or osteoblast
precursor cells. The beneficial or adverse effects of ASA on the survival and function of
MSCs, particularly in osteogenic differentiation needs to be further investigated.
1.1 Objectives
The objectives of this study were to investigate the effects of ASA on the
osteogenic potential and expression profile of genes in PDLSCs. The study was
conducted by dividing into three phases as following:
Phase I: Isolation and characterization of mesenchymal derived stem cells (MSCs) from
periodontal ligament (PDL) tissue.
Phase II: Analysis of the effects of ASA on the cell proliferation rate and expression
profile of growth factors-associated genes in PDLSCs using PCR-array.
Phase III: Studying the effects of ASA on osteogenic differentiation of PDLSCs:
a. Analysis of the effect of ASA on PDLSCs cell proliferation in osteogenic
differentiation media.
b. Analysis on the effect of ASA on the osteogenic potential of PDLSCs.
c. Analysis of the effect of ASA on PDLSCs gene expression profiles during
osteogenic differentiation through microarray analysis.
d. Bioinformatics analysis of gene expression data to gain insights on the
mechanism / impact of ASA on PDLSCs osteogenic differentiation.
4
CHAPTER 2: LITERATURE REVIEW
2.1 Definition and types of stem cells
Stem cells (SCs) are unspecialized or non-differentiated cells which are capable
of indefinite cellular division throughout the lifetime of an organism. SCs have two
uniquely important properties: self-renewal and multipotency. Self-renewal is the ability
of SCs to divide indefinitely to make more copies of itself, perpetuating the stem cell
pool throughout the life of an organism, at the same time, maintaining the
undifferentiated state (He et al., 2009). Stem cell multipotency refers to its unique
ability to develop or differentiate into various types of specialized cells. SCs are able to
differentiate into specialized cells under specific cues and conditions (Morrison &
Judith Kimble, 2006). Multipotent cells can develop into more than one cell type.
However, pluripotent cells can give rise to all of the cell types of an organism.
Stem cells are generally divided into embryonic stem cells (ESCs) and adult
stem cells, based on their primary origins and differentiation capacity. ESCs are
derived from the inner cell mass of blastocysts and they are considered as pluripotent,
capable of differentiating into cells of the endodermal, ectodermal and mesodermal
origins (Thomson et al., 1998). ESCs is capable of retaining its undifferentiated states in
vitro indefinitely, enabling the production of continuous cultures almost indefinitely
(Shah et al., 2014). However, the study or manipulation of ESCs brought about ethical
and political controversies that can pose challenging issues that is not easy to be
reconciled.
5
2.2 Mesenchymal stem cells (MCSs) and their characteristics
MSCs were first isolated by Friedenstein and his associates from rodent bone
marrow. They were identified as colony forming unit (CFU) fibroblasts, capable of
differentiating into bone, chondrocytes or adipocytes, and can reconstitute the
hematopoietic microenvironment (Friedenstein, 1970). MSCs are adult stem cells
originating from the mesodermic layer. They possess two remarkable features similar to
SCs, i.e., self-renewal capacity and multipotency, i.e. differentiation into various
specialized cells of the mesenchymal lineage such as osteoblasts, chondrocytes, and
adipocytes (Seo et al., 2004). In addition, MSCs also have the capacity to differentiate
into a variety of cells of mesodermal and endodermal origin such as hepatocytes
(Chagraoui et al., 2003), neural cells (Woodbury et al., 2000) and epithelial cells (Spees
et al., 2003). Due to such properties, MSCs have been shown to be effective in tissue
regeneration (Wei et al., 2013).
MSCs have been extensively characterised through morphology and
immunophenotyping analyses, displaying unique cell surface markers. MSCs exhibit
fibroblast-like appearance, with an elongated shape and express the following cell
surface markers: CD49a/CD29, CD44, STRO-1, CD90, CD105, CD106, CD146,
CD140b, CD166 and CD271 (Lin et al., 2009). Phenotypically, MSCs also show cell
surface markers expression that is similar to perivascular, bone and neural cells (Lin et
al., 2009), suggesting a common link between MSCs and different cell types (Gronthos
& Simmons, 1995; Pittenger et al., 1999; Prockop et al., 2001; Gronthos et al., 2003).
Although MSCs of different origins may share a common phenotype, differences in
terms of proliferative and differentiation/developmental capacities have been reported
(Gronthos et al., 2003; Kuznetsov et al., 1997; Muraglia et al., 2000) .
6
2.3 Tissue sources of MSCs
MSCs can be found in a variety of tissues such as human umbilical cords (Kim
et al., 2013a), adipose tissues (Zuk et al., 2002), skeletal muscle, tendons, and
trabecular bones (Bi et al., 2007). There have also been attempts to harvest MSCs from
various types of dental tissues. To date, eight unique populations of dental-derived
MSCs have been isolated (Figure 2.1) and characterized (Liu et al., 2015a). The first
types of human dental MSCs were identified from pulp tissues, and are known as dental
pulp stem cells (DPSCs) (Gronthos et al., 2000).
Thereafter, isolation of additional dental MSCs such as human exfoliated
deciduous teeth (SHED) (Miura et al., 2003), periodontal ligament stem cells
(PDLSCs) (Seo et al., 2004), dental follicles progenitor cells (DFPCs) (Morsczeck et
al., 2005), alveolar bone-derived MSCs (ABMSCs) (Matsubara et al., 2005), gingiva-
derived MSCs (GMSCs) (Zhang et al., 2009b), stem cells from apical papilla (SCAP)
(Sonoyama et al., 2008) and tooth germ progenitor cells (TGPCs) (Ikeda et al., 2008)
have been reported.
7
2.3.1 Dental Pulp Stem Cells (DPSCs)
DPSCs, primarily known as postnatal dental pulp stem cells, were first isolated
from permanent dental pulp tissue (Gronthos et al., 2000). They express several MSCs
surface markers including CD73, CD90, and CD105 but lack expression of
hematopoietic markers (CD14, CD34 and CD45) (Gronthos et al., 2000). DPSCs
possess immunosuppressive properties and are also prone to forming ectopic dental-
pulp like complexes (Gronthos et al., 2000). DPSCs have the tendency to differentiate
into osteoblasts, chondrocytes, cardiomycytes, and hepatocytes in vitro.
2.3.2 Stem Cells from Human Exfoliated Deciduous Teeth (SHED)
SHED were first isolated from the remnant pulps of exfoliated deciduous teeth
(Miura et al., 2003) and have higher proliferation rates compared to DPSCs, increased
cell population doubling rates, and are able to form sphere-like cell clusters. SHED
display MSCs cell surface markers (Dominici et al., 2006; Huang et al., 2009) and also
Figure 2.1: Location of dental stem cells [adaptation from (Liu et al., 2015a)].
8
express ESC markers (Oct-4 and Nanog), neuronal markers (nestin) and the stage-
specific embryonic antigens, SSEA-3 and SSEA-4 (Miura et al., 2003). SHED
displayed trilineage differentiation capacity, similar to other MSCs.
2.3.3 Dental Follicle Stem Cells (DFSCs)
Dental follicle stem cells are derived from ectomesenchyme that surround the
developing tooth germ cells prior to eruption. Similar to other dental stem cells, they
possess an extensive proliferative ability and expressed MSCs markers but lack
expression of hematopoietic markers. The dental follicle contains stem cells and
lineage progenitor cells that can differentiate into cementoblast, osteoblast, and PDL-
like cells (Morsczeck et al., 2005). DFSCs have been reported to express putative stem
cell markers including Notch-1 and Nestin, as well as demonstrated the expression of
higher insulin-like growth factor 2 (IGF-2) (Morsczeck et al., 2005).
2.3.4 Stem cells from the Apical Papilla (SCAP)
Sonoyama et al. reported the isolation of another unique type of MSCs from
dental tissue, known as SCAP (Sonoyama et al., 2008). The MSCs were isolated from
the apical papilla of human immature permanent tooth (Sonoyama et al., 2006;
Sonoyama et al., 2008). Root formation begins with the apical papilla proliferation of
epithelial cells from the cervical loops in developing tooth. The dental papilla
contributes to tooth formation and eventually converts to pulp tissue within the pulp
chamber.
9
The apical zone lies in between the apical papilla and pulp. SCAP expresses
various MSC markers and represent a novel population of multipotent stem cells that
posses a greater proliferative capacity for dentine regeneration than DPSCs. SCAP also
have a tendency to develop into odontoblast-like cells and adipocytes in in vitro studies
(Sonoyama et al., 2006; Sonoyama et al., 2008). Morever, they have the potential for
forming odontoblast-like cells produce dentine in vivo and are likely to be the source of
primary odontoblasts for root dentin formation. In addition, they are capable to express
high levels of important molecules in mediating proliferation, survival, and telomerase
enzyme. SCAP also exhibit higher proliferation rates and mineralization potential
compared to DPSCs.
2.3.5 Gingiva-derived MSCs (GMSCs)
GMSCs are MSCs isolated from the human gingiva. They exhibit stem cell-like
properties (clonogenicity, self-renewal, and multi-lineage differentiation),
immunomodulatory functions, anti-inflammatory as well as being a promising cell
source for cell-based treatments in experimental inflammatory diseases (Zhang et al.,
2009). GMSCs show positive expression of CD29, CD105, CD90 and STRO-1 (Zhang
et al., 2009; Wang et al., 2011).
10
2.4 Identification and characterization of periodontal ligament stem cells
(PDLSCs)
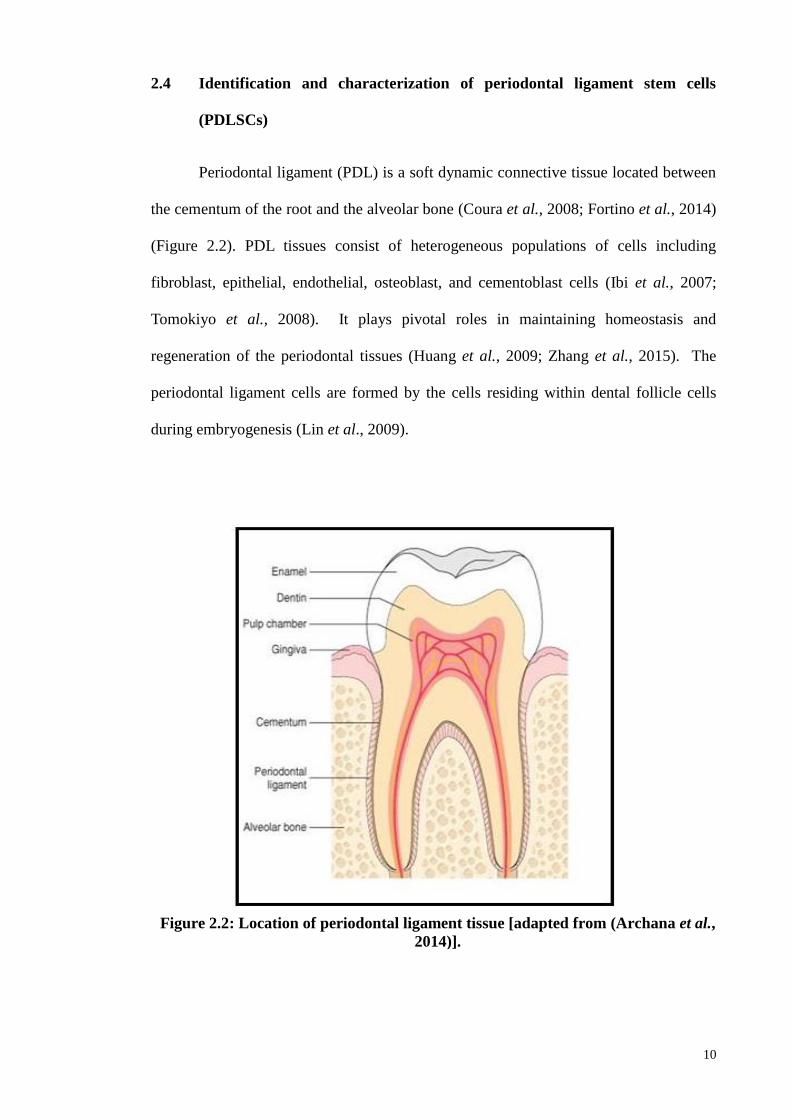
Periodontal ligament (PDL) is a soft dynamic connective tissue located between
the cementum of the root and the alveolar bone (Coura et al., 2008; Fortino et al., 2014)
(Figure 2.2). PDL tissues consist of heterogeneous populations of cells including
fibroblast, epithelial, endothelial, osteoblast, and cementoblast cells (Ibi et al., 2007;
Tomokiyo et al., 2008). It plays pivotal roles in maintaining homeostasis and
regeneration of the periodontal tissues (Huang et al., 2009; Zhang et al., 2015). The
periodontal ligament cells are formed by the cells residing within dental follicle cells
during embryogenesis (Lin et al., 2009).
Figure 2.2: Location of periodontal ligament tissue [adapted from (Archana et al.,
2014)].
11
The human PDLSC was first isolated from human impacted third molars (Seo et al.,
2004). Numerous studies have then indicated that MSCs isolated from PDL have the
properties that are similar to BMMSCs (Seo et al., 2004; Huang et al., 2009; Xu et al.,
2009; Silvério et al., 2010). Similar to BMMSCs, the PDLSCs demonstrated the ability
to self-renewal and to generate clonogenic adherent colonies, with spindle and
elongated-shaped cells. Morever, PDLSCs are capable of forming various types of
mesodermal origin cells such as osteoblasts, chondrocytes, cementoblast, adipocytes,
and neural-like cells (Seo et al., 2004; Coura et al., 2008; Huang et al., 2009; Xu et al.,
2009).
In addition, PDLSCs differentiate into ectodermal (neuronal-like cells) and
endodermal (pancreas, hepatocyte and cardiac like cells) lineages. Several in vitro
studies have shown that PDLSCs possess many osteoblasts-like cell properties similar
to BMMSCs (Gay et al., 2007; Huang et al., 2009). Dental stem cells including
PDLSCs have been shown to express perivascular markers such as CD146/MUC18, and
alpha-smooth muscle actin and pericyte antigen associated (3G5) markers, similar to
BMMSCs (Seo et al., 2004). The primary explants of PDLSCs are capable of producing
mineralized calcium deposits in vitro (Arceo et al., 1991; Cho et al., 1992) and, further,
they demonstrated the formation of mineralization nodules which tested positive with
Alizarin Red S (ARS) staining (Seo et al., 2004).
PDLSCs show similar characteristics to MSCs as they are positive for the
following cell surface markers: CD 166, CD146, CD105, CD 73, CD90, CD29, and
STRO-1 (Feng et al., 2010; Yang et al., 2013). However, PDLSCs showed negative
expressions of the following hematopoietic markers: CD34 and CD45 (Feng et al.,
12
2010). PDLSCs stored in liquid nitrogen retained high proliferative capacity, even
though they may show reduction in cell numbers upon storage (Seo et al., 2004).
PDLSCs are hypoimmunogenic and were able to inhibit the proliferation of
allogeneic T-cells through the upregulation of cyclooxygenase2 (COX2) and
prostaglandin E2 (PGE2) (Ding et al., 2010). PDLSCs could suppress the proliferation,
differentiation, and migration of B-cells through cell-to-cell contact, which were
mediated by programmed cell death protein-1 (Ousheng et al., 2013). The low
immunogenicity and immunosuppressive effects towards T- and B-cells allow the use of
allogeneic PDLSCs in periodontal regeneration.
2.4.1 Growth potential of PDLSCs
PDLSCs could maintain their higher growth potential rate beyond 100
population doublings before entering senescence, compared to BMMSCs, which can
only achieve 50 populations doubling before senescence were noted. Similar to other
MSCs, PDLs undergo senescence-associated growth arrest as culture passage number
increases, and this appears to make it different from ESCs, which are considered as
immortal stem cells (Bocker et al., 2008).
2.4.2 Periodontal regeneration using PDLSCs
The presence of various MSCs residing in dental or craniofacial tissue has
invited clinical investigations into the potential use of such SCs for the regeneration of
tissues in the orofacial region. PDL is predicted to provide the best-suited source of
13
progenitor cells for periodontal regeneration therapy. Dental stem cells, including
PDLSCs, are derived from neural crest cells (ectomesenchyme), and this makes them an
attractive source of MSCs for craniofacial regeneration owing to their higher potential
or plasticity of differentiation into craniofacial tissues (Coura et al., 2008).
Although MSCs express a common set of genetic markers, it has been observed
that different sources of MSCs have their own distinct phenotypes and biological
properties. Thus, MSCs of different sources came from their own specific
microenvironment, which could influence their plasticity or differentiation capacity
(Musina et al., 2005; Musina et al., 2006)). This notion is supported by the observation
of lower odontogenic potential showed by BMMSC compared to dental stem cells (Yu
et al., 2007; Huang et al., 2009).
The study of PDLSCs use for orofacial regeneration purposes may bring further
understanding of the factors that regulate the formation of mineralized matrices and
other associated connective tissues during regenerative processes. PDLSCs are able to
form mineralized nodules under appropriate culture conditions. They are observed to
express several bone related gene marker such as alkaline phosphatase and bone
sialoprotein (IBSP), with expressions comparable to BMMSCs (Lekic et al., 2001;
Pitaru et al.2002).
ALP activity was also observed by day 14 in PDLSCs and day 7 in BMMSCs
under osteogenic cultures conditions (Gay et al., 2007). IBSP expression was observed
by day 7 for both cells but more intense staining is seen in PDLSCS cultures. In
addition, PDLSCs are also capable of generating cementoblast-like cells and periodontal
14
ligament-like tissue in vitro, highlighting potential therapeutics application of PDLSCs
for PDL regeneration (Huang et al., 2009).
A number of studies have reported PDLSCs potential in periodontal
regeneration (Gronthos et al., 2000; Gronthos et al., 2000;Miura et al., 2003; Seo et al.,
2004; Moshaverinia et al., 2014; Tang et al., 2014; An et al., 2015). Those studies
indicated that PDLSCs were able to show osteogenic differentiation, forming
mineralized matrices in the presence of β-Glycerophosphate, ascorbic acid and
dexamethasone (An et al., 2015). L-ascorbic acid, dexamethasone and β-
glycerophosphate are in vitro osteogenic inducers that are supplemented in osteogenic
media (Jaiswal et al., 1997; Kim et al., 2003) but these inducers are not useful for in
vivo studies.
PDLSCs that were expanded in vitro and transplanted into immunocompromised
rodents have been shown to generate cementum/PDL-like cells and connective tissues,
and this highlighted the potential use of PDLSCs in addressing periodontal defects in
vivo (Seo et al., 2004). PDLSCs have also been reported to induce formation of
periodontal ligament-like structures in vivo, in the presence of scaffolds such as
hydroxyapatite/tricalcium phosphate (HA/TCP) acting as a carrier (Sonoyama et al.,
2006). The PDLSCs were observed to form cementum on the surface of the HA/TCP
carrier and Sharpey's fibers after a few weeks of transplantation (Sonoyama et al.,
2006). These findings suggested that PDLSCs could be useful for dental root and
periodontal regeneration.
15
2.5 Bone
The human bone is a type of mineralized connective tissue that is also known as
osseous tissue, which forms the rigid supporting structure of the human body-the
skeleton. The bone tissue undergoes a continuous process of remodeling in vivo. The
formation of new bone tissue is known as ossification (or osteogenesis). The osteogenic
potential of adult stem cells is often investigated if the cells are newly isolated from the
human tissue, to confirm/ascertain their osteogenic differentiation capability,
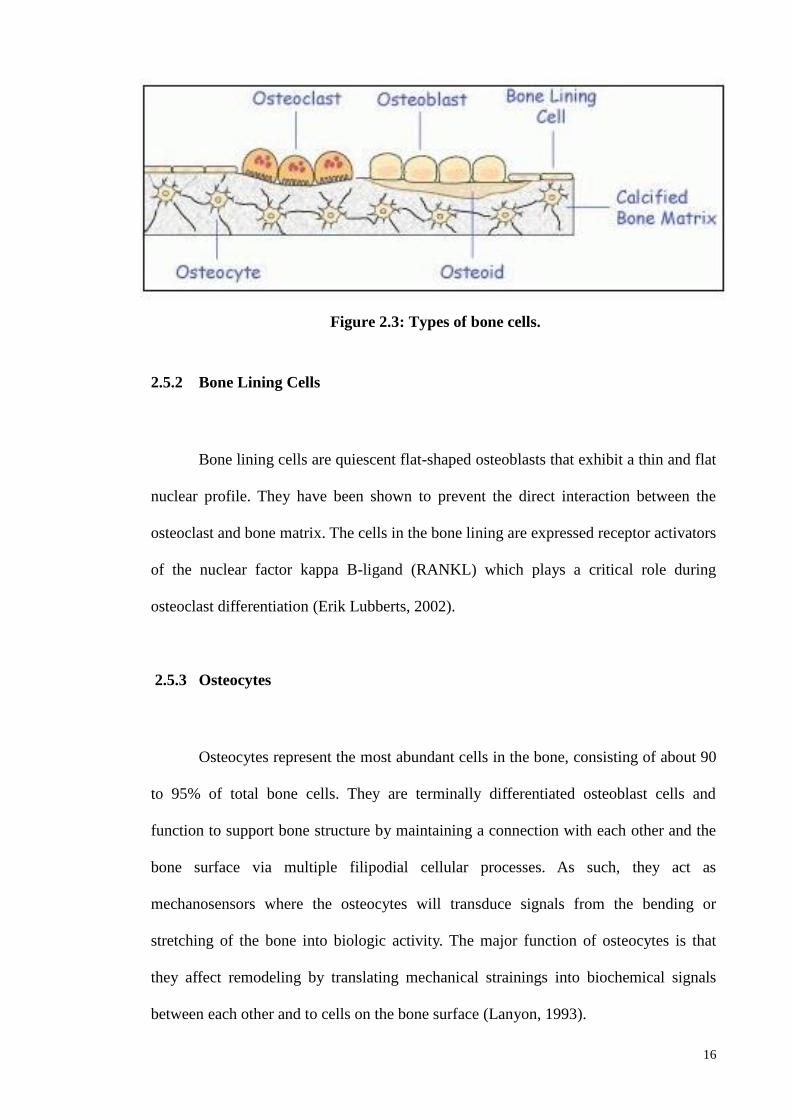
particularly BMMSCs or stem cells from the oro-facial regions. Bone consists of four
types of cells: (i) osteoblast, (ii) osteoclast, (iii) osteocyte, and (iv) bone lining cells
(Downey & Siegel, 2006), as shown in Figure 2.3. Bone cells work in harmony to
maintain a balance between bone formation and resorption, to eventually control bone
structure and function.
2.5.1 Osteoblast
Osteoblasts are bone forming cells which originated from MSCs. Osteoblasts
make about 4 to 6% of total bone cells (Capulli et al., 2014) and they are found along
the bone surface with a cuboidal shape (Figure 2.3). They synthesize the bone matrix
and subsequent matrix mineralization. At the end of the bone-forming phase,
osteoblasts can have one of four different fates; some of the osteoblast cells are trapped
as they are buried in the bone matrix as osteocyte; some of the osteoblasts form the
bone–lining cells and the majority of the osteoblasts undergo apoptosis and also
transdifferentiate into cells that deposit chondroid or chondroid bone (Noble et al.,
1997; Jilka et al., 1998; Manolagas, 2000; Li et al., 2004; Franz-Odendaal et al., 2006).
16
Figure 2.3: Types of bone cells.
2.5.2 Bone Lining Cells
Bone lining cells are quiescent flat-shaped osteoblasts that exhibit a thin and flat
nuclear profile. They have been shown to prevent the direct interaction between the
osteoclast and bone matrix. The cells in the bone lining are expressed receptor activators
of the nuclear factor kappa B-ligand (RANKL) which plays a critical role during
osteoclast differentiation (Erik Lubberts, 2002).
2.5.3 Osteocytes
Osteocytes represent the most abundant cells in the bone, consisting of about 90
to 95% of total bone cells. They are terminally differentiated osteoblast cells and
function to support bone structure by maintaining a connection with each other and the
bone surface via multiple filipodial cellular processes. As such, they act as
mechanosensors where the osteocytes will transduce signals from the bending or
stretching of the bone into biologic activity. The major function of osteocytes is that
they affect remodeling by translating mechanical strainings into biochemical signals
between each other and to cells on the bone surface (Lanyon, 1993).
17
2.5.4 Osteoclasts
Osteoclast cells are derived from hematopoietic stem cells that which developed
and adhere to the bone matrix. Several steps are involved in osteoclast differentiation of
hematopoietic stem cells, to give rise to colony-forming granulocytes/macrophages
units. During the initiation phase, the hematopoietic stem cells are recruited to the
specific area of the bone, to differentiate into cells of the monocyte/macrophage lineage
in the bone marrow. The monocyte/macrophage lineage in the bone marrow acts as an
osteoclast precursor that will attach to the bone matrix to differentiate into mature
osteoclasts in response to osteoclastogenesis factors, macrophage colony-stimulating
factor (M-CSF), and nuclear factor kappa B-ligand (RANKL) that initiate bone
resorption (Boyle et al., 2003). M-CSF will bind to its receptor found in osteoclast
precursor cells and this stimulated their proliferation (osteoclastogenesis) and inhibited
their apoptosis.
2.5.5 Bone extracellular matrix
The bone extracellular matrix consists of both a non-mineralized organic matrix
and an inorganic matrix (Downey & Siegel, 2006). The organic component is
constituted of mainly collagen proteins, pre-dominantly type I, and several non-
collagenous proteins including bone sialoproteins (IBSP), osteopontin (OPN),
osteocalcin (OCN), proteoglycan, glycosylated proteins, and gla-proteins as well as
growth factors and cytokine components (Downey & Siegel, 2006). The inorganic
matrix component plays an important role that is related to the storage of ions. It is
estimated that mineral salts consist of 99% calcium and 85% phosphorus as well as little
amounts of magnesium and sodium.
18
2.6 Osteoblastogenesis
Osteoblastogenesis is the process of osteoblast development, consisting of three
major phases: (i) lineage commitment, (ii) proliferation phase known as pre-osteoblast,
(iii) matrix maturation and (iv) matrix mineralization of osteoblasts which are
characterized by the expression of distinctive osteoblast markers. The first transition
involves the commitment of MSCs to osteogenic lineage. The lineage commitment of
multipotent mesenchymal cells is driven by the selective expression of the so-called
“master transcriptional regulators”.
This step is regulated by transcription factors and the expressions of lineage
inducing factors are committed either to osteoblast or chondroblast, depending upon the
threshold levels of Sox, myosin D (MyoD) and runt-related transcription factor 2
(Matsubara et al., 2008). Meanwhile MyoD directs these cells into the myogenic
pathway, where Sox9 enhances chondrogenesis development, while Peroxisome
proliferator-activated receptor γ2 (PPARγ2) promotes adipogenesis.
After lineage commitment, a second transition is associated with mitotic
duplication, giving rise to another stem cell type and a committed osteoprogenitor. A
wide range of osteogenic cell types are involved during this stage and range from MSCs
through to the more committed pre-osteoblast and chondro-osteoprogenitors, which are
characterized by the production of proteins such as collagen, fibronectin, and growth
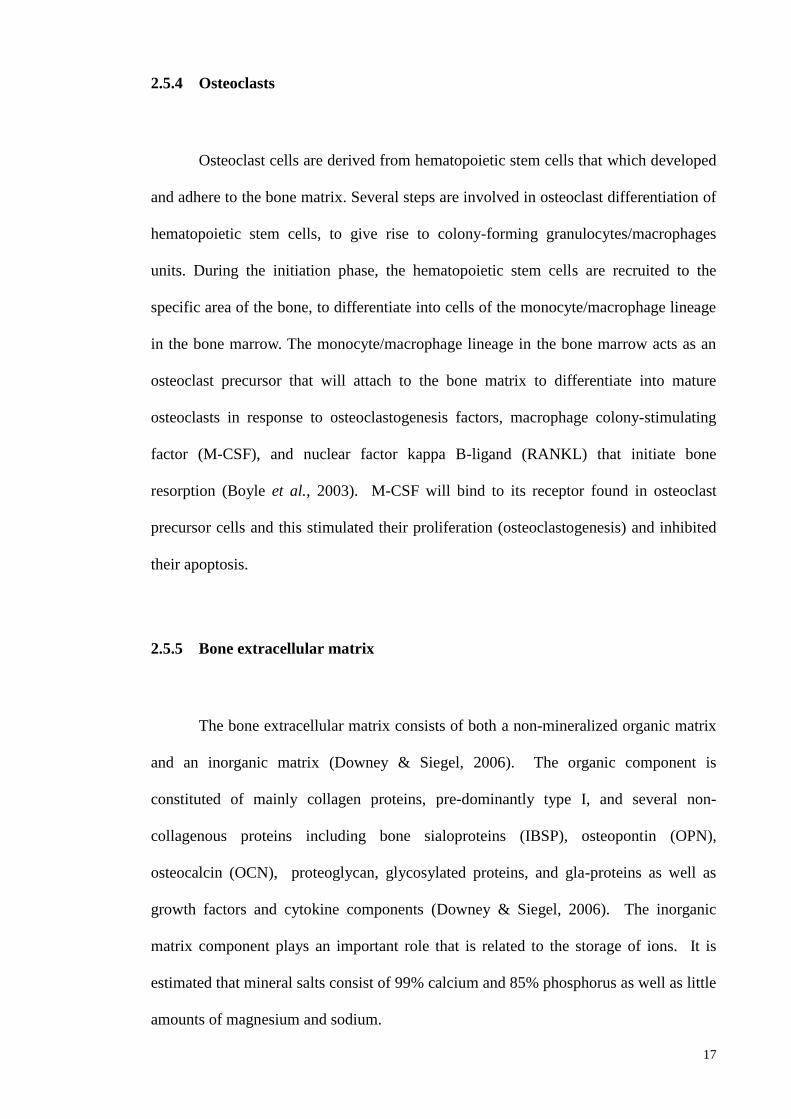
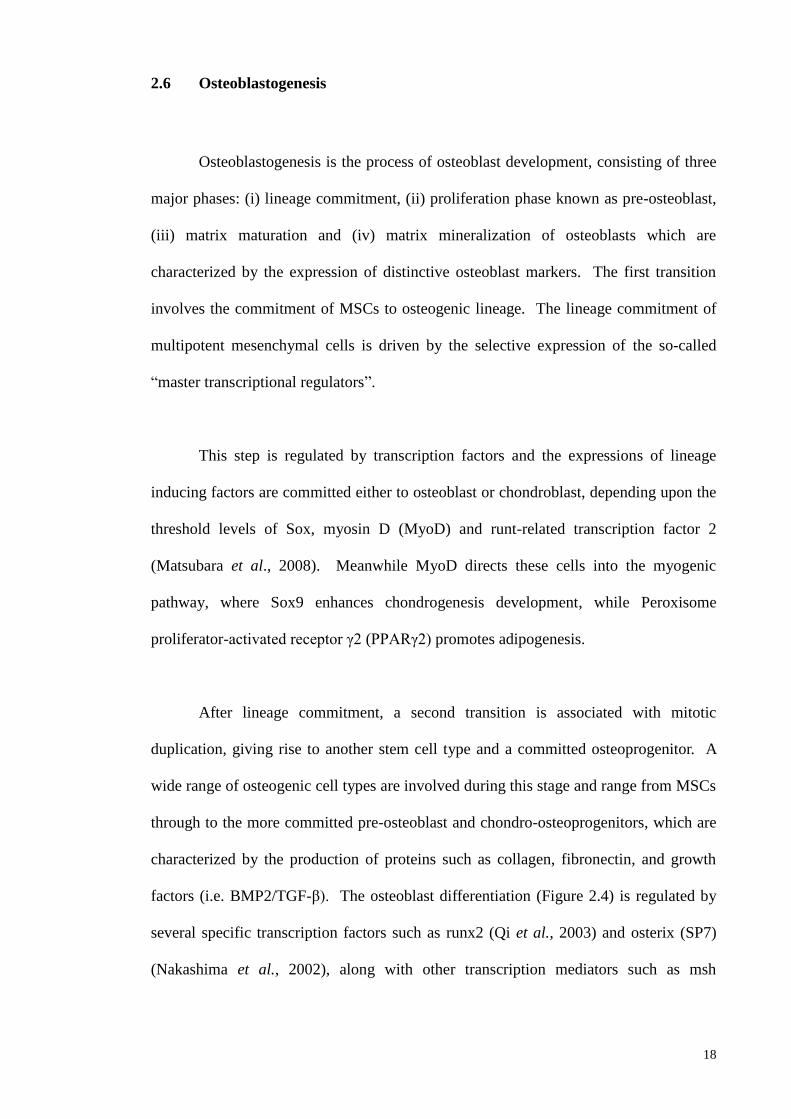
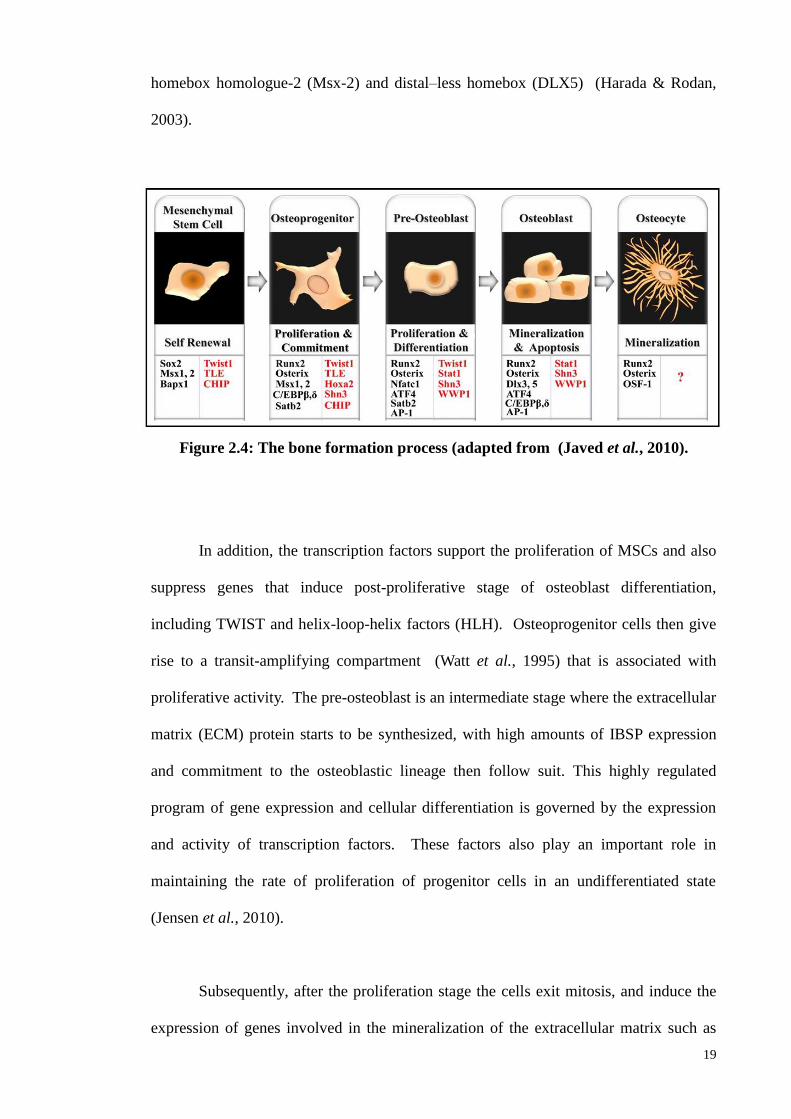
factors (i.e. BMP2/TGF-β). The osteoblast differentiation (Figure 2.4) is regulated by
several specific transcription factors such as runx2 (Qi et al., 2003) and osterix (SP7)
(Nakashima et al., 2002), along with other transcription mediators such as msh
19
homebox homologue-2 (Msx-2) and distal–less homebox (DLX5) (Harada & Rodan,
2003).
In addition, the transcription factors support the proliferation of MSCs and also
suppress genes that induce post-proliferative stage of osteoblast differentiation,
including TWIST and helix-loop-helix factors (HLH). Osteoprogenitor cells then give
rise to a transit-amplifying compartment (Watt et al., 1995) that is associated with
proliferative activity. The pre-osteoblast is an intermediate stage where the extracellular
matrix (ECM) protein starts to be synthesized, with high amounts of IBSP expression
and commitment to the osteoblastic lineage then follow suit. This highly regulated
program of gene expression and cellular differentiation is governed by the expression
and activity of transcription factors. These factors also play an important role in
maintaining the rate of proliferation of progenitor cells in an undifferentiated state
(Jensen et al., 2010).
Subsequently, after the proliferation stage the cells exit mitosis, and induce the
expression of genes involved in the mineralization of the extracellular matrix such as
Figure 2.4: The bone formation process (adapted from (Javed et al., 2010).
20
osteocalcin, OPN, and collagenase. At this level, there is an expression of ALP, which
is an early marker of the post-proliferative osteoblast phenotype, and production of
collagen matrix. The MSCs exit from the cell cycle and the cessation of cell
proliferation is indicated by the accumulation of type 1 collagen and a marked reduction
in histone expression. In order to support the expression osteoblast-related genes,
collagen ECM promotes a signalling cascade by both cell matrix and cell-cell
interactions (Franceschi & Xiao, 2003).
For example, runx2 mRNA or protein levels and its transcriptional activity
suggest that post-translational modification and/or protein-protein interactions may
regulate this factor. Runx2 can be phosphorylated and activated by the mitogen-
activated protein kinase (MAPK) pathway. This pathway can be stimulated by a variety
of signals including those initiated by extracellular matrix (ECM), osteogenic growth
factors like bone morphogenic proteins (BMPs) and fibroblast growth factor-2 (FGF2),
mechanical loading and hormones such as parathyroid hormone (PTH) (Abelev et al.,
2009).
The final stage of osteoblastogenesis is characterized by the deposition of
minerals in ECM together with the expression of osteoblast marker genes such as IBSP,
OCN, and OPN. At this stage, the downregulation of matrix maturation takes place
and strong expression of gene associated with the mineralization that leads to the
formation and accumulation of hydroxyapatite crystals occurs. Osteoblasts cells
produce ECM that are mineralized and become inactive bone lining cells or osteocytes,
entrapped within the mineralized matrix (Javed et al., 2010). The majority of osteoblast
cells do not achieve the end stage of an osteocyte and undergo apoptosis. It can be
21
observed when apoptotic osteoblasts show increased expressions of Bad and Bax, and
the suppression of Bcl2, a pro-cell survival gene (Xing & Boyce, 2005).
2.7 Growth Factors (GFs): regulation of proliferation and differentiation of
MSCs
Growth factors (GFs) are known biological mediators with crucial roles in tissue
proliferation and repair. Fibroblast growth factor 2 (FGF2), platelet derived growth
factor-BB (PDGF-BB), bone morphogenetic proteins (BMP2/6/12), and brain-derived
neurotrotrophic factor (BDNF) are among GF candidates for periodontal regeneration
(Lin et al., 2015). The following section discusses the importance of the above growth
factors in stem cell proliferation and differentiation, particularly in relation to osteoblast
differentiation.
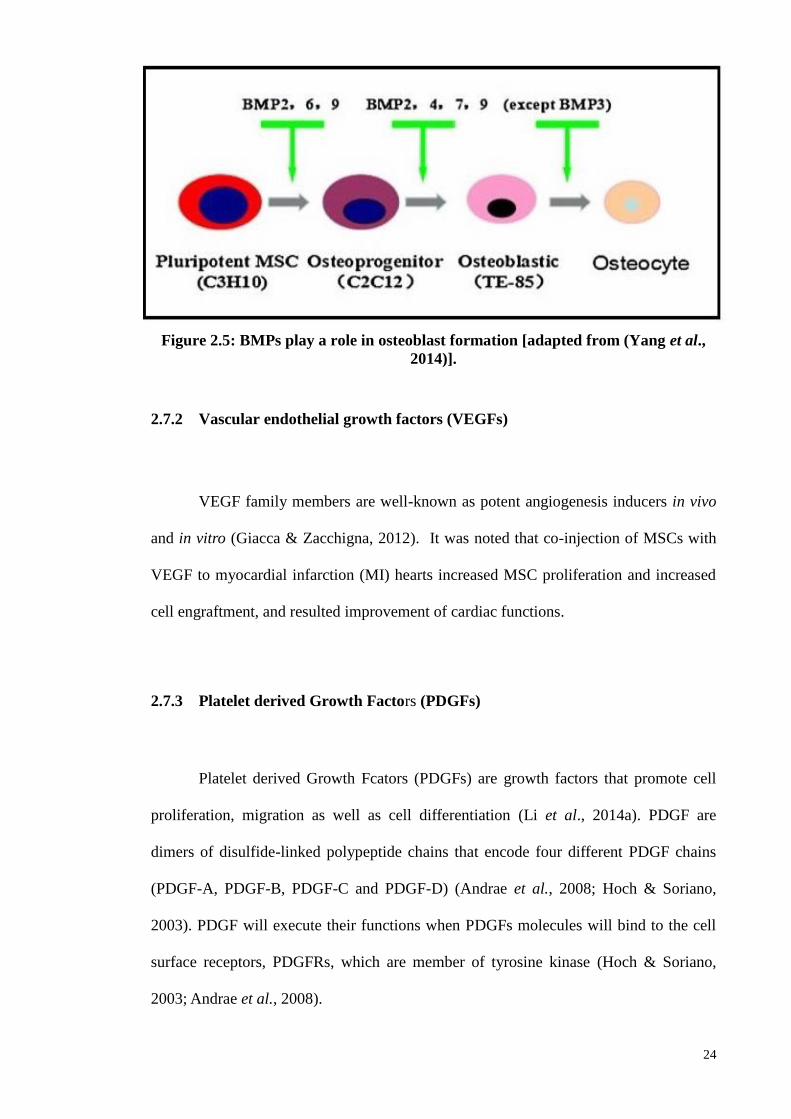
2.7.1 BMPs family members and their roles in osteogenic differentiation
BMPs are multifunctional cytokines and identified as members of the
transforming growth factor-β (TGF-β) superfamily (Celeste et al., 1990). There are
more than 20 BMPs family members, of which BMP2, BMP4, BMP6, BMP7 and
BMP9 have been shown to play important roles in ossification. The effects of BMP6
and BMP9 are the strongest inducer, imparting the most prominent factors for robust
and mature bone ossification to take place (Kang et al., 2004), as shown in Figure 2.5.
BMP3 has been shown to act as a negative regulator of bone ossification induced by
BMP2, BMP6, and BMP7. In contrast, BMP9 plays a vital role during the entire process
of osteoblast formation. It has also been reported that BMP2 did not affect cell
22
proliferation, but it is able to enhance immortalized human marrow stromal cell line
hMS(2–6) osteoblast differentiation. This is achieved by an increase in mineralized
nodule formation and enhanced expression and secretion of ALP and type I procollagen
(Gori et al., 1999).
BMP2 plays an important role in MSCs osteoblast differentiation through the
activation of the SMAD signaling pathway. It regulates essential factors in bone
formation and osteogenesis-related genes such as ALP type I collagen, osteocalcin, and
IBSP (Yang et al., 2014). BMP2 also regulates the expression of Osterix/sp7 through
runx2-dependent and -independent mechanisms. Osterix is a transcriptional factor that
plays an important role in osteoblast formation and osteoblastogenesis, and in addition,
the homebox gene, MSX-2, is also upregulated by BMP2 (Matsubara et al., 2008). It is
noted that the expression of Osterix by BMP2 can be mediated through either of two
different transcriptional factors, runx2 and MSX-2 (Matsubara et al., 2008).
Another BMPs family member that plays an important role in bone formation is
BMP4. BMP4 was found in less differentiated osteoprogenitor cells and not by
differentiated osteoblasts. It plays an important role in the early stages of bone fracture
healing (Nakase et al., 1994). BMP4 indirectly stimulates bone formation by inhibiting
osteoclastogenesis (Yang et al., 2014). This is achieved by BMP4 stimulation of
osteoprotegerin (OPG) expression, which is an osteoclastogenesis inhibitor protein
(Tazoe et al., 2003).
It has also been reported that BMP4 induced an increase in the expression level
of OPG in mouse bone marrow derived from stromal cell lines via the MAPK signaling
pathway (Tazoe et al., 2003). Another study reported that BMP4 and VEGF acted
23
synergistically to enhance cartilage formation in the early stages of endochondral bone
formation from muscle-derived stem cells (Peng et al., 2002). These early stage actions
coupled with accelerated cartilage resorption eventually led to a significant
enhancement of osteoblast differentiation.
BMP6 is similar to BMP5, osteogenic protein (OP)-1/BMP-7, and OP-2/BMP-8
(Ebisawa et al., 1999). It has been demonstrated that BMP6 could increase ALP activity
in osteoblast lineage cells including C2C12 cells, MC3T3-E1 cells, and ROB-C26 cells
and induce bone formation through transduced signals mainly through Smad5 and
possibly through Smad1 (Ebisawa et al., 1999).
These findings suggest that, similar to BMP-2 and OP-1/BMP-7 (Katagiri et al.,
1994; Takeda et al., 1998), BMP-6 converts the differentiation pathway of myoblastic
cell lines into that of osteoblast lineage, and induces osteoblast differentiation and
maturation in osteoprogenitor and osteoblastic cell lines. The profile of binding of
BMP-6 to type I and type II receptors was similar to that of OP-1/BMP-7 in C2C12
cells and MC3T3-E1 cells; BMP-6 strongly bound to activin receptor-like kinase
(ALK)-2 (also termed ActR-I), together with type II receptors, i.e. BMP type II receptor
(BMPR-II) and activin type II receptor (ActR-II). In addition, BMP-6 weakly bound to
BMPR-IA (ALK-3), to which BMP-2 also bound.
24
2.7.2 Vascular endothelial growth factors (VEGFs)
VEGF family members are well-known as potent angiogenesis inducers in vivo
and in vitro (Giacca & Zacchigna, 2012). It was noted that co-injection of MSCs with
VEGF to myocardial infarction (MI) hearts increased MSC proliferation and increased
cell engraftment, and resulted improvement of cardiac functions.
2.7.3 Platelet derived Growth Factors (PDGFs)
Platelet derived Growth Fcators (PDGFs) are growth factors that promote cell
proliferation, migration as well as cell differentiation (Li et al., 2014a). PDGF are
dimers of disulfide-linked polypeptide chains that encode four different PDGF chains
(PDGF-A, PDGF-B, PDGF-C and PDGF-D) (Andrae et al., 2008; Hoch & Soriano,
2003). PDGF will execute their functions when PDGFs molecules will bind to the cell
surface receptors, PDGFRs, which are member of tyrosine kinase (Hoch & Soriano,
2003; Andrae et al., 2008).
Figure 2.5: BMPs play a role in osteoblast formation [adapted from (Yang et al.,
2014)].
25
MSCs express high levels of PDGF-A and PDGF-C and low levels of PDGF-b
and PDGF-D (Rodrigues et al., 2010). PDGF-BB has been found to induce both
proliferation and migration in MSCs (Tamama et al., 2006; Fierro et al., 2007).
However, one study reported that PDGF-β inhibits osteogenic differentiation while the
effect of PDGF-α was subtle (Tokunaga A, 2008).
2.7.4 Fibroblast growth factors (FGFs)
FGFs have been isolated from many sources and although have a pivotal role in
cell proliferation, they also display multitude functions in the epithelial and
mesenchymal cells (Hurley et al., 2002). Structurally, FGFs contain 22 members and
their molecular weight ranges between 17 to 34 kDda (Yun et al., 2010). FGFs are
divided into two classes: acidic (a-FGF) or basic (b-FGF), and these were originally
isolated from the brain and pituitary glands as growth factors for fibroblasts (Yun et al.,
2010). bFGFs showed various biological functions including development,
differentiation, angiogenesis, and wound healing.
The expressions of FGFs play major roles in bone development, and are found
in mesenchymal progenitor and osteoblast cells. In addition, a study has shown that b-
FGF, especially FGF2, maintains the proliferation of as well trilineage differentiation
capacity in MSCs through the early mitogenic cycles although, eventually, all the MSCs
differentiate into the chondrogenic line (Rodrigues et al., 2010). FGF2 was reported to
markedly enhance the growth rates and the life spans of MSCs from rabbit, canine, and
human bone marrows in monolayer cultures (Tsutsumi et al., 2001).
26
bFGF could enhance the levels of cAMP, ALP, OCN, mineralization and
differentiation of osteogenic precursors cells of rat stromal bone marrow cells (rSBMC)
isolated from young adult rat. This suggests bFGF is able to stimulate rSBMC growth
and biochemical functions (Pitaru et al., 1993). The exposure of bFGF to rat BMMSCs
enhances in vitro osteogenic development in the presence of dexamethasone as the
inducer (Hanada et al., 1997). The treatment of rat BMMSC in combination with bFGF
and BMP2 was also shown to synergistically enhance osteogenic potential of the stem
cells, compared to BMP2 treatment alone.
FGF-18 was reported to be expressed in mesenchymal tissues during
differentiation of osteoblasts in calvarial bone development and in the perichondrium of
developing bones (Ohbayashi et al., 2002). It appears to positively affect osteogensis,
by regulating cell proliferation and differentiation, while at the same time, able to
negatively regulate chondrogenesis (Ohbayashi et al., 2002). The biological activities
of FGFs are dependent on the presence of BMP proteins. FGF4 and FGFR signals play
important roles during BMP2-induced bone formation as observed in rats (Kubota et al.,
2002).
2.8 Mechanism of MSCs osteogenic differentiation
2.8.1 FGF signaling controls osteoblast gene expression
FGFs are heparin-binding proteins and function by binding to the following:
tyrosine kinase in the intracellular region of FGR receptors (FGFRs), non-transducing
heparan sulfate-containing proteoglycans (HSPGs), the cysteine-rich receptor (CFR),
and binding proteins (BPs) (Hurley et al., 2002). FGFRs contain an extracellular
ligand-binding domain, a transmembrane region, and an intracellular divided tyrosine
27
kinase domain. The FGF-FGFRs binding results in the autophosphorlyation of tyrosine
residues in the intracellular region of the FGFR leading to the activation of intracellular
downstream signaling pathways especially in the three important pathways of mitogen-
activated protein kinase (Ras/MAPK), protein kinase B, protein kinase C and
phospholipase C, and also p21 pathways (Dailey et al., 2005).
There are four distinct types of FGFR tyrosine kinase receptors (FGFR1,
FGFR2, FGFR3, and FGFR4) with different FGF- binding properties. FGFRs are
expressed on many different cell types and regulate proliferation, differentiation, and
survival. FGFR1 and FGFR2 are expressed in MSCs prior to deposition on
extracellular bone matrix during bone development as shown in Figure 2.6. FGFR1
was recently shown to be an important transducer of FGF2 signals in proliferating
osteoprogenitor cells and subsequent differentiation during short term cultivation (Ling
et al., 2006).
When FGFR1 is blockied, the inhibition of the FGF signaling pathway is
resulted and leading to the abrogation or impairment in the osteogenic differentiation of
human BMMSCs (Jacob et al., 2006). FGF signaling is associated with main
downstream pathways such as: 1) RAS/MAP kinase signaling pathway, 2) P13
Kinase/AKT signaling pathway, and 3) PLCγ signaling pathway. The key event in the
FGF signaling pathway is the phosphorylation of tyrosine residues in the docking
protein and fibroblast growth factor receptor substrates 2-alpha (FRS2-alpha) which
provide new binding sites for direct or indirect recruitment of proteins that are
responsible for both activation and attenuation signaling (Lax et al., 2002).
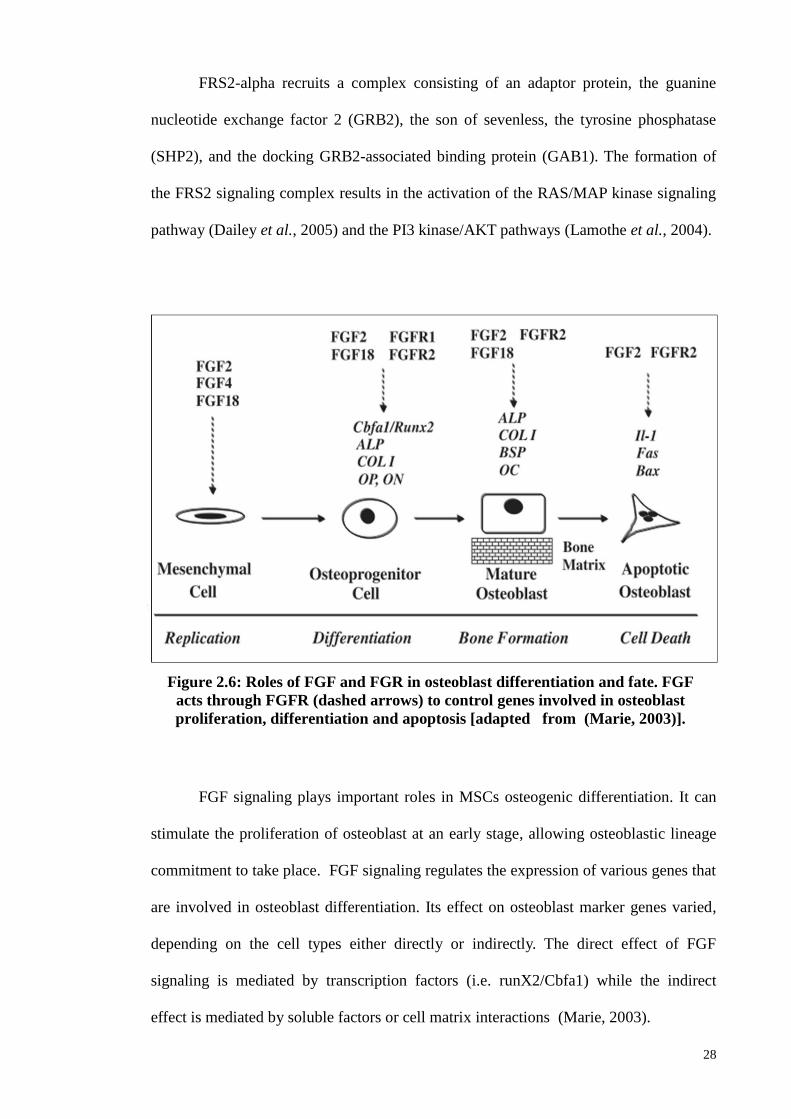
28
FRS2-alpha recruits a complex consisting of an adaptor protein, the guanine
nucleotide exchange factor 2 (GRB2), the son of sevenless, the tyrosine phosphatase
(SHP2), and the docking GRB2-associated binding protein (GAB1). The formation of
the FRS2 signaling complex results in the activation of the RAS/MAP kinase signaling
pathway (Dailey et al., 2005) and the PI3 kinase/AKT pathways (Lamothe et al., 2004).
FGF signaling plays important roles in MSCs osteogenic differentiation. It can
stimulate the proliferation of osteoblast at an early stage, allowing osteoblastic lineage
commitment to take place. FGF signaling regulates the expression of various genes that
are involved in osteoblast differentiation. Its effect on osteoblast marker genes varied,
depending on the cell types either directly or indirectly. The direct effect of FGF
signaling is mediated by transcription factors (i.e. runX2/Cbfa1) while the indirect
effect is mediated by soluble factors or cell matrix interactions (Marie, 2003).
Figure 2.6: Roles of FGF and FGR in osteoblast differentiation and fate. FGF
acts through FGFR (dashed arrows) to control genes involved in osteoblast
proliferation, differentiation and apoptosis [adapted from (Marie, 2003)].
29
The stimulation of runx2/Cbfa1 expression by FGF2 provides an important
molecular mechanism by which FGF/FGFR signaling directly activates the expression
of osteoblast genes that are dependent on runx2/Cbfa1. FGFs signaling could also have
indirect effects on growth factor, matrix degradation, and cell proteins, as shown in
Table 2.1. In such cases, FGFs signaling could affect osteoblast differentiation. Another
example of the indirect effect of FGF signaling is to regulate osteogenic differentiation
through the interaction of the growth factor signaling pathway.
In addition, FGF can also influence other growth factors that influence
osteoblast formation, and this could enhance bone formation. For example, FGFs
increase VEGF and the hepatocyte growth factor (HGF) levels, both of which are
mitogenic factors for osteoprogenitor cells (Tokuda et al., 2000). FGFs also regulate the
genes involved in matrix degradation. FGF signaling regulates the expression of IL6
which is important mediator of the effects of bFGF on bone cells (Kawaguchi et al.,
1995; Hurley et al., 1996). FGF2 modulates the bone matrix by regulating the
expression of collagenase activity. In fetal rat osteoblast-enriched (Ob) cells, it has
been observed that bFGF can stimulate collagenase 3 gene promoter activity through
AP-1 promoter binding site (Varghese et al., 2000) and stromelysin-3 transcription.
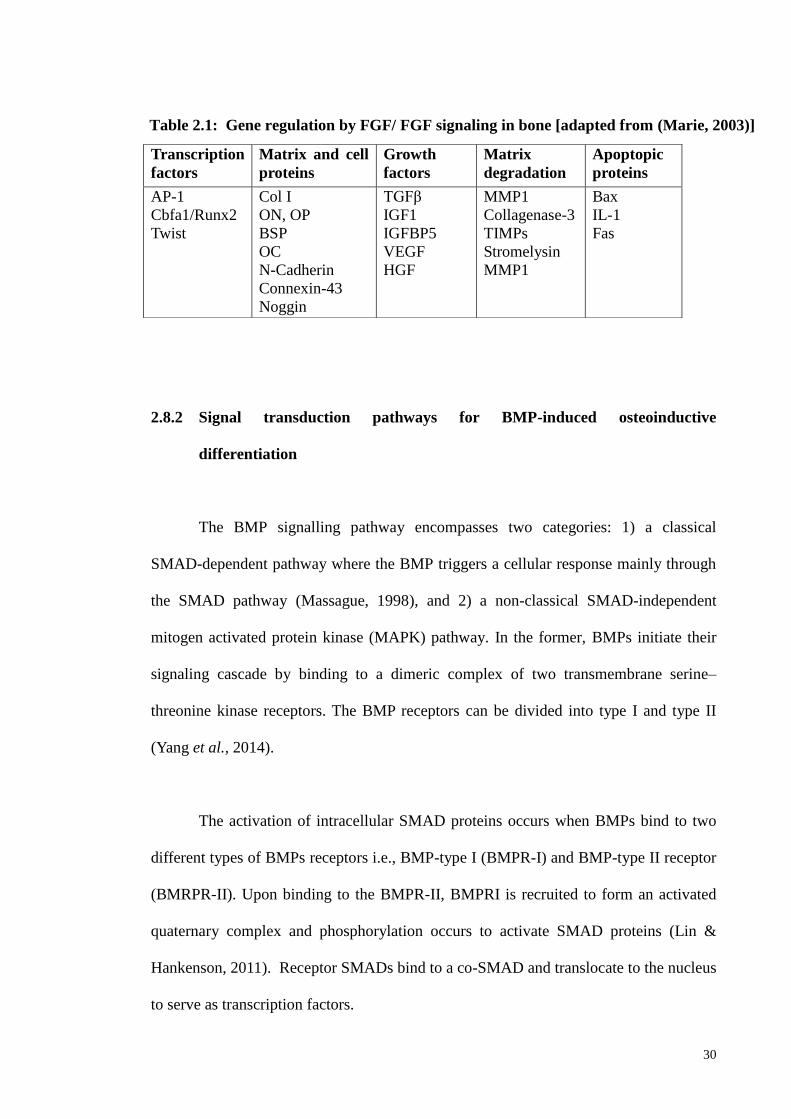
30
2.8.2 Signal transduction pathways for BMP-induced osteoinductive
differentiation
The BMP signalling pathway encompasses two categories: 1) a classical
SMAD-dependent pathway where the BMP triggers a cellular response mainly through
the SMAD pathway (Massague, 1998), and 2) a non-classical SMAD-independent
mitogen activated protein kinase (MAPK) pathway. In the former, BMPs initiate their
signaling cascade by binding to a dimeric complex of two transmembrane serine–
threonine kinase receptors. The BMP receptors can be divided into type I and type II
(Yang et al., 2014).
The activation of intracellular SMAD proteins occurs when BMPs bind to two
different types of BMPs receptors i.e., BMP-type I (BMPR-I) and BMP-type II receptor
(BMRPR-II). Upon binding to the BMPR-II, BMPRI is recruited to form an activated
quaternary complex and phosphorylation occurs to activate SMAD proteins (Lin &
Hankenson, 2011). Receptor SMADs bind to a co-SMAD and translocate to the nucleus
to serve as transcription factors.
Transcription
factors
Matrix and cell
proteins
Growth
factors
Matrix
degradation
Apoptopic
proteins
AP-1
Cbfa1/Runx2
Twist
Col I
ON, OP
BSP
OC
N-Cadherin
Connexin-43
Noggin
TGFβ
IGF1
IGFBP5
VEGF
HGF
MMP1
Collagenase-3
TIMPs
Stromelysin
MMP1
Bax
IL-1
Fas
Table 2.1: Gene regulation by FGF/ FGF signaling in bone [adapted from (Marie, 2003)]
31
SMADs were divided into two categories: 1) R-SMADs (SMAD-1, SMAD-5
and SMAD-8); 2) Co-mediator SMADs. At first, the BMPs will bind to the type-I and
type-II receptor complexes as shown in Figure 2.7. Then, the type-II receptor complex
was activated and phosphorylates the GS-domain type-I receptor. The type-I receptor
subsequently recognized the R-SMADs in the cytoplasm and phosphorylation occurred.
The phosphorylated R-SMADs together with SMAD-4 turn to the complex form and
activate an essential factor for the bone formation transcriptional factor, runx2/Cbfa1 in
the nucleus (Nishimura et al., 2003).
Meanwhile in the non-classical BMPs-MAPK pathway, BMPs will bind to either
type-I or type-II receptors to activate the MAPKs signaling pathway and further
transduce the signaling into the nucleus via the ERK pathway, p-38 pathway, and JNK-
pathway. This signal transduction plays an important role in bone formation (Nohe et
al., 2004; Matsubara et al., 2008).).
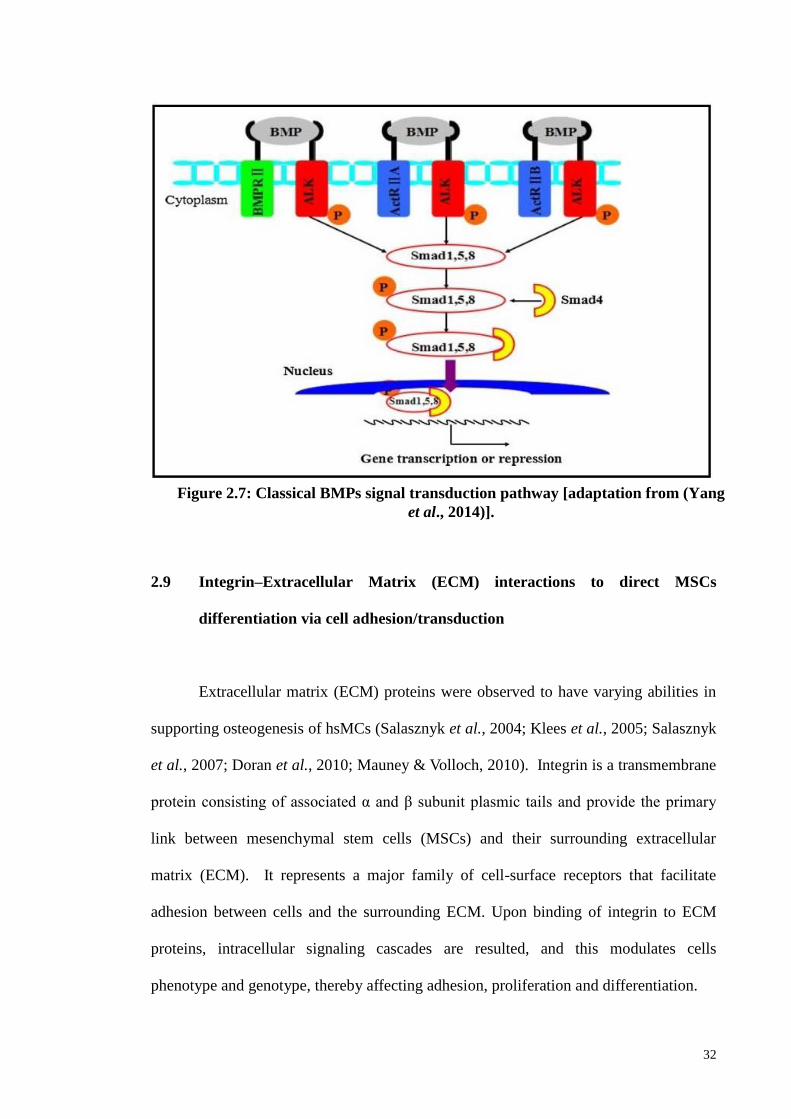
32
2.9 Integrin–Extracellular Matrix (ECM) interactions to direct MSCs
differentiation via cell adhesion/transduction
Extracellular matrix (ECM) proteins were observed to have varying abilities in
supporting osteogenesis of hsMCs (Salasznyk et al., 2004; Klees et al., 2005; Salasznyk
et al., 2007; Doran et al., 2010; Mauney & Volloch, 2010). Integrin is a transmembrane
protein consisting of associated α and β subunit plasmic tails and provide the primary
link between mesenchymal stem cells (MSCs) and their surrounding extracellular
matrix (ECM). It represents a major family of cell-surface receptors that facilitate
adhesion between cells and the surrounding ECM. Upon binding of integrin to ECM
proteins, intracellular signaling cascades are resulted, and this modulates cells
phenotype and genotype, thereby affecting adhesion, proliferation and differentiation.
Figure 2.7: Classical BMPs signal transduction pathway [adaptation from (Yang
et al., 2014)].
33
MSCs expressed a broad range of integrins including α1β1, α2β1, α5β1, α6β1,
αVβ3, and αVβ5 (Gronthos et al., 2001). The variety of integrins results in a different
combination of α and β subunits that can bind to a specific repertoire of ECM protein
molecules or peptides. The specific repertoires include fibronectin, laminin, collagens,
vitronectin, OPN, bone sialoprotein, and dentin matrix protein-1 (Docheva et al., 2007).
In MSCs, the binding of integrin and fibronectin can facilitate osteogenic potential.
Different domains of fibronectin have different affinity for multiple integrins including
α5β1 and αVβ3 and thus have varying abilities to promote osteogenesis.
It is widely acknowledged that the type of ECM and integrin present can
influence MSC differentiation. This is supported in a previous study on BMMSCs
where cultures in osteogenic conditions in the presence of fibronectin and OPN, and the
mineralization matrix and commitment to the osteoblast lineage were increased
(Schwab et al., 2013). It has also been reported that osteogenic induction upregulates
integrin receptors α5β1 and αVβ3, and that the differentiation of dental bud stem cells
(DBSCs) toward the osteoblastic lineage increased when grown with FN, OPN, and
vitronectin (Di Benedetto et al., 2015).
2.10 Prostaglandin (PG), Cyclooxygenase and their roles in bone metabolism
Prostaglandin (PG) is known as prostanoids are formed when arachidonic acid is
released from the plasma membrane by phospholipases (PLAs) and metabolized by the
activity of prostaglandin G/H synthase or cyclooxygenase (Casimiro et al., 2010). COX
is a bifunctional enzymes contains cyclooxygenase and peroxidase activity (Smith et al.,
2000). PG synthesis is triggered by COX activity. The COX enzyme exists in two
34
different forms, namely COX-1 and COX-2. The former is a housekeeping gene,
constitutively expressed and plays important roles in physiological function such as
platelet aggregation, gastric lining protection and homeostasis (Crofford, 1997). COX-2
is an inducible enzyme that is implicated in pathophysiological processes, which can
lead to inflammation, pain and fever (Turini & DuBois, 2002).
The COX-1 is expressed in both normal and fractured bones while COX-2 is up
regulated especially during the initial stages of the bone repair process. Both osteoblast
and osteoclasts produce prostaglandins, where PGE2 is the most abundant PG
synthesized. COX and PG play important roles in bone homeostasis (Raisz, 1995; Min
et al., 1998; Zhang et al., 2002) specifically COX-2 which has a key role in
prostaglandin-E2 (PGE-2) production and important in osteoblast formation (Zhang et
al., 2002). The effect of PGs on bone metabolism is mediated through the prostaglandin
E receptor types 2 and 4 (EP2 and EP4). In osteoblast formation, PG could increase the
proliferation and differentiation of osteoblasts while in bone resorption, PG could
increase the activity of the osteoclast.
2.11 Aspirin (ASA) and its mechanism
Aspirin (ASA) is also known as acetylsalicylic acid and type of non-steroidal
inflammatory drug (NSAID) that is mainly used as analgesic, anti-pyretic and anti-
inflammatory. ASA exerts its anti-inflammatory action by suppressing the production of
prostanoids (thromboxanes, prostacyclines, and PGs) (Casimiro et al., 2010), that are
produced by COX-1 and COX-2 enzymes. The inhibition of cyclooxygenase,
particularly COX-2 prevents the elevation of PGs levels, molecules which are related to
35
induction of inflammation, which can lead to various kind of pain sensation (Gray et al.,
2002). The inhibition prevents the pro-inflammatory signaling pathways such as NF-Kβ
pathway (Yin et al., 1998). Moreover, ASA action resulted in the inhibition of IKK-β
kinase activity which in turn prevents the activation of the NF-kB pathway (Yin et al.,
1998).
2.12 Effect of NSAIDs on osteoblast cell culture and osteoblast precursor cells or
MSCs
There has been limited number of studies which investigated the effect of
NSAIDs on osteoblast cells. Ho et al., (1999) reported that NSAIDs capable to affect
osteoblast proliferation and the earlier stage of differentiation. Further analysis indicated
that both PGs and NSAIDs inhibited DNA synthesis and mitosis, in a time- and
concentration-dependent manner (Ho et al., 1999) . Indomethacin and ketorolac also
negatively affect cell proliferation and differentiation/osteoblastic differentiation,
although the mechanisms were not through PGE1 and PGE2.
Other studies have also reported that NSAIDs (ketorolac, indomethacin,
diclofenac, and piroxicam) exerted cytotoxic effects on osteoblast cultures derived from
fetal rat calvaria bone (Arlt et al., 2001; Ho et al., 2001). Ketorolac and indomethacin
were observed to arrest the cell cycle at the G0/G1 phase. All the NSAIDs tested
showed cytotoxic effect in a concentration-dependent manner. Among them,
indomethacin showed the greatest toxicity, followed by diclofenac > ketorolac >
piroxicam. The cytotoxic effect of NSAIDs on osteoblast was PG-independent. These
observations suggest that the cell cycle arrest induced by the NSAIDs is an important
suppressive mechanism of bone repair and remodeling in vivo.
36
According to report by De Luna-Bertos et al. (2012), the treatment of the MG63
human cell line with therapeutic doses of aspirin (1–10 μM) was not cytotoxic, did not
induce apoptosis/necrosis or resulted to cell cycle changes (De Luna-Bertos et al.,
2012). They reported that ASA in therapeutic doses appeared to have no adverse effect
on osteoblast growth in vitro. The proliferation of MG-63 cells was not significantly
inhibited by 0.1, 1, or 10 μM aspirin at 24-hour treatment. However, at higher ASA
concentrations (20, 100, and 1000 μM), cellular proliferation was negatively affected
within 24 hours of treatment. It was previously reported that NSAID dosage is a key
factor in modulating cellular proliferation, differentiation and migration (Muller et al.,
2011).
NSAIDs (ketorolac, indomethacin, diclofenac and piroxicam) have been
reported to suppress cell proliferation and cell cycle kinetics, exert cytotoxicity and
impair osteogenesis of BMMSCs in mice (D1 cells) and humans (hBMSCs) (Chang et
al., 2007). The NSAIDs drugs showed that all the NSAIDs drugs suppressed
proliferation and arrested cell cycle of D1 cells, but no significant cytotoxic effects was
found. These observations suggest that the suppression of proliferation by NSAIDs on
BMMSCs is not through prostaglandin-related mechanism, but may have been achieved
by the modulation of cellular proliferation, particularly through proteins that regulate
the cell cycle.
In another study, NSAIDs (ketorolac and indomethacin) were reported to
suppress osteoblast proliferation, arrest cell cycle, and induce cell death in osteoblast
cultures from rat fetal calvaria (Chang et al., 2005). The NSAIDs arrested the cell cycle
at the G0/G1 phase, induced cytotoxicity and apoptosis in osteoblast cells. The study
also indicated that piroxicam is less harmful on the osteoblasts function compared to
37
indomethacin. The effect of COX-2 inhibitors celecoxib and naproxen on the
osteogenic differentiation of BMMSCs in inflammatory and non-inflammatory
conditions has also been reported (Yoon et al., 2010).
IL-1β was used to induce inflammation in BMMSCs. The results indicated that
osteoblast differentiation, alkaline phosphatase and calcium contents of IL-1β-treated
BMMSCs were significantly reduced at high doses of COX-2 inhibitors, compared to
the low-dose group. Meanwhile, ALP and calcium contents were not reduced by COX-
2 inhibitors in non-inflammatory condition. In addition, COX-2 inhibitor reduced the
levels of transcription factors such as runx2, Dlx5, and OCN, which are known to be
essential for osteogenesis. The levels of these transcription factors remain constant in
the non-inflammatory-conditioned MSCs. These data indicate that the osteogenic
potential of MSC is inhibited by the treatment of high-dose NSAIDs under
inflammatory conditions.
In a study by Pountos and colleagues, the in vitro effects of COX-1 and COX-2
inhibitors (diclofenac sodium, piroxicam, parecoxib, lornoxicam, meloxicam,
ketoprofen, and ketorolac) on BMMSCs were reported (Pountos et al., 2011). The
results indicated that at a broad range of concentrations (10-3
to 100 μg/ml), the
NSAIDs did not interfere with the MSCs potential to proliferate and differentiate into
osteogenic lineage, but affected the chondrogenic potential with a reduction in sulphated
glycosaminoglycans (sGAG) content.
38
2.13 Beneficial impact of ASA on stem cell and the potential application
The impact of ASA on stem cells properties has been reported in a number of
studies (Liu et al., 2011a; Liu et al., 2015b; Cao et al., 2015). Liu et al., (2011a)
reported that repairs in BMMSC-based calvarial bone defects in C57BL/6 mice was
enhanced by site-specific ASA treatment, and this was due to the suppression of tumor
necrosis factor alpha (TNF-α) and interferon gamma (IFN-γ) concentrations (and
action) at the implantation site (Liu et al., 2011a). They found that the TNF-α and IFN-
γ that are primarily produced by activated T cells, and these are capable of inducing
apoptosis and inhibiting the ability of MSCs to mediate bone repair.
Thus, the host immune system poses significant effects on the fate of
transplanted MSC during bone remodeling, where TNF-α and IFN-γ play a critical role
(Liu et al., 2011a). Another report also showed that the local administration of ASA
achieved MSC-based regenerative application through the repair of calvarial bone
defects in a mini swine model, and this was postulated to have been achieved through
the same mechanism as above, i.e., through the suppression of TNF- α and IFN-γ .
Observations from previous studies indicated that ASA showed a positive impact in
reducing human alveolar bone loss and improving periodontal status, leading to the
suggestion that ASA provides a favourable condition for periodontal tissue health.
However, it was also argued that due to the complexity of periodontitis
pathogenesis, it was unlikely that the inhibition of inflammation by NSAIDs was the
only factor which contributed to the observed clinical benefit (Heasman & Hughes,
2014). Liu et al. (2015b) reported that ASA treatment on stem cells from exfoliated
deciduous teeth (SHED) at low dosages (~55 and 277 μM) resulted in the activation of
39
telomerase reverse transcriptase (TERT) activity, which improved SHED osteogenesis
and immunomodulatory properties. The authors suggested that a low dose of ASA
therapy is a feasible and efficient pharmacologic approach to activate TERT activity in
stem cells, to improve stem cell functions, avoid replicative senescence, and achieve the
therapeutic effects of stem cells.
A recent study reported that administration of ASA and human umbilical cord
matrix-derived mesenchymal stem cells (hUCMs) reduced the effect of post-ischemic
brain injury in the rat induced by artificial stroke (Shams ara et al., 2015). Based on the
aforementioned observations, it could be hypothesized that ASA may have positively
affect growth factors gene expression in dental stem cells, leading to improvement in
periodontal status. Thus, investigating the effect of ASA on stem cells properties, such
as those sourced from PDLSCs is of relevance. There is not much data or studies that
have been done to investigate the effect of ASA on the viability and expression of
growth factor genes in PDLSCs. The outcome of this study could shed additional
insights on the impact of ASA on PDLSCs properties. This could provide novel data
that may be useful in the field of regenerative dentistry, particularly periodontal
regeneration.
40
CHAPTER 3: METHODOLOGY
3.1 Isolation and culturing human PDLSCs from periodontal ligament tissue
This study was approved by the Medical Ethics Committee, Faculty of Dentistry,
University of Malaya [Medical Ethics Clearance Number: DF CO1107/0066 (L)] and
with the informed consent of the patients. The PDLSCs were isolated from normal and
vital tooth. The donors were aged between 18 to 35 years old (n=3) and the teeth were
indicated for extraction for orthodontics treatment purposes. The PDLSCs were isolated
by using standard protocols with some modifications (Seo et al., 2004). The PDL
tissues were scraped off the root surface using a sterilized scalpel and minced into small
fragments prior to digestion in a solution of 1 mg/mL collagenase type I (Gibco, Grand
Island, NY) for 30 minutes at 37°C.
After neutralization with a 10% fetal bovine serum (FBS) (Gibco, Grand Island,
NY), the cells were centrifuged and seeded in T75 culture flasks (BD Pharmingen, San
Diego CA, USA) using a culture medium containing KO-DMEM, 10% FBS, 0.5% and
10000 µg/mL of penicillin/streptomycin (Invitrogen), 1% 1x Glutamax (Invitrogen),
and incubated at 37oC in the presence of 5% CO2. The medium was replaced every
three days until the cells reach 70-80% confluency
41
3.1.1 Basic characterization of periodontal ligament stem cells (PDLSCs)
3.1.1.1 Growth kinetics of PDLSCs
The growth curve of PDLSCs at passage 3 were analysed by plating them at T25
culture flasks with a cell density of 1 × 10³ cells/cm
2 (BD Pharmingen, San Diego CA,
USA) until they reached confluency. The cell number was determined through trypan
blue assay (Sigma Aldrich). The mean cell number was determined using three
independent samples in each experimental group and the results were expressed as mean
± standard deviation (SD).
3.1.1.2 Trilineage differentiation capacity
The cultures were initiated at a density of 1x10³ cells/cm
2 in 6-well plates
(Nunclon, Roskilde, Denmark) and were grown to confluence and subjected to
differentiation into adipogenic, chondrogenic, and osteogenic lineages. The adipogenic
induction media contained 10% FBS, 200 mmol/L indomethacin, 0.5 mmol/L 3-
isobutyl-1-methyxanthine (IBMX), 10 mg/mL insulin, and 1 mmol/L dexamethasone
(Sigma Aldrich). The lipid droplets formed by the cells were visualized through oil red
O staining (Sigma Aldrich).
For chondrogenic differentiation, the cells were cultured using media
supplemented with ITS+1 (Sigma Aldrich), 50 mmol/L L-ascorbic acid-2 phosphates
(Sigma Aldrich), 55 mmol/L sodium pyruvate (Invitrogen), 25 mmol/L L-proline
(Sigma Aldrich), and 10 ng/mL of transforming growth factor-β (TGF-β) (Sigma
Aldrich). The assessment of proteoglycan accumulation was achieved using alcian blue
staining (Sigma Aldrich).
42
Osteogenic differentiation was done by culturing the cells for 3 weeks using
osteogenic media supplemented with 10% FBS, 1% glutamax (Gibco), 100 nM
dexamethasone (Sigma Aldrich), 10 mmol/L β-glycerol phosphates (Sigma Aldrich),
and 0.2 mM of Ascorbic acid (Sigma Aldrich). Calcium accumulation was visualized
using 2% Alizarin Red S staining (Sigma Aldrich).
3.1.1.3 Flow cytometry
The PDLSCs were immunophenotyped through flow cytometry analysis. The
human MSC phenotyping kit (MACS MiltenyiBiotec, catalog #130-095-198) was used.
The following antibodies were used to mark the cell surface: epitopes-CD90-
phycoerythrin (PE), CD73-APC, CD105-PE and CD14-PerCP, CD20-PerCP, CD34-
PerCP, and CD45-PerCP. The PDLSCs were trypsinised using trypsin and the cell
numbers determined up to 1x10⁶ cells. Two aliquots were prepared for the 1x10
6 cells
and the cell suspension was centrifuged at 300xg for 10 minutes.
Each aliquot was resuspended in 100µL of buffer. 10 µL of the MSC
Phenotyping Cocktail was added to aliquot 1 and a similar amount of the Isotype
Control Cocktail was added to aliquot 2. Both aliquots were mixed well and incubated
for 10 minutes in the dark in the refrigerator at 2-8 °C. The cells were washed by adding
1-2 mL of buffer and centrifuged at 300×g for 10 minutes. The supernatant was
aspirated completely. The cell pellet was resuspended in a suitable amount of buffer for
analysis by flow cytometry and the results analyzed utilizing MACS QuantifyTM
software. The results were analyzed utilizing MACS QuantifyTM
software.
43
3.2 MTT cell proliferation assay
The proliferation of PDLSCs was assessed using a 3-(4,5-dimethylthiazohl-2-
yl)-2,5-diphenyltetrazolium bromide (MTT) (Chemicon, Milipore) assay. ASA (Sigma
Aldrich) was dissolved in ethanol to make a stock solution of 1M. The experimental
group was treated with ASA at 10, 100, 200, 500, 1,000, 6,000, 8,000, and 10, 000μM.
The PDLSCs were seeded at 3x10⁴ cells in a 96-well plate and incubated overnight at
37oC in 5% CO2 atmosphere.
The experimental group was treated at the required ASA concentrations for 24,
48, and 72 hours. The MTT solution was then added and the cells were further
incubated at 37◦C for 4 hours. The culture media was then removed and dimethyl
sulfoxide (DMSO) was added into each well. The absorbance was then measured at 575
nm. The cell viability was determined by calculating the ratio of optical density (OD)
values between the ASA-treated and vehicle-control cells.
3.3 Growth factors gene expression profiling utilizing RT2 PCR array
Gene expression profiling was done using the human growth factors RT2 PCR
array (Qiagen, catalog number PAHS-041Z). The array could profile 84 growth-factor
associated genes, associated to the following categories: angiogenic growth factors,
regulators of apoptosis, cell differentiation, and developmental regulators. The PDLSCs
were cultured for 24 hours in the absence (experimental control) or presence of 1000
μM ASA. Total RNA was then isolated using the RNA easy Mini kit (Qiagen) and then
cDNA amplification uses the SYBR green master mix PCR array kit (Qiagen). For PCR
array, the reaction mix was prepared by using the components listed below (Table 3.1).
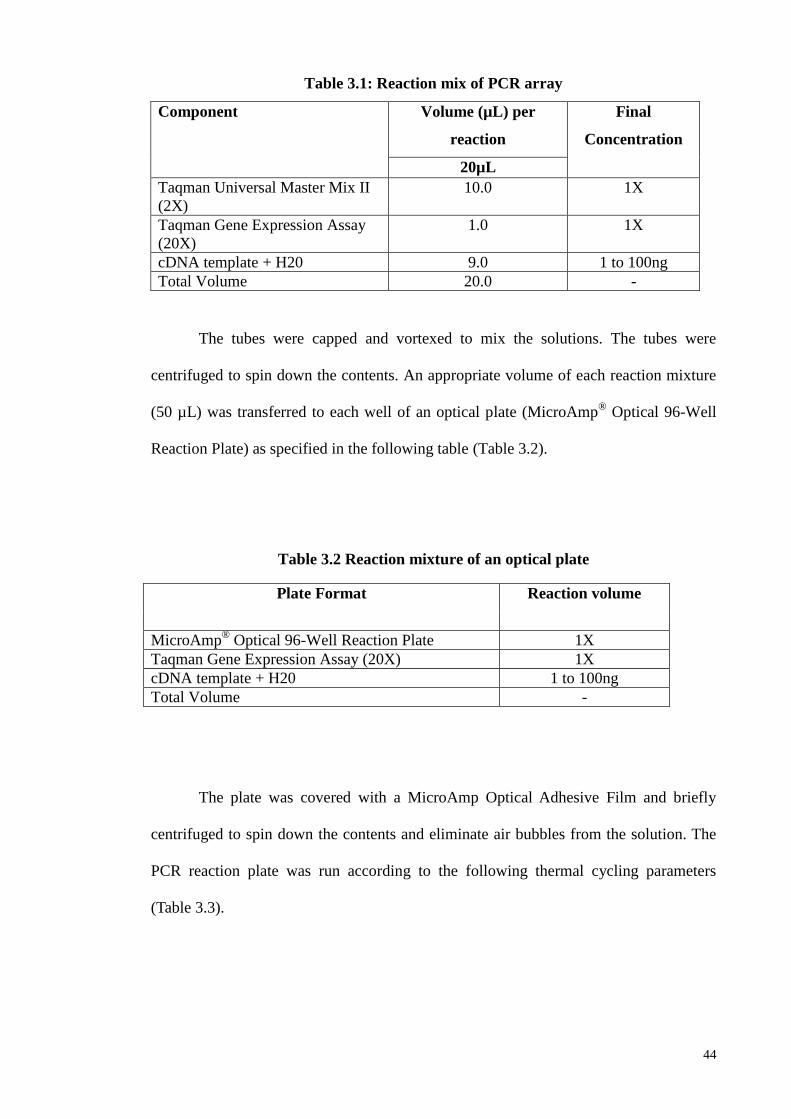
44
Table 3.1: Reaction mix of PCR array
Component Volume (µL) per
reaction
Final
Concentration
20µL
Taqman Universal Master Mix II
(2X)
10.0 1X
Taqman Gene Expression Assay
(20X)
1.0 1X
cDNA template + H20 9.0 1 to 100ng
Total Volume 20.0 -
The tubes were capped and vortexed to mix the solutions. The tubes were
centrifuged to spin down the contents. An appropriate volume of each reaction mixture
(50 µL) was transferred to each well of an optical plate (MicroAmp® Optical 96-Well
Reaction Plate) as specified in the following table (Table 3.2).
Table 3.2 Reaction mixture of an optical plate
The plate was covered with a MicroAmp Optical Adhesive Film and briefly
centrifuged to spin down the contents and eliminate air bubbles from the solution. The
PCR reaction plate was run according to the following thermal cycling parameters
(Table 3.3).
Plate Format Reaction volume
MicroAmp® Optical 96-Well Reaction Plate 1X
Taqman Gene Expression Assay (20X) 1X
cDNA template + H20 1 to 100ng
Total Volume -
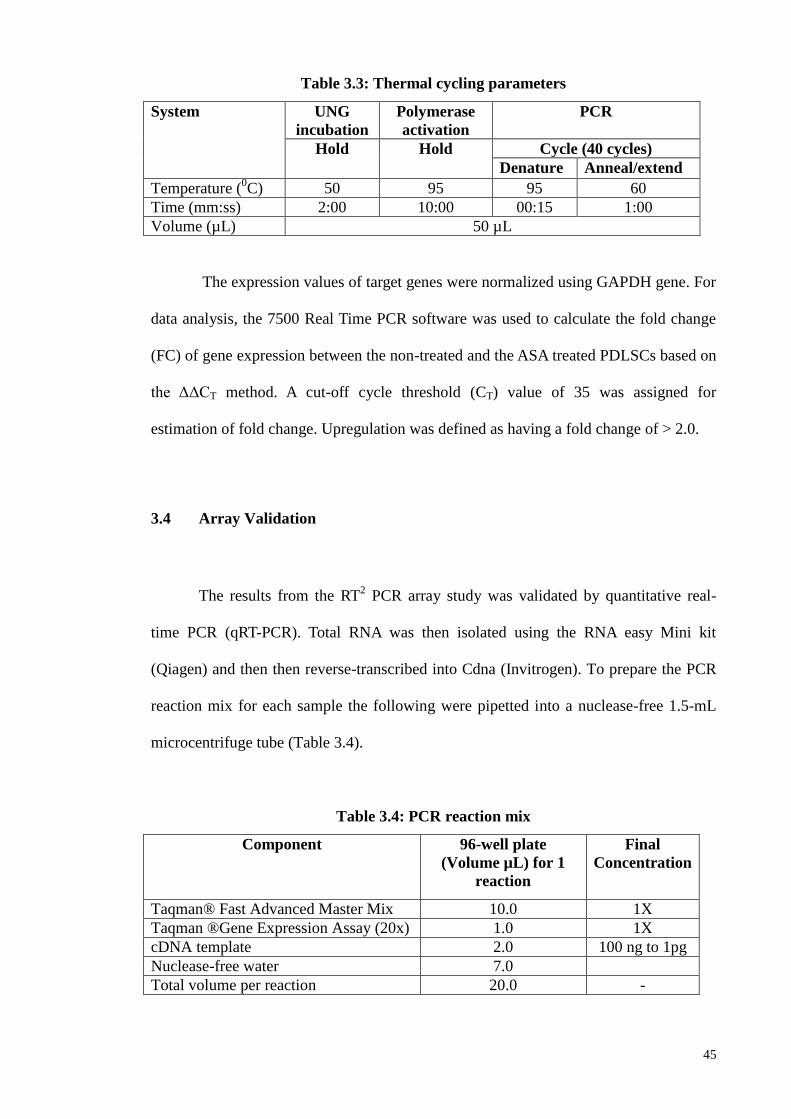
45
Table 3.3: Thermal cycling parameters
System UNG
incubation
Polymerase
activation
PCR
Hold
Hold Cycle (40 cycles)
Denature Anneal/extend
Temperature (0C) 50 95 95 60
Time (mm:ss) 2:00 10:00 00:15 1:00
Volume (µL) 50 µL
The expression values of target genes were normalized using GAPDH gene. For
data analysis, the 7500 Real Time PCR software was used to calculate the fold change
(FC) of gene expression between the non-treated and the ASA treated PDLSCs based on
the ΔΔCT method. A cut-off cycle threshold (CT) value of 35 was assigned for
estimation of fold change. Upregulation was defined as having a fold change of > 2.0.
3.4 Array Validation
The results from the RT2 PCR array study was validated by quantitative real-
time PCR (qRT-PCR). Total RNA was then isolated using the RNA easy Mini kit
(Qiagen) and then then reverse-transcribed into Cdna (Invitrogen). To prepare the PCR
reaction mix for each sample the following were pipetted into a nuclease-free 1.5-mL
microcentrifuge tube (Table 3.4).
Table 3.4: PCR reaction mix
Component 96-well plate
(Volume µL) for 1
reaction
Final
Concentration
Taqman® Fast Advanced Master Mix 10.0 1X
Taqman ®Gene Expression Assay (20x) 1.0 1X
cDNA template 2.0 100 ng to 1pg
Nuclease-free water 7.0
Total volume per reaction 20.0 -
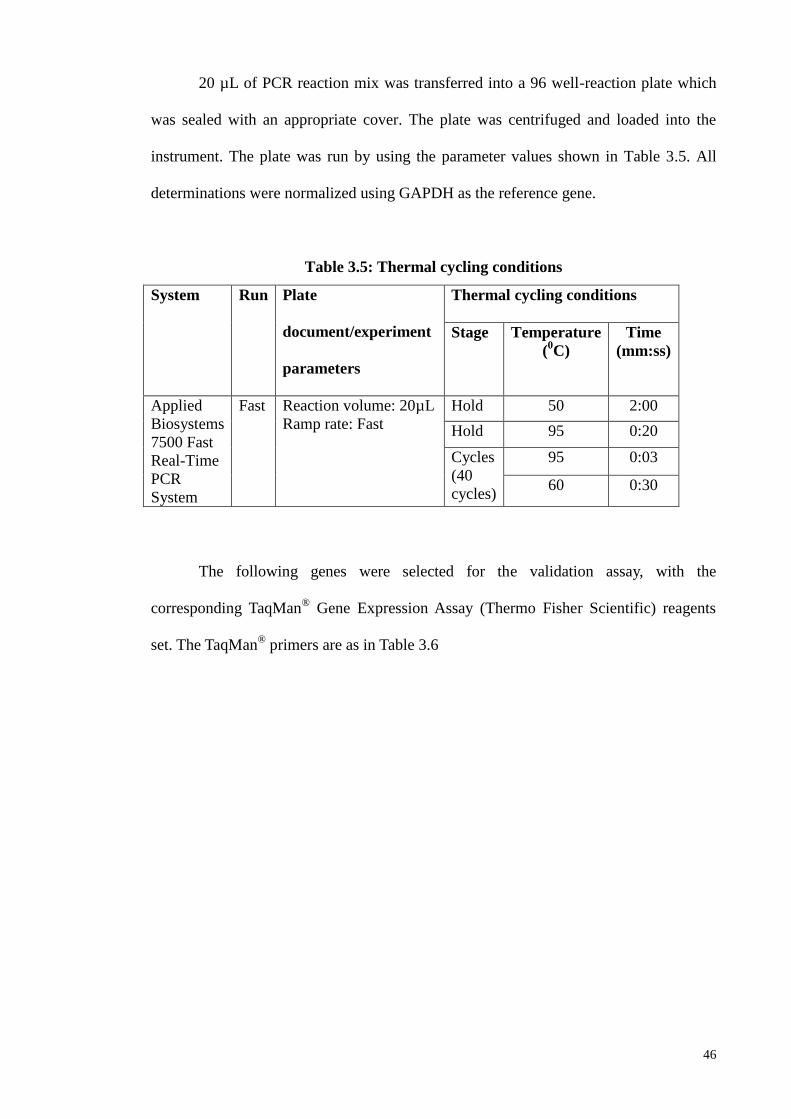
46
20 µL of PCR reaction mix was transferred into a 96 well-reaction plate which
was sealed with an appropriate cover. The plate was centrifuged and loaded into the
instrument. The plate was run by using the parameter values shown in Table 3.5. All
determinations were normalized using GAPDH as the reference gene.
Table 3.5: Thermal cycling conditions
System Run Plate
document/experiment
parameters
Thermal cycling conditions
Stage Temperature
(0C)
Time
(mm:ss)
Applied
Biosystems
7500 Fast
Real-Time
PCR
System
Fast Reaction volume: 20µL
Ramp rate: Fast
Hold 50 2:00
Hold 95 0:20
Cycles
(40
cycles)
95 0:03
60 0:30
The following genes were selected for the validation assay, with the
corresponding TaqMan®
Gene Expression Assay (Thermo Fisher Scientific) reagents
set. The TaqMan® primers are as in Table 3.6
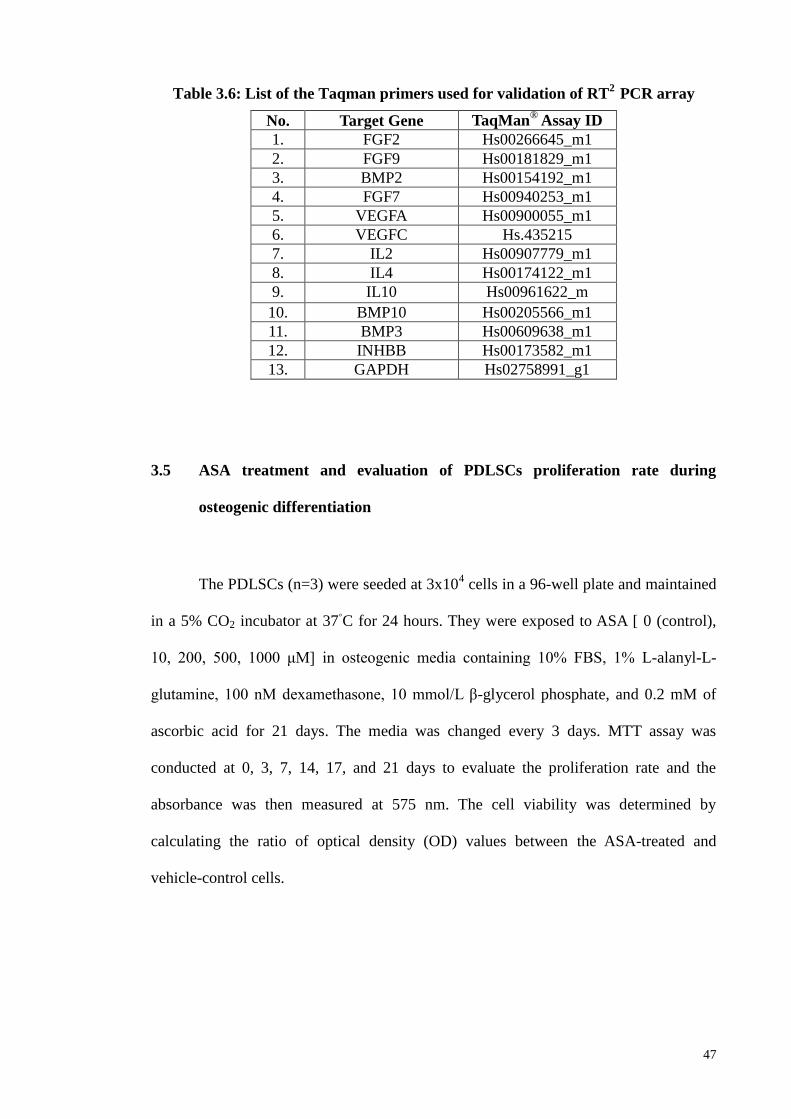
47
No. Target Gene TaqMan® Assay ID
1. FGF2 Hs00266645_m1
2. FGF9 Hs00181829_m1
3. BMP2 Hs00154192_m1
4. FGF7 Hs00940253_m1
5. VEGFA Hs00900055_m1
6. VEGFC Hs.435215
7. IL2 Hs00907779_m1
8. IL4 Hs00174122_m1
9. IL10 Hs00961622_m
10. BMP10 Hs00205566_m1
11. BMP3 Hs00609638_m1
12. INHBB Hs00173582_m1
13. GAPDH Hs02758991_g1
3.5 ASA treatment and evaluation of PDLSCs proliferation rate during
osteogenic differentiation
The PDLSCs (n=3) were seeded at 3x10⁴ cells in a 96-well plate and maintained
in a 5% CO2 incubator at 37◦C for 24 hours. They were exposed to ASA [ 0 (control),
10, 200, 500, 1000 μM] in osteogenic media containing 10% FBS, 1% L-alanyl-L-
glutamine, 100 nM dexamethasone, 10 mmol/L β-glycerol phosphate, and 0.2 mM of
ascorbic acid for 21 days. The media was changed every 3 days. MTT assay was
conducted at 0, 3, 7, 14, 17, and 21 days to evaluate the proliferation rate and the
absorbance was then measured at 575 nm. The cell viability was determined by
calculating the ratio of optical density (OD) values between the ASA-treated and
vehicle-control cells.
Table 3.6: List of the Taqman primers used for validation of RT2
PCR array
48
3.6 Effect of ASA on PDLSCs osteogenic potential
The PDLSCs (n=3) were seeded in a 6-well plate and maintained in 5% CO2
incubator at 37◦C until they reached 70 to 80% confluency. They were then exposed to
ASA [ 0 (control), 10, 200, 500, 1000 μM] in osteogenic media containing 10% FBS,
1% L-alanyl-L-glutamine, 100 nM dexamethasone, 10 mmol/L β-glycerol phosphate,
and 0.2 mM of ascorbic acid for 21 days.
The media was changed every 3 days. The mineralization assay was done to
evaluate the PDLCs osteogenic potential and the cells stained with 2% ARS at the
designated days (3, 7, 14, and 21 days). The Alizarin Red S positive area (ARSA) was
analyzed using image J software (developed by the National Institutes of Health, USA)
and the results presented as a percentage of ARSA over the total area of the image.
3.7 Microarray based gene expression profiling: effect of ASA on PDLSCs
during osteogenic differentiation
The PDLSCs were seeded in T75 culture flasks (BD Pharmingen) and
maintained in 5% CO2 incubator at 37◦C for 24 hours until they reached 70% to 80%
confluency. Then, the PDLSCs (n=4) were exposed to ASA [ 0 (control), 200, 500,
1000 μM] in osteogenic media containing 10% FBS, 1% L-alanyl-L-glutamine, 100 nM
dexamethasone, 10 mmol/L β-glycerol phosphate and 0.2 mM of ascorbic acid for 21
days. The media was changed every 3 days. Total RNA was extracted at day-21, using
the RNAeasy Mini kit (Qiagen). For RNA extraction, the cells numbers were
49
determined. The cells were transferred to an RNAase-free glass tube and centrifuged at
300 x g for 5 minutes. The supernatants were completely aspirated.
The cells were disrupted by adding 350 µL buffer RLT to an appropriate volume
and vortexed. The lysates were pipeted into a QIAshredder spin column placed in a 2 ml
collection tube and centrifuged for 2 minutes at full speed. One volume of 70% ethanol
was added to the homogenized lysate and mixed well by pipetting. Up to 700 µL of the
sample was transferred to an RNeasy spin column placed in a 2 ml collection tube and
centrifuged for 15a at ≥8000 x g (10,000 rpm). The flow-through was discarded.
700 µL Buffer RW1 was added to the RNeasy spin column and centrifuged for
15 s at ≥8000 x g (≥10,000 rpm) to wash the spin column membrane. The flow-through
was discarded. 500 µl Buffer RPE was added to the RNeasy spin column and
centrifuged for 15 s at ≥8000 x g (≥10,000 rpm) to wash the spin column membrane,
and the flow-through discarded. 500 µl Buffer RPE was added to the RNeasy spin
column and centrifuged for 2 minutes at≥8000 x g (≥10,000 rpm) to wash the spin
column membrane, and the flow-through discarded.
The RNeasy spin column was placed in a new 2 ml collection tube and the old
collection tube with the flow-through was discarded. The samples were centrifuged at
full speed for 1 minute. The RNeasy spin column was placed in a new 1.5 ml collection
tube and 30µl RNase-free water was added directly to the spin column membrane and
centrifuged for 1 min at ≥8000 x g (≥10,000 rpm) to elute the RNA. The quality of
RNA (A260/A280, A260/A230) was determined using Nanodrop spectrophotometer
ND-2000 (Thermo Scientific Inc.)
50
The RNA integrity number (RIN) was determined using Agilent Bioanalyzer
2100 (Agilent Technologies). The microarray assay was carried out using Agilent
SurePrint G3 Human GE v2 8x60K Microarrays (Agilent Technologies, catalog
number G4851B) according to the manufacturer's protocol. 100 ng of total RNA was
labeled with Low Input Quick Amp Labeling Kit, One color (Agilent Technologies)
following the manufacturer’s instruction. In this step, 100 ng of total RNA was
converted into double stranded cDNA by priming with an oligo-dT primer containing
the recognition site for T7 RNA polymerase. In vitro transcription with T7 RNA
polymerase was used to produce cyanine 3-CTP labeled cRNA.
Six hundred ng of labeled cRNA was hybridized onto Agilent SurePrint G3
Human GE 8X60K Microarray for 17 hours at 65◦C in hybridization oven (10 rpm).
After hybridization, the microarray slide was washed in gene expression wash buffer 1
for 1 minute at room temperature and another minute in gene expression wash buffer 2
at 37◦C before scanning the chip on Agilent High Resolution Microarray Scanner (C-
model). Raw signal data were extracted from TIFF image with Agilent Feature
Extraction Software (V10.7.1.1). Repeated measure test was used for statistical
analysis. Genes up or downregulated (p<0.05) by two-fold change (FC) were selected
for further analysis.
3.7.1 Gene ontology (GO) and functional enrichment analysis
The PANTHER (Protein Analysis Through Evolutionary Relationships)
classification system provides intuitive visualizations for GO analysis output and this
was used to classify the differentially expressed genes to facilitate data analysis. The
functional enrichment analyses were performed using DAVID functional annotation
51
clustering tool (Huang da et al., 2009) to ascertain the effect of ASA treatment at 200,
500, and 1,000 μM on the gene expression profile. The categories were filtered based
on the enrichment score with the lowest p-values. The threshold value of the enrichment
score was set at 1.6. DAVID generates an enrichment score for a group of genes
indicating the associations of annotation term members in a given experiment.
3.7.2 Functional Annotation and Pathway Analysis
Pathway enrichment analysis was performed using Qiagen’s Ingenuity Pathways
Analysis (IPA, Ingenuity Systems Inc.). The software determines the significance (p-
value) of a particular pathway being represented in the list of differentially expressed
genes by Fisher’s exact. IPA is also able to show the canonical pathway participated by
any of the dysregulated genes, the gene functions, and the potential gene network
interactions.
A dataset with gene identifiers and corresponding fold change values were
entered into IPA software. These molecules were overlaid onto a global molecular
network (contained in the Ingenuity Knowledge Base) during the analyses. Default
settings were used to perform the analyses. The functional analysis in IPA allows
determination of the biological functions and diseases associated with each network.
Since the data composition of Ingenuity Knowledge Base can change over time, the
results of the IPA analyses performed at different times may differ in the details
uncovered.
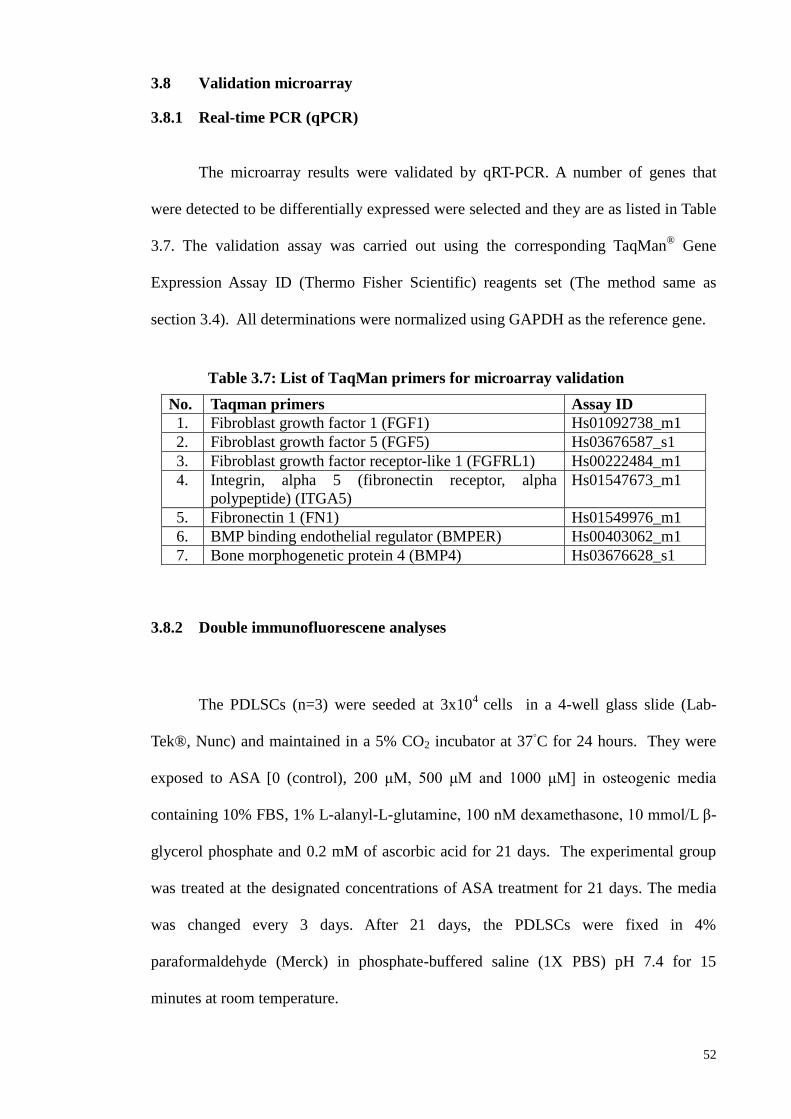
52
3.8 Validation microarray
3.8.1 Real-time PCR (qPCR)
The microarray results were validated by qRT-PCR. A number of genes that
were detected to be differentially expressed were selected and they are as listed in Table
3.7. The validation assay was carried out using the corresponding TaqMan® Gene
Expression Assay ID (Thermo Fisher Scientific) reagents set (The method same as
section 3.4). All determinations were normalized using GAPDH as the reference gene.
No. Taqman primers Assay ID
1. Fibroblast growth factor 1 (FGF1) Hs01092738_m1
2. Fibroblast growth factor 5 (FGF5) Hs03676587_s1
3. Fibroblast growth factor receptor-like 1 (FGFRL1) Hs00222484_m1
4. Integrin, alpha 5 (fibronectin receptor, alpha
polypeptide) (ITGA5)
Hs01547673_m1
5. Fibronectin 1 (FN1) Hs01549976_m1
6. BMP binding endothelial regulator (BMPER) Hs00403062_m1
7. Bone morphogenetic protein 4 (BMP4) Hs03676628_s1
3.8.2 Double immunofluorescene analyses
The PDLSCs (n=3) were seeded at 3x10⁴
cells in a 4-well glass slide (Lab-
Tek®, Nunc) and maintained in a 5% CO2 incubator at 37◦C for 24 hours. They were
exposed to ASA [0 (control), 200 μM, 500 μM and 1000 μM] in osteogenic media
containing 10% FBS, 1% L-alanyl-L-glutamine, 100 nM dexamethasone, 10 mmol/L β-
glycerol phosphate and 0.2 mM of ascorbic acid for 21 days. The experimental group
was treated at the designated concentrations of ASA treatment for 21 days. The media
was changed every 3 days. After 21 days, the PDLSCs were fixed in 4%
paraformaldehyde (Merck) in phosphate-buffered saline (1X PBS) pH 7.4 for 15
minutes at room temperature.
Table 3.7: List of TaqMan primers for microarray validation
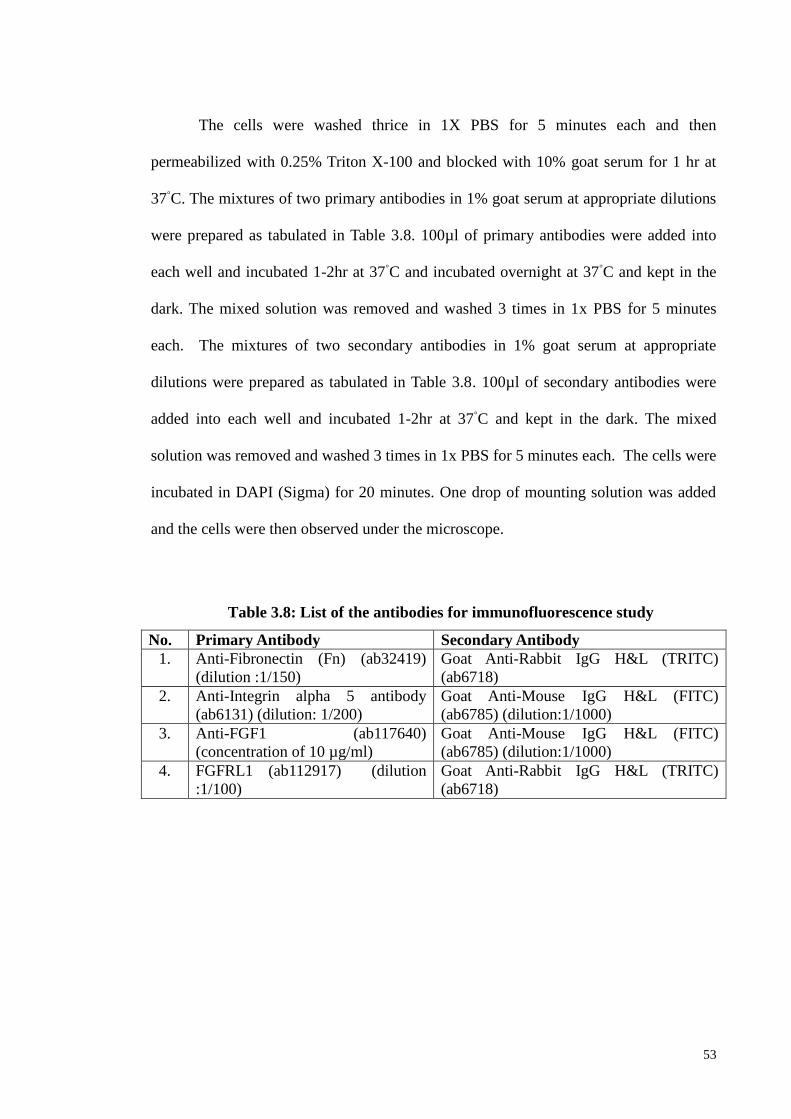
53
The cells were washed thrice in 1X PBS for 5 minutes each and then
permeabilized with 0.25% Triton X-100 and blocked with 10% goat serum for 1 hr at
37◦C. The mixtures of two primary antibodies in 1% goat serum at appropriate dilutions
were prepared as tabulated in Table 3.8. 100µl of primary antibodies were added into
each well and incubated 1-2hr at 37◦C and incubated overnight at 37
◦C and kept in the
dark. The mixed solution was removed and washed 3 times in 1x PBS for 5 minutes
each. The mixtures of two secondary antibodies in 1% goat serum at appropriate
dilutions were prepared as tabulated in Table 3.8. 100µl of secondary antibodies were
added into each well and incubated 1-2hr at 37◦C and kept in the dark. The mixed
solution was removed and washed 3 times in 1x PBS for 5 minutes each. The cells were
incubated in DAPI (Sigma) for 20 minutes. One drop of mounting solution was added
and the cells were then observed under the microscope.
No. Primary Antibody Secondary Antibody
1. Anti-Fibronectin (Fn) (ab32419)
(dilution :1/150)
Goat Anti-Rabbit IgG H&L (TRITC)
(ab6718)
2. Anti-Integrin alpha 5 antibody
(ab6131) (dilution: 1/200)
Goat Anti-Mouse IgG H&L (FITC)
(ab6785) (dilution:1/1000)
3. Anti-FGF1 (ab117640)
(concentration of 10 µg/ml)
Goat Anti-Mouse IgG H&L (FITC)
(ab6785) (dilution:1/1000)
4. FGFRL1 (ab112917) (dilution
:1/100)
Goat Anti-Rabbit IgG H&L (TRITC)
(ab6718)
Table 3.8: List of the antibodies for immunofluorescence study
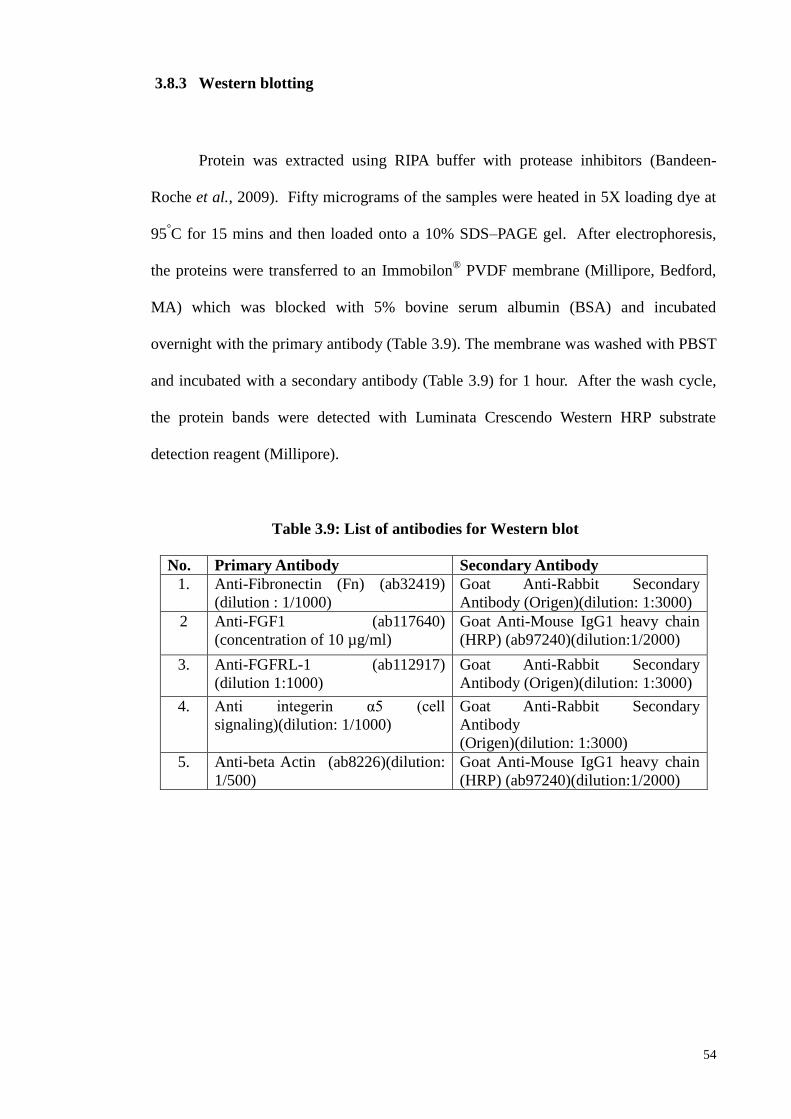
54
3.8.3 Western blotting
Protein was extracted using RIPA buffer with protease inhibitors (Bandeen-
Roche et al., 2009). Fifty micrograms of the samples were heated in 5X loading dye at
95°C for 15 mins and then loaded onto a 10% SDS–PAGE gel. After electrophoresis,
the proteins were transferred to an Immobilon® PVDF membrane (Millipore, Bedford,
MA) which was blocked with 5% bovine serum albumin (BSA) and incubated
overnight with the primary antibody (Table 3.9). The membrane was washed with PBST
and incubated with a secondary antibody (Table 3.9) for 1 hour. After the wash cycle,
the protein bands were detected with Luminata Crescendo Western HRP substrate
detection reagent (Millipore).
No. Primary Antibody Secondary Antibody
1. Anti-Fibronectin (Fn) (ab32419)
(dilution : 1/1000)
Goat Anti-Rabbit Secondary
Antibody (Origen)(dilution: 1:3000)
2 Anti-FGF1 (ab117640)
(concentration of 10 µg/ml)
Goat Anti-Mouse IgG1 heavy chain
(HRP) (ab97240)(dilution:1/2000)
3. Anti-FGFRL-1 (ab112917)
(dilution 1:1000) Goat Anti-Rabbit Secondary
Antibody (Origen)(dilution: 1:3000)
4. Anti integerin α5 (cell
signaling)(dilution: 1/1000)
Goat Anti-Rabbit Secondary
Antibody
(Origen)(dilution: 1:3000)
5. Anti-beta Actin (ab8226)(dilution:
1/500)
Goat Anti-Mouse IgG1 heavy chain
(HRP) (ab97240)(dilution:1/2000)
Table 3.9: List of antibodies for Western blot
55
3.9 Statistical Analysis
The results are presented as means ± standard deviations (SDs) of at least 3
replicates (n=3). Two-way ANOVA with Bonferroni post-test was performed using
software (Graphpad Software, San Diego CA) and p values of <0.05 were considered
significant. The PCR array data was analysed at Qiagen’s data analysis center
(http://pcrdataanalysis.sabiosciences.com/pcr/arrayanalysis.php). The p-values were
calculated based on a student’s t-test of the triplicate 2^ (-Delta Ct) (2 FC) values for
each gene in the control and treatment groups with p-values < 0.05 being considered
significant.
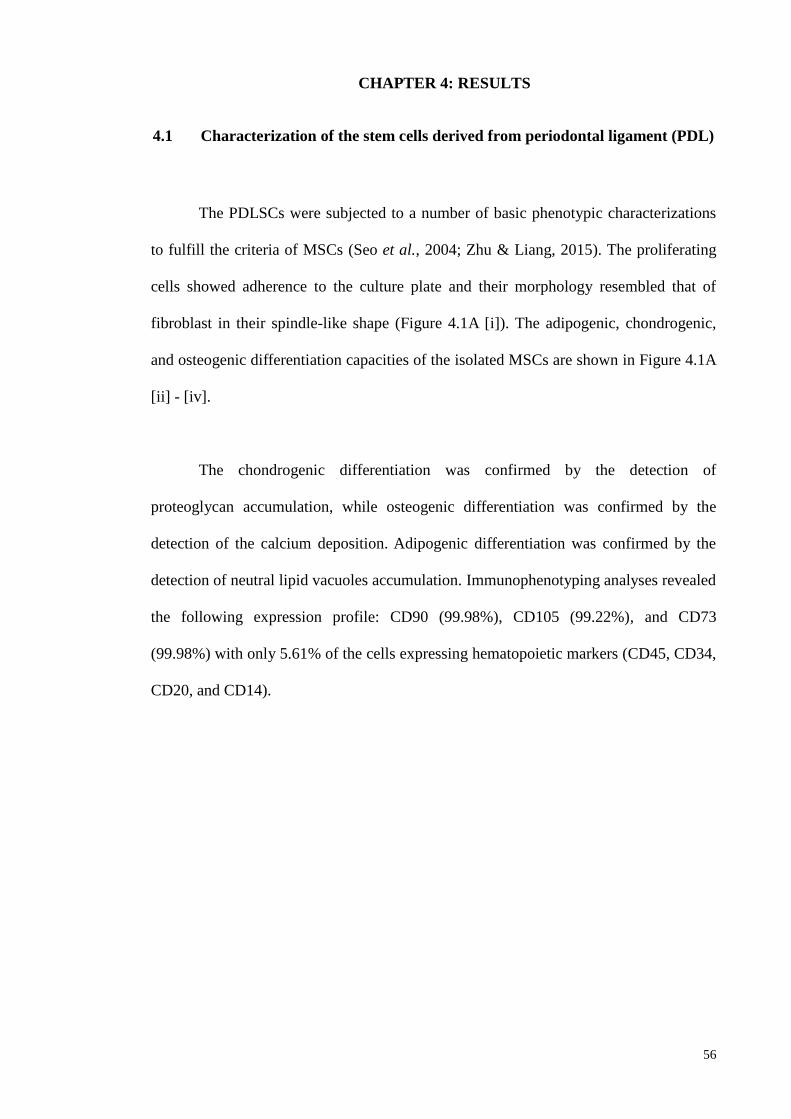
56
CHAPTER 4: RESULTS
4.1 Characterization of the stem cells derived from periodontal ligament (PDL)
The PDLSCs were subjected to a number of basic phenotypic characterizations
to fulfill the criteria of MSCs (Seo et al., 2004; Zhu & Liang, 2015). The proliferating
cells showed adherence to the culture plate and their morphology resembled that of
fibroblast in their spindle-like shape (Figure 4.1A [i]). The adipogenic, chondrogenic,
and osteogenic differentiation capacities of the isolated MSCs are shown in Figure 4.1A
[ii] - [iv].
The chondrogenic differentiation was confirmed by the detection of
proteoglycan accumulation, while osteogenic differentiation was confirmed by the
detection of the calcium deposition. Adipogenic differentiation was confirmed by the
detection of neutral lipid vacuoles accumulation. Immunophenotyping analyses revealed
the following expression profile: CD90 (99.98%), CD105 (99.22%), and CD73
(99.98%) with only 5.61% of the cells expressing hematopoietic markers (CD45, CD34,
CD20, and CD14).
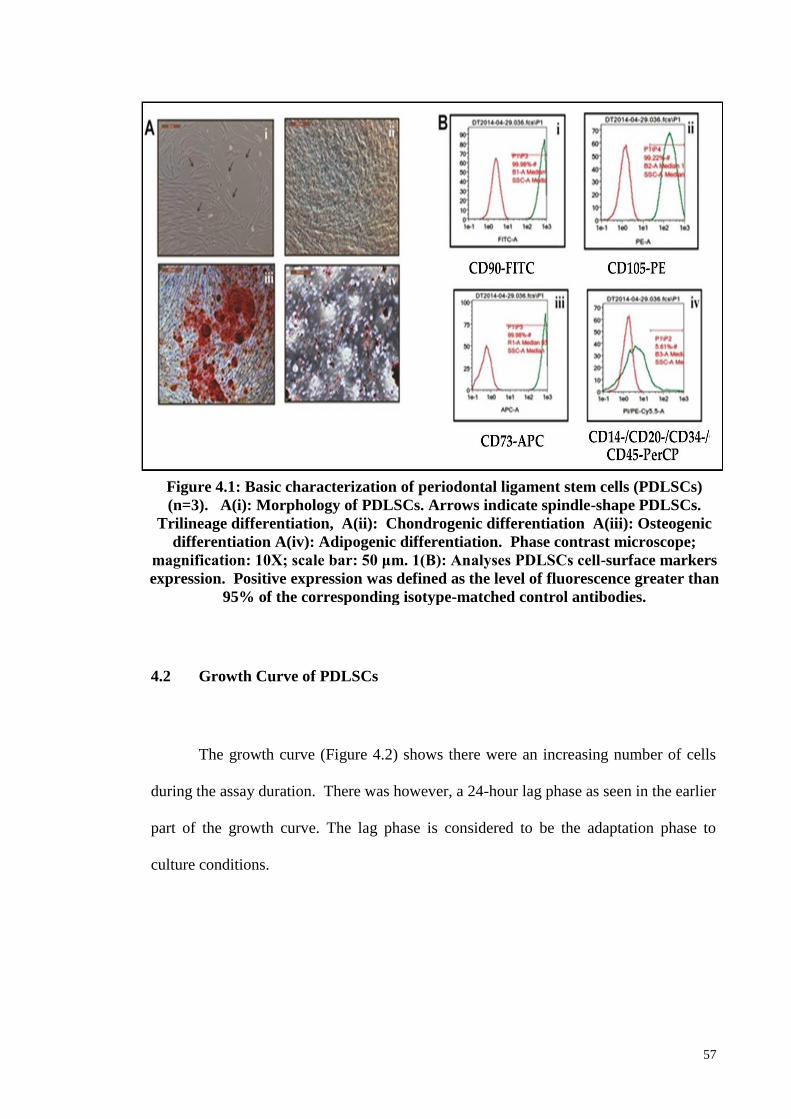
57
4.2 Growth Curve of PDLSCs
The growth curve (Figure 4.2) shows there were an increasing number of cells
during the assay duration. There was however, a 24-hour lag phase as seen in the earlier
part of the growth curve. The lag phase is considered to be the adaptation phase to
culture conditions.
Figure 4.1: Basic characterization of periodontal ligament stem cells (PDLSCs)
(n=3). A(i): Morphology of PDLSCs. Arrows indicate spindle-shape PDLSCs.
Trilineage differentiation, A(ii): Chondrogenic differentiation A(iii): Osteogenic
differentiation A(iv): Adipogenic differentiation. Phase contrast microscope;
magnification: 10X; scale bar: 50 μm. 1(B): Analyses PDLSCs cell-surface markers
expression. Positive expression was defined as the level of fluorescence greater than
95% of the corresponding isotype-matched control antibodies.
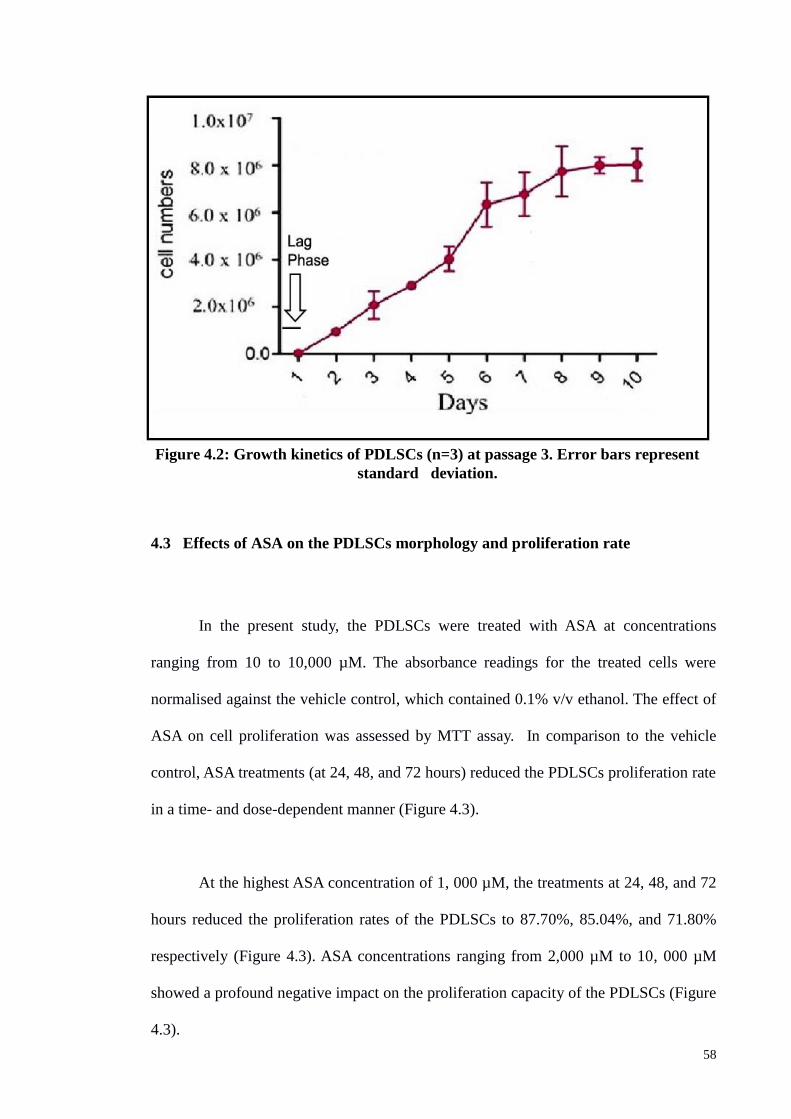
58
4.3 Effects of ASA on the PDLSCs morphology and proliferation rate
In the present study, the PDLSCs were treated with ASA at concentrations
ranging from 10 to 10,000 µM. The absorbance readings for the treated cells were
normalised against the vehicle control, which contained 0.1% v/v ethanol. The effect of
ASA on cell proliferation was assessed by MTT assay. In comparison to the vehicle
control, ASA treatments (at 24, 48, and 72 hours) reduced the PDLSCs proliferation rate
in a time- and dose-dependent manner (Figure 4.3).
At the highest ASA concentration of 1, 000 µM, the treatments at 24, 48, and 72
hours reduced the proliferation rates of the PDLSCs to 87.70%, 85.04%, and 71.80%
respectively (Figure 4.3). ASA concentrations ranging from 2,000 µM to 10, 000 µM
showed a profound negative impact on the proliferation capacity of the PDLSCs (Figure
4.3).
Figure 4.2: Growth kinetics of PDLSCs (n=3) at passage 3. Error bars represent
standard deviation.
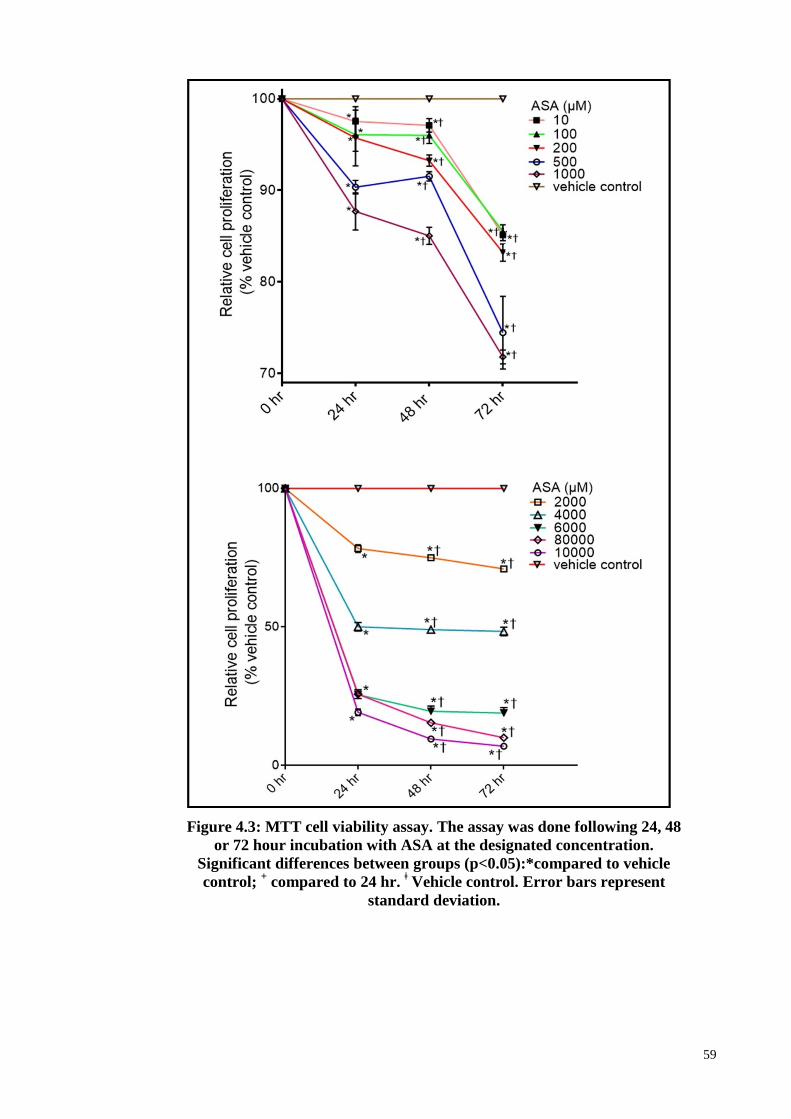
59
Figure 4.3: MTT cell viability assay. The assay was done following 24, 48
or 72 hour incubation with ASA at the designated concentration.
Significant differences between groups (p<0.05):*compared to vehicle
control; + compared to 24 hr.
ǂ Vehicle control. Error bars represent
standard deviation.
60
4.4 The effect of ASA on the expression of growth factors-associated genes in
PDLSC
The result for the expression analysis of the 84 growth-factor associated genes
using the human growth factors RT2 PCR array is shown in Table 4.1. Using a 2.0-fold-
change as a threshold value, 19 genes were found to be differentially expressed, of
which 12 were upregulated and 7 downregulated (Table 4.1). The following 35 genes
showed very high Ct values (Ct > 35) in the treated and untreated cells, suggesting that
they were expressed only at very low/background levels: BMP3, BMP8B, CLC, CSF2,
CSF3, EREG, FGF11, FGF13, FGF14, FGF17, FGF22, FGF6, GDF10, GDF11, IGF2,
IL11, IL1A, IL1B, INHBA, JAG2, LEFTY1, LEFTY2, LTBP4, MDK, NDP, NRG2,
NRG3, NRTN, OSGIN1, PSPN, SLCO1A2, SPP1, TDGF1, THPO and TYMP.
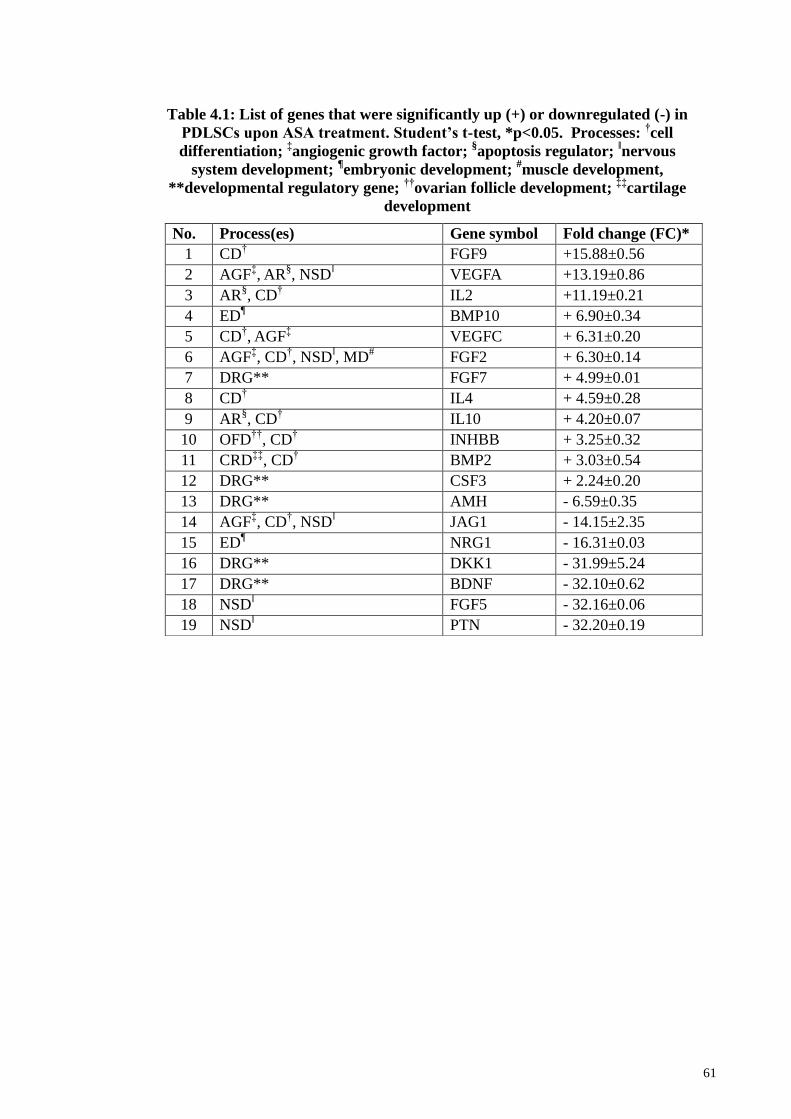
61
Table 4.1: List of genes that were significantly up (+) or downregulated (-) in
PDLSCs upon ASA treatment. Student’s t-test, *p<0.05. Processes: †cell
differentiation; ‡angiogenic growth factor;
§apoptosis regulator;
ǁnervous
system development; ¶embryonic development;
#muscle development,
**developmental regulatory gene; ††
ovarian follicle development; ‡‡
cartilage
development
No. Process(es) Gene symbol Fold change (FC)*
1 CD† FGF9 +15.88±0.56
2 AGFffi, AR
§, NSD
ǁ VEGFA +13.19±0.86
3 AR§, CD
† IL2 +11.19±0.21
4 ED¶ BMP10 + 6.90±0.34
5 CD†, AGF
ffi VEGFC + 6.31±0.20
6 AGFffi, CD
†, NSD
ǁ, MD
# FGF2 + 6.30±0.14
7 DRG** FGF7 + 4.99±0.01
8 CD† IL4 + 4.59±0.28
9 AR§, CD
† IL10 + 4.20±0.07
10 OFD††
, CD† INHBB + 3.25±0.32
11 CRDffiffi
, CD† BMP2 + 3.03±0.54
12 DRG** CSF3 + 2.24±0.20
13 DRG** AMH - 6.59±0.35
14 AGFffi, CD
†, NSD
ǁ JAG1 - 14.15±2.35
15 ED¶ NRG1 - 16.31±0.03
16 DRG** DKK1 - 31.99±5.24
17 DRG** BDNF - 32.10±0.62
18 NSDǁ FGF5 - 32.16±0.06
19 NSDǁ PTN - 32.20±0.19
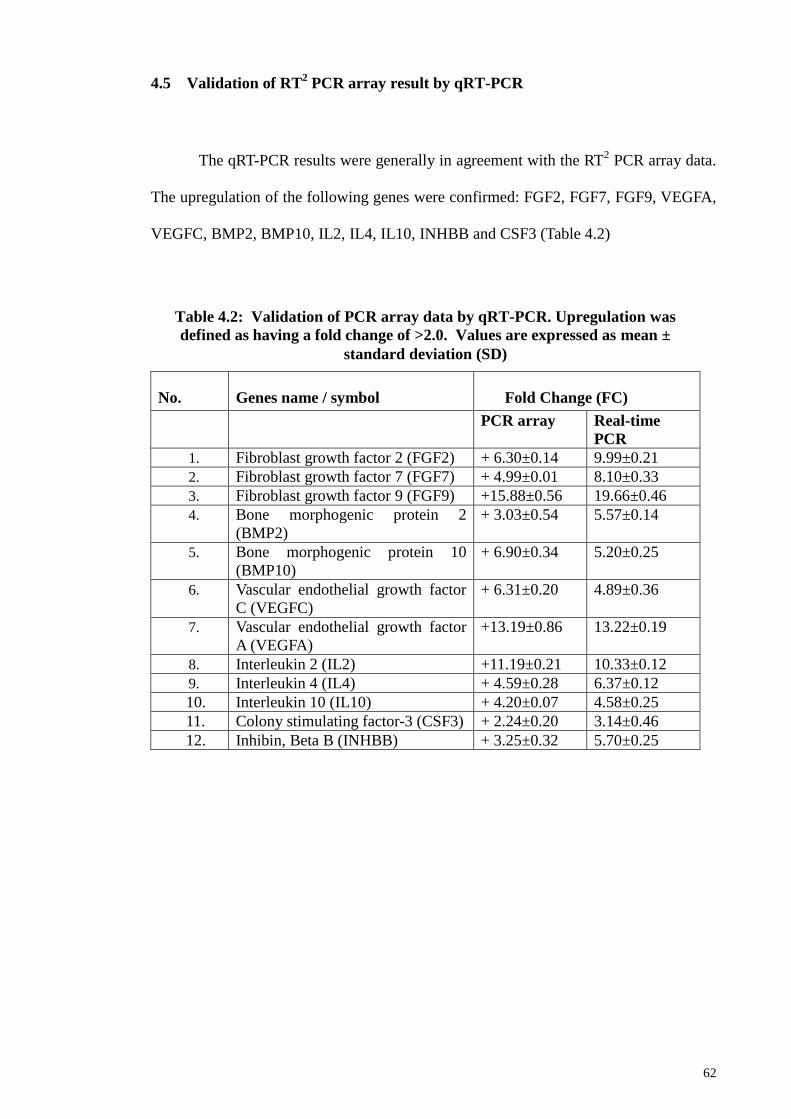
62
4.5 Validation of RT2 PCR array result by qRT-PCR
The qRT-PCR results were generally in agreement with the RT2 PCR array data.
The upregulation of the following genes were confirmed: FGF2, FGF7, FGF9, VEGFA,
VEGFC, BMP2, BMP10, IL2, IL4, IL10, INHBB and CSF3 (Table 4.2)
.
No. Genes name / symbol Fold Change (FC)
PCR array Real-time
PCR
1. Fibroblast growth factor 2 (FGF2) + 6.30±0.14 9.99±0.21
2. Fibroblast growth factor 7 (FGF7) + 4.99±0.01 8.10±0.33
3. Fibroblast growth factor 9 (FGF9) +15.88±0.56 19.66±0.46
4. Bone morphogenic protein 2
(BMP2)
+ 3.03±0.54 5.57±0.14
5. Bone morphogenic protein 10
(BMP10)
+ 6.90±0.34 5.20±0.25
6. Vascular endothelial growth factor
C (VEGFC)
+ 6.31±0.20 4.89±0.36
7. Vascular endothelial growth factor
A (VEGFA)
+13.19±0.86 13.22±0.19
8. Interleukin 2 (IL2) +11.19±0.21 10.33±0.12
9. Interleukin 4 (IL4) + 4.59±0.28 6.37±0.12
10. Interleukin 10 (IL10) + 4.20±0.07 4.58±0.25
11. Colony stimulating factor-3 (CSF3) + 2.24±0.20 3.14±0.46
12. Inhibin, Beta B (INHBB) + 3.25±0.32 5.70±0.25
Table 4.2: Validation of PCR array data by qRT-PCR. Upregulation was
defined as having a fold change of >2.0. Values are expressed as mean ±
standard deviation (SD)
63
4.6 Ingenuity Pathway Analyses (IPA)
The Ingenuity Pathway Analysis was used to identify the plausible association
between the upregulated genes with biological functions and canonical pathways to gain
insights on the biological effects of ASA on the PDLSCs function. Figures 4.4 (A) and
4.4 (B) show the top 15 significantly regulated biological functions and canonical
pathways respectively upon exposure of PDLSCs to 1,000µM of ASA.
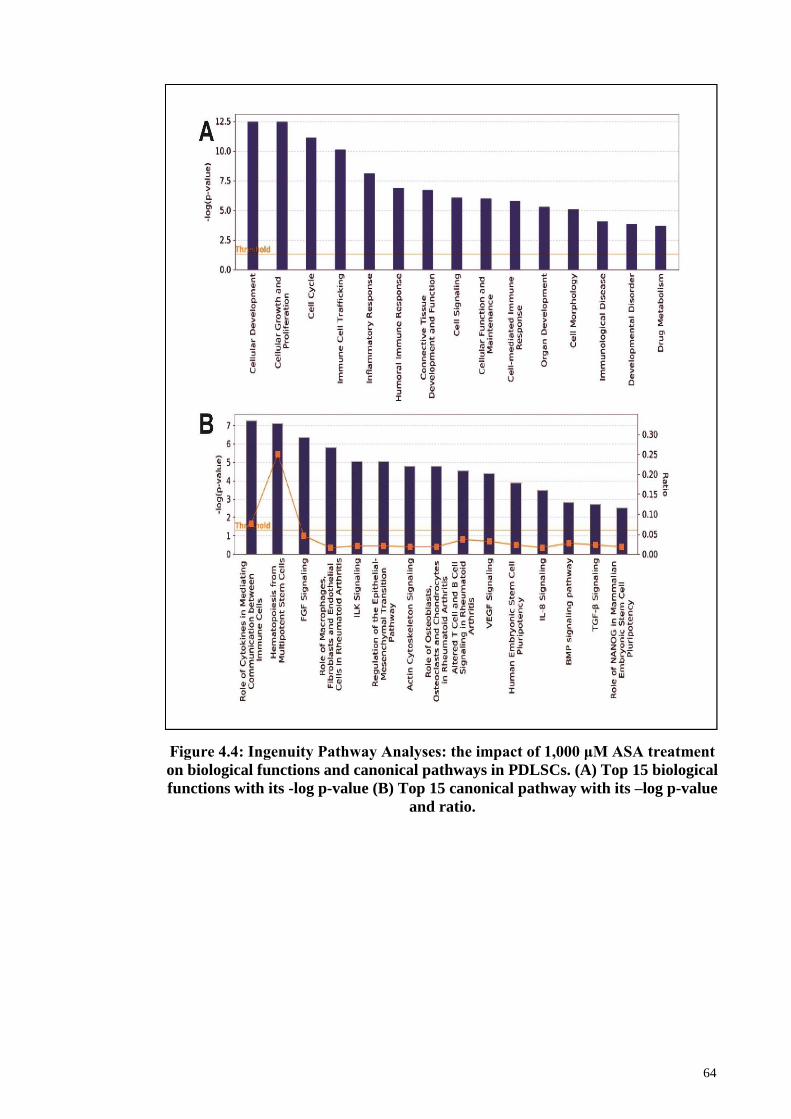
64
Figure 4.4: Ingenuity Pathway Analyses: the impact of 1,000 μM ASA treatment
on biological functions and canonical pathways in PDLSCs. (A) Top 15 biological
functions with its -log p-value (B) Top 15 canonical pathway with its –log p-value
and ratio.
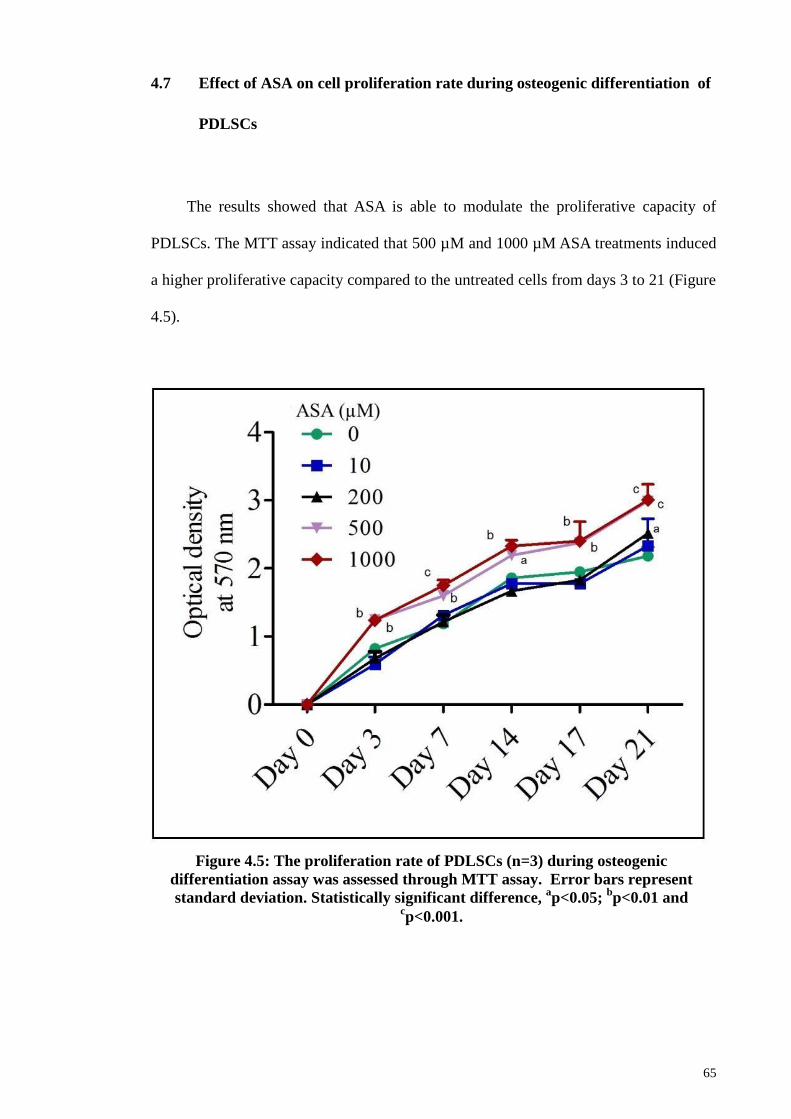
65
4.7 Effect of ASA on cell proliferation rate during osteogenic differentiation of
PDLSCs
The results showed that ASA is able to modulate the proliferative capacity of
PDLSCs. The MTT assay indicated that 500 µM and 1000 µM ASA treatments induced
a higher proliferative capacity compared to the untreated cells from days 3 to 21 (Figure
4.5).
Figure 4.5: The proliferation rate of PDLSCs (n=3) during osteogenic
differentiation assay was assessed through MTT assay. Error bars represent
standard deviation. Statistically significant difference, ap<0.05;
bp<0.01 and
cp<0.001.
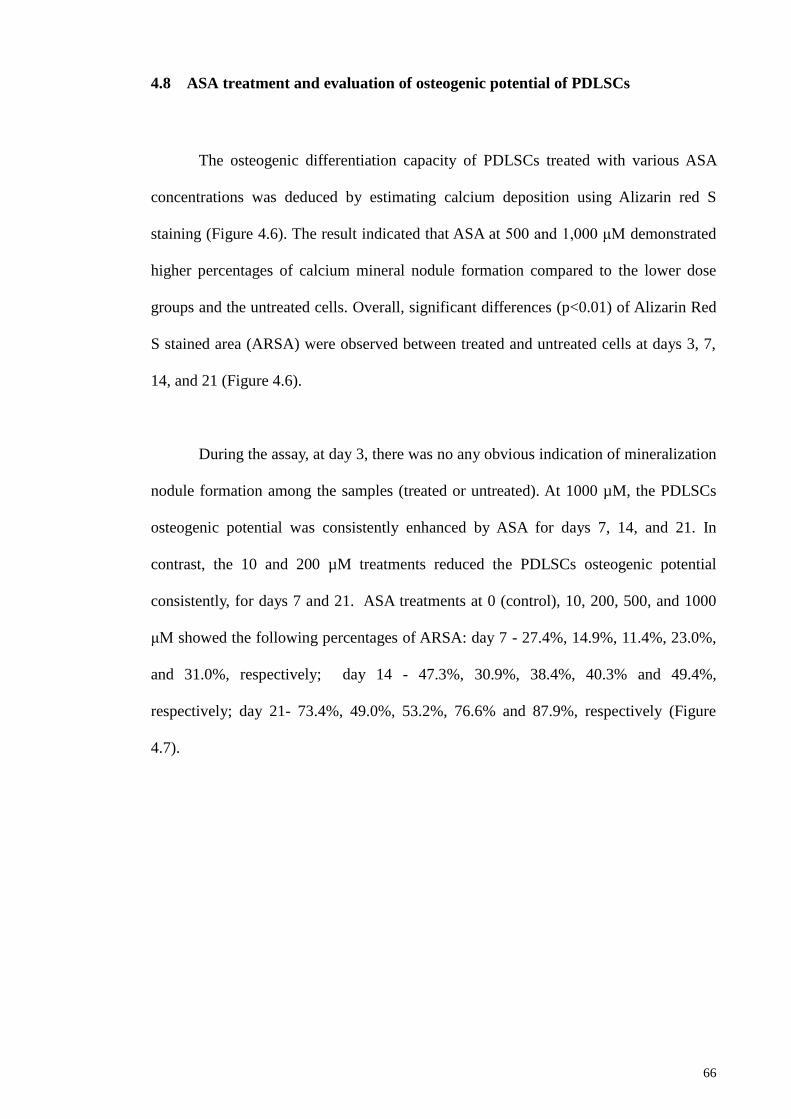
66
4.8 ASA treatment and evaluation of osteogenic potential of PDLSCs
The osteogenic differentiation capacity of PDLSCs treated with various ASA
concentrations was deduced by estimating calcium deposition using Alizarin red S
staining (Figure 4.6). The result indicated that ASA at 500 and 1,000 μM demonstrated
higher percentages of calcium mineral nodule formation compared to the lower dose
groups and the untreated cells. Overall, significant differences (p<0.01) of Alizarin Red
S stained area (ARSA) were observed between treated and untreated cells at days 3, 7,
14, and 21 (Figure 4.6).
During the assay, at day 3, there was no any obvious indication of mineralization
nodule formation among the samples (treated or untreated). At 1000 µM, the PDLSCs
osteogenic potential was consistently enhanced by ASA for days 7, 14, and 21. In
contrast, the 10 and 200 µM treatments reduced the PDLSCs osteogenic potential
consistently, for days 7 and 21. ASA treatments at 0 (control), 10, 200, 500, and 1000
μM showed the following percentages of ARSA: day 7 - 27.4%, 14.9%, 11.4%, 23.0%,
and 31.0%, respectively; day 14 - 47.3%, 30.9%, 38.4%, 40.3% and 49.4%,
respectively; day 21- 73.4%, 49.0%, 53.2%, 76.6% and 87.9%, respectively (Figure
4.7).
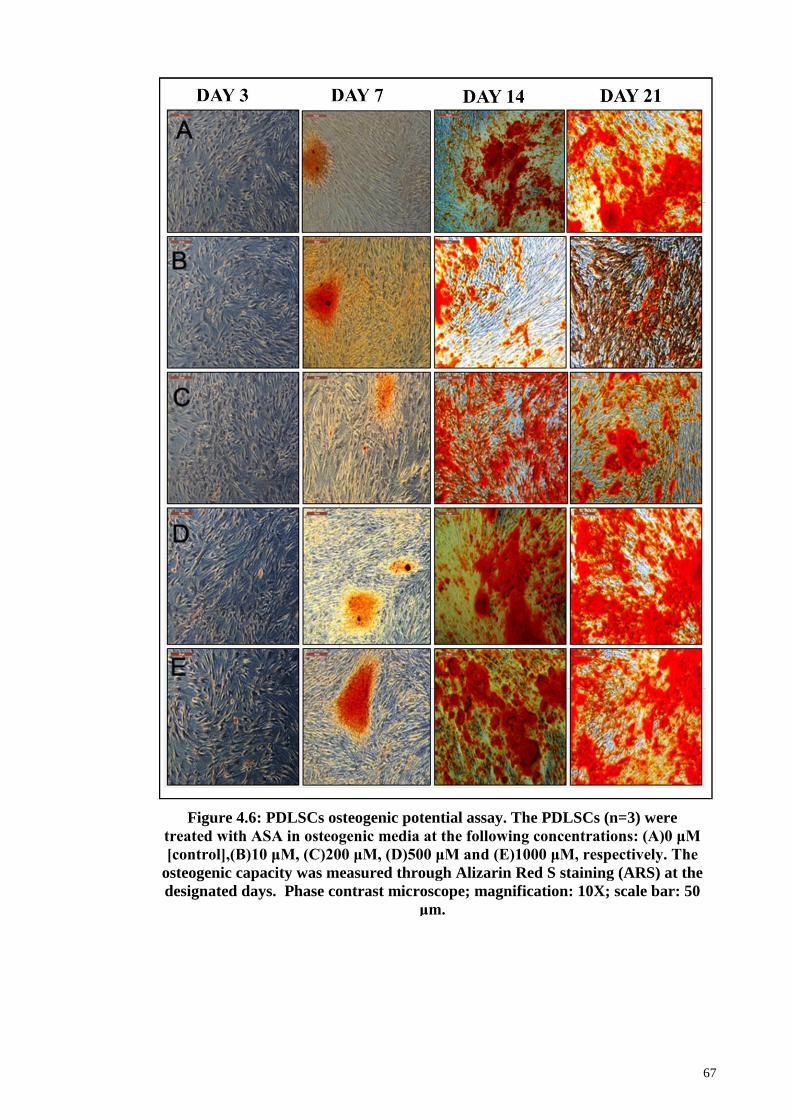
67
Figure 4.6: PDLSCs osteogenic potential assay. The PDLSCs (n=3) were
treated with ASA in osteogenic media at the following concentrations: (A)0 μM
[control],(B)10 μM, (C)200 μM, (D)500 μM and (E)1000 μM, respectively. The
osteogenic capacity was measured through Alizarin Red S staining (ARS) at the
designated days. Phase contrast microscope; magnification: 10X; scale bar: 50
μm.
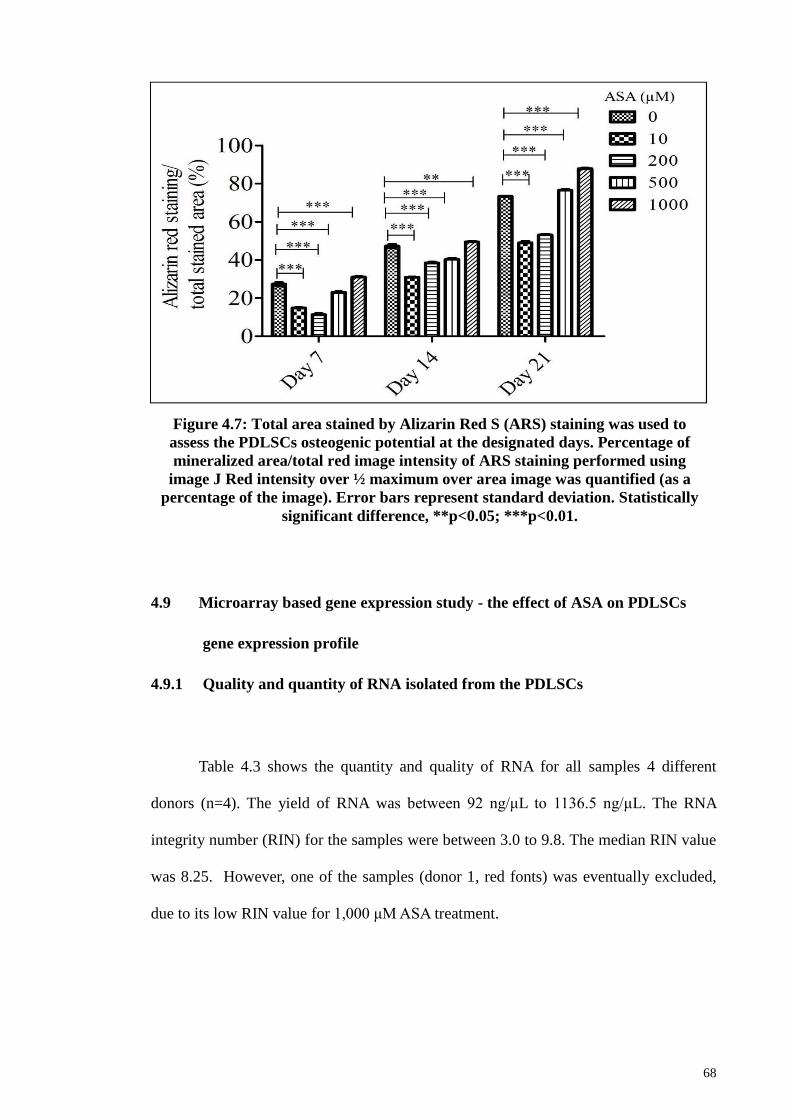
68
4.9 Microarray based gene expression study - the effect of ASA on PDLSCs
gene expression profile
4.9.1 Quality and quantity of RNA isolated from the PDLSCs
Table 4.3 shows the quantity and quality of RNA for all samples 4 different
donors (n=4). The yield of RNA was between 92 ng/μL to 1136.5 ng/μL. The RNA
integrity number (RIN) for the samples were between 3.0 to 9.8. The median RIN value
was 8.25. However, one of the samples (donor 1, red fonts) was eventually excluded,
due to its low RIN value for 1,000 μM ASA treatment.
Figure 4.7: Total area stained by Alizarin Red S (ARS) staining was used to
assess the PDLSCs osteogenic potential at the designated days. Percentage of
mineralized area/total red image intensity of ARS staining performed using
image J Red intensity over ½ maximum over area image was quantified (as a
percentage of the image). Error bars represent standard deviation. Statistically
significant difference, **p<0.05; ***p<0.01.
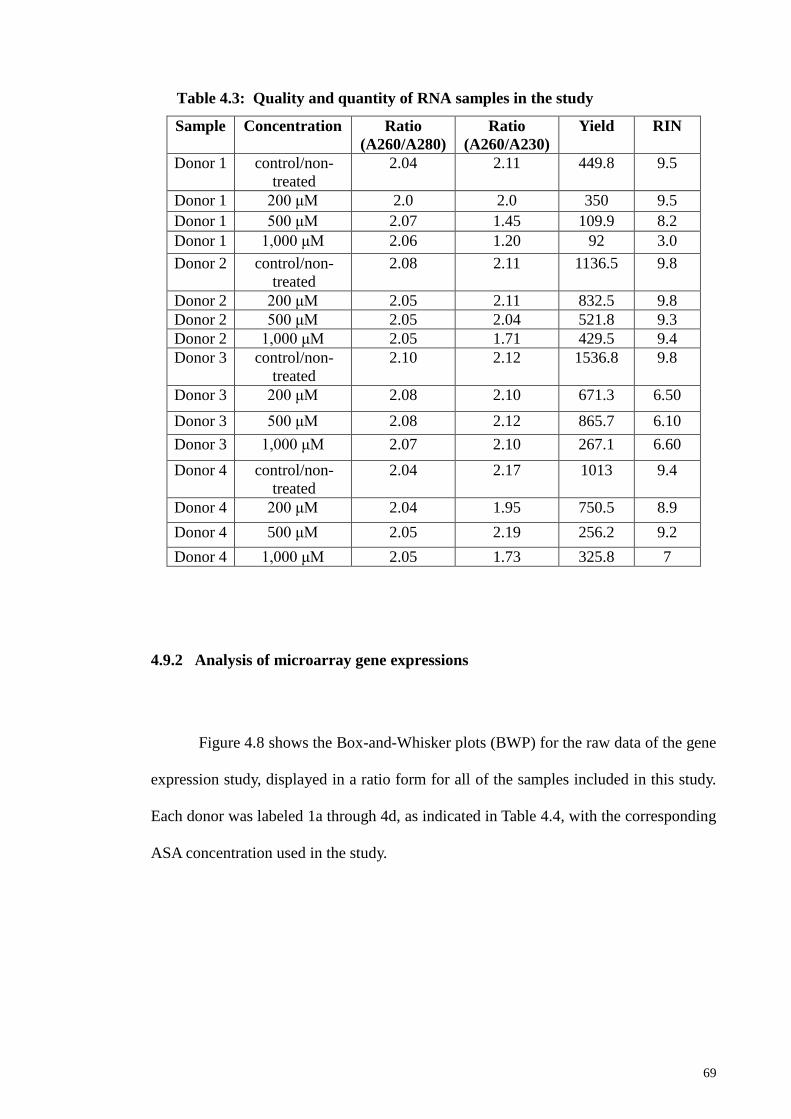
69
Sample Concentration Ratio
(A260/A280)
Ratio
(A260/A230)
Yield RIN
Donor 1 control/non-
treated
2.04 2.11 449.8 9.5
Donor 1 200 μM 2.0 2.0 350 9.5
Donor 1 500 μM 2.07 1.45 109.9 8.2
Donor 1 1,000 μM 2.06 1.20 92 3.0
Donor 2 control/non-
treated
2.08 2.11 1136.5 9.8
Donor 2 200 μM 2.05 2.11 832.5 9.8
Donor 2 500 μM 2.05 2.04 521.8 9.3
Donor 2 1,000 μM 2.05 1.71 429.5 9.4
Donor 3 control/non-
treated
2.10 2.12 1536.8 9.8
Donor 3 200 μM 2.08 2.10 671.3 6.50
Donor 3 500 μM 2.08 2.12 865.7 6.10
Donor 3 1,000 μM 2.07 2.10 267.1 6.60
Donor 4 control/non-
treated
2.04 2.17 1013 9.4
Donor 4 200 μM 2.04 1.95 750.5 8.9
Donor 4 500 μM 2.05 2.19 256.2 9.2
Donor 4 1,000 μM 2.05 1.73 325.8 7
4.9.2 Analysis of microarray gene expressions
Figure 4.8 shows the Box-and-Whisker plots (BWP) for the raw data of the gene
expression study, displayed in a ratio form for all of the samples included in this study.
Each donor was labeled 1a through 4d, as indicated in Table 4.4, with the corresponding
ASA concentration used in the study.
Table 4.3: Quality and quantity of RNA samples in the study
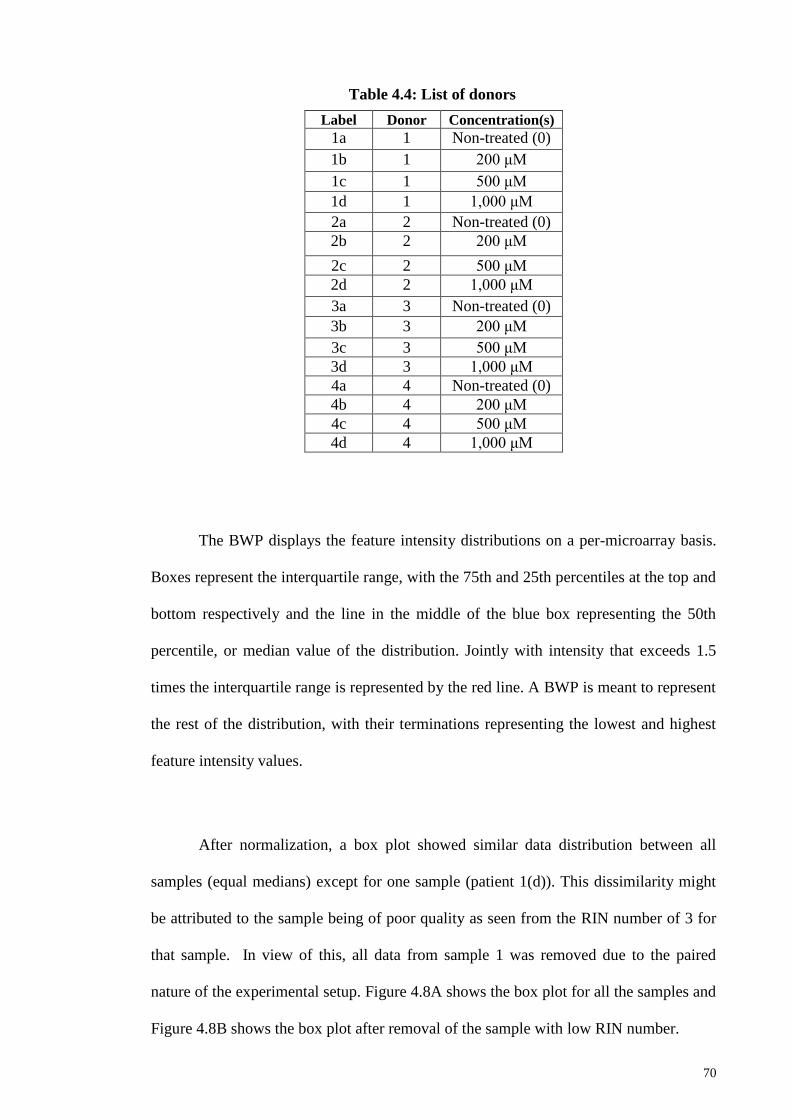
70
Label Donor Concentration(s)
1a 1 Non-treated (0)
1b 1 200 μM
1c 1 500 μM
1d 1 1,000 μM
2a 2 Non-treated (0)
2b 2 200 μM
2c 2 500 μM
2d 2 1,000 μM
3a 3 Non-treated (0)
3b 3 200 μM
3c 3 500 μM
3d 3 1,000 μM
4a 4 Non-treated (0)
4b 4 200 μM
4c 4 500 μM
4d 4 1,000 μM
The BWP displays the feature intensity distributions on a per-microarray basis.
Boxes represent the interquartile range, with the 75th and 25th percentiles at the top and
bottom respectively and the line in the middle of the blue box representing the 50th
percentile, or median value of the distribution. Jointly with intensity that exceeds 1.5
times the interquartile range is represented by the red line. A BWP is meant to represent
the rest of the distribution, with their terminations representing the lowest and highest
feature intensity values.
After normalization, a box plot showed similar data distribution between all
samples (equal medians) except for one sample (patient 1(d)). This dissimilarity might
be attributed to the sample being of poor quality as seen from the RIN number of 3 for
that sample. In view of this, all data from sample 1 was removed due to the paired
nature of the experimental setup. Figure 4.8A shows the box plot for all the samples and
Figure 4.8B shows the box plot after removal of the sample with low RIN number.
Table 4.4: List of donors
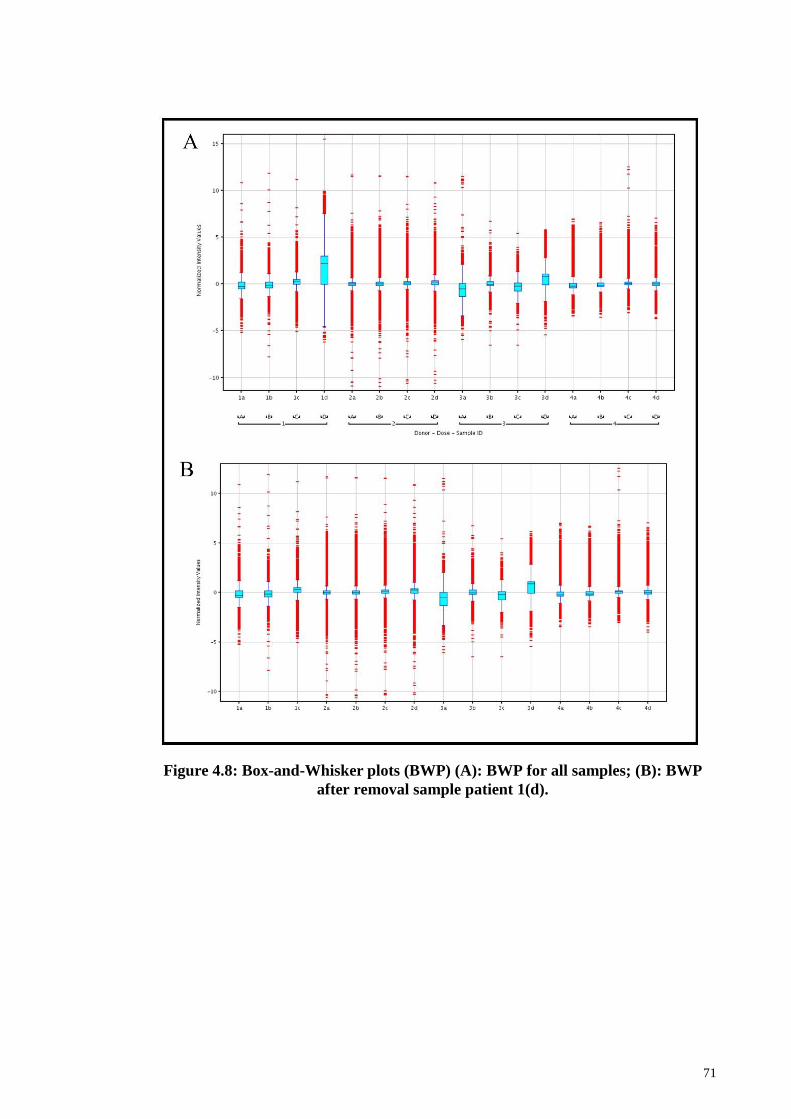
71
Figure 4.8: Box-and-Whisker plots (BWP) (A): BWP for all samples; (B): BWP
after removal sample patient 1(d).
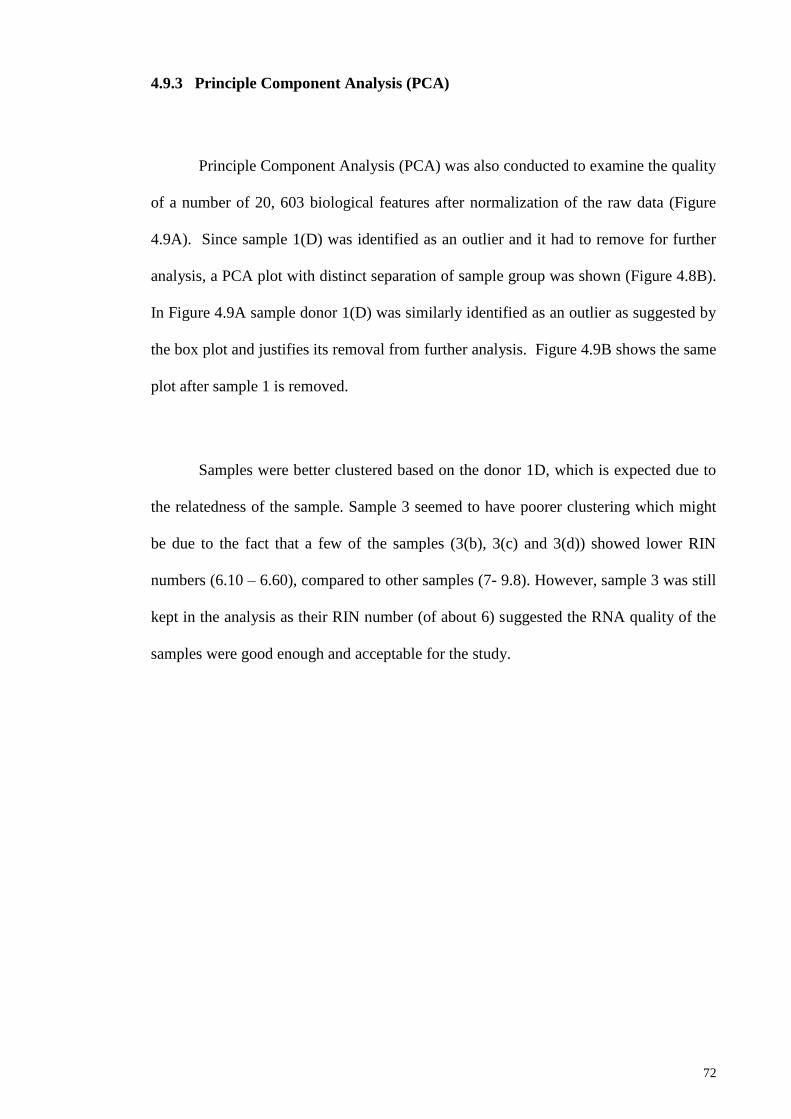
72
4.9.3 Principle Component Analysis (PCA)
Principle Component Analysis (PCA) was also conducted to examine the quality
of a number of 20, 603 biological features after normalization of the raw data (Figure
4.9A). Since sample 1(D) was identified as an outlier and it had to remove for further
analysis, a PCA plot with distinct separation of sample group was shown (Figure 4.8B).
In Figure 4.9A sample donor 1(D) was similarly identified as an outlier as suggested by
the box plot and justifies its removal from further analysis. Figure 4.9B shows the same
plot after sample 1 is removed.
Samples were better clustered based on the donor 1D, which is expected due to
the relatedness of the sample. Sample 3 seemed to have poorer clustering which might
be due to the fact that a few of the samples (3(b), 3(c) and 3(d)) showed lower RIN
numbers (6.10 – 6.60), compared to other samples (7- 9.8). However, sample 3 was still
kept in the analysis as their RIN number (of about 6) suggested the RNA quality of the
samples were good enough and acceptable for the study.
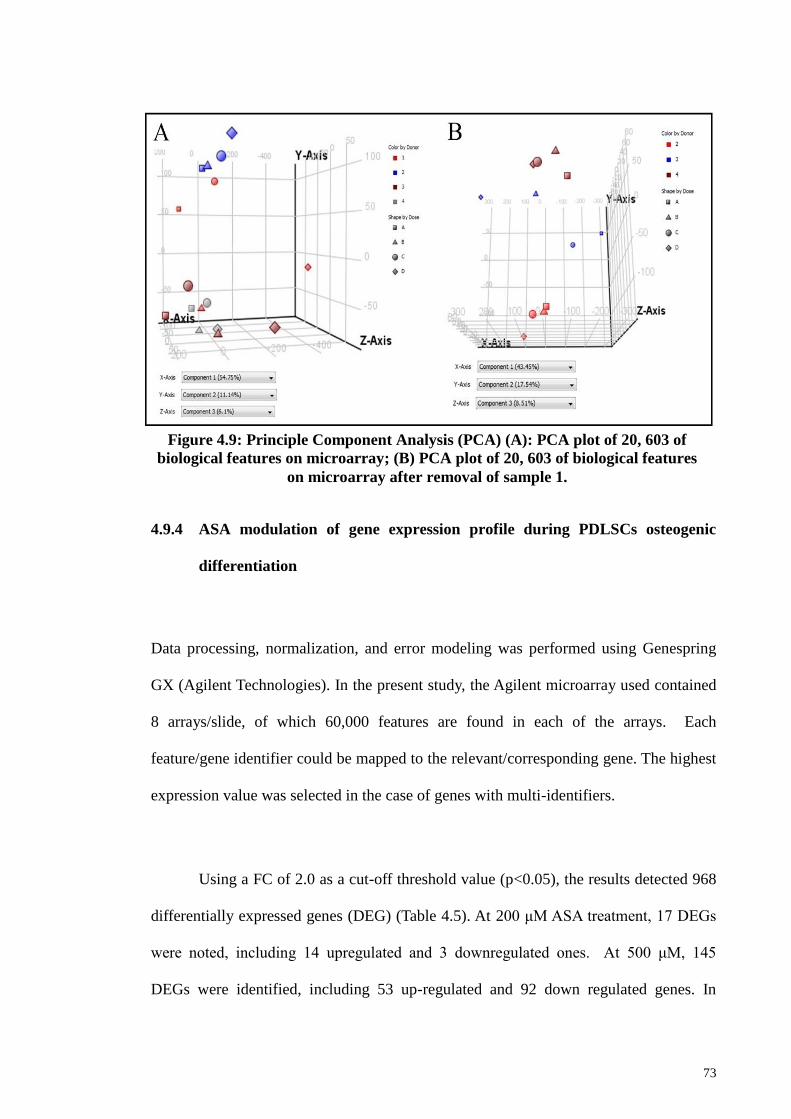
73
4.9.4 ASA modulation of gene expression profile during PDLSCs osteogenic
differentiation
Data processing, normalization, and error modeling was performed using Genespring
GX (Agilent Technologies). In the present study, the Agilent microarray used contained
8 arrays/slide, of which 60,000 features are found in each of the arrays. Each
feature/gene identifier could be mapped to the relevant/corresponding gene. The highest
expression value was selected in the case of genes with multi-identifiers.
Using a FC of 2.0 as a cut-off threshold value (p<0.05), the results detected 968
differentially expressed genes (DEG) (Table 4.5). At 200 μM ASA treatment, 17 DEGs
were noted, including 14 upregulated and 3 downregulated ones. At 500 μM, 145
DEGs were identified, including 53 up-regulated and 92 down regulated genes. In
Figure 4.9: Principle Component Analysis (PCA) (A): PCA plot of 20, 603 of
biological features on microarray; (B) PCA plot of 20, 603 of biological features
on microarray after removal of sample 1.
74
contrast, at 1,000 M, 819 DEGs were identified, which included 335 up-regulated and
484 down-regulated genes.
Meanwhile, using a FC of 1.75 as a cut-off threshold value (p<0.05), 1620
were found to be differentially expressed (Table 4.5). At 200 μM ASA treatment, 61
DEGs were noted, including 41 upregulated and 20 downregulated genes. At 500 μM,
305 DEGs were identified, including 122 upregulated and 183 downregulated ones. In
contrast, at 1,000 M, 1254 DEGs were noted including 633 that were upregulated and
987 downregulated.
Using an FC of 1.5 as a cut-off threshold value (p<0.05), 3,144 were found to be
DEGs (Table 7). At 200 μM ASA treatment, 315 DEGs were noted, including 151
upregulated and 164 down-regulated genes. At 500 μM, 794 DEGs were identified,
including 364 upregulated and 430 down regulated genes. In contrast, at 1,000 M, 2035
DEGs were noted, which included 1,250 upregulated and 1,894 downregulated genes.
The common shared upregulated gene between 200 μM vs 500 μM and 1, 000
μM is a zinc finger protein 316 (ZNF316) gene. Meanwhile the most common
downregulated genes between 200 μM vs 500 μM and 1,000 μM were family with a
sequence similarity of 107, member A (FAM107A), potassium inwardly-rectifying
channel, subfamily J, member 8 (KCNJ8) and scavenger receptor class A, member 5
(putative) (SCARA5).
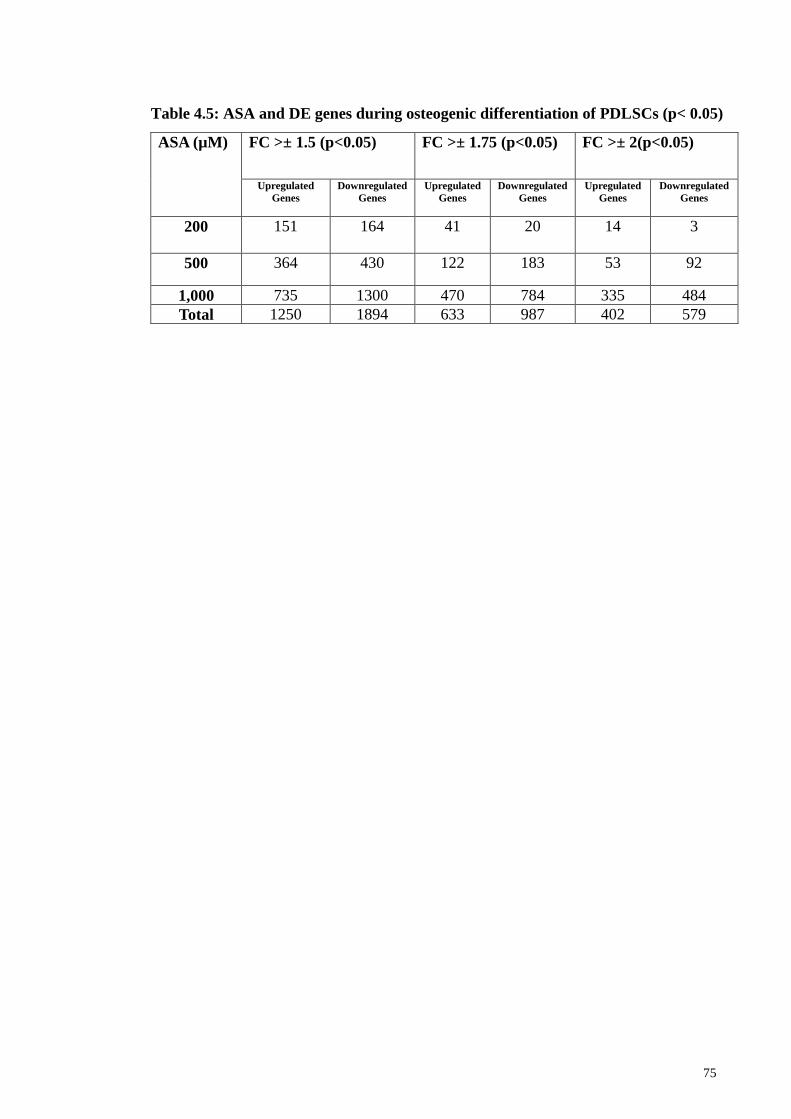
75
ASA (µM) FC >± 1.5 (p<0.05) FC >± 1.75 (p<0.05) FC >± 2(p<0.05)
Upregulated
Genes
Downregulated
Genes
Upregulated
Genes
Downregulated
Genes
Upregulated
Genes
Downregulated
Genes
200 151 164 41 20 14 3
500 364 430 122 183 53 92
1,000 735 1300 470 784 335 484
Total 1250 1894 633 987 402 579
Table 4.5: ASA and DE genes during osteogenic differentiation of PDLSCs (p< 0.05)
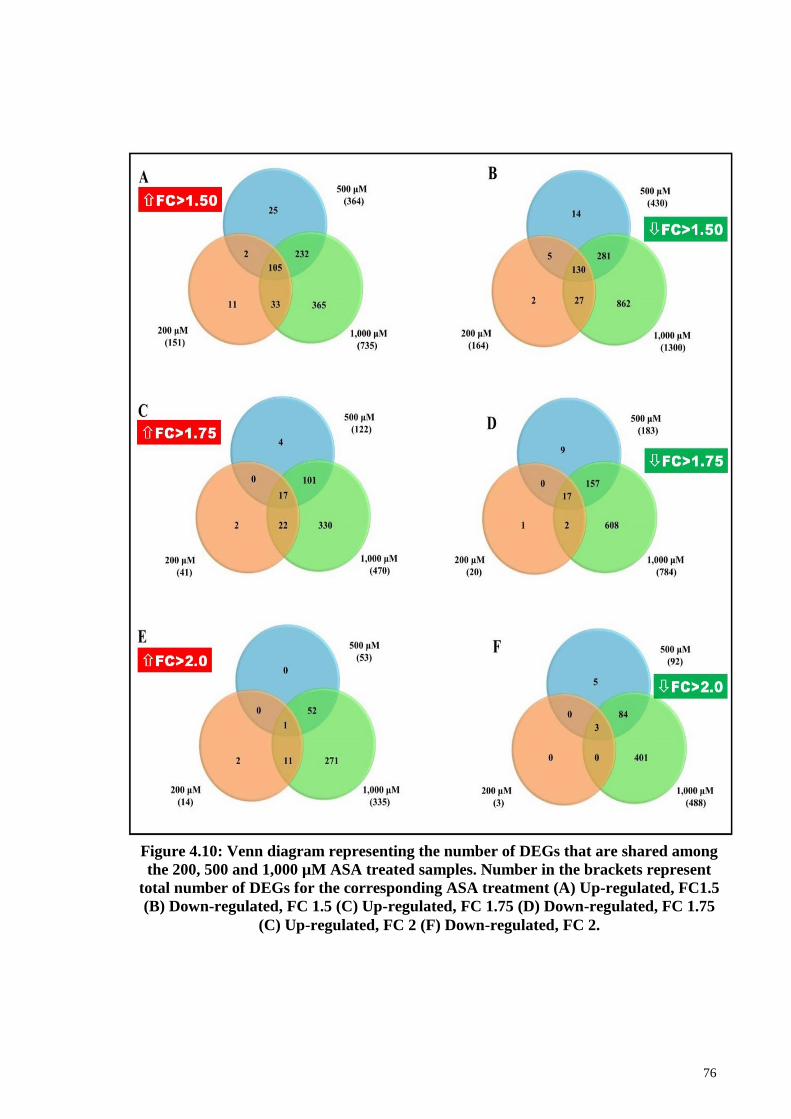
76
Figure 4.10: Venn diagram representing the number of DEGs that are shared among
the 200, 500 and 1,000 µM ASA treated samples. Number in the brackets represent
total number of DEGs for the corresponding ASA treatment (A) Up-regulated, FC1.5
(B) Down-regulated, FC 1.5 (C) Up-regulated, FC 1.75 (D) Down-regulated, FC 1.75
(C) Up-regulated, FC 2 (F) Down-regulated, FC 2.
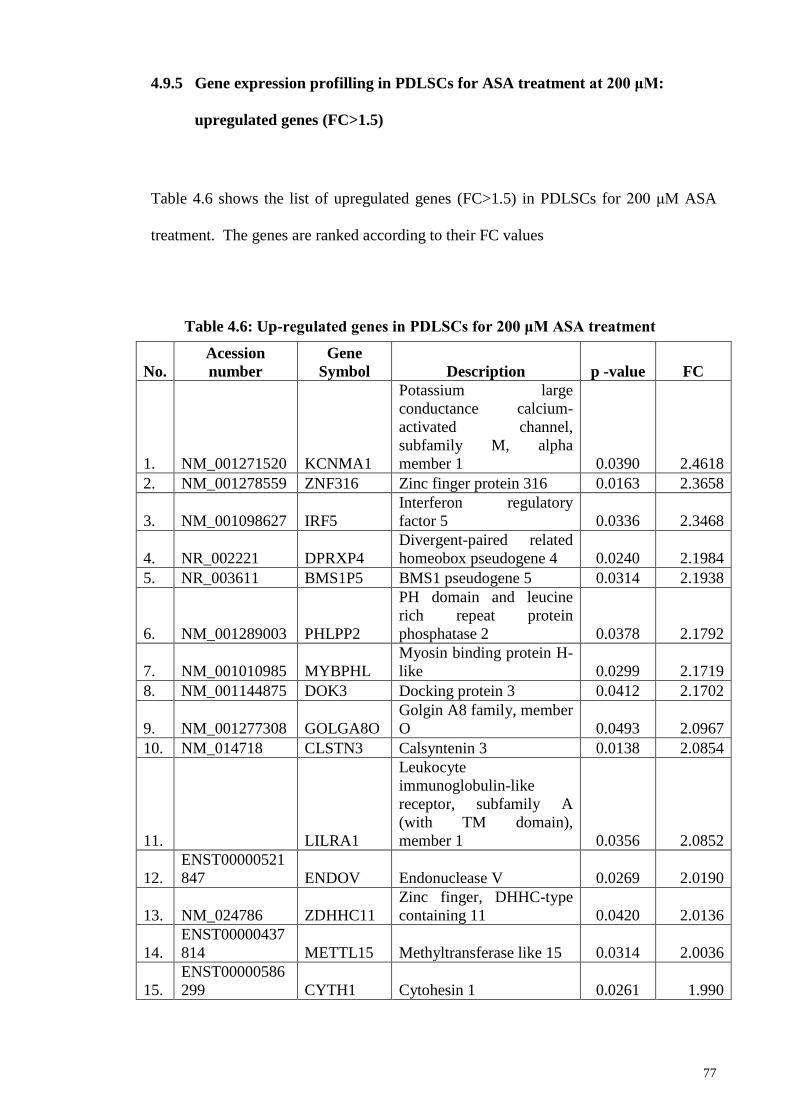
77
4.9.5 Gene expression profilling in PDLSCs for ASA treatment at 200 μM:
upregulated genes (FC>1.5)
Table 4.6 shows the list of upregulated genes (FC>1.5) in PDLSCs for 200 μM ASA
treatment. The genes are ranked according to their FC values
No.
Acession
number
Gene
Symbol Description p -value FC
1. NM_001271520 KCNMA1
Potassium large
conductance calcium-
activated channel,
subfamily M, alpha
member 1 0.0390 2.4618
2. NM_001278559 ZNF316 Zinc finger protein 316 0.0163 2.3658
3. NM_001098627 IRF5
Interferon regulatory
factor 5 0.0336 2.3468
4. NR_002221 DPRXP4
Divergent-paired related
homeobox pseudogene 4 0.0240 2.1984
5. NR_003611 BMS1P5 BMS1 pseudogene 5 0.0314 2.1938
6. NM_001289003 PHLPP2
PH domain and leucine
rich repeat protein
phosphatase 2 0.0378 2.1792
7. NM_001010985 MYBPHL
Myosin binding protein H-
like 0.0299 2.1719
8. NM_001144875 DOK3 Docking protein 3 0.0412 2.1702
9. NM_001277308 GOLGA8O
Golgin A8 family, member
O 0.0493 2.0967
10. NM_014718 CLSTN3 Calsyntenin 3 0.0138 2.0854
11. LILRA1
Leukocyte
immunoglobulin-like
receptor, subfamily A
(with TM domain),
member 1 0.0356 2.0852
12.
ENST00000521
847 ENDOV Endonuclease V 0.0269 2.0190
13. NM_024786 ZDHHC11
Zinc finger, DHHC-type
containing 11 0.0420 2.0136
14.
ENST00000437
814 METTL15 Methyltransferase like 15 0.0314 2.0036
15.
ENST00000586
299 CYTH1 Cytohesin 1 0.0261 1.990
Table 4.6: Up-regulated genes in PDLSCs for 200 μM ASA treatment
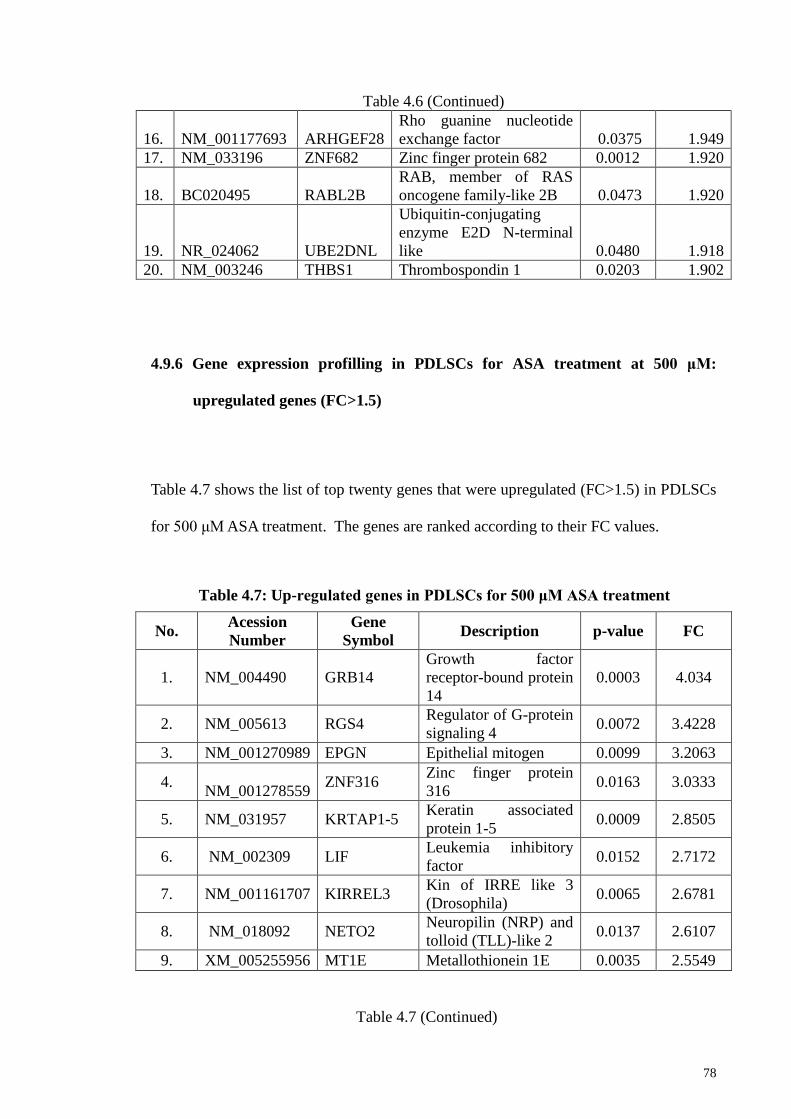
78
Table 4.6 (Continued)
16. NM_001177693 ARHGEF28
Rho guanine nucleotide
exchange factor 0.0375 1.949
17. NM_033196 ZNF682 Zinc finger protein 682 0.0012 1.920
18. BC020495 RABL2B
RAB, member of RAS
oncogene family-like 2B 0.0473 1.920
19. NR_024062 UBE2DNL
Ubiquitin-conjugating
enzyme E2D N-terminal
like 0.0480 1.918
20. NM_003246 THBS1 Thrombospondin 1 0.0203 1.902
4.9.6 Gene expression profilling in PDLSCs for ASA treatment at 500 μM:
upregulated genes (FC>1.5)
Table 4.7 shows the list of top twenty genes that were upregulated (FC>1.5) in PDLSCs
for 500 μM ASA treatment. The genes are ranked according to their FC values.
No. Acession
Number
Gene
Symbol Description p-value FC
1. NM_004490 GRB14
Growth factor
receptor-bound protein
14
0.0003 4.034
2. NM_005613 RGS4 Regulator of G-protein
signaling 4 0.0072 3.4228
3. NM_001270989 EPGN Epithelial mitogen 0.0099 3.2063
4.
NM_001278559 ZNF316
Zinc finger protein
316 0.0163 3.0333
5. NM_031957 KRTAP1-5 Keratin associated
protein 1-5 0.0009 2.8505
6. NM_002309 LIF Leukemia inhibitory
factor 0.0152 2.7172
7. NM_001161707 KIRREL3 Kin of IRRE like 3
(Drosophila) 0.0065 2.6781
8. NM_018092 NETO2 Neuropilin (NRP) and
tolloid (TLL)-like 2 0.0137 2.6107
9. XM_005255956 MT1E Metallothionein 1E 0.0035 2.5549
Table 4.7 (Continued)
Table 4.7: Up-regulated genes in PDLSCs for 500 μM ASA treatment
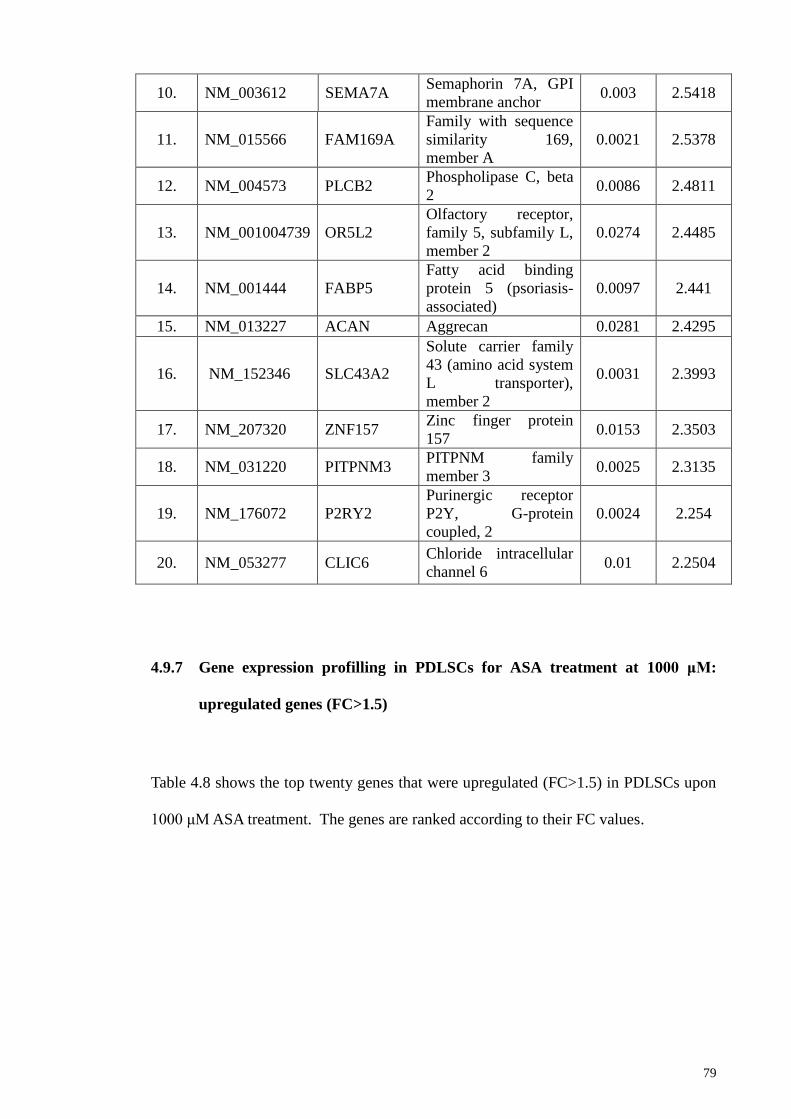
79
10. NM_003612 SEMA7A Semaphorin 7A, GPI
membrane anchor 0.003 2.5418
11. NM_015566 FAM169A
Family with sequence
similarity 169,
member A
0.0021 2.5378
12. NM_004573 PLCB2 Phospholipase C, beta
2 0.0086 2.4811
13. NM_001004739 OR5L2
Olfactory receptor,
family 5, subfamily L,
member 2
0.0274 2.4485
14. NM_001444 FABP5
Fatty acid binding
protein 5 (psoriasis-
associated)
0.0097 2.441
15. NM_013227 ACAN Aggrecan 0.0281 2.4295
16. NM_152346 SLC43A2
Solute carrier family
43 (amino acid system
L transporter),
member 2
0.0031 2.3993
17. NM_207320 ZNF157 Zinc finger protein
157 0.0153 2.3503
18. NM_031220 PITPNM3 PITPNM family
member 3 0.0025 2.3135
19. NM_176072 P2RY2
Purinergic receptor
P2Y, G-protein
coupled, 2
0.0024 2.254
20. NM_053277 CLIC6 Chloride intracellular
channel 6 0.01 2.2504
4.9.7 Gene expression profilling in PDLSCs for ASA treatment at 1000 μM:
upregulated genes (FC>1.5)
Table 4.8 shows the top twenty genes that were upregulated (FC>1.5) in PDLSCs upon
1000 μM ASA treatment. The genes are ranked according to their FC values.
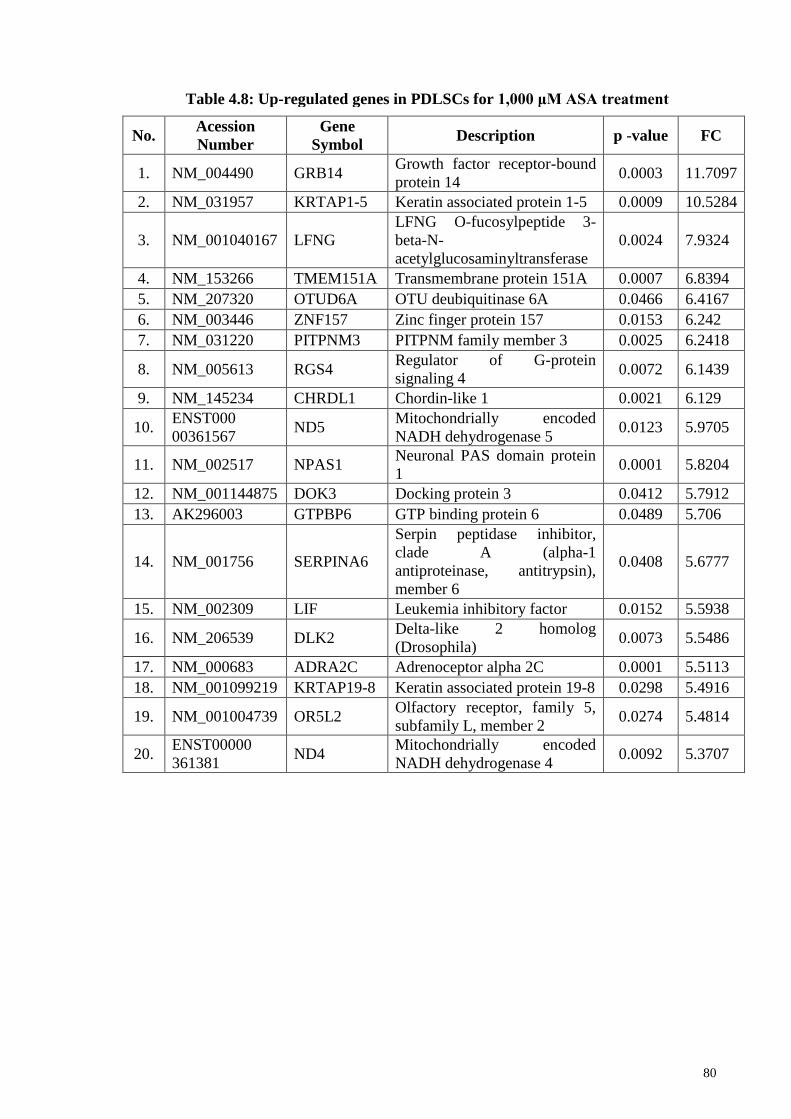
80
No. Acession
Number
Gene
Symbol Description p -value FC
1. NM_004490 GRB14 Growth factor receptor-bound
protein 14 0.0003 11.7097
2. NM_031957 KRTAP1-5 Keratin associated protein 1-5 0.0009 10.5284
3. NM_001040167 LFNG
LFNG O-fucosylpeptide 3-
beta-N-
acetylglucosaminyltransferase
0.0024 7.9324
4. NM_153266 TMEM151A Transmembrane protein 151A 0.0007 6.8394
5. NM_207320 OTUD6A OTU deubiquitinase 6A 0.0466 6.4167
6. NM_003446 ZNF157 Zinc finger protein 157 0.0153 6.242
7. NM_031220 PITPNM3 PITPNM family member 3 0.0025 6.2418
8. NM_005613 RGS4 Regulator of G-protein
signaling 4 0.0072 6.1439
9. NM_145234 CHRDL1 Chordin-like 1 0.0021 6.129
10. ENST000
00361567 ND5
Mitochondrially encoded
NADH dehydrogenase 5 0.0123 5.9705
11. NM_002517 NPAS1 Neuronal PAS domain protein
1 0.0001 5.8204
12. NM_001144875 DOK3 Docking protein 3 0.0412 5.7912
13. AK296003 GTPBP6 GTP binding protein 6 0.0489 5.706
14. NM_001756 SERPINA6
Serpin peptidase inhibitor,
clade A (alpha-1
antiproteinase, antitrypsin),
member 6
0.0408 5.6777
15. NM_002309 LIF Leukemia inhibitory factor 0.0152 5.5938
16. NM_206539 DLK2 Delta-like 2 homolog
(Drosophila) 0.0073 5.5486
17. NM_000683 ADRA2C Adrenoceptor alpha 2C 0.0001 5.5113
18. NM_001099219 KRTAP19-8 Keratin associated protein 19-8 0.0298 5.4916
19. NM_001004739 OR5L2 Olfactory receptor, family 5,
subfamily L, member 2 0.0274 5.4814
20. ENST00000
361381 ND4
Mitochondrially encoded
NADH dehydrogenase 4 0.0092 5.3707
Table 4.8: Up-regulated genes in PDLSCs for 1,000 μM ASA treatment
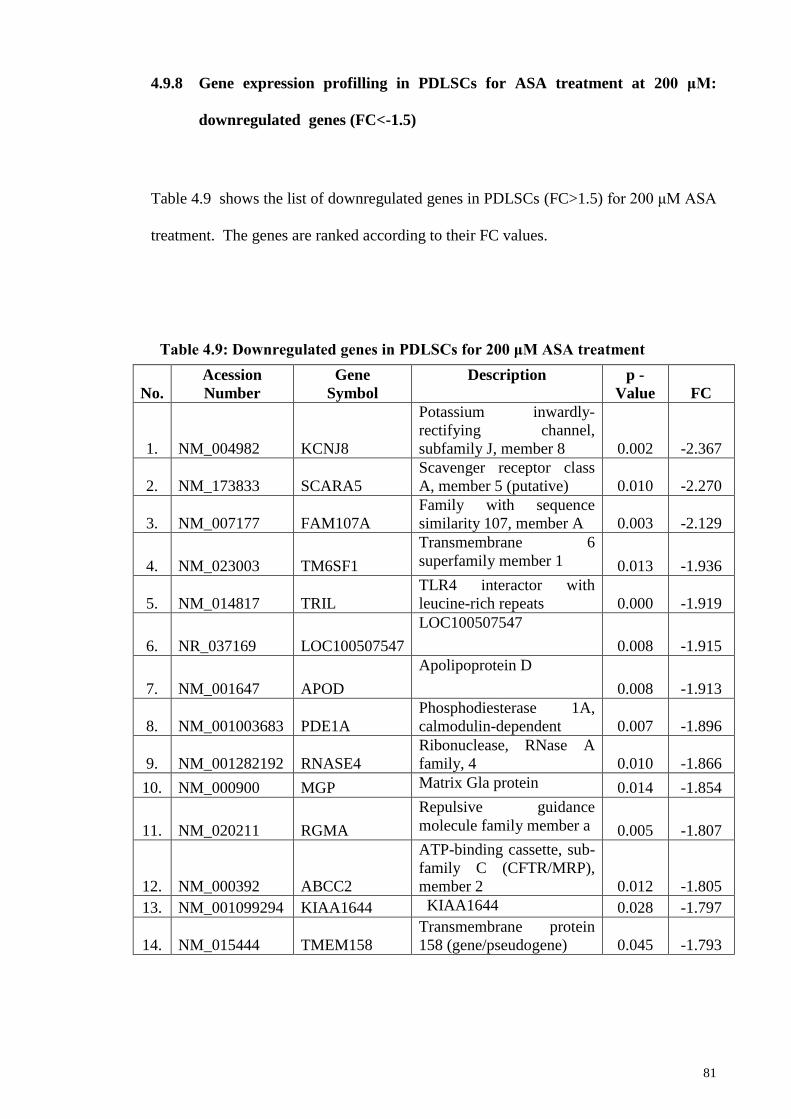
81
4.9.8 Gene expression profilling in PDLSCs for ASA treatment at 200 μM:
downregulated genes (FC<-1.5)
Table 4.9 shows the list of downregulated genes in PDLSCs (FC>1.5) for 200 μM ASA
treatment. The genes are ranked according to their FC values.
No.
Acession
Number
Gene
Symbol
Description p -
Value FC
1. NM_004982 KCNJ8
Potassium inwardly-
rectifying channel,
subfamily J, member 8 0.002 -2.367
2. NM_173833 SCARA5
Scavenger receptor class
A, member 5 (putative) 0.010 -2.270
3. NM_007177 FAM107A
Family with sequence
similarity 107, member A 0.003 -2.129
4. NM_023003 TM6SF1
Transmembrane 6
superfamily member 1 0.013 -1.936
5. NM_014817 TRIL
TLR4 interactor with
leucine-rich repeats 0.000 -1.919
6. NR_037169 LOC100507547
LOC100507547
0.008 -1.915
7. NM_001647 APOD
Apolipoprotein D
0.008 -1.913
8. NM_001003683 PDE1A
Phosphodiesterase 1A,
calmodulin-dependent 0.007 -1.896
9. NM_001282192 RNASE4
Ribonuclease, RNase A
family, 4 0.010 -1.866
10. NM_000900 MGP Matrix Gla protein 0.014 -1.854
11. NM_020211 RGMA
Repulsive guidance
molecule family member a 0.005 -1.807
12. NM_000392 ABCC2
ATP-binding cassette, sub-
family C (CFTR/MRP),
member 2 0.012 -1.805
13. NM_001099294 KIAA1644 KIAA1644 0.028 -1.797
14. NM_015444 TMEM158
Transmembrane protein
158 (gene/pseudogene) 0.045 -1.793
Table 4.9: Downregulated genes in PDLSCs for 200 μM ASA treatment
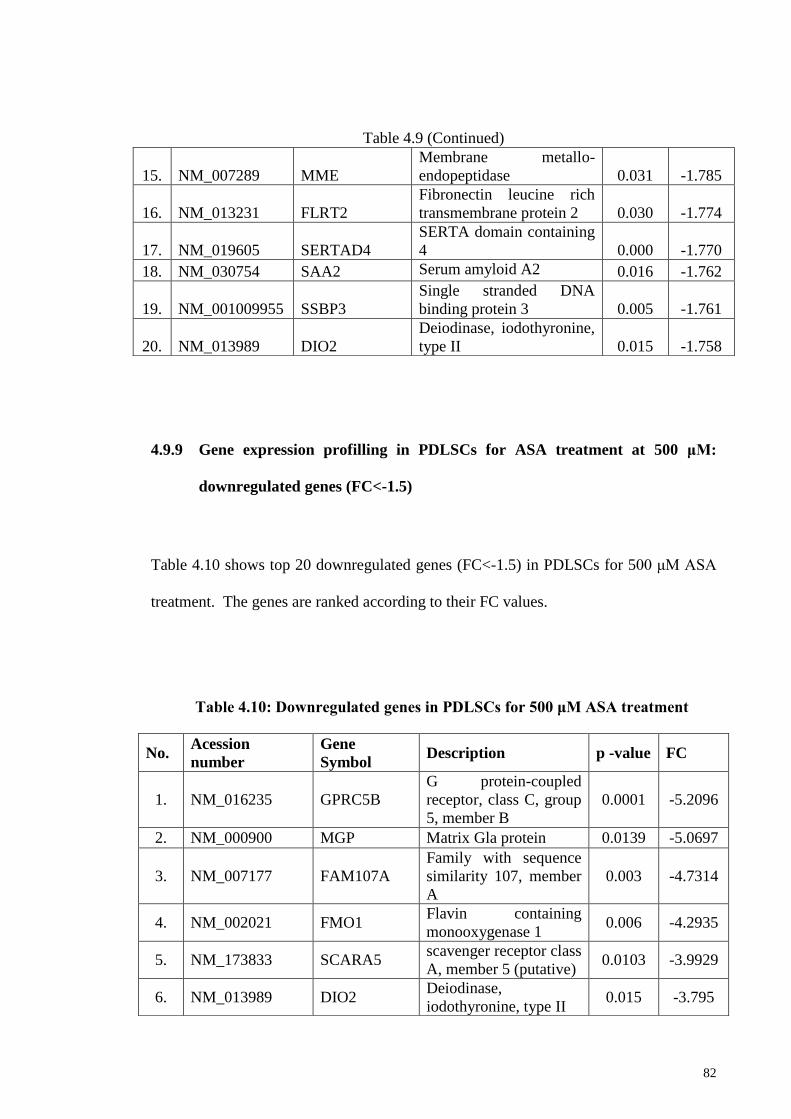
82
4.9.9 Gene expression profilling in PDLSCs for ASA treatment at 500 μM:
downregulated genes (FC<-1.5)
Table 4.10 shows top 20 downregulated genes (FC<-1.5) in PDLSCs for 500 μM ASA
treatment. The genes are ranked according to their FC values.
Table 4.9 (Continued)
15. NM_007289 MME
Membrane metallo-
endopeptidase 0.031 -1.785
16. NM_013231 FLRT2
Fibronectin leucine rich
transmembrane protein 2 0.030 -1.774
17. NM_019605 SERTAD4
SERTA domain containing
4 0.000 -1.770
18. NM_030754 SAA2 Serum amyloid A2 0.016 -1.762
19. NM_001009955 SSBP3
Single stranded DNA
binding protein 3 0.005 -1.761
20. NM_013989 DIO2
Deiodinase, iodothyronine,
type II 0.015 -1.758
No. Acession
number
Gene
Symbol Description p -value FC
1. NM_016235 GPRC5B
G protein-coupled
receptor, class C, group
5, member B
0.0001 -5.2096
2. NM_000900 MGP Matrix Gla protein 0.0139 -5.0697
3. NM_007177 FAM107A
Family with sequence
similarity 107, member
A
0.003 -4.7314
4. NM_002021 FMO1 Flavin containing
monooxygenase 1 0.006 -4.2935
5. NM_173833 SCARA5 scavenger receptor class
A, member 5 (putative) 0.0103 -3.9929
6. NM_013989 DIO2 Deiodinase,
iodothyronine, type II 0.015 -3.795
Table 4.10: Downregulated genes in PDLSCs for 500 μM ASA treatment
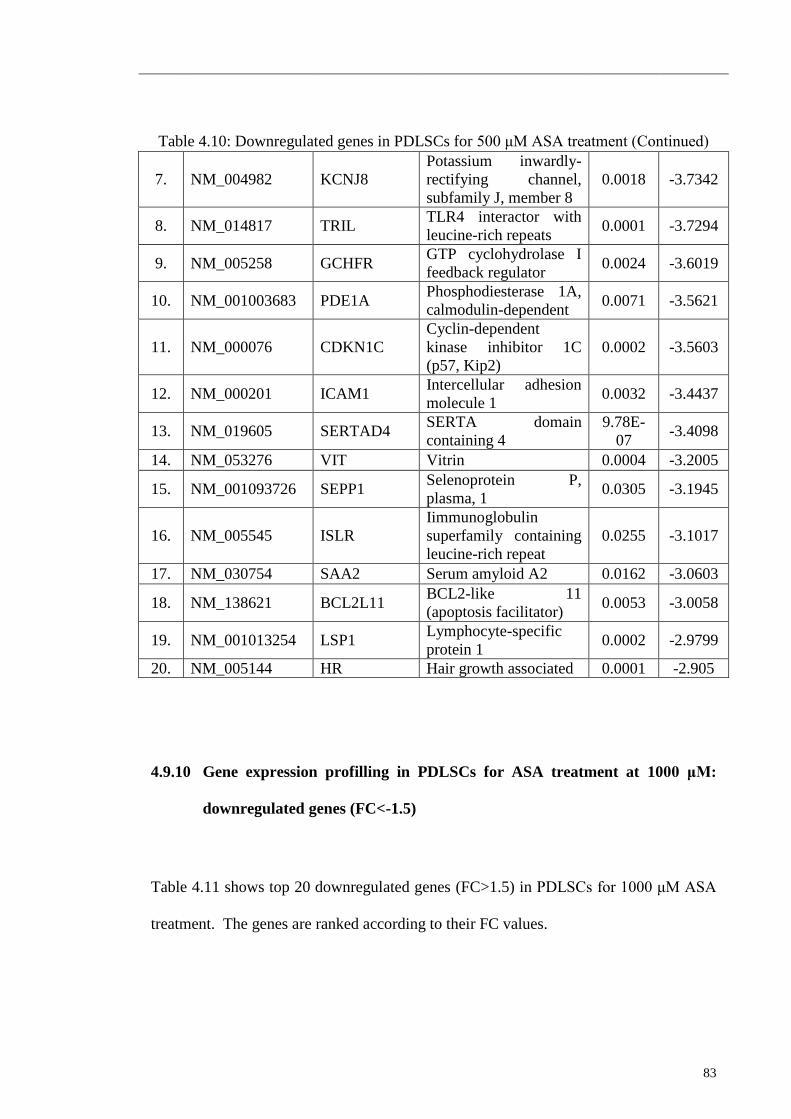
83
4.9.10 Gene expression profilling in PDLSCs for ASA treatment at 1000 μM:
downregulated genes (FC<-1.5)
Table 4.11 shows top 20 downregulated genes (FC>1.5) in PDLSCs for 1000 μM ASA
treatment. The genes are ranked according to their FC values.
Table 4.10: Downregulated genes in PDLSCs for 500 μM ASA treatment (Continued)
7. NM_004982 KCNJ8
Potassium inwardly-
rectifying channel,
subfamily J, member 8
0.0018 -3.7342
8. NM_014817 TRIL TLR4 interactor with
leucine-rich repeats 0.0001 -3.7294
9. NM_005258 GCHFR GTP cyclohydrolase I
feedback regulator 0.0024 -3.6019
10. NM_001003683 PDE1A Phosphodiesterase 1A,
calmodulin-dependent 0.0071 -3.5621
11. NM_000076 CDKN1C
Cyclin-dependent
kinase inhibitor 1C
(p57, Kip2)
0.0002 -3.5603
12. NM_000201 ICAM1 Intercellular adhesion
molecule 1 0.0032 -3.4437
13. NM_019605 SERTAD4 SERTA domain
containing 4
9.78E-
07 -3.4098
14. NM_053276 VIT Vitrin 0.0004 -3.2005
15. NM_001093726 SEPP1 Selenoprotein P,
plasma, 1 0.0305 -3.1945
16. NM_005545 ISLR
Iimmunoglobulin
superfamily containing
leucine-rich repeat
0.0255 -3.1017
17. NM_030754 SAA2 Serum amyloid A2 0.0162 -3.0603
18. NM_138621 BCL2L11 BCL2-like 11
(apoptosis facilitator) 0.0053 -3.0058
19. NM_001013254 LSP1 Lymphocyte-specific
protein 1 0.0002 -2.9799
20. NM_005144 HR Hair growth associated 0.0001 -2.905
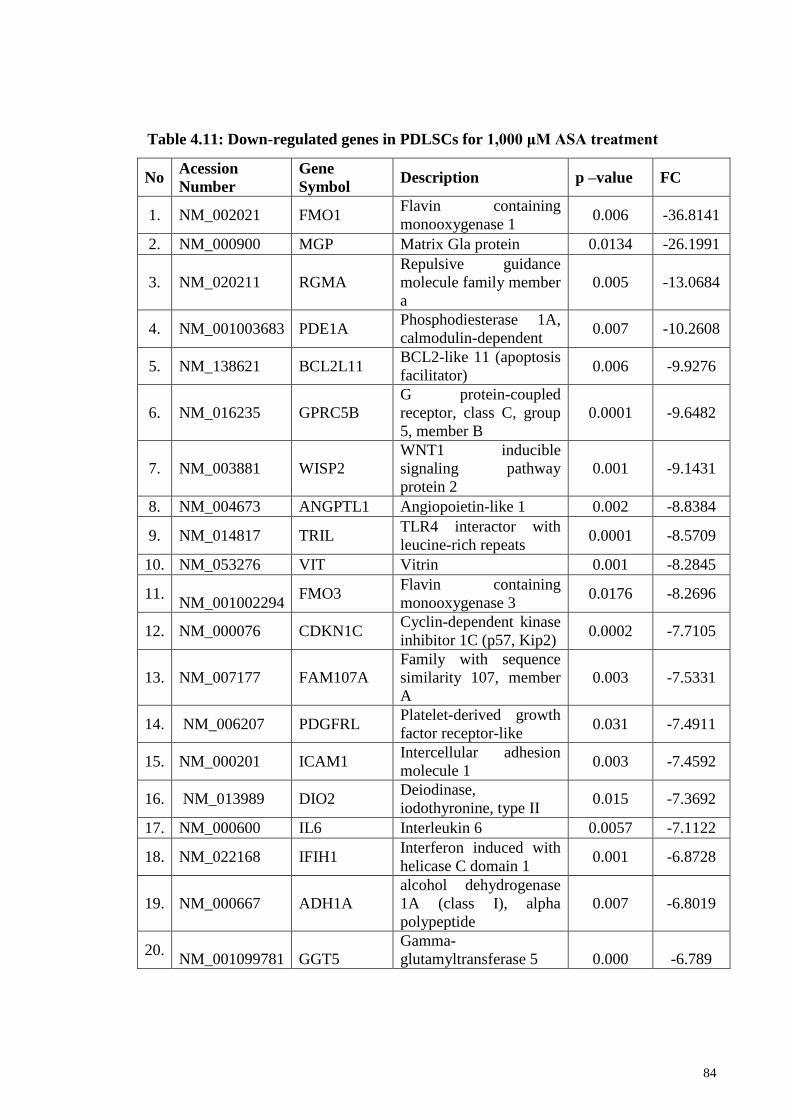
84
No Acession
Number
Gene
Symbol Description p –value FC
1. NM_002021 FMO1 Flavin containing
monooxygenase 1 0.006 -36.8141
2. NM_000900 MGP Matrix Gla protein 0.0134 -26.1991
3. NM_020211 RGMA
Repulsive guidance
molecule family member
a
0.005 -13.0684
4. NM_001003683 PDE1A Phosphodiesterase 1A,
calmodulin-dependent 0.007 -10.2608
5. NM_138621 BCL2L11 BCL2-like 11 (apoptosis
facilitator) 0.006 -9.9276
6. NM_016235 GPRC5B
G protein-coupled
receptor, class C, group
5, member B
0.0001 -9.6482
7. NM_003881 WISP2
WNT1 inducible
signaling pathway
protein 2
0.001 -9.1431
8. NM_004673 ANGPTL1 Angiopoietin-like 1 0.002 -8.8384
9. NM_014817 TRIL TLR4 interactor with
leucine-rich repeats 0.0001 -8.5709
10. NM_053276 VIT Vitrin 0.001 -8.2845
11.
NM_001002294 FMO3
Flavin containing
monooxygenase 3 0.0176 -8.2696
12. NM_000076 CDKN1C Cyclin-dependent kinase
inhibitor 1C (p57, Kip2) 0.0002 -7.7105
13. NM_007177 FAM107A
Family with sequence
similarity 107, member
A
0.003 -7.5331
14. NM_006207 PDGFRL Platelet-derived growth
factor receptor-like 0.031 -7.4911
15. NM_000201 ICAM1 Intercellular adhesion
molecule 1 0.003 -7.4592
16. NM_013989 DIO2 Deiodinase,
iodothyronine, type II 0.015 -7.3692
17. NM_000600 IL6 Interleukin 6 0.0057 -7.1122
18. NM_022168 IFIH1 Interferon induced with
helicase C domain 1 0.001 -6.8728
19. NM_000667 ADH1A
alcohol dehydrogenase
1A (class I), alpha
polypeptide
0.007 -6.8019
20. NM_001099781 GGT5
Gamma-
glutamyltransferase 5 0.000 -6.789
Table 4.11: Down-regulated genes in PDLSCs for 1,000 μM ASA treatment
85
4.10 Comparison differentially expressed genes in PDLSCs: effect of growth
media and ASA concentrations
The gene expression analyses indicated that ASA was able to modulate the
expression of genes in PDLSCs, using normal media or osteogenic differentiation
media. In the first part of the gene expression profiling study, PCR array was used. The
study used non-osteogenic induction media (normal media) and profiled growth factor
associated genes in the presence/absence of ASA. In the second part of the study,
Agilent microarray was used, to profile global gene expression in PDLSCs in the
presence and absence of ASA. The second part of the analyses differs from the first
assay, due to the use of osteogenic induction media. For the microarray data, although a
number of genes were similarly up/downregulation using different ASA concentrations,
the gene expression profiles among 200, 500 and 1000 μM ASA treatments were in
general significantly different.
The use of osteogenic media and non-osteogenic media also influenced the gene
expression profile. For example, for 1000 μM ASA treatments, INHBB was found to be
upregulated in PDLSCs using non-osteogenic induction media, while the same gene
was upregulated when grown using osteogenic induction media (Table 4.12). Similarly,
FGF5 was significantly downregulated at 1000 μM ASA treatment when the PDLSCs
was grown in non-osteogenic induction media, but the same gene was observed to be
upregulated at 1000 μM ASA treatment using osteogenic induction media.
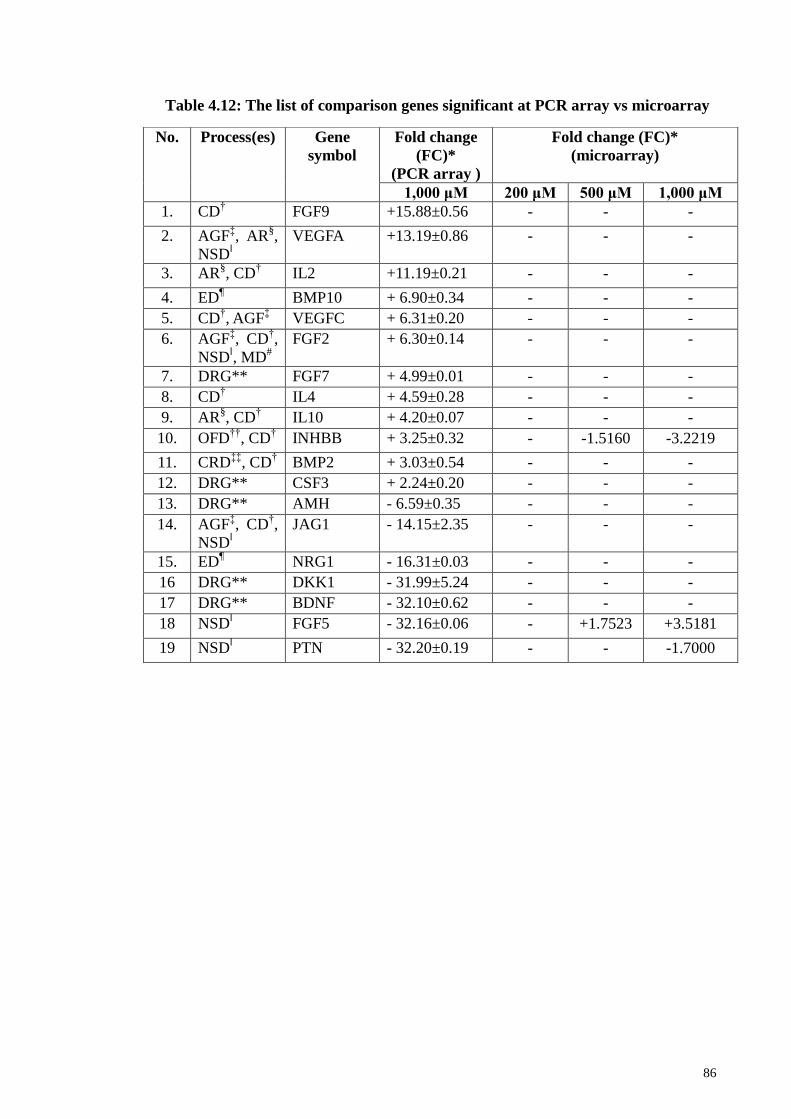
86
No. Process(es) Gene
symbol
Fold change
(FC)*
(PCR array )
Fold change (FC)*
(microarray)
1,000 μM 200 μM 500 μM 1,000 μM
1. CD† FGF9 +15.88±0.56 - - -
2. AGFffi, AR
§,
NSDǁ
VEGFA +13.19±0.86 - - -
3. AR§, CD
† IL2 +11.19±0.21 - - -
4. ED¶ BMP10 + 6.90±0.34 - - -
5. CD†, AGF
ffi VEGFC + 6.31±0.20 - - -
6. AGFffi, CD
†,
NSDǁ, MD
#
FGF2 + 6.30±0.14 - - -
7. DRG** FGF7 + 4.99±0.01 - - -
8. CD† IL4 + 4.59±0.28 - - -
9. AR§, CD
† IL10 + 4.20±0.07 - - -
10. OFD††
, CD† INHBB + 3.25±0.32 - -1.5160 -3.2219
11. CRDffiffi
, CD† BMP2 + 3.03±0.54 - - -
12. DRG** CSF3 + 2.24±0.20 - - -
13. DRG** AMH - 6.59±0.35 - - -
14. AGFffi, CD
†,
NSDǁ
JAG1 - 14.15±2.35 - - -
15. ED¶ NRG1 - 16.31±0.03 - - -
16 DRG** DKK1 - 31.99±5.24 - - -
17 DRG** BDNF - 32.10±0.62 - - -
18 NSDǁ FGF5 - 32.16±0.06 - +1.7523 +3.5181
19 NSDǁ PTN - 32.20±0.19 - - -1.7000
Table 4.12: The list of comparison genes significant at PCR array vs microarray
87
4.11 Gene ontology (GO) analyses : PANTHER
Genes ontology (GO) analysis was enriched by using PANTHER families
(protein annotation through evolutionary relationship)(Mi et al., 2013). GO analysis was
used to infer functions shared among related genes. Gene family phylogeny was used to
incorporate the variant experimentally-derived GO functional annotations across
related genes. It classifies the 1,344 genes (FC≥1.5, p<0.05) according to Biological
Process (BP), Molecular Function (MF), and Cellular Component (CC). Figures 4.11,
4.12, and 4.13 showed BP, MF and CC for 200, 500, and 1,000 μM of ASA treatments
respectively.
4.11.1 Gene ontology for Biological Processes (BP)
The distribution of the genes conferring biological processes (BP) at 200 μM of
ASA treatments (Figure 4.11A) is as follows: metabolic process (117 genes, 22.5%),
cellular process (112 genes, 21.5%), biological regulation (71 genes, 13.6%),
localization (38 genes, 7.3%), developmental process (48 genes, 9.2%), response to
stimulus (35 genes, 6.7%), immune system process (27 genes, 5.2%), multicellular
organismal process (21 genes, 4.0%), cellular component organization or biogenesis (15
genes, 2.9%), apoptotic process (15 genes, 2.9%), locomotion (4 genes, 0.8%),
biological adhesion (15 genes, 2.9%), and reproduction (3 genes, 0.6%),
The distribution of the genes conferring biological processes (BP) at 500 μM of
ASA treatments (Figure 4.11B) is as follows: metabolic process (335 genes, 23.7%),
cellular process (276 genes, 19.5%), biological regulation (186 genes, 13.2%),
developmental process (125 genes, 8.8%), localization (110 genes, 7.8%), response to
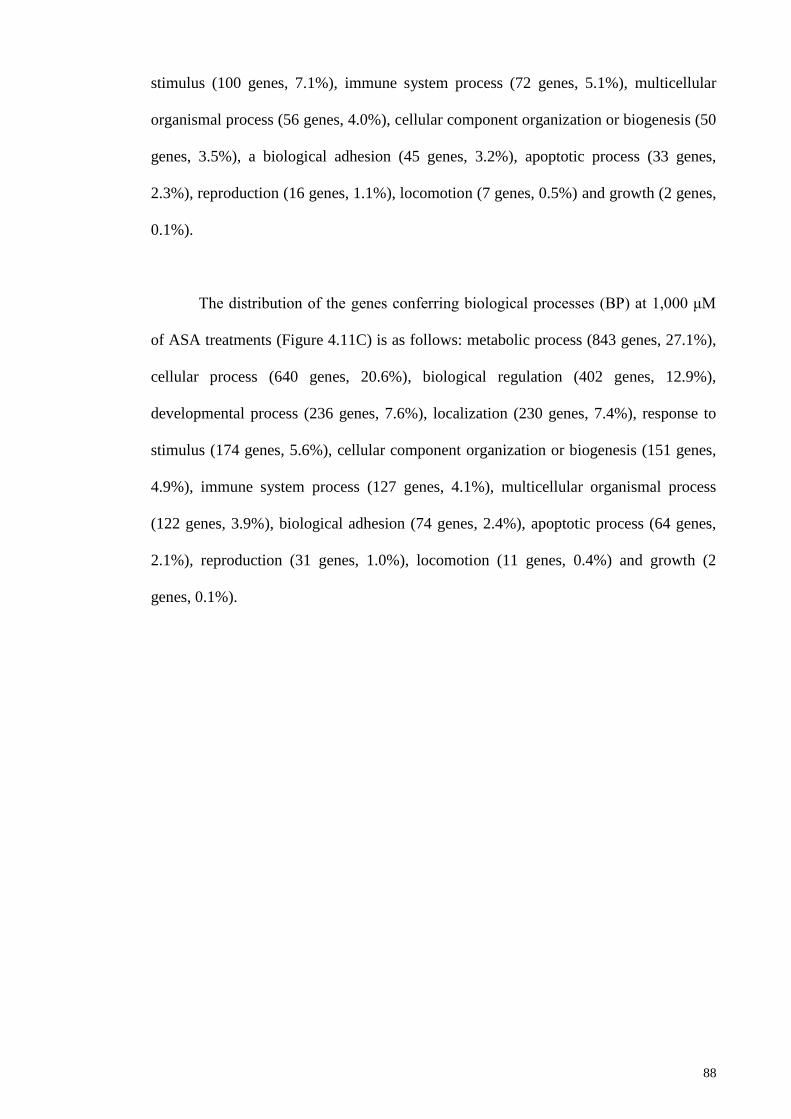
88
stimulus (100 genes, 7.1%), immune system process (72 genes, 5.1%), multicellular
organismal process (56 genes, 4.0%), cellular component organization or biogenesis (50
genes, 3.5%), a biological adhesion (45 genes, 3.2%), apoptotic process (33 genes,
2.3%), reproduction (16 genes, 1.1%), locomotion (7 genes, 0.5%) and growth (2 genes,
0.1%).
The distribution of the genes conferring biological processes (BP) at 1,000 μM
of ASA treatments (Figure 4.11C) is as follows: metabolic process (843 genes, 27.1%),
cellular process (640 genes, 20.6%), biological regulation (402 genes, 12.9%),
developmental process (236 genes, 7.6%), localization (230 genes, 7.4%), response to
stimulus (174 genes, 5.6%), cellular component organization or biogenesis (151 genes,
4.9%), immune system process (127 genes, 4.1%), multicellular organismal process
(122 genes, 3.9%), biological adhesion (74 genes, 2.4%), apoptotic process (64 genes,
2.1%), reproduction (31 genes, 1.0%), locomotion (11 genes, 0.4%) and growth (2
genes, 0.1%).
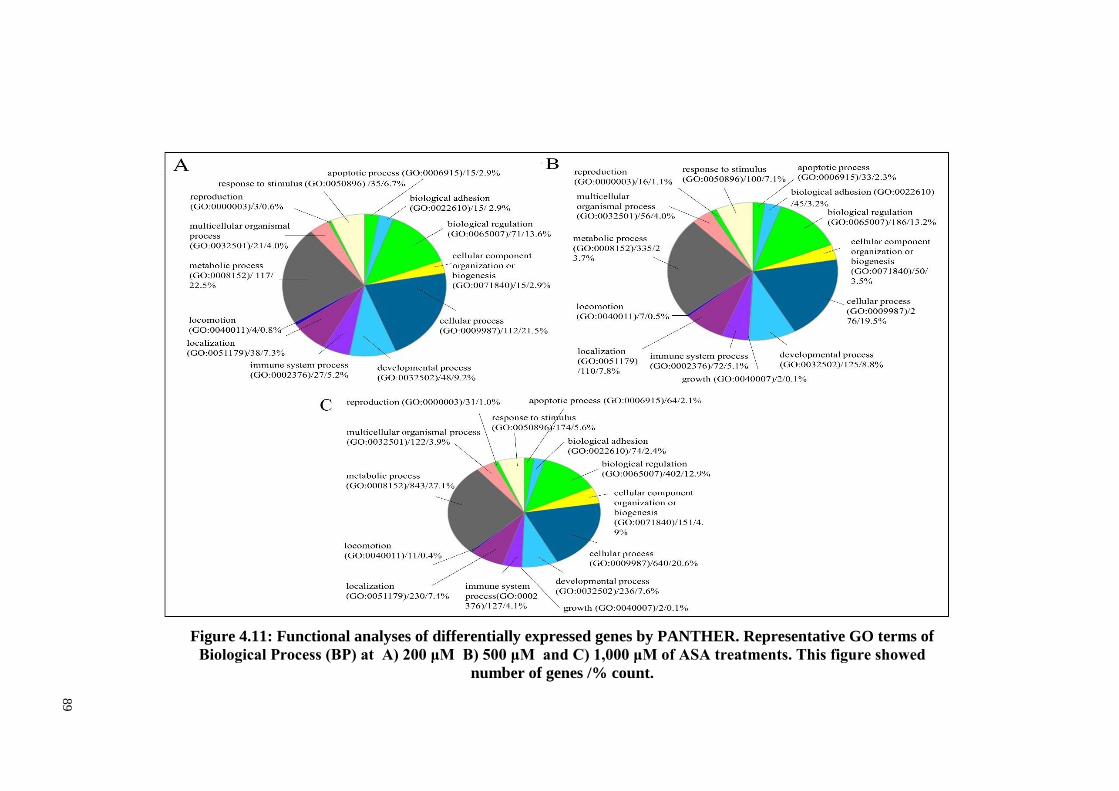
89
Figure 4.11: Functional analyses of differentially expressed genes by PANTHER. Representative GO terms of
Biological Process (BP) at A) 200 μM B) 500 μM and C) 1,000 μM of ASA treatments. This figure showed
number of genes /% count.
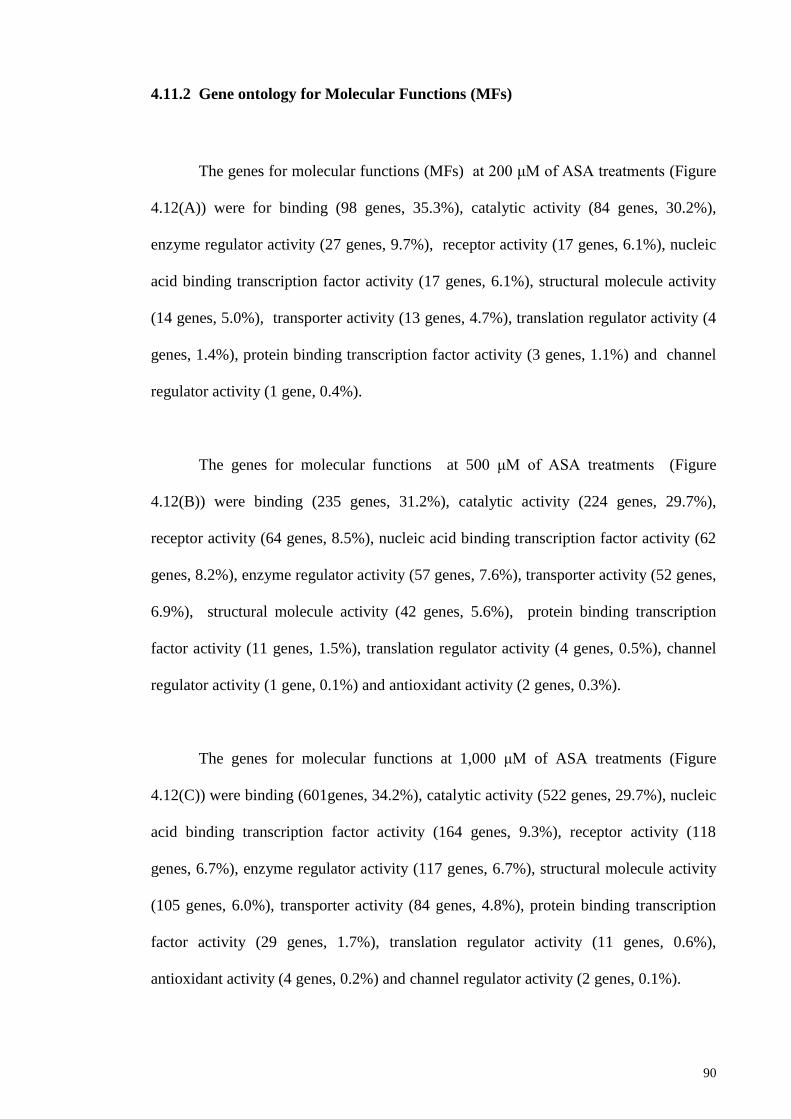
90
4.11.2 Gene ontology for Molecular Functions (MFs)
The genes for molecular functions (MFs) at 200 μM of ASA treatments (Figure
4.12(A)) were for binding (98 genes, 35.3%), catalytic activity (84 genes, 30.2%),
enzyme regulator activity (27 genes, 9.7%), receptor activity (17 genes, 6.1%), nucleic
acid binding transcription factor activity (17 genes, 6.1%), structural molecule activity
(14 genes, 5.0%), transporter activity (13 genes, 4.7%), translation regulator activity (4
genes, 1.4%), protein binding transcription factor activity (3 genes, 1.1%) and channel
regulator activity (1 gene, 0.4%).
The genes for molecular functions at 500 μM of ASA treatments (Figure
4.12(B)) were binding (235 genes, 31.2%), catalytic activity (224 genes, 29.7%),
receptor activity (64 genes, 8.5%), nucleic acid binding transcription factor activity (62
genes, 8.2%), enzyme regulator activity (57 genes, 7.6%), transporter activity (52 genes,
6.9%), structural molecule activity (42 genes, 5.6%), protein binding transcription
factor activity (11 genes, 1.5%), translation regulator activity (4 genes, 0.5%), channel
regulator activity (1 gene, 0.1%) and antioxidant activity (2 genes, 0.3%).
The genes for molecular functions at 1,000 μM of ASA treatments (Figure
4.12(C)) were binding (601genes, 34.2%), catalytic activity (522 genes, 29.7%), nucleic
acid binding transcription factor activity (164 genes, 9.3%), receptor activity (118
genes, 6.7%), enzyme regulator activity (117 genes, 6.7%), structural molecule activity
(105 genes, 6.0%), transporter activity (84 genes, 4.8%), protein binding transcription
factor activity (29 genes, 1.7%), translation regulator activity (11 genes, 0.6%),
antioxidant activity (4 genes, 0.2%) and channel regulator activity (2 genes, 0.1%).
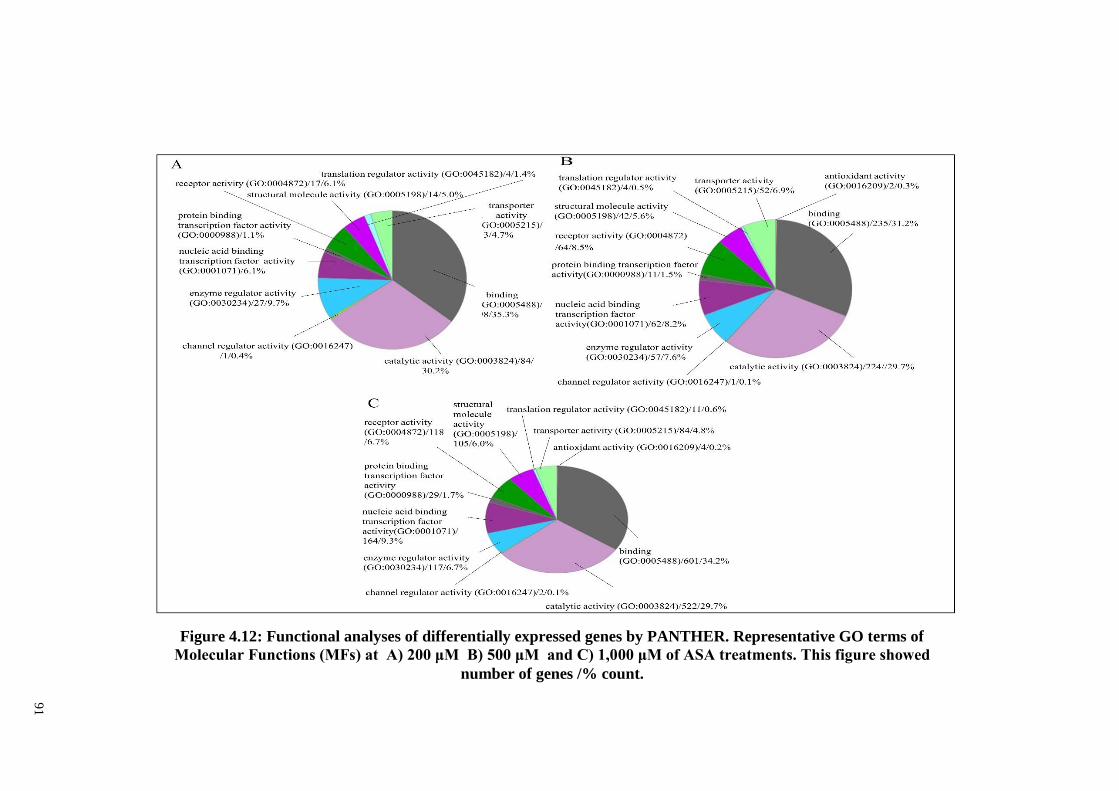
91
Figure 4.12: Functional analyses of differentially expressed genes by PANTHER. Representative GO terms of
Molecular Functions (MFs) at A) 200 μM B) 500 μM and C) 1,000 μM of ASA treatments. This figure showed
number of genes /% count.
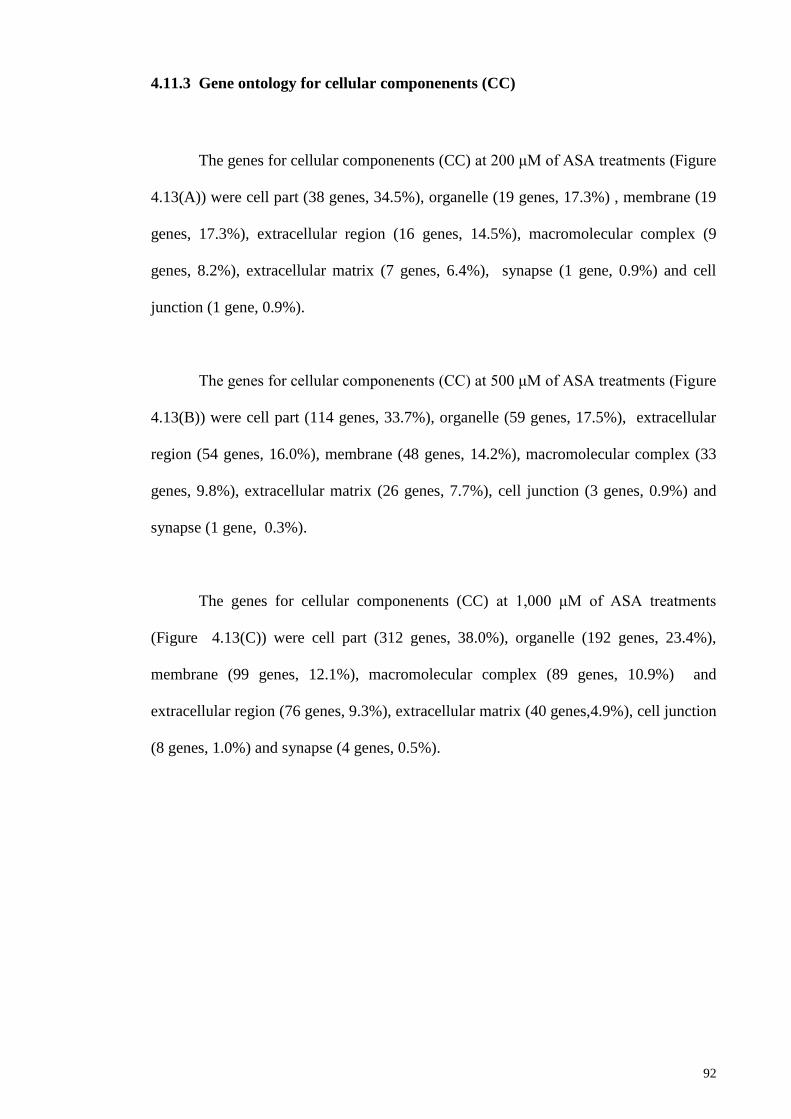
92
4.11.3 Gene ontology for cellular componenents (CC)
The genes for cellular componenents (CC) at 200 μM of ASA treatments (Figure
4.13(A)) were cell part (38 genes, 34.5%), organelle (19 genes, 17.3%) , membrane (19
genes, 17.3%), extracellular region (16 genes, 14.5%), macromolecular complex (9
genes, 8.2%), extracellular matrix (7 genes, 6.4%), synapse (1 gene, 0.9%) and cell
junction (1 gene, 0.9%).
The genes for cellular componenents (CC) at 500 μM of ASA treatments (Figure
4.13(B)) were cell part (114 genes, 33.7%), organelle (59 genes, 17.5%), extracellular
region (54 genes, 16.0%), membrane (48 genes, 14.2%), macromolecular complex (33
genes, 9.8%), extracellular matrix (26 genes, 7.7%), cell junction (3 genes, 0.9%) and
synapse (1 gene, 0.3%).
The genes for cellular componenents (CC) at 1,000 μM of ASA treatments
(Figure 4.13(C)) were cell part (312 genes, 38.0%), organelle (192 genes, 23.4%),
membrane (99 genes, 12.1%), macromolecular complex (89 genes, 10.9%) and
extracellular region (76 genes, 9.3%), extracellular matrix (40 genes,4.9%), cell junction
(8 genes, 1.0%) and synapse (4 genes, 0.5%).
93
Figure 4.13: Functional analyses of differentially expressed genes by PANTHER. Representative GO terms of Cellular
Components (CCs) at A) 200 μM B) 500 μM and C) 1,000 μM of ASA treatments. This figure showed number of genes /%
count.
94
4.12 Functional enrichment analysis using DAVID
The web-based bioinformatics tools, DAVID v6.7 (Database for Annotation,
Visualization and Integrated Discovery) was used for protein functional enrichment
analysis. The microarray data was subjected to functional enrichment analysis, to
identify the dysregulated GO categories during osteogenic differentiation of PDLSCs in
the presence of ASA at 200, 500, and 1,000 μM. The functional categorization is
considered significant when the p-value is less than 0.05. DAVID generates an
enrichment score for a group of genes indicating annotation term member associations
in a given experiment. The categories with top enrichment scores and lowest p-values
are noted in the following sections.
4.12.1 DAVID functional enrichment analysis : Gene expression profile for 200
µM ASA treatment
Table 4.13 lists the GO terms that were found to be statistically enriched for 200 µM
ASA treatment during PDLSCs osteogenic differentiation.
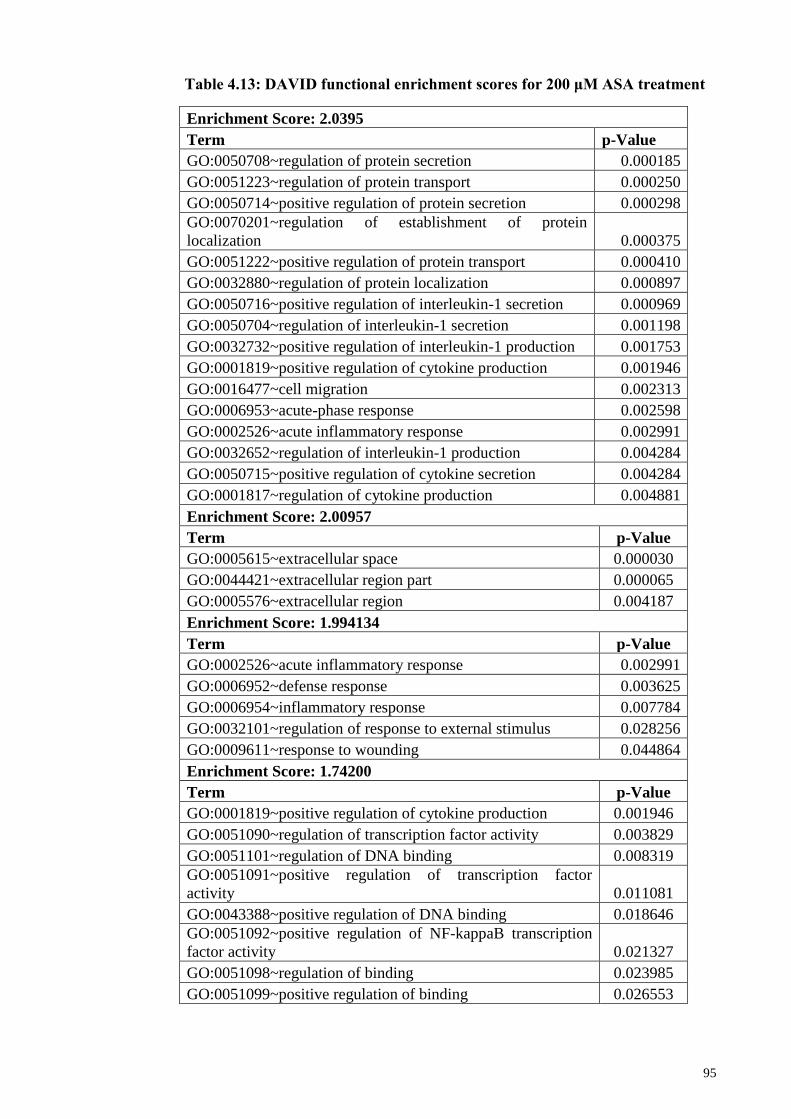
95
Enrichment Score: 2.0395
Term p-Value
GO:0050708~regulation of protein secretion 0.000185
GO:0051223~regulation of protein transport 0.000250
GO:0050714~positive regulation of protein secretion 0.000298
GO:0070201~regulation of establishment of protein
localization 0.000375
GO:0051222~positive regulation of protein transport 0.000410
GO:0032880~regulation of protein localization 0.000897
GO:0050716~positive regulation of interleukin-1 secretion 0.000969
GO:0050704~regulation of interleukin-1 secretion 0.001198
GO:0032732~positive regulation of interleukin-1 production 0.001753
GO:0001819~positive regulation of cytokine production 0.001946
GO:0016477~cell migration 0.002313
GO:0006953~acute-phase response 0.002598
GO:0002526~acute inflammatory response 0.002991
GO:0032652~regulation of interleukin-1 production 0.004284
GO:0050715~positive regulation of cytokine secretion 0.004284
GO:0001817~regulation of cytokine production 0.004881
Enrichment Score: 2.00957
Term p-Value
GO:0005615~extracellular space 0.000030
GO:0044421~extracellular region part 0.000065
GO:0005576~extracellular region 0.004187
Enrichment Score: 1.994134
Term p-Value
GO:0002526~acute inflammatory response 0.002991
GO:0006952~defense response 0.003625
GO:0006954~inflammatory response 0.007784
GO:0032101~regulation of response to external stimulus 0.028256
GO:0009611~response to wounding 0.044864
Enrichment Score: 1.74200
Term p-Value
GO:0001819~positive regulation of cytokine production 0.001946
GO:0051090~regulation of transcription factor activity 0.003829
GO:0051101~regulation of DNA binding 0.008319
GO:0051091~positive regulation of transcription factor
activity 0.011081
GO:0043388~positive regulation of DNA binding 0.018646
GO:0051092~positive regulation of NF-kappaB transcription
factor activity 0.021327
GO:0051098~regulation of binding 0.023985
GO:0051099~positive regulation of binding 0.026553
Table 4.13: DAVID functional enrichment scores for 200 μM ASA treatment
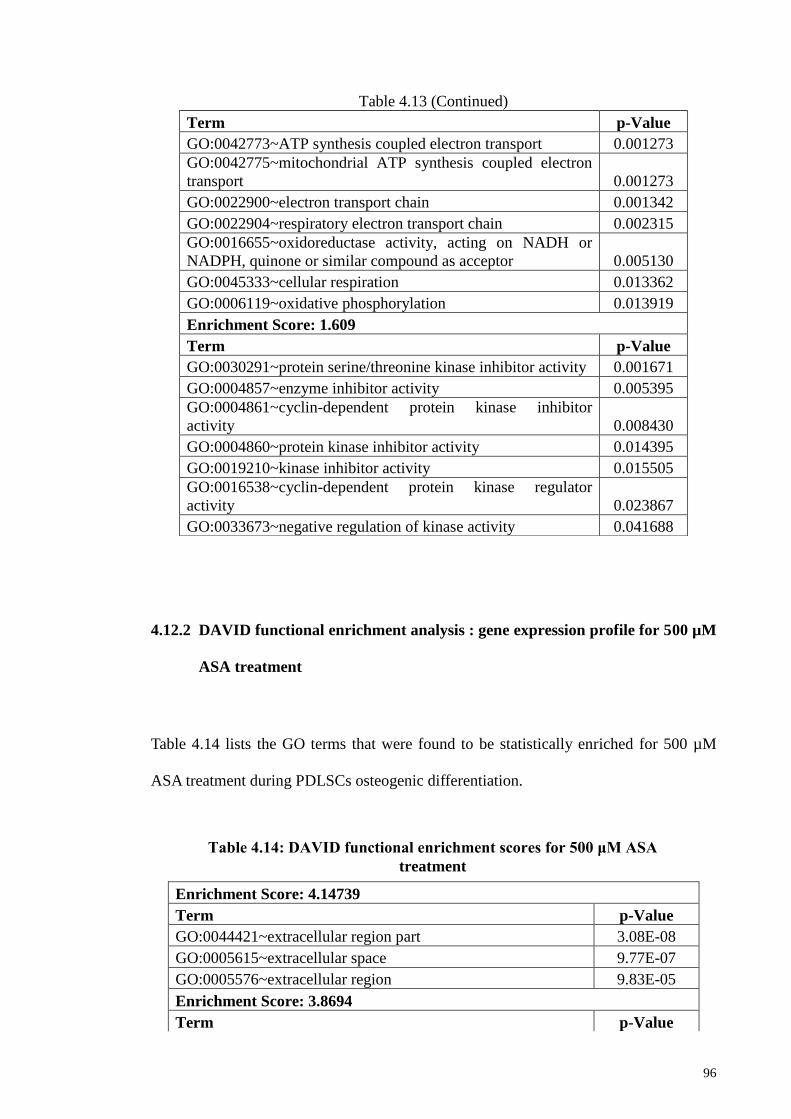
96
4.12.2 DAVID functional enrichment analysis : gene expression profile for 500 µM
ASA treatment
Table 4.14 lists the GO terms that were found to be statistically enriched for 500 µM
ASA treatment during PDLSCs osteogenic differentiation.
Enrichment Score: 4.14739
Term p-Value
GO:0044421~extracellular region part 3.08E-08
GO:0005615~extracellular space 9.77E-07
GO:0005576~extracellular region 9.83E-05
Enrichment Score: 3.8694
Term p-Value
Table 4.13 (Continued)
Term p-Value
GO:0042773~ATP synthesis coupled electron transport 0.001273
GO:0042775~mitochondrial ATP synthesis coupled electron
transport 0.001273
GO:0022900~electron transport chain 0.001342
GO:0022904~respiratory electron transport chain 0.002315
GO:0016655~oxidoreductase activity, acting on NADH or
NADPH, quinone or similar compound as acceptor 0.005130
GO:0045333~cellular respiration 0.013362
GO:0006119~oxidative phosphorylation 0.013919
Enrichment Score: 1.609
Term p-Value
GO:0030291~protein serine/threonine kinase inhibitor activity 0.001671
GO:0004857~enzyme inhibitor activity 0.005395
GO:0004861~cyclin-dependent protein kinase inhibitor
activity 0.008430
GO:0004860~protein kinase inhibitor activity 0.014395
GO:0019210~kinase inhibitor activity 0.015505
GO:0016538~cyclin-dependent protein kinase regulator
activity 0.023867
GO:0033673~negative regulation of kinase activity 0.041688
Table 4.14: DAVID functional enrichment scores for 500 μM ASA
treatment
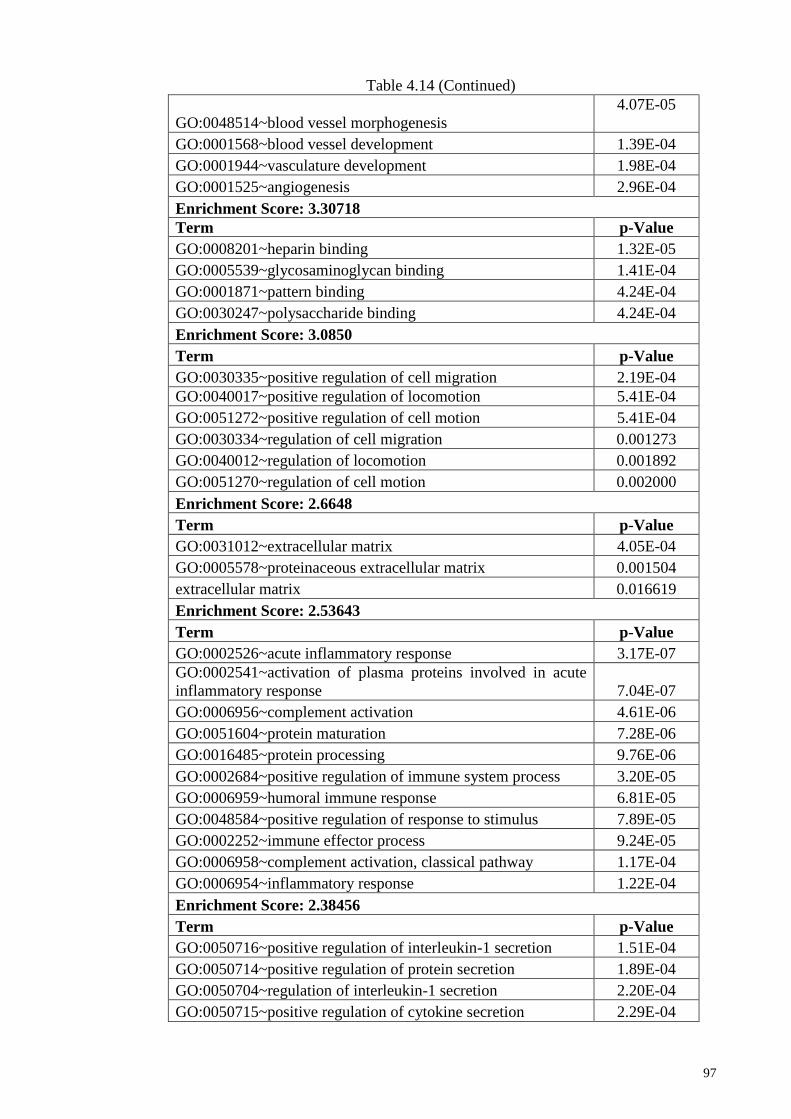
97
Table 4.14 (Continued)
GO:0048514~blood vessel morphogenesis
4.07E-05
GO:0001568~blood vessel development 1.39E-04
GO:0001944~vasculature development 1.98E-04
GO:0001525~angiogenesis 2.96E-04
Enrichment Score: 3.30718
Term p-Value
GO:0008201~heparin binding 1.32E-05
GO:0005539~glycosaminoglycan binding 1.41E-04
GO:0001871~pattern binding 4.24E-04
GO:0030247~polysaccharide binding 4.24E-04
Enrichment Score: 3.0850
Term p-Value
GO:0030335~positive regulation of cell migration 2.19E-04
GO:0040017~positive regulation of locomotion 5.41E-04
GO:0051272~positive regulation of cell motion 5.41E-04
GO:0030334~regulation of cell migration 0.001273
GO:0040012~regulation of locomotion 0.001892
GO:0051270~regulation of cell motion 0.002000
Enrichment Score: 2.6648
Term p-Value
GO:0031012~extracellular matrix 4.05E-04
GO:0005578~proteinaceous extracellular matrix 0.001504
extracellular matrix 0.016619
Enrichment Score: 2.53643
Term p-Value
GO:0002526~acute inflammatory response 3.17E-07
GO:0002541~activation of plasma proteins involved in acute
inflammatory response 7.04E-07
GO:0006956~complement activation 4.61E-06
GO:0051604~protein maturation 7.28E-06
GO:0016485~protein processing 9.76E-06
GO:0002684~positive regulation of immune system process 3.20E-05
GO:0006959~humoral immune response 6.81E-05
GO:0048584~positive regulation of response to stimulus 7.89E-05
GO:0002252~immune effector process 9.24E-05
GO:0006958~complement activation, classical pathway 1.17E-04
GO:0006954~inflammatory response 1.22E-04
Enrichment Score: 2.38456
Term p-Value
GO:0050716~positive regulation of interleukin-1 secretion 1.51E-04
GO:0050714~positive regulation of protein secretion 1.89E-04
GO:0050704~regulation of interleukin-1 secretion 2.20E-04
GO:0050715~positive regulation of cytokine secretion 2.29E-04
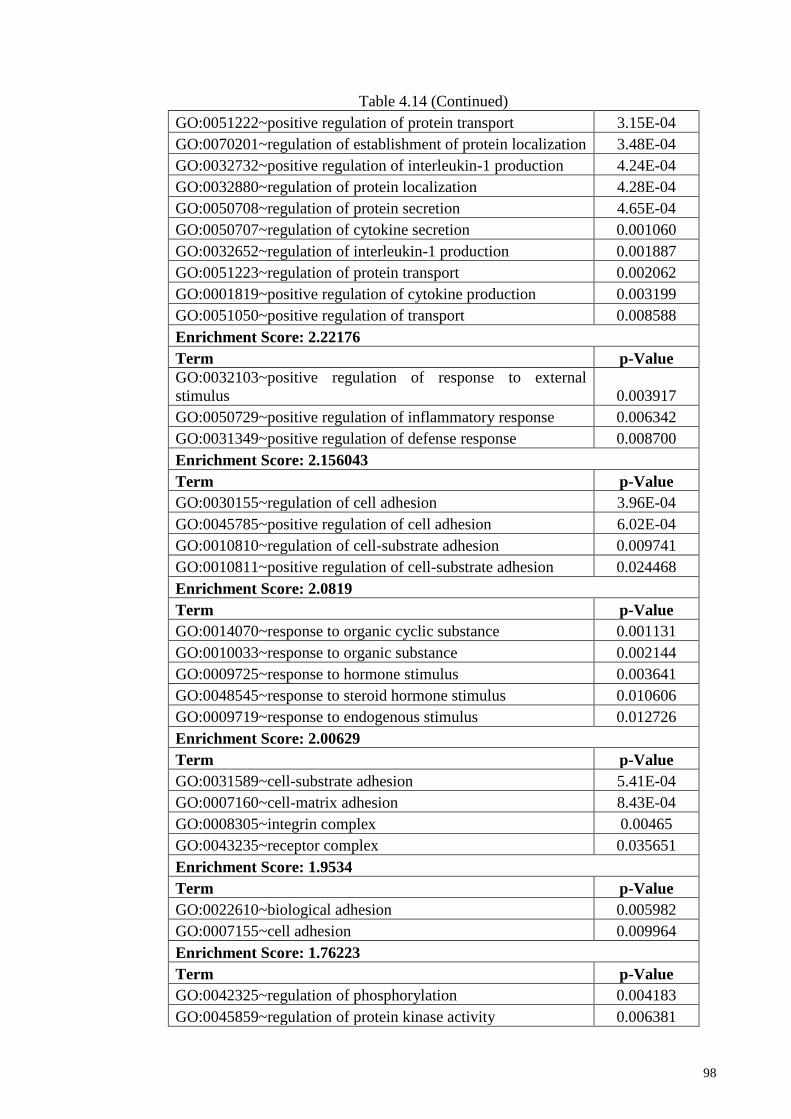
98
Table 4.14 (Continued)
GO:0051222~positive regulation of protein transport 3.15E-04
GO:0070201~regulation of establishment of protein localization 3.48E-04
GO:0032732~positive regulation of interleukin-1 production 4.24E-04
GO:0032880~regulation of protein localization 4.28E-04
GO:0050708~regulation of protein secretion 4.65E-04
GO:0050707~regulation of cytokine secretion 0.001060
GO:0032652~regulation of interleukin-1 production 0.001887
GO:0051223~regulation of protein transport 0.002062
GO:0001819~positive regulation of cytokine production 0.003199
GO:0051050~positive regulation of transport 0.008588
Enrichment Score: 2.22176
Term p-Value
GO:0032103~positive regulation of response to external
stimulus 0.003917
GO:0050729~positive regulation of inflammatory response 0.006342
GO:0031349~positive regulation of defense response 0.008700
Enrichment Score: 2.156043
Term p-Value
GO:0030155~regulation of cell adhesion 3.96E-04
GO:0045785~positive regulation of cell adhesion 6.02E-04
GO:0010810~regulation of cell-substrate adhesion 0.009741
GO:0010811~positive regulation of cell-substrate adhesion 0.024468
Enrichment Score: 2.0819
Term p-Value
GO:0014070~response to organic cyclic substance 0.001131
GO:0010033~response to organic substance 0.002144
GO:0009725~response to hormone stimulus 0.003641
GO:0048545~response to steroid hormone stimulus 0.010606
GO:0009719~response to endogenous stimulus 0.012726
Enrichment Score: 2.00629
Term p-Value
GO:0031589~cell-substrate adhesion 5.41E-04
GO:0007160~cell-matrix adhesion 8.43E-04
GO:0008305~integrin complex 0.00465
GO:0043235~receptor complex 0.035651
Enrichment Score: 1.9534
Term p-Value
GO:0022610~biological adhesion 0.005982
GO:0007155~cell adhesion 0.009964
Enrichment Score: 1.76223
Term p-Value
GO:0042325~regulation of phosphorylation 0.004183
GO:0045859~regulation of protein kinase activity 0.006381
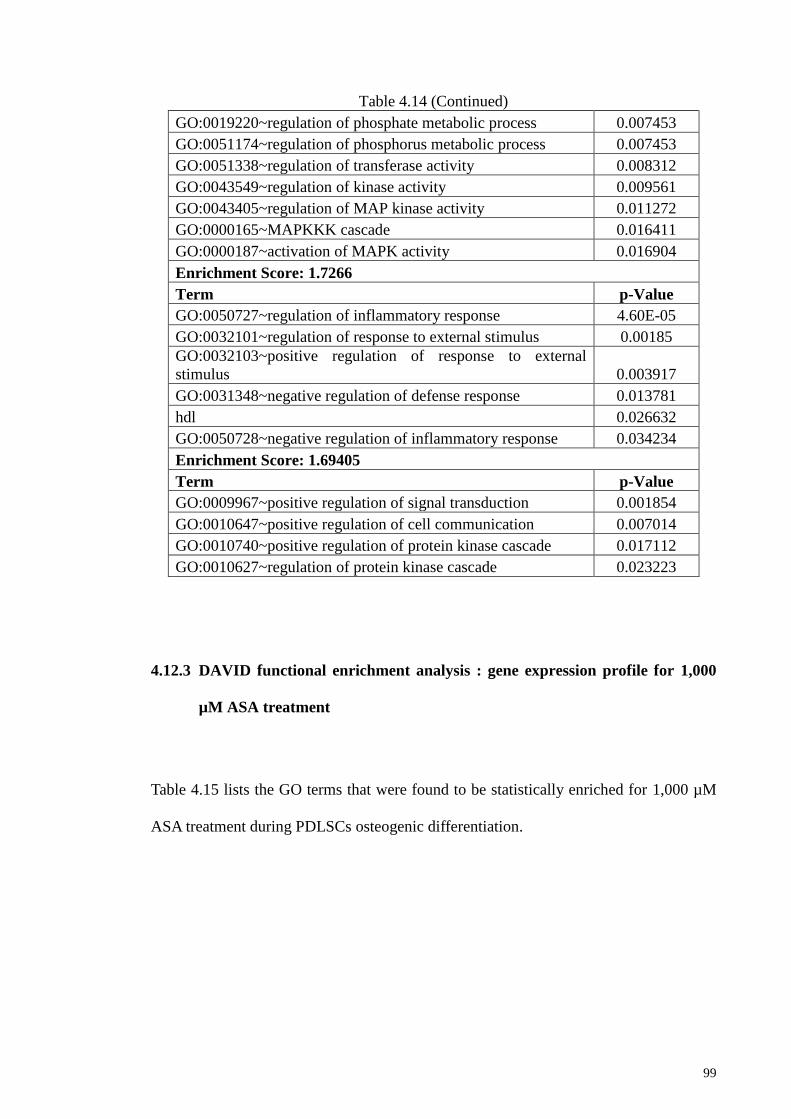
99
Table 4.14 (Continued)
GO:0019220~regulation of phosphate metabolic process 0.007453
GO:0051174~regulation of phosphorus metabolic process 0.007453
GO:0051338~regulation of transferase activity 0.008312
GO:0043549~regulation of kinase activity 0.009561
GO:0043405~regulation of MAP kinase activity 0.011272
GO:0000165~MAPKKK cascade 0.016411
GO:0000187~activation of MAPK activity 0.016904
Enrichment Score: 1.7266
Term p-Value
GO:0050727~regulation of inflammatory response 4.60E-05
GO:0032101~regulation of response to external stimulus 0.00185
GO:0032103~positive regulation of response to external
stimulus 0.003917
GO:0031348~negative regulation of defense response 0.013781
hdl 0.026632
GO:0050728~negative regulation of inflammatory response 0.034234
Enrichment Score: 1.69405
Term p-Value
GO:0009967~positive regulation of signal transduction 0.001854
GO:0010647~positive regulation of cell communication 0.007014
GO:0010740~positive regulation of protein kinase cascade 0.017112
GO:0010627~regulation of protein kinase cascade 0.023223
4.12.3 DAVID functional enrichment analysis : gene expression profile for 1,000
µM ASA treatment
Table 4.15 lists the GO terms that were found to be statistically enriched for 1,000 µM
ASA treatment during PDLSCs osteogenic differentiation.
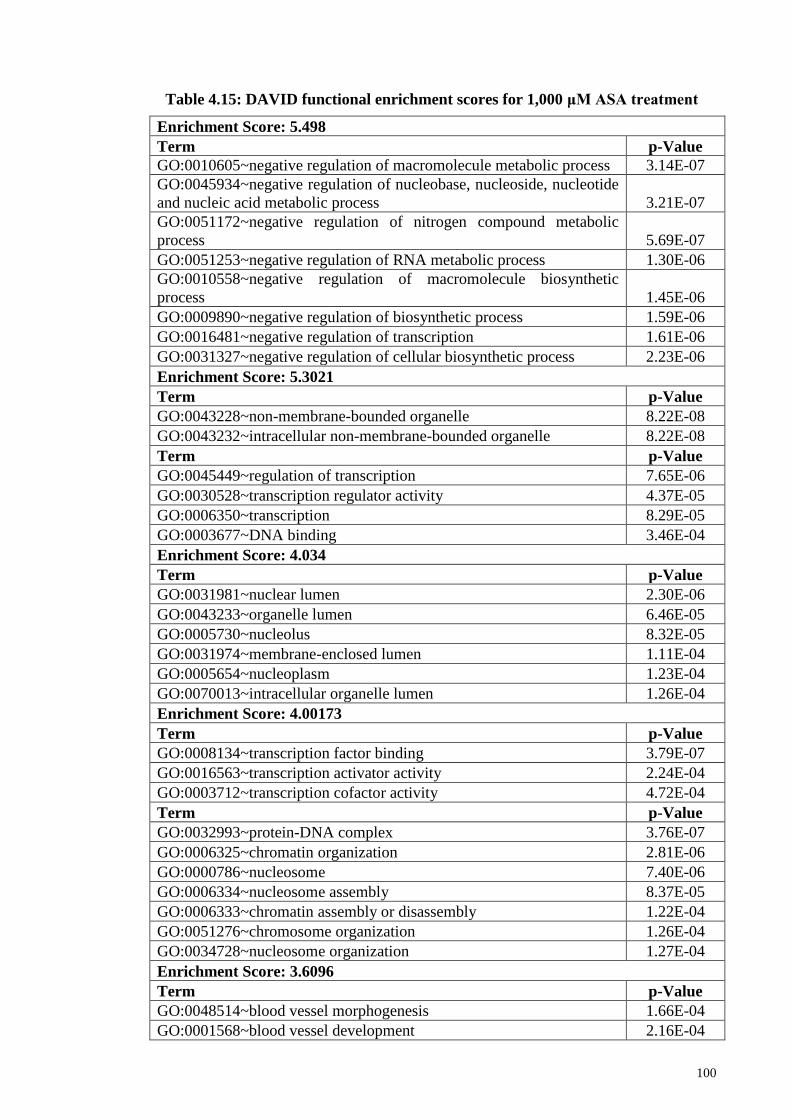
100
Enrichment Score: 5.498
Term p-Value
GO:0010605~negative regulation of macromolecule metabolic process 3.14E-07
GO:0045934~negative regulation of nucleobase, nucleoside, nucleotide
and nucleic acid metabolic process 3.21E-07
GO:0051172~negative regulation of nitrogen compound metabolic
process 5.69E-07
GO:0051253~negative regulation of RNA metabolic process 1.30E-06
GO:0010558~negative regulation of macromolecule biosynthetic
process 1.45E-06
GO:0009890~negative regulation of biosynthetic process 1.59E-06
GO:0016481~negative regulation of transcription 1.61E-06
GO:0031327~negative regulation of cellular biosynthetic process 2.23E-06
Enrichment Score: 5.3021
Term p-Value
GO:0043228~non-membrane-bounded organelle 8.22E-08
GO:0043232~intracellular non-membrane-bounded organelle 8.22E-08
Term p-Value
GO:0045449~regulation of transcription 7.65E-06
GO:0030528~transcription regulator activity 4.37E-05
GO:0006350~transcription 8.29E-05
GO:0003677~DNA binding 3.46E-04
Enrichment Score: 4.034
Term p-Value
GO:0031981~nuclear lumen 2.30E-06
GO:0043233~organelle lumen 6.46E-05
GO:0005730~nucleolus 8.32E-05
GO:0031974~membrane-enclosed lumen 1.11E-04
GO:0005654~nucleoplasm 1.23E-04
GO:0070013~intracellular organelle lumen 1.26E-04
Enrichment Score: 4.00173
Term p-Value
GO:0008134~transcription factor binding 3.79E-07
GO:0016563~transcription activator activity 2.24E-04
GO:0003712~transcription cofactor activity 4.72E-04
Term p-Value
GO:0032993~protein-DNA complex 3.76E-07
GO:0006325~chromatin organization 2.81E-06
GO:0000786~nucleosome 7.40E-06
GO:0006334~nucleosome assembly 8.37E-05
GO:0006333~chromatin assembly or disassembly 1.22E-04
GO:0051276~chromosome organization 1.26E-04
GO:0034728~nucleosome organization 1.27E-04
Enrichment Score: 3.6096
Term p-Value
GO:0048514~blood vessel morphogenesis 1.66E-04
GO:0001568~blood vessel development 2.16E-04
Table 4.15: DAVID functional enrichment scores for 1,000 μM ASA treatment
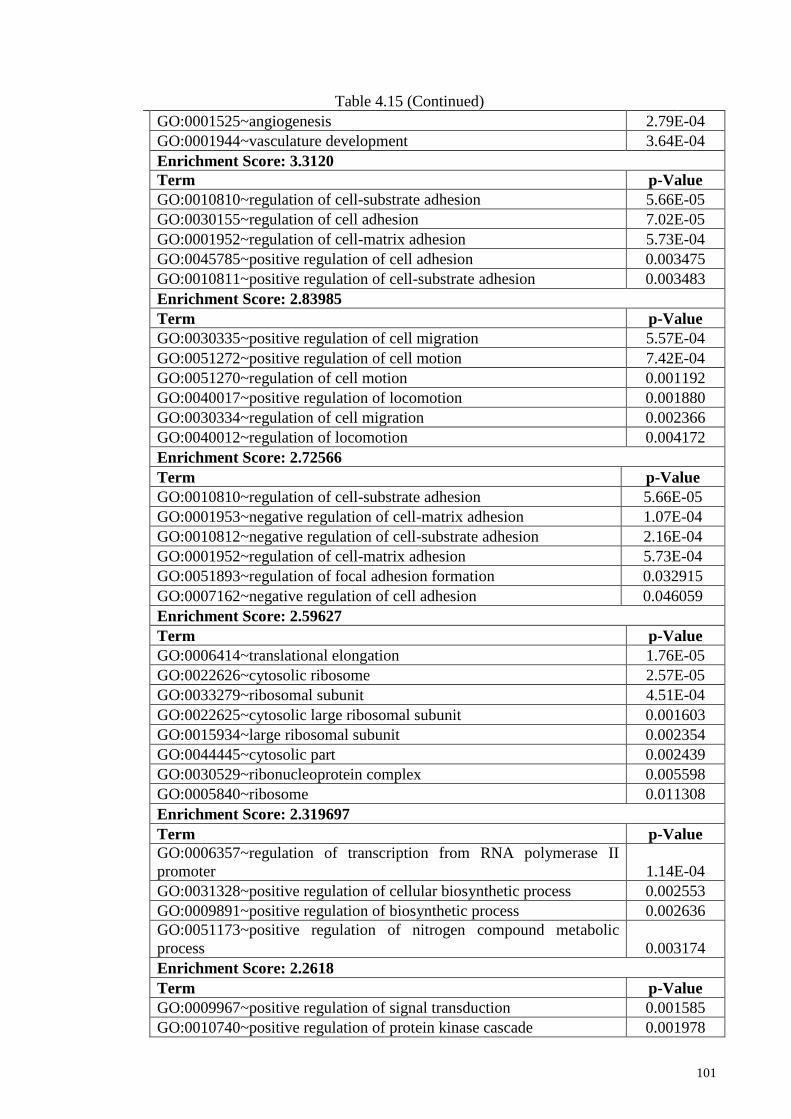
101
Table 4.15 (Continued)
GO:0001525~angiogenesis 2.79E-04
GO:0001944~vasculature development 3.64E-04
Enrichment Score: 3.3120
Term p-Value
GO:0010810~regulation of cell-substrate adhesion 5.66E-05
GO:0030155~regulation of cell adhesion 7.02E-05
GO:0001952~regulation of cell-matrix adhesion 5.73E-04
GO:0045785~positive regulation of cell adhesion 0.003475
GO:0010811~positive regulation of cell-substrate adhesion 0.003483
Enrichment Score: 2.83985
Term p-Value
GO:0030335~positive regulation of cell migration 5.57E-04
GO:0051272~positive regulation of cell motion 7.42E-04
GO:0051270~regulation of cell motion 0.001192
GO:0040017~positive regulation of locomotion 0.001880
GO:0030334~regulation of cell migration 0.002366
GO:0040012~regulation of locomotion 0.004172
Enrichment Score: 2.72566
Term p-Value
GO:0010810~regulation of cell-substrate adhesion 5.66E-05
GO:0001953~negative regulation of cell-matrix adhesion 1.07E-04
GO:0010812~negative regulation of cell-substrate adhesion 2.16E-04
GO:0001952~regulation of cell-matrix adhesion 5.73E-04
GO:0051893~regulation of focal adhesion formation 0.032915
GO:0007162~negative regulation of cell adhesion 0.046059
Enrichment Score: 2.59627
Term p-Value
GO:0006414~translational elongation 1.76E-05
GO:0022626~cytosolic ribosome 2.57E-05
GO:0033279~ribosomal subunit 4.51E-04
GO:0022625~cytosolic large ribosomal subunit 0.001603
GO:0015934~large ribosomal subunit 0.002354
GO:0044445~cytosolic part 0.002439
GO:0030529~ribonucleoprotein complex 0.005598
GO:0005840~ribosome 0.011308
Enrichment Score: 2.319697
Term p-Value
GO:0006357~regulation of transcription from RNA polymerase II
promoter 1.14E-04
GO:0031328~positive regulation of cellular biosynthetic process 0.002553
GO:0009891~positive regulation of biosynthetic process 0.002636
GO:0051173~positive regulation of nitrogen compound metabolic
process 0.003174
Enrichment Score: 2.2618
Term p-Value
GO:0009967~positive regulation of signal transduction 0.001585
GO:0010740~positive regulation of protein kinase cascade 0.001978
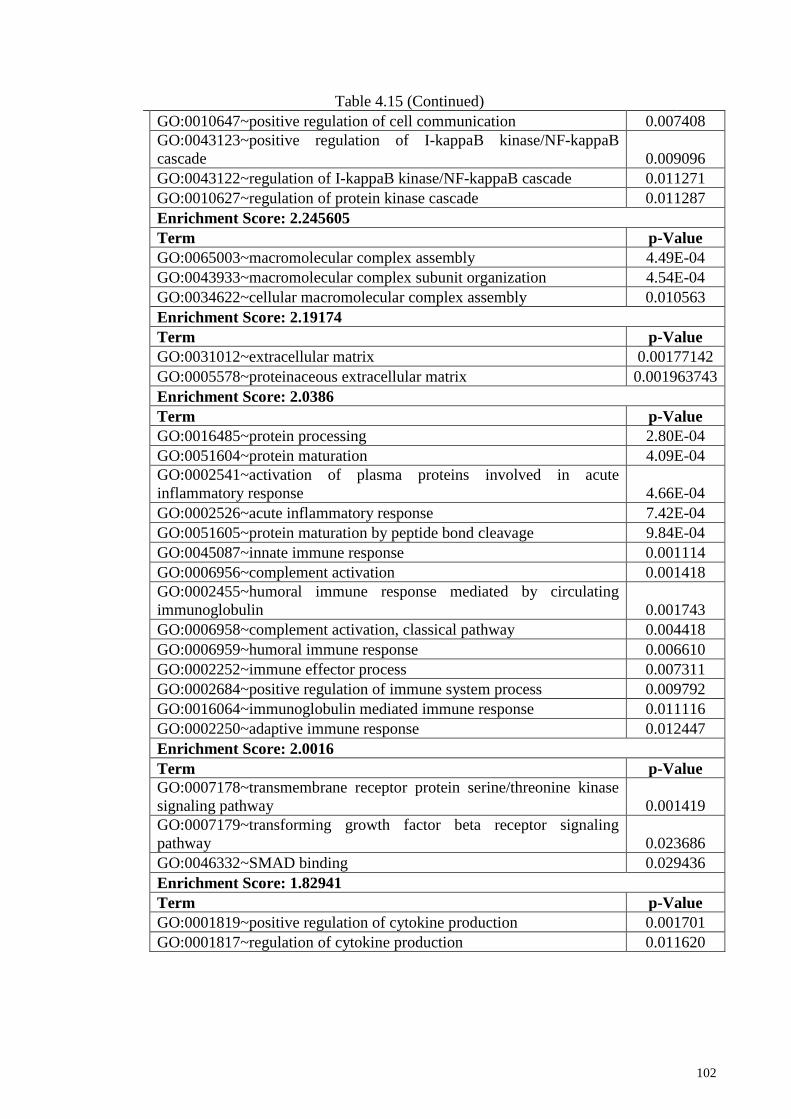
102
Table 4.15 (Continued)
GO:0010647~positive regulation of cell communication 0.007408
GO:0043123~positive regulation of I-kappaB kinase/NF-kappaB
cascade 0.009096
GO:0043122~regulation of I-kappaB kinase/NF-kappaB cascade 0.011271
GO:0010627~regulation of protein kinase cascade 0.011287
Enrichment Score: 2.245605
Term p-Value
GO:0065003~macromolecular complex assembly 4.49E-04
GO:0043933~macromolecular complex subunit organization 4.54E-04
GO:0034622~cellular macromolecular complex assembly 0.010563
Enrichment Score: 2.19174
Term p-Value
GO:0031012~extracellular matrix 0.00177142
GO:0005578~proteinaceous extracellular matrix 0.001963743
Enrichment Score: 2.0386
Term p-Value
GO:0016485~protein processing 2.80E-04
GO:0051604~protein maturation 4.09E-04
GO:0002541~activation of plasma proteins involved in acute
inflammatory response 4.66E-04
GO:0002526~acute inflammatory response 7.42E-04
GO:0051605~protein maturation by peptide bond cleavage 9.84E-04
GO:0045087~innate immune response 0.001114
GO:0006956~complement activation 0.001418
GO:0002455~humoral immune response mediated by circulating
immunoglobulin 0.001743
GO:0006958~complement activation, classical pathway 0.004418
GO:0006959~humoral immune response 0.006610
GO:0002252~immune effector process 0.007311
GO:0002684~positive regulation of immune system process 0.009792
GO:0016064~immunoglobulin mediated immune response 0.011116
GO:0002250~adaptive immune response 0.012447
Enrichment Score: 2.0016
Term p-Value
GO:0007178~transmembrane receptor protein serine/threonine kinase
signaling pathway 0.001419
GO:0007179~transforming growth factor beta receptor signaling
pathway 0.023686
GO:0046332~SMAD binding 0.029436
Enrichment Score: 1.82941
Term p-Value
GO:0001819~positive regulation of cytokine production 0.001701
GO:0001817~regulation of cytokine production 0.011620
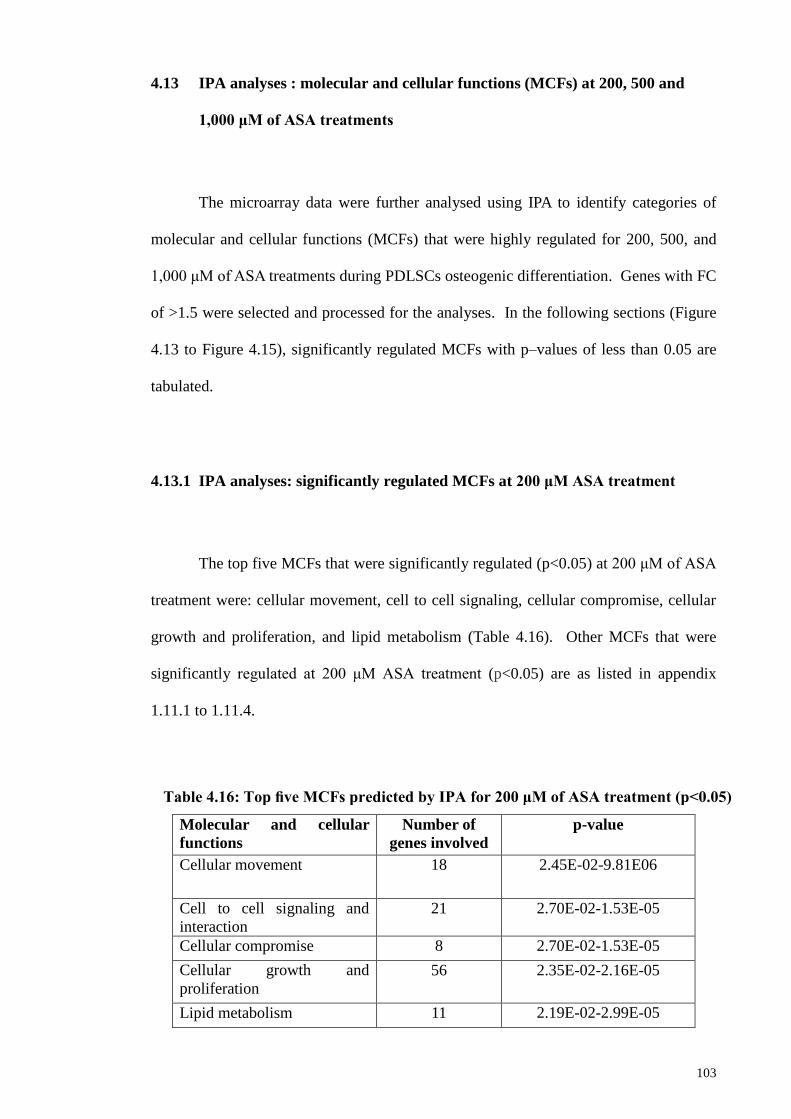
103
4.13 IPA analyses : molecular and cellular functions (MCFs) at 200, 500 and
1,000 μM of ASA treatments
The microarray data were further analysed using IPA to identify categories of
molecular and cellular functions (MCFs) that were highly regulated for 200, 500, and
1,000 μM of ASA treatments during PDLSCs osteogenic differentiation. Genes with FC
of >1.5 were selected and processed for the analyses. In the following sections (Figure
4.13 to Figure 4.15), significantly regulated MCFs with p–values of less than 0.05 are
tabulated.
4.13.1 IPA analyses: significantly regulated MCFs at 200 μM ASA treatment
The top five MCFs that were significantly regulated (p<0.05) at 200 μM of ASA
treatment were: cellular movement, cell to cell signaling, cellular compromise, cellular
growth and proliferation, and lipid metabolism (Table 4.16). Other MCFs that were
significantly regulated at 200 μM ASA treatment (p<0.05) are as listed in appendix
1.11.1 to 1.11.4.
Molecular and cellular
functions
Number of
genes involved
p-value
Cellular movement 18 2.45E-02-9.81E06
Cell to cell signaling and
interaction
21 2.70E-02-1.53E-05
Cellular compromise 8 2.70E-02-1.53E-05
Cellular growth and
proliferation
56 2.35E-02-2.16E-05
Lipid metabolism 11 2.19E-02-2.99E-05
Table 4.16: Top five MCFs predicted by IPA for 200 μM of ASA treatment (p<0.05)
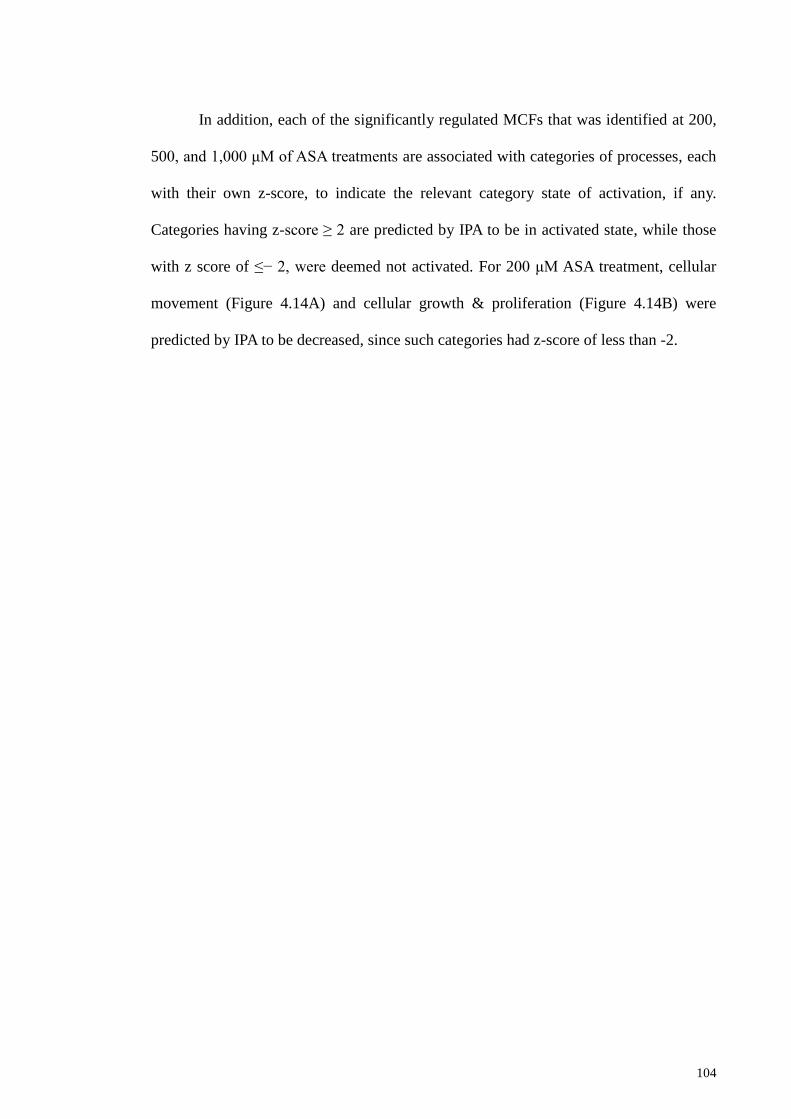
104
In addition, each of the significantly regulated MCFs that was identified at 200,
500, and 1,000 μM of ASA treatments are associated with categories of processes, each
with their own z-score, to indicate the relevant category state of activation, if any.
Categories having z-score ≥ 2 are predicted by IPA to be in activated state, while those
with z score of ≤− 2, were deemed not activated. For 200 μM ASA treatment, cellular
movement (Figure 4.14A) and cellular growth & proliferation (Figure 4.14B) were
predicted by IPA to be decreased, since such categories had z-score of less than -2.
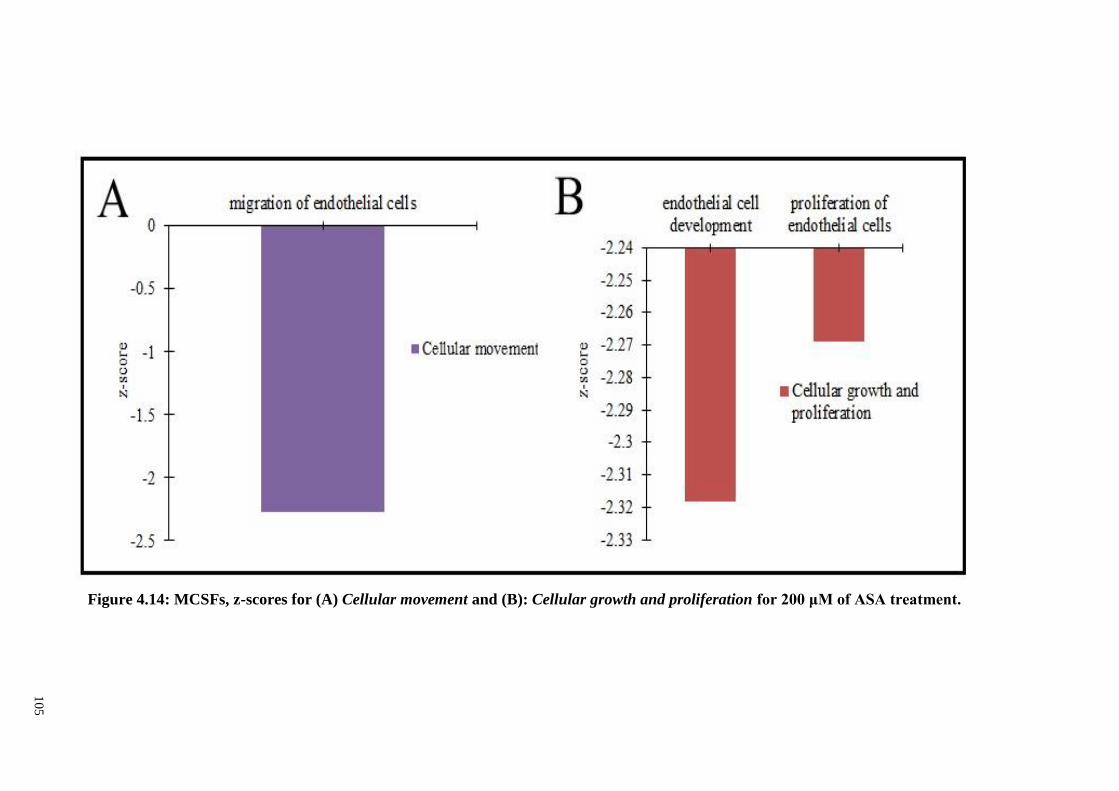
10
5
Figure 4.14: MCSFs, z-scores for (A) Cellular movement and (B): Cellular growth and proliferation for 200 μM of ASA treatment.s
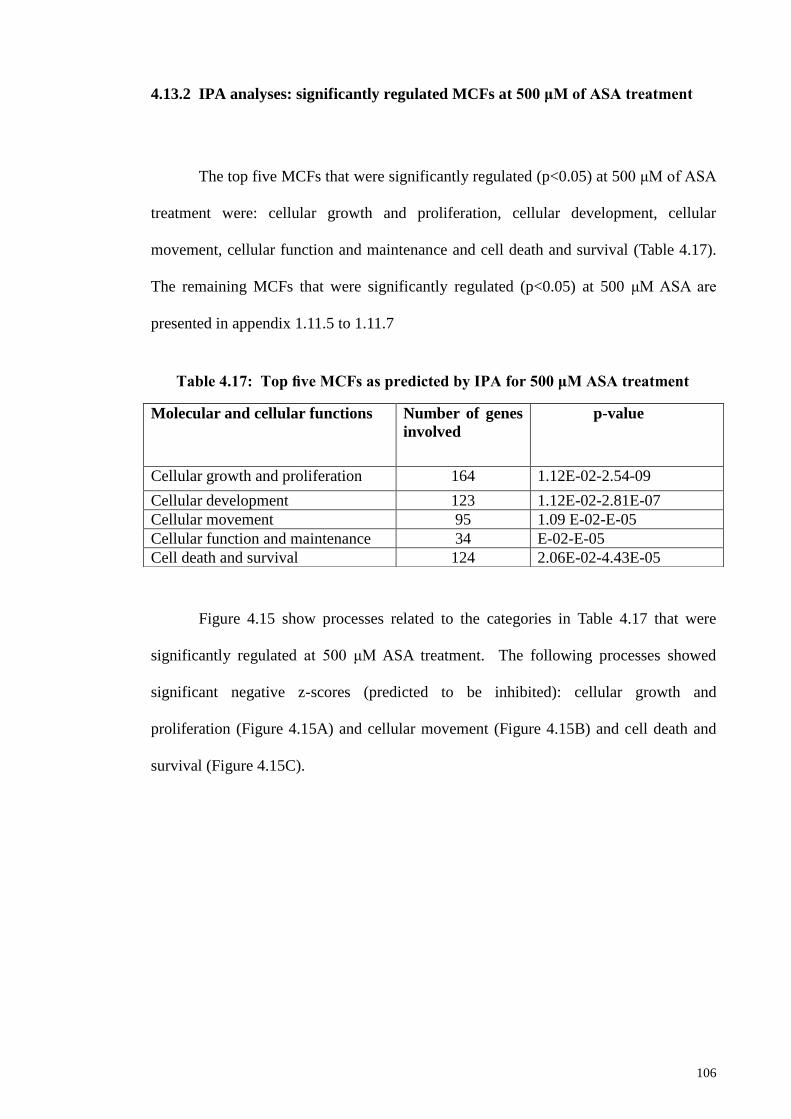
106
4.13.2 IPA analyses: significantly regulated MCFs at 500 μM of ASA treatment
The top five MCFs that were significantly regulated (p<0.05) at 500 μM of ASA
treatment were: cellular growth and proliferation, cellular development, cellular
movement, cellular function and maintenance and cell death and survival (Table 4.17).
The remaining MCFs that were significantly regulated (p<0.05) at 500 μM ASA are
presented in appendix 1.11.5 to 1.11.7
Figure 4.15 show processes related to the categories in Table 4.17 that were
significantly regulated at 500 μM ASA treatment. The following processes showed
significant negative z-scores (predicted to be inhibited): cellular growth and
proliferation (Figure 4.15A) and cellular movement (Figure 4.15B) and cell death and
survival (Figure 4.15C).
Molecular and cellular functions Number of genes
involved
p-value
Cellular growth and proliferation 164 1.12E-02-2.54-09
Cellular development 123 1.12E-02-2.81E-07
Cellular movement 95 1.09 E-02-E-05
Cellular function and maintenance 34 E-02-E-05
Cell death and survival 124 2.06E-02-4.43E-05
Table 4.17: Top five MCFs as predicted by IPA for 500 μM ASA treatment
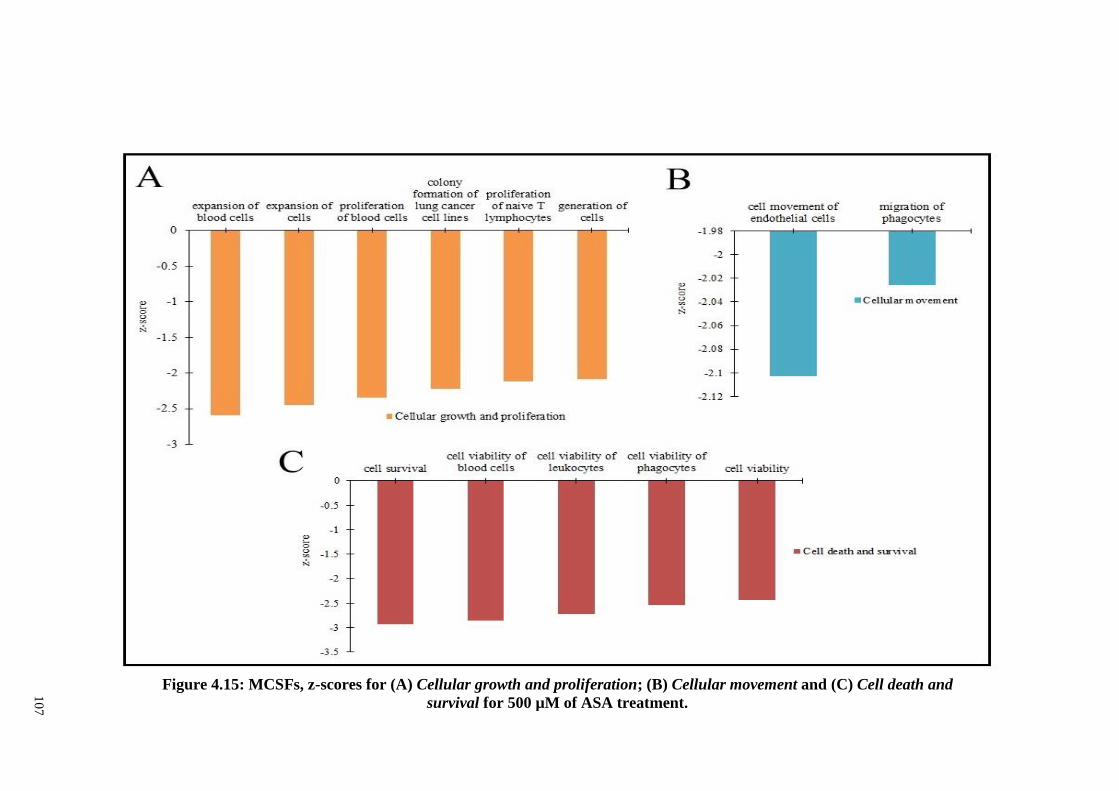
10
7
Figure 4.15: MCSFs, z-scores for (A) Cellular growth and proliferation; (B) Cellular movement and (C) Cell death and
survival for 500 µM of ASA treatment.
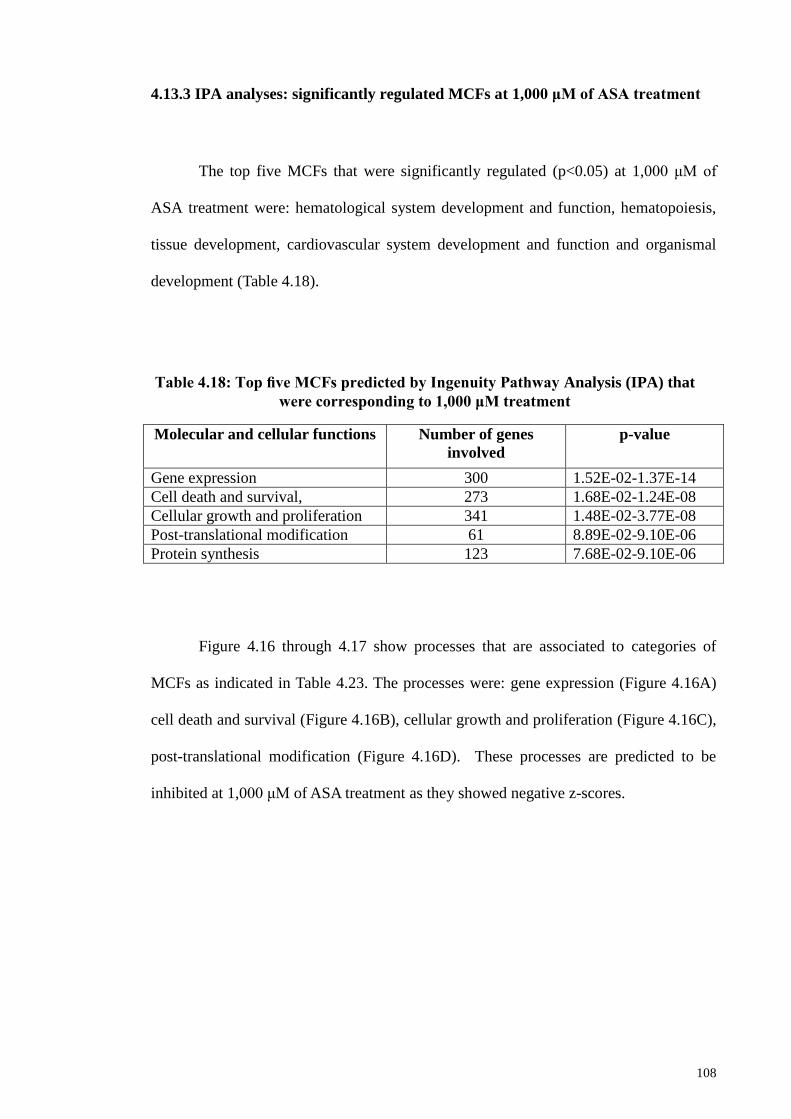
108
4.13.3 IPA analyses: significantly regulated MCFs at 1,000 μM of ASA treatment
The top five MCFs that were significantly regulated (p<0.05) at 1,000 μM of
ASA treatment were: hematological system development and function, hematopoiesis,
tissue development, cardiovascular system development and function and organismal
development (Table 4.18).
Molecular and cellular functions Number of genes
involved
p-value
Gene expression 300 1.52E-02-1.37E-14
Cell death and survival, 273 1.68E-02-1.24E-08
Cellular growth and proliferation 341 1.48E-02-3.77E-08
Post-translational modification 61 8.89E-02-9.10E-06
Protein synthesis 123 7.68E-02-9.10E-06
Figure 4.16 through 4.17 show processes that are associated to categories of
MCFs as indicated in Table 4.23. The processes were: gene expression (Figure 4.16A)
cell death and survival (Figure 4.16B), cellular growth and proliferation (Figure 4.16C),
post-translational modification (Figure 4.16D). These processes are predicted to be
inhibited at 1,000 μM of ASA treatment as they showed negative z-scores.
Table 4.18: Top five MCFs predicted by Ingenuity Pathway Analysis (IPA) that
were corresponding to 1,000 μM treatment
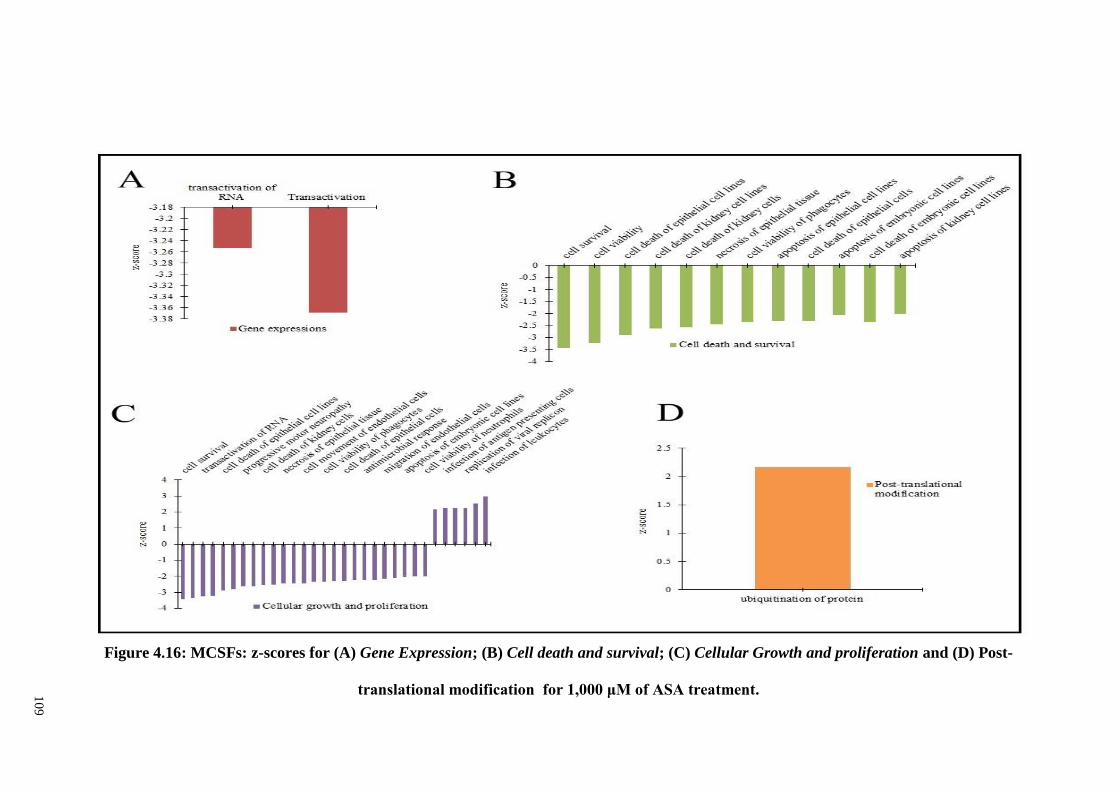
10
9
Figure 4.16: MCSFs: z-scores for (A) Gene Expression; (B) Cell death and survival; (C) Cellular Growth and proliferation and (D) Post-
translational modification for 1,000 μM of ASA treatment.
110
4.14 IPA prediction on the effect of ASA treatment on physiological system and
development functions (PSDF) in PDLSCs
IPA was used to predict the effect of ASA on physiological system and development in
PDLSCs. Genes with a FC of 1.5 (p<0.05) were selected for the analyses. The complete
list of PSDFs that are enriched is listed in appendix 1.10.
4.14.1 IPA analyses: PSD for 200 μM ASA treatment
The top five PSDFs predicted by IPA were: connective tissue development and function,
tissue development, organ development and skeletal and muscular system developments
and functions and hematological system development (Table 4.19).
Physiological system and
development
Number of molecules
associated
p-value
Connective tissue development and
function
6 1.36E02-2.16E05
Tissue development 35 2.70E02-2.16E05
Organ development 15 1.36E02-6.40E05
Skeletal and muscular system
developments and function
24 1.43E02-6.40E05
Hematological system development
and function
18 2.70E02-1.61E04
Table 4.19: Top five PSDFs predicted by IPA for 200 μM of ASA treatment
111
In addition, highly regulated category functions having z-score ≥ + 2, as are listed in
Figure 4.17.
4.14.2 IPA analyses: PSDFs for 500 μM ASA treatment
The top five PSDFs at 500 μM of ASA treatment (p<0.05) were: organ development,
skeletal and muscular development and function, tissue development, cardiovascular
system and development and organismal development (Table 4.20).
4.14.2 IPA analyses: PSDFs for 500 μM ASA treatment
The top five PSDFs at 500 μM of ASA treatment (p<0.05) were: organ development,
skeletal and muscular development and function, tissue development, cardiovascular
system and development and organismal development (Table 4.20).
Figure 4.17: PSDFs: z-scores for tissue development functions for 200 μM ASA
treatment.
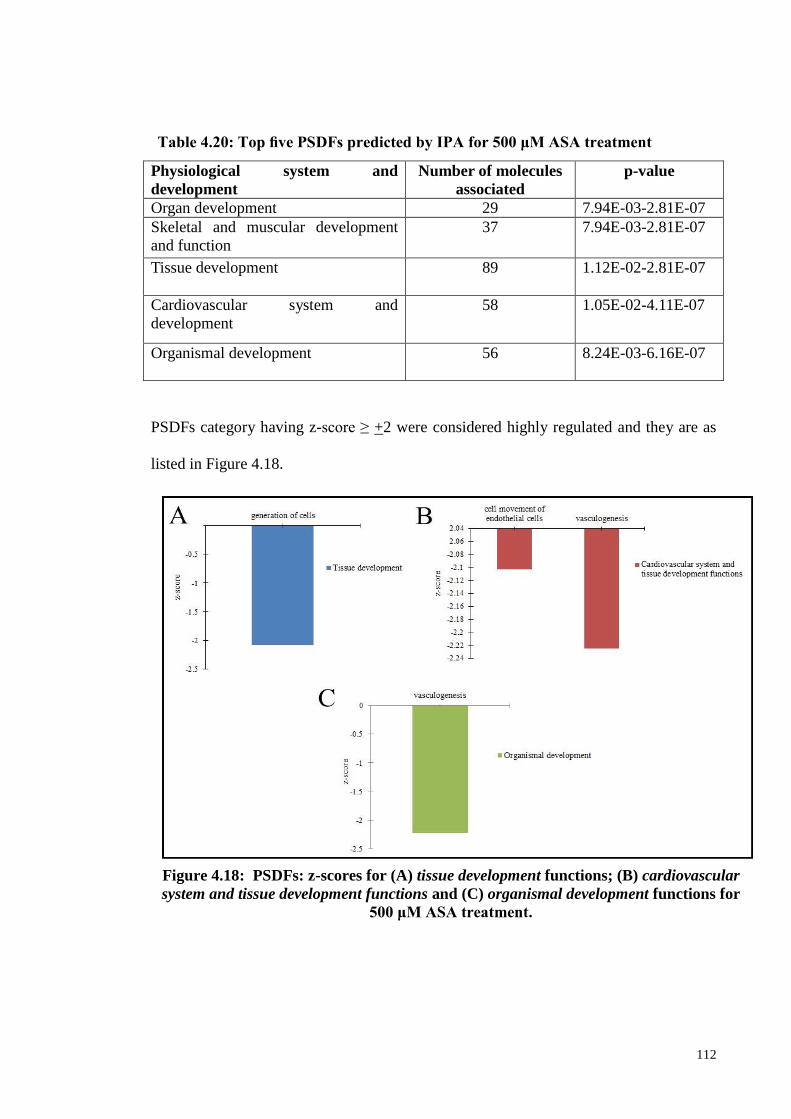
112
PSDFs category having z-score ≥ +2 were considered highly regulated and they are as
listed in Figure 4.18.
Physiological system and
development
Number of molecules
associated
p-value
Organ development 29 7.94E-03-2.81E-07
Skeletal and muscular development
and function
37
7.94E-03-2.81E-07
Tissue development 89 1.12E-02-2.81E-07
Cardiovascular system and
development
58 1.05E-02-4.11E-07
Organismal development 56 8.24E-03-6.16E-07
Table 4.20: Top five PSDFs predicted by IPA for 500 μM ASA treatment
Figure 4.18: PSDFs: z-scores for (A) tissue development functions; (B) cardiovascular
system and tissue development functions and (C) organismal development functions for
500 μM ASA treatment.
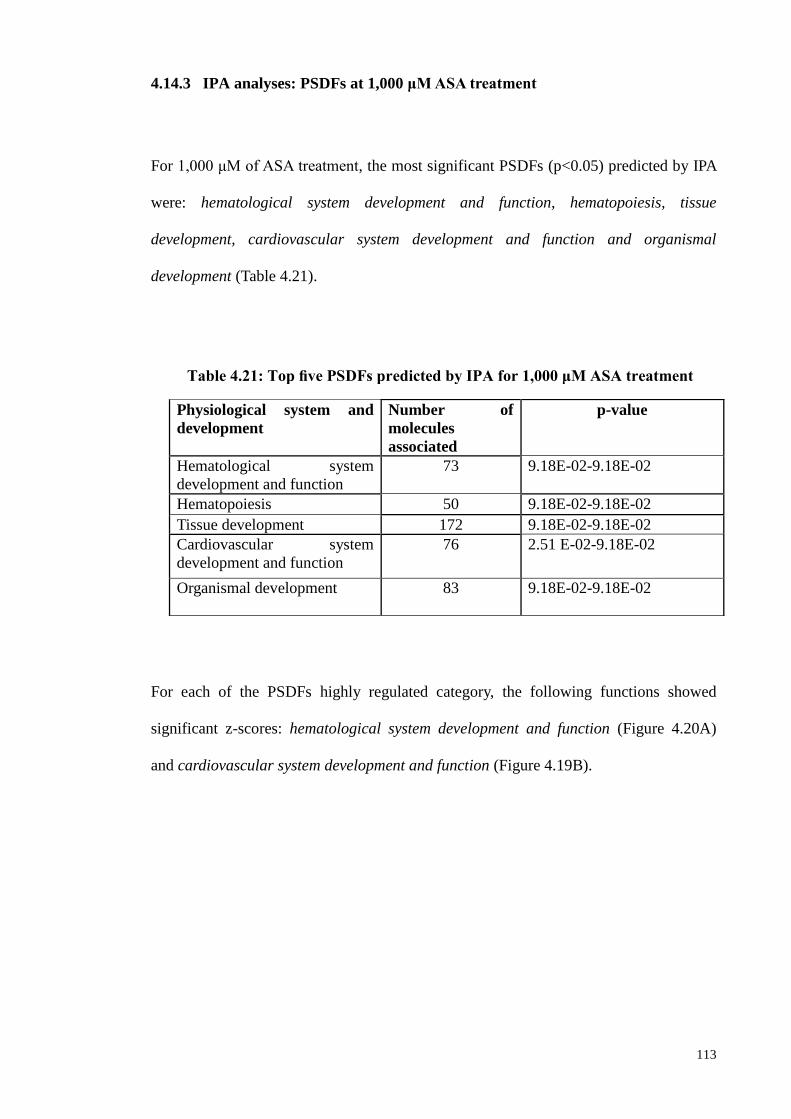
113
4.14.3 IPA analyses: PSDFs at 1,000 μM ASA treatment
For 1,000 μM of ASA treatment, the most significant PSDFs (p<0.05) predicted by IPA
were: hematological system development and function, hematopoiesis, tissue
development, cardiovascular system development and function and organismal
development (Table 4.21).
For each of the PSDFs highly regulated category, the following functions showed
significant z-scores: hematological system development and function (Figure 4.20A)
and cardiovascular system development and function (Figure 4.19B).
Physiological system and
development
Number of
molecules
associated
p-value
Hematological system
development and function
73 9.18E-02-9.18E-02
Hematopoiesis 50 9.18E-02-9.18E-02
Tissue development 172 9.18E-02-9.18E-02
Cardiovascular system
development and function
76 2.51 E-02-9.18E-02
Organismal development 83 9.18E-02-9.18E-02
Table 4.21: Top five PSDFs predicted by IPA for 1,000 μM ASA treatment
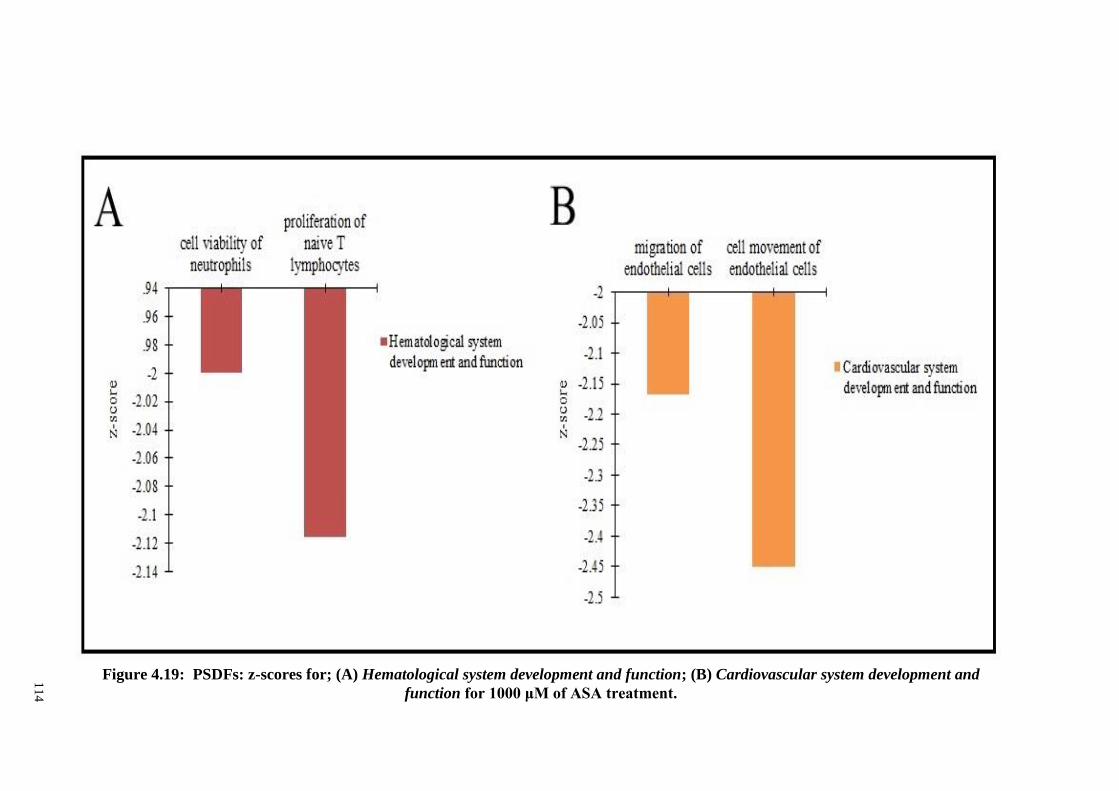
11
4
Figure 4.19: PSDFs: z-scores for; (A) Hematological system development and function; (B) Cardiovascular system development and
function for 1000 μM of ASA treatment.
115
4.15 Upstream regulators analysis (URA)
URA was done using IPA. It provided a small list of inferred upstream
regulators based on the measured fold changes (FC) for each ASA treatment. It is
critical to infer the identity of upstream regulatory molecules and associated
mechanisms to provide biological insight to the observed expression changes. The
putative cascade of upstream transcriptional regulators (TRs) were identified through
upstream regulators (URs) which provided knowledge or information on the biological
activities occurring due to ASA treatments in PDL osteogenic differentiation. The
upstream TRs were measured based on p-value (p< 0.05) and activation z-score.
In addition, the z-score can be used to predict the UR activity independently.
The z-score is assigned for a likely activation based on comparison with a model rather
than on assigned random regulation directions. Upstream regulators with z-scores ≥ 2,
i.e., activated (or ≤− 2, i.e., inhibited) were considered significant. Significance criteria
were stringent for URA in order to focus on the most significantly regulated signalling
pathways.
The URA for 200 μM of ASA treatments are shown in Figure 4.20A. The IL-1
receptor antagonist (IL1RN) (z-score: + 2.219) was predicted to be activated, while
other cytokines including Periplakin (z-score:-2.236), tumor necrosis factor (TNF) (z-
score: -2.124), and interferon gamma (IFNG) (z-score: -2.884) were predicted to be
inhibited. The non-activation state of TNF, PPL, and IL1RN cytokines was also
predicted by IPA at 500 and 1,000 μM ASA treatments, with the following z-scores:
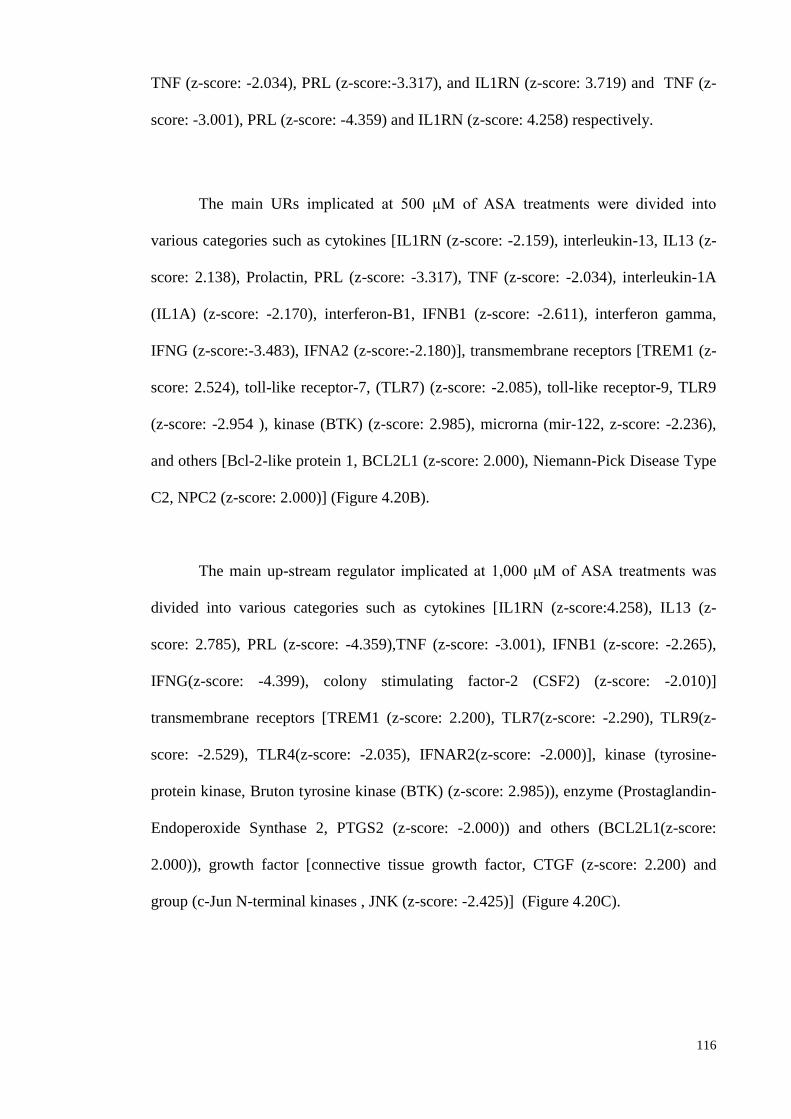
116
TNF (z-score: -2.034), PRL (z-score:-3.317), and IL1RN (z-score: 3.719) and TNF (z-
score: -3.001), PRL (z-score: -4.359) and IL1RN (z-score: 4.258) respectively.
The main URs implicated at 500 μM of ASA treatments were divided into
various categories such as cytokines [IL1RN (z-score: -2.159), interleukin-13, IL13 (z-
score: 2.138), Prolactin, PRL (z-score: -3.317), TNF (z-score: -2.034), interleukin-1A
(IL1A) (z-score: -2.170), interferon-B1, IFNB1 (z-score: -2.611), interferon gamma,
IFNG (z-score:-3.483), IFNA2 (z-score:-2.180)], transmembrane receptors [TREM1 (z-
score: 2.524), toll-like receptor-7, (TLR7) (z-score: -2.085), toll-like receptor-9, TLR9
(z-score: -2.954 ), kinase (BTK) (z-score: 2.985), microrna (mir-122, z-score: -2.236),
and others [Bcl-2-like protein 1, BCL2L1 (z-score: 2.000), Niemann-Pick Disease Type
C2, NPC2 (z-score: 2.000)] (Figure 4.20B).
The main up-stream regulator implicated at 1,000 μM of ASA treatments was
divided into various categories such as cytokines [IL1RN (z-score:4.258), IL13 (z-
score: 2.785), PRL (z-score: -4.359),TNF (z-score: -3.001), IFNB1 (z-score: -2.265),
IFNG(z-score: -4.399), colony stimulating factor-2 (CSF2) (z-score: -2.010)]
transmembrane receptors [TREM1 (z-score: 2.200), TLR7(z-score: -2.290), TLR9(z-
score: -2.529), TLR4(z-score: -2.035), IFNAR2(z-score: -2.000)], kinase (tyrosine-
protein kinase, Bruton tyrosine kinase (BTK) (z-score: 2.985)), enzyme (Prostaglandin-
Endoperoxide Synthase 2, PTGS2 (z-score: -2.000)) and others (BCL2L1(z-score:
2.000)), growth factor [connective tissue growth factor, CTGF (z-score: 2.200) and
group (c-Jun N-terminal kinases , JNK (z-score: -2.425)] (Figure 4.20C).
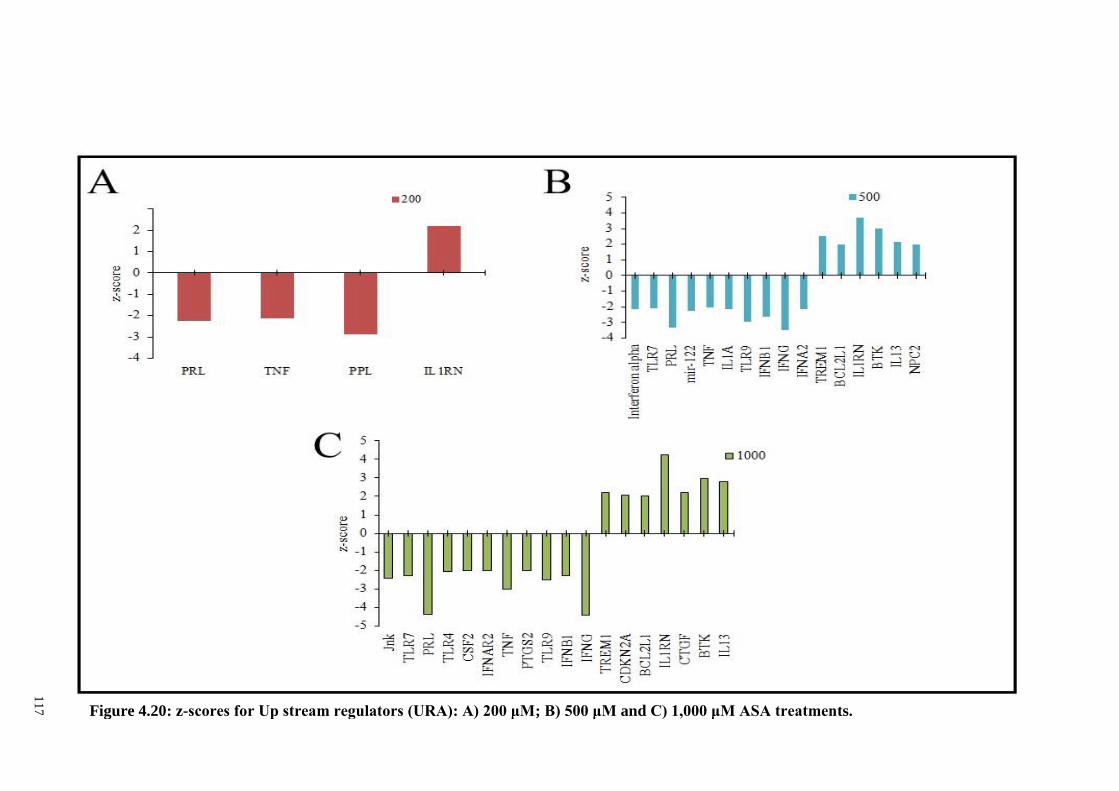
11
7
Figure 4.20: z-scores for Up stream regulators (URA): A) 200 μM; B) 500 μM and C) 1,000 μM ASA treatments.
118
4.15.1 Heat map of up-stream regulators – combined picture
Upstream analysis provided a list of inferred upstream regulators based upon
measured fold changes for each concentration of ASA treatments. The objective of the
URA is to identify a putative cascade of upstream transcriptional regulator (TRs) that
interpret the observed gene expression changes in a user’s dataset. Figure 4.21 depicts
the most enriched up-stream regulators at 200, 500, and 1,000 μM upon ASA treatments
according to the significant z-scores.
They can be seen to have similar patterns/consistent activation or inhibition at
all concentrations of ASA treatments. Few up-stream regulators were shown to activate
at all concentrations of ASA treatments including IL1RN and BTK. Meanwhile, few up
stream regulators were shown to activate at 500 and 1,000 μM of ASA treatments
including IL1RN, BTK, TREM1, IL13, and BCL2L1. The only up-stream regulator
seen to activate at 1,000 μM of ASA treatments is the CDKN2A.
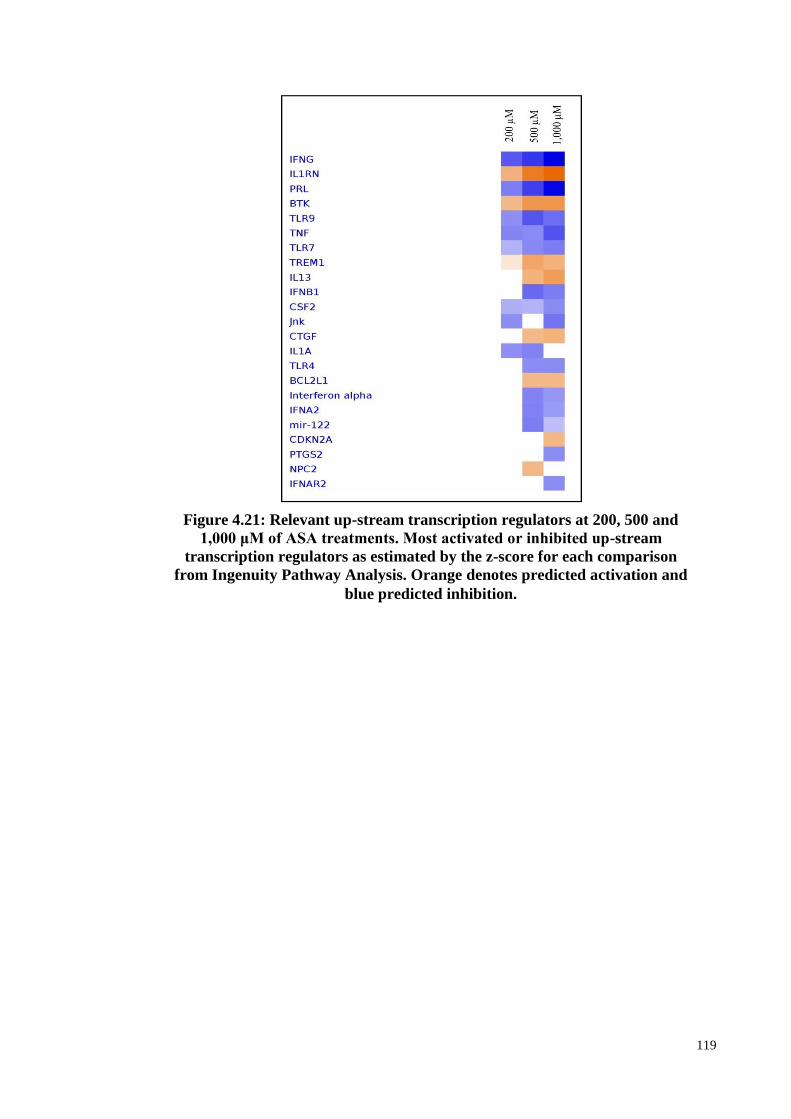
119
Figure 4.21: Relevant up-stream transcription regulators at 200, 500 and
1,000 μM of ASA treatments. Most activated or inhibited up-stream
transcription regulators as estimated by the z-score for each comparison
from Ingenuity Pathway Analysis. Orange denotes predicted activation and
blue predicted inhibition.
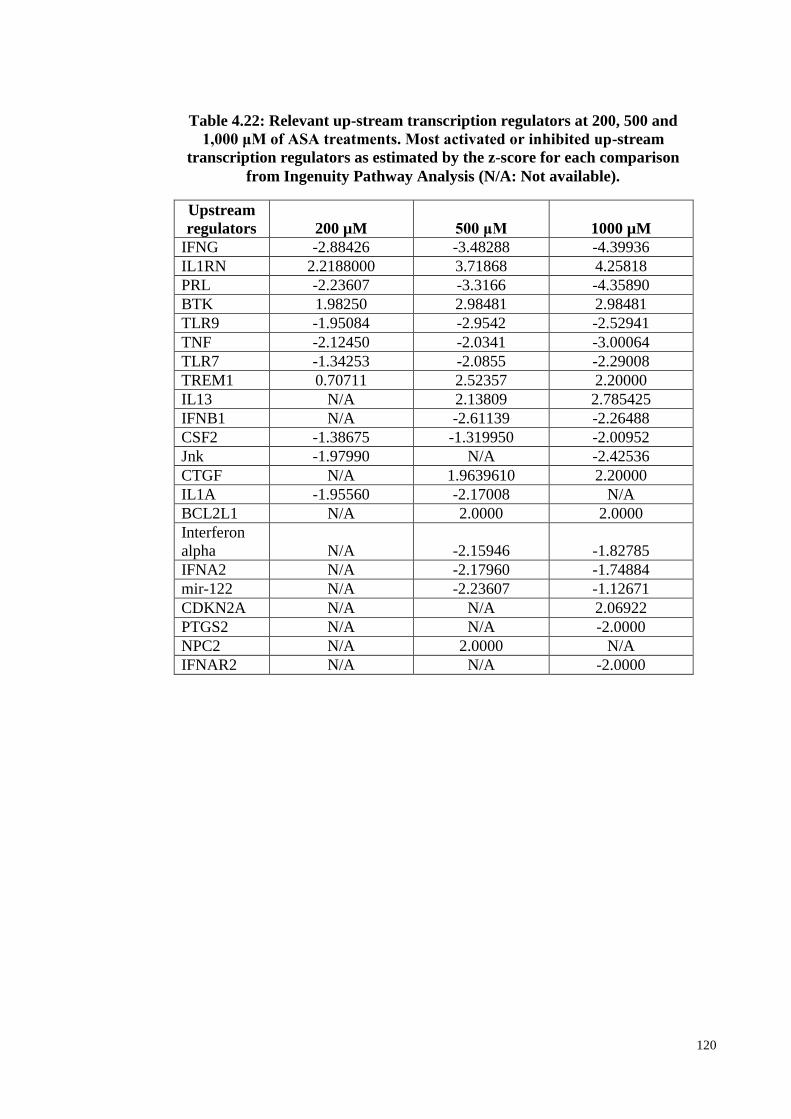
120
Upstream
regulators 200 µM 500 μM 1000 µM
IFNG -2.88426 -3.48288 -4.39936
IL1RN 2.2188000 3.71868 4.25818
PRL -2.23607 -3.3166 -4.35890
BTK 1.98250 2.98481 2.98481
TLR9 -1.95084 -2.9542 -2.52941
TNF -2.12450 -2.0341 -3.00064
TLR7 -1.34253 -2.0855 -2.29008
TREM1 0.70711 2.52357 2.20000
IL13 N/A 2.13809 2.785425
IFNB1 N/A -2.61139 -2.26488
CSF2 -1.38675 -1.319950 -2.00952
Jnk -1.97990 N/A -2.42536
CTGF N/A 1.9639610 2.20000
IL1A -1.95560 -2.17008 N/A
BCL2L1 N/A 2.0000 2.0000
Interferon
alpha N/A -2.15946 -1.82785
IFNA2 N/A -2.17960 -1.74884
mir-122 N/A -2.23607 -1.12671
CDKN2A N/A N/A 2.06922
PTGS2 N/A N/A -2.0000
NPC2 N/A 2.0000 N/A
IFNAR2 N/A N/A -2.0000
Table 4.22: Relevant up-stream transcription regulators at 200, 500 and
1,000 μM of ASA treatments. Most activated or inhibited up-stream
transcription regulators as estimated by the z-score for each comparison
from Ingenuity Pathway Analysis (N/A: Not available).
121
4.16 Canonical pathways (CP)
Canonical signaling pathways are characterized by the use of IPA software
according to the Ingenuity Pathway knowledge base (IPKB). They are ranked according
to the IPA calculated score and Fisher’s exact test, which are based on the significance
of the involved genes (p<0.05). A complete list of enriched of canonical pathway for all
ASA treatments can be found in supplementary (Table 1, 2 and 3) (p<0.05). The top 20
canonical signaling pathways that are significantly enriched (for ASA treatments at 200,
500 and 1,000 μM) are shown in Figure 4.22 (p<0.05).
Among the pathways that are significantly enriched were acute phase response
signaling, TR/RXR activation and role of macrophages, fibroblast and endothelial cells
in rheumatoid arthritis (Figure 4.22). Meanwhile the most significant canonical
pathway enriched in 200 and 500 μM ASA treatments were acute phase response
signaling, oxidative phosphorylation, role of macrophages, fibroblast and endothelial
cells in rheumatoid athritis. The pathway enriched was observed consistently in 500
and 1,000 μM ASA treatments including complement system, acute phase response
signaling, NRF-2 mediated oxidative stress response, role of macrophages, fibroblast
and end endothelial cells in rheumatoid athritis, LPS/IL-1 mediated inhibition of RXR
function and ethanol degradation II.
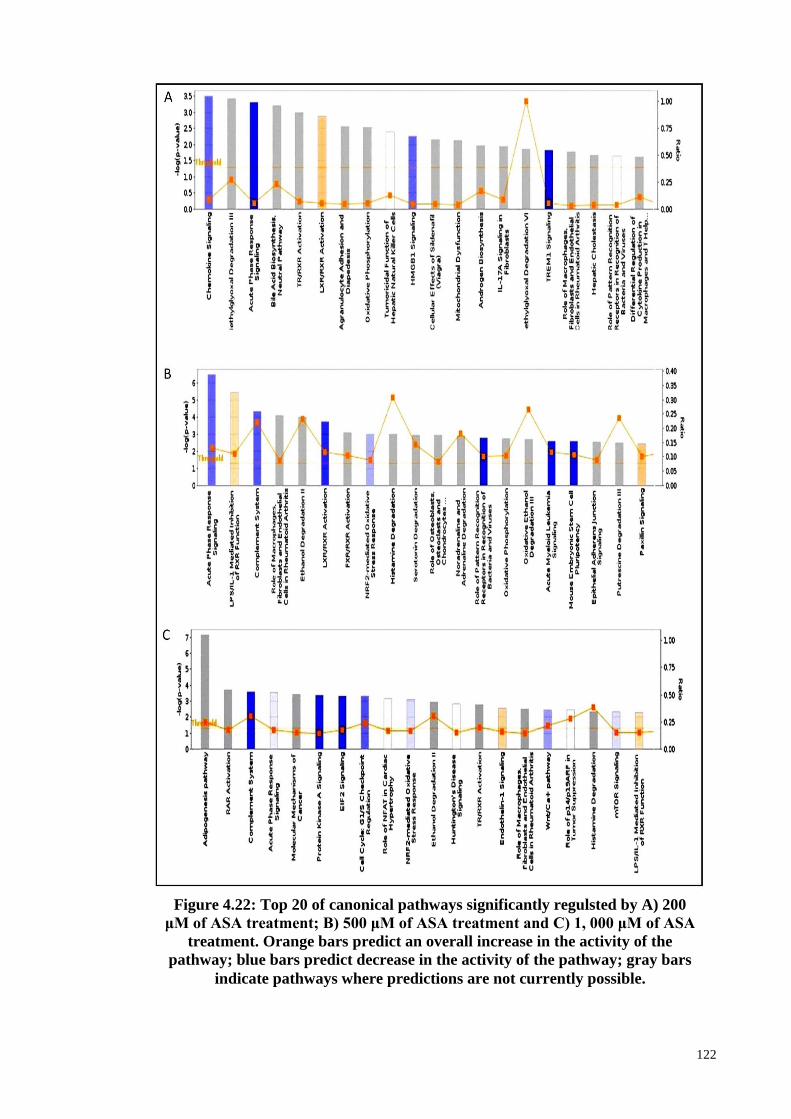
122
Figure 4.22: Top 20 of canonical pathways significantly regulsted by A) 200
μM of ASA treatment; B) 500 μM of ASA treatment and C) 1, 000 μM of ASA
treatment. Orange bars predict an overall increase in the activity of the
pathway; blue bars predict decrease in the activity of the pathway; gray bars
indicate pathways where predictions are not currently possible.
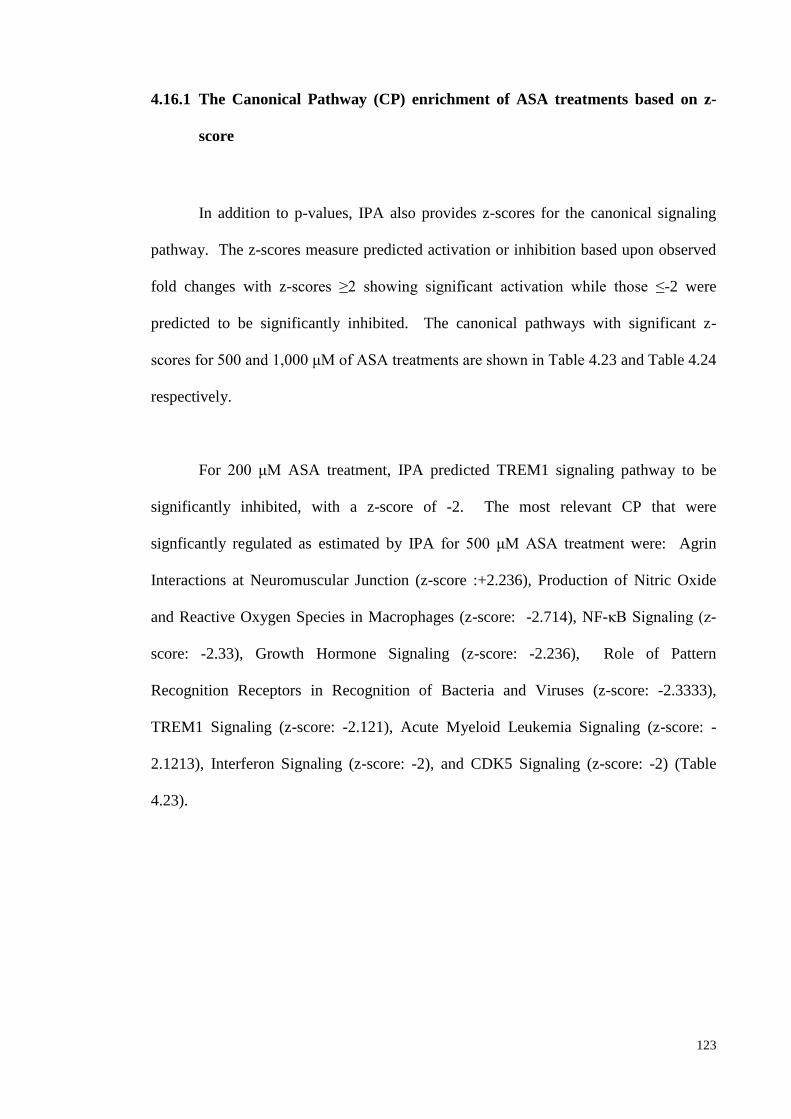
123
4.16.1 The Canonical Pathway (CP) enrichment of ASA treatments based on z-
score
In addition to p-values, IPA also provides z-scores for the canonical signaling
pathway. The z-scores measure predicted activation or inhibition based upon observed
fold changes with z-scores ≥2 showing significant activation while those ≤-2 were
predicted to be significantly inhibited. The canonical pathways with significant z-
scores for 500 and 1,000 μM of ASA treatments are shown in Table 4.23 and Table 4.24
respectively.
For 200 μM ASA treatment, IPA predicted TREM1 signaling pathway to be
significantly inhibited, with a z-score of -2. The most relevant CP that were
signficantly regulated as estimated by IPA for 500 μM ASA treatment were: Agrin
Interactions at Neuromuscular Junction (z-score :+2.236), Production of Nitric Oxide
and Reactive Oxygen Species in Macrophages (z-score: -2.714), NF-κB Signaling (z-
score: -2.33), Growth Hormone Signaling (z-score: -2.236), Role of Pattern
Recognition Receptors in Recognition of Bacteria and Viruses (z-score: -2.3333),
TREM1 Signaling (z-score: -2.121), Acute Myeloid Leukemia Signaling (z-score: -
2.1213), Interferon Signaling (z-score: -2), and CDK5 Signaling (z-score: -2) (Table
4.23).
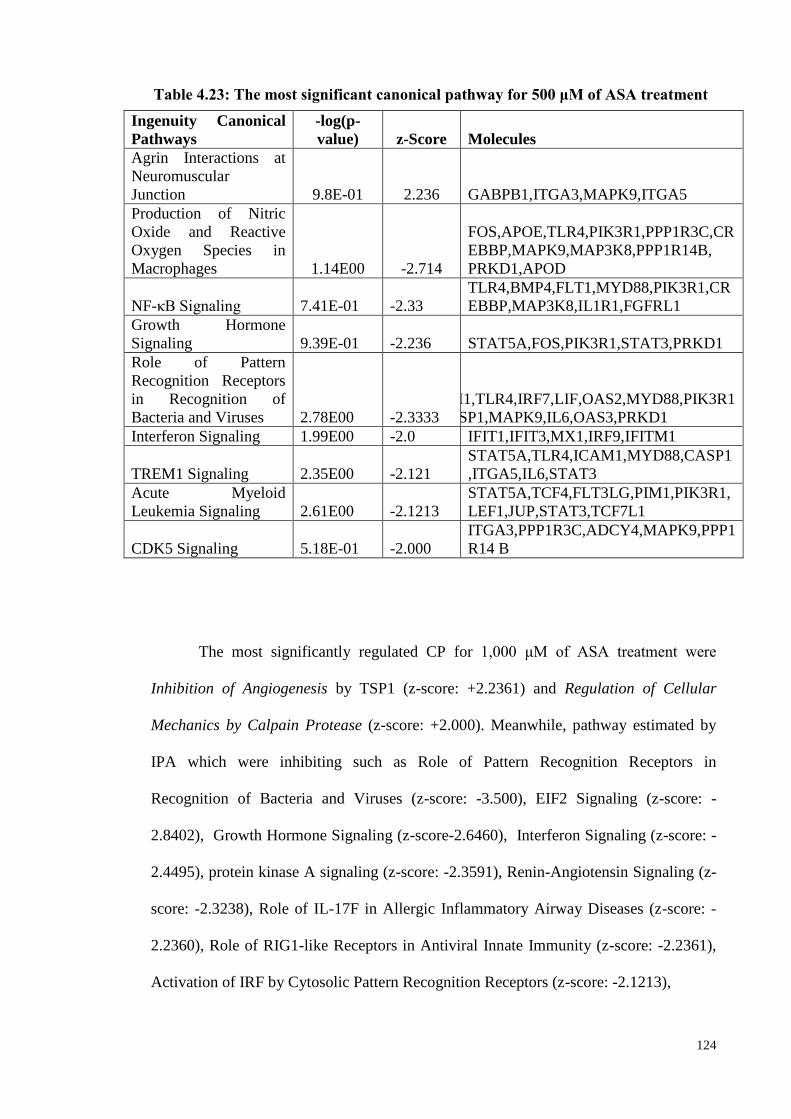
124
Ingenuity Canonical
Pathways
-log(p-
value) z-Score Molecules
Agrin Interactions at
Neuromuscular
Junction 9.8E-01 2.236 GABPB1,ITGA3,MAPK9,ITGA5
Production of Nitric
Oxide and Reactive
Oxygen Species in
Macrophages 1.14E00 -2.714
FOS,APOE,TLR4,PIK3R1,PPP1R3C,CR
EBBP,MAPK9,MAP3K8,PPP1R14B,
PRKD1,APOD
NF-κB Signaling 7.41E-01 -2.33
TLR4,BMP4,FLT1,MYD88,PIK3R1,CR
EBBP,MAP3K8,IL1R1,FGFRL1
Growth Hormone
Signaling 9.39E-01 -2.236 STAT5A,FOS,PIK3R1,STAT3,PRKD1
Role of Pattern
Recognition Receptors
in Recognition of
Bacteria and Viruses 2.78E00 -2.3333
IFIH1,TLR4,IRF7,LIF,OAS2,MYD88,PIK3R1
,CASP1,MAPK9,IL6,OAS3,PRKD1
Interferon Signaling 1.99E00 -2.0 IFIT1,IFIT3,MX1,IRF9,IFITM1
TREM1 Signaling 2.35E00 -2.121
STAT5A,TLR4,ICAM1,MYD88,CASP1
,ITGA5,IL6,STAT3
Acute Myeloid
Leukemia Signaling 2.61E00 -2.1213
STAT5A,TCF4,FLT3LG,PIM1,PIK3R1,
LEF1,JUP,STAT3,TCF7L1
CDK5 Signaling 5.18E-01 -2.000
ITGA3,PPP1R3C,ADCY4,MAPK9,PPP1
R14 B
The most significantly regulated CP for 1,000 μM of ASA treatment were
Inhibition of Angiogenesis by TSP1 (z-score: +2.2361) and Regulation of Cellular
Mechanics by Calpain Protease (z-score: +2.000). Meanwhile, pathway estimated by
IPA which were inhibiting such as Role of Pattern Recognition Receptors in
Recognition of Bacteria and Viruses (z-score: -3.500), EIF2 Signaling (z-score: -
2.8402), Growth Hormone Signaling (z-score-2.6460), Interferon Signaling (z-score: -
2.4495), protein kinase A signaling (z-score: -2.3591), Renin-Angiotensin Signaling (z-
score: -2.3238), Role of IL-17F in Allergic Inflammatory Airway Diseases (z-score: -
2.2360), Role of RIG1-like Receptors in Antiviral Innate Immunity (z-score: -2.2361),
Activation of IRF by Cytosolic Pattern Recognition Receptors (z-score: -2.1213),
Table 4.23: The most significant canonical pathway for 500 μM of ASA treatment

125
Production of Nitric Oxide and Reactive Oxygen Species in Macrophages (z-score: -
2.13201), Thrombopoietin Signaling(z-score: -2.1213), TREM1 Signaling (z-score: -
2.1106), Colorectal Cancer Metastasis Signaling (z-score : -2.0412) and NF-κB
Signaling (z-score: -2.0) (Table 4.24).
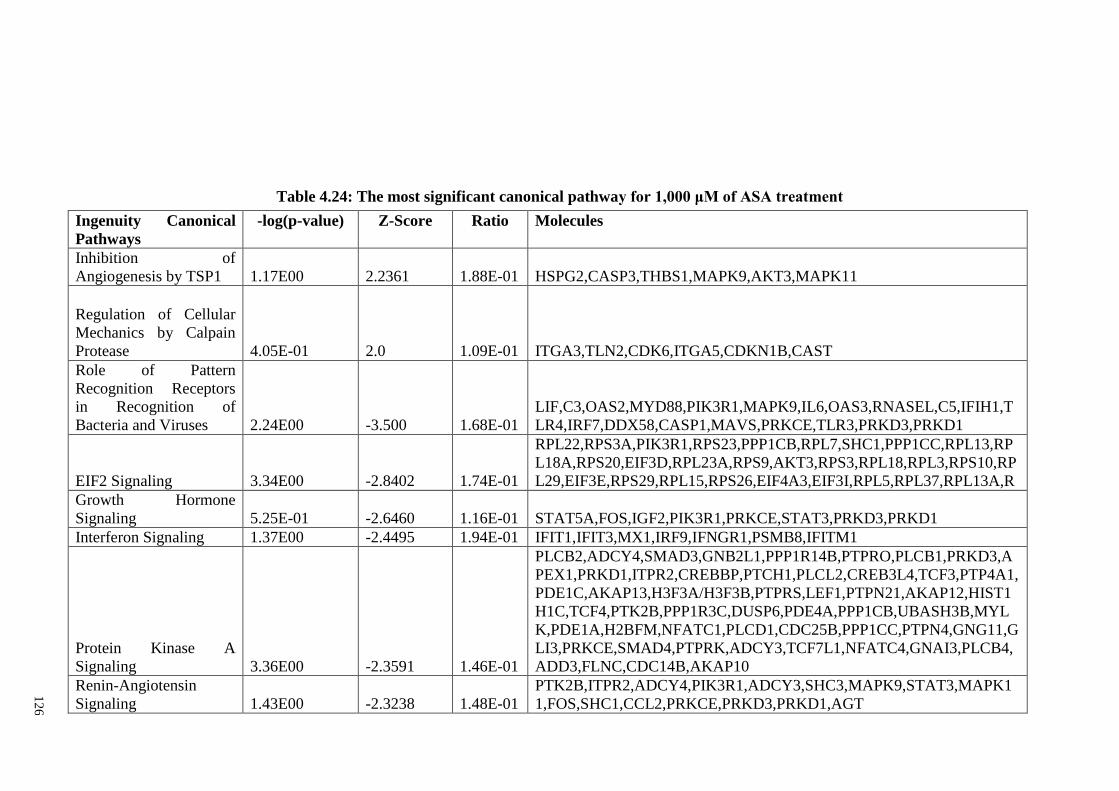
12
6
Table 4.24: The most significant canonical pathway for 1,000 μM of ASA treatment
Ingenuity Canonical
Pathways
-log(p-value) Z-Score Ratio Molecules
Inhibition of
Angiogenesis by TSP1 1.17E00 2.2361 1.88E-01 HSPG2,CASP3,THBS1,MAPK9,AKT3,MAPK11
Regulation of Cellular
Mechanics by Calpain
Protease 4.05E-01 2.0 1.09E-01 ITGA3,TLN2,CDK6,ITGA5,CDKN1B,CAST
Role of Pattern
Recognition Receptors
in Recognition of
Bacteria and Viruses 2.24E00 -3.500 1.68E-01
LIF,C3,OAS2,MYD88,PIK3R1,MAPK9,IL6,OAS3,RNASEL,C5,IFIH1,T
LR4,IRF7,DDX58,CASP1,MAVS,PRKCE,TLR3,PRKD3,PRKD1
EIF2 Signaling 3.34E00 -2.8402 1.74E-01
RPL22,RPS3A,PIK3R1,RPS23,PPP1CB,RPL7,SHC1,PPP1CC,RPL13,RP
L18A,RPS20,EIF3D,RPL23A,RPS9,AKT3,RPS3,RPL18,RPL3,RPS10,RP
L29,EIF3E,RPS29,RPL15,RPS26,EIF4A3,EIF3I,RPL5,RPL37,RPL13A,R
Growth Hormone
Signaling 5.25E-01 -2.6460 1.16E-01 STAT5A,FOS,IGF2,PIK3R1,PRKCE,STAT3,PRKD3,PRKD1
Interferon Signaling 1.37E00 -2.4495 1.94E-01 IFIT1,IFIT3,MX1,IRF9,IFNGR1,PSMB8,IFITM1
Protein Kinase A
Signaling 3.36E00 -2.3591 1.46E-01
PLCB2,ADCY4,SMAD3,GNB2L1,PPP1R14B,PTPRO,PLCB1,PRKD3,A
PEX1,PRKD1,ITPR2,CREBBP,PTCH1,PLCL2,CREB3L4,TCF3,PTP4A1,
PDE1C,AKAP13,H3F3A/H3F3B,PTPRS,LEF1,PTPN21,AKAP12,HIST1
H1C,TCF4,PTK2B,PPP1R3C,DUSP6,PDE4A,PPP1CB,UBASH3B,MYL
K,PDE1A,H2BFM,NFATC1,PLCD1,CDC25B,PPP1CC,PTPN4,GNG11,G
LI3,PRKCE,SMAD4,PTPRK,ADCY3,TCF7L1,NFATC4,GNAI3,PLCB4,
ADD3,FLNC,CDC14B,AKAP10
Renin-Angiotensin
Signaling 1.43E00 -2.3238 1.48E-01
PTK2B,ITPR2,ADCY4,PIK3R1,ADCY3,SHC3,MAPK9,STAT3,MAPK1
1,FOS,SHC1,CCL2,PRKCE,PRKD3,PRKD1,AGT
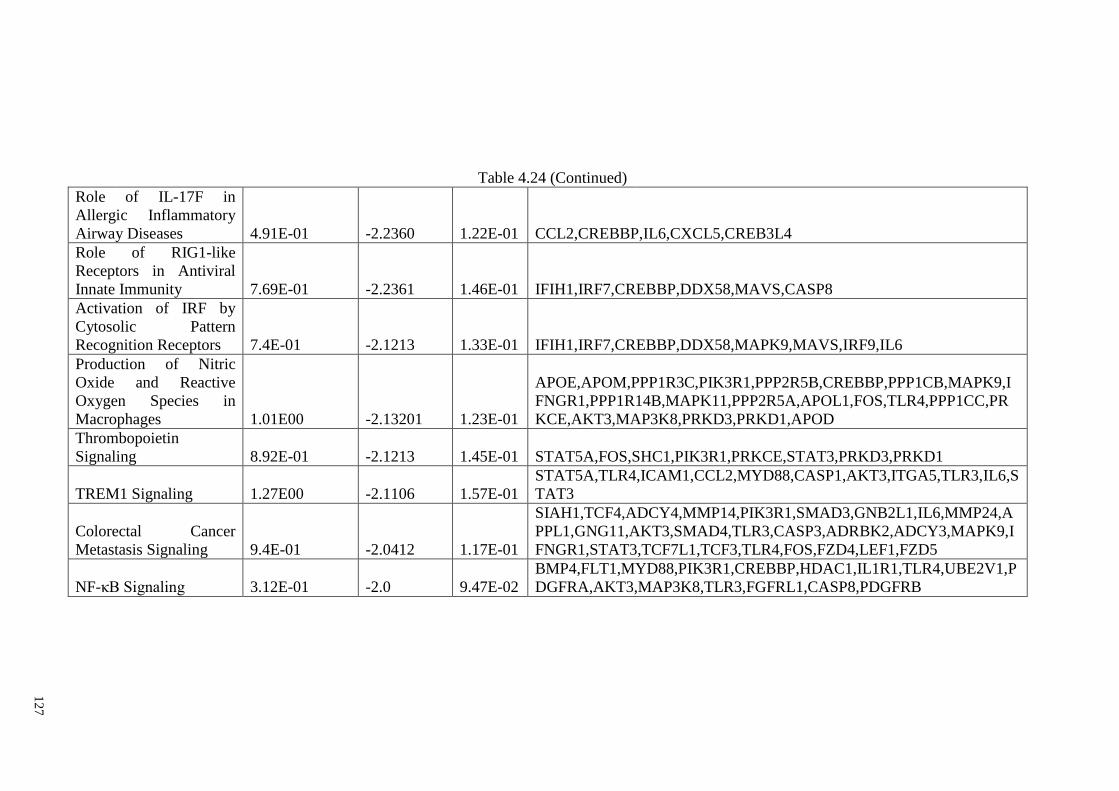
12
7
Table 4.24 (Continued)
Role of IL-17F in
Allergic Inflammatory
Airway Diseases 4.91E-01 -2.2360 1.22E-01 CCL2,CREBBP,IL6,CXCL5,CREB3L4
Role of RIG1-like
Receptors in Antiviral
Innate Immunity 7.69E-01 -2.2361 1.46E-01 IFIH1,IRF7,CREBBP,DDX58,MAVS,CASP8
Activation of IRF by
Cytosolic Pattern
Recognition Receptors 7.4E-01 -2.1213 1.33E-01 IFIH1,IRF7,CREBBP,DDX58,MAPK9,MAVS,IRF9,IL6
Production of Nitric
Oxide and Reactive
Oxygen Species in
Macrophages 1.01E00 -2.13201 1.23E-01
APOE,APOM,PPP1R3C,PIK3R1,PPP2R5B,CREBBP,PPP1CB,MAPK9,I
FNGR1,PPP1R14B,MAPK11,PPP2R5A,APOL1,FOS,TLR4,PPP1CC,PR
KCE,AKT3,MAP3K8,PRKD3,PRKD1,APOD
Thrombopoietin
Signaling 8.92E-01 -2.1213 1.45E-01 STAT5A,FOS,SHC1,PIK3R1,PRKCE,STAT3,PRKD3,PRKD1
TREM1 Signaling 1.27E00 -2.1106 1.57E-01
STAT5A,TLR4,ICAM1,CCL2,MYD88,CASP1,AKT3,ITGA5,TLR3,IL6,S
TAT3
Colorectal Cancer
Metastasis Signaling 9.4E-01 -2.0412 1.17E-01
SIAH1,TCF4,ADCY4,MMP14,PIK3R1,SMAD3,GNB2L1,IL6,MMP24,A
PPL1,GNG11,AKT3,SMAD4,TLR3,CASP3,ADRBK2,ADCY3,MAPK9,I
FNGR1,STAT3,TCF7L1,TCF3,TLR4,FOS,FZD4,LEF1,FZD5
NF-κB Signaling 3.12E-01 -2.0 9.47E-02
BMP4,FLT1,MYD88,PIK3R1,CREBBP,HDAC1,IL1R1,TLR4,UBE2V1,P
DGFRA,AKT3,MAP3K8,TLR3,FGFRL1,CASP8,PDGFRB
128
4.16.2 ASA treatment and Enrichment of Canonical Pathway
Figure 4.23 depicts the most enriched canonical pathways at 200, 500, and 1,000
μM upon ASA treatments, arranged according to their z-scores. They can be seen to
have similar patterns/consistent activation or inhibition at all concentrations of ASA
treatments. The pathways which were predicted to be significantly activated at 500 μM
of ASA treatments included only Agrin interactions at neuromuscular junctions (z-
score: 2.236068) (Table 4.25/ Figure 4.23).
Meanwhile at 1,000 μM of ASA treatments the inhibition of angiogenesis by
TSP1 (z-score: +2.236068) (Table 4.25/Figure 4.23) and regulation of cellular
mechanics by calpain protease (z-score: +2.236068) (Table 4.25/Figure 4.23) were
estimated by IPA. The other canonical pathways were predicted to be inhibited at 500
and 1,000 of ASA treatments (Table 4.25/ Figure 4.23). Only the TREM-1 signaling
pathway was predicted to be significantly inhibited at all concentrations of ASA
treatments (200, 500, and 1,000 μM).
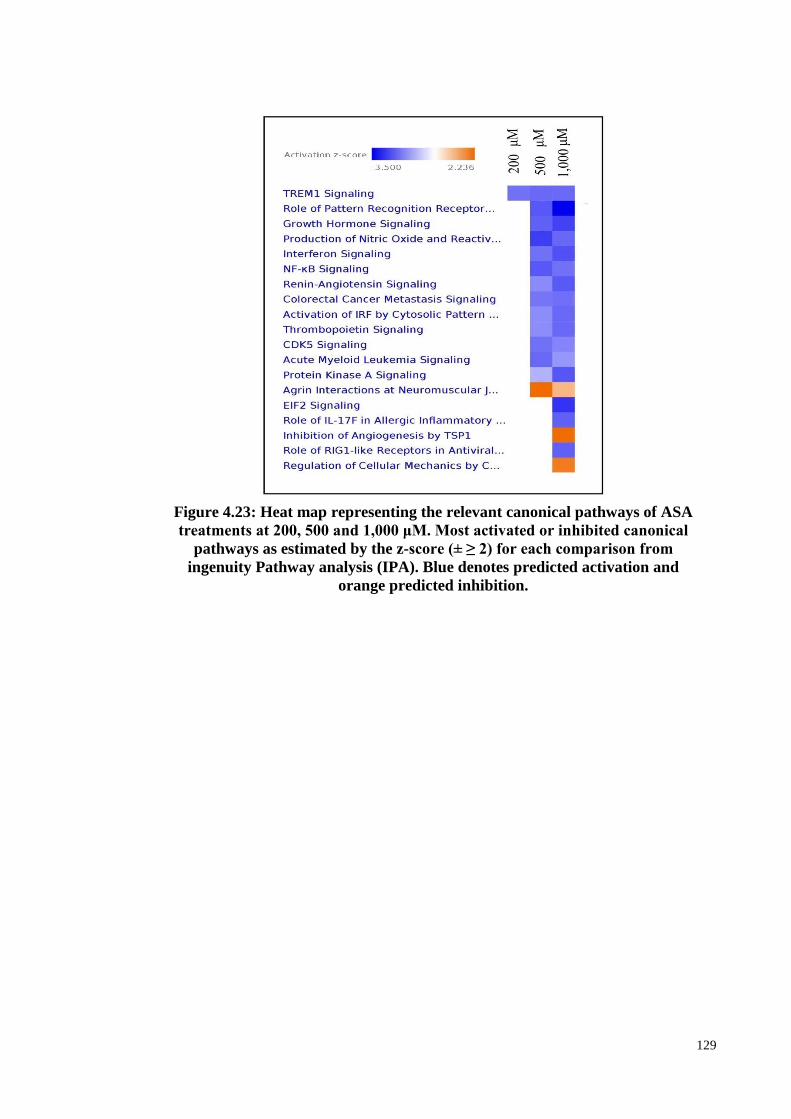
129
Figure 4.23: Heat map representing the relevant canonical pathways of ASA
treatments at 200, 500 and 1,000 μM. Most activated or inhibited canonical
pathways as estimated by the z-score (± ≥ 2) for each comparison from
ingenuity Pathway analysis (IPA). Blue denotes predicted activation and
orange predicted inhibition.
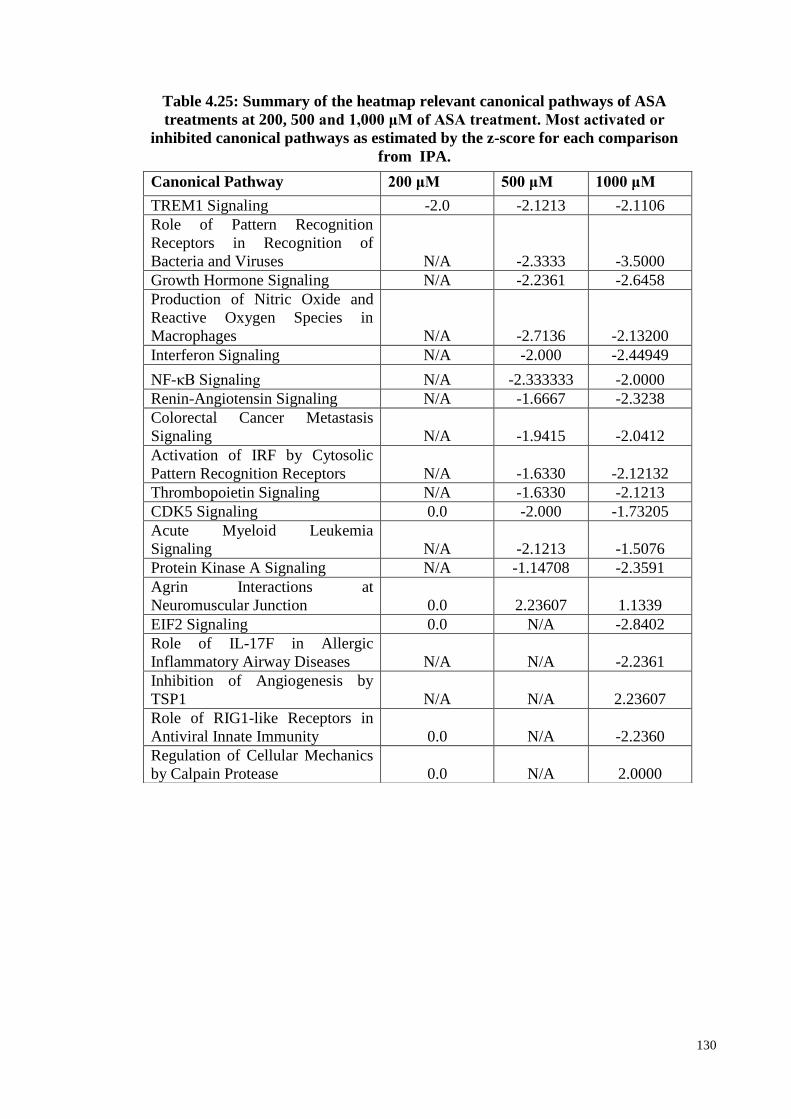
130
Canonical Pathway 200 μM 500 μM 1000 μM
TREM1 Signaling -2.0 -2.1213 -2.1106
Role of Pattern Recognition
Receptors in Recognition of
Bacteria and Viruses N/A -2.3333 -3.5000
Growth Hormone Signaling N/A -2.2361 -2.6458
Production of Nitric Oxide and
Reactive Oxygen Species in
Macrophages N/A -2.7136 -2.13200
Interferon Signaling N/A -2.000 -2.44949
NF-κB Signaling N/A -2.333333 -2.0000
Renin-Angiotensin Signaling N/A -1.6667 -2.3238
Colorectal Cancer Metastasis
Signaling N/A -1.9415 -2.0412
Activation of IRF by Cytosolic
Pattern Recognition Receptors N/A -1.6330 -2.12132
Thrombopoietin Signaling N/A -1.6330 -2.1213
CDK5 Signaling 0.0 -2.000 -1.73205
Acute Myeloid Leukemia
Signaling N/A -2.1213 -1.5076
Protein Kinase A Signaling N/A -1.14708 -2.3591
Agrin Interactions at
Neuromuscular Junction 0.0 2.23607 1.1339
EIF2 Signaling 0.0 N/A -2.8402
Role of IL-17F in Allergic
Inflammatory Airway Diseases N/A N/A -2.2361
Inhibition of Angiogenesis by
TSP1 N/A N/A 2.23607
Role of RIG1-like Receptors in
Antiviral Innate Immunity 0.0 N/A -2.2360
Regulation of Cellular Mechanics
by Calpain Protease 0.0 N/A 2.0000
Table 4.25: Summary of the heatmap relevant canonical pathways of ASA
treatments at 200, 500 and 1,000 μM of ASA treatment. Most activated or
inhibited canonical pathways as estimated by the z-score for each comparison
from IPA.
Canonical Pathway 200 μM 500 μM 1000 μM
TREM1 Signaling -2.0 -2.1213 -2.1106
Role of Pattern Recognition
Receptors in Recognition of
Bacteria and Viruses N/A -2.3333 -3.5000
Growth Hormone Signaling N/A -2.2361 -2.6458
Production of Nitric Oxide and
Reactive Oxygen Species in
Macrophages N/A -2.7136 -2.13200
Interferon Signaling N/A -2.000 -2.44949
NF-κB Signaling N/A -2.333333 -2.0000
Renin-Angiotensin Signaling N/A -1.6667 -2.3238
Colorectal Cancer Metastasis
Signaling N/A -1.9415 -2.0412
Activation of IRF by Cytosolic
Pattern Recognition Receptors N/A -1.6330 -2.12132
Thrombopoietin Signaling N/A -1.6330 -2.1213
CDK5 Signaling 0.0 -2.000 -1.73205
Acute Myeloid Leukemia
Signaling N/A -2.1213 -1.5076
Protein Kinase A Signaling N/A -1.14708 -2.3591
Agrin Interactions at
Neuromuscular Junction 0.0 2.23607 1.1339
EIF2 Signaling 0.0 N/A -2.8402
Role of IL-17F in Allergic
Inflammatory Airway Diseases N/A N/A -2.2361
Inhibition of Angiogenesis by
TSP1 N/A N/A 2.23607
Role of RIG1-like Receptors in
Antiviral Innate Immunity 0.0 N/A -2.2360
Regulation of Cellular Mechanics
by Calpain Protease 0.0 N/A 2.0000
Table 4.25: The summary of the heatmap relevant canonical pathways of
ASA treatments at 200, 500 and 1,000 μM. Most activated or inhibited
canonical pathways as estimated by the z-score for each comparison from
ingenuity Pathway analysis (IPA).
131
4.17 Disease and function network by IPA
The Disease and Function Network analyses was through IPA. It was noted that
the formation of adhesion of the extracellular matrix (p-value: 7.94E-05 for 500 μM and
p-value: 3.14E-03 for 1,000 μM) and connective tissue cells (p-value: 1.31E-05 for 500
μM and p-value: 4.92E-03 for 1,000 μM) were significant at 500 μM (Figure 4.24A)
and 1,000 μM of ASA treatments (Figure 4.24B) but not at 200 μM of ASA treatment.
It is interesting that most of the genes above were earlier predicted to be encriched, as
indicated by DAVID and PANTHER, where groups in the cell adhesion and
extracellular matrix were also enriched, as discovered by IPA for 500 and 1,000 μM of
ASA treatments.
It is noted that most of the genes involved in the cell adhesion of the ECM and
connective tissue cells at 500 and 1,000 μM of ASA treatments were almost similar. In
fact, additional genes were found at 1,000 μM such as THY1, TLN2 for adhesion of
connective tissues, and ITGB1BP1, CDKN2A and LYVE1 for ECM. It was observed
that the integrin group was play important role in the cell adhesion of both connective
tissues and ECM. ECM proteins play a role in regulating cell adhesion and linage
commitment of MSCs. The binding of integrin FN can facilitate the osteogenic
differentiation potential of MSCs due to the modulation of the expression of specific
integrin subunits during the process.………………………………………………….
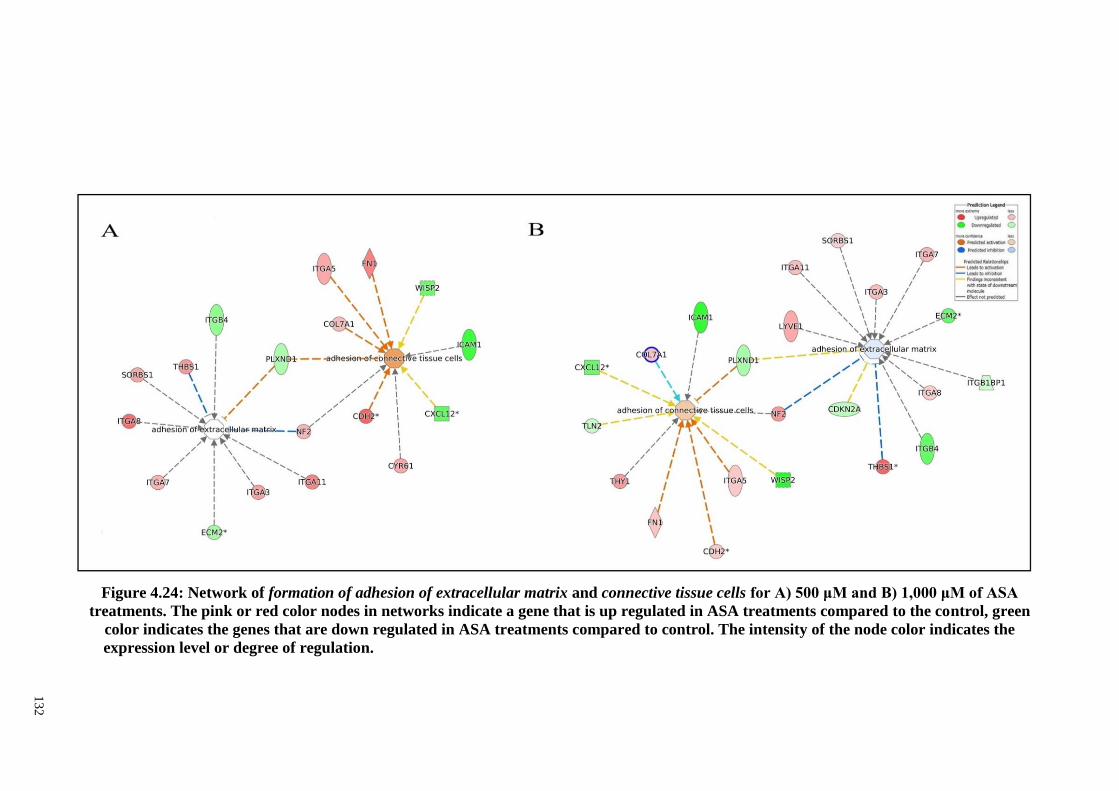
13
2
Figure 4.24: Network of formation of adhesion of extracellular matrix and connective tissue cells for A) 500 μM and B) 1,000 μM of ASA
treatments. The pink or red color nodes in networks indicate a gene that is up regulated in ASA treatments compared to the control, green
color indicates the genes that are down regulated in ASA treatments compared to control. The intensity of the node color indicates the
expression level or degree of regulation.…………………………..……………………………………………………………………………...
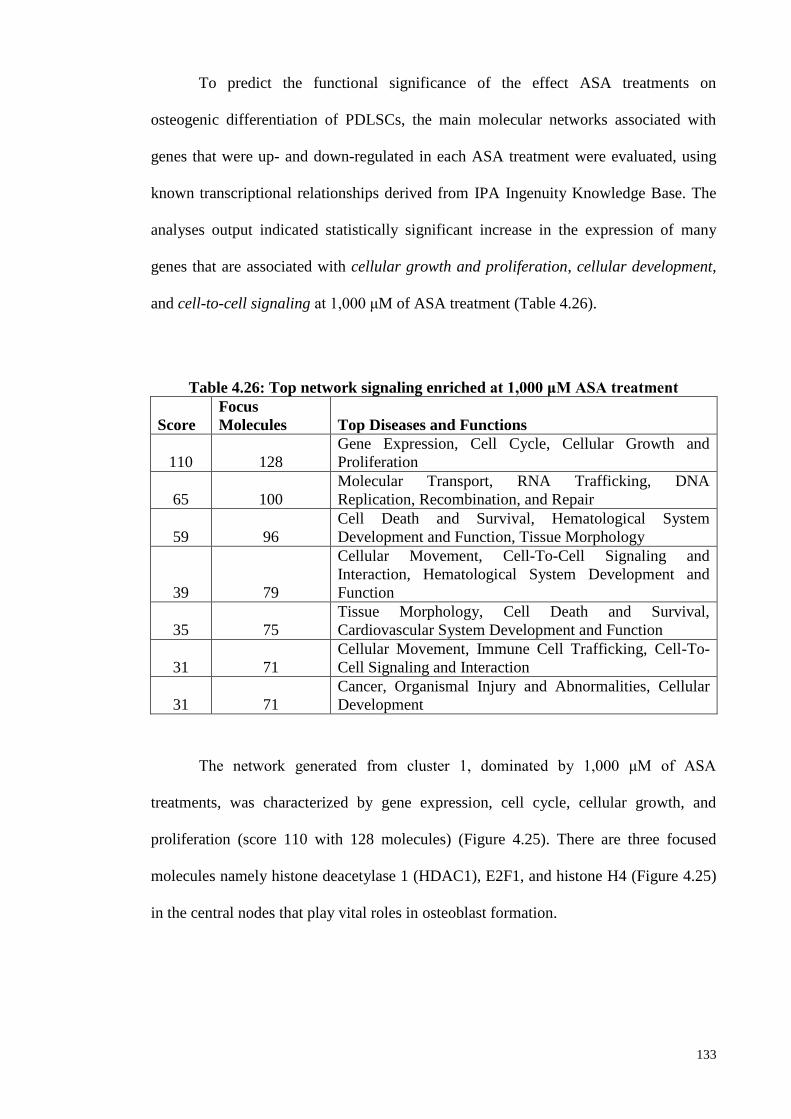
133
To predict the functional significance of the effect ASA treatments on
osteogenic differentiation of PDLSCs, the main molecular networks associated with
genes that were up- and down-regulated in each ASA treatment were evaluated, using
known transcriptional relationships derived from IPA Ingenuity Knowledge Base. The
analyses output indicated statistically significant increase in the expression of many
genes that are associated with cellular growth and proliferation, cellular development,
and cell-to-cell signaling at 1,000 μM of ASA treatment (Table 4.26).
Table 4.26: Top network signaling enriched at 1,000 μM ASA treatment
Score
Focus
Molecules Top Diseases and Functions
110 128
Gene Expression, Cell Cycle, Cellular Growth and
Proliferation
65 100
Molecular Transport, RNA Trafficking, DNA
Replication, Recombination, and Repair
59 96
Cell Death and Survival, Hematological System
Development and Function, Tissue Morphology
39 79
Cellular Movement, Cell-To-Cell Signaling and
Interaction, Hematological System Development and
Function
35 75
Tissue Morphology, Cell Death and Survival,
Cardiovascular System Development and Function
31 71
Cellular Movement, Immune Cell Trafficking, Cell-To-
Cell Signaling and Interaction
31 71
Cancer, Organismal Injury and Abnormalities, Cellular
Development
The network generated from cluster 1, dominated by 1,000 μM of ASA
treatments, was characterized by gene expression, cell cycle, cellular growth, and
proliferation (score 110 with 128 molecules) (Figure 4.25). There are three focused
molecules namely histone deacetylase 1 (HDAC1), E2F1, and histone H4 (Figure 4.25)
in the central nodes that play vital roles in osteoblast formation.
134
Histone deacetylase 1 (HDAC1) is a key enzyme to regulates osteoblast
formation (Lee et al., 2006). HDAC falls into two major groups, class I and class II.
HDAC1 is in major class I and expressed ubiquitously. Other studies have demonstrated
that HDAC1 plays a vital role in osteogenesis differentiation (Lee et al., 2006). The
histone modification plays a crucial role in the transcriptional regulation of most
eukaryotic genes and this modification can be altered by HDAC1. The recruitment of
HDAC1 on osteogenesis can result in the downregulation of several markers of
osteoblast genes (i.e., osterix and osteocalcin) and this suggests that the suppression of
HDAC1 is a critical factor in the osteogenic differentiation step.
The role of the transcription factor E2F1 in osteogenesis and mineralization has
been previously described (Shibing Yu, 2013). Frizzled homolog 1 (FZD1) is a member
of the G-protein coupled receptor which is a transmembrane receptor that mediates the
WNT signaling pathway. The WNT signaling pathway is an important potential
therapeutic target in osteoblast differentiation. E2F1 is a transcription-factor binding
element in the FZD1 promoter and could enhance osteoblast differentiation and
mineralization. In the study, E2F1 was identified in silico and characterized in Saos2
cells in vitro.
The study demonstrated that the over-expression of E2F1 could enhance the
mineralization of differentiated Saos2 cells and contributes to the regulation of
osteoblast mineralization. Histone H4 encodes osteogenic growth peptides (OGP), a
highly conserved 14 amino acid identical to the C-terminus of histone H4 which is
involved in the regulation of bone formation and hematopoiesis. OGP stimulates bone
formation and increases trabecular bone mass in vivo (Fazzi et al., 2003) and contributes
to the proliferation of ALP activity in vitro (Bab et al., 1992). The findings suggest that

135
high concentrations of ASA treatments modulate a number of cellular genes, cellular
development, cellular growth, cell death, and cell cycles, and the molecules associated
with bone formation.
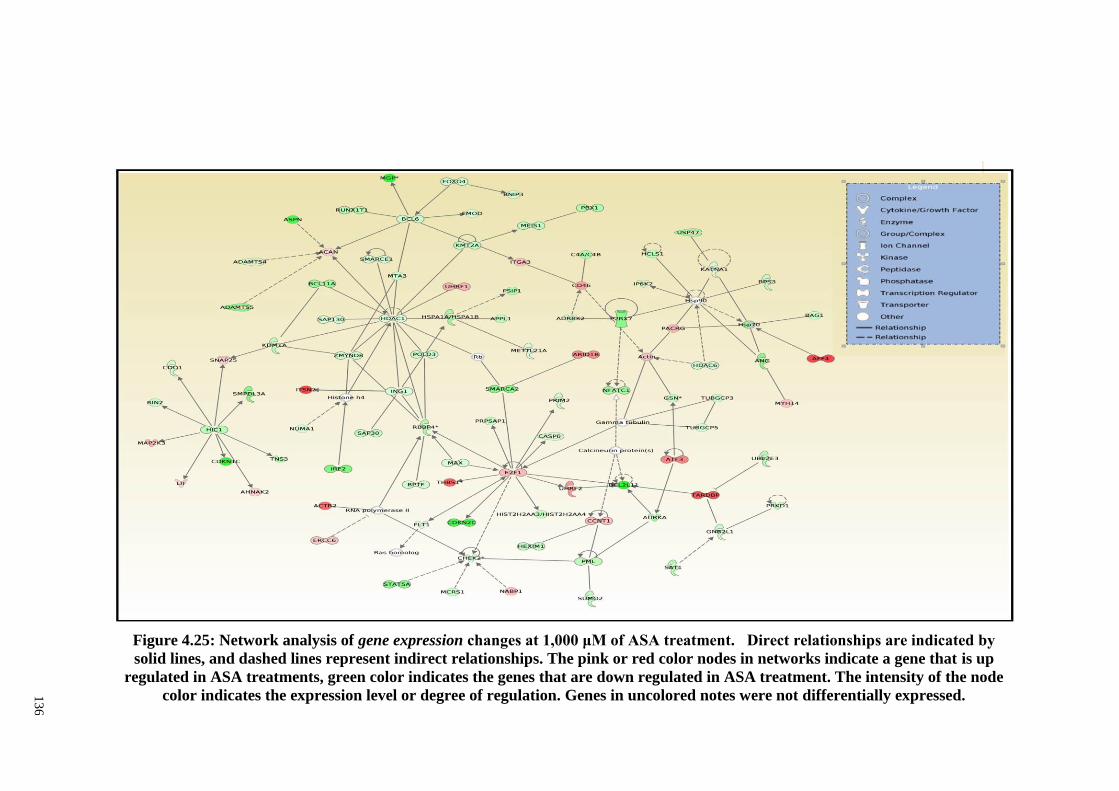
13
6
Figure 4.25: Network analysis of gene expression changes at 1,000 μM of ASA treatment. Direct relationships are indicated by
solid lines, and dashed lines represent indirect relationships. The pink or red color nodes in networks indicate a gene that is up
regulated in ASA treatments, green color indicates the genes that are down regulated in ASA treatment. The intensity of the node
color indicates the expression level or degree of regulation. Genes in uncolored notes were not differentially expressed.
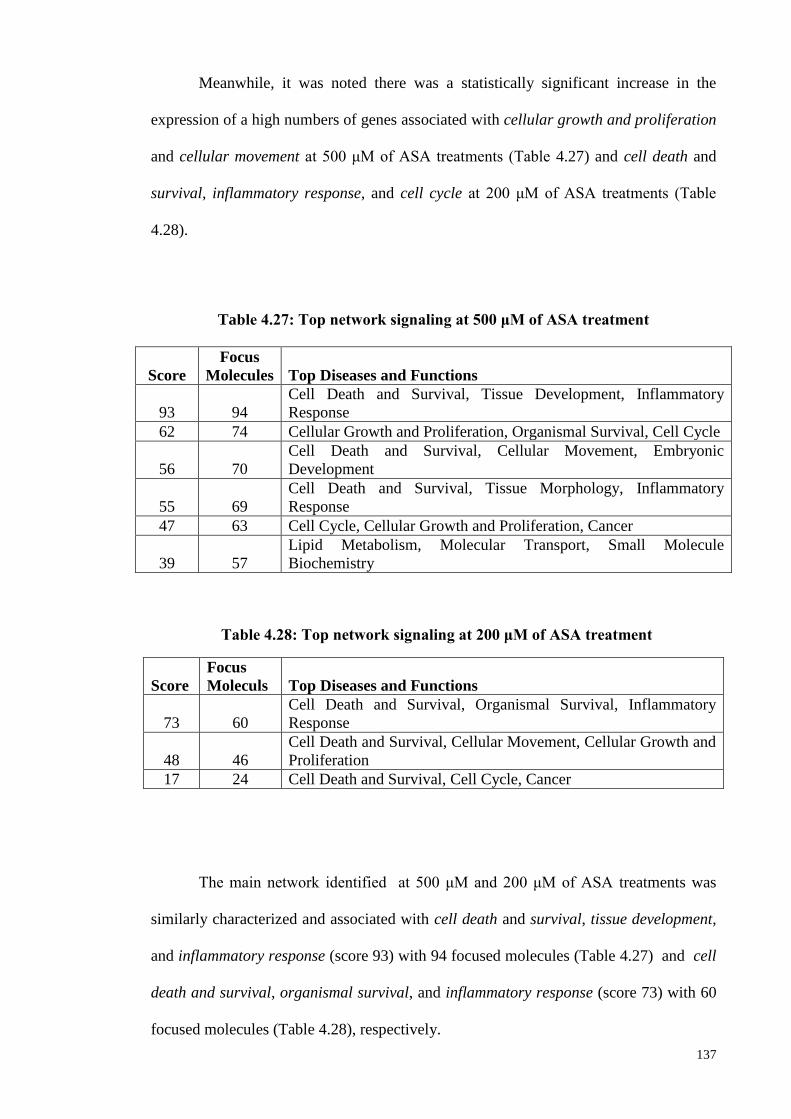
137
Meanwhile, it was noted there was a statistically significant increase in the
expression of a high numbers of genes associated with cellular growth and proliferation
and cellular movement at 500 μM of ASA treatments (Table 4.27) and cell death and
survival, inflammatory response, and cell cycle at 200 μM of ASA treatments (Table
4.28).
Score
Focus
Molecules Top Diseases and Functions
93 94
Cell Death and Survival, Tissue Development, Inflammatory
Response
62 74 Cellular Growth and Proliferation, Organismal Survival, Cell Cycle
56 70
Cell Death and Survival, Cellular Movement, Embryonic
Development
55 69
Cell Death and Survival, Tissue Morphology, Inflammatory
Response
47 63 Cell Cycle, Cellular Growth and Proliferation, Cancer
39 57
Lipid Metabolism, Molecular Transport, Small Molecule
Biochemistry
Score
Focus
Moleculs Top Diseases and Functions
73 60
Cell Death and Survival, Organismal Survival, Inflammatory
Response
48 46
Cell Death and Survival, Cellular Movement, Cellular Growth and
Proliferation
17 24 Cell Death and Survival, Cell Cycle, Cancer
The main network identified at 500 μM and 200 μM of ASA treatments was
similarly characterized and associated with cell death and survival, tissue development,
and inflammatory response (score 93) with 94 focused molecules (Table 4.27) and cell
death and survival, organismal survival, and inflammatory response (score 73) with 60
focused molecules (Table 4.28), respectively.
Table 4.27: Top network signaling at 500 μM of ASA treatment
Table 4.27: Top network signaling at 500 μM of ASA treatments
Table 4.28: Top network signaling at 200 μM of ASA treatment
Table 4.28: Top network signaling at 200 μM of ASA treatments

138
Most interestingly, central invited nodes in this network at 500 μΜ of ASA
treatments included ERK 1/2 which is a key protein involved in cell proliferation and
differentiation of osteoblast formation (Lai et al., 2001) and AKT which is required to
promote osteoblast differentiation and bone formation (Marie et al., 2014). NFKβ
(complex) is a major focused molecule found in central nodes molecules at 200 and 500
μM of ASA treatments.……………………………………………………………….
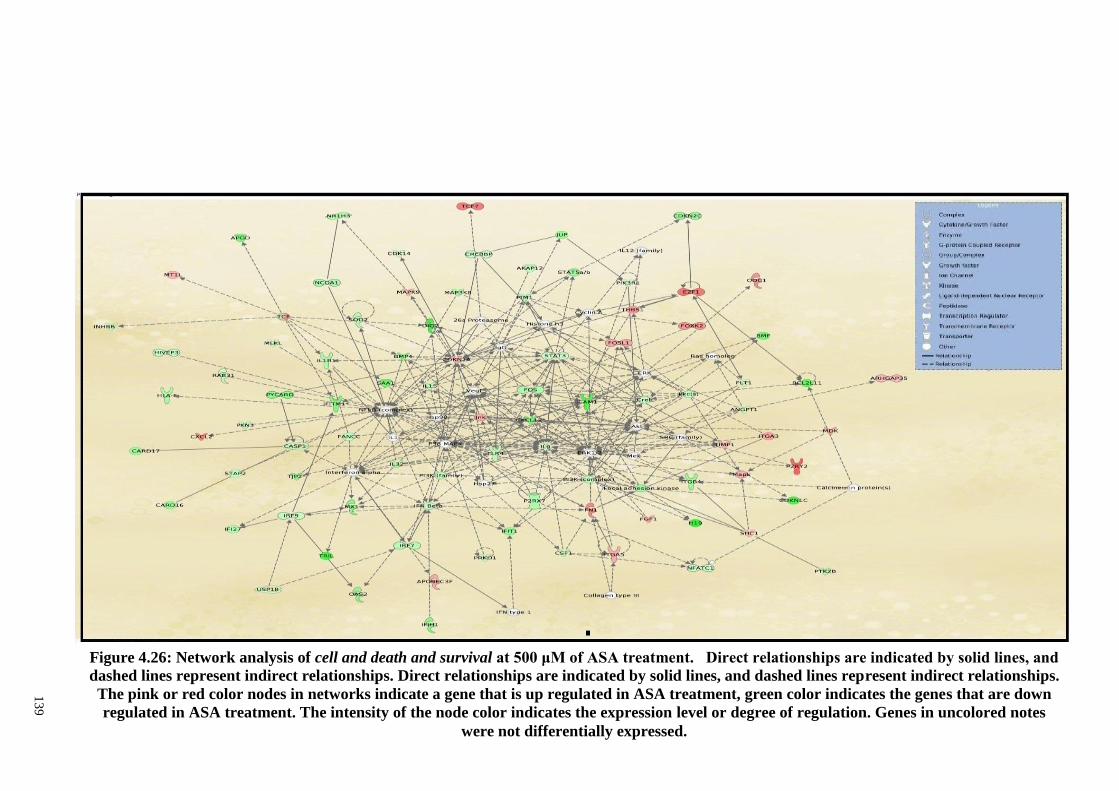
13
9
Figure 4.26: Network analysis of cell and death and survival at 500 μM of ASA treatment. Direct relationships are indicated by solid lines, and
dashed lines represent indirect relationships. Direct relationships are indicated by solid lines, and dashed lines represent indirect relationships.
The pink or red color nodes in networks indicate a gene that is up regulated in ASA treatment, green color indicates the genes that are down
regulated in ASA treatment. The intensity of the node color indicates the expression level or degree of regulation. Genes in uncolored notes
were not differentially expressed.
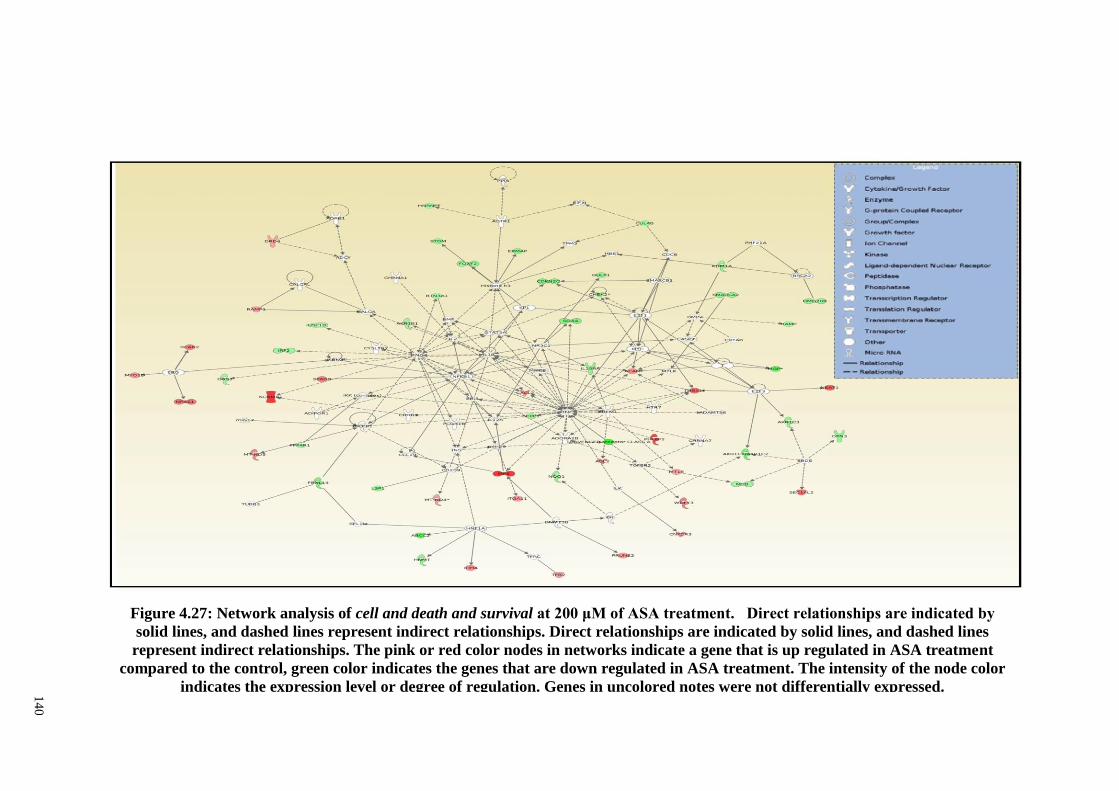
14
0
Figure 4.27: Network analysis of cell and death and survival at 200 μM of ASA treatment. Direct relationships are indicated by
solid lines, and dashed lines represent indirect relationships. Direct relationships are indicated by solid lines, and dashed lines
represent indirect relationships. The pink or red color nodes in networks indicate a gene that is up regulated in ASA treatment
compared to the control, green color indicates the genes that are down regulated in ASA treatment. The intensity of the node color
indicates the expression level or degree of regulation. Genes in uncolored notes were not differentially expressed.
141
4.18 Validation of microarray data by qRT-PCR, immunofluorescence and
western blotting analyses
4.18.1 qPCR analysis
Quantitative real-time RT-PCR was done on seven differentially DE genes to
validate the microarray data. The genes include (Fibronectin 1) FN1, (integrin α5) Igα5,
fibroblast growth factor-1 (FGF1), fibroblast growth factor-5 (FGF5), fibroblast growth
factor receptor-like 1 (FGFRL1), bone morphogenic-4 (BMP4) and BMP binding
endothelial regulator (BMPER). The result showed the genes significantly different
expression rates between ASA-treated cells and untreated cells (Figure 4.28). The qRT-
PCR results were generally in agreement with the data obtained from microarray
analyse.
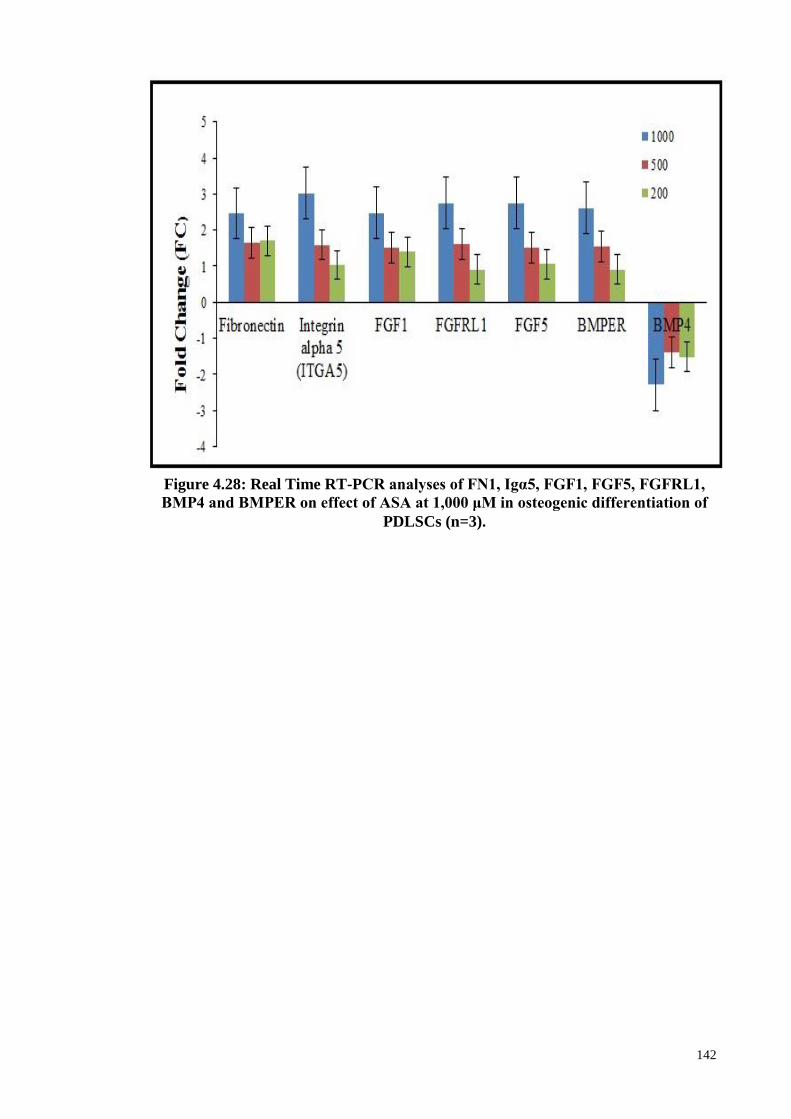
142
Figure 4.28: Real Time RT-PCR analyses of FN1, Igα5, FGF1, FGF5, FGFRL1,
BMP4 and BMPER on effect of ASA at 1,000 μM in osteogenic differentiation of
PDLSCs (n=3).
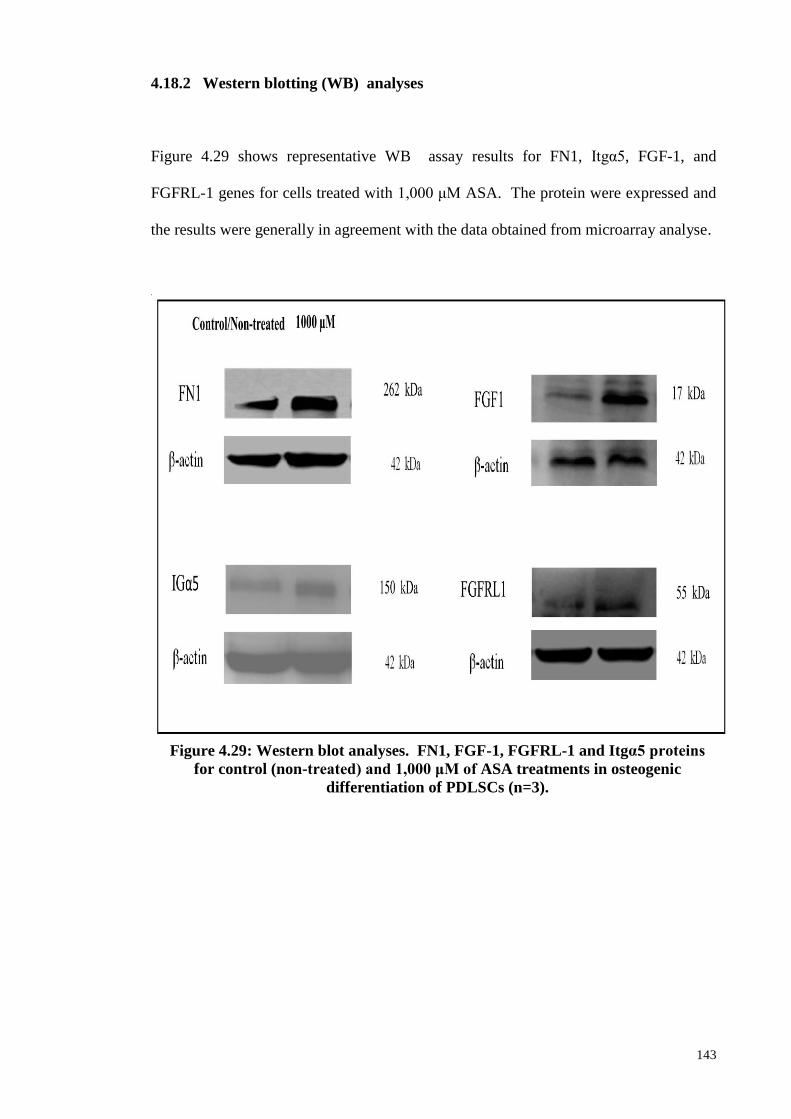
143
4.18.2 Western blotting (WB) analyses
Figure 4.29 shows representative WB assay results for FN1, Itgα5, FGF-1, and
FGFRL-1 genes for cells treated with 1,000 μM ASA. The protein were expressed and
the results were generally in agreement with the data obtained from microarray analyse.
Figure 4.29: Western blot analyses. FN1, FGF-1, FGFRL-1 and Itgα5 proteins
for control (non-treated) and 1,000 μM of ASA treatments in osteogenic
differentiation of PDLSCs (n=3).
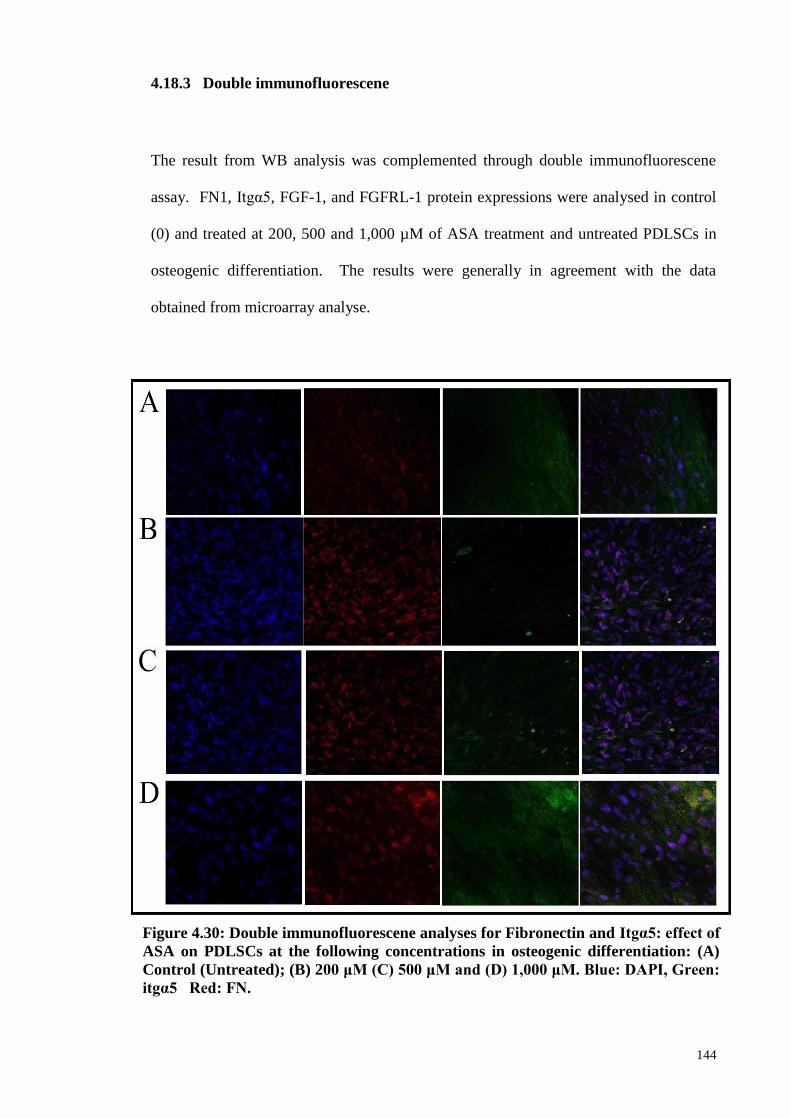
144
4.18.3 Double immunofluorescene
The result from WB analysis was complemented through double immunofluorescene
assay. FN1, Itgα5, FGF-1, and FGFRL-1 protein expressions were analysed in control
(0) and treated at 200, 500 and 1,000 µM of ASA treatment and untreated PDLSCs in
osteogenic differentiation. The results were generally in agreement with the data
obtained from microarray analyse.
Figure 4.30: Double immunofluorescene analyses for Fibronectin and Itgα5: effect of
ASA on PDLSCs at the following concentrations in osteogenic differentiation: (A)
Control (Untreated); (B) 200 μM (C) 500 μM and (D) 1,000 μM. Blue: DAPI, Green:
itgα5 Red: FN.
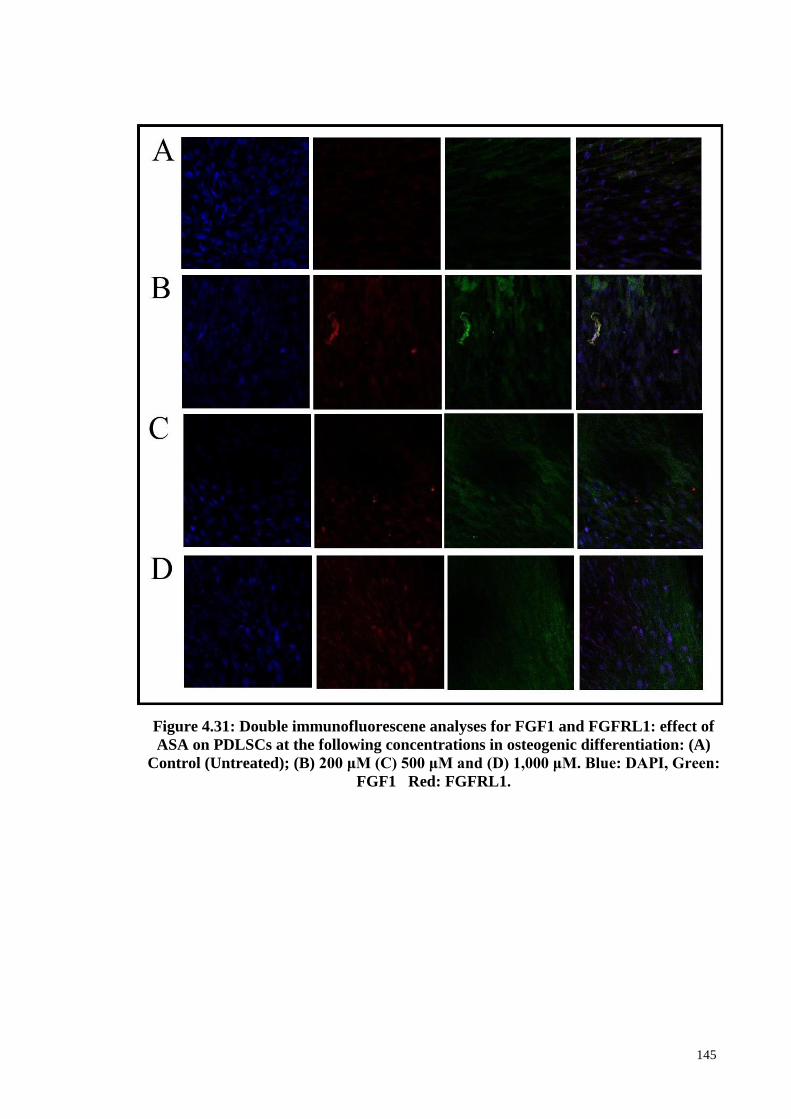
145
Figure 4.31: Double immunofluorescene analyses for FGF1 and FGFRL1: effect of
ASA on PDLSCs at the following concentrations in osteogenic differentiation: (A)
Control (Untreated); (B) 200 μM (C) 500 μM and (D) 1,000 μM. Blue: DAPI, Green:
FGF1 Red: FGFRL1.
146
CHAPTER 5: DISCUSSION
The PDLSCs isolated in the current study showed characteristics of MSCs as
previously described (Seo et al., 2004; Ullah et al., 2015). The PDLSCs were positive
for CD73, CD90 and CD105 surface markers and negative for CD45, CD34, CD20 and
CD14 hematopoietic markers. The range of ASA concentrations used in this study was
within the in vivo therapeutic range of between 100 to 2000 µM as previously reported
(Awtry & Loscalzo, 2000; Borthwick et al., 2006).
The MTT assay indicated that ASA generally inhibited PDLSCs proliferation in
a time- and dose-dependent manner (Figures 4.3). At 1,000 μM, the proliferation rates
for 24, 48 and 72 hour treatments were 87.15%, 85.04% and 71.8%, respectively. This
suggests that ASA modestly inhibited PDLSCs proliferation at 500 and 1000 µM. This
observation is comparable to that of rat bone marrow mesenchymal stem cells, whereby
1,000 μM ASA treatments decreased cell proliferation rate to only 82% (Wang et al.,
2006). ASA at 1,000 μM and lower concentrations were also reported to modestly
inhibit the proliferation of a variety of other cell types (De Luna-Bertos et al., 2012;
Shams ara et al., 2015; Liu et al., 2015b).
Contrary to the above observation, the proliferation rate of the progenitor cells
were higher in osteogenic media in the presence of 500 and 1000 µM ASA (Figure 4.5).
At day 21, the 500 and 1000 µM ASA treated cells showed absorbance readings that
were 36.0% and 37.6% higher than the untreated cells, respectively. The osteogenic
capacity of the progenitor cells following 500 and 1000 mM ASA treatments for 21
days were also significantly higher (p<0.01), with their percentages of Alizarin Red S
147
staining area (ARSA) of 76.59% and 87.85%, respectively, compared to 73.35% for the
untreated cells (Figures 4.6 and 4.7). This finding suggest that ASA is capable of
enhancing PDLSCs osteogenic potential, and similar observation has been reported by
Liu and colleagues, whereby aspirin site-specific treatment enhances BMSSC (Liu et
al.,2015).
However, ASA at lower concentrations of 10 and 200 M, consistently reduced
osteogenic differentiation at days 7, 14 and 21. For example, following day 21, the
percentages of ARSA for 0 and 200 M treatments were 49.10% and 53.15%,
respectively, compared to 73.35% for the untreated cells. It is unclear why lower
concentrations of ASA inhibited the osteogenic capacity of the cells, without
significantly inhibiting their proliferation rates (Figure 4.5), and this warrants further
investigations to uncover the reason.
The gene expression profiling study using PCR array indicated that ASA was
able to modulate the expression of growth factor genes in PDLSCs. Aspirin at 1000 μM
was selected as the treatment dose because such concentration is within the in vivo ASA
therapeutic range. Additionally, the 24 hour treatment using 1000 µM ASA and basic
growth media showed modest inhibitory effect on PDLSCs proliferation rate, compared
to higher ASA concentrations (Awtry & Loscalzo, 2000; Borthwick et al., 2006).
The basic growth media was used for the gene expression profiling assay
because the osteogenic media is known to significantly enhance osteogenic potential of
stem cells, owing to the actions of dexamethasone, ascorbic acid and -
glycerophosphate that are present in the said media (Langenbach et al., 2013).
Dexamethasone induces the expression of LIM-domain protein with 4.5 LIM domains
148
(FHL2), which in turn upregulates Runt-related transcription factor 2 (runx2)
expression, which is known as the master osteogenic transcription factor (Langenbach et
al., 2013). Runx2 upregulation eventually causes various events that lead to the
expression of osteogenic proteins (Langenbach et al., 2013).
The basic growth media provides an environment without the presence of
differentiation inducing agents that could confound the effect of ASA on the gene
expression profile in PDLSCs. However, since the finding in this study indicated that
ASA was capable of enhancing the proliferation and osteogenic potential of the cells in
osteogenic media (Figures 4.5, 4.6 and 4.7), future investigation could be done explore
the underlying mechanism of such observation.
The result from the gene expression profiling study indicated that 19 genes were
differentially expressed, which include 12 upregulated and 7 downregulated genes
(Table 4.1). Pathway analysis indicated that 1000 µM ASA treatment resulted to
activation of biological functions and canonical pathways in PDLSCs that are related to
cellular signaling, angiogenesis, stem cells pluripotency and cellular growth,
proliferation and differentiation (Figure 4.4). The function of some of the genes that
were markedly up and downregulated are discussed in the following paragraphs.
FGFs and BMPs are among the signalling molecules that are actively expressed
during human primary teeth development (Huang et al., 2015). In the mouse, FGF
signalling regulates differentiation and proliferation in tooth development, specifying
odontogenic fate in both the dental epithelium and dental mesenchyme (Liu et al.,
2013). In this study, FGF2, FGF7 and FGF9 were upregulated and these are members
of the canonical FGF subfamily (c-FGF). The c-FGFs are secreted as extracellular
149
proteins and mediate their biological functions by activating FGF receptors (Itoh &
Ornitz, 2011).
FGF2, or basic fibroblast growth factor (bFGF) is a member of fibroblast growth
factor protein family, known to be involved in many biological processes such as
wound healing, cell proliferation, tissue vascularization, regeneration of various tissues
in the body including dentine and periodontal tissues (Lin et al., 2015). FGF2 have
been suggested to be the most upstream self-renewal factor in human embryonic stem
cells (ESCs) (Greber et al., 2007). FGF2, together with vascular endothelial growth
factor (VEGF) have been reported to show synergistic role in angiogenesis (Przybylski,
2009).
VEGF family members are renowned as potent angiogenesis inducers in vivo
and in vitro (Giacca & Zacchigna, 2012). It has been reported that FGF2 was able to
induce VEGFA expression, and the combination of both factors synergistically
stimulated angiogenesis in mouse PDL cells (Yanagita et al., 2014). The co-
upregulation of FGF2 and VEGF genes by ASA as observed in this study may support
the induction of angiogenesis in PDLSCs which could be useful for regenerative
dentistry.
The expression patterns of FGF7 and FGF9 have recently been reported in the
developing human primary tooth germs (Huang et al., 2015). FGF7 plays crucial roles
in epithelial repair process associated with wound healing (auf demKeller et al., 2004).
During the bell stage of the developing human embryo tooth germ (Huang et al., 2015).
FGF7 expression was noted to be among the highest in the dental mesenchyme
compared to six other FGFs. FGF9 was also observed to be strongly expressed in both
150
the inner enamel epithelium and dental mesenchyme, during the cap and bell stages of
the human primary tooth germs (Huang et al., 2015).
The bone morphogenetic proteins (BMPs) are cytokines, comprising over 20
members that are structurally related and belonging to TGFβ superfamily. They are
classically known as bone growth factors which are responsible for embryonic skeletal
formation, skeletal regeneration and bone healing (Carreira et al., 2014). BMP2 is a
potent inducer of mesenchymal cell differentiation to pre-osteoblasts during
osteogenesis and have been shown to stimulate regeneration of periodontal tissue (Lin
et al., 2015).
The interplay between FGF and BMP signaling is important in bone formation
(Chen et al., 2012), repair and mineralization (Hughes-Fulford & Li, 2011). Treatment
of primary calvarial bone cells with exogenous FGF-2/-9 increases BMP2 expression
and this is suggested to provide a favorable microenvironment that enhances the
osteogenic potential of the cells for bone formation (Fakhry et al., 2005). Contrary to
the finding in this study, NSAIDs other than ASA had previously been shown to
negatively affect BMP2 expression. NSAID NS-398 was shown to downregulate
BMP2 expression in MSCs (Arikawa et al., 2004).
BMP10 was reported to be expressed in the cardiac tissue and essential for
murine cardiac morphogenesis (Chen et al., 2004; Carreira et al., 2014). Despite its
restricted expression in cardiac tissue, treatment of C2C12 cells (mouse myoblast) with
BMP10 was shown to induce the expression of signaling molecules, transcription
factors and osteogenic-specific markers, suggesting the supportive role of BMP10 in
osteogenesis (Bessa et al., 2009).
151
In this study, IL2, IL4 and IL10 cytokines were observed to be upregulated in
ASA treated PDLSCs. IL-10 is a regulator of inflammation which can downregulate
pro-inflammatory cytokines and chemokines such as IL1, IL6 and TNFα (Sabat et al.,
2010). IL1, IL6 and TNFα are also known to promote osteoclastogenesis and bone
resorption activity (Zhang et al., 2014). In the murine model, IL10 deficiency increases
the susceptibility to alveolar bone loss (Al-Rasheed et al., 2003). IL10 also inhibits
osteoclasts formation and promoted osteoblast differentiation (Zhang et al., 2014). The
inherent anti-inflammatory activity of ASA and its upregulation of IL10 expression in
PDLSCs may synergistically reduce inflammatory condition in periodontal disease,
which could be useful in periodontal regenerative medicine.
IL2 is a pro-inflammatory cytokine that is essential for stimulating T-cell
functions, proliferation and differentiation and amplifying immune response (Malek,
2008). When co-cultured with peripheral blood mononuclear cells (PBMCs), the stem
cells from inflamed deciduous teeth secreted higher levels of IL2, compared to the stem
cells from normal deciduous teeth (Yazid et al., 2014). IL2 level was reported to be
higher in inflamed pulpal tissues compared to normal healthy samples (Rauschenberger
et al., 1997). In this study upregulation of IL10 was also detected in ASA treated
PDLSCs, and this may counteract IL2 pro-inflammatory action. However, it should be
noted that synergism between IL10 and IL2 may also be possible, since both cytokines
have been reported to synergistically enhance human B-lymphocytes function (Itoh et
al., 1994).
152
IL4 is a polyfunctional cytokine produced specific types of immune cells with a
role in a vast number of immune and non-immune functions. Numerous type of cells in
the body contain IL4 receptors, suggesting diverse or pleotropic IL4 functions (Paul,
2015). IL4 is involved in canonical type 2 immunity, which includes epithelial and
tissue remodeling activities (Redpath et al., 2015) an activity that may be helpful in
regenerative medicine.
CSF3 is also known as granulocyte stimulating factor, renowned for its
capability in stimulating haematopoietic stem cells proliferation. Recent studies
indicated CSF3 could enhance neurogenesis, likely due to its capability of stimulating
of progenitor cells activity in the central nervous system (Wallner et al., 2015). CSF3,
as well as FGF2 showed pro-angiogenic activity, being capable of inducing
proliferation and migration of endothelial cells. However, the combination of CSF3 and
FGF2 was reported to be more potent in angiogenesis induction (Bussolino et al., 1991).
The upregulation of CSF3 and FGF2 in PDLSCs induced by ASA may provide
synergistic factors that could promote angiogenesis, an activity that could be useful in
periodontal regenerative medicine.
Inhibins are heterodimeric proteins containing α and β subunits. The two types
of inhibins are inhibin A(α:βA) and B(α:Βb). Inhibins are members of TGFβ
superfamily, known to regulate cellular proliferation, gonadal development, apoptosis,
inflammation and differentiation. The widespread expression of inhibin subunit mRNA
and protein suggest its widespread role in various systems during development and
embryogenesis (Makanji et al., 2014). The continuous expression of inhibin in vivo has
been reported to cause an increase in bone mass and strength, due to the enhancement of
osteoblast differentiation and activity (Makanji et al., 2014).
153
In this study, ASA treatment was also observed to cause the downregulation of 7
genes with a FC of more than 2.0 (Table 4.1). Among the downregulated genes, the
following were markedly downregulated: pleotropin (PTN), fibroblast growth factor 5
(FGF5), brain derived neurotrophic factor (BDNF), and Dickkopf WNT signaling
pathway inhibitor 1 (DKK1). PTN is a secreted angiogenic growth factor, exerting
pleotropic effect by modulating various processes such bone remodelling, angiogenesis,
fracture healing and osteoarthritis (Lamprou et al., 2014a).
During mouse odontogenesis, PTN expression was detected in ameloblasts,
odontoblasts, dental follicle and periodontal ligament (Erlandsen et al., 2012). It the
mouse, targeted PTN over-expression in the bone inhibited BMP2 mediated bone
induction, impairing fracture healing (Lamprou et al., 2014b). On the other hand, PTN
ablation in mice is associated with improvement in haematopoetic stem cells function:
loss of microenvironmental PTN leads to enhancement of stem cell maintenance in vivo
and stem cell repopulation ability in vitro (Istvanffy et al., 2011).
DKK1 is another gene that was markedly downregulated by ASA. In
osteoblastogenesis, the canonical wingless (WNT) pathway plays a critical role for the
differentiation of progenitor cells into osteoblast. BMP2 could induce osteogenesis in
MSC (Lin et al., 2015), and this is sustained by WNT signaling. In the presence of
DKK1 (WNT inhibitor), osteogenesis is inhibited (Gregory et al., 2005). Thus, it is
possible that downregulation of DKK1 by ASA may be supportive of BMP2 function.
FGF5 is widely expressed in the murine embryonic tissues and likely regulate
diverse set of events during embryogenesis (Haub et al., 1991). In adult mouse, FGF5
expression was only detected in the brain and spinal cord, suggesting FGF5 specialised
154
role in the mouse central nervous system (Haub et al., 1990). The possible impact of
FGF5 downregulation by ASA on PDLSCs properties is not clear, but to my
knowledge, this study is the first to observe striking downregulation of FGF5 expression
by ASA.
Brain derived neurotrophic factor (BNDF) is a pro-survival protein in the
neurons, with numerous roles including synapse formation, synaptic plasticity, neurons
proliferation and differentiation (Reichardt, 2006). The rate of BDNF expression was
observed to vary among differently sourced stem cells: it was not detected in human
adipose-derived stem cells (hAMSCs), but was expressed in hBMSCs, albeit at a lower
level compared to human dental pulp stem cells (hDPSCs) (Mead et al., 2014). In this
study, BDNF was strikingly downregulated by ASA, a finding which may not favor
regenerative dentistry application, considering BDNF was reported to be supportive of
periodontal regeneration (Lin et al., 2015).
However, a recent study indicated that BDNF expression in periodontal tissue
was significantly higher in subjects with chronic periodontitis (CP) compared to healthy
subjects (Correa et al., 2014). The authors also reported an inverse correlation of
BDNF and IL-10 production in periodontitis cases compared to healthy subjects. Such
observation is comparable with the result in this study, where BDNF expression was
strikingly downregulated, but IL10 was significantly upregulated (Correa et al., 2014).
The finding in this study indicated that ASA was capable of enhancing the
proliferation and osteogenic potential of the cell in osteogenic media (Figures 4.5, 4.6,
4.7). The proliferation rate of the cell was higher in osteogenic media in the presence of
500 and 1000 μM ASA (Figure 4.5). At day 21, the 500 and 1000 µM ASA treated
155
cells showed absorbance readings that were 36.0% and 37.6% higher than the untreated
cells, respectively.
The osteogenic capacity of the progenitor cells following 500 and 1000 μM
ASA treatments for 21 days were also significantly higher (P<0.01), with their
percentages of Alizarin Red S staining area (ARSA) of 76.59% and 87.85%,
respectively, compared to 73.35% for the untreated cells (Figure 4.7). This finding
suggest that ASA is capable of enhancing PDLSCs osteogenic potential, and similar
observation has been reported by Liu and colleagues, whereby aspirin site-specific
treatment enhances BMSSC (Liu et al., 2015b).
The present study also examined the effect of ASA (200, 500, and 1,000 μM) on
PDLSCs osteogenic differentiation through microarray gene expression profiling.
Microarray technology is a powerful tool used in studying the level of expression of
thousands of genes simultaneously. This study sought to assess the significance effect
of ASA treatments at 200, 500, and 1,000 μM on the osteogenic potential of PDLSCs.
It employed microarray assays in studying the effect of ASA on the osteogenic potential
of PDLSCs using the platform of Agilent SurePrint G3 Human GE v2 8x60K
Microarrays.
Data normalization and quality control (QC) processes are important in
microarray data analysis for producing good quality data. Normalization involves the
reduction of some sources of variation which could affect the levels of measured gene
expressions (Park et al., 2003) and this study uses the quantile normalization method as
it minimises the average standard error of the data. The PCA procedure was used to
represent samples variability, which defines a group of principal components used in
156
explaining variability existing among the samples (Raychaudhuri et al., 2000). Thus,
PCA analysis is used as a quality control measure to demonstrate the quality and
separation of samples in a study by treatment concentrations and donors.
PCA representations showed that donors 2, 3, and 4 were separated from the
other four donors based on the principal component. From the results, sample 1 was
removed due to the low RIN number at patient 1(d) (RIN: 3) as a result of degradation
of extracted RNA samples. This biologically mediated degradation could possibly be
attributed to either the cell’s decay machinery or because of a disruption in the leakage
of RNAses into its membrane.
Using an FC of 1.5 as a cut-off threshold value (P<0.05), 3,144 genes were
found to be DEGs (Table 4.5). Among them, a total of 1,765 genes (56.14%) were up-
regulated and 2,488 genes (79.13%) were down-regulated at all concentrations of ASA
treatments. At 200 μM ASA treatment, 315 DEGs were noted, including 151
upregulated and 164 down-regulated genes. At 500 μM, 794 DEGs were identified,
including 364 upregulated and 430 down regulated genes. In contrast, at 1,000 μM,
2,035 DEGs were noted, which included 1,250 upregulated and 1,894 downregulated
genes.
The data from microarray study was subjected to data mining, to uncover the
plausible pathways activated or highly regulated by ASA in PDLSCs. The results
indicated that ASA at 500 and 1,000 μM were able to enhance osteogenic potential in
PDLSCs. To significantly determine the importance of the biological function of genes,
Gene Ontology (GO) analysis was conducted using PANTHER and pathway
enrichment analysis by DAVID.
157
According to the PANTHER analysis, the biological process (BPs) showed that
both up-regulated and down-regulated genes in all ASA treatments (200, 500, and 1,000
μM) had similar patterns which were highly enriched for metabolic and cellular
processes, and for biological regulation. The regulation of metabolic pathways was
shown to be involved in regulating the fate of stem cells. The MSCs metabolized to
self-renew and differentiate in vitro. During the early stages of MSC differentiation, the
fate of the new cells is redirected by down-regulating the pluripotent specific genes and
up-regulating the terminal-specific genes and switching the subsets of metabolic
enzymes (Phinney et al., 2015).
Molecular Functions (MFs) revealed that up-regulated and down-regulated
genes in all ASA treatments showed similar patterns which were highly enriched for
binding and catalytic and nucleic acid binding transcription factor activities. Cellular
Components (CCs) showed that both types of genes in all ASA treatments showed
similar patterns and were highly enriched in the cell part, organelle, and extracellular
regions.
An interesting finding was that the highly abundant cell transcripts at 500 and
1,000 μM ASA treatments were significantly enriched in functions related to protein
synthesis and had a role in extracellular matrix formation, the regulation of cell
adhesion, and in migration thus suggesting that ASA treatments could benefit
osteogenesis differentiation. This was apparent according to the functional enrichment
studies (DAVID and PANTHER).
158
Extracellular matrix (ECM)-adhesion proteins were also substantially increased
in PDLSCs in the osteogenic medium upon ASA treatments at 1,000 μM compared to
control. This study demonstrates the ASA might have beneficial effects for osteoblast
formation in the presence of agent inducers in osteogenic culture mediums such as
ascorbic acid, β-Glycerophosphate, and dexamethasone (dex) that play a role in
enhancing depositions in the mineralization/extracellular matrix (ECM).
The ascorbic acid increases collagen biosynthesis (Franceschi, 1992) while β-
Glycerophosphate could increase the phosphate ion to produce hydroxylapatite minerals
to regulate the expression of osteogenic genes (Langenbach, 2013). In addition, dex is
capable of promoting osteogenic differentiation by inducing the expression of
osteoblast-specific transcription factors such as core-binding factor 1 (cbfa1), and
osterix (Igarashi et al., 2004).
The other study demonstrated that lower ASA treatments (1µM and 10 µM)
stimulated ST2 cell osteogenic differentiation when compared to higher concentrations
(100 and 1,000 µM) in the ASA treatment and control groups (Du et al., 2016). An
increment of ALP activity and runx-2 levels was observed when treated for 7 days.
However, in this study, the expression of the osteoblast transcription factor (i.e., Runx-
2, osterix) was not detected. This is most likely due to the effect of ASA in the
osteoblast differentiation.
The common shared upregulated gene between 200 μM vs 500 μM and 1,000
μM is a zinc finger protein 316 (ZNF316) gene. Most of the ZNFs remain
uncharacterized (Vaquerizas et al., 2009). ZNF is mostly protein and shown to be
implicated in the developmental process (Aruga, 2004; Ganss & Jheon, 2004). ZNF449
159
plays an important role in chondrogenesis (Okada et al., 2014 ) while ZNF 395 is
involved in adipogenesis (Hasegawa et al., 2013). As such, the differentially expressed
ZNF proteins observed in ESCs and MSCs strongly suggest that they also play an
important role in stem cell biology. However, ZNF316 has still not been characterized
and its role in osteogenic potential remains unclear.
Meanwhile the most common downregulated genes between 200 μM vs 500 μM
and 1,000 μM were the potassium inwardly-rectifying channel, subfamily J, member 8
(KCNJ8), family of a sequence similarity of 107, member A (FAM107A), and
scavenger receptor class A, member 5 (putative) (SCARA5). KCNJ8 is a human gene
encoding the Kir6.1 protein (Gourraud et al., 2013). Its role in osteogenesis
differentiation has not as yet been elucidated although its part in cardiac development
has been reported (Gourraud et al., 2013). It has been up-regulated in cardiomycytes
and involved in the pathogenesis of cardiac arrest in the early repolarization syndrome.
FAM107A has been found to be downregulated in the renal cell carcinoma gene
1 (DRR1), and some studies have noted that its expression has been downregulated in
various types of cancers such as non-small-cell lung, renal cell, and prostate cancers and
astrocytoma by epigenetic silencing, including promoter hypermethylation (Awakura et
al., 2008; Liu et al., 2009). Meanwhile in normal brain tissues, FAM107A has been
shown to play critical roles in neural cell survival, migration, and spine formation
(Asano et al., 2010; Le et al., 2010; Schmidt et al., 2011) although its precise role in
osteogenic differentiation is still unclear.
160
SCARA5 were also shown to be downregulated in this study for all ASA
treatments. SCARA5 is a coding for a receptor with a putative transmembrane domain
and is reported to play a vital role in chondrogenic differentiation of the human
BMMSCs (Menssen et al., 2011). It has already been established that SCARA5 is a
ferritin receptor for mediating non-transferrin iron delivery, which is essential for cell
growth (Li et al., 2009) .
The next section focused on the genes that were involved in osteogenic
differentiation of PDLSCs during exposure to ASA treatments. By comparing the lists
of differentially expressed genes from each group (treated and non-treated), a group of
functionally expressed genes was classified. Gene functionally analysis was carried out
by searching the National Center for Biotechnology Information Database (NCBI). The
classified genes were mainly related to signal transduction, cell adhesion, development
and angiogenesis during the differentiation of PDL cells in ASA treatments.
In addition, chloride intracellular channel 6 (CLIC6) was upregulated at 500
and 1,000 μM of ASA treatment. The results were in agreement with another study in
which high expressions were observed on day 14 on PDL in the osteogenic culture
media (Choi et al., 2011). CLIC6 genes were involved in calcium-binding or ion
channel activity (Choi et al., 2011).
The other genes related to apoptosis, angiogenesis, and adipogenesis which were
demonstrated to highly express at 1,000 μM of ASA treatment in this study were
angiopoietin-like 4 (ANGPTL4). These genes were also observed to be up-regulated in
another study which noted that ANGPTL4 was more strongly expressed on day 14 than
on day 7 in the osteogenic culture media (Choi et al., 2011). ANGPTL4 is a member of
161
the angiopoietin/angiopoietin-like gene family and encodes a glycosylated, secreted
protein with a fibrinogen C-terminal domain and is involved in cell differentiation,
multicellular organismal development, negative regulation of apoptosis, positive
regulation of angiogenesis, and signal transduction.
The results demonstrate that phosphodiesterase 1A, calmodulin-dependent
(PDE1A) was down-regulated at the middle and the highest concentrations of ASA
treatments (500 and 1,000 μM). This is contrary to previous findings which
demonstrated that PDEA1 was more strongly up-regulated on day 7 than day 14 of
PDL in the osteogenic media at FC (5.74) and (1.90) respectively (Choi et al., 2011).
PDE1A is a member of the PDE1 family (phosphodiesterase 1A, colmodulin-
dependent) and a Ca2+/ calmodulin-dependent PDEs that is activated in the presence of
Ca2T (Michibata et al., 2001 ).
It was reported that colmodulin regulates osteoblast differentiation (Michibata et
al., 2001 ). Therefore, PDE1A is related to calmodulin binding, signal transduction, and
ion binding. We surmise that the PDE1A was down-regulated in this study due to the
effect of ASA treatment in osteogenic differentiation and also because the cells had
already reached maturity (late osteoblast differentiation).
Figure 4.20 depicts the various categories of URA which were activated and
inhibited upon ASA treatments and included cytokines, transcription factors,
transmembrane receptors and others. Based on the findings, the most important URA
were cytokines and transmembrane receptors estimated by IPA to control the expression
of dysregulated genes (DEG) upon ASA treatments. The most URA was shown to have
consistent activation or inhibition through ASA treatments.
162
IL1RN was the only URA that activated in all ASA treatments while BTK,
TREM1, IL13, and BCL2L1 were estimated by IPA to activate at 500 and 1,000 μM of
ASA treatments. Few important cytokines were shown to have inhibition in ASA
treatments (Figure 4.21/ Table 4.22). IFNG, PRL, and TNF showed inhibition in all
ASA treatments while TLR7, TLR9, and IFNB1 were shown by IPA to be inhibited in
500 and 1,000 μM of ASA treatments.
Specifically, the most URA that was significantly activated and inhibited in this
study was in regard to pro-inflammatory cytokines such as interleukins (IL1RN, IL13,
and IL1A), the tumor necrosis factor (TNF), and interferon families (i.e., IFNG, IFN-α,
IFNA2, INFNAR2, and IFNB1). The pro-inflammatory genes were closely linked to
the osteoblast process. It is noted that bone and immune cells are functionally
connected as they derive from same progenitors that reside in the bone marrow (Zupan
et al., 2013).
They share a similar microenvironment and are influenced by the same
mediators. The bone remodeling involved osteoblastogenesis and osteoclastogenesis.
Osteoblast cells were derived from the mesenchymal precursor that is initially involved
in bone-forming cells and responsible for secreting bone matrix protein and later in
stimulating the occurrence of mineralization. Meanwhile the osteoclast is derived from
hematopoietic origins and adheres to the demineralized bone and dissolved bone matrix
(Teitelbaum, 2000).
163
The co-ordinated balance in bone turnover between osteoblast and osteoclast has
to be maintained to avoid bone destruction. However, several acute and chronic
inflammatory diseases such as rheumatoid arthritis (RA), periodontal disease, and
cancer could have a negative impact on bone remodeling. Therefore an appreciation of
which of the immune cells influence the molecular mechanism activity of bone cells is
critical for developing rational therapies for these diseases.
Osteoblasts are highly responsive to immune-derived cytokines and they
respond to these by promoting osteoclast activity. Further, they start to produce pro-
inflammatory cytokines including the tumor necrosis factor α (TNF-α) and the receptor
activator of nuclear factor (NF)-κB (RANK)/RANK ligand (RANKL)/osteoprotegrin
(OPG) family of the TNF receptor (TNFR)-related cytokines.
The cytokine (IL1RN) showed significant activation in all ASA treatments in
osteogenic differentiation of PDLSCs. The cytokine IL1RN and TLR4 are associated
with aggressive periodontitis susceptibility (Laine et al., 2012). Among the most
inhibited cytokines were some that have been previously known to inhibit osteogenesis,
such as IFN (Liu et al., 2011b), TLR (Li et al., 2014b), and TNF (Chang et al., 2013),
while the estimated activation of IL1RN in osteoclastogenesis was clearly described
(Kimble et al., 1994; Kitazawa et al., 1994).
IL1RN is a competitive inhibitor of IL-1, and has been shown to reduce
osteoclast formation, bone loss, and bone resorption in estrogen deficient
(ovariectomized) mice (Kimble et al., 1994; Kitazawa et al., 1994). The analysis
confirmed a main role for the TNF in coordinating osteogenesis. TNF suppresses bone
164
mineralization and osteogenic differentiation by stimulated IκB kinase -NF-κB and
impaired osteogenic differentiation of MSCs (Chang et al., 2013).
In addition, prolactin (PRL) was observed to significantly inhibit in all ASA
treatments. PRL was found to be higher levels during pregnancy and it was very
important to maintain the interaction between maternal, extraembryonic, and fetal
tissues. The role of PRL in human periodontal ligament fibroblast (hPDLF)
proliferation and differentiation was described (Surarit et al., 2016). They observed the
presence of PRL in hPDLF at non-production level (10 ng/mL) and pregnant level
(100 ng/mL) upregulated bone associated marker genes such as runx2 and BMP2. They
suggested a direct role PRL in PDL and periodontal tissue development.
The role of pro-inflammatory cytokines in osteoclastogenesis are described
elsewhere (Zupan et al., 2013). They possess osteoclastogenesis and anti-clastogenesis
properties and directly or indirectly target osteoclast via the receptor activators of the
nuclear factor kb (RANK)/RANKL. Cytokines such as interleukin1 and TNF-α have
osteoclastogenesis properties as they stimulate osteoclast differentiation. Meanwhile,
IFNγ and IFNα have anti-osteoclastogenesis properties. IFN is a cytokine that plays a
pivotal role in anti-microbial, immunomodulatory, cell growth, and differentiation
regulatory activities. The pro-inflammatory genes such as IFN-gamma and TNF-alpha
could influence the immune properties of bone marrow and wharton’s jelly of
mesenchymal stem cells (Prasanna et al., 2010).
In this study, the transmembrane receptors and toll-like receptor groups (TLR 9,
TLR7, and TL4) were estimated by IPA to be among the most inhibited in ASA
treatments at 500 and 1,000 μM. Except for the other two TLR transmembrane
165
receptors, TLR4 was estimated by IPA to be significantly inhibited at 1,000 μM only.
Other study showed lipopolysaccharides (LPS) decreased the osteogenic differentiation
of human PDLSCs through the TLR4 regulated nuclear factor (NF)-κB pathway, but not
for BMMSCs (Li et al., 2014b).
The expression of TLR9 and TLR4 were much stronger in BMMSCs compared
to PDLSCs (Li et al., 2014b). The results suggest that the TLR was inhibited to
increase the osteogenic potential. The data is in agreement with Li et al., suggesting that
blocking the TLR4 is a new approach for enhancing osteogenic potential and as an
approach in the treatment of periodontitis (Li et al., 2014b). LPS can activate the
TLR4-regulated NF-κB pathway of human PDLSCs, thus decreasing their osteogenic
potential.
In this study, c-Jun N-terminal kinases (JNK) was inhibited at 1,000 μM of ASA
treatments. The estimated inhibition of JNK in this experiment has no apparent
explanation. However, a role for JNK in osteogenesis differentiation has been
previously demonstrated (Guo et al., 2014). Osteoblastogenesis was involved with JNK
by phosphorylating intracellular substrates and augmenting the cellular sensibility for
BMP2 (Liu et al., 2011a).
Meanwhile, URA estimated to be significantly activated during ASA treatments
at 500 and 1,000 μM were BTK and TREM1. BTK is a non-receptor tyrosine kinase of
the TEC family and is expressed in hematopoietic cells (Bam et al., 2013; Mohamed et
al., 2009). A direct role of BTK in osteoclast differentiation has been clearly described
in Bam et al., (2013) and is very important as the dysregulation of BTK can causes the
hereditory immudodeficiency, X-linked agamma globulinemia (XLA) disease in
166
humans and X-linked immunodeficiency (Xid) in mice (Mohamed et al., 2009). The
upregulation of BTK lead to increase bone resorption and homing of multiple myeloma
(MM) cell to the bone marrow in myeloma cells (Tai et al., 2012 ). They have shown
that BTK plays a pathogenic role in MM-related osteolytic bone disease, as well as
growth and survival of MM in the bone marrow microenvironment.
Canonical pathway analysis identified the pathways from the IPA library of
canonical pathways that were most significant to the genes expressed differentially in
the study. The most significant canonical pathway for all ASA treatments (200, 500
and 1,000 μM was ranked by significance of the z-score (Figure 4.25/ Table 4.23).
Based on the results, TREM1 signaling was estimated by IPA to be most significantly
inhibited affected canonical pathways at 200, 500, and 1,000 μM of ASA treatments.
However, URA analysis demonstrated that TREM1 was shown positive z-score for 500
μM (z-score: 2.524) and 1,000 μM (z-score: 2.524) of ASA treatments.
Upstream Regulator Analysis (URA) determine upstream regulator that are
connected to data set genes through set of direct and indirect relationship. It is only
based on the prior knowledge of expected effects between transcriptional regulators and
their target genes stored in Ingenuity® Knowledge Base. The activation z-score is used
to predict upstream regulators based on significant pattern match of up/down regulation.
This is the possibility that TREM1 was shown positive z-score in URA analysis but was
shown contradict finding (z-score: negative) for the canonical pathway identified in
ASA treatments (200, 500 and 1,000 μM).
167
TREM1 proteins are a family of cell surface receptors that participate in diverse
cell processes, including inflammation, bone homeostasis, neurological development,
and coagulation. TREM1, or the triggering receptor expressed on myleoid cells, is a 30-
Kda glycoprotein of the immunoglobulin superfamily that plays an important role in the
inflammation process (Gingras et al., 2002). TREM1 is expressed on blood neutrophils
and a subset of monocytes, and is up-regulated by bacterial LPS as well as being
associated with DAP12 for signaling and function purposes (Bouchon et al., 2000).
TREM1 triggered secretion other pro-inflammatory factors including TNF-α, IL6,
CXXL8, CCL4 and CCL5 in order to amplify an inflammation (Bosco et al., 2011).
A direct role of TREM1 signaling in osteoblast differentiation has not been
previously observed although their important roles in acute inflammation have been
described (Gingras et al., 2002). The mechanism of TREM-1 activation is associated
with DAP12 signaling leading to the activation of protein tyrosine kinase and further
poshphorylate of various proteins, CA2T
mobilization, acivation of extracellular signal-
regulated kinases (ERK), and transcription complexes downstream of ERK (Bouchon et
al., 2000). TREM-1 also induces a pro-inflammatory cytokines factor, TNF-α, and IL-
1α, demonstrating that it can amplify pro-inflammatory responses in the presence of
induced Toll-like receptors (TLR).
A previous study reports that the co-operation of TREM1 and Toll-like receptors
(TLR) could produce an inflammatory response. It was observed in this study that ASA
treatments at 500 and 1,000 μM could block TLR4 activation and further inhibit the
inflammatory process. The blocking of TREM-1 reduces inflammation and increases
survival in animal models of bacterial infections that cause systemic hyperinflammatory
syndromes (Colonna & Facchetti, 2003).
168
The shared canonical signaling pathway related to inflammation which was
shown to be inhibited at 500 and 1,000 μM of ASA treatments was NF-κB Signaling.
The NF-κB signaling was activated by pro-inflammatory cytokines such as the tumor
necrosis factor (TNF), interleukin1 (IL1), and RANK-L (Lawrence, 2009). The TNF
was reported to inhibit osteoblast differentiation and bone formation (Krum et al., 2010)
by downregulating the transcription of runx2, which regulates the expression of bone
matrix proteins (Gilbert et al., 2002).
NF-κB is a transcription nuclear factor that plays a role in the expression and
regulator of other pro-inflammatory genes and host immune responses. NFκB signaling
also leads to the induction of osteoclast differentiation genes, prolonged survival of
osteoclasts, and increased bone resorption. Studies have reported that NF-κB inhibits
the osteogenic differentiation of MSCs (Chang et al., 2013). In the present study, IPA
was predicted upon ASA treatments at 500 and 1,000 μM and pointed to the inhibition
of several genes including BMP4 and IL1R that cause the suppression of IκB kinase.
The results are in agreement with other studies which reported that the pro-
inflammatory genes were stimulated by IKK-NF-κB and impaired the osteogenic
differentiation of MSCs (Chang et al., 2013). Other studies note that TNF and IL17
stimulated IκB kinase–NF-κB and impaired the osteogenic differentiation of MSCs.
Chang et al. (2013) reported that TNF and IL-17 stimulated IKK- NF-κB and impaired
the osteogenic differentiation of MSCs (Chang et al., 2013). The inhibition of IKK-
NF-κB enhanced the mediation of bone formation. Further evidence in support of NF-
κB acting as an important target for bone disease and tissue regeneration is provided by
Chen et al. (2013) who report that DNA damage could inhibit osteogenic differentiation
169
of MSC and accelerate bone aging by activating NF-κB in vitro and in vivo (Chen et al.,
2013).
Renin angiotensin signaling (RAS) was inhibited at the highest concentrations of
ASA treatments (1000 μM). RAS plays an important role in regulating of
cardiovascular and renal functions to maintain extracellular fluid volumes and
electrolyte homeostasis (Fung, 2014). In addition, RAS in bones remodeling has also
been noted to negatively regulate bone turnover and bone mass via osteoclast AT1
receptors (Hatton et al., 1997; Kaneko et al., 2011). Previous studies suggest that
Angiotensin II (Ang II) related to the osteoclast activation through a receptor activator
of nuclear factor Kb ligand (RANKL) is produced by osteoblast cells (Guan et al.,
2011; Shimizu et al., 2008).
The role of Ang II in osteoblast differentiation is unclear. Ang II suppresses
osteoblast differentiation and has been observed to supress ALP activity and
mineralized nodule formations in rat calvarial osteoblast cells (Hagiwara et al., 1998;
Lamparter et al., 1998). Nakai and colleague also report that Ang II suppressed ALP
activity on osteoblastic cells and ROS17/2.8 during the growth stage (Nakai et al.,
2015). They further investigated the effect of Ang II on the expression of the
transcription factor of osteoblast runx2 and found that Ang II suppresses osteoblastic
differentiation by decreasing runx2 and Msx2 expression and suppresses mineralized
nodule formation in ROS17/2.8 cells.
Interestingly, Cyclin-dependent kinase 5 (CDK5) signallings were inhibited at
500 μM of ASA treatments only. CDK5 is a member of the small serine/threonine
cyclin-dependent kinase (CDK) family (Pareek et al., 2010). The best delineated role of
170
CDK5 is its regulation of the cytoskeleton architecture of the central nervous system
(CNS) during inflammatory hyperalgesia. There are not many studies that provide a
description or function of CDK5 in dental stem cell differentiation.
However, CDK5 has been seen to be expressed in odontoblast-like cells and
odontoblast-enriched primary preparations from murine teeth and an odontoblast-like
cell line (MDPC-23) (Utreras et al., 2013). They found that CDK5 is functionally
active in these cells and its kinase activity is upregulated during cell differentiation in
MDPC-23 cells. They observed that CDK5 and p35 are expressed in a murine
odontoblast-enriched primary preparation of cells from teeth. CDK5 is also functionally
active in odontoblast-like MDPC-23 cells.
Their findings are based on the theory that odontoblasts are directly involved in
dental nociception and pain transduction (Utreras et al., 2013). This study shows that
the ASA treatments were downregulated and genes laminin were bound tightly to
integrin alpha 6 beta 1 (Igα6) and further activated the P35 signaling via ERK1/2. This
indicates that ASA could be a novel therapeutic agent for use in periodontal
regeneration/osteoblast differentiation.
On the other hand, interestingly, few genes were identified that up/down
regulated in the PCR array and contradicted the findings in the microarray studies on
osteogenic differentiation. For example, FGF5 was found to be negatively expressed
with FC (-32.16±0.06) at 1,000 μM on proliferation growth factor of PDLSCs (PCR
array) but was positively express at FC (+3.5181) at 1,000 μM of ASA treatment on
PDL in the osteogenic culture medium (microarray studies). The same pattern with
pleuropoitin (PTN) was demonstrated down-regulated at FC (-32.20±0.19) on effect of
171
ASA on growth factor of PDLSCs (PCR array) meanwhile was shown down-regulated
at all concentration of ASA treatments at 1,000 μM of ASA treatments (FC -1.7)
(microarray studies).
Meanwhile the gene INHBβ was found to be highly expressed in PDLSCs
proliferation with FC (+3.25±0.32) but showed to contradict with PDLSCs in
osteogenic culture media which were down-regulated at 1000 μM of ASA treatment
with FC (-3.2219) but with no significant changes at 200 and 500 μM of ASA
treatments. The difference of expression in proliferation and differentiation of certain
genes is probably due to the different mediums used in the experiment. ASA was
treated in the normal media to study the effects of proliferation of PDLCs and PCR
assays while the next study used osteogenic media containing osteogenic inducers such
as ascorbic acid, dexametahasone, and β-glycerophosphate in the microarray studies.
This indicated that the type of media could alter the effect of ASA in modulating
PDLSCs gene expression profile.
FGF5 has been shown to be highly expressed in the mouse embryonic ectoderm,
or epiblast, which gives rise to the three germ layers (Hébert et al., 1991 ). It is also
expressed in loose mesenchyme outside the condensation (Ornitz & Marie, 2002).
Another study reports the importance of FGF5 in generating muscles by acting as a
muscle-derived survival factor for cultured spinal moto neurons (Karalaki et al., 2009).
FGF5 stimulates the expansion of connective tissue fibroblasts and inhibits skeletal
muscle development in the limb (Clase et al., 2000) and is a secreted heparin-binding
growth factor that belongs to the FGFs family.
172
The osteogenic-potential role of FGF5 is not really understood but its pivotal
role in negatively inhibiting the hair growth cycle has been reviewed (Beenken &
Mohammadi, 2009). To the best of knowledge, this is the first report of FGF5 being
negatively down-regulated in PDLSCs proliferation but up-regulated in osteogenic
differentiation upon ASA treatments.
Inhibin beta B, also known as INHBB, is part of a group of the transforming
growth factor B (TGF-β) that can regulate the growth and differentiation of a variety of
cell types (Vassalli et al., 1994). It is expressed abundantly compared with the INHBB
subunit in human osteoblast cultures (Eijken et al., 2007). Inhibin was reported to
suppress osteoblastogenesis and osteoclastogenesis in murine bone marrow cell cultures
(Gaddy-Kurten et al., 2002).
In addition, ASA treatments at high concentration could improve osteogenic
differentiation potential through the activation of FN1 and Itga5 reactions. The ECM
proteins play a role in regulating cell adhesion and linage commitment of MSCs. The
binding of integrin FN1 can facilitate the osteogenic differentiation potential of MSCs.
This is due to the modulation of the expression of specific integrin subunits during
osteogenic differentiation.
A similar observation was made in the previous study where the adhesion of
human BMMSCs to FN was investigated and further assayed for their osteogenic
commitment in the presence of ECM proteins (fibronectin) (Schwab et al., 2013). The
adhesion to FN resulted in an elevated expression of α5-integrin and further upregulated
under osteogenic media. The BMMSCs showed their ability to form a mineralized
173
matrix and their commitment to the osteoblast lineage was increased in the presence of
FN and under osteogenic conditions.
Seven genes were validated by qPCR namely Fibronectin1 (FN1), Integrin
Alpha 5 (Igα5), Bone Morphogenetic Protein Endothelial Cell Precursor-derived
Regulator (BMPER), Bone Morphogenic Protein4 (BMP4), Fibroblast Growth Factor1
(FGF1), Fibroblast Growth Factor5 (FGF5), and Fibroblast Growth Factor Receptor1
(FGFRL1). The study showed FGF1 and FGFRL1 to be highly expressed from the
highest ASA treatments at FC 2.1459 and 2.1035 respectively. The up-regulation of
FGFRL1 and FGF1 was also reported in human dental follicles in response to DMEM
media and dexamethasone suggesting that FGF2, FGF1, FGF3, and FGFRL1 play a
critical role in the differentiation of dental follicle cells (Yongkuan Zhang, 2006).
Based on this study it has been suggested that that ASA acts as a regulator for
FGF1 to bind to the FGFRL1 receptor and activates several bone-related marker genes.
FGFs are heparin binding proteins and signal through a binding to the tyrosine kinase in
the intracellular region of the FGR receptor (FGFR). The FGFRs contain an
extracellular ligand-binding domain, a transmembrane region, and an intracellular
divided tyrosine kinase domain. The binding of FGFs to FGFRs enables the
autophosphorlyation of tyrosine in the intracellular region of FGFR leading to the
activation of intracellular downstream signaling pathways, such as mitogen-activated
protein kinase (Ras/MAPK), protein kinase B, protein kinase C, and phospholipase C
and also the p21 pathways (Dailey et al., 2005).
174
On the other hand, Miraoui and colleagues reported that FGFR2 acts as novel
regulatory molecules that promote osteogenic differentiation in murine MSCs (Miraoui
et al., 2009). The effect of FGFR2 is mediated by PKCα and ERK1/2 pathways that
have critical roles in FGFR2-induced osteogenic differentiation of murine MSCs
(Miraoui et al., 2009). This was supported by the IPA database where FGF signaling
was significantly enriched (p<0.05, supplement data appendix 1.8 and 1.9 supplement
data) upon ASA treatments at 500 and 1,000 μM) upon ASA treatments of 500 and
1,000 μM.
The present study also found that the osteoblast differentiation mechanism not
only depended on FGFs but also on the BMPs gene. In this study, BMP1 was observed
to down-regulate upon all ASA treatments while BMP4 was down-regulated at high
concentration of ASA treatments. BMP1 was also differentially expressed in dental
follicle stem cells (Yongkuan Zhang, 2006). BMP1 is not part of the TGF-b family and,
as a procollagen C proteinase containing 730 amino acid residues with rich cysteine
residue, it is a regulatory factor for bone growth and belongs to the family of
metalloproteinases (Yang et al., 2014). This was supported by the IPA database when
BMP signaling was significantly enriched (p<0.05, appendix 1.8 and 1.9 supplement
data) upon ASA treatments at 500 and 1,000 μM).
The expression of BMPER was noted at 1,000 μM of ASA treatments. The
present study believe that BMPER acts as the mode and action and is a novel regulator
in osteoblast-like differentiations as previously reported (Satomi-Kobayashi et al.,
2012). BMPER is a differentially expressed protein in embryonic endothelial precursor
cells. MSCs reside in a perivascular niche of the body, suggesting that they interact
175
closely with vascular endothelial cells through cell-cell interactions or paracrine
signaling to maintain cell functions.
The anatomical relationship between human MSCs and vascular endothelial
cells also suggests that these two cell types interact with each other most likely through
cell-cell interaction and/or paracrine signaling. Endothelial cells can regulate the
cellular activities of human MSCs and have demonstrated the ability to enhance
osteogenic differentiation of human MSCs through direct cell-cell contact (Kaigler et
al., 2005). BMPER encodes protein that interacts and inhibits BMPs function. It
interacts with BMP2, BMP4 and BMP6 and antagonized BMP4-dependent SMAD5
activation (Moser et al., 2003; Jennifer Heinke et al., 2008). It has been shown to
inhibit BMP2 and BMP4 dependent osteoblast differentiation and BMP-dependent
differentiation of the chondrogenic cells. This seems to tally with this present study
when BMP4 was down-regulated in this study upon ASA treatments.
176
CHAPTER 6: CONCLUSIONS
ASA was able to modulate the expression of growth factors-associated genes in
PDLSCs. The genes that were regulated by ASA are capable of participating in
canonical pathways and biological functions related to cellular signaling, angiogenesis,
stem cells pluripotency, cellular growth, proliferation and differentiation. ASA may
potentially enhance periodontal regenerative processes through the stimulation of
selected number of growth factors-associated genes in PDLSCs or/and via its
enhancement of osteogenic potential–these observations suggest ASA could be
supportive of regenerative processes and may help the improvement in periodontal
health. This study showed ASA was capable of enhancing the proliferation and
osteogenic differentiation of PDLSCs grown in osteogenic media. This study postulated
that ASA promotes osteogenesis by targeting the FGF/FGFRL pathway and modulates
fibronectin and integrin interaction. Further in-depth investigations, such as global
proteome and transcriptome profiling studies may provide additional insights on the
impact of ASA on PDLSCs regenerative activities and how it could affect PDL
functions in periodontal health and regeneration.
177
REFERENCES
Abelev, B. I., Aggarwal, M. M., Ahammed, Z., Alakhverdyants, A. V., Anderson, B.
D., Arkhipkin, D., . . . Collaboration, S. (2009). Azimuthal charged-particle
correlations and possible local strong parity violation. Phys Rev Lett, 103(25),
251601. doi: 10.1103/PhysRevLett.103.251601
Al-Rasheed, A., Scheerens, H., Rennick, D. M., Fletcher, H. M., & Tatakis, D. N.
(2003). Accelerated alveolar bone loss in mice lacking interleukin-10. Journal of
Dental Research, 82(8), 632-635.
An, S., Gao, Y., & Ling, J. (2015). Characterization of human periodontal ligament
cells cultured on three-dimensional biphasic calcium phosphate scaffolds in the
presence and absence of L-ascorbic acid, dexamethasone and β-
glycerophosphate in vitro. Exp Ther Med, 10(4), 1387-1393.
Andrae, J., Gallini, R., & Betsholtz, C. (2008). Role of platelet-derived growth factors
in physiology and medicine. Genes Dev, 22(10), 1276-1312. doi:
10.1101/gad.1653708
Arceo, N., Sauk, J. J., Moehring, J., Foster, R. A., & Somerman, M. J. (1991). Human
periodontal cells initiate mineral-like nodules in vitro. J Periodontol, 62(8), 499-
503. doi: 10.1902/jop.1991.62.8.499
Archana, A., Srikanth, V., Sasireka, Kurien, B., Ebenezer, & (2014). Fibroblast
Heterogeneity in Periodontium – a Review International Journal of Dental
Sciences and Research, 2(3), 50-54.
Arikawa, T., Omura, K., & Morita, I. (2004). Regulation of bone morphogenetic
protein-2 expression by endogenous prostaglandin E2 in human mesenchymal
stem cells. J Cell Physiol, 200(3), 400-406. doi: 10.1002/jcp.20031
Arlt, P., Schlossmuseum (Gotha Germany), & Schloss Friedenstein (Gotha Germany).
(2001). Mythos und Figur : doch das Antike find ich zu lebendig :
Schlossmuseum Gotha, Schloss Friedenstein, 1. September bis 11. November
2001. Gotha: Gothaer Kultur- und Fremdenverkehrsbetrieb.
Aruga, J. (2004). The role of Zic genes in neural development. Mol Cell Neurosci,
26(2), 205-221. doi: 10.1016/j.mcn.2004.01.004
Asano, Y., Kishida, S., Mu, P., Sakamoto, K., Murohara, T., & Kadomatsu, K. (2010).
DRR1 is expressed in the developing nervous system and downregulated during
neuroblastoma carcinogenesis. Biochem Biophys Res Commun, 394, 829-835.
auf demKeller, U., Krampert, M., Kumin, A., Braun, S., & Werner, S. (2004).
Keratinocyte growth factor: effects on keratinocytes and mechanisms of action.
Eur J Cell Biol, 83(11-12), 607-612.
Awakura, Y., Nakamura, E., Ito, N., Kamoto, T., & Ogawa, O. (2008). Methylation-
associated silencing of TU3A in human cancers. Int J Oncol, 33(4), 893-899.
Awtry, E. H., & Loscalzo, J. (2000). Aspirin. Circulation, 101(10), 1206-1218.
178
Bab, I., Gazit, D., Chorev, M., Muhlrad, A., Shteyer, A., Greenberg, Z., . . . Kahn, A.
(1992). Histone H4-related osteogenic growth peptide (OGP): a novel
circulating stimulator of osteoblastic activity. EMBO J, 11(5), 1867-1873.
Bam, R., Ling, W., Khan, S., Pennisi, A., Venkateshaiah, S. U., Li, X., . . . Yaccoby, S.
(2013). Role of Bruton's tyrosine kinase in myeloma cell migration and
induction of bone disease. Am J Hematol, 88(6), 463-471. doi:
10.1002/ajh.23433
Bandeen-Roche, K., Walston, J. D., Huang, Y., Semba, R. D., & Ferrucci, L. (2009).
Measuring systemic inflammatory regulation in older adults: evidence and
utility. Rejuvenation Res, 12(6), 403-410. doi: 10.1089/rej.2009.0883
Beenken, A., & Mohammadi, M. (2009). The FGF family: biology, pathophysiology
and therapy. Nat Rev Drug Discov, 8(3), 235-253. doi: 10.1038/nrd2792
Bessa, P. C., Cerqueira, M. T., Rada, T., Gomes, M. E., Neves, N. M., Nobre, A., . . .
Casal, M. (2009). Expression, purification and osteogenic bioactivity of
recombinant human BMP-4,-9,-10,-11 and-14. Protein Expression and
Purification, 63(2), 89-94. doi: 10.1016/j.pep.2008.09.014
Bi, Y., Ehirchiou, D., Kilts, T. M., Inkson, C. A., Embree, M. C., Sonoyama, W., . . .
MF, Y. (2007). Identification of tendon stem/progenitor cells and the role of the
extracellular matrix in their niche. Nat Med, 13(10), 1219-1227.
Bocker, W., Yin, Z., Drosse, I., Haasters, F., Rossmann, O., Wierer, M., . . . Schieker,
M. (2008). Introducing a single-cell-derived human mesenchymal stem cell line
expressing hTERT after lentiviral gene transfer. J Cell Mol Med, 12(4), 1347-
1359. doi: 10.1111/j.1582-4934.2008.00299.x
Borthwick, G. M., Johnson, A. S., Partington, M., Burn, J., Wilson, R., & Arthur, H. M.
(2006). Therapeutic levels of aspirin and salicylate directly inhibit a model of
angiogenesis through a Cox-independent mechanism. Faseb Journal, 20(12),
2009-2016. doi: 10.1096/fj.06-5987com
Bosco, M. C., Pierobon, D., & Blengio, F. (2011). Hypoxia modulates the gene
expression profile of immunoregulatory receptors in human mature dendritic
cells: identification of TREM-1 as a novel hypoxic marker in vitro and in vivo.
Blood Press, 117(9), 2625–2639.
Bosshardt, D.D. and Sculean, A. (2009). Does periodontal tissue regeneration really
work?, Periodontology 2000 (51), 208–219.
Bouchon, A., Dietrich, J., & Colonna, M. (2000). Cutting edge: Inflammatory responses
can be triggered by TREM-1, a novel receptor expressed on neutrophils and
monocytes. Journal of Immunology, 164(10), 4991-4995.
Boyle, W. J., Simonet, W. S., & Lacey, D. L. (2003). Osteoclast differentiation and
activation. Nature, 423(6937), 337-342. doi: 10.1038/nature01658
Bussolino, F., Ziche, M., Wang, J. M., Alessi, D., Morbidelli, L., Cremona, O., . . .
Mantovani, A. (1991). In vitro and in vivo activation of endothelial cells by
179
colony-stimulating factors. J Clin Invest, 87(3), 986-995. doi:
10.1172/JCI115107
Cao, Y., Xiong, J., Mei, S., Wang, F., Zhao, Z., Wang, S., & Liu, Y. (2015). Aspirin
promotes bone marrow mesenchymal stem cell-based calvarial bone
regeneration in mini swine. Stem Cell Res Ther, 6, 210. doi: 10.1186/s13287-
015-0200-4
Capulli, M., Paone, R., & Rucci, N. (2014). Osteoblast and osteocyte: Games without
frontiers: Games without frontiers. Archives of Biochemistry and Biophysics,
561, 3-12.
Carreira, A. C., Lojudice, F. H., Halcsik, E., Navarro, R. D., Sogayar, M. C., &
Granjeiro, J. M. (2014). Bone morphogenetic proteins: facts, challenges, and
future perspectives. J Dent Res, 93(4), 335-345.
Casimiro, D. R., Cox, K., Tang, A., Sykes, K. J., Feng, M., Wang, F., . . . Shiver, J. W.
(2010). Efficacy of multivalent adenovirus-based vaccine against simian
immunodeficiency virus challenge. J Virol, 84(6), 2996-3003.
Celeste, A. J., Iannazzi, J. A., Taylor, R. C., & Hewick, R. M. e. a. (1990).
Identification of transforming growth factor f8 family members present in bone-
inductive protein purified from bovine bone. Biochemistry, 87, 9843-9847.
Chagraoui, J., Lepage-Noll, A., Anjo, A., Uzan, G., & Charbord, P. (2003). Fetal liver
stroma consists of cells in epithelial-to-mesenchymal transition. Blood, 101(8),
2973-2982. doi: 10.1182/blood-2002-05-1341
Chang, Li, C. J., Wu, S. C., Yeh, C. H., Chen, C. H., Fu, Y. C., . . . Ho, M. L. (2007).
Effects of anti-inflammatory drugs on proliferation, cytotoxicity and
osteogenesis in bone marrow mesenchymal stem cells. Biochem Pharmacol,
74(9), 1371-1382.
Chang, Wang, G. J., Tsai, S. T., & Ho, M. L. (2005). Nonsteroidal anti-inflammatory
drug effects on osteoblastic cell cycle, cytotoxicity, and cell death. Connect
Tissue Res, 46(4-5), 200-210. doi: 10.1080/03008200500344025
Chang, J., Liu, F., Lee, M., Wu, B., Ting, K., Zara, J. N., . . . Wang, C. Y. (2013). NF-
kappaB inhibits osteogenic differentiation of mesenchymal stem cells by
promoting beta-catenin degradation. Proc Natl Acad Sci U S A, 110(23), 9469-
9474. doi: 10.1073/pnas.1300532110
Chen, G., Deng, C., & Li, Y. P. (2012). TGF-beta and BMP signaling in osteoblast
differentiation and bone formation. Int J Biol Sci, 8(2), 272-288.
Chen, H. Y., Shi, S., Acosta, L., Li, W. M., Lu, J., Bao, S.Chen, Z., Yang, Z.,
Schneider, M.D., Chien, K.R., Conway, S.J., Yoder, M.C., Haneline, L.S.,
Franco, D. & Shou, W. N. (2004). BMP10 is essential for maintaining cardiac
growth during murine cardiogenesis. Development, 131(9), 2219-2231. doi:
10.1242/dev.01094
180
Chen, Q., Liu, K., Robinson, A. R., Clauson, C. L., Blair, H. C., Robbins, P. D., . . .
Ouyang, H. (2013). DNA damage drives accelerated bone aging via an NF-
kappaB-dependent mechanism. J Bone Miner Res, 28(5), 1214-1228. doi:
10.1002/jbmr.1851
Cho, M. I., Matsuda, N., Lin, W. L., Moshier, A., & Ramakrishnan, P. R. (1992). In
vitro formation of mineralized nodules by periodontal ligament cells from the
rat. Calcif Tissue Int, 50(5), 459-467.
Choi, H. D., Noh, W. C., Park, J. W., Lee, J. M., & Suh, J. Y. (2011). Analysis of gene
expression during mineralization of cultured human periodontal ligament cells. J
Periodontal Implant Sci, 41(1), 30-43. doi: 10.5051/jpis.2011.41.1.30
Clase, K. L., Mitchell, P. J., Ward, P. J., Dorman, C. M., Johnson, S. E., & Hannon, K.
(2000). FGF5 stimulates expansion of connective tissue fibroblasts and inhibits
skeletal muscle development in the limb. Dev Dyn, 219(3), 368-380.
Colnot, C. (2011). Cell sources for bone tissue engineering: insights from basic science.
Tissue Eng Part B Rev, 17(6), 449-457. doi: 10.1089/ten.TEB.2011.0243
Colonna, M., & Facchetti, F. (2003). TREM-1 (triggering receptor expressed on
myeloid cells): a new player in acute inflammatory responses. J Infect Dis, 187
Suppl 2, S397-401.
Correa, J. D., Pereira, D. S., Madeira, M. F., Queiroz-Junior, C. M., Souza, D. G.,
Teixeira, M. M., . . . da Silva, T. A. (2014). Brain-derived neurotrophic factor in
chronic periodontitis. Mediators Inflamm, 2014, 373765.
Coura, G. S., Garcez, R. C., de Aguiar, C. B., Alvarez-Silva, M., Magini, R. S., &
Trentin, A. G. (2008). Human periodontal ligament: a niche of neural crest stem
cells. J Periodontal Res, 43(5), 531-536.
Crofford, L. J. (1997). COX-1 and COX-2 tissue expression: implications and
predictions. J Rheumatol Suppl, 49, 15-19.
Dailey, L., Ambrosetti, D., Mansukhani, A., & Basilico, C. (2005). Mechanisms
underlying differential responses to FGF signaling. Cytokine Growth Factor
Rev, 16(2), 233-247
De Luna-Bertos, E., Ramos-Torrecillas, J., Garcia-Martinez, O., Diaz-Rodriguez, L., &
Ruiz, C. (2012). Effect of aspirin on cell growth of human MG-63 osteosarcoma
line. ScientificWorldJournal, 2012, 834246.
Di Benedetto, A., Brunetti, G., Posa, F., Ballini, A., Grassi, F. R., Colaianni, G., . . .
Mori, G. (2015). Osteogenic differentiation of mesenchymal stem cells from
dental bud: Role of integrins and cadherins. Stem Cell Res, 15(3), 618-628.
Ding, G., Liu, Y., Wang, W., Wei, F., Liu, D., Fan, Z., . . . Wang, S. (2010). Allogeneic
periodontal ligament stem cell therapy for periodontitis in swine. Stem Cells,
28(10), 1829-1838.
181
Docheva, D., Popov, C., Mutschler, W., & Schieker, M. (2007). Human mesenchymal
stemcells in contact with their environment: surface characteristics and the
integrin system. Cell. Mol. Med, 11(1), 21-38.
Dominici, M., Le Blanc, K., Mueller, I., Slaper-Cortenbach, I., Marini, F., Krause, D., .
. . Horwitz, E. (2006). Minimal criteria for defining multipotent mesenchymal
stromal cells. The International Society for Cellular Therapy position statement.
Cytotherapy, 8(4), 315-317.
Doran, M. R., Frith, J. E., Prowse, A. B., Fitzpatrick, J., Wolvetang, E. J., Munro, T. P.,
. . . Cooper-White, J. J. (2010). Defined high protein content surfaces for stem
cell culture. Biomaterials, 31(19), 5137-5142.
Downey, P. A., & Siegel, M. I. (2006). Bone biology and the clinical implications for
osteoporosis. Phys Ther, 86(1), 77-91.
Ebisawa, T., Tada, K., Kitajima, I., Tojo, K., Sampath, T. K., Kawabata, M., . . .
Imamura, T. (1999). Characterization of bone morphogenetic protein-6 signaling
pathways in osteoblast differentiation. J Cell Sci, 112 ( Pt 20), 3519-3527.
Eijken, M., Swagemakers, S., Koedam, M., Steenbergen, C., Derkx, P., Uitterlinden, A.
G., . . . van Leeuwen, J. P. (2007). The activin A-follistatin system: potent
regulator of human extracellular matrix mineralization. FASEB J, 21(11), 2949-
2960.
Erik Lubberts, L. A. B. J., Birgitte Oppers-Walgreen,Steven R. Goldring,Allison R.
Pettit,Ellen M. Gravallese, Liduine van den Bersselaar, and Wim B. van den
Berg. (2002). Increase in Expression of Receptor Activator of Nuclear Factor B
at Sites of Bone Erosion Correlates With Progression of Inflammation in
Evolving Collagen-Induced Arthritis. .Arthritis & Rheumatism, 46(11), 3055–
3064.
Erlandsen, H., Ames, J. E., Tamkenath, A., Mamaeva, O., Stidham, K., Wilson, M. E.,
Perez-Pinera, P., Deuel, T.F. & Macdougall, M. (2012). Pleiotrophin expression
during odontogenesis. J Histochem Cytochem, 60(5), 366-375.
Fakhry, A., Ratisoontorn, C., Vedhachalam, C., Salhab, I., Koyama, E., Leboy, P., . . .
Nah, H. D. (2005). Effects of FGF-2/-9 in calvarial bone cell cultures:
differentiation stage-dependent mitogenic effect, inverse regulation of BMP-2
and noggin, and enhancement of osteogenic potential. Bone, 36(2), 254-266.
Fazzi, R., Pacini, S., Testi, R., Azzara, A., Galimberti, S., Testi, C., . . . Petrini, M.
(2003). Carboxy-terminal fragment of osteogenic growth peptide in vitro
increases bone marrow cell density in idiopathic myelofibrosis. Br J Haematol,
121(1), 76-85.
Feng, F., Akiyama, K., Liu, Y., Yamaza, T., Wang, T. M., Chen, J. H., . . . Shi, S.
(2010). Utility of PDL progenitors for in vivo tissue regeneration: a report of 3
cases. Oral Dis, 16(1), 20-28.
Fierro, F., Illmer, T., J.D,, Schleyer, E., Ehninger, G., Boxberger, S., & Bornhauser, M.
(2007). Inhibition of platelet-derived growth factor receptor beta by imatinib
182
mesylate suppresses proliferation and alters differentiation of human
mesenchymal stem cells in vitro. Cell Proliferation, 40, 355-366.
Fortino, V. R., Chen, R. S., Pelaez, D., & Cheung, H. S. (2014). Neurogenesis of neural
crest-derived periodontal ligament stem cells by EGF and bFGF. J Cell Physiol,
229(4), 479-488. doi: 10.1002/jcp.24468
Franceschi, R. T. (1992). The role of ascorbic acid in mesenchymal differentiation. Nutr
Rev, 50(3), 65-70.
Franceschi, R. T., & Xiao, G. (2003). Regulation of the osteoblast-specific transcription
factor, Runx2: responsiveness to multiple signal transduction pathways. J Cell
Biochem, 88(3), 446-454. 9
Franz-Odendaal, T. A., Hall, B. K., & Witten, P. E. (2006). Buried alive: how
osteoblasts become osteocytes.. Dev Dyn., 235(1), 176-190.
Friedenstein, A. J., Chailakhjan, R.K., & Lalykina, K.S. (1970). The development of
fibroblasts colonies in monolayer cultures of guinea-pig bone marrow and splees
cells. Cell Proliferation, 3(4), 393-403.
Fung, M. L. (2014). The role of local renin-angiotensin system in arterial
chemoreceptors in sleep-breathing disorders. Front Physiol, 5, 336.
Gaddy-Kurten, D., Coker, J. K., Abe, E., Jilka, R. L., & Manolagas, S. C. (2002).
Inhibin suppresses and activin stimulates osteoblastogenesis and
osteoclastogenesis in murine bone marrow cultures. Endocrinology, 143(1), 74-
83.
Ganss, B., & Jheon, A. (2004). Zinc finger transcription factors in skeletal development.
Crit Rev Oral Biol Med, 15(5), 282-297.
Gay, I. C., Chen, S., & MacDougall, M. (2007). Isolation and characterization of
multipotent human periodontal ligament stem cells. Orthod Craniofac Res,
10(3), 149-160.
Giacca, M., & Zacchigna, S. (2012). VEGF gene therapy: therapeutic angiogenesis in
the clinic and beyond. Gene Ther, 19(6), 622-629. doi: 10.1038/gt.2012.17
Gilbert, L., He, X., Farmer, P., Rubin, J., Drissi, H., van Wijnen, A., J., . . . Nanes, M. S.
(2002). Expression of the Osteoblast Differentiation Factor RUNX2
(Cbfa1/AML3/Pebp2αA) Is Inhibited by Tumor Necrosis Factor-α. J Biol Chem,
277, 2695-2701.
Gingras, M. C., Lapillonne, H., & Margolin, J. F. (2002). TREM-1, MDL-1, and
DAP12 expression is associated with a mature stage of myeloid development.
Molecular Immunology, 38(11), 817-824.
Gori, F., Thomas, T., Hicok, K. C., Spelsberg, T. C., & Riggs, B. L. (1999).
Differentiation of human marrow stromal precursor cells: bone morphogenetic
183
protein-2 increases OSF2/CBFA1, enhances osteoblast commitment, and
inhibits late adipocyte maturation. J Bone Miner Res, 14(9), 1522-1535.
Gourraud, J. B., le Scouarnec, S., & Sacher F. (2013). Identification of large families in
early repolarization syndrome. Journal of the American College of Cardiology,
61, 164–172.
Gonzalez, E. L. P., P.; Tacconelli, S.; Rodriguez, L.A. Variability of risk of upper
gastrointestinal bleeding among nonsteroidal anti-inflammatory drugs. Arthritis
Rheum. 2010,[Epub ahead of print]. (Variability of risk of upper gastrointestinal
bleeding among nonsteroidal anti-inflammatory drugs).
Gray, P. A., Warner , T. D., IVojnovic , I., P Del Soldato, P., Parikh , A., Scadding
G.K., & Mitchell, J. A. (2002). Effects of non-steroidal antiinfl ammatory drugs
on cyclo-oxygenase and lipoxygenase activity in whole blood from aspirin-
sensitive asthmatics vs healthy donors Br J Pharmacol 137, 1031 – 1038.
Greber, B., Lehrach, H., & Adjaye, J. (2007). Fibroblast growth factor 2 modulates
transforming growth factor beta signaling in mouse embryonic fibroblasts and
human ESCs (hESCs) to support hESC self-renewal. Stem Cells, 25(2), 455-464.
doi: 10.1634/stemcells.2006-0476
Gregory, C. A., Gunn, W. G., Reyes, E., Smolarz, A. J., Munoz, J., Spees, J. L., &
Prockop, D. J. (2005). How Wnt signaling affects bone repair by mesenchymal
stem cells from the bone marrow. Stem Cell Biology: Development and
Plasticity, 1049, 97-106.
Gronthos, S., Mankani, M., Brahim, J., Robey, P. G., & Shi, S. (2000). Postnatal human
dental pulp stem cells (DPSCs) in vitro and in vivo. Proc Natl Acad Sci U S A,
97(25), 13625-13630.
Gronthos, S., & Simmons, P. J. (1995). The growth factor requirements of STRO-1-
positive human bone marrow stromal precursors under serum-deprived
conditions in vitro. Blood, 85(4), 929-940.
Gronthos, S., Simmons, P. J., Graves, S. E., & Robey, P. G. (2001). Integrin-mediated
interactions between human bone marrow stromal precursor cells and the
extracellular matrix.. Bone, 28(2), 174-181.
Gronthos, S., Zannettino, A. C., Hay, S. J., Shi, S., Graves, S. E., Kortesidis, A., &
Simmons, P. J. (2003). Molecular and cellular characterisation of highly purified
stromal stem cells derived from human bone marrow. J Cell Sci, 116(Pt 9),
1827-1835.
Guan, X. X., Zhou, Y., & Li, J. Y. (2011). Reciprocal roles of angiotensin II and
Angiotensin II Receptors Blockade (ARB) in regulating Cbfa1/RANKL via
cAMP signaling pathway: possible mechanism for hypertension-related
osteoporosis and antagonistic effect of ARB on hypertension-related
osteoporosis. Int J Mol Sci, 12(7), 4206-4213. doi: 10.3390/ijms12074206
Guo, C., Yuan, L., Wang, J. G., Wang, F., Yang, X. K., Zhang, F. H., . . . Song, G. H.
(2014). Lipopolysaccharide (LPS) induces the apoptosis and inhibits osteoblast
184
differentiation through JNK pathway in MC3T3-E1 cells. Inflammation. 2014
Apr;37(2):621-31. doi: 10.1007/s10753-013-9778-9.
Hagiwara, H., Hiruma, Y., Inoue, A., Yamaguchi, A., & Hirose, S. (1998). Deceleration
by angiotensin II of the differentiation and bone formation of rat calvarial
osteoblastic cells. J Endocrinol, 156(3), 543-550.
Hanada, K., Dennis, J. E., & Caplan, A. I. (1997). Stimulatory effects of basic fibroblast
growth factor and bone morphogenetic protein-2 on osteogenic differentiation of
rat bone marrow-derived mesenchymal stem cells. J Bone Miner Res, 12(10),
1606-1614. doi: 10.1359/jbmr.1997.12.10.1606
Harada, S., & Rodan, G. A. (2003). Control of osteoblast function and regulation of
bone mass. Nature, 423(6937), 349-355. doi: 10.1038/nature01660
Hasegawa R., Tomaru, Y., de Hoon, M., Suzuki, H., Hayashizaki, Y., & Shin, J. W.
(2013). Identification of ZNF395 as a novel modulator of adipogenesis. Exp.
Cell Res., 319, 68-76.
Hatton, R., Stimpel, M., & Chambers, T. J. (1997). Angiotensin II is generated from
angiotensin I by bone cells and stimulates osteoclastic bone resorption in vitro.
Journal of Endocrinology, 152(1), 5-10. doi: DOI 10.1677/joe.0.1520005
Haub O, Goldfarb M (1991). Expression of the fibroblast growth factor-5 gene in the
mouse embryo. Development 1991;112:397-406.
Haub, O., Drucker, B., & Goldfarb, M (1990). Expression of the murine fibroblast
growth factor 5 gene in the adult central nervous system. Proc Natl Acad Sci U S
A, 87(20), 8022-8026.
He, S., Nakada, D., & Morrison, S. J. (2009). Mechanisms of stem cell self-renewal.
Annu Rev Cell Dev Biol, 25, 377-406.
Heasman, P. A., & Hughes, F. J. (2014). Drugs, medications and periodontal disease. Br
Dent J, 217(8), 411-419. doi: 10.1038/sj.bdj.2014.905
Hébert, J. M., Boyle, M., & Martin, G. R. ( 1991 ). mRNA localization studies suggest
that murine FGF-5 plays a role in gastrulation. Development., 112(2), 407-415.
Ho, M. L., Chang, J. K., Chuang, L. Y., Hsu, H. K., & Wang, G. J. (1999). Effects of
nonsteroidal anti-inflammatory drugs and prostaglandins on osteoblastic
functions. Biochem Pharmacol, 58(6), 983-990.
Ho, M. L., Chang, J. K., Tsai, H. T., Cho, M. H., & Wang, G. J. (2001). Nonsteroidal
anti-inflammatory drugs arrest cell cycle in G0/G1 phase and induce cell death
in osteoblast-enriched cultures. J Musculoskeletal Res, 5, 279–289.
Hoch, R. V., & Soriano, P. (2003). Roles of PDGF in animal development.
Development, 130(20), 4769-4784. doi: 10.1242/dev.00721
185
Huang, Gronthos, S., & Shi, S. (2009). Mesenchymal stem cells derived from dental
tissues vs. those from other sources: their biology and role in regenerative
medicine. J Dent Res, 88(9), 792–806.
Huang da, W., Sherman, B. T., & Lempicki, R. A. (2009). Bioinformatics enrichment
tools: paths toward the comprehensive functional analysis of large gene lists.
Nucleic Acids Res, 37(1), 1-13. doi: 10.1093/nar/gkn923
Huang, F., Hu, X., Fang, C., Liu, H., Lin, C., Zhang, Y., & Hu, X. (2015). Expression
profile of critical genes involved in FGF signaling pathway in the developing
human primary dentition. Histochem Cell Biol, 144(5), 457-469. doi:
10.1007/s00418-015-1358-7
Hughes-Fulford, M., & Li, C. F. (2011). The role of FGF-2 and BMP-2 in regulation of
gene induction, cell proliferation and mineralization. J Orthop Surg Res, 6, 8.
doi: 10.1186/1749-799X-6-8
Hurley, M. M., Abreu, C., Marcello, K., Kawaguchi, H., Lorenzo, J., Kalinowski, J., . . .
Gronowicz, G. (1996). Regulation of NFIL-6 and IL-6 expression by basic
fibroblast growth factor in osteoblasts. J Bone Miner Res, 11(6), 760-767. doi:
10.1002/jbmr.5650110607
Hurley, M. M., Marie, P. J., & Florkiewicz, R. Z. (2002). Fibroblast growth factor
(FGF) and FGF receptor families in bone. In book: Principles of Bone Biology, ,
pp. 825–851.
Ibi, M., Ishisaki, A., Yamamoto, M., Wada S, Kozakai, T., Nakashima, A., . . . M, T.
(2007). Establishment of cell lines that exhibit pluripotency from miniature
swine periodontal ligaments. Arch Oral Biol. , 52(10), 1002-1008.
Igarashi, M., Kamiya, N., Hasegawa, M., Kasuya, T., Takahashi, T., & Takagi, M.
(2004). Inductive effects of dexamethasone on the gene expression of Cbfa1,
Osterix and bone matrix proteins during differentiation of cultured primary rat
osteoblasts. J Mol Histol, 35(1), 3-10.
Ikeda, E., Yagi, K., Kojima, M., Yagyuu, T., Ohshima, A., Sobajima, S., . . . Ohgushi,
H. (2008). Multipotent cells from the human third molar: feasibility of cell-
based therapy for liver disease. Differentiation, 76(5), 495-505. doi:
10.1111/j.1432-0436.2007.00245.x
Istvanffy, R., Kroger, M., Eckl, C., Gitzelmann, S., Vilne, B., Bock, F., . . . Oostendorp,
R. A. (2011). Stromal pleiotrophin regulates repopulation behavior of
hematopoietic stem cells. Blood, 118(10), 2712-2722. doi: 10.1182/blood-2010-
05-287235
Itoh, N., & Ornitz, D. M. (2011). Fibroblast growth factors: from molecular evolution to
roles in development, metabolism and disease. J Biochem, 149(2), 121-130. doi:
10.1093/jb/mvq121
Itoh, K., Inoue, T., Ito, K., Hirohata S (1994). The interplay of interleukin-10 (IL-10)
and interleukin-2 (IL-2) in humoral immune response:IL-10 synergizes with IL-
186
2 to enhance responses of human B lymphocytes in a mechanism which is
different from upregulation of CD25 expression. Cell Immunol, 157: 478-388.
Jacob, A. L., Smith, C., Partanen, J., & Ornitz, D. M. (2006). Fibroblast growth factor
receptor 1 signaling in the osteo-chondrogenic cell lineage regulates sequential
steps of osteoblast maturation. Dev Biol, 296(2), 315-328. doi:
10.1016/j.ydbio.2006.05.031
Jaiswal, N., Haynesworth, S. E., Caplan, A. I., & Bruder, S. P. (1997). Osteogenic
differentiation of purified, culture-expanded human mesenchymal stem cells in
vitro.J Cell Biochem, 64, 295-312.
Javed, A., Chen, H., & Ghori, F. Y. (2010). Genetic and transcriptional control of bone
formation. Oral Maxillofac Surg Clin North Am, 22(3), 283-293, v. doi:
10.1016/j.coms.2010.05.001
Jennifer Heinke, Leonie Wehofsits, Qian Zhou, Christoph Zoeller, Kim-Miriam Baar,
Thomas Helbing, . . . . (2008). BMPER Is an Endothelial Cell Regulator and
Controls Bone Morphogenetic Protein-4–Dependent Angiogenesis. Circulation
Research, 103, 804-812.
Jensen, E. D., Gopalakrishnan, R., & Westendorf, J. J. (2010). Regulation of gene
expression in osteoblasts. Biofactors, 36(1), 25-32. doi: 10.1002/biof.72
Jilka, R. L., Weinstein, R. S., Bellido, T., Parfitt, A. M., & Manolagas, S. C. (1998).
Osteoblast programmed cell death (apoptosis): modulation by growth factors
and cytokines. J Bone Miner Res, 13(5), 793-802. doi:
10.1359/jbmr.1998.13.5.793
Kaigler, D., Krebsbach, P. H., West, E. R., Horger, K., Huang, Y. C., & Mooney, D. J.
(2005). Endothelial cell modulation of bone marrow stromal cell osteogenic
potential. FASEB J, 19(6), 665-667. doi: 10.1096/fj.04-2529fje
Kaneko, K., Ito, M., Fumoto, T., Fukuhara, R., Ishida, J., Fukamizu, A., & Ikeda, K.
(2011). Physiological function of the angiotensin AT1a receptor in bone
remodeling. J Bone Miner Res, 26(12), 2959-2966. doi: 10.1002/jbmr.501
Kang, Q., Sun, M. H., Cheng H, Peng, Y., Montag, A. G., Deyrup, A. T., . . . He, T. C.
(2004). Characterization of the distinct orthotopic bone-forming activity of 14
BMPs using recombinant adenovirus-mediated gene delivery. Gene Ther.(17),
1312-1320.
Karalaki, M., Fili, S., Philippou, A., & Koutsilieris, M. (2009). Muscle regeneration:
cellular and molecular events. In Vivo, 23(5), 779-796.
Katagiri, T., Yamaguchi, A., Komaki, M., Abe, E., Takahashi, N., Ikeda, T., . . . Suda,
T. (1994). Bone morphogenetic protein-2 converts the differentiation pathway of
C2C12 myoblasts into the osteoblast lineage. J. Cell Biol., 127, 1755-1766.
Kawaguchi, H., Pilbeam, C. C., Gronowicz, G., Abreu, C., Fletcher, B. S., Herschman,
H. R., . . . Hurley, M. M. (1995). Transcriptional induction of prostaglandin G/H
187
synthase-2 by basic fibroblast growth factor. J Clin Invest, 96(2), 923-930. doi:
10.1172/JCI118140
Kim, Kim, H. W., & Suh, H. (2003). Sustained release of ascorbate-2-phosphate and
dexamethasone from porous PLGA scaffolds for bone tissue engineering using
mesenchymal stem cells. Biomaterials 24, 4671-4679.
Kim, D. W., Meaghan, S., Kazutaka, S., Paolina P., Sung-Don, K., & Cesar, V. B.
(2013). Wharton’s Jelly-Derived Mesenchymal Stem Cells: Phenotypic
Characterization and Optimizing Their Therapeutic Potential for Clinical
Applications. Int J Mol Sci., 14(6), 11692-11712.
Kimble, R. B., Vannice, J. L., Bloedow, D. C., Thompson, R. C., Hopfer, W., Kung, V.
T., . . . Pacifici, R. (1994). Interleukin-1 receptor antagonist decreases bone loss
and bone resorption in ovariectomized rats. J Clin Invest, 93(5), 1959-1967. doi:
10.1172/JCI117187
Kitazawa, R., Kimble, R. B., Vannice, J. L., Kung, V. T., & Pacifici, R. (1994).
Interleukin-1 receptor antagonist and tumor necrosis factor binding protein
decrease osteoclast formation and bone resorption in ovariectomized mice. J
Clin Invest, 94(6), 2397-2406. doi: 10.1172/JCI117606
Klees, R. F., Salasznyk, R. M., Kingsley, K., Williams, W. A., Boskey, A., & Plopper,
G. E. (2005). Laminin-5 induces osteogenic gene expression in human
mesenchymal stem cells through an ERK-dependent pathway. Mol Biol Cell.,
16, 881-890.
Krum, S. A., Chang, J., Miranda-Carboni, G., & Wang, C. Y. (2010). Novel functions
for NFkappaB: inhibition of bone formation. Nat Rev Rheumatol, 6(10), 607-
611. doi: 10.1038/nrrheum.2010.133
Kubota, K., Iseki, S., Kuroda, S., Oida, S., Iimura, T., Duarte, W. R., . . . Kasugai, S.
(2002). Synergistic effect of fibroblast growth factor-4 in ectopic bone formation
induced by bone morphogenetic protein-2. Bone, 31(4), 465-471.
Kuznetsov, S. A., Krebsbach, P. H., Satomura, K., Kerr, J., , Riminucci, M., Benayahu,
D., & Robey, P. G. (1997). Single-colony derived strains of human marrow
stromal fibroblasts form bone after transplantation in vivo. J Bone Miner Res,
12, 1335–1347.
Lai, C. F., Chaudhary, L., Fausto, A., Halstead, L. R., Ory, D. S., Avioli, L. V., &
Cheng, S. L. (2001). Erk is essential for growth, differentiation, integrin
expression, and cell function in human osteoblastic cells. Journal of Biological
Chemistry, 276(17), 14443-14450.
Laine, M. L., Crielaard, W., & Loos, B. G. (2012). Genetic susceptibility to
periodontitis. Periodontol 2000, 58(1), 37-68. doi: 10.1111/j.1600-
0757.2011.00415.x
Lamothe, B., Yamada, M., Schaeper, U., Birchmeier, W., Lax, I., & Schlessinger, J.
(2004). The docking protein Gab1 is an essential component of an indirect
188
mechanism for fibroblast growth factor stimulation of the phosphatidylinositol
3-kinase/Akt antiapoptotic pathway. Mol Cell Biol, 24(13), 5657–5666.
Lamparter, S., Kling, L., Schrader, M., Ziegler, R., & Pfeilschifter, J. (1998). Effects of
angiotensin II on bone cells in vitro. J Cell Physiol, 175(1), 89-98. doi:
10.1002/(SICI)1097-4652(199804)175:1<89::AID-JCP10>3.0.CO;2-J
Lamprou, M., Kaspiris, A., Panagiotopoulos, E., Giannoudis, P. V., & Papadimitriou, E.
(2014a). The role of pleiotrophin in bone repair. Injury-International Journal of
the Care of the Injured, 45(12), 1816-1823. doi: 10.1016/j.injury.2014.10.013
Lamprou, M., Kaspiris, A., Panagiotopoulos, E., Giannoudis, P. V., & Papadimitriou, E.
(2014b). The role of pleiotrophin in bone repair. Injury-International Journal of
the Care of the Injured, 45(12), 1816-1823. doi: 10.1016/j.injury.2014.10.013
Langenbach F, H. J. (2013). Effects of dexamethasone, ascorbic acid and β-
glycerophosphate on the osteogenic differentiation of stem cells in vitro. Stem
Cell Res Ther., 4(5), 117.
Lanyon, L. E. (1993). Osteocytes, strain detection, bone modeling and remodeling.
Calcif Tissue Int, 53 Suppl 1, S102-106; discussion S106-107.
Lawrence, T. (2009). The nuclear factor NF-kappaB pathway in inflammation. Cold
Spring Harb Perspect Biol, 1(6), a001651. doi: 10.1101/cshperspect.a001651
Lax, I., Wong, A., Lamothe, B., Lee, A., Frost, A., Hawes, J., & Schlessinger, J. (2002).
The docking protein FRS2 alpha controls a MAP kinase-mediated negative
feedback mechanism for signaling by FGF receptors. Mol Cell, 10(4), 709-719.
Le, P. U., Angers-Loustau, A., de Oliveira, R. M., Ajlan, A., Brassard, C. L., Dudley,
A., . . . Petrecca, K. (2010). DRR drives brain cancer invasion by regulating
cytoskeletal-focal adhesion dynamics. Oncogene, 29(33), 4636-4647. doi:
10.1038/onc.2010.216
Lee, H. W., Suh, J. H., Kim, A. Y., Lee, Y. S., Park, S. Y., & Kim, J. B. (2006). Histone
deacetylase 1-mediated histone modification regulates osteoblast differentiation.
Mol Endocrinol, 20(10), 2432-2443. doi: 10.1210/me.2006-0061
Lekic PC, Rajshankar D, Chen H, Tenenbaum H, McCulloch CA (2001).
Transplantation of labeled periodontal ligament cells promotes regeneration of
alveolar bone. Anat Rec. 262(2):193-202.
Li, Amizuka, N., Oda, K., Tokunaga, K., Ito, T., Takeuchi, K., Takagi, R. & Maeda, T.
(2004). Histochemical evidence of the initial chondrogenesis and osteogenesis in
the periosteum of a rib fractured model: implications of osteocyte involvement
in periosteal chondrogenesis. Microsc Res Tech, 64(4), 330-342. doi:
10.1002/jemt.20088
Li, A., Xia, X., Yeh, J., Kua, H., Liu, H., Mishina, Y., Hao, A. & Li, B. (2014). PDGF-
AA promotes osteogenic differentiation and migration of mesenchymal stem cell
by down-regulating PDGFRalpha and derepressing BMP-Smad1/5/8 signaling.
PLoS One, 9(12), e113785. doi: 10.1371/journal.pone.0113785
189
Li, C., Li, B., Dong, Z., Gao, L., He, X., Liao, L., & Hu, C. ( 2014b).
Lipopolysaccharide differentially affects the osteogenic differentiation of
periodontal ligament stem cells and bone marrow mesenchymal stem cells
through Toll-like receptor 4 mediated nuclear factor κB pathway. Stem Cell Res
Ther., 5(3), 67.
Li, J. Y., Paragas, N., Ned, R. M., Qiu, A., Viltard, M., Leete, T., . . . Barasch, J. (2009).
Scara5 is a ferritin receptor mediating non-transferrin iron delivery.
Developmental cell., 16(1), 35-46.
Lin, G. L., & Hankenson, K. D. (2011). Integration of BMP, Wnt, and notch signaling
pathways in osteoblast differentiation. J Cell Biochem, 112(12), 3491-3501. doi:
10.1002/jcb.23287
Lin, N. H., Gronthos, S., & Bartold, P. M. (2009). Stem cells and future periodontal
regeneration. Periodontol 2000, 51, 239-251. doi: 10.1111/j.1600-
0757.2009.00303.x
Lin, Z., Rios, H. F., & Cochran, D. L. (2015). Emerging regenerative approaches for
periodontal reconstruction: a systematic review from the AAP Regeneration
Workshop. J Periodontol, 86(2 Suppl), S134-152. doi: 10.1902/jop.2015.130689
Ling, L., Murali, S., Dombrowski, C., Haupt, L. M., Stein, G. S., van Wijnen, A. J., . . .
Cool, S. M. (2006). Sulfated glycosaminoglycans mediate the effects of FGF2
on the osteogenic potential of rat calvarial osteoprogenitor cells. J Cell Physiol,
209(3), 811-825. doi: 10.1002/jcp.20760
Liu, J., Yu, F., Sun, Y., Jiang, B., Zhang, W., Yang, J., . . . Liu, S. (2015a). Concise
reviews: Characteristics and potential applications of human dental tissue-
derived mesenchymal stem cells. Stem Cells, 33(3), 627-638. doi:
10.1002/stem.1909
Liu Y, Chen C, Liu S, et al (2015b). Acetylsalicylic acid treatment improves
differentiation and immunomodulation of SHED. Journal of dental research,
94:209-218.
Liu, C., Gu, S. P., Sun, C., Ye, W. D., Song, Z. C., Zhang, Y. D., & Chen, Y. P. (2013).
FGF signaling sustains the odontogenic fate of dental mesenchyme by
suppressing beta-catenin signaling. Development, 140(21), 4375-4385. doi:
10.1242/dev.097733
Liu, Y., Wang, L., Kikuiri, T., Akiyama, K., Chen, C., Xu, X., . . . Shi, S. (2011a).
Mesenchymal stem cell-based tissue regeneration is governed by recipient T
lymphocytes via IFN-gamma and TNF-alpha. Nature medicine 17, 1594-1601.
Liu, H., Liu, Y., Viggeswarapu, M., Zheng, Z., Titus, L., & Boden, S. D. (2011b).
Activation of c-Jun NH(2)-terminal kinase 1 increases cellular responsiveness to
BMP-2 and decreases binding of inhibitory Smad6 to the type 1 BMP receptor. J
Bone Miner Res, 26(5), 1122-1132. doi: 10.1002/jbmr.296
190
Liu, Q., Zhao, X. Y., Bai, R. Z., Liang, S. F., Nie, C. L., Yuan, Z., . . . Wei, Y. Q.
(2009). Induction of tumor inhibition and apoptosis by a candidate tumor
suppressor gene DRR1 on 3p21.1. Oncol Rep, 22(5), 1069-1075.
Ma, J., Yang, F., Both, S. K., Prins, H. J., Helder, M. N., Pan, J., . . . van den Beucken,
J. J. (2014). In vitro and in vivo angiogenic capacity of BM-MSCs/HUVECs and
AT-MSCs/HUVECs cocultures. Biofabrication, 6(1), 015005. doi:
10.1088/1758-5082/6/1/015005
Makanji, Y., Zhu, J., Mishra, R., Holmquist, C., Wong, W. P. S., Schwartz, N. B., . . .
Woodruff, T. K. (2014). Inhibin at 90: From Discovery to Clinical Application,
a Historical Review. Endocrine Reviews, 35(5), 747-794. doi: 10.1210/er.2014-
1003
Malek, T. R. (2008). The biology of interleukin-2. Annu Rev Immunol, 26, 453-479. doi:
10.1146/annurev.immunol.26.021607.090357
Manolagas, S. C. (2000). Birth and death of bone cells: basic regulatory mechanisms
and implications for the pathogenesis and treatment of osteoporosis. Endocrine
Reviews, 21(2), 115-137. doi: 10.1210/edrv.21.2.0395
Marie, P. J. (2003). Fibroblast growth factor signaling controlling osteoblast
differentiation. Gene, 316, 23-32.
Marie, P. J., Hay, E., & Saidak, Z. (2014). Integrin and cadherin signaling in bone: role
and potential therapeutic targets. Trends Endocrinol Metab, 25(11), 567-575.
doi: 10.1016/j.tem.2014.06.009
Massague, J. (1998). TGF-beta signal transduction. Annu Rev Biochem, 67, 753-791.
doi: 10.1146/annurev.biochem.67.1.753
Matsubara, T., Kida, K., Yamaguchi, A., Hata, K., Ichida, F., Meguro, H., . . . Yoneda,
T. (2008). BMP2 regulates Osterix through Msx2 and Runx2 during osteoblast
differentiation. Biol Chem., 283(43), 29119-29125.
Matsubara, T., Suardita K, Ishii M., Sugiyama, M., Igarashi, A., Oda, R., . . . Kato, Y.
(2005). alveloar bone marrow as a cell source for regenerative
medicine:differences between alveolar and iliac bone marrow stroma cells. 20,
399-409.
Mauney, J., & Volloch, V. (2010). Human bone marrow-derived stromal cells show
highly efficient stress-resistant adipogenesis on denatured collagen IV matrix
but not on its native counterpart: implications for obesity. Matrix Biol, 9-14.
Mead, B., Logan, A., Berry, M., Leadbeater, W., & Scheven, B. A. (2014). Paracrine-
mediated neuroprotection and neuritogenesis of axotomised retinal ganglion
cells by human dental pulp stem cells: comparison with human bone marrow
and adipose-derived mesenchymal stem cells. PLoS One, 9(10), e109305. doi:
10.1371/journal.pone.0109305
191
Menssen, A., Haupl, T., Sittinger, M., Delorme, B., Charbord, P., & Ringe, J. (2011).
Differential gene expression profiling of human bone marrow-derived
mesenchymal stem cells during adipogenic development. BMC Genomics, 12,
461. doi: 10.1186/1471-2164-12-461
Mi, H., Muruganujan, A., & Thomas, P. D. (2013). PANTHER in 2013: modeling the
evolution of gene function, and other gene attributes, in the context of
phylogenetic trees. Nucleic Acids Res, 41(Database issue), D377-386. doi:
10.1093/nar/gks1118
Michibata, H., Yanaka, N., Kanoh, Y., Okumura, K., & K., O. ( 2001 ). Human
Ca2+/calmodulin-dependent phosphodiesterase PDE1A: novel splice variants,
their specific expression, genomic organization, and chromosomal localization.
Biochim Biophys Acta., 1517(2), 278-287.
Min, Y. K., Rao, Y., Okada, Y., Raisz, L. G., & Pilbeam, C. C. (1998). Regulation of
prostaglandin G/H synthase-2 expression by interleukin-1 in human osteoblast-
like cells. J Bone Miner Res, 13(7), 1066-1075. doi:
10.1359/jbmr.1998.13.7.1066
Miraoui, H., Oudina, K., Petite, H., Tanimoto, Y., Moriyama, K., & Marie, P. J. (2009).
Fibroblast growth factor receptor 2 promotes osteogenic differentiation in
mesenchymal cells via ERK1/2 and protein kinase C signaling. J Biol Chem,
284(8), 4897-4904. doi: 10.1074/jbc.M805432200
Miura, M., Gronthos, S., Zhao, M., Lu, B., Fisher, L. W., Robey, P. G., & Shi, S.
(2003). SHED: stem cells from human exfoliated deciduous teeth. Proc Natl
Acad Sci U S A, 100(10), 5807-5812. doi: 10.1073/pnas.0937635100
Mohamed, A. J., Yu, L., & Backesjo, C. M. (2009). Bruton’s tyrosine kinase (Btk):
Function, regulation, and transformation with special emphasis on the PH
domain. Immunol Rev(228), 58-73.
Morrison, S. J., & Judith Kimble, J. (2006). Review article Asymmetric and symmetric
stem-cell divisions in development and cancer. Nature 441, 1068-1074
Morsczeck, C., Götz, W., Schierholz, J., Zeilhofer, F., Kühn, U., Möhl, C., . . . KH., H.
(2005). Isolation of precursor cells (PCs) from human dental follicle of wisdom
teeth. Matrix Biol, 24(2):155-65.
Moser, M., Binder, O., Wu, Y., Aitsebaomo, J., Ren, R., Bode, C., . . . Patterson, C.
(2003). BMPER, a novel endothelial cell precursor-derived protein, antagonizes
bone morphogenetic protein signaling and endothelial cell differentiation. Mol
Cell Biol, 23(16), 5664-5679.
Moshaverinia, A., Chen, C., Xu, X., Akiyama, K., Ansari, S., Zadeh, H. H., & Shi, S.
(2014). Bone regeneration potential of stem cells derived from periodontal
ligament or gingival tissue sources encapsulated in RGD-modified alginate
scaffold. Tissue Eng Part A, 20(3-4), 611-621. doi: 10.1089/ten.TEA.2013.0229
Muller, M., Raabe, O., Addicks, K., Wenisch, S., & Arnhold, S. (2011). Effects of non-
steroidal anti-inflammatory drugs on proliferation, differentiation and migration
192
in equine mesenchymal stem cells. Cell Biol Int, 35(3), 235-248. doi:
10.1042/CBI20090211
Muraglia, A., Cancedda, R., & Quarto, R. (2000). Clonal mesenchymal progenitors
from human bone marrow differentiate in vitro according to a hierarchical
model. J Cell Sci, 113 ( Pt 7), 1161-1166.
Musina, Bekchanova, E. S., Belyavskii, A. V., & Sukhikh, G. T. (2006). Differentiation
potential of mesenchymal stem cells of different origin. Bull Exp Biol Med,
141(1), 147-151.
Musina, Bekchanova, E. S., & Sukhikh, G. T. (2005). Comparison of mesenchymal
stem cells obtained from different human tissues. Bull Exp Biol Med, 139, 504-
509.
Nakai, K., Kawato, T., Morita, T., Yamazaki, Y., Tanaka, H., Tonogi, M., . . . Maeno,
M. (2015). Angiotensin II suppresses osteoblastic differentiation and
mineralized nodule formation via AT1 receptor in ROS17/2.8 cells. Arch Med
Sci, 11(3), 628-637. doi: 10.5114/aoms.2015.52369
Nakase, T., Nomura, S., Yoshikawa, H., Hashimoto, J., Hirota, S., Kitamura, Y., . . .
Takaoka, K. (1994). Transient and localized expression of bone morphogenetic
protein 4 messenger RNA during fracture healing. J Bone Miner Res, 9(5), 651-
659. doi: 10.1002/jbmr.5650090510
Nakashima, K., Zhou, X., Kunkel, G., Zhang, Z., Deng, J. M., Behringer, R. R., & de
Crombrugghe, B. (2002). The novel zinc finger-containing transcription factor
osterix is required for osteoblast differentiation and bone formation. Cell, 108,
17–29.
Nishimura, R., Hata, K., Ikeda, F., Matsubara, T., Yamashita, K., Ichida, F., & Yoneda,
T. (2003). The role of Smads in BMP signaling. Front Biosci, 8, s275-284.
Noble, B. S., Stevens, H., Loveridge, N., & Reeve, J. (1997). Identification of apoptotic
changes in osteocytes in normal and pathological human bone. Bone, 20(3), 273-
282.
Nohe, A., Keating, E., Knaus, P., & Petersen, N. O. (2004). Signal transduction of bone
morphogenetic protein receptors. Cell Signal, 16(3), 291-299.
Ohbayashi, N., Shibayama, M., Kurotaki, Y., Imanishi, M., Fujimori, T., Itoh, N., &
Takada, S. (2002). FGF18 is required for normal cell proliferation and
differentiation during osteogenesis and chondrogenesis. Genes Dev, 16(7), 870-
879.
Okada, K., Fukai, A., Mori, D., Hosaka, Y., Yano, F., Chung, U. I., . . . Saito, T. ( 2014
). Identification of SCAN domain zinc-finger gene ZNF449 as a novel factor of
chondrogenesis. PLoS One., 9(12).
Ornitz, D. M., & Marie, P. J. (2002). FGF signaling pathways in endochondral and
intramembranous bone development and human genetic disease. Genes Dev,
16(12), 1446-1465. doi: 10.1101/gad.990702
193
Ousheng, L., Yaozhong, D., Junji, X., Gang, D., Zhangui, T., Dayong, L., . . . Wanjun,
C. (2013). Periodontal Ligament Stem Cells Regulate B Lymphocyte
FunctionvVia Programmed Cell Death Protein 1 STEM CELLS 31, 1371–1382
Pareek, T. K., Lam, E., Zheng, X. J., Askew, D., Kulkarni, A. B., Chance, M. R., . . .
Letterio, J. J. (2010). Cyclin-dependent kinase 5 activity is required for T cell
activation and induction of experimental autoimmune encephalomyelitis.
Journal of Experimental Medicine, 207(11), 2507-2519. doi:
10.1084/jem.20100876
Park, T., Yi, S. G., Kang, S. H., Lee, S., Lee, Y. S., & Simon, R. (2003). Evaluation of
normalization methods for microarray data. BMC Bioinformatics, 4, 33. doi:
10.1186/1471-2105-4-33
Paul, W. E. (2015). History of interleukin-4. Cytokine, 75(1), 3-7. doi:
10.1016/j.cyto.2015.01.038
Peng, H., Wright, V., Usas, A., Gearhart, B., Shen, H. C., Cummins, J., & Huard, J.
(2002). Synergistic enhancement of bone formation and healing by stem cell-
expressed VEGF and bone morphogenetic protein-4. J Clin Invest, 110(6), 751-
759. doi: 10.1172/JCI15153
Phinney, D. G., Di Giuseppe, M., Njah, J., Sala, E., Shiva, S., St Croix, C. M., . . .
Leikauf, G. D. (2015). Mesenchymal stem cells use extracellular vesicles to
outsource mitophagy and shuttle microRNAs. Nat. Commun, 6(8472).
Pitaru, S., Kotev-Emeth, S., Noff, D., Kaffuler, S., & Savion, N. (1993). Effect of basic
fibroblast growth factor on the growth and differentiation of adult stromal bone
marrow cells: enhanced development of mineralized bone-like tissue in culture.
J Bone Miner Res, 8(8), 919-929. doi: 10.1002/jbmr.5650080804
Pittenger, M. F., Mackay, A. M., Beck, S. C., Jaiswal, R. K., Douglas, R., Mosca, J. D.,
. . . Marshak, D. R. (1999). Multilineage potential of adult human mesenchymal
stem cells. Science, 284(5411), 143-147.
Pountos, I., Giannoudis, P. V., Jones, E., English, A., Churchman, S., Field, S., . . .
McGonagle, D. (2011). NSAIDS inhibit in vitro MSC chondrogenesis but not
osteogenesis: implications for mechanism of bone formation inhibition in man. J
Cell Mol Med. , 15(3), 525-534.
Prasanna, S. J., Gopalakrishnan, D., Shankar, S. R., & Vasandan, A. B. (2010). Pro-
inflammatory cytokines, IFNgamma and TNFalpha, influence immune
properties of human bone marrow and Wharton jelly mesenchymal stem cells
differentially. PLoS One, 5(2), e9016. doi: 10.1371/journal.pone.0009016
Prockop, D. J., Sekiya, I., & Colter, D. C. (2001). Isolation and characterization of
rapidly self-renewing stem cells from cultures of human marrow stromal cells.
Cytotherapy, 3(5), 393-396. doi: 10.1080/146532401753277229
194
Przybylski, M. (2009). A review of the current research on the role of bFGF and VEGF
in angiogenesis. J Wound Care, 18(12), 516-519. doi:
10.12968/jowc.2009.18.12.45609
Qi, H., Aguiar, D. J., Williams, S. M., La Pean, A., Pan, W. & Verfaillie, C. M. (2003).
Identification of genes responsible for osteoblast differentiation from human
mesodermal progenitor cells. Proc Natl Acad Sci U S A, 100(6), 3305-3310. doi:
10.1073/pnas.0532693100
Raisz, L. G. (1995). Physiologic and pathologic roles of prostaglandins and other
eicosanoids in bone metabolism. J Nutr, 125(7 Suppl), 2024S-2027S.
Rauschenberger, C. R., Bailey, J. C., & Cootauco, C. J. (1997). Detection of human IL-
2 in normal and inflamed dental pulps. J Endod, 23(6), 366-370. doi:
10.1016/S0099-2399(97)80184-7
Raychaudhuri, S., Stuart, J. M., & Altman, R. B. (2000). Principal components analysis
to summarize microarray experiments: application to sporulation time series.
Pac Symp Biocomput, 455-466.
Redpath, S. A., Heieis, G., & Perona-Wright, G. (2015). Spatial regulation of IL-4
signalling in vivo. Cytokine, 75(1), 51-56. doi: 10.1016/j.cyto.2015.02.026
Reichardt, L. F. (2006). Neurotrophin-regulated signalling pathways. Philos Trans R
Soc Lond B Biol Sci, 361(1473), 1545-1564. doi: 10.1098/rstb.2006.1894
Rodrigues, M., Griffith, L. G., & Wells, A. (2010). Growth factor regulation of
proliferation and survival of multipotential stromal cells. Stem Cell Res Ther,
1(4), 32. doi: 10.1186/scrt32
Sabat, R., Grutz, G., Warszawska, K., Kirsch, S., Witte, E., Wolk, K., & Geginat, J.
(2010). Biology of interleukin-10. Cytokine & Growth Factor Reviews, 21(5),
331-344. doi: 10.1016/j.cytogfr.2010.09.002
Salasznyk, R. M., Klees, R. F., Boskey, A., & Plopper, G. E. (2007). Activation of FAK
is necessary for the osteogenic differentiation of human mesenchymal stem cells
on laminin-5. Cell Biochem Funct, 100, 499–514.
Salasznyk, R. M., Williams, W. A., Boskey, A., Batorsky, A., & Plopper, G. E. (2004).
Adhesion to Vitronectin and Collagen I Promotes Osteogenic Differentiation of
Human Mesenchymal Stem Cells. J Biomed Biotechnol, 2004(1), 24-34.
Satomi-Kobayashi, S., Kinugasa, M., Kobayashi, R., Hatakeyama, K., Kurogane, Y.,
Ishida, T., . . . Rikitake, Y. (2012). Osteoblast-like differentiation of cultured
human coronary artery smooth muscle cells by bone morphogenetic protein
endothelial cell precursor-derived regulator (BMPER). J Biol Chem, 287(36),
30336-30345.
Scanlon, C., Marchesan, J., Soehren, S., Matsuo, M., & Kapila, Y. (2011). Capturing
the regenerative potential of periodontal ligament fibroblasts. J Stem Cells
Regen Med, 7(1), 54-56.
195
Schmidt, M. V., Schülke, J. P., Liebl, C., Stiess, M., Avrabos, C., Bock, J., . . . T., R.
(2011). Tumor suppressor down-regulated in renal cell carcinoma 1 (DRR1) is a
stress-induced actin bundling factor that modulates synaptic efficacy and
cognition. Proc Natl Acad Sci U S A, 108(41), 17213-17218.
Schwab, E. H., Halbig, M., Glenske, K., Wagner, A. S., Wenisch, S., & Cavalcanti-
Adam, E. A. (2013). Distinct effects of RGD-glycoproteins on Integrin-mediated
adhesion and osteogenic differentiation of human mesenchymal stem cells. Int J
Med Sci, 10(13), 1846-1859. doi: 10.7150/ijms.6908
Seo, B. M., Miura, M., Gronthos, S., Bartold, P. M., Batouli, S., Brahim, J., . . . Shi, S.
(2004). Investigation of multipotent postnatal stem cells from human periodontal
ligament. Lancet, 364(9429), 149-155. doi: 10.1016/S0140-6736(04)16627-0
Shah, S. M., Saini, N., Ashraf, S., Kaur, R., & Chauhan, M. S. (2014). Stem Cell and
Cloning Research in Farm Animals- A Special Focus on Buffalo. MGM J Med
Sc, 1(4), 163-173.
Shams ara, A., Sheibani, V., Esmaeilpour, K., Eslaminejad, T., & Nematollahi-Mahani,
S. N. (2015). Coadministration of the Human Umbilical Cord Matrix-Derived
Mesenchymal Cells and Aspirin Alters Postischemic Brain Injury in Rats. J
Stroke Cerebrovasc Dis, 24(9), 2005-2016. doi:
10.1016/j.jstrokecerebrovasdis.2015.04.049
Shibing Yu, L. M. Y.-A., Yanxia Chu, Joseph M. Zmuda and Yingze Zhanga. (2013).
E2F1 effects on osteoblast differentiation and mineralization are mediated
through up-regulation of frizzled-1. Bone, 56(2), 234-241.
Shimizu, H., Nakagami, H., Osako, M. K., Hanayama, R., Kunugiza, Y., Kizawa, T., . .
. Morishita, R. (2008). Angiotensin II accelerates osteoporosis by activating
osteoclasts. FASEB J, 22(7), 2465-2475. doi: 10.1096/fj.07-098954
Silvério, K. G., Rodrigues, T. L., & Coletta, R. D. e. a. ( 2010). Mesenchymal stem cell
properties of periodontal ligament cells from deciduous and permanent teeth. J
Periodontol, 81(8): 1207–1215.
Smith, W. L., DeWitt, D. L., & Garavito, R. M. (2000). Cyclooxygenases: structural,
cellular, and molecular biology. Annu Rev Biochem, 69, 145-182. doi:
10.1146/annurev.biochem.69.1.145
Sonoyama, W., Liu, Y., Fang, D., Yamaza, T., Seo, B. M., Zhang, C., . . . Shi, S.
(2006). Mesenchymal stem cell-mediated functional tooth regeneration in swine.
PLoS One, 1, e79. doi: 10.1371/journal.pone.0000079
Sonoyama, W., Liu, Y., Yamaza, T., Tuan, R. S., Wang, S., Shi, S., & Huang, G. T.
(2008). Characterization of the apical papilla and its residing stem cells from
human immature permanent teeth: a pilot study. J Endod, 34(2), 166-171. doi:
10.1016/j.joen.2007.11.021
Spees, J. L., Olson, S. D., Ylostalo, J., Lynch, P. J., Smith, J., Perry, A., . . . Prockop, D.
J. (2003). Differentiation, cell fusion, and nuclear fusion during ex vivo repair of
196
epithelium by human adult stem cells from bone marrow stroma. Proc Natl Acad
Sci U S A, 100(5), 2397-2402. doi: 10.1073/pnas.0437997100
Surarit, R., Krishnamra, N., & Seriwatanachai, D. (2016). Prolactin receptor and
osteogenic induction of prolactin in human periodontal ligament fibroblasts. Cell
Biol Int, 40(4), 419-427. doi: 10.1002/cbin.10580
Sutcliffe, P., Connock, M., Gurung, T., Freeman, K., Johnson, S., Ngianga-Bakwin, K.,
. . . Clarke, A. (2013). Aspirin in primary prevention of cardiovascular disease
and cancer: a systematic review of the balance of evidence from reviews of
randomized trials. PLoS One, 8(12), e81970. doi: 10.1371/journal.pone.0081970
Tai, Y. T., Chang, B. Y., Kong, S. Y., Fulciniti, M., Yang, G., Y., C., . . . al., e. (2012 ).
Bruton tyrosine kinase inhibition is a novel therapeutic strategy targeting tumor
in the bone marrow microenvironment in multiple myeloma. Blood, 120(9),
1877-1887.
Takeda, K., Ichijo, H., Fujii, M., Mochida, Y., Saitoh, M., Nishitoh, H., . . . Miyazono,
K. (1998). Identification of a novel bone morphogenetic protein-responsive gene
that may function as a noncoding RNA. J. Biol. Chem, 273, 17079-17085.
Tamama, K., Fan, V. H., Griffith, L. G., Blair, H. C., & Wells, A. (2006,). Epidermal
growth factor as a candidate for ex vivo expansion of bone marrow-derived
mesenchymal stem cells. Stem Cells Dev, 24:, 686-695.
Tang, R. L., Wei, F. L., Wei, L. M., Wang, S. L., & Ding, G. (2014). Osteogenic
differentiated periodontal ligament stem cells maintain their immunomodulatory
capacity. Journal of Tissue Engineering and Regenerative Medicine, 8(3), 226-
232. doi: 10.1002/term.1516
Tazoe, M., Mogi, M., Goto, S., & Togari, A. (2003). Involvement of p38MAP kinase in
bone morphogenetic protein-4-induced osteoprotegerin in mouse bone-marrow-
derived stromal cells. Arch Oral Biol, 48(8), 615-619.
Teitelbaum, S. L. (2000). Bone resorption by osteoclasts. Science, 289(5484), 1504-
1508.
Thomson, J. A., Itskovitz-Eldor, J., Shapiro, S. S., Waknitz, M. A., Swiergiel, J. J.,
Marshall, V. S., & Jones, J. M. (1998). Embryonic stem cell lines derived from
human blastocysts. Science, 282(5391), 1145-1147.
Tokuda, H., Kozawa, O., & Uematsu, T. (2000). Basic fibroblast growth factor
stimulates vascular endothelial growth factor release in osteoblasts: divergent
regulation by p42/p44 mitogen-activated protein kinase and p38 mitogen-
activated protein kinase. J Bone Miner Res, 15(12), 2371-2379. doi:
10.1359/jbmr.2000.15.12.2371
Tokunaga A, O. T., Ishii Y, Motomura H, Nakamura C, Ishizawa S, Fujimori T,
Nabeshima Y, Umezawa A, Kanamori M, Kimura T, Sasahara M. (2008). PDGF
receptor beta is a potent regulator of mesenchymal stromal cell function. J Bone
Miner Res 23, 1519-1528.
197
Tomokiyo, A., Maeda, H., Fujii, S., Wada, N., Shima, K., & Akamine, A. (2008).
Development of a multipotent clonal human periodontal ligament cell line. .
Differentiation. , 76(4), 337-347.
Trubiani, O., Orsini, G., Zini, N., Di Iorio, D., Piccirilli, M., Piattelli, A., Caputi, S.
Regenerative potential of human periodontal ligament derived stem cells on three
dimensional biomaterials: a morphological report. J Biomed Mater Res A. 2008
Dec 15; 87(4):986-93.
Tsutsumi, S., Shimazu, A., Miyazaki, K., Pan, H., Koike, C., Yoshida, E., . . . Kato, Y.
(2001). Retention of multilineage differentiation potential of mesenchymal cells
during proliferation in response to FGF. Biochem Biophys Res Commun, 288(2),
413-419. doi: 10.1006/bbrc.2001.5777
Turini, M. E., & DuBois, R. N. (2002). Cyclooxygenase-2: a therapeutic target. Annu
Rev Med, 53, 35-57. doi: 10.1146/annurev.med.53.082901.103952
Ullah, I., Subbarao, R. B., & Rho, G. J. (2015). Human mesenchymal stem cells -
current trends and future prospective. Biosci Rep, 35(2). doi:
10.1042/BSR20150025
Utreras, E., Prochazkova, M., Terse, A., Gross, J., Keller, J., J Iadarola, M. J., & A.B.,
K. ( 2013). TGF-β1 sensitizes TRPV1 through Cdk5 signaling in odontoblast-
like cells. Mol Pain., 9(24).
Vaquerizas, J. M., Kummerfeld, S. K., Teichmann, S. A., & Luscombe, N. M. (2009). A
census of human transcription factors: function, expression and evolution. Nat
Rev Genet, 10(4), 252-263. doi: 10.1038/nrg2538
Varghese, S., Rydziel, S., & Canalis, E. (2000). Basic fibroblast growth factor
stimulates collagenase-3 promoter activity in osteoblasts through an activator
protein-1-binding site. Endocrinology, 141(6), 2185-2191.
Vassalli, A., Matzuk, M. M., Gardner, H. A., Lee, K. F., & Jaenisch, R. (1994).
Activin/inhibin beta B subunit gene disruption leads to defects in eyelid
development and female reproduction. Genes Dev, 8(4), 414-427.
Wallner, S., Peters, S., Pitzer, C., Resch, H., Bogdahn, U., & Schneider, A. (2015). The
Granulocyte-colony stimulating factor has a dual role in neuronal and vascular
plasticity. Frontiers in cell and developmental biology, 3(48).
Wang, Yu, M., & al., Y. X. e. (2011). Gingiva derived mesenchymal stem cell-mediated
therapeutic approach for bone tissue regeneration. Stem Cells Dev, 20, 2093-
2102.
Wang, Y., Chen, X., Zhu, W., Zhang, H., Hu, S., & Cong, X. (2006). Growth inhibition
of mesenchymal stem cells by aspirin: involvement of the WNT/beta-catenin
signal pathway. Clin Exp Pharmacol Physiol, 33(8), 696-701. doi:
10.1111/j.1440-1681.2006.04432.x
198
Watt, S., Gschmeissner, S., & Bates, P. (1995). PECAM-1: its expression and function
as a cell adhesion molecule on hemopoietic and endothelial cells. Leuk.
Lymphoma 17, 229-235.
Wei, X., Yang, X., Han, Z., Qu, F., Shao, L., & Shi, Y. (2013). Mesechymal stem cells:
a new trend for cell theraphy. Acta Pharmacologica Sinica, 34, 747-754.
Woodbury, D., Schwarz, E. J., Prockop, D. J., & Black, I. B. (2000). Adult rat and
human bone marrow stromal cells differentiate into neurons. . Neurosci Res,
4(61), 364-370.
Xing, L., & Boyce, B. F. (2005). Regulation of apoptosis in osteoclasts and osteoblastic
cells. Biochem Biophys Res Commun, 328(3), 709-720. doi:
10.1016/j.bbrc.2004.11.072
Xu, J., Wang, W., Kapila, Y., Lotz, J., & Kapila, S. (2009). Multiple differentiation
capacity of STRO-1+/CD146+ PDL mesenchymal progenitor cells. Stem Cells
Dev, 18(3), 487-496. doi: 10.1089/scd.2008.0113
Yanagita, M., Kojima, Y., Kubota, M., Mori, K., Yamashita, M., Yamada, S., . . .
Murakami, S. (2014). Cooperative effects of FGF-2 and VEGF-A in periodontal
ligament cells. J Dent Res, 93(1), 89-95. doi: 10.1177/0022034513511640
Yang, Gao, L. N., An, Y., Hu, C. H., Jin, F., Zhou, J., . . . Chen, F. M. (2013).
Comparison of mesenchymal stem cells derived from gingival tissue and
periodontal ligament in different incubation conditions. Biomaterials, 34(29),
7033-7047. doi: 10.1016/j.biomaterials.2013.05.025
Yang, J., Shi, P., Tu, M., Wang, Y., Liu, M., Fan, F., & Du, M. (2014). Bone
morphogenic proteins: Relationship between molecular structure and their
osteogenic activity. Food Science and Human Wellness, 3, 127-135.
Yazid, F. B., Gnanasegaran, N., Kunasekaran, W., Govindasamy, V., & Musa, S.
(2014). Comparison of immunodulatory properties of dental pulp stem cells
derived from healthy and inflamed teeth. Clin Oral Investig, 18(9), 2103-2112.
doi: 10.1007/s00784-014-1207-4
Yin, M. J., Yamamoto, Y., & Gaynor, R. B. (1998). The anti-inflammatory agents
aspirin and salicylate inhibit the activity of I(kappa)B kinase-beta. Nature,
396(6706), 77-80. doi: 10.1038/23948
Yongkuan Zhang, H. S., Zhu Lin, Zuolin Jin, Yingchun Bi, Xueying Han. (2006).
Microarray analysis of osteogenesis gene of human dental follicle cells
stimulated with dexamethasone in vitro. Int Chin J Dent 6, 115-122.
Yoon, D. S., Yoo, J. H., Kim, Y. H., Paik, S., C.D., H., & Lee, J. (2010). The Effects of
COX-2 Inhibitor During OsteogenicDifferentiation of Bone Marrow-Derived
Human Mesenchymal Stem Cells. stem cells 19(10).
Yu, J., Wang, Y., Deng, Z., Tang, L., Li, Y., Shi, J., & Jin, Y. (2007). Odontogenic
capability: bone marrow stromal stem cells versus dental pulp stem cells. Biol
Cell, 99(8), 465-474. doi: 10.1042/BC20070013
199
Yun, Y. R., Won, J. E., Jeon, E., Lee, S., Kang, W., Jo, H., . . . Kim, H. W. (2010).
Fibroblast growth factors: biology, function, and application for tissue
regeneration. J Tissue Eng, 2010, 218142. doi: 10.4061/2010/218142
Zhang, Lu, Y., Zhang, L., Liu, Y., Zhou, Y., Chen, Y., & Yu, H. (2015). Influence of
different intensities of vibration on proliferation and differentiation of human
periodontal ligament stem cells. Arch Med Sci, 11(3), 638-646. doi:
10.5114/aoms.2015.52370
Zhang, Schwarz, E. M., Young, D. A., Puzas, J. E., Rosier, R. N., & O'Keefe, R. J.
(2002). Cyclooxygenase-2 regulates mesenchymal cell differentiation into the
osteoblast lineage and is critically involved in bone repair. J. Clin. Invest.,
109(11), 1405-1415.
Zhang, Shi, S., Liu, Y., Uyanne, J., Shi, Y., Shi, S., & Le, A. D. (2009). Mesenchymal
stem cells derived from human gingiva are capable of immunomodulatory
functions and ameliorate inflammation-related tissue destruction in experimental
colitis. J Immunol 183, 7787.
Zhang, Q., Chen, B., Yan, F., Guo, J., Zhu, X., Ma, S., & Yang, W. (2014). Interleukin-
10 inhibits bone resorption: a potential therapeutic strategy in periodontitis and
other bone loss diseases. Biomed Res Int, 2014, 284836. doi:
10.1155/2014/284836
Zhang, Q., Shi, S., Liu, Y., Uyanne, J., Shi, Y., Shi, S., and Le, A.D. (2009).
Mesenchymal stem cells derived from human gingiva are capable of
immunomodulatory functions and ameliorate inflammation-related tissue
destruction in experimental colitis. J Immunol, 183, 7787.
Zhu, W., & Liang, M. (2015). Periodontal ligament stem cells: current status, concerns,
and future prospects. Stem Cells Int, 2015, 972313. doi: 10.1155/2015/972313
Zuk, P. A., Zhu, M., Ashjian, P., De Ugarte, D. A., Huang, J. I., Mizuno, H., . . .
Hedrick, M. H. (2002). Human adipose tissue is a source of multipotent stem
cells. Molecular Biology of the Cell, 13(12), 4279-4295. doi: 10.1091/mbc.E02-
02-0105
Zupan, J., Jeras, M., & Marc, J. (2013). Osteoimmunology and the influence of pro-
inflammatory cytokines on osteoclasts. Biochem Med (Zagreb), 23(1), 43-63.
200
LIST OF PUBLICATIONS AND PAPER PRESENTED
1. Mariam A., Abd. Rahman, F. Gnanasegaran, Abu Kasim, N.H., and Musa, S.
Diverse Effects of Lead Nitrate on the Proliferation, Differentiation, and Gene
Expression of Stem Cells Isolated from a Dental Origin. The Scientific World
Journal Volume 2014 (2014), Article ID 235941
2. Abd Rahman F, Mohd Ali J, Abdullah M, Abu Kasim NH, Musa S Aspirin
Enhances Osteogenic Potential of Periodontal Ligament Stem Cells (PDLSCs)
and Modulates the Expression Profile of Growth Factor-Associated Genes in
PDLSCs. J Periodontol. 2016 Jul;87(7):837-47. doi: 10.1902/jop.2016.150610.
3. Abd. Rahman, F., Vincent-Chong, V.K., Ali, J.M. Rahman, M.T., Abdullah, M.
Effect of aspirin on osteogenic potential of periodontal ligament stem cells
(PDLSCs), Global Control in Stem Cells by International Society for Stem Cell
Research/ Stem cell Society Singapore ISSCR/ISCSS), 5-7 November 2014.
4. Abd. Rahman, F., Cheek, N.K., Govindasamy, V., Ali, J.M., Rahman, M.T.,
Abdullah, M. Effects of Non-steroidal drugs (NSAIDs) alleviates basal
expression of growth factor-associated genes in periodontal ligament stem cells
(PDLSCs). Stem cell annual meeting by ISSCR Annual Meeting, 24-27th
June
2015, Stockholm, Sweeden.
Paper on writing
1. Microarray gene expression profiles on effect of aspirin on osteoblast potential of
periodontal ligament stem cells (PDLSCs).
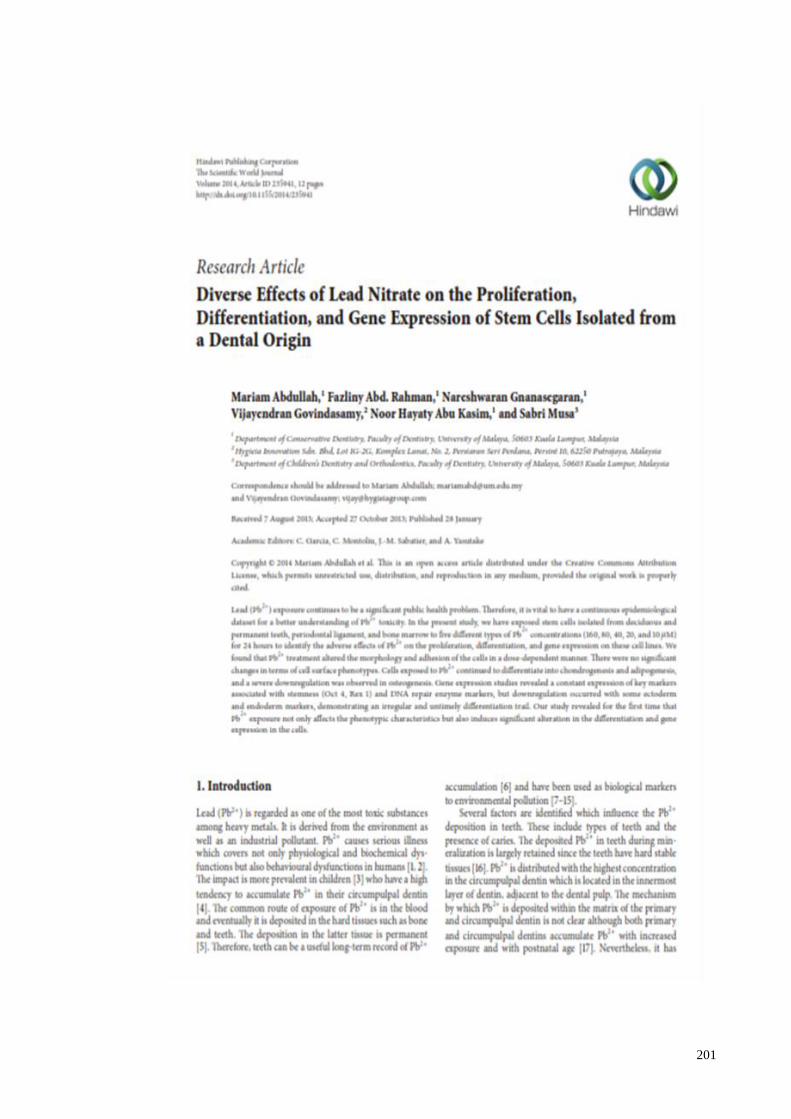
201
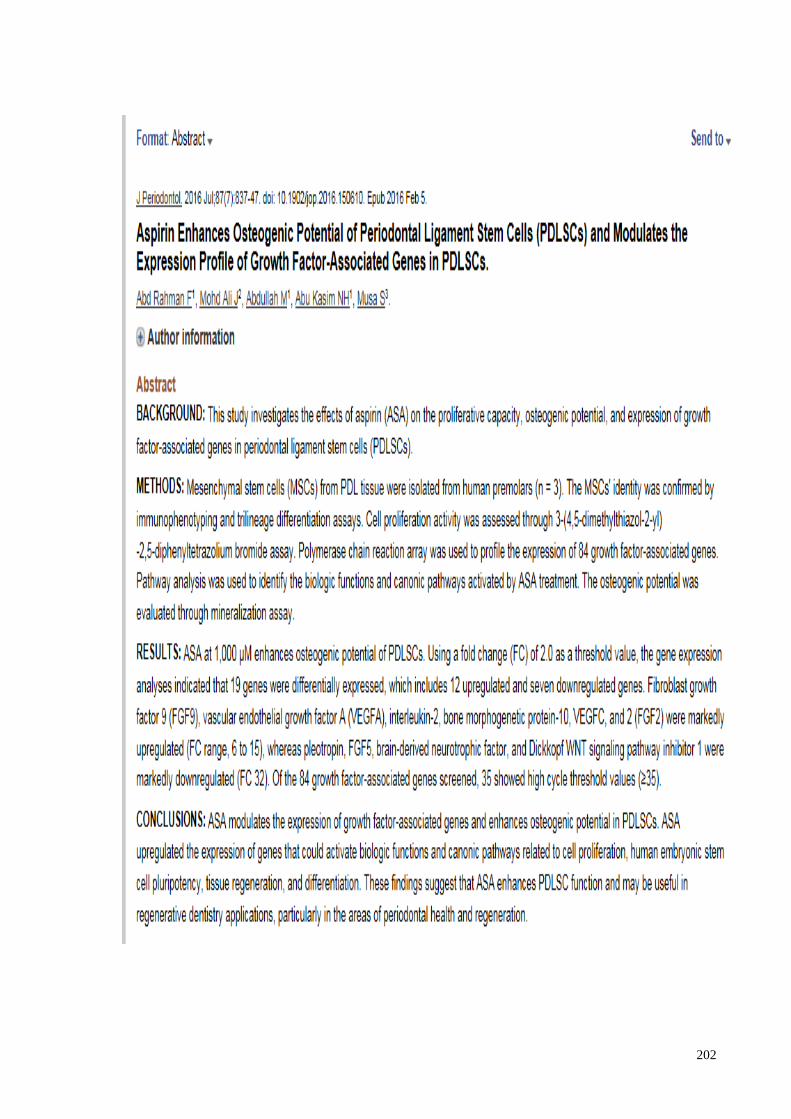
202
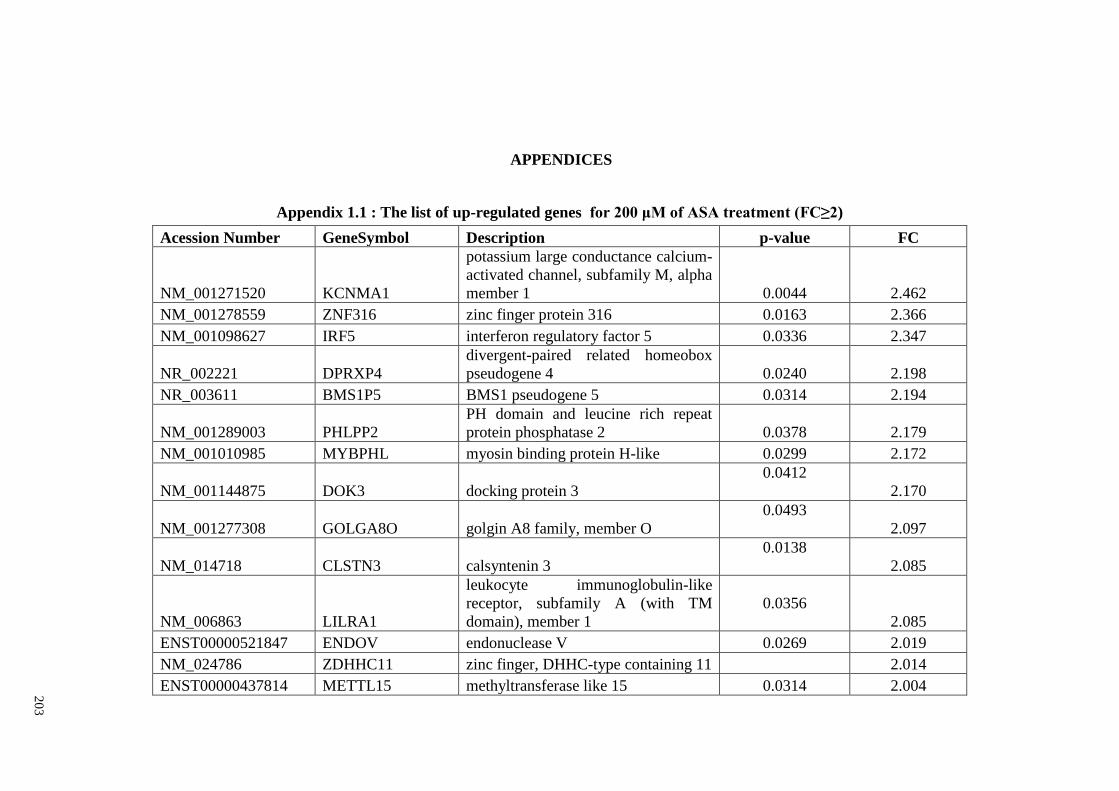
20
3
APPENDICES
Appendix 1.1 : The list of up-regulated genes for 200 μM of ASA treatment (FC≥2)
Acession Number GeneSymbol Description p-value FC
NM_001271520 KCNMA1
potassium large conductance calcium-
activated channel, subfamily M, alpha
member 1 0.0044 2.462
NM_001278559 ZNF316 zinc finger protein 316 0.0163 2.366
NM_001098627 IRF5 interferon regulatory factor 5 0.0336 2.347
NR_002221 DPRXP4
divergent-paired related homeobox
pseudogene 4 0.0240 2.198
NR_003611 BMS1P5 BMS1 pseudogene 5 0.0314 2.194
NM_001289003 PHLPP2
PH domain and leucine rich repeat
protein phosphatase 2 0.0378 2.179
NM_001010985 MYBPHL myosin binding protein H-like 0.0299 2.172
NM_001144875 DOK3 docking protein 3
0.0412
2.170
NM_001277308 GOLGA8O golgin A8 family, member O
0.0493
2.097
NM_014718 CLSTN3 calsyntenin 3
0.0138
2.085
NM_006863 LILRA1
leukocyte immunoglobulin-like
receptor, subfamily A (with TM
domain), member 1
0.0356
2.085
ENST00000521847 ENDOV endonuclease V 0.0269 2.019
NM_024786 ZDHHC11 zinc finger, DHHC-type containing 11
2.014
ENST00000437814 METTL15 methyltransferase like 15 0.0314 2.004
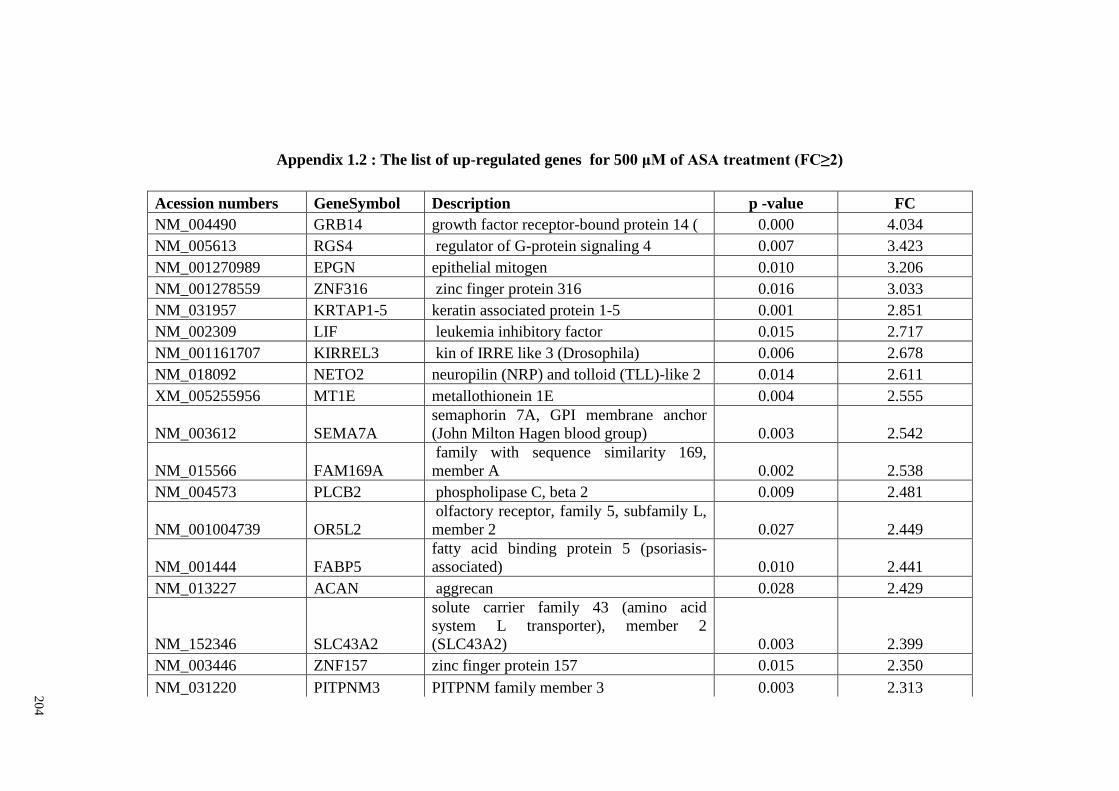
20
4
Appendix 1.2 : The list of up-regulated genes for 500 μM of ASA treatment (FC≥2)
Acession numbers GeneSymbol Description p -value FC
NM_004490 GRB14 growth factor receptor-bound protein 14 ( 0.000 4.034
NM_005613 RGS4 regulator of G-protein signaling 4 0.007 3.423
NM_001270989 EPGN epithelial mitogen 0.010 3.206
NM_001278559 ZNF316 zinc finger protein 316 0.016 3.033
NM_031957 KRTAP1-5 keratin associated protein 1-5 0.001 2.851
NM_002309 LIF leukemia inhibitory factor 0.015 2.717
NM_001161707 KIRREL3 kin of IRRE like 3 (Drosophila) 0.006 2.678
NM_018092 NETO2 neuropilin (NRP) and tolloid (TLL)-like 2 0.014 2.611
XM_005255956 MT1E metallothionein 1E 0.004 2.555
NM_003612 SEMA7A
semaphorin 7A, GPI membrane anchor
(John Milton Hagen blood group) 0.003 2.542
NM_015566 FAM169A
family with sequence similarity 169,
member A 0.002 2.538
NM_004573 PLCB2 phospholipase C, beta 2 0.009 2.481
NM_001004739 OR5L2
olfactory receptor, family 5, subfamily L,
member 2 0.027 2.449
NM_001444 FABP5
fatty acid binding protein 5 (psoriasis-
associated) 0.010 2.441
NM_013227 ACAN aggrecan 0.028 2.429
NM_152346 SLC43A2
solute carrier family 43 (amino acid
system L transporter), member 2
(SLC43A2) 0.003 2.399
NM_003446 ZNF157 zinc finger protein 157 0.015 2.350
NM_031220 PITPNM3 PITPNM family member 3 0.003 2.313
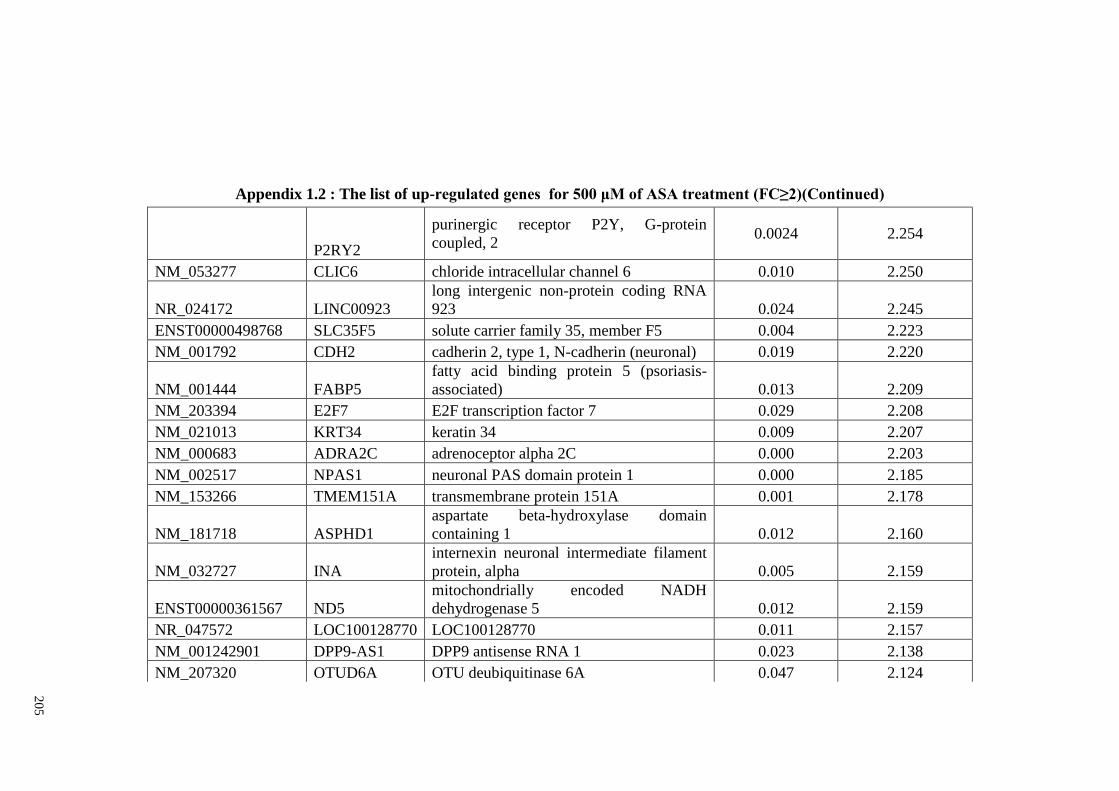
20
5
Appendix 1.2 : The list of up-regulated genes for 500 μM of ASA treatment (FC≥2)(Continued)
P2RY2
purinergic receptor P2Y, G-protein
coupled, 2 0.0024 2.254
NM_053277 CLIC6 chloride intracellular channel 6 0.010 2.250
NR_024172 LINC00923
long intergenic non-protein coding RNA
923 0.024 2.245
ENST00000498768 SLC35F5 solute carrier family 35, member F5 0.004 2.223
NM_001792 CDH2 cadherin 2, type 1, N-cadherin (neuronal) 0.019 2.220
NM_001444 FABP5
fatty acid binding protein 5 (psoriasis-
associated) 0.013 2.209
NM_203394 E2F7 E2F transcription factor 7 0.029 2.208
NM_021013 KRT34 keratin 34 0.009 2.207
NM_000683 ADRA2C adrenoceptor alpha 2C 0.000 2.203
NM_002517 NPAS1 neuronal PAS domain protein 1 0.000 2.185
NM_153266 TMEM151A transmembrane protein 151A 0.001 2.178
NM_181718 ASPHD1
aspartate beta-hydroxylase domain
containing 1 0.012 2.160
NM_032727 INA
internexin neuronal intermediate filament
protein, alpha 0.005 2.159
ENST00000361567 ND5
mitochondrially encoded NADH
dehydrogenase 5 0.012 2.159
NR_047572 LOC100128770 LOC100128770 0.011 2.157
NM_001242901 DPP9-AS1 DPP9 antisense RNA 1 0.023 2.138
NM_207320 OTUD6A OTU deubiquitinase 6A 0.047 2.124
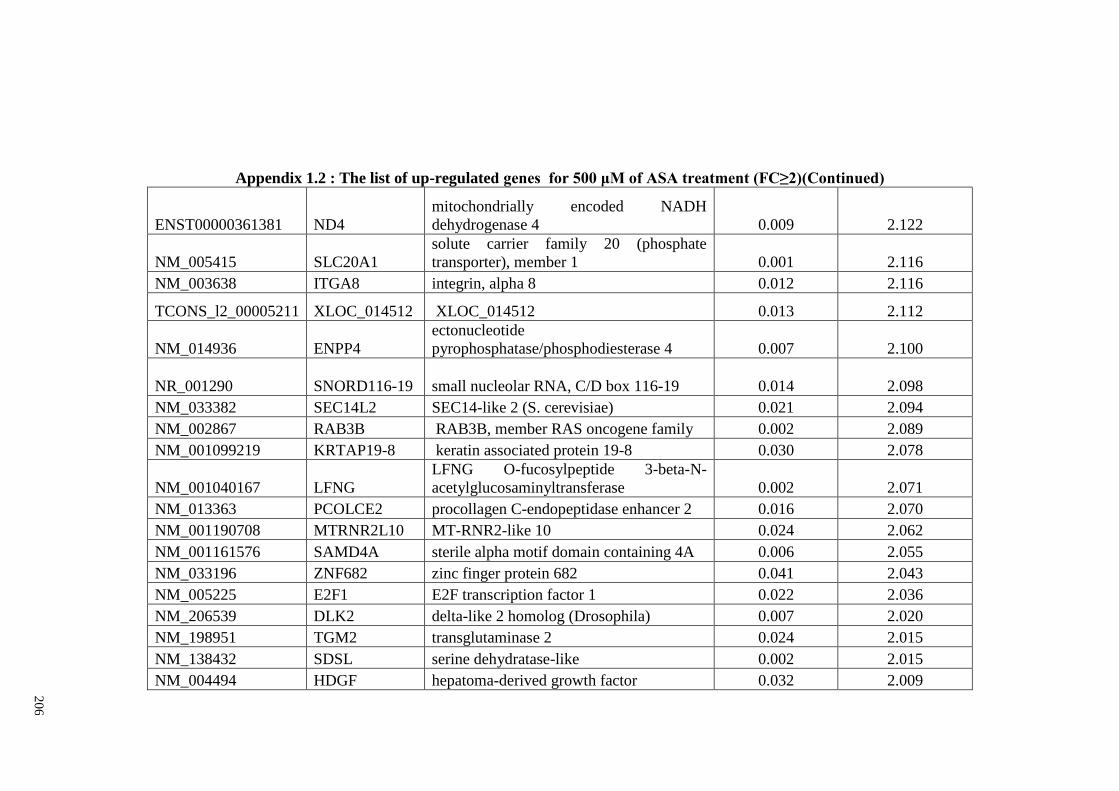
20
6
Appendix 1.2 : The list of up-regulated genes for 500 μM of ASA treatment (FC≥2)(Continued)
ENST00000361381 ND4
mitochondrially encoded NADH
dehydrogenase 4 0.009 2.122
NM_005415 SLC20A1
solute carrier family 20 (phosphate
transporter), member 1 0.001 2.116
NM_003638 ITGA8 integrin, alpha 8 0.012 2.116
TCONS_l2_00005211 XLOC_014512 XLOC_014512 0.013 2.112
NM_014936 ENPP4
ectonucleotide
pyrophosphatase/phosphodiesterase 4 0.007 2.100
NR_001290 SNORD116-19 small nucleolar RNA, C/D box 116-19 0.014 2.098
NM_033382 SEC14L2 SEC14-like 2 (S. cerevisiae) 0.021 2.094
NM_002867 RAB3B RAB3B, member RAS oncogene family 0.002 2.089
NM_001099219 KRTAP19-8 keratin associated protein 19-8 0.030 2.078
NM_001040167 LFNG
LFNG O-fucosylpeptide 3-beta-N-
acetylglucosaminyltransferase 0.002 2.071
NM_013363 PCOLCE2 procollagen C-endopeptidase enhancer 2 0.016 2.070
NM_001190708 MTRNR2L10 MT-RNR2-like 10 0.024 2.062
NM_001161576 SAMD4A sterile alpha motif domain containing 4A 0.006 2.055
NM_033196 ZNF682 zinc finger protein 682 0.041 2.043
NM_005225 E2F1 E2F transcription factor 1 0.022 2.036
NM_206539 DLK2 delta-like 2 homolog (Drosophila) 0.007 2.020
NM_198951 TGM2 transglutaminase 2 0.024 2.015
NM_138432 SDSL serine dehydratase-like 0.002 2.015
NM_004494 HDGF hepatoma-derived growth factor 0.032 2.009
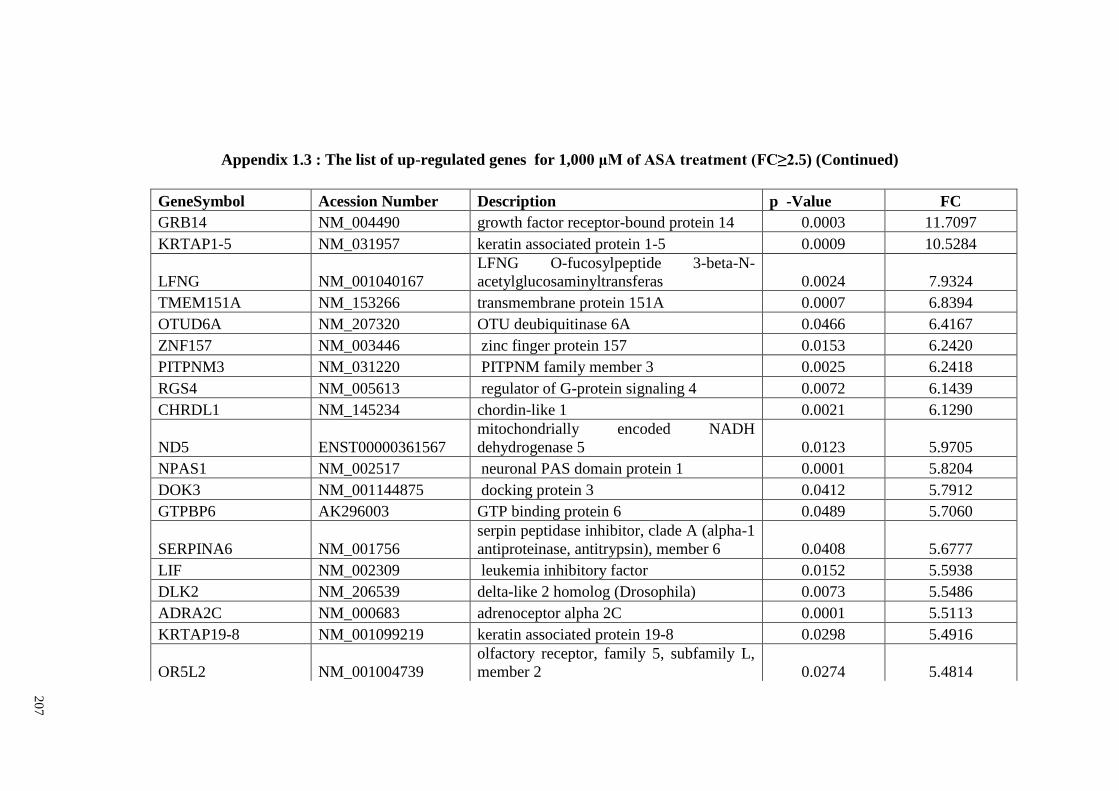
20
7
Appendix 1.3 : The list of up-regulated genes for 1,000 μM of ASA treatment (FC≥2.5) (Continued)
GeneSymbol Acession Number Description p -Value FC
GRB14 NM_004490 growth factor receptor-bound protein 14 0.0003 11.7097
KRTAP1-5 NM_031957 keratin associated protein 1-5 0.0009 10.5284
LFNG NM_001040167
LFNG O-fucosylpeptide 3-beta-N-
acetylglucosaminyltransferas 0.0024 7.9324
TMEM151A NM_153266 transmembrane protein 151A 0.0007 6.8394
OTUD6A NM_207320 OTU deubiquitinase 6A 0.0466 6.4167
ZNF157 NM_003446 zinc finger protein 157 0.0153 6.2420
PITPNM3 NM_031220 PITPNM family member 3 0.0025 6.2418
RGS4 NM_005613 regulator of G-protein signaling 4 0.0072 6.1439
CHRDL1 NM_145234 chordin-like 1 0.0021 6.1290
ND5 ENST00000361567
mitochondrially encoded NADH
dehydrogenase 5 0.0123 5.9705
NPAS1 NM_002517 neuronal PAS domain protein 1 0.0001 5.8204
DOK3 NM_001144875 docking protein 3 0.0412 5.7912
GTPBP6 AK296003 GTP binding protein 6 0.0489 5.7060
SERPINA6 NM_001756
serpin peptidase inhibitor, clade A (alpha-1
antiproteinase, antitrypsin), member 6 0.0408 5.6777
LIF NM_002309 leukemia inhibitory factor 0.0152 5.5938
DLK2 NM_206539 delta-like 2 homolog (Drosophila) 0.0073 5.5486
ADRA2C NM_000683 adrenoceptor alpha 2C 0.0001 5.5113
KRTAP19-8 NM_001099219 keratin associated protein 19-8 0.0298 5.4916
OR5L2 NM_001004739
olfactory receptor, family 5, subfamily L,
member 2 0.0274 5.4814
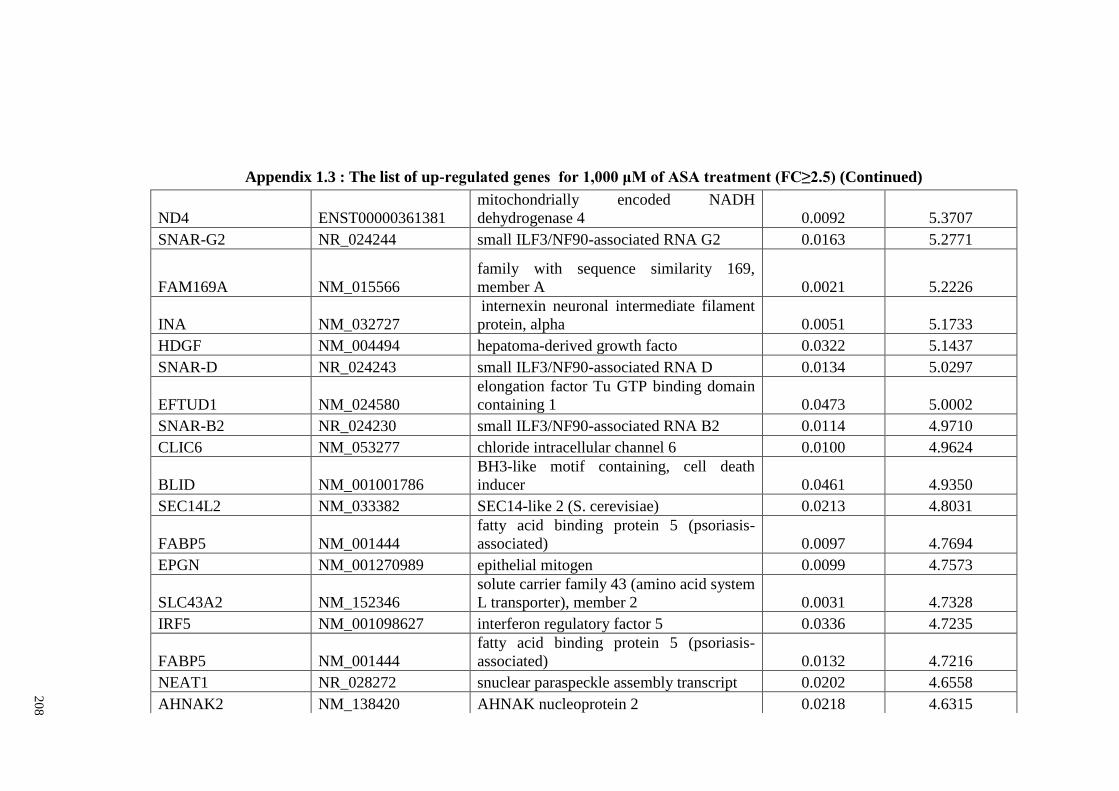
20
8
Appendix 1.3 : The list of up-regulated genes for 1,000 μM of ASA treatment (FC≥2.5) (Continued)
ND4 ENST00000361381
mitochondrially encoded NADH
dehydrogenase 4 0.0092 5.3707
SNAR-G2 NR_024244 small ILF3/NF90-associated RNA G2 0.0163 5.2771
FAM169A NM_015566
family with sequence similarity 169,
member A 0.0021 5.2226
INA NM_032727
internexin neuronal intermediate filament
protein, alpha 0.0051 5.1733
HDGF NM_004494 hepatoma-derived growth facto 0.0322 5.1437
SNAR-D NR_024243 small ILF3/NF90-associated RNA D 0.0134 5.0297
EFTUD1 NM_024580
elongation factor Tu GTP binding domain
containing 1 0.0473 5.0002
SNAR-B2 NR_024230 small ILF3/NF90-associated RNA B2 0.0114 4.9710
CLIC6 NM_053277 chloride intracellular channel 6 0.0100 4.9624
BLID NM_001001786
BH3-like motif containing, cell death
inducer 0.0461 4.9350
SEC14L2 NM_033382 SEC14-like 2 (S. cerevisiae) 0.0213 4.8031
FABP5 NM_001444
fatty acid binding protein 5 (psoriasis-
associated) 0.0097 4.7694
EPGN NM_001270989 epithelial mitogen 0.0099 4.7573
SLC43A2 NM_152346
solute carrier family 43 (amino acid system
L transporter), member 2 0.0031 4.7328
IRF5 NM_001098627 interferon regulatory factor 5 0.0336 4.7235
FABP5 NM_001444
fatty acid binding protein 5 (psoriasis-
associated) 0.0132 4.7216
NEAT1 NR_028272 snuclear paraspeckle assembly transcript 0.0202 4.6558
AHNAK2 NM_138420 AHNAK nucleoprotein 2 0.0218 4.6315
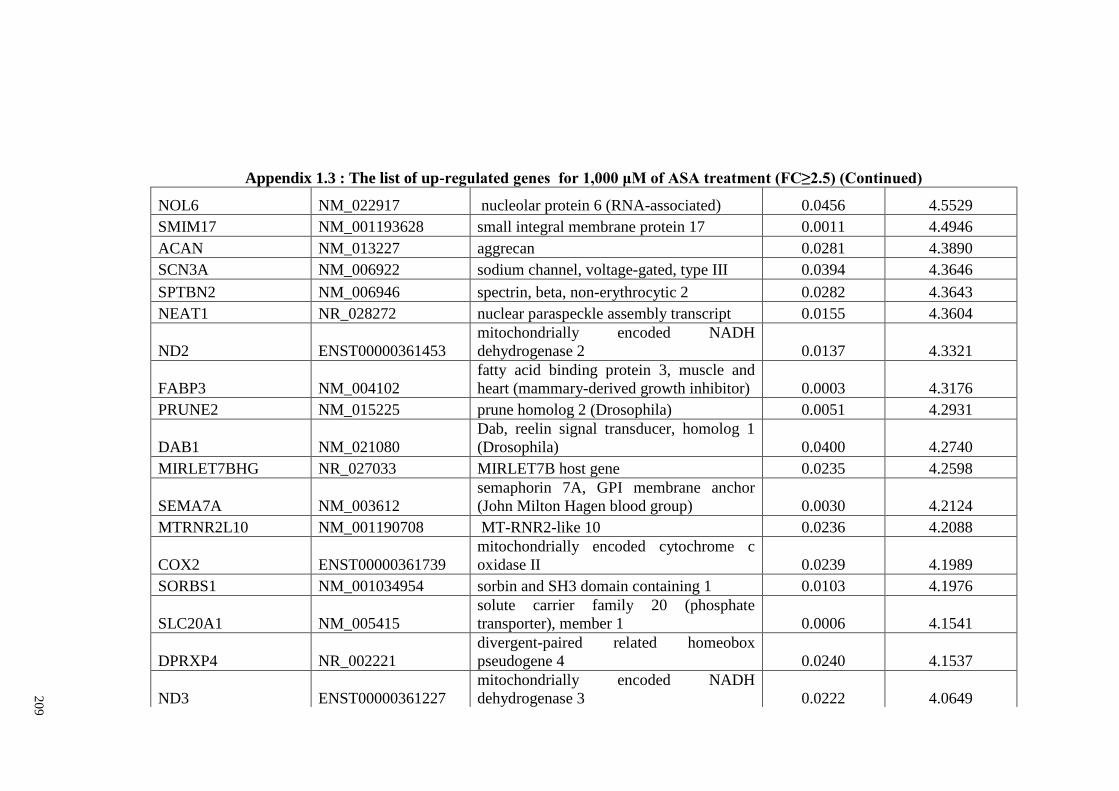
20
9
Appendix 1.3 : The list of up-regulated genes for 1,000 μM of ASA treatment (FC≥2.5) (Continued)
NOL6 NM_022917 nucleolar protein 6 (RNA-associated) 0.0456 4.5529
SMIM17 NM_001193628 small integral membrane protein 17 0.0011 4.4946
ACAN NM_013227 aggrecan 0.0281 4.3890
SCN3A NM_006922 sodium channel, voltage-gated, type III 0.0394 4.3646
SPTBN2 NM_006946 spectrin, beta, non-erythrocytic 2 0.0282 4.3643
NEAT1 NR_028272 nuclear paraspeckle assembly transcript 0.0155 4.3604
ND2 ENST00000361453
mitochondrially encoded NADH
dehydrogenase 2 0.0137 4.3321
FABP3 NM_004102
fatty acid binding protein 3, muscle and
heart (mammary-derived growth inhibitor) 0.0003 4.3176
PRUNE2 NM_015225 prune homolog 2 (Drosophila) 0.0051 4.2931
DAB1 NM_021080
Dab, reelin signal transducer, homolog 1
(Drosophila) 0.0400 4.2740
MIRLET7BHG NR_027033 MIRLET7B host gene 0.0235 4.2598
SEMA7A NM_003612
semaphorin 7A, GPI membrane anchor
(John Milton Hagen blood group) 0.0030 4.2124
MTRNR2L10 NM_001190708 MT-RNR2-like 10 0.0236 4.2088
COX2 ENST00000361739
mitochondrially encoded cytochrome c
oxidase II 0.0239 4.1989
SORBS1 NM_001034954 sorbin and SH3 domain containing 1 0.0103 4.1976
SLC20A1 NM_005415
solute carrier family 20 (phosphate
transporter), member 1 0.0006 4.1541
DPRXP4 NR_002221
divergent-paired related homeobox
pseudogene 4 0.0240 4.1537
ND3 ENST00000361227
mitochondrially encoded NADH
dehydrogenase 3 0.0222 4.0649
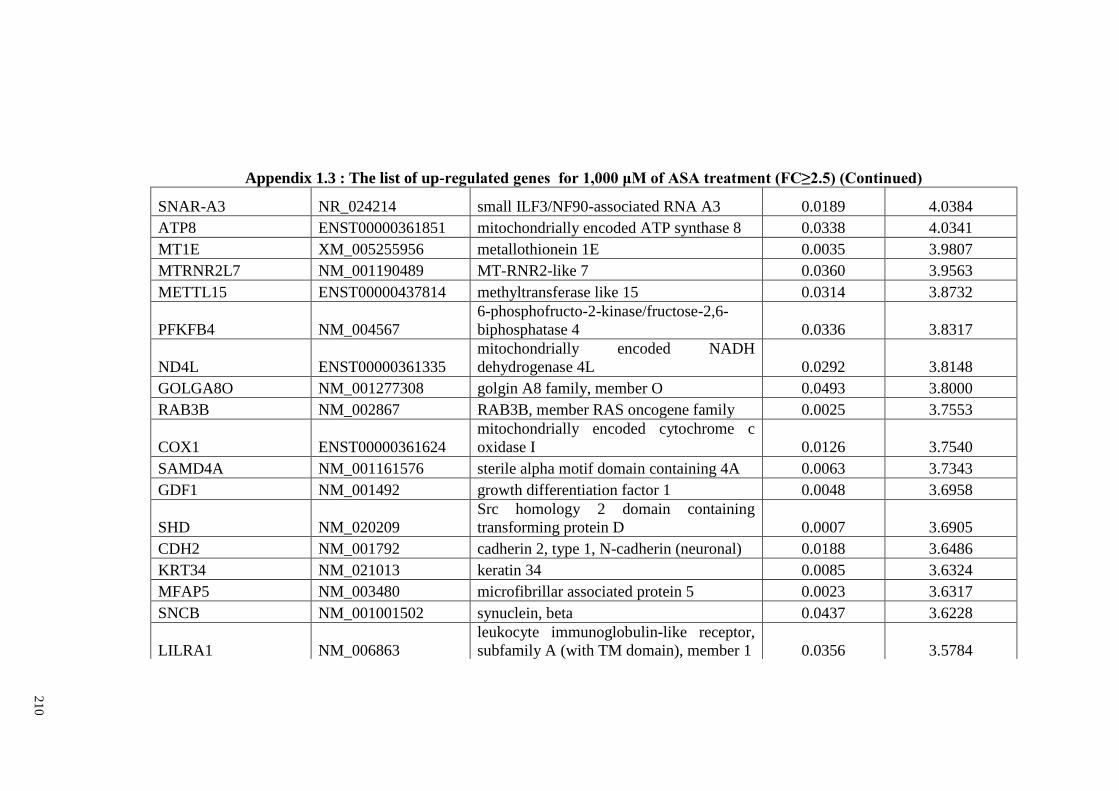
21
0
Appendix 1.3 : The list of up-regulated genes for 1,000 μM of ASA treatment (FC≥2.5) (Continued)
SNAR-A3 NR_024214 small ILF3/NF90-associated RNA A3 0.0189 4.0384
ATP8 ENST00000361851 mitochondrially encoded ATP synthase 8 0.0338 4.0341
MT1E XM_005255956 metallothionein 1E 0.0035 3.9807
MTRNR2L7 NM_001190489 MT-RNR2-like 7 0.0360 3.9563
METTL15 ENST00000437814 methyltransferase like 15 0.0314 3.8732
PFKFB4 NM_004567
6-phosphofructo-2-kinase/fructose-2,6-
biphosphatase 4 0.0336 3.8317
ND4L ENST00000361335
mitochondrially encoded NADH
dehydrogenase 4L 0.0292 3.8148
GOLGA8O NM_001277308 golgin A8 family, member O 0.0493 3.8000
RAB3B NM_002867 RAB3B, member RAS oncogene family 0.0025 3.7553
COX1 ENST00000361624
mitochondrially encoded cytochrome c
oxidase I 0.0126 3.7540
SAMD4A NM_001161576 sterile alpha motif domain containing 4A 0.0063 3.7343
GDF1 NM_001492 growth differentiation factor 1 0.0048 3.6958
SHD NM_020209
Src homology 2 domain containing
transforming protein D 0.0007 3.6905
CDH2 NM_001792 cadherin 2, type 1, N-cadherin (neuronal) 0.0188 3.6486
KRT34 NM_021013 keratin 34 0.0085 3.6324
MFAP5 NM_003480 microfibrillar associated protein 5 0.0023 3.6317
SNCB NM_001001502 synuclein, beta 0.0437 3.6228
LILRA1 NM_006863
leukocyte immunoglobulin-like receptor,
subfamily A (with TM domain), member 1 0.0356 3.5784
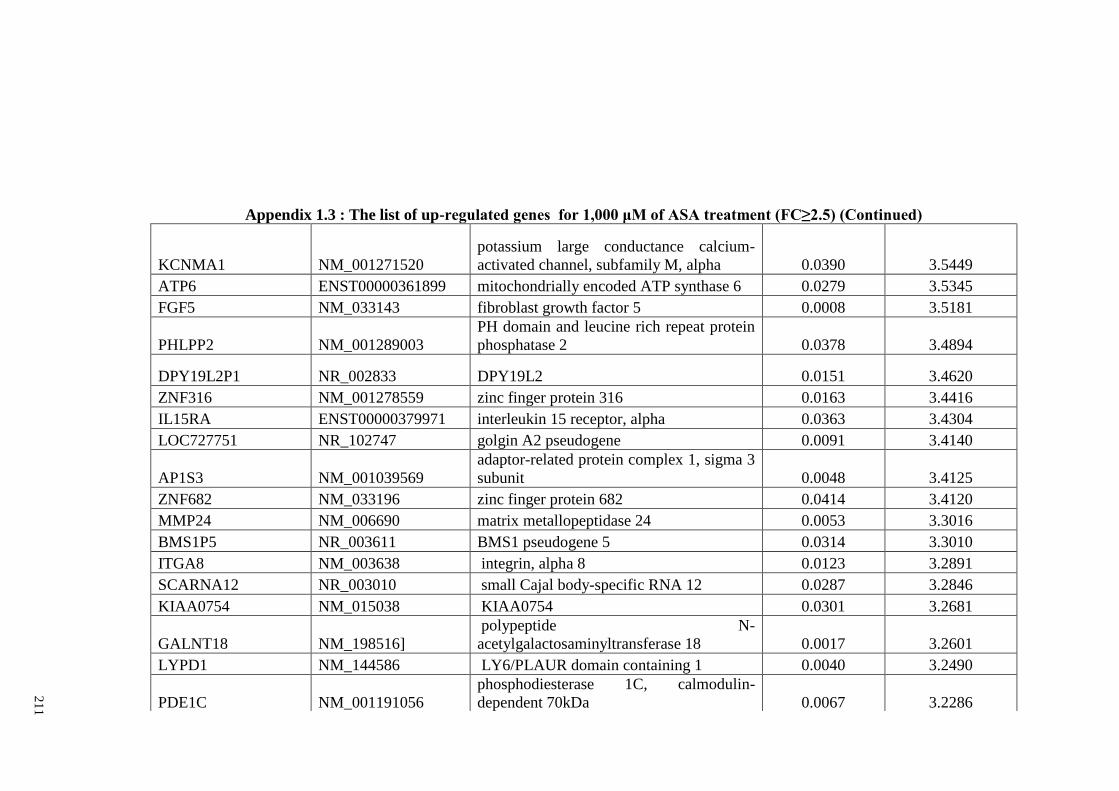
21
1
Appendix 1.3 : The list of up-regulated genes for 1,000 μM of ASA treatment (FC≥2.5) (Continued)
KCNMA1 NM_001271520
potassium large conductance calcium-
activated channel, subfamily M, alpha 0.0390 3.5449
ATP6 ENST00000361899 mitochondrially encoded ATP synthase 6 0.0279 3.5345
FGF5 NM_033143 fibroblast growth factor 5 0.0008 3.5181
PHLPP2 NM_001289003
PH domain and leucine rich repeat protein
phosphatase 2 0.0378 3.4894
DPY19L2P1 NR_002833 DPY19L2 0.0151 3.4620
ZNF316 NM_001278559 zinc finger protein 316 0.0163 3.4416
IL15RA ENST00000379971 interleukin 15 receptor, alpha 0.0363 3.4304
LOC727751 NR_102747 golgin A2 pseudogene 0.0091 3.4140
AP1S3 NM_001039569
adaptor-related protein complex 1, sigma 3
subunit 0.0048 3.4125
ZNF682 NM_033196 zinc finger protein 682 0.0414 3.4120
MMP24 NM_006690 matrix metallopeptidase 24 0.0053 3.3016
BMS1P5 NR_003611 BMS1 pseudogene 5 0.0314 3.3010
ITGA8 NM_003638 integrin, alpha 8 0.0123 3.2891
SCARNA12 NR_003010 small Cajal body-specific RNA 12 0.0287 3.2846
KIAA0754 NM_015038 KIAA0754 0.0301 3.2681
GALNT18 NM_198516]
polypeptide N-
acetylgalactosaminyltransferase 18 0.0017 3.2601
LYPD1 NM_144586 LY6/PLAUR domain containing 1 0.0040 3.2490
PDE1C NM_001191056
phosphodiesterase 1C, calmodulin-
dependent 70kDa 0.0067 3.2286
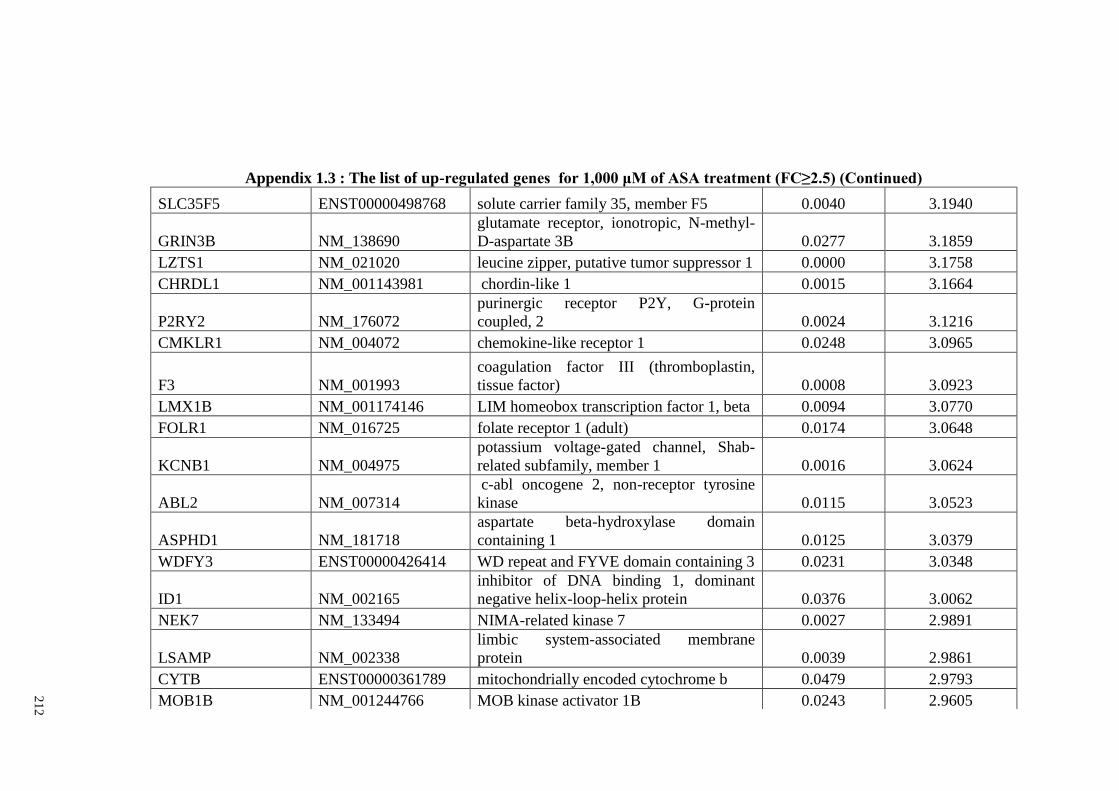
21
2
Appendix 1.3 : The list of up-regulated genes for 1,000 μM of ASA treatment (FC≥2.5) (Continued)
SLC35F5 ENST00000498768 solute carrier family 35, member F5 0.0040 3.1940
GRIN3B NM_138690
glutamate receptor, ionotropic, N-methyl-
D-aspartate 3B 0.0277 3.1859
LZTS1 NM_021020 leucine zipper, putative tumor suppressor 1 0.0000 3.1758
CHRDL1 NM_001143981 chordin-like 1 0.0015 3.1664
P2RY2 NM_176072
purinergic receptor P2Y, G-protein
coupled, 2 0.0024 3.1216
CMKLR1 NM_004072 chemokine-like receptor 1 0.0248 3.0965
F3 NM_001993
coagulation factor III (thromboplastin,
tissue factor) 0.0008 3.0923
LMX1B NM_001174146 LIM homeobox transcription factor 1, beta 0.0094 3.0770
FOLR1 NM_016725 folate receptor 1 (adult) 0.0174 3.0648
KCNB1 NM_004975
potassium voltage-gated channel, Shab-
related subfamily, member 1 0.0016 3.0624
ABL2 NM_007314
c-abl oncogene 2, non-receptor tyrosine
kinase 0.0115 3.0523
ASPHD1 NM_181718
aspartate beta-hydroxylase domain
containing 1 0.0125 3.0379
WDFY3 ENST00000426414 WD repeat and FYVE domain containing 3 0.0231 3.0348
ID1 NM_002165
inhibitor of DNA binding 1, dominant
negative helix-loop-helix protein 0.0376 3.0062
NEK7 NM_133494 NIMA-related kinase 7 0.0027 2.9891
LSAMP NM_002338
limbic system-associated membrane
protein 0.0039 2.9861
CYTB ENST00000361789 mitochondrially encoded cytochrome b 0.0479 2.9793
MOB1B NM_001244766 MOB kinase activator 1B 0.0243 2.9605
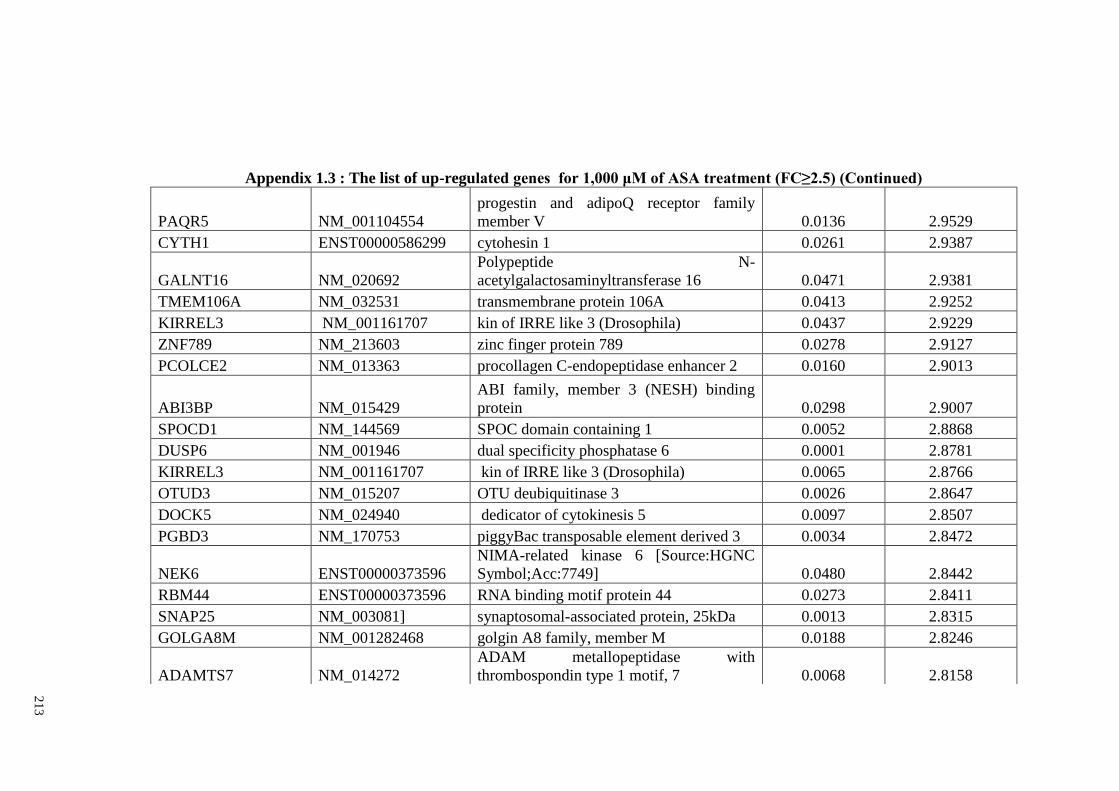
21
3
Appendix 1.3 : The list of up-regulated genes for 1,000 μM of ASA treatment (FC≥2.5) (Continued)
PAQR5 NM_001104554
progestin and adipoQ receptor family
member V 0.0136 2.9529
CYTH1 ENST00000586299 cytohesin 1 0.0261 2.9387
GALNT16 NM_020692
Polypeptide N-
acetylgalactosaminyltransferase 16 0.0471 2.9381
TMEM106A NM_032531 transmembrane protein 106A 0.0413 2.9252
KIRREL3 NM_001161707 kin of IRRE like 3 (Drosophila) 0.0437 2.9229
ZNF789 NM_213603 zinc finger protein 789 0.0278 2.9127
PCOLCE2 NM_013363 procollagen C-endopeptidase enhancer 2 0.0160 2.9013
ABI3BP NM_015429
ABI family, member 3 (NESH) binding
protein 0.0298 2.9007
SPOCD1 NM_144569 SPOC domain containing 1 0.0052 2.8868
DUSP6 NM_001946 dual specificity phosphatase 6 0.0001 2.8781
KIRREL3 NM_001161707 kin of IRRE like 3 (Drosophila) 0.0065 2.8766
OTUD3 NM_015207 OTU deubiquitinase 3 0.0026 2.8647
DOCK5 NM_024940 dedicator of cytokinesis 5 0.0097 2.8507
PGBD3 NM_170753 piggyBac transposable element derived 3 0.0034 2.8472
NEK6 ENST00000373596
NIMA-related kinase 6 [Source:HGNC
Symbol;Acc:7749] 0.0480 2.8442
RBM44 ENST00000373596 RNA binding motif protein 44 0.0273 2.8411
SNAP25 NM_003081] synaptosomal-associated protein, 25kDa 0.0013 2.8315
GOLGA8M NM_001282468 golgin A8 family, member M 0.0188 2.8246
ADAMTS7 NM_014272
ADAM metallopeptidase with
thrombospondin type 1 motif, 7 0.0068 2.8158
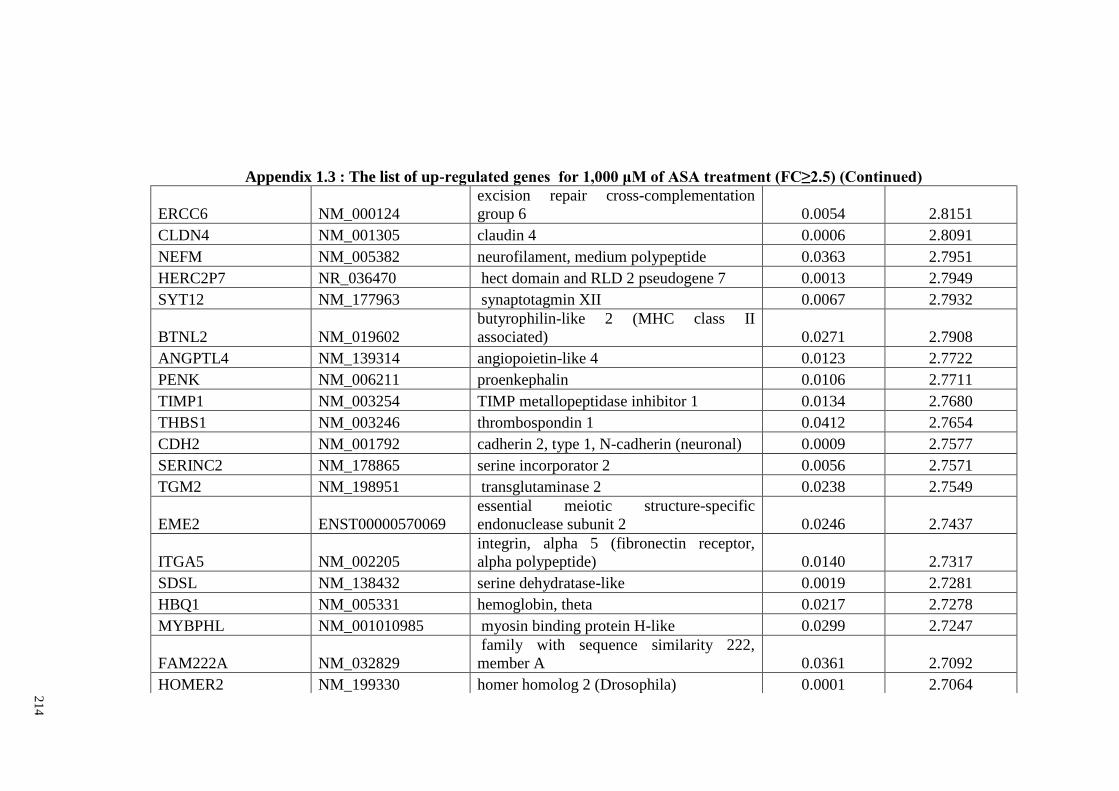
21
4
Appendix 1.3 : The list of up-regulated genes for 1,000 μM of ASA treatment (FC≥2.5) (Continued)
ERCC6 NM_000124
excision repair cross-complementation
group 6 0.0054 2.8151
CLDN4 NM_001305 claudin 4 0.0006 2.8091
NEFM NM_005382 neurofilament, medium polypeptide 0.0363 2.7951
HERC2P7 NR_036470 hect domain and RLD 2 pseudogene 7 0.0013 2.7949
SYT12 NM_177963 synaptotagmin XII 0.0067 2.7932
BTNL2 NM_019602
butyrophilin-like 2 (MHC class II
associated) 0.0271 2.7908
ANGPTL4 NM_139314 angiopoietin-like 4 0.0123 2.7722
PENK NM_006211 proenkephalin 0.0106 2.7711
TIMP1 NM_003254 TIMP metallopeptidase inhibitor 1 0.0134 2.7680
THBS1 NM_003246 thrombospondin 1 0.0412 2.7654
CDH2 NM_001792 cadherin 2, type 1, N-cadherin (neuronal) 0.0009 2.7577
SERINC2 NM_178865 serine incorporator 2 0.0056 2.7571
TGM2 NM_198951 transglutaminase 2 0.0238 2.7549
EME2 ENST00000570069
essential meiotic structure-specific
endonuclease subunit 2 0.0246 2.7437
ITGA5 NM_002205
integrin, alpha 5 (fibronectin receptor,
alpha polypeptide) 0.0140 2.7317
SDSL NM_138432 serine dehydratase-like 0.0019 2.7281
HBQ1 NM_005331 hemoglobin, theta 0.0217 2.7278
MYBPHL NM_001010985 myosin binding protein H-like 0.0299 2.7247
FAM222A NM_032829
family with sequence similarity 222,
member A 0.0361 2.7092
HOMER2 NM_199330 homer homolog 2 (Drosophila) 0.0001 2.7064
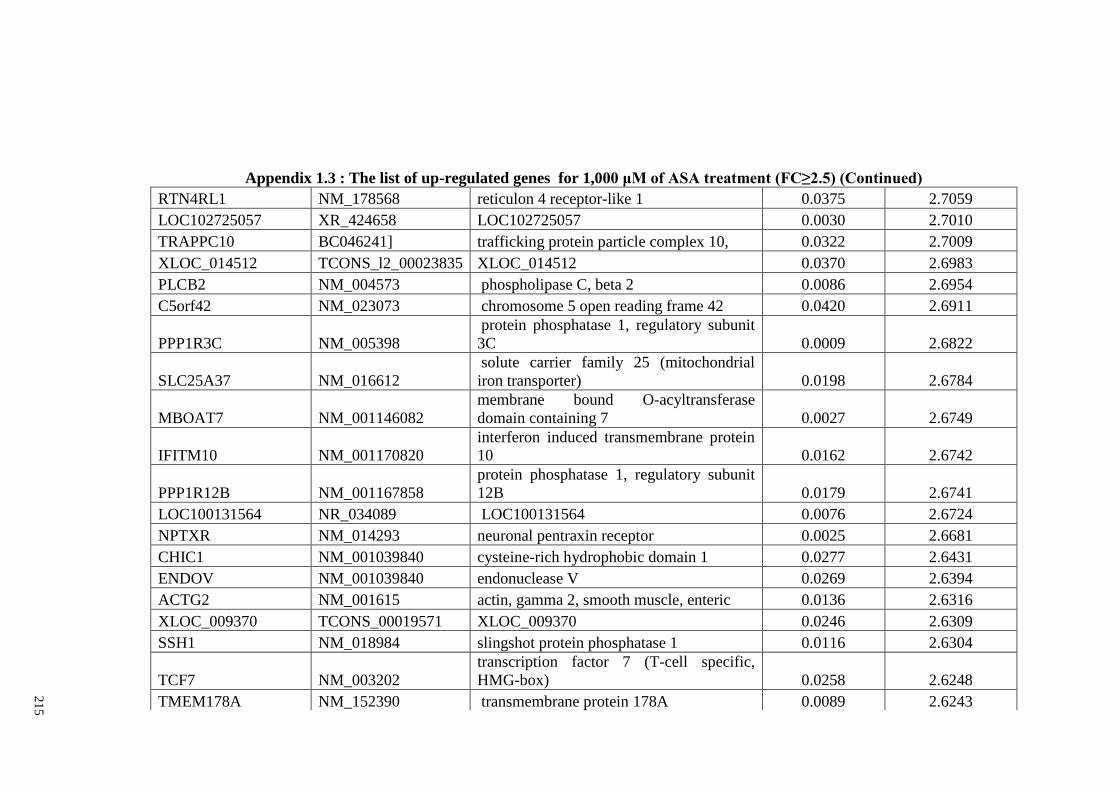
21
5
Appendix 1.3 : The list of up-regulated genes for 1,000 μM of ASA treatment (FC≥2.5) (Continued)
RTN4RL1 NM_178568 reticulon 4 receptor-like 1 0.0375 2.7059
LOC102725057 XR_424658 LOC102725057 0.0030 2.7010
TRAPPC10 BC046241] trafficking protein particle complex 10, 0.0322 2.7009
XLOC_014512 TCONS_l2_00023835 XLOC_014512 0.0370 2.6983
PLCB2 NM_004573 phospholipase C, beta 2 0.0086 2.6954
C5orf42 NM_023073 chromosome 5 open reading frame 42 0.0420 2.6911
PPP1R3C NM_005398
protein phosphatase 1, regulatory subunit
3C 0.0009 2.6822
SLC25A37 NM_016612
solute carrier family 25 (mitochondrial
iron transporter) 0.0198 2.6784
MBOAT7 NM_001146082
membrane bound O-acyltransferase
domain containing 7 0.0027 2.6749
IFITM10 NM_001170820
interferon induced transmembrane protein
10 0.0162 2.6742
PPP1R12B NM_001167858
protein phosphatase 1, regulatory subunit
12B 0.0179 2.6741
LOC100131564 NR_034089 LOC100131564 0.0076 2.6724
NPTXR NM_014293 neuronal pentraxin receptor 0.0025 2.6681
CHIC1 NM_001039840 cysteine-rich hydrophobic domain 1 0.0277 2.6431
ENDOV NM_001039840 endonuclease V 0.0269 2.6394
ACTG2 NM_001615 actin, gamma 2, smooth muscle, enteric 0.0136 2.6316
XLOC_009370 TCONS_00019571 XLOC_009370 0.0246 2.6309
SSH1 NM_018984 slingshot protein phosphatase 1 0.0116 2.6304
TCF7 NM_003202
transcription factor 7 (T-cell specific,
HMG-box) 0.0258 2.6248
TMEM178A NM_152390 transmembrane protein 178A 0.0089 2.6243
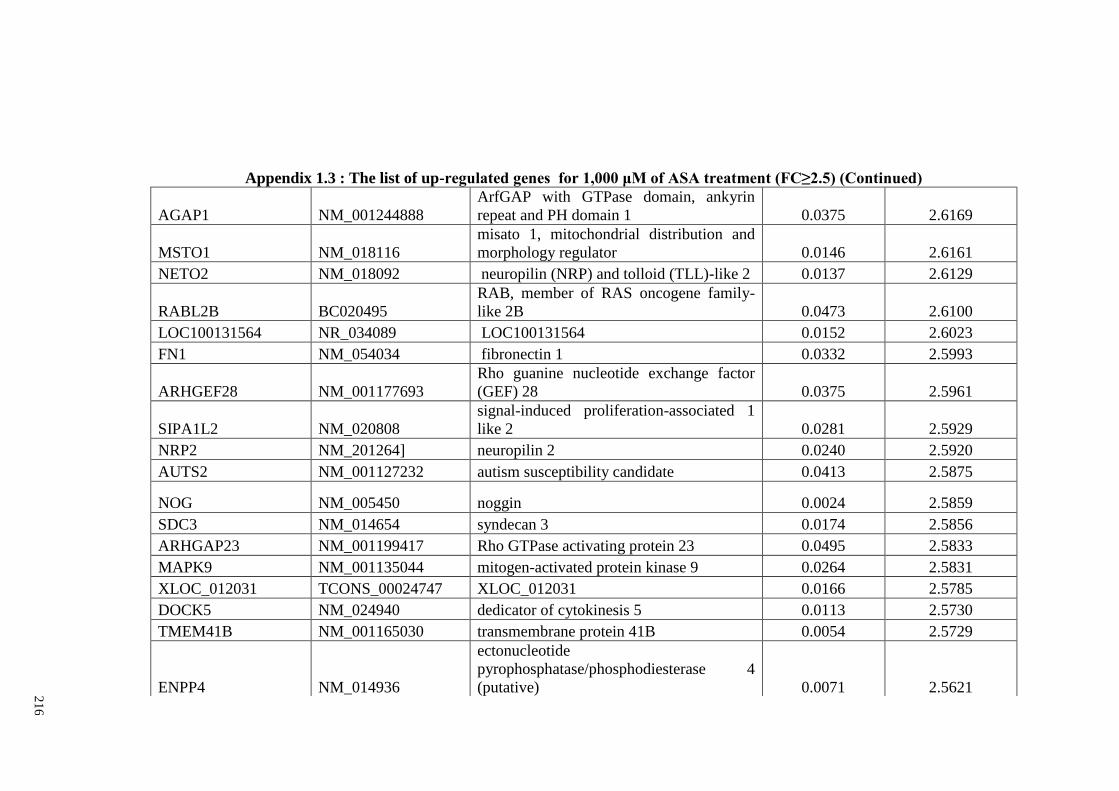
21
6
Appendix 1.3 : The list of up-regulated genes for 1,000 μM of ASA treatment (FC≥2.5) (Continued)
AGAP1 NM_001244888
ArfGAP with GTPase domain, ankyrin
repeat and PH domain 1 0.0375 2.6169
MSTO1 NM_018116
misato 1, mitochondrial distribution and
morphology regulator 0.0146 2.6161
NETO2 NM_018092 neuropilin (NRP) and tolloid (TLL)-like 2 0.0137 2.6129
RABL2B BC020495
RAB, member of RAS oncogene family-
like 2B 0.0473 2.6100
LOC100131564 NR_034089 LOC100131564 0.0152 2.6023
FN1 NM_054034 fibronectin 1 0.0332 2.5993
ARHGEF28 NM_001177693
Rho guanine nucleotide exchange factor
(GEF) 28 0.0375 2.5961
SIPA1L2 NM_020808
signal-induced proliferation-associated 1
like 2 0.0281 2.5929
NRP2 NM_201264] neuropilin 2 0.0240 2.5920
AUTS2 NM_001127232 autism susceptibility candidate 0.0413 2.5875
NOG NM_005450 noggin 0.0024 2.5859
SDC3 NM_014654 syndecan 3 0.0174 2.5856
ARHGAP23 NM_001199417 Rho GTPase activating protein 23 0.0495 2.5833
MAPK9 NM_001135044 mitogen-activated protein kinase 9 0.0264 2.5831
XLOC_012031 TCONS_00024747 XLOC_012031 0.0166 2.5785
DOCK5 NM_024940 dedicator of cytokinesis 5 0.0113 2.5730
TMEM41B NM_001165030 transmembrane protein 41B 0.0054 2.5729
ENPP4 NM_014936
ectonucleotide
pyrophosphatase/phosphodiesterase 4
(putative) 0.0071 2.5621
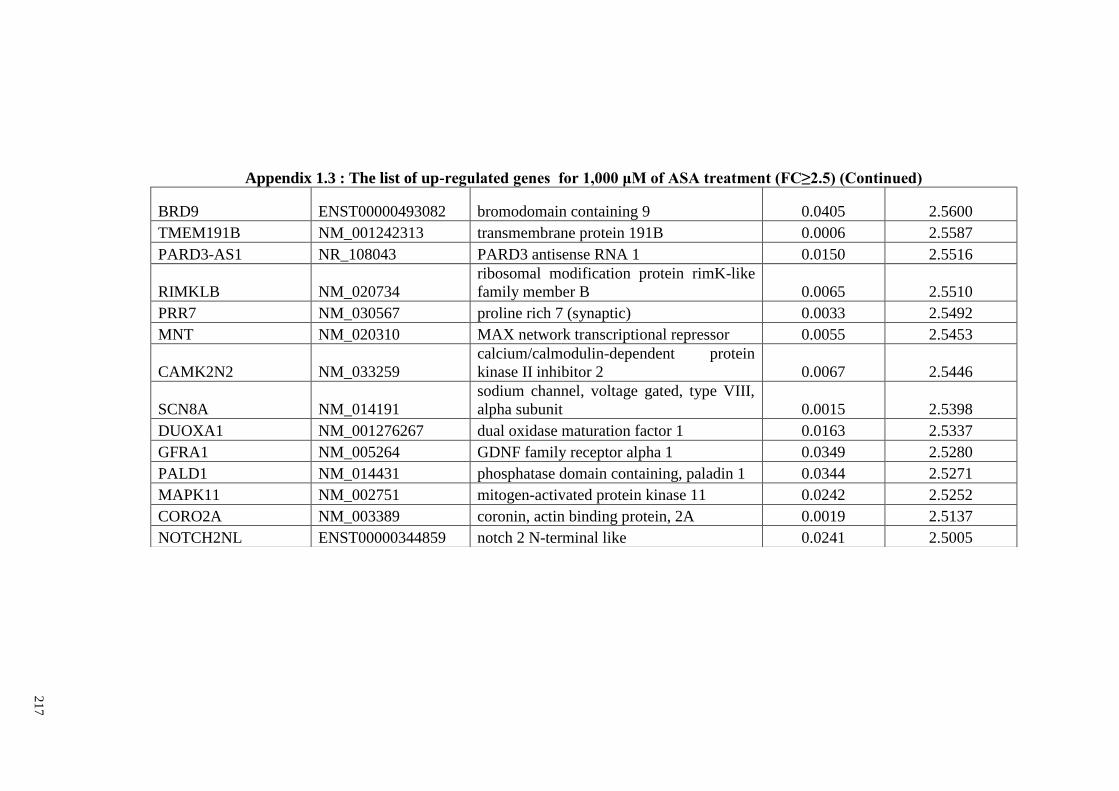
21
7
Appendix 1.3 : The list of up-regulated genes for 1,000 μM of ASA treatment (FC≥2.5) (Continued)
BRD9 ENST00000493082 bromodomain containing 9 0.0405 2.5600
TMEM191B NM_001242313 transmembrane protein 191B 0.0006 2.5587
PARD3-AS1 NR_108043 PARD3 antisense RNA 1 0.0150 2.5516
RIMKLB NM_020734
ribosomal modification protein rimK-like
family member B 0.0065 2.5510
PRR7 NM_030567 proline rich 7 (synaptic) 0.0033 2.5492
MNT NM_020310 MAX network transcriptional repressor 0.0055 2.5453
CAMK2N2 NM_033259
calcium/calmodulin-dependent protein
kinase II inhibitor 2 0.0067 2.5446
SCN8A NM_014191
sodium channel, voltage gated, type VIII,
alpha subunit 0.0015 2.5398
DUOXA1 NM_001276267 dual oxidase maturation factor 1 0.0163 2.5337
GFRA1 NM_005264 GDNF family receptor alpha 1 0.0349 2.5280
PALD1 NM_014431 phosphatase domain containing, paladin 1 0.0344 2.5271
MAPK11 NM_002751 mitogen-activated protein kinase 11 0.0242 2.5252
CORO2A NM_003389 coronin, actin binding protein, 2A 0.0019 2.5137
NOTCH2NL ENST00000344859 notch 2 N-terminal like 0.0241 2.5005
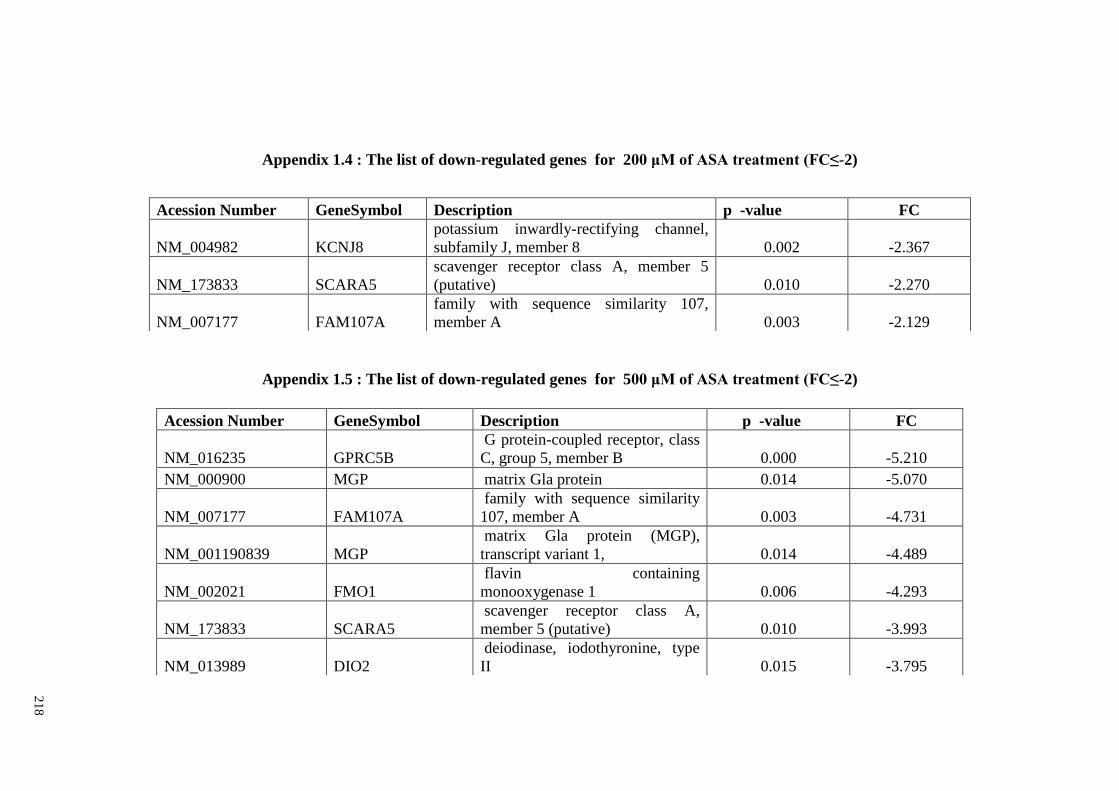
21
8
Appendix 1.4 : The list of down-regulated genes for 200 μM of ASA treatment (FC≤-2)
Appendix 1.5 : The list of down-regulated genes for 500 μM of ASA treatment (FC≤-2)
Acession Number GeneSymbol Description p -value FC
NM_016235 GPRC5B
G protein-coupled receptor, class
C, group 5, member B 0.000 -5.210
NM_000900 MGP matrix Gla protein 0.014 -5.070
NM_007177 FAM107A
family with sequence similarity
107, member A 0.003 -4.731
NM_001190839 MGP
matrix Gla protein (MGP),
transcript variant 1, 0.014 -4.489
NM_002021 FMO1
flavin containing
monooxygenase 1 0.006 -4.293
NM_173833 SCARA5
scavenger receptor class A,
member 5 (putative) 0.010 -3.993
NM_013989 DIO2
deiodinase, iodothyronine, type
II 0.015 -3.795
Acession Number GeneSymbol Description p -value FC
NM_004982 KCNJ8
potassium inwardly-rectifying channel,
subfamily J, member 8 0.002 -2.367
NM_173833 SCARA5
scavenger receptor class A, member 5
(putative) 0.010 -2.270
NM_007177 FAM107A
family with sequence similarity 107,
member A 0.003 -2.129
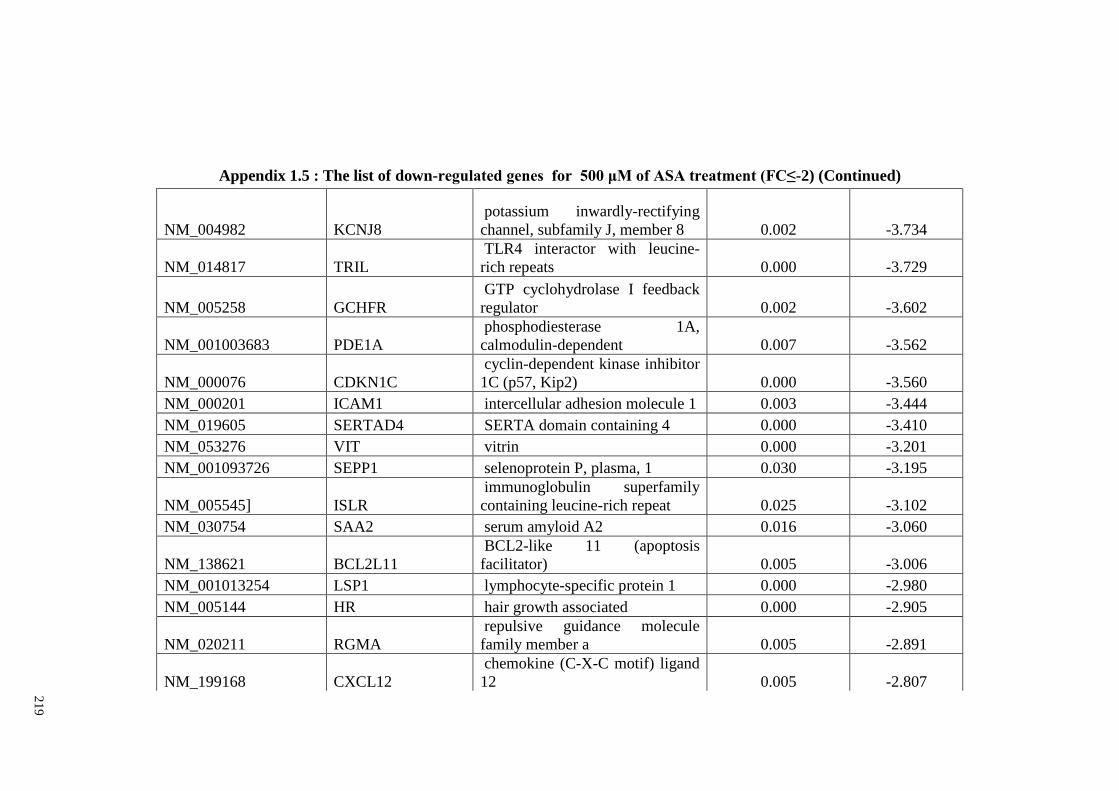
21
9
Appendix 1.5 : The list of down-regulated genes for 500 μM of ASA treatment (FC≤-2) (Continued)
NM_004982 KCNJ8
potassium inwardly-rectifying
channel, subfamily J, member 8 0.002 -3.734
NM_014817 TRIL
TLR4 interactor with leucine-
rich repeats 0.000 -3.729
NM_005258 GCHFR
GTP cyclohydrolase I feedback
regulator 0.002 -3.602
NM_001003683 PDE1A
phosphodiesterase 1A,
calmodulin-dependent 0.007 -3.562
NM_000076 CDKN1C
cyclin-dependent kinase inhibitor
1C (p57, Kip2) 0.000 -3.560
NM_000201 ICAM1 intercellular adhesion molecule 1 0.003 -3.444
NM_019605 SERTAD4 SERTA domain containing 4 0.000 -3.410
NM_053276 VIT vitrin 0.000 -3.201
NM_001093726 SEPP1 selenoprotein P, plasma, 1 0.030 -3.195
NM_005545] ISLR
immunoglobulin superfamily
containing leucine-rich repeat 0.025 -3.102
NM_030754 SAA2 serum amyloid A2 0.016 -3.060
NM_138621 BCL2L11
BCL2-like 11 (apoptosis
facilitator) 0.005 -3.006
NM_001013254 LSP1 lymphocyte-specific protein 1 0.000 -2.980
NM_005144 HR hair growth associated 0.000 -2.905
NM_020211 RGMA
repulsive guidance molecule
family member a 0.005 -2.891
NM_199168 CXCL12
chemokine (C-X-C motif) ligand
12 0.005 -2.807
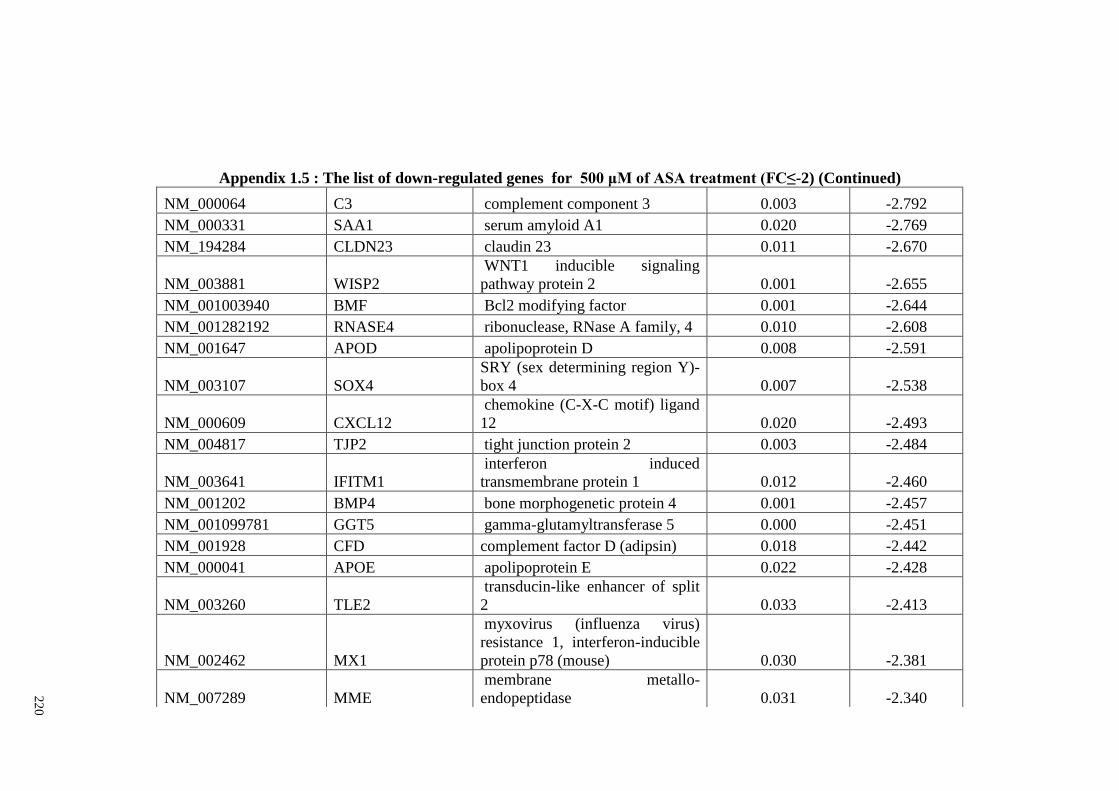
22
0
Appendix 1.5 : The list of down-regulated genes for 500 μM of ASA treatment (FC≤-2) (Continued)
NM_000064 C3 complement component 3 0.003 -2.792
NM_000331 SAA1 serum amyloid A1 0.020 -2.769
NM_194284 CLDN23 claudin 23 0.011 -2.670
NM_003881 WISP2
WNT1 inducible signaling
pathway protein 2 0.001 -2.655
NM_001003940 BMF Bcl2 modifying factor 0.001 -2.644
NM_001282192 RNASE4 ribonuclease, RNase A family, 4 0.010 -2.608
NM_001647 APOD apolipoprotein D 0.008 -2.591
NM_003107 SOX4
SRY (sex determining region Y)-
box 4 0.007 -2.538
NM_000609 CXCL12
chemokine (C-X-C motif) ligand
12 0.020 -2.493
NM_004817 TJP2 tight junction protein 2 0.003 -2.484
NM_003641 IFITM1
interferon induced
transmembrane protein 1 0.012 -2.460
NM_001202 BMP4 bone morphogenetic protein 4 0.001 -2.457
NM_001099781 GGT5 gamma-glutamyltransferase 5 0.000 -2.451
NM_001928 CFD complement factor D (adipsin) 0.018 -2.442
NM_000041 APOE apolipoprotein E 0.022 -2.428
NM_003260 TLE2
transducin-like enhancer of split
2 0.033 -2.413
NM_002462 MX1
myxovirus (influenza virus)
resistance 1, interferon-inducible
protein p78 (mouse) 0.030 -2.381
NM_007289 MME
membrane metallo-
endopeptidase 0.031 -2.340
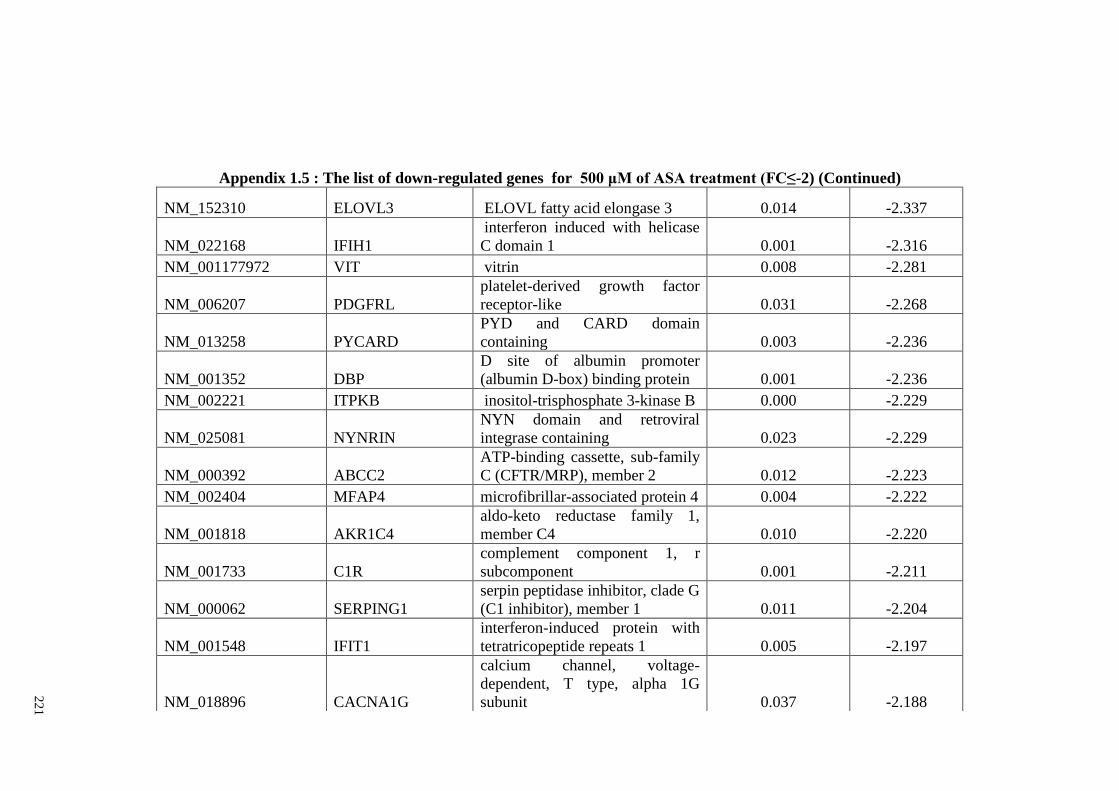
22
1
Appendix 1.5 : The list of down-regulated genes for 500 μM of ASA treatment (FC≤-2) (Continued)
NM_152310 ELOVL3 ELOVL fatty acid elongase 3 0.014 -2.337
NM_022168 IFIH1
interferon induced with helicase
C domain 1 0.001 -2.316
NM_001177972 VIT vitrin 0.008 -2.281
NM_006207 PDGFRL
platelet-derived growth factor
receptor-like 0.031 -2.268
NM_013258 PYCARD
PYD and CARD domain
containing 0.003 -2.236
NM_001352 DBP
D site of albumin promoter
(albumin D-box) binding protein 0.001 -2.236
NM_002221 ITPKB inositol-trisphosphate 3-kinase B 0.000 -2.229
NM_025081 NYNRIN
NYN domain and retroviral
integrase containing 0.023 -2.229
NM_000392 ABCC2
ATP-binding cassette, sub-family
C (CFTR/MRP), member 2 0.012 -2.223
NM_002404 MFAP4 microfibrillar-associated protein 4 0.004 -2.222
NM_001818 AKR1C4
aldo-keto reductase family 1,
member C4 0.010 -2.220
NM_001733 C1R
complement component 1, r
subcomponent 0.001 -2.211
NM_000062 SERPING1
serpin peptidase inhibitor, clade G
(C1 inhibitor), member 1 0.011 -2.204
NM_001548 IFIT1
interferon-induced protein with
tetratricopeptide repeats 1 0.005 -2.197
NM_018896 CACNA1G
calcium channel, voltage-
dependent, T type, alpha 1G
subunit 0.037 -2.188
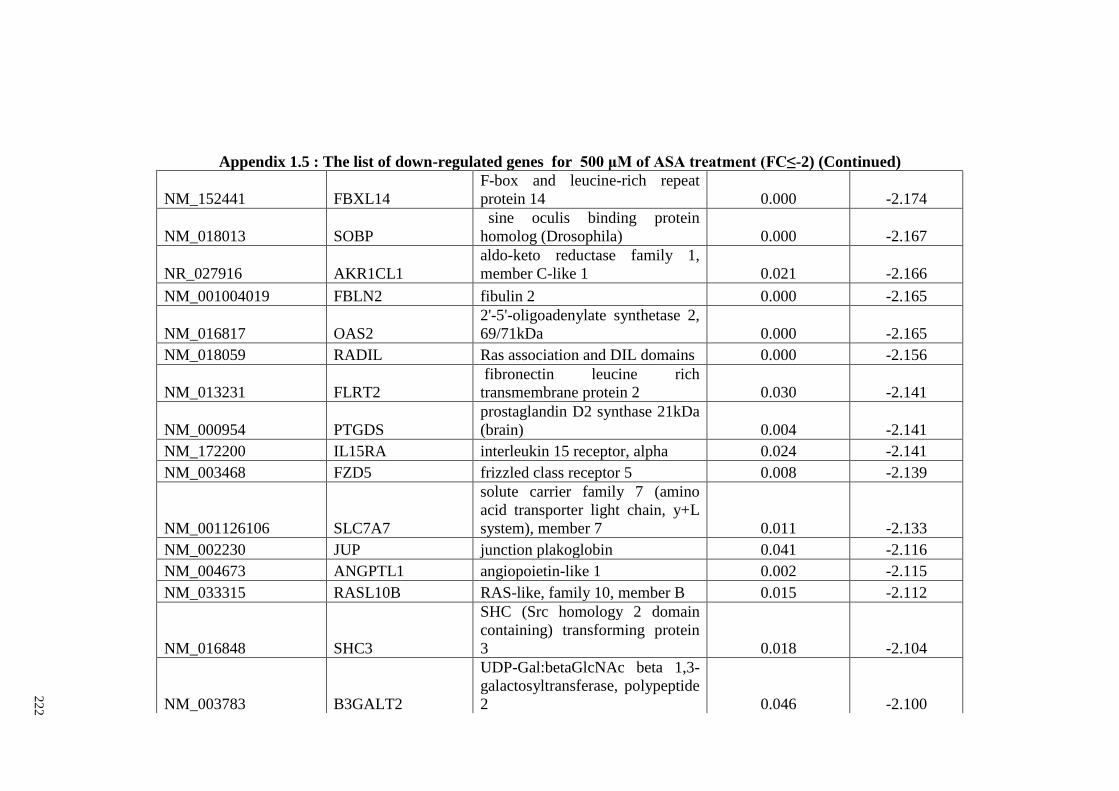
22
2
Appendix 1.5 : The list of down-regulated genes for 500 μM of ASA treatment (FC≤-2) (Continued)
NM_152441 FBXL14
F-box and leucine-rich repeat
protein 14 0.000 -2.174
NM_018013 SOBP
sine oculis binding protein
homolog (Drosophila) 0.000 -2.167
NR_027916 AKR1CL1
aldo-keto reductase family 1,
member C-like 1 0.021 -2.166
NM_001004019 FBLN2 fibulin 2 0.000 -2.165
NM_016817 OAS2
2'-5'-oligoadenylate synthetase 2,
69/71kDa 0.000 -2.165
NM_018059 RADIL Ras association and DIL domains 0.000 -2.156
NM_013231 FLRT2
fibronectin leucine rich
transmembrane protein 2 0.030 -2.141
NM_000954 PTGDS
prostaglandin D2 synthase 21kDa
(brain) 0.004 -2.141
NM_172200 IL15RA interleukin 15 receptor, alpha 0.024 -2.141
NM_003468 FZD5 frizzled class receptor 5 0.008 -2.139
NM_001126106 SLC7A7
solute carrier family 7 (amino
acid transporter light chain, y+L
system), member 7 0.011 -2.133
NM_002230 JUP junction plakoglobin 0.041 -2.116
NM_004673 ANGPTL1 angiopoietin-like 1 0.002 -2.115
NM_033315 RASL10B RAS-like, family 10, member B 0.015 -2.112
NM_016848 SHC3
SHC (Src homology 2 domain
containing) transforming protein
3 0.018 -2.104
NM_003783 B3GALT2
UDP-Gal:betaGlcNAc beta 1,3-
galactosyltransferase, polypeptide
2 0.046 -2.100
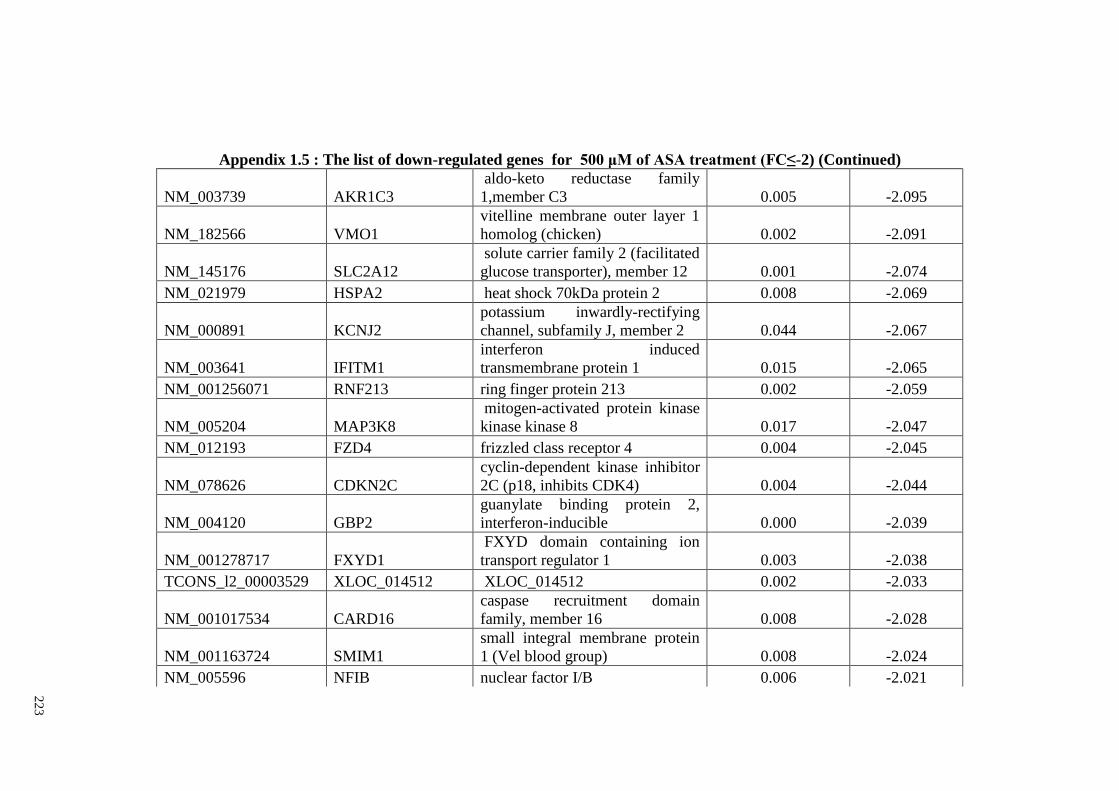
22
3
Appendix 1.5 : The list of down-regulated genes for 500 μM of ASA treatment (FC≤-2) (Continued)
NM_003739 AKR1C3
aldo-keto reductase family
1,member C3 0.005 -2.095
NM_182566 VMO1
vitelline membrane outer layer 1
homolog (chicken) 0.002 -2.091
NM_145176 SLC2A12
solute carrier family 2 (facilitated
glucose transporter), member 12 0.001 -2.074
NM_021979 HSPA2 heat shock 70kDa protein 2 0.008 -2.069
NM_000891 KCNJ2
potassium inwardly-rectifying
channel, subfamily J, member 2 0.044 -2.067
NM_003641 IFITM1
interferon induced
transmembrane protein 1 0.015 -2.065
NM_001256071 RNF213 ring finger protein 213 0.002 -2.059
NM_005204 MAP3K8
mitogen-activated protein kinase
kinase kinase 8 0.017 -2.047
NM_012193 FZD4 frizzled class receptor 4 0.004 -2.045
NM_078626 CDKN2C
cyclin-dependent kinase inhibitor
2C (p18, inhibits CDK4) 0.004 -2.044
NM_004120 GBP2
guanylate binding protein 2,
interferon-inducible 0.000 -2.039
NM_001278717 FXYD1
FXYD domain containing ion
transport regulator 1 0.003 -2.038
TCONS_l2_00003529 XLOC_014512 XLOC_014512 0.002 -2.033
NM_001017534 CARD16
caspase recruitment domain
family, member 16 0.008 -2.028
NM_001163724 SMIM1
small integral membrane protein
1 (Vel blood group) 0.008 -2.024
NM_005596 NFIB nuclear factor I/B 0.006 -2.021
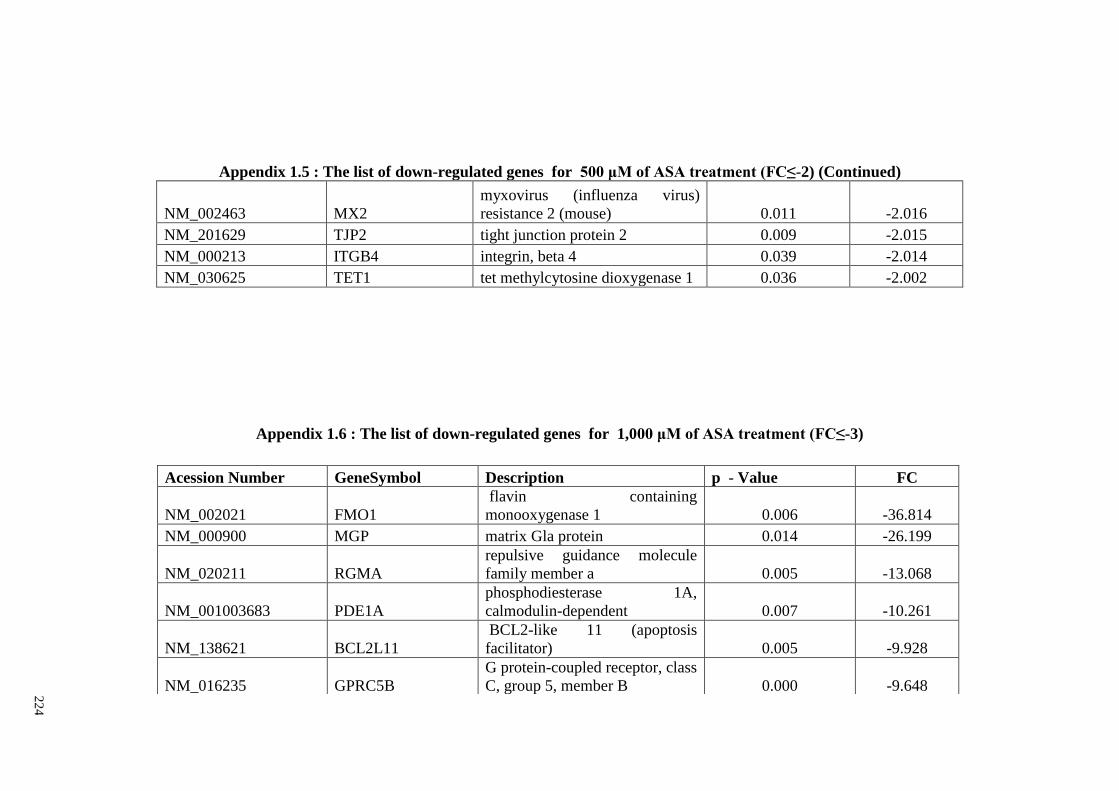
22
4
Appendix 1.5 : The list of down-regulated genes for 500 μM of ASA treatment (FC≤-2) (Continued)
NM_002463 MX2
myxovirus (influenza virus)
resistance 2 (mouse) 0.011 -2.016
NM_201629 TJP2 tight junction protein 2 0.009 -2.015
NM_000213 ITGB4 integrin, beta 4 0.039 -2.014
NM_030625 TET1 tet methylcytosine dioxygenase 1 0.036 -2.002
Appendix 1.6 : The list of down-regulated genes for 1,000 μM of ASA treatment (FC≤-3)
Acession Number GeneSymbol Description p - Value FC
NM_002021 FMO1
flavin containing
monooxygenase 1 0.006 -36.814
NM_000900 MGP matrix Gla protein 0.014 -26.199
NM_020211 RGMA
repulsive guidance molecule
family member a 0.005 -13.068
NM_001003683 PDE1A
phosphodiesterase 1A,
calmodulin-dependent 0.007 -10.261
NM_138621 BCL2L11
BCL2-like 11 (apoptosis
facilitator) 0.005 -9.928
NM_016235 GPRC5B
G protein-coupled receptor, class
C, group 5, member B 0.000 -9.648
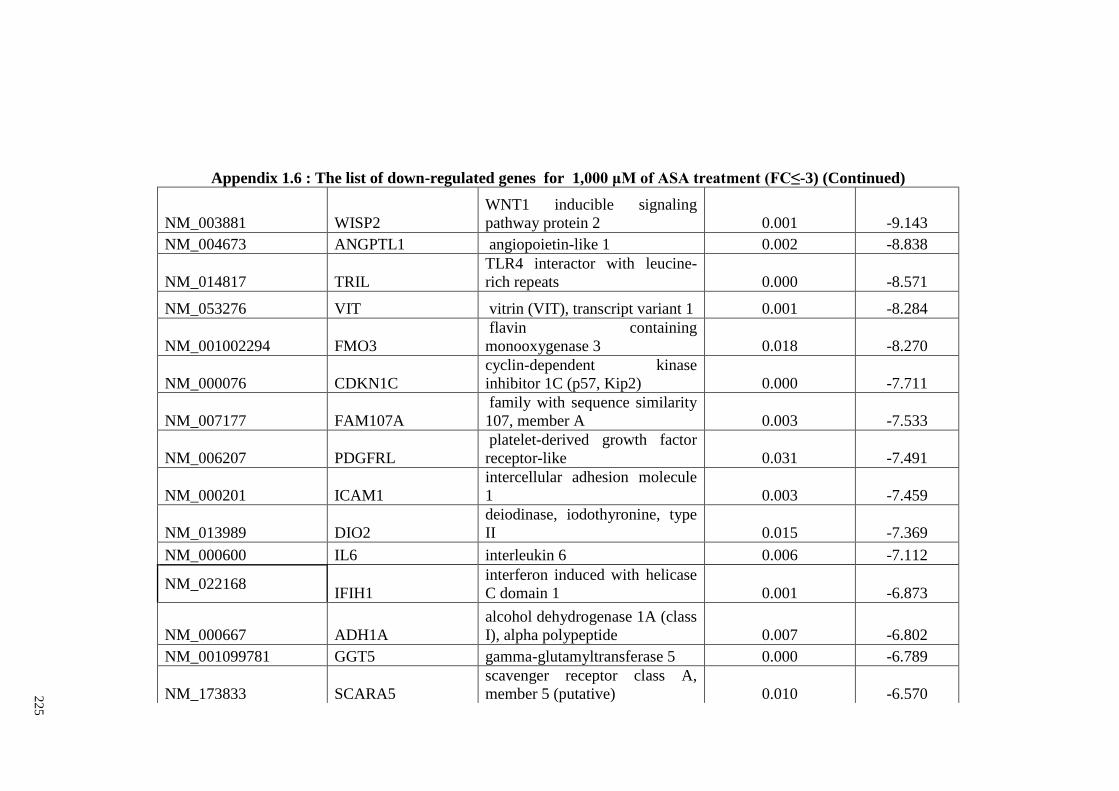
22
5
Appendix 1.6 : The list of down-regulated genes for 1,000 μM of ASA treatment (FC≤-3) (Continued)
NM_003881 WISP2
WNT1 inducible signaling
pathway protein 2 0.001 -9.143
NM_004673 ANGPTL1 angiopoietin-like 1 0.002 -8.838
NM_014817 TRIL
TLR4 interactor with leucine-
rich repeats 0.000 -8.571
NM_053276 VIT vitrin (VIT), transcript variant 1 0.001 -8.284
NM_001002294 FMO3
flavin containing
monooxygenase 3 0.018 -8.270
NM_000076 CDKN1C
cyclin-dependent kinase
inhibitor 1C (p57, Kip2) 0.000 -7.711
NM_007177 FAM107A
family with sequence similarity
107, member A 0.003 -7.533
NM_006207 PDGFRL
platelet-derived growth factor
receptor-like 0.031 -7.491
NM_000201 ICAM1
intercellular adhesion molecule
1 0.003 -7.459
NM_013989 DIO2
deiodinase, iodothyronine, type
II 0.015 -7.369
NM_000600 IL6 interleukin 6 0.006 -7.112
NM_022168 IFIH1
interferon induced with helicase
C domain 1 0.001 -6.873
NM_000667 ADH1A
alcohol dehydrogenase 1A (class
I), alpha polypeptide 0.007 -6.802
NM_001099781 GGT5 gamma-glutamyltransferase 5 0.000 -6.789
NM_173833 SCARA5
scavenger receptor class A,
member 5 (putative) 0.010 -6.570
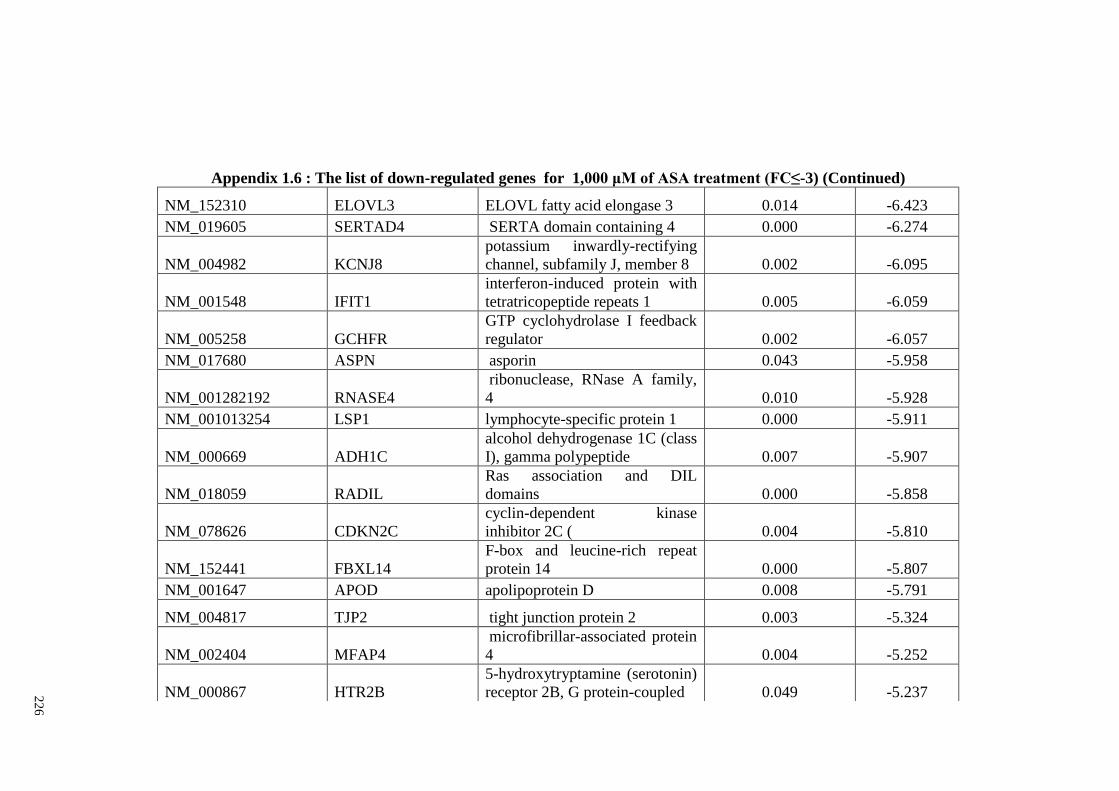
22
6
Appendix 1.6 : The list of down-regulated genes for 1,000 μM of ASA treatment (FC≤-3) (Continued)
NM_152310 ELOVL3 ELOVL fatty acid elongase 3 0.014 -6.423
NM_019605 SERTAD4 SERTA domain containing 4 0.000 -6.274
NM_004982 KCNJ8
potassium inwardly-rectifying
channel, subfamily J, member 8 0.002 -6.095
NM_001548 IFIT1
interferon-induced protein with
tetratricopeptide repeats 1 0.005 -6.059
NM_005258 GCHFR
GTP cyclohydrolase I feedback
regulator 0.002 -6.057
NM_017680 ASPN asporin 0.043 -5.958
NM_001282192 RNASE4
ribonuclease, RNase A family,
4 0.010 -5.928
NM_001013254 LSP1 lymphocyte-specific protein 1 0.000 -5.911
NM_000669 ADH1C
alcohol dehydrogenase 1C (class
I), gamma polypeptide 0.007 -5.907
NM_018059 RADIL
Ras association and DIL
domains 0.000 -5.858
NM_078626 CDKN2C
cyclin-dependent kinase
inhibitor 2C ( 0.004 -5.810
NM_152441 FBXL14
F-box and leucine-rich repeat
protein 14 0.000 -5.807
NM_001647 APOD apolipoprotein D 0.008 -5.791
NM_004817 TJP2 tight junction protein 2 0.003 -5.324
NM_002404 MFAP4
microfibrillar-associated protein
4 0.004 -5.252
NM_000867 HTR2B
5-hydroxytryptamine (serotonin)
receptor 2B, G protein-coupled 0.049 -5.237
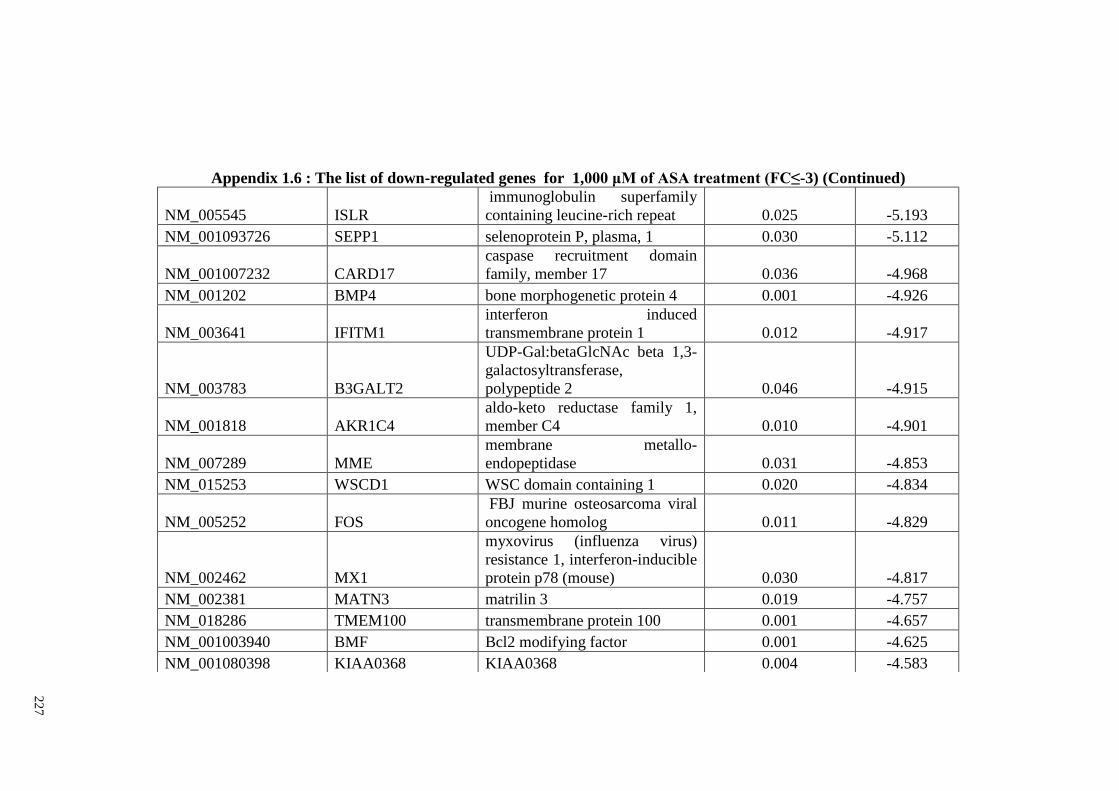
22
7
Appendix 1.6 : The list of down-regulated genes for 1,000 μM of ASA treatment (FC≤-3) (Continued)
NM_005545 ISLR
immunoglobulin superfamily
containing leucine-rich repeat 0.025 -5.193
NM_001093726 SEPP1 selenoprotein P, plasma, 1 0.030 -5.112
NM_001007232 CARD17
caspase recruitment domain
family, member 17 0.036 -4.968
NM_001202 BMP4 bone morphogenetic protein 4 0.001 -4.926
NM_003641 IFITM1
interferon induced
transmembrane protein 1 0.012 -4.917
NM_003783 B3GALT2
UDP-Gal:betaGlcNAc beta 1,3-
galactosyltransferase,
polypeptide 2 0.046 -4.915
NM_001818 AKR1C4
aldo-keto reductase family 1,
member C4 0.010 -4.901
NM_007289 MME
membrane metallo-
endopeptidase 0.031 -4.853
NM_015253 WSCD1 WSC domain containing 1 0.020 -4.834
NM_005252 FOS
FBJ murine osteosarcoma viral
oncogene homolog 0.011 -4.829
NM_002462 MX1
myxovirus (influenza virus)
resistance 1, interferon-inducible
protein p78 (mouse) 0.030 -4.817
NM_002381 MATN3 matrilin 3 0.019 -4.757
NM_018286 TMEM100 transmembrane protein 100 0.001 -4.657
NM_001003940 BMF Bcl2 modifying factor 0.001 -4.625
NM_001080398 KIAA0368 KIAA0368 0.004 -4.583
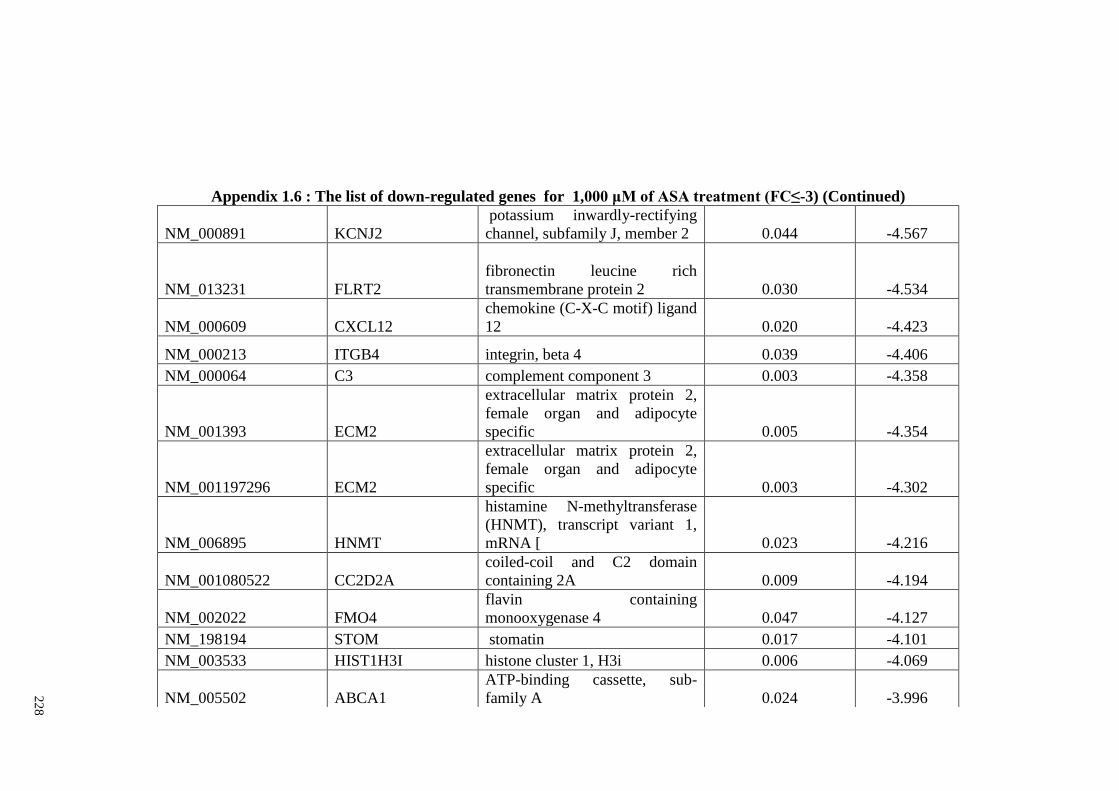
22
8
Appendix 1.6 : The list of down-regulated genes for 1,000 μM of ASA treatment (FC≤-3) (Continued)
NM_000891 KCNJ2
potassium inwardly-rectifying
channel, subfamily J, member 2 0.044 -4.567
NM_013231 FLRT2
fibronectin leucine rich
transmembrane protein 2 0.030 -4.534
NM_000609 CXCL12
chemokine (C-X-C motif) ligand
12 0.020 -4.423
NM_000213 ITGB4 integrin, beta 4 0.039 -4.406
NM_000064 C3 complement component 3 0.003 -4.358
NM_001393 ECM2
extracellular matrix protein 2,
female organ and adipocyte
specific 0.005 -4.354
NM_001197296 ECM2
extracellular matrix protein 2,
female organ and adipocyte
specific 0.003 -4.302
NM_006895 HNMT
histamine N-methyltransferase
(HNMT), transcript variant 1,
mRNA [ 0.023 -4.216
NM_001080522 CC2D2A
coiled-coil and C2 domain
containing 2A 0.009 -4.194
NM_002022 FMO4
flavin containing
monooxygenase 4 0.047 -4.127
NM_198194 STOM stomatin 0.017 -4.101
NM_003533 HIST1H3I histone cluster 1, H3i 0.006 -4.069
NM_005502 ABCA1
ATP-binding cassette, sub-
family A 0.024 -3.996
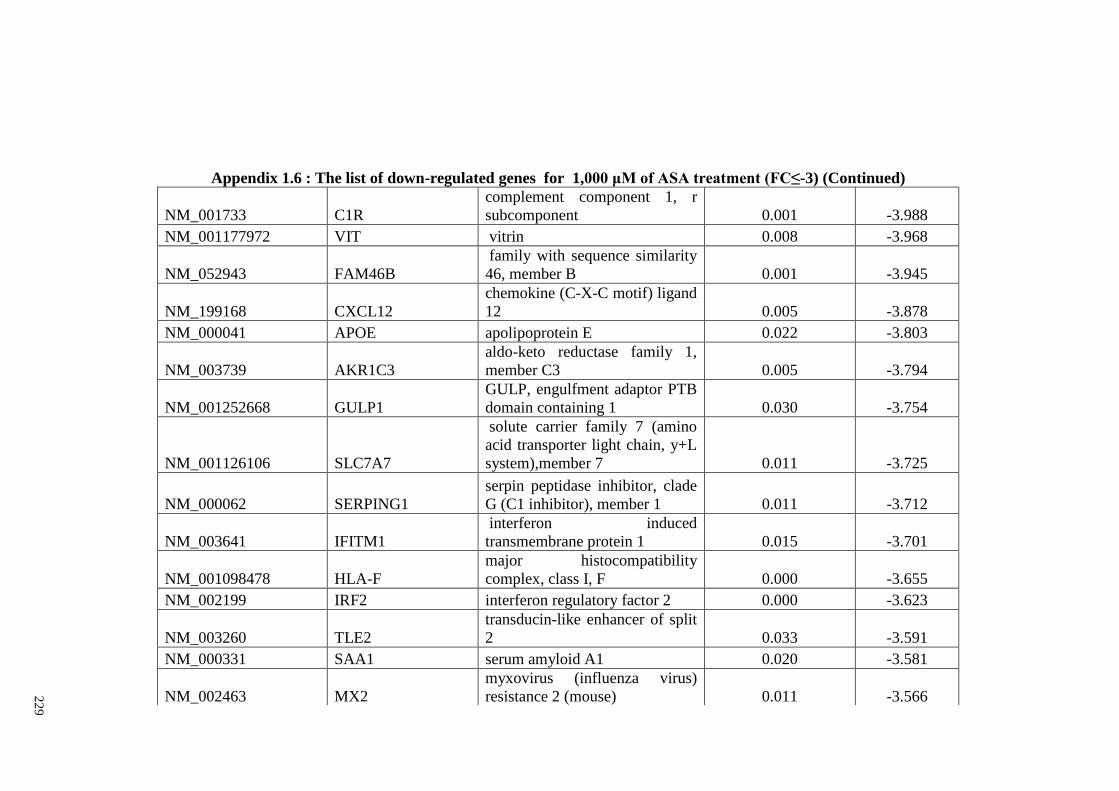
22
9
Appendix 1.6 : The list of down-regulated genes for 1,000 μM of ASA treatment (FC≤-3) (Continued)
NM_001733 C1R
complement component 1, r
subcomponent 0.001 -3.988
NM_001177972 VIT vitrin 0.008 -3.968
NM_052943 FAM46B
family with sequence similarity
46, member B 0.001 -3.945
NM_199168 CXCL12
chemokine (C-X-C motif) ligand
12 0.005 -3.878
NM_000041 APOE apolipoprotein E 0.022 -3.803
NM_003739 AKR1C3
aldo-keto reductase family 1,
member C3 0.005 -3.794
NM_001252668 GULP1
GULP, engulfment adaptor PTB
domain containing 1 0.030 -3.754
NM_001126106 SLC7A7
solute carrier family 7 (amino
acid transporter light chain, y+L
system),member 7 0.011 -3.725
NM_000062 SERPING1
serpin peptidase inhibitor, clade
G (C1 inhibitor), member 1 0.011 -3.712
NM_003641 IFITM1
interferon induced
transmembrane protein 1 0.015 -3.701
NM_001098478 HLA-F
major histocompatibility
complex, class I, F 0.000 -3.655
NM_002199 IRF2 interferon regulatory factor 2 0.000 -3.623
NM_003260 TLE2
transducin-like enhancer of split
2 0.033 -3.591
NM_000331 SAA1 serum amyloid A1 0.020 -3.581
NM_002463 MX2
myxovirus (influenza virus)
resistance 2 (mouse) 0.011 -3.566
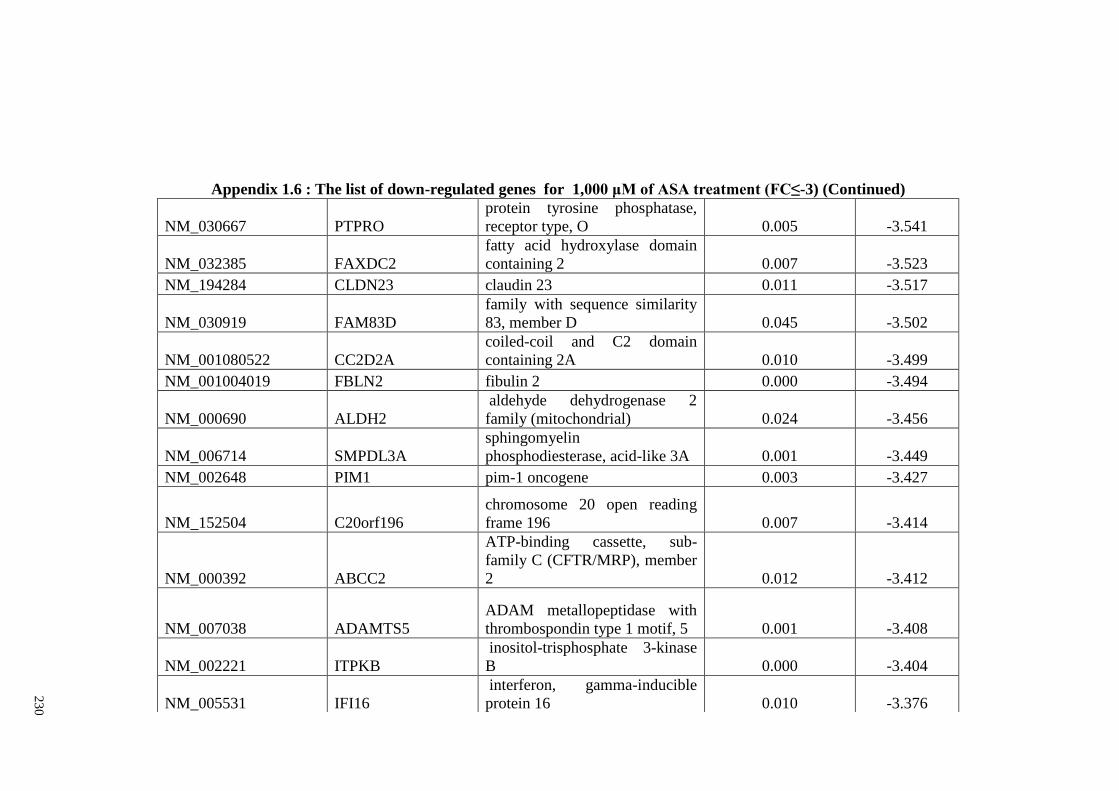
23
0
Appendix 1.6 : The list of down-regulated genes for 1,000 μM of ASA treatment (FC≤-3) (Continued)
NM_030667 PTPRO
protein tyrosine phosphatase,
receptor type, O 0.005 -3.541
NM_032385 FAXDC2
fatty acid hydroxylase domain
containing 2 0.007 -3.523
NM_194284 CLDN23 claudin 23 0.011 -3.517
NM_030919 FAM83D
family with sequence similarity
83, member D 0.045 -3.502
NM_001080522 CC2D2A
coiled-coil and C2 domain
containing 2A 0.010 -3.499
NM_001004019 FBLN2 fibulin 2 0.000 -3.494
NM_000690 ALDH2
aldehyde dehydrogenase 2
family (mitochondrial) 0.024 -3.456
NM_006714 SMPDL3A
sphingomyelin
phosphodiesterase, acid-like 3A 0.001 -3.449
NM_002648 PIM1 pim-1 oncogene 0.003 -3.427
NM_152504 C20orf196
chromosome 20 open reading
frame 196 0.007 -3.414
NM_000392 ABCC2
ATP-binding cassette, sub-
family C (CFTR/MRP), member
2 0.012 -3.412
NM_007038 ADAMTS5
ADAM metallopeptidase with
thrombospondin type 1 motif, 5 0.001 -3.408
NM_002221 ITPKB
inositol-trisphosphate 3-kinase
B 0.000 -3.404
NM_005531 IFI16
interferon, gamma-inducible
protein 16 0.010 -3.376
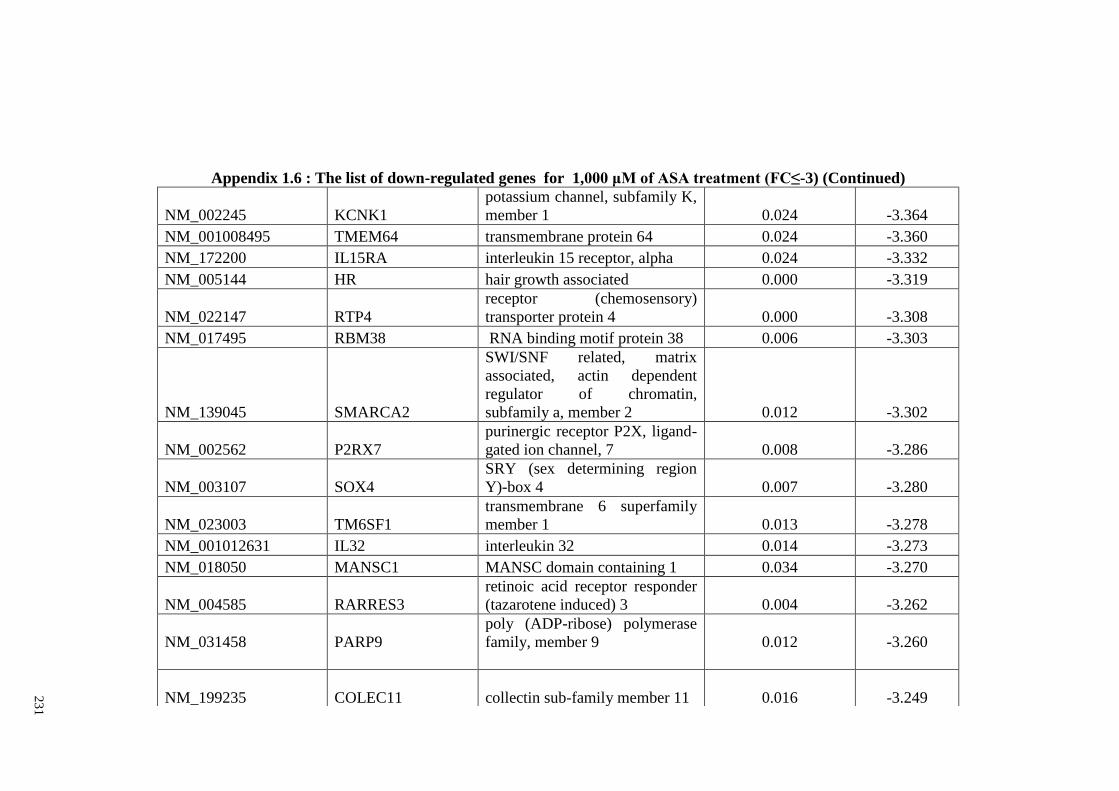
23
1
Appendix 1.6 : The list of down-regulated genes for 1,000 μM of ASA treatment (FC≤-3) (Continued)
NM_002245 KCNK1
potassium channel, subfamily K,
member 1 0.024 -3.364
NM_001008495 TMEM64 transmembrane protein 64 0.024 -3.360
NM_172200 IL15RA interleukin 15 receptor, alpha 0.024 -3.332
NM_005144 HR hair growth associated 0.000 -3.319
NM_022147 RTP4
receptor (chemosensory)
transporter protein 4 0.000 -3.308
NM_017495 RBM38 RNA binding motif protein 38 0.006 -3.303
NM_139045 SMARCA2
SWI/SNF related, matrix
associated, actin dependent
regulator of chromatin,
subfamily a, member 2 0.012 -3.302
NM_002562 P2RX7
purinergic receptor P2X, ligand-
gated ion channel, 7 0.008 -3.286
NM_003107 SOX4
SRY (sex determining region
Y)-box 4 0.007 -3.280
NM_023003 TM6SF1
transmembrane 6 superfamily
member 1 0.013 -3.278
NM_001012631 IL32 interleukin 32 0.014 -3.273
NM_018050 MANSC1 MANSC domain containing 1 0.034 -3.270
NM_004585 RARRES3
retinoic acid receptor responder
(tazarotene induced) 3 0.004 -3.262
NM_031458 PARP9
poly (ADP-ribose) polymerase
family, member 9 0.012 -3.260
NM_199235 COLEC11 collectin sub-family member 11 0.016 -3.249
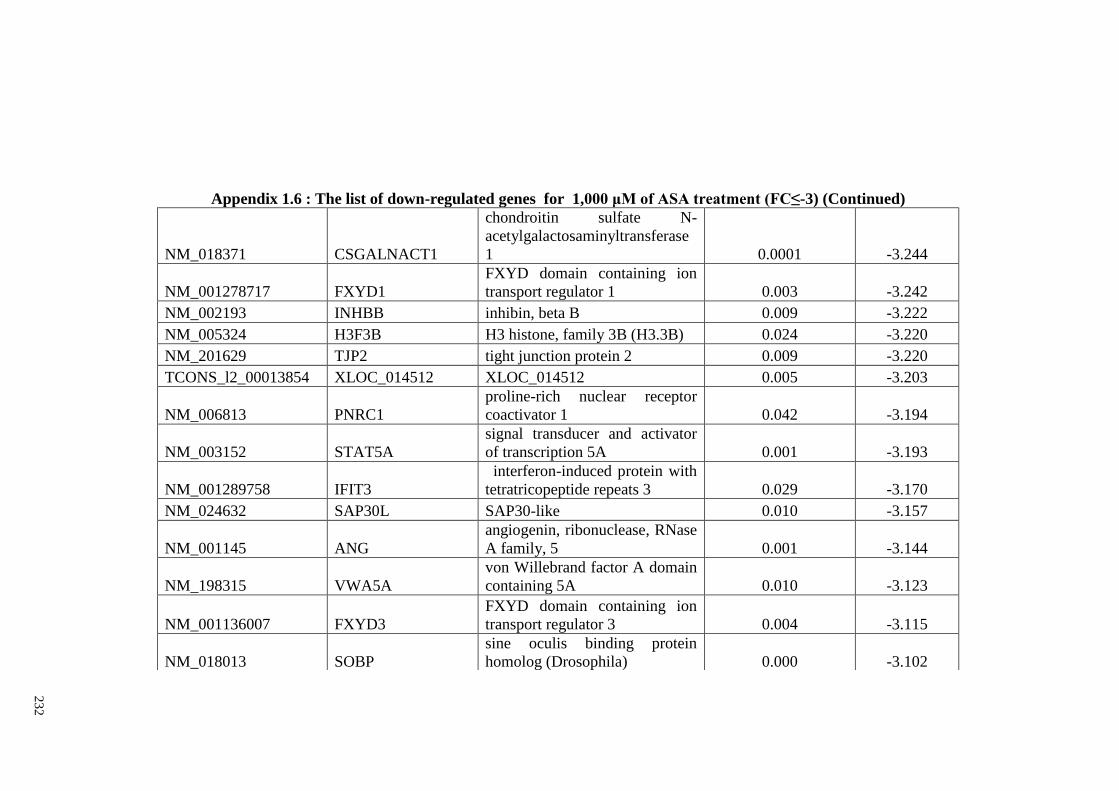
23
2
Appendix 1.6 : The list of down-regulated genes for 1,000 μM of ASA treatment (FC≤-3) (Continued)
NM_018371 CSGALNACT1
chondroitin sulfate N-
acetylgalactosaminyltransferase
1 0.0001 -3.244
NM_001278717 FXYD1
FXYD domain containing ion
transport regulator 1 0.003 -3.242
NM_002193 INHBB inhibin, beta B 0.009 -3.222
NM_005324 H3F3B H3 histone, family 3B (H3.3B) 0.024 -3.220
NM_201629 TJP2 tight junction protein 2 0.009 -3.220
TCONS_l2_00013854 XLOC_014512 XLOC_014512 0.005 -3.203
NM_006813 PNRC1
proline-rich nuclear receptor
coactivator 1 0.042 -3.194
NM_003152 STAT5A
signal transducer and activator
of transcription 5A 0.001 -3.193
NM_001289758 IFIT3
interferon-induced protein with
tetratricopeptide repeats 3 0.029 -3.170
NM_024632 SAP30L SAP30-like 0.010 -3.157
NM_001145 ANG
angiogenin, ribonuclease, RNase
A family, 5 0.001 -3.144
NM_198315 VWA5A
von Willebrand factor A domain
containing 5A 0.010 -3.123
NM_001136007 FXYD3
FXYD domain containing ion
transport regulator 3 0.004 -3.115
NM_018013 SOBP
sine oculis binding protein
homolog (Drosophila) 0.000 -3.102
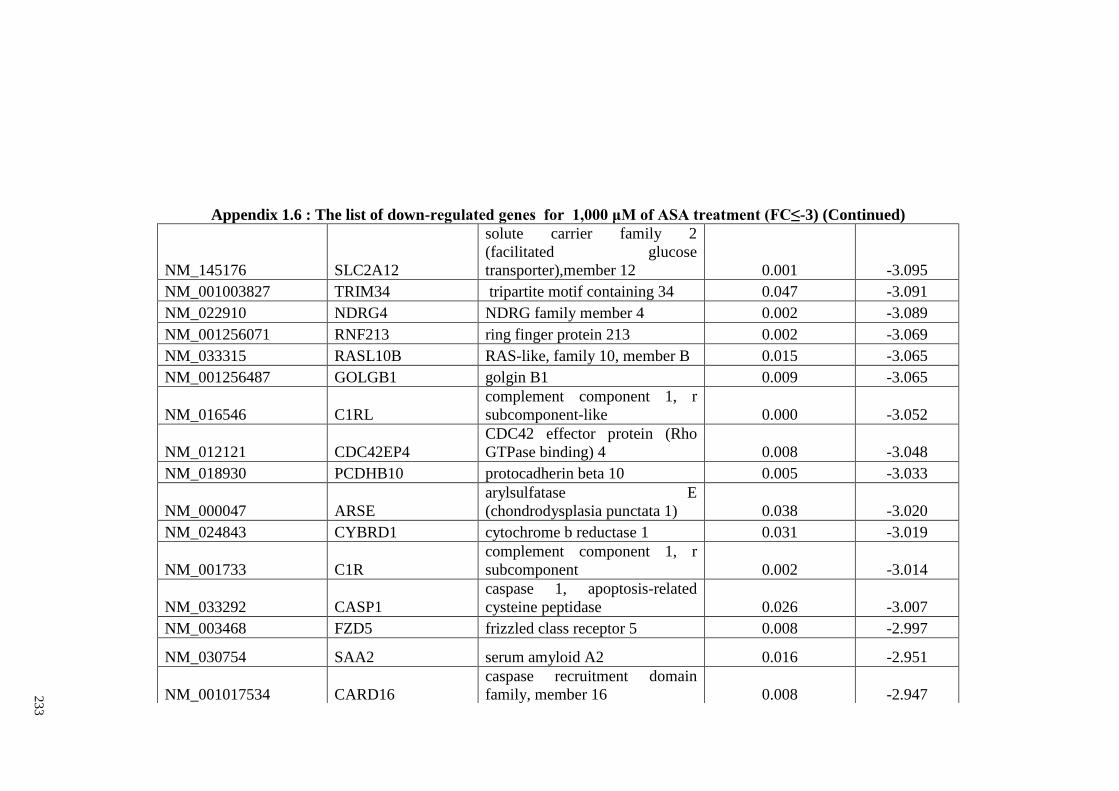
23
3
Appendix 1.6 : The list of down-regulated genes for 1,000 μM of ASA treatment (FC≤-3) (Continued)
NM_145176 SLC2A12
solute carrier family 2
(facilitated glucose
transporter),member 12 0.001 -3.095
NM_001003827 TRIM34 tripartite motif containing 34 0.047 -3.091
NM_022910 NDRG4 NDRG family member 4 0.002 -3.089
NM_001256071 RNF213 ring finger protein 213 0.002 -3.069
NM_033315 RASL10B RAS-like, family 10, member B 0.015 -3.065
NM_001256487 GOLGB1 golgin B1 0.009 -3.065
NM_016546 C1RL
complement component 1, r
subcomponent-like 0.000 -3.052
NM_012121 CDC42EP4
CDC42 effector protein (Rho
GTPase binding) 4 0.008 -3.048
NM_018930 PCDHB10 protocadherin beta 10 0.005 -3.033
NM_000047 ARSE
arylsulfatase E
(chondrodysplasia punctata 1) 0.038 -3.020
NM_024843 CYBRD1 cytochrome b reductase 1 0.031 -3.019
NM_001733 C1R
complement component 1, r
subcomponent 0.002 -3.014
NM_033292 CASP1
caspase 1, apoptosis-related
cysteine peptidase 0.026 -3.007
NM_003468 FZD5 frizzled class receptor 5 0.008 -2.997
NM_030754 SAA2 serum amyloid A2 0.016 -2.951
NM_001017534 CARD16
caspase recruitment domain
family, member 16 0.008 -2.947
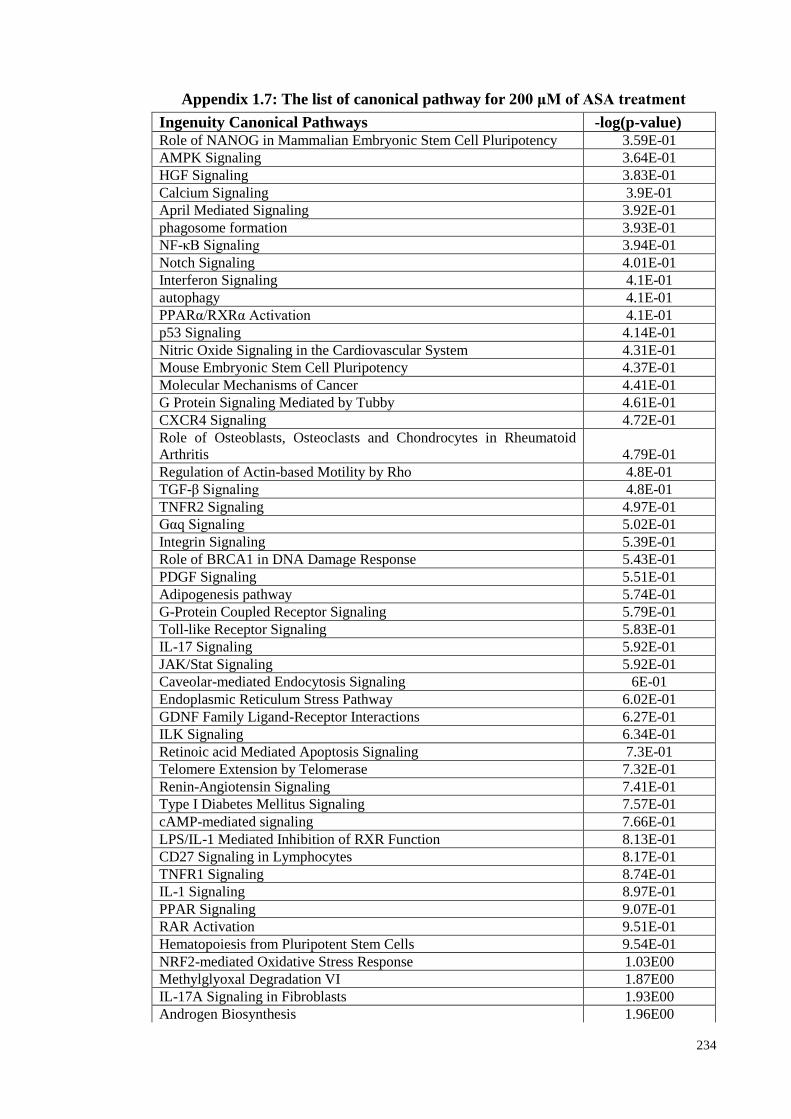
234
Appendix 1.7: The list of canonical pathway for 200 μM of ASA treatment
Ingenuity Canonical Pathways -log(p-value) Role of NANOG in Mammalian Embryonic Stem Cell Pluripotency 3.59E-01
AMPK Signaling 3.64E-01
HGF Signaling 3.83E-01
Calcium Signaling 3.9E-01
April Mediated Signaling 3.92E-01
phagosome formation 3.93E-01
NF-κB Signaling 3.94E-01
Notch Signaling 4.01E-01
Interferon Signaling 4.1E-01
autophagy 4.1E-01
PPARα/RXRα Activation 4.1E-01
p53 Signaling 4.14E-01
Nitric Oxide Signaling in the Cardiovascular System 4.31E-01
Mouse Embryonic Stem Cell Pluripotency 4.37E-01
Molecular Mechanisms of Cancer 4.41E-01
G Protein Signaling Mediated by Tubby 4.61E-01
CXCR4 Signaling 4.72E-01
Role of Osteoblasts, Osteoclasts and Chondrocytes in Rheumatoid
Arthritis 4.79E-01
Regulation of Actin-based Motility by Rho 4.8E-01
TGF-β Signaling 4.8E-01
TNFR2 Signaling 4.97E-01
Gαq Signaling 5.02E-01
Integrin Signaling 5.39E-01
Role of BRCA1 in DNA Damage Response 5.43E-01
PDGF Signaling 5.51E-01
Adipogenesis pathway 5.74E-01
G-Protein Coupled Receptor Signaling 5.79E-01
Toll-like Receptor Signaling 5.83E-01
IL-17 Signaling 5.92E-01
JAK/Stat Signaling 5.92E-01
Caveolar-mediated Endocytosis Signaling 6E-01
Endoplasmic Reticulum Stress Pathway 6.02E-01
GDNF Family Ligand-Receptor Interactions 6.27E-01
ILK Signaling 6.34E-01
Retinoic acid Mediated Apoptosis Signaling 7.3E-01
Telomere Extension by Telomerase 7.32E-01
Renin-Angiotensin Signaling 7.41E-01
Type I Diabetes Mellitus Signaling 7.57E-01
cAMP-mediated signaling 7.66E-01
LPS/IL-1 Mediated Inhibition of RXR Function 8.13E-01
CD27 Signaling in Lymphocytes 8.17E-01
TNFR1 Signaling 8.74E-01
IL-1 Signaling 8.97E-01
PPAR Signaling 9.07E-01
RAR Activation 9.51E-01
Hematopoiesis from Pluripotent Stem Cells 9.54E-01
NRF2-mediated Oxidative Stress Response 1.03E00
Methylglyoxal Degradation VI 1.87E00
IL-17A Signaling in Fibroblasts 1.93E00
Androgen Biosynthesis 1.96E00
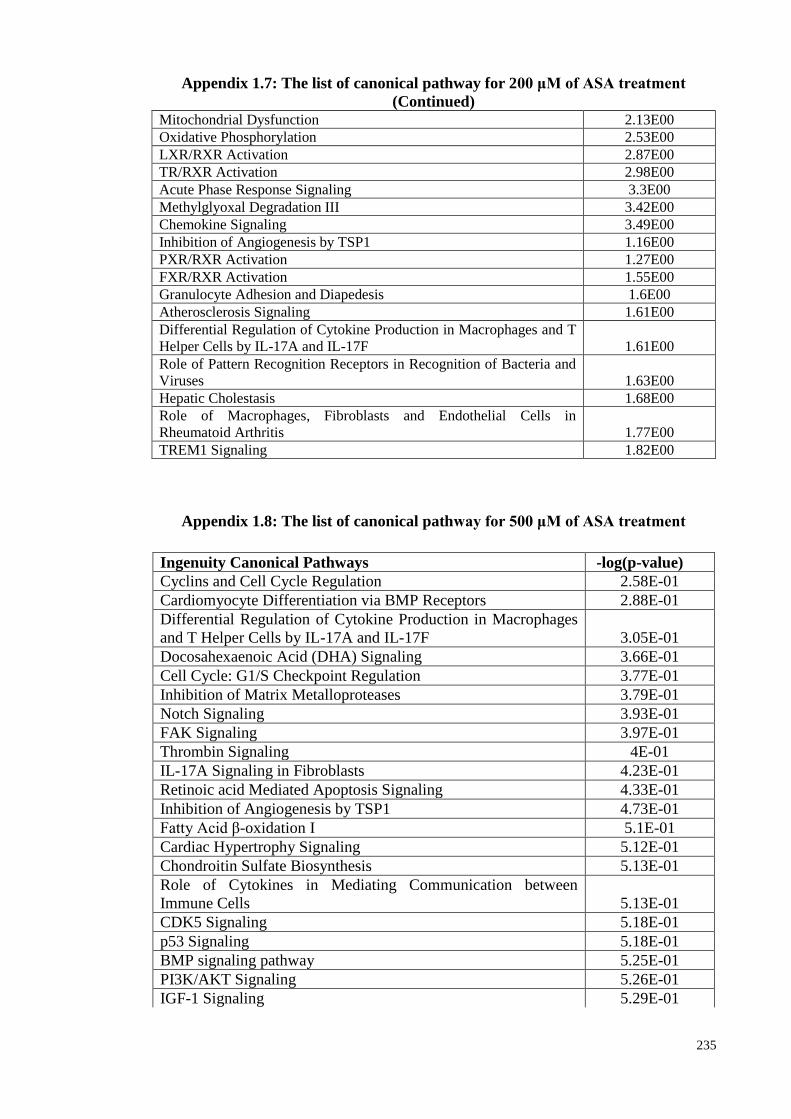
235
Appendix 1.7: The list of canonical pathway for 200 μM of ASA treatment
(Continued) Mitochondrial Dysfunction 2.13E00
Oxidative Phosphorylation 2.53E00
LXR/RXR Activation 2.87E00
TR/RXR Activation 2.98E00
Acute Phase Response Signaling 3.3E00
Methylglyoxal Degradation III 3.42E00
Chemokine Signaling 3.49E00
Inhibition of Angiogenesis by TSP1 1.16E00
PXR/RXR Activation 1.27E00
FXR/RXR Activation 1.55E00
Granulocyte Adhesion and Diapedesis 1.6E00
Atherosclerosis Signaling 1.61E00
Differential Regulation of Cytokine Production in Macrophages and T
Helper Cells by IL-17A and IL-17F 1.61E00
Role of Pattern Recognition Receptors in Recognition of Bacteria and
Viruses 1.63E00
Hepatic Cholestasis 1.68E00
Role of Macrophages, Fibroblasts and Endothelial Cells in
Rheumatoid Arthritis 1.77E00
TREM1 Signaling 1.82E00
Appendix 1.8: The list of canonical pathway for 500 μM of ASA treatment
Ingenuity Canonical Pathways -log(p-value)
Cyclins and Cell Cycle Regulation 2.58E-01
Cardiomyocyte Differentiation via BMP Receptors 2.88E-01
Differential Regulation of Cytokine Production in Macrophages
and T Helper Cells by IL-17A and IL-17F 3.05E-01
Docosahexaenoic Acid (DHA) Signaling 3.66E-01
Cell Cycle: G1/S Checkpoint Regulation 3.77E-01
Inhibition of Matrix Metalloproteases 3.79E-01
Notch Signaling 3.93E-01
FAK Signaling 3.97E-01
Thrombin Signaling 4E-01
IL-17A Signaling in Fibroblasts 4.23E-01
Retinoic acid Mediated Apoptosis Signaling 4.33E-01
Inhibition of Angiogenesis by TSP1 4.73E-01
Fatty Acid β-oxidation I 5.1E-01
Cardiac Hypertrophy Signaling 5.12E-01
Chondroitin Sulfate Biosynthesis 5.13E-01
Role of Cytokines in Mediating Communication between
Immune Cells 5.13E-01
CDK5 Signaling 5.18E-01
p53 Signaling 5.18E-01
BMP signaling pathway 5.25E-01
PI3K/AKT Signaling 5.26E-01
IGF-1 Signaling 5.29E-01
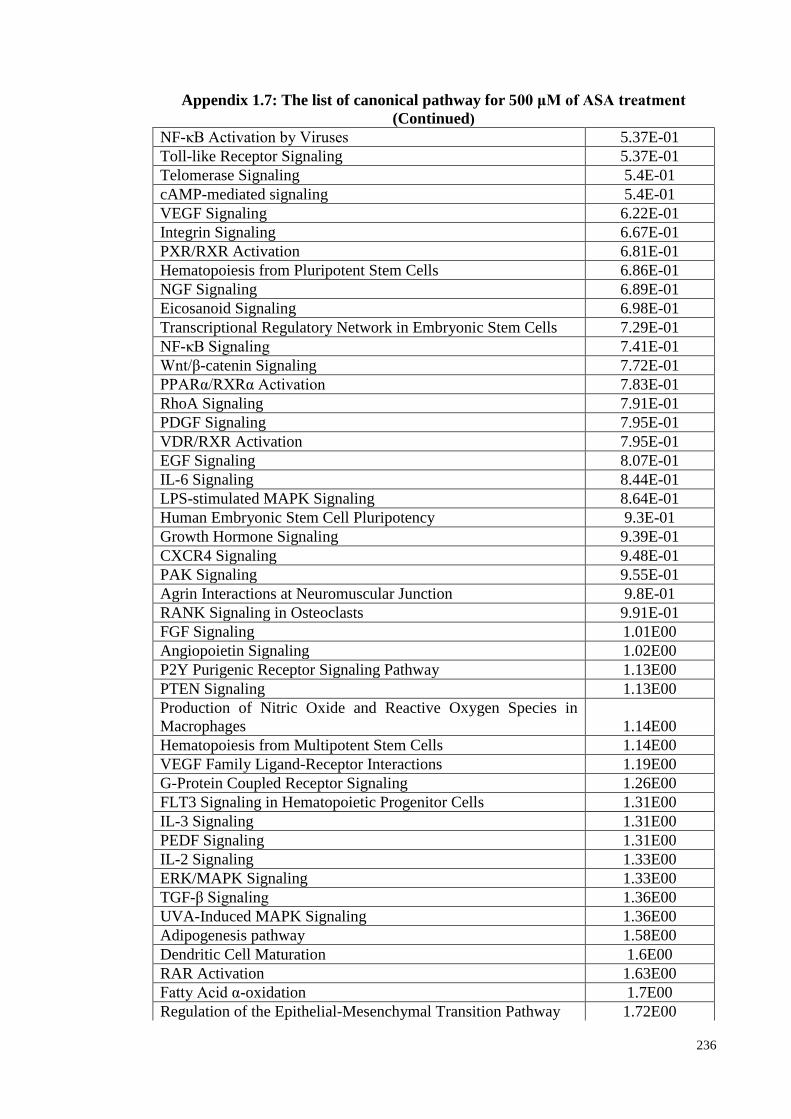
236
Appendix 1.7: The list of canonical pathway for 500 μM of ASA treatment
(Continued)
NF-κB Activation by Viruses 5.37E-01
Toll-like Receptor Signaling 5.37E-01
Telomerase Signaling 5.4E-01
cAMP-mediated signaling 5.4E-01
VEGF Signaling 6.22E-01
Integrin Signaling 6.67E-01
PXR/RXR Activation 6.81E-01
Hematopoiesis from Pluripotent Stem Cells 6.86E-01
NGF Signaling 6.89E-01
Eicosanoid Signaling 6.98E-01
Transcriptional Regulatory Network in Embryonic Stem Cells 7.29E-01
NF-κB Signaling 7.41E-01
Wnt/β-catenin Signaling 7.72E-01
PPARα/RXRα Activation 7.83E-01
RhoA Signaling 7.91E-01
PDGF Signaling 7.95E-01
VDR/RXR Activation 7.95E-01
EGF Signaling 8.07E-01
IL-6 Signaling 8.44E-01
LPS-stimulated MAPK Signaling 8.64E-01
Human Embryonic Stem Cell Pluripotency 9.3E-01
Growth Hormone Signaling 9.39E-01
CXCR4 Signaling 9.48E-01
PAK Signaling 9.55E-01
Agrin Interactions at Neuromuscular Junction 9.8E-01
RANK Signaling in Osteoclasts 9.91E-01
FGF Signaling 1.01E00
Angiopoietin Signaling 1.02E00
P2Y Purigenic Receptor Signaling Pathway 1.13E00
PTEN Signaling 1.13E00
Production of Nitric Oxide and Reactive Oxygen Species in
Macrophages 1.14E00
Hematopoiesis from Multipotent Stem Cells 1.14E00
VEGF Family Ligand-Receptor Interactions 1.19E00
G-Protein Coupled Receptor Signaling 1.26E00
FLT3 Signaling in Hematopoietic Progenitor Cells 1.31E00
IL-3 Signaling 1.31E00
PEDF Signaling 1.31E00
IL-2 Signaling 1.33E00
ERK/MAPK Signaling 1.33E00
TGF-β Signaling 1.36E00
UVA-Induced MAPK Signaling 1.36E00
Adipogenesis pathway 1.58E00
Dendritic Cell Maturation 1.6E00
RAR Activation 1.63E00
Fatty Acid α-oxidation 1.7E00
Regulation of the Epithelial-Mesenchymal Transition Pathway 1.72E00
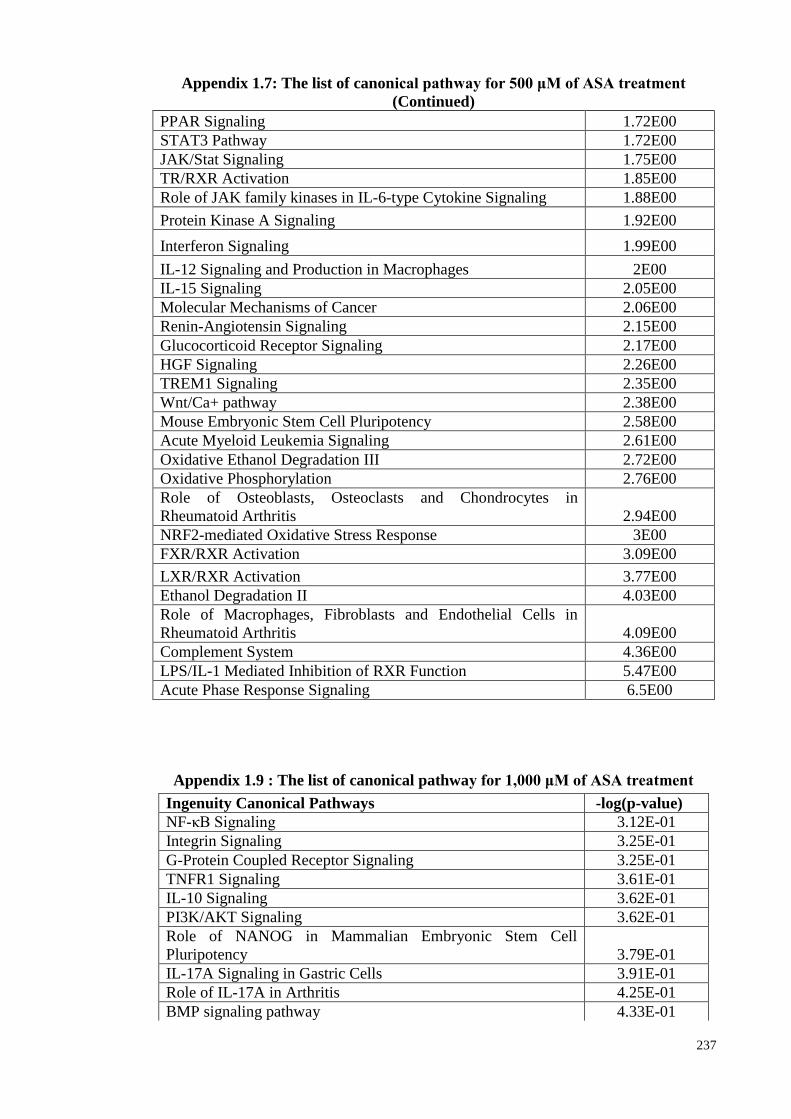
237
Appendix 1.7: The list of canonical pathway for 500 μM of ASA treatment
(Continued)
PPAR Signaling 1.72E00
STAT3 Pathway 1.72E00
JAK/Stat Signaling 1.75E00
TR/RXR Activation 1.85E00
Role of JAK family kinases in IL-6-type Cytokine Signaling 1.88E00
Protein Kinase A Signaling 1.92E00
Interferon Signaling 1.99E00
IL-12 Signaling and Production in Macrophages 2E00
IL-15 Signaling 2.05E00
Molecular Mechanisms of Cancer 2.06E00
Renin-Angiotensin Signaling 2.15E00
Glucocorticoid Receptor Signaling 2.17E00
HGF Signaling 2.26E00
TREM1 Signaling 2.35E00
Wnt/Ca+ pathway 2.38E00
Mouse Embryonic Stem Cell Pluripotency 2.58E00
Acute Myeloid Leukemia Signaling 2.61E00
Oxidative Ethanol Degradation III 2.72E00
Oxidative Phosphorylation 2.76E00
Role of Osteoblasts, Osteoclasts and Chondrocytes in
Rheumatoid Arthritis 2.94E00
NRF2-mediated Oxidative Stress Response 3E00
FXR/RXR Activation 3.09E00
LXR/RXR Activation 3.77E00
Ethanol Degradation II 4.03E00
Role of Macrophages, Fibroblasts and Endothelial Cells in
Rheumatoid Arthritis 4.09E00
Complement System 4.36E00
LPS/IL-1 Mediated Inhibition of RXR Function 5.47E00
Acute Phase Response Signaling 6.5E00
Appendix 1.9 : The list of canonical pathway for 1,000 μM of ASA treatment
Ingenuity Canonical Pathways -log(p-value)
NF-κB Signaling 3.12E-01
Integrin Signaling 3.25E-01
G-Protein Coupled Receptor Signaling 3.25E-01
TNFR1 Signaling 3.61E-01
IL-10 Signaling 3.62E-01
PI3K/AKT Signaling 3.62E-01
Role of NANOG in Mammalian Embryonic Stem Cell
Pluripotency 3.79E-01
IL-17A Signaling in Gastric Cells 3.91E-01
Role of IL-17A in Arthritis 4.25E-01
BMP signaling pathway 4.33E-01
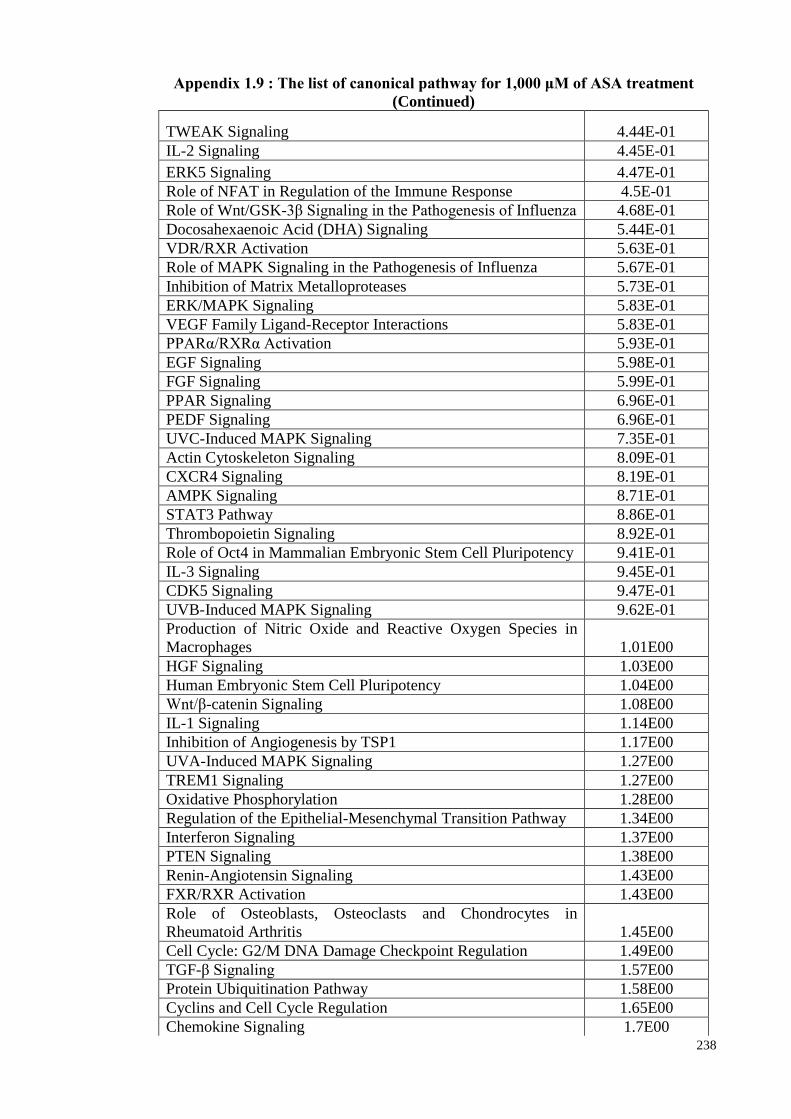
238
Appendix 1.9 : The list of canonical pathway for 1,000 μM of ASA treatment
(Continued)
TWEAK Signaling 4.44E-01
IL-2 Signaling 4.45E-01
ERK5 Signaling 4.47E-01
Role of NFAT in Regulation of the Immune Response 4.5E-01
Role of Wnt/GSK-3β Signaling in the Pathogenesis of Influenza 4.68E-01
Docosahexaenoic Acid (DHA) Signaling 5.44E-01
VDR/RXR Activation 5.63E-01
Role of MAPK Signaling in the Pathogenesis of Influenza 5.67E-01
Inhibition of Matrix Metalloproteases 5.73E-01
ERK/MAPK Signaling 5.83E-01
VEGF Family Ligand-Receptor Interactions 5.83E-01
PPARα/RXRα Activation 5.93E-01
EGF Signaling 5.98E-01
FGF Signaling 5.99E-01
PPAR Signaling 6.96E-01
PEDF Signaling 6.96E-01
UVC-Induced MAPK Signaling 7.35E-01
Actin Cytoskeleton Signaling 8.09E-01
CXCR4 Signaling 8.19E-01
AMPK Signaling 8.71E-01
STAT3 Pathway 8.86E-01
Thrombopoietin Signaling 8.92E-01
Role of Oct4 in Mammalian Embryonic Stem Cell Pluripotency 9.41E-01
IL-3 Signaling 9.45E-01
CDK5 Signaling 9.47E-01
UVB-Induced MAPK Signaling 9.62E-01
Production of Nitric Oxide and Reactive Oxygen Species in
Macrophages 1.01E00
HGF Signaling 1.03E00
Human Embryonic Stem Cell Pluripotency 1.04E00
Wnt/β-catenin Signaling 1.08E00
IL-1 Signaling 1.14E00
Inhibition of Angiogenesis by TSP1 1.17E00
UVA-Induced MAPK Signaling 1.27E00
TREM1 Signaling 1.27E00
Oxidative Phosphorylation 1.28E00
Regulation of the Epithelial-Mesenchymal Transition Pathway 1.34E00
Interferon Signaling 1.37E00
PTEN Signaling 1.38E00
Renin-Angiotensin Signaling 1.43E00
FXR/RXR Activation 1.43E00
Role of Osteoblasts, Osteoclasts and Chondrocytes in
Rheumatoid Arthritis 1.45E00
Cell Cycle: G2/M DNA Damage Checkpoint Regulation 1.49E00
TGF-β Signaling 1.57E00
Protein Ubiquitination Pathway 1.58E00
Cyclins and Cell Cycle Regulation 1.65E00
Chemokine Signaling 1.7E00
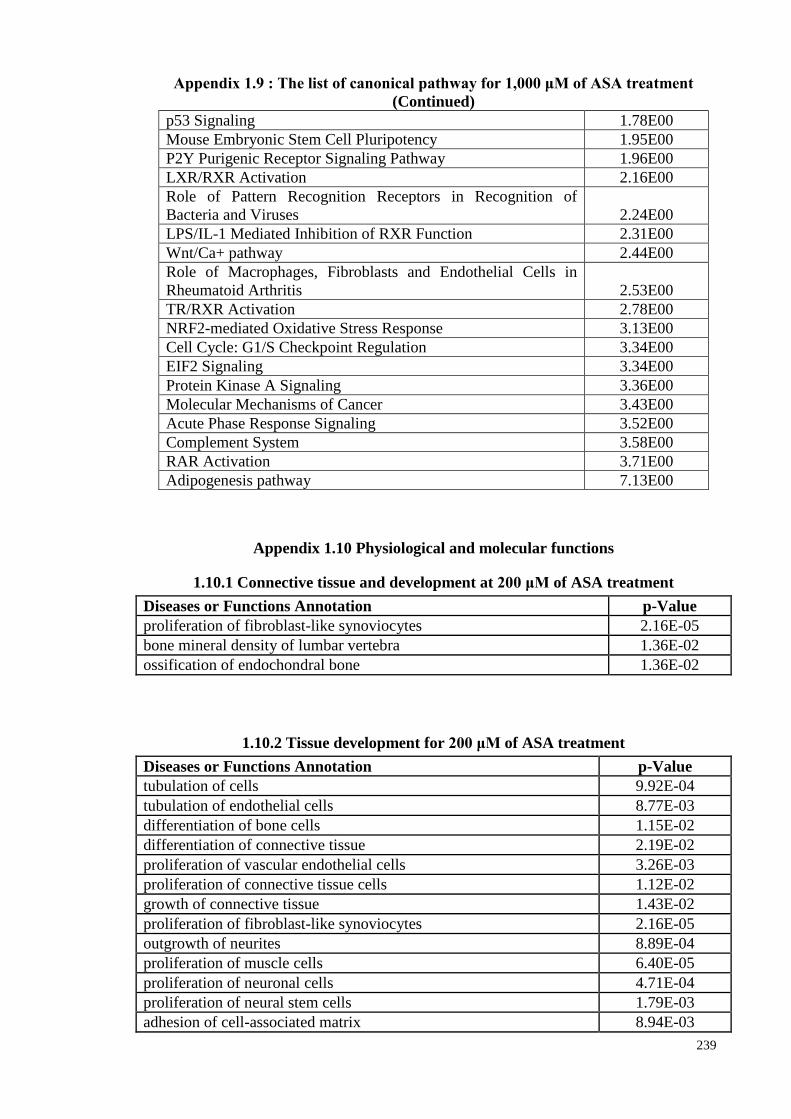
239
Appendix 1.9 : The list of canonical pathway for 1,000 μM of ASA treatment
(Continued)
p53 Signaling 1.78E00
Mouse Embryonic Stem Cell Pluripotency 1.95E00
P2Y Purigenic Receptor Signaling Pathway 1.96E00
LXR/RXR Activation 2.16E00
Role of Pattern Recognition Receptors in Recognition of
Bacteria and Viruses 2.24E00
LPS/IL-1 Mediated Inhibition of RXR Function 2.31E00
Wnt/Ca+ pathway 2.44E00
Role of Macrophages, Fibroblasts and Endothelial Cells in
Rheumatoid Arthritis 2.53E00
TR/RXR Activation 2.78E00
NRF2-mediated Oxidative Stress Response 3.13E00
Cell Cycle: G1/S Checkpoint Regulation 3.34E00
EIF2 Signaling 3.34E00
Protein Kinase A Signaling 3.36E00
Molecular Mechanisms of Cancer 3.43E00
Acute Phase Response Signaling 3.52E00
Complement System 3.58E00
RAR Activation 3.71E00
Adipogenesis pathway 7.13E00
Appendix 1.10 Physiological and molecular functions
1.10.1 Connective tissue and development at 200 μM of ASA treatment
Diseases or Functions Annotation p-Value
proliferation of fibroblast-like synoviocytes 2.16E-05
bone mineral density of lumbar vertebra 1.36E-02
ossification of endochondral bone 1.36E-02
1.10.2 Tissue development for 200 μM of ASA treatment
Diseases or Functions Annotation p-Value
tubulation of cells 9.92E-04
tubulation of endothelial cells 8.77E-03
differentiation of bone cells 1.15E-02
differentiation of connective tissue 2.19E-02
proliferation of vascular endothelial cells 3.26E-03
proliferation of connective tissue cells 1.12E-02
growth of connective tissue 1.43E-02
proliferation of fibroblast-like synoviocytes 2.16E-05
outgrowth of neurites 8.89E-04
proliferation of muscle cells 6.40E-05
proliferation of neuronal cells 4.71E-04
proliferation of neural stem cells 1.79E-03
adhesion of cell-associated matrix 8.94E-03
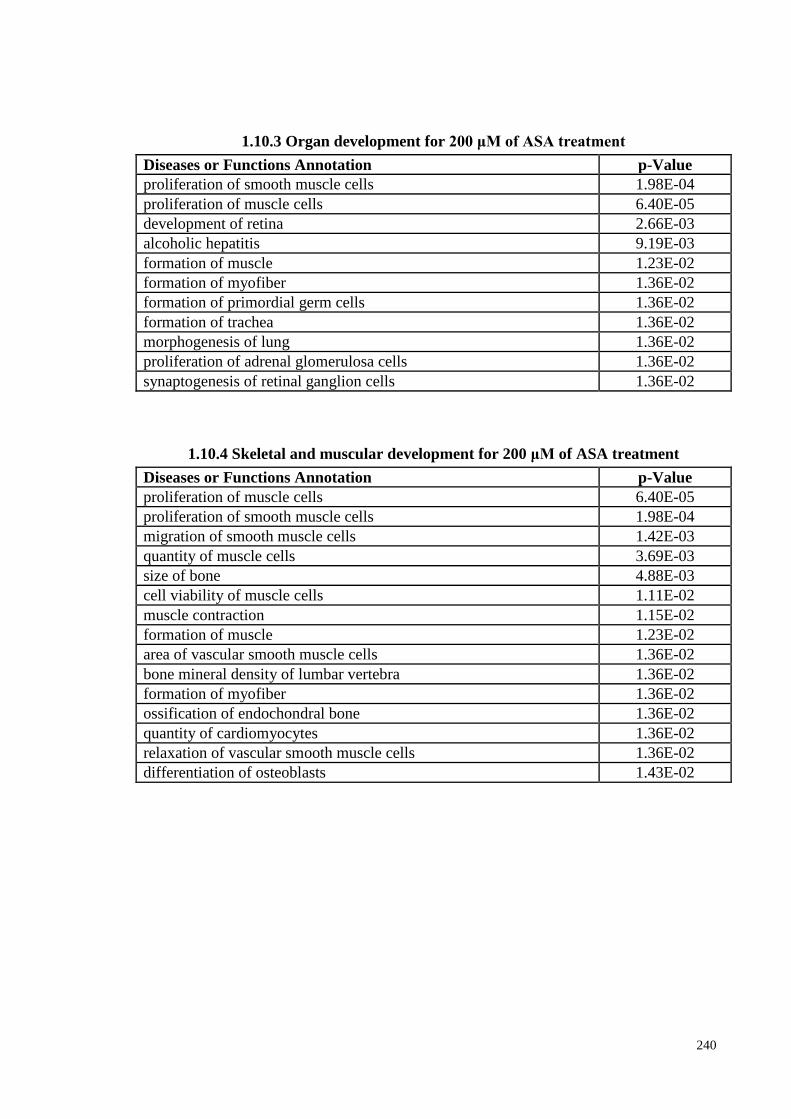
240
1.10.3 Organ development for 200 μM of ASA treatment
Diseases or Functions Annotation p-Value
proliferation of smooth muscle cells 1.98E-04
proliferation of muscle cells 6.40E-05
development of retina 2.66E-03
alcoholic hepatitis 9.19E-03
formation of muscle 1.23E-02
formation of myofiber 1.36E-02
formation of primordial germ cells 1.36E-02
formation of trachea 1.36E-02
morphogenesis of lung 1.36E-02
proliferation of adrenal glomerulosa cells 1.36E-02
synaptogenesis of retinal ganglion cells 1.36E-02
1.10.4 Skeletal and muscular development for 200 μM of ASA treatment
Diseases or Functions Annotation p-Value
proliferation of muscle cells 6.40E-05
proliferation of smooth muscle cells 1.98E-04
migration of smooth muscle cells 1.42E-03
quantity of muscle cells 3.69E-03
size of bone 4.88E-03
cell viability of muscle cells 1.11E-02
muscle contraction 1.15E-02
formation of muscle 1.23E-02
area of vascular smooth muscle cells 1.36E-02
bone mineral density of lumbar vertebra 1.36E-02
formation of myofiber 1.36E-02
ossification of endochondral bone 1.36E-02
quantity of cardiomyocytes 1.36E-02
relaxation of vascular smooth muscle cells 1.36E-02
differentiation of osteoblasts 1.43E-02
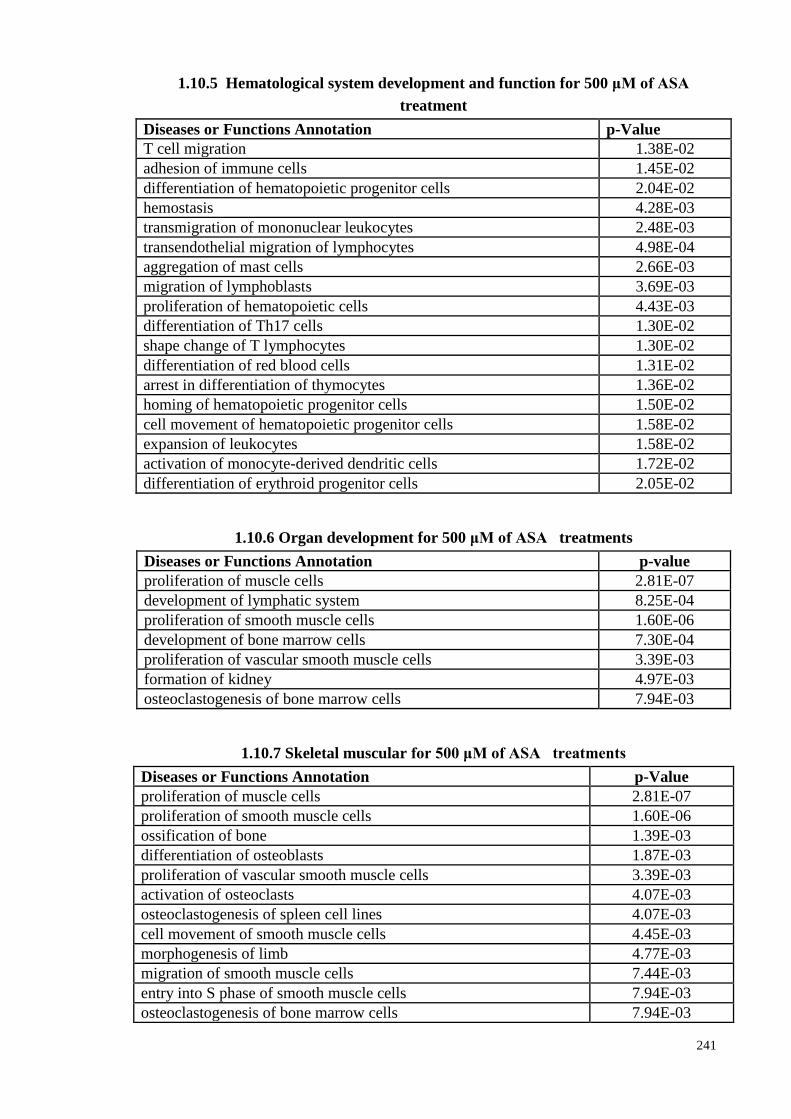
241
1.10.5 Hematological system development and function for 500 μM of ASA
treatment
Diseases or Functions Annotation p-Value
T cell migration 1.38E-02
adhesion of immune cells 1.45E-02
differentiation of hematopoietic progenitor cells 2.04E-02
hemostasis 4.28E-03
transmigration of mononuclear leukocytes 2.48E-03
transendothelial migration of lymphocytes 4.98E-04
aggregation of mast cells 2.66E-03
migration of lymphoblasts 3.69E-03
proliferation of hematopoietic cells 4.43E-03
differentiation of Th17 cells 1.30E-02
shape change of T lymphocytes 1.30E-02
differentiation of red blood cells 1.31E-02
arrest in differentiation of thymocytes 1.36E-02
homing of hematopoietic progenitor cells 1.50E-02
cell movement of hematopoietic progenitor cells 1.58E-02
expansion of leukocytes 1.58E-02
activation of monocyte-derived dendritic cells 1.72E-02
differentiation of erythroid progenitor cells 2.05E-02
1.10.6 Organ development for 500 μM of ASA treatments
Diseases or Functions Annotation p-value
proliferation of muscle cells 2.81E-07
development of lymphatic system 8.25E-04
proliferation of smooth muscle cells 1.60E-06
development of bone marrow cells 7.30E-04
proliferation of vascular smooth muscle cells 3.39E-03
formation of kidney 4.97E-03
osteoclastogenesis of bone marrow cells 7.94E-03
1.10.7 Skeletal muscular for 500 μM of ASA treatments
Diseases or Functions Annotation p-Value
proliferation of muscle cells 2.81E-07
proliferation of smooth muscle cells 1.60E-06
ossification of bone 1.39E-03
differentiation of osteoblasts 1.87E-03
proliferation of vascular smooth muscle cells 3.39E-03
activation of osteoclasts 4.07E-03
osteoclastogenesis of spleen cell lines 4.07E-03
cell movement of smooth muscle cells 4.45E-03
morphogenesis of limb 4.77E-03
migration of smooth muscle cells 7.44E-03
entry into S phase of smooth muscle cells 7.94E-03
osteoclastogenesis of bone marrow cells 7.94E-03
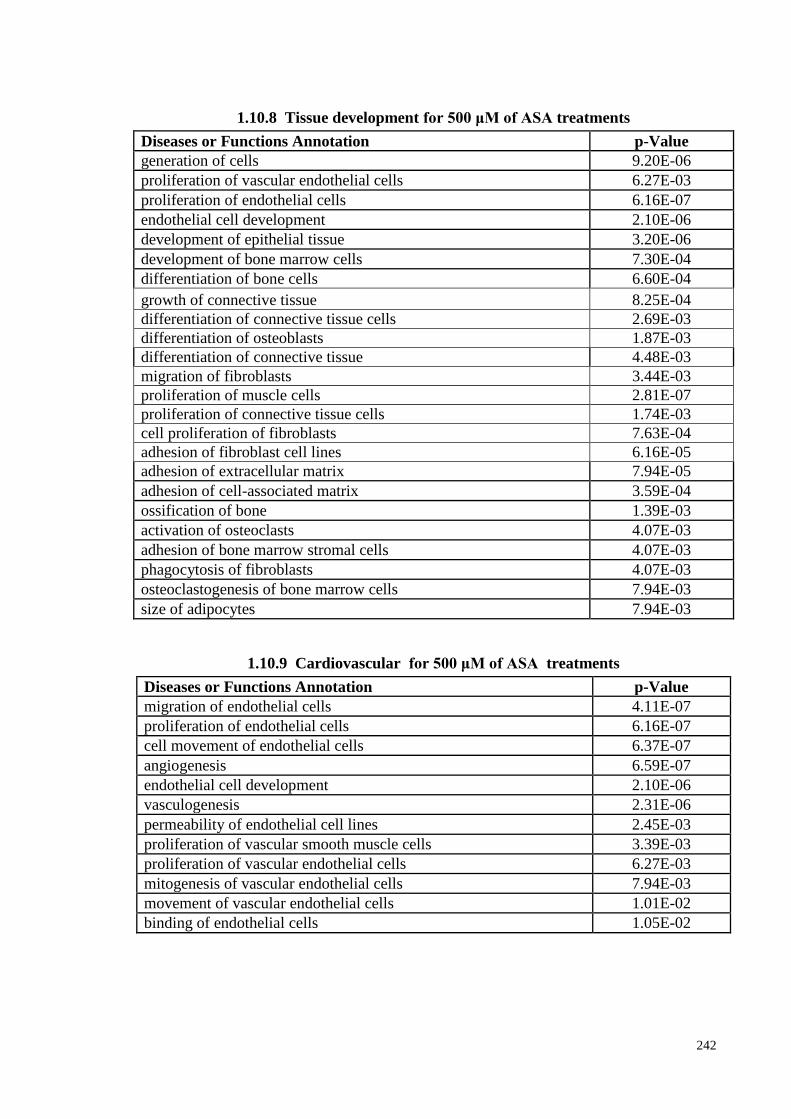
242
1.10.8 Tissue development for 500 μM of ASA treatments
Diseases or Functions Annotation p-Value
generation of cells 9.20E-06
proliferation of vascular endothelial cells 6.27E-03
proliferation of endothelial cells 6.16E-07
endothelial cell development 2.10E-06
development of epithelial tissue 3.20E-06
development of bone marrow cells 7.30E-04
differentiation of bone cells 6.60E-04
growth of connective tissue 8.25E-04
differentiation of connective tissue cells 2.69E-03
differentiation of osteoblasts 1.87E-03
differentiation of connective tissue 4.48E-03
migration of fibroblasts 3.44E-03
proliferation of muscle cells 2.81E-07
proliferation of connective tissue cells 1.74E-03
cell proliferation of fibroblasts 7.63E-04
adhesion of fibroblast cell lines 6.16E-05
adhesion of extracellular matrix 7.94E-05
adhesion of cell-associated matrix 3.59E-04
ossification of bone 1.39E-03
activation of osteoclasts 4.07E-03
adhesion of bone marrow stromal cells 4.07E-03
phagocytosis of fibroblasts 4.07E-03
osteoclastogenesis of bone marrow cells 7.94E-03
size of adipocytes 7.94E-03
1.10.9 Cardiovascular for 500 μM of ASA treatments
Diseases or Functions Annotation p-Value
migration of endothelial cells 4.11E-07
proliferation of endothelial cells 6.16E-07
cell movement of endothelial cells 6.37E-07
angiogenesis 6.59E-07
endothelial cell development 2.10E-06
vasculogenesis 2.31E-06
permeability of endothelial cell lines 2.45E-03
proliferation of vascular smooth muscle cells 3.39E-03
proliferation of vascular endothelial cells 6.27E-03
mitogenesis of vascular endothelial cells 7.94E-03
movement of vascular endothelial cells 1.01E-02
binding of endothelial cells 1.05E-02
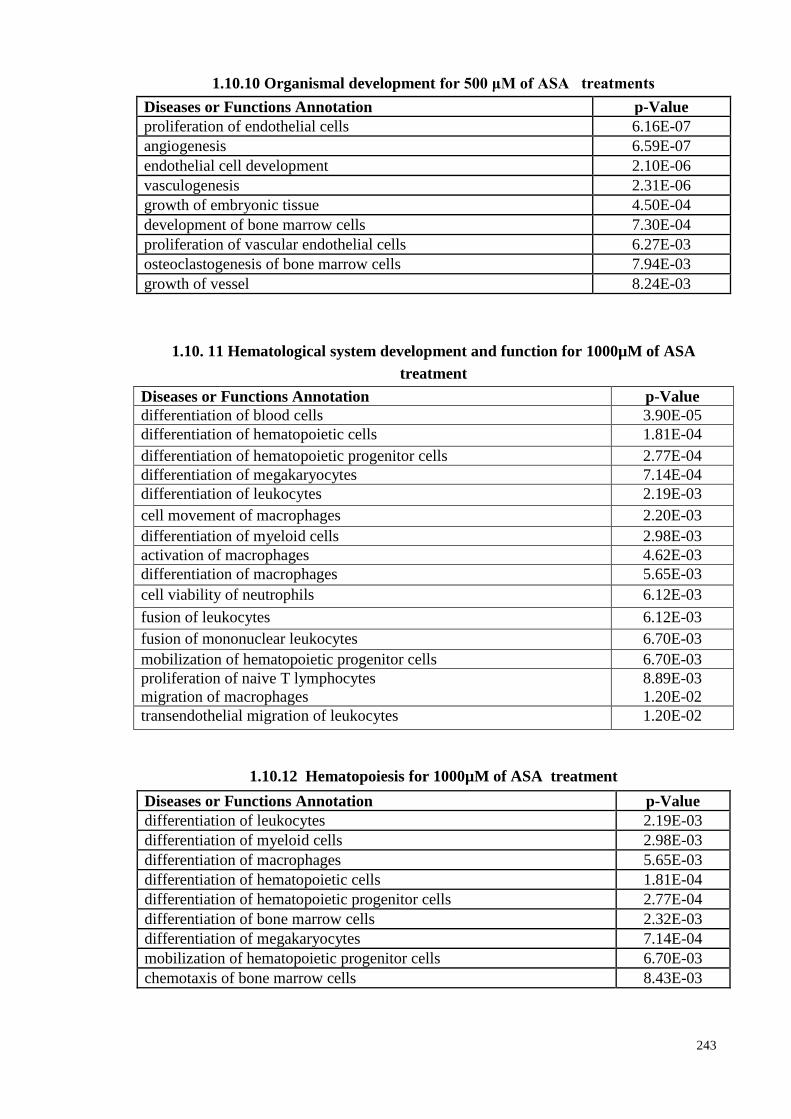
243
1.10.10 Organismal development for 500 μM of ASA treatments
Diseases or Functions Annotation p-Value
proliferation of endothelial cells 6.16E-07
angiogenesis 6.59E-07
endothelial cell development 2.10E-06
vasculogenesis 2.31E-06
growth of embryonic tissue 4.50E-04
development of bone marrow cells 7.30E-04
proliferation of vascular endothelial cells 6.27E-03
osteoclastogenesis of bone marrow cells 7.94E-03
growth of vessel 8.24E-03
1.10. 11 Hematological system development and function for 1000µM of ASA
treatment
Diseases or Functions Annotation p-Value
differentiation of blood cells 3.90E-05
differentiation of hematopoietic cells 1.81E-04
differentiation of hematopoietic progenitor cells 2.77E-04
differentiation of megakaryocytes 7.14E-04
differentiation of leukocytes 2.19E-03
cell movement of macrophages 2.20E-03
differentiation of myeloid cells 2.98E-03
activation of macrophages 4.62E-03
differentiation of macrophages 5.65E-03
cell viability of neutrophils 6.12E-03
fusion of leukocytes 6.12E-03
fusion of mononuclear leukocytes 6.70E-03
mobilization of hematopoietic progenitor cells 6.70E-03
proliferation of naive T lymphocytes
migration of macrophages
8.89E-03
1.20E-02
transendothelial migration of leukocytes 1.20E-02
1.10.12 Hematopoiesis for 1000µM of ASA treatment
Diseases or Functions Annotation p-Value
differentiation of leukocytes 2.19E-03
differentiation of myeloid cells 2.98E-03
differentiation of macrophages 5.65E-03
differentiation of hematopoietic cells 1.81E-04
differentiation of hematopoietic progenitor cells 2.77E-04
differentiation of bone marrow cells 2.32E-03
differentiation of megakaryocytes 7.14E-04
mobilization of hematopoietic progenitor cells 6.70E-03
chemotaxis of bone marrow cells 8.43E-03
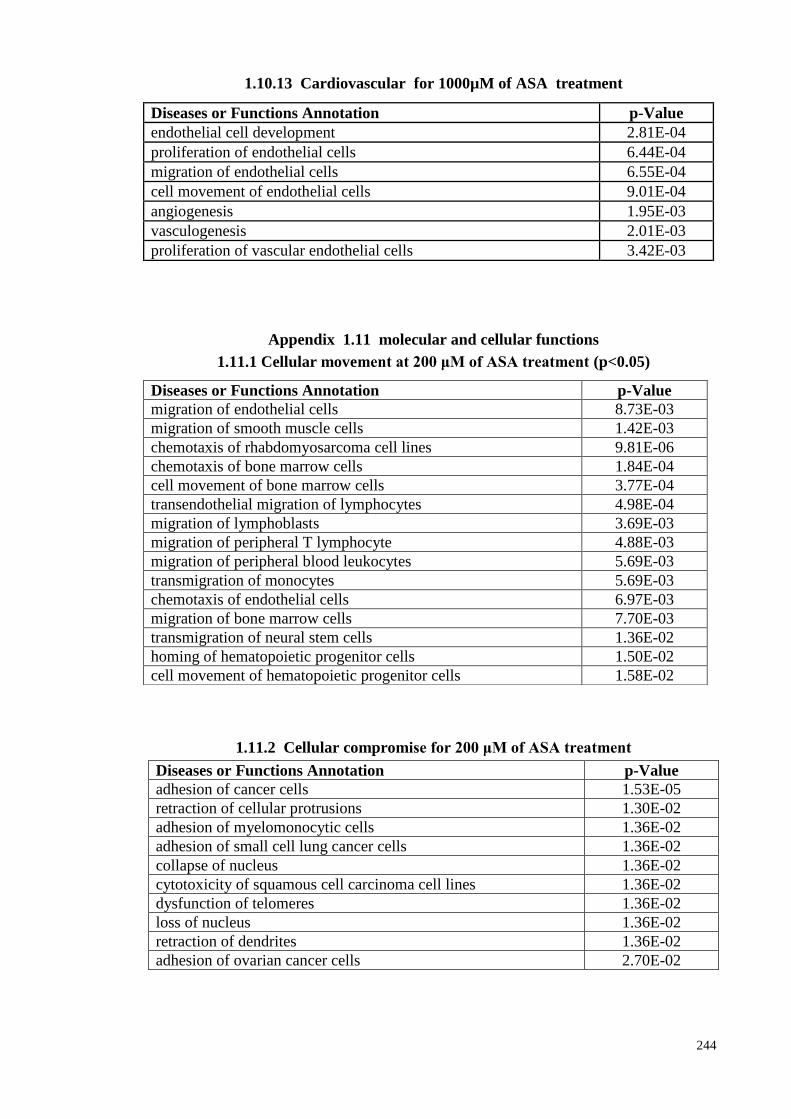
244
1.10.13 Cardiovascular for 1000µM of ASA treatment
Appendix 1.11 molecular and cellular functions
1.11.1 Cellular movement at 200 μM of ASA treatment (p<0.05)
1.11.2 Cellular compromise for 200 μM of ASA treatment
Diseases or Functions Annotation p-Value
adhesion of cancer cells 1.53E-05
retraction of cellular protrusions 1.30E-02
adhesion of myelomonocytic cells 1.36E-02
adhesion of small cell lung cancer cells 1.36E-02
collapse of nucleus 1.36E-02
cytotoxicity of squamous cell carcinoma cell lines 1.36E-02
dysfunction of telomeres 1.36E-02
loss of nucleus 1.36E-02
retraction of dendrites 1.36E-02
adhesion of ovarian cancer cells 2.70E-02
Diseases or Functions Annotation p-Value
endothelial cell development 2.81E-04
proliferation of endothelial cells 6.44E-04
migration of endothelial cells 6.55E-04
cell movement of endothelial cells 9.01E-04
angiogenesis 1.95E-03
vasculogenesis 2.01E-03
proliferation of vascular endothelial cells 3.42E-03
Diseases or Functions Annotation p-Value
migration of endothelial cells 8.73E-03
migration of smooth muscle cells 1.42E-03
chemotaxis of rhabdomyosarcoma cell lines 9.81E-06
chemotaxis of bone marrow cells 1.84E-04
cell movement of bone marrow cells 3.77E-04
transendothelial migration of lymphocytes 4.98E-04
migration of lymphoblasts 3.69E-03
migration of peripheral T lymphocyte 4.88E-03
migration of peripheral blood leukocytes 5.69E-03
transmigration of monocytes 5.69E-03
chemotaxis of endothelial cells 6.97E-03
migration of bone marrow cells 7.70E-03
transmigration of neural stem cells 1.36E-02
homing of hematopoietic progenitor cells 1.50E-02
cell movement of hematopoietic progenitor cells 1.58E-02
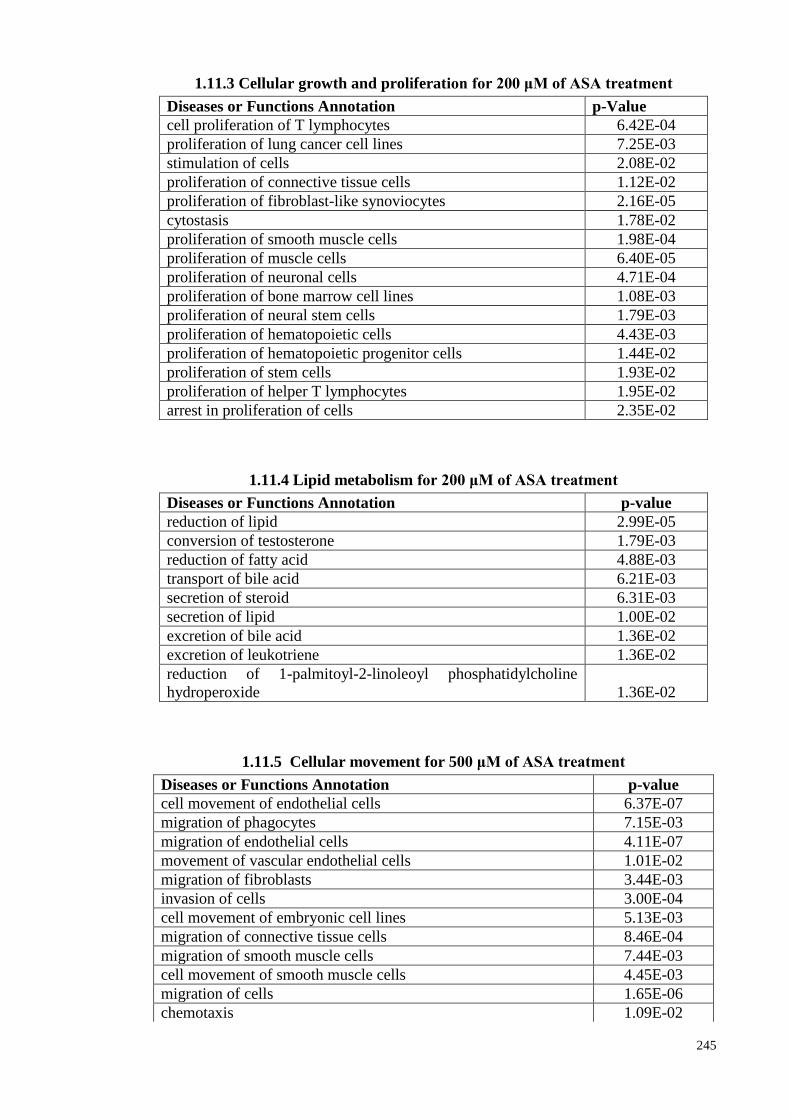
245
1.11.3 Cellular growth and proliferation for 200 μM of ASA treatment
Diseases or Functions Annotation p-Value
cell proliferation of T lymphocytes 6.42E-04
proliferation of lung cancer cell lines 7.25E-03
stimulation of cells 2.08E-02
proliferation of connective tissue cells 1.12E-02
proliferation of fibroblast-like synoviocytes 2.16E-05
cytostasis 1.78E-02
proliferation of smooth muscle cells 1.98E-04
proliferation of muscle cells 6.40E-05
proliferation of neuronal cells 4.71E-04
proliferation of bone marrow cell lines 1.08E-03
proliferation of neural stem cells 1.79E-03
proliferation of hematopoietic cells 4.43E-03
proliferation of hematopoietic progenitor cells 1.44E-02
proliferation of stem cells 1.93E-02
proliferation of helper T lymphocytes 1.95E-02
arrest in proliferation of cells 2.35E-02
1.11.4 Lipid metabolism for 200 μM of ASA treatment
Diseases or Functions Annotation p-value
reduction of lipid 2.99E-05
conversion of testosterone 1.79E-03
reduction of fatty acid 4.88E-03
transport of bile acid 6.21E-03
secretion of steroid 6.31E-03
secretion of lipid 1.00E-02
excretion of bile acid 1.36E-02
excretion of leukotriene 1.36E-02
reduction of 1-palmitoyl-2-linoleoyl phosphatidylcholine
hydroperoxide 1.36E-02
1.11.5 Cellular movement for 500 μM of ASA treatment
Diseases or Functions Annotation p-value
cell movement of endothelial cells 6.37E-07
migration of phagocytes 7.15E-03
migration of endothelial cells 4.11E-07
movement of vascular endothelial cells 1.01E-02
migration of fibroblasts 3.44E-03
invasion of cells 3.00E-04
cell movement of embryonic cell lines 5.13E-03
migration of connective tissue cells 8.46E-04
migration of smooth muscle cells 7.44E-03
cell movement of smooth muscle cells 4.45E-03
migration of cells 1.65E-06
chemotaxis 1.09E-02
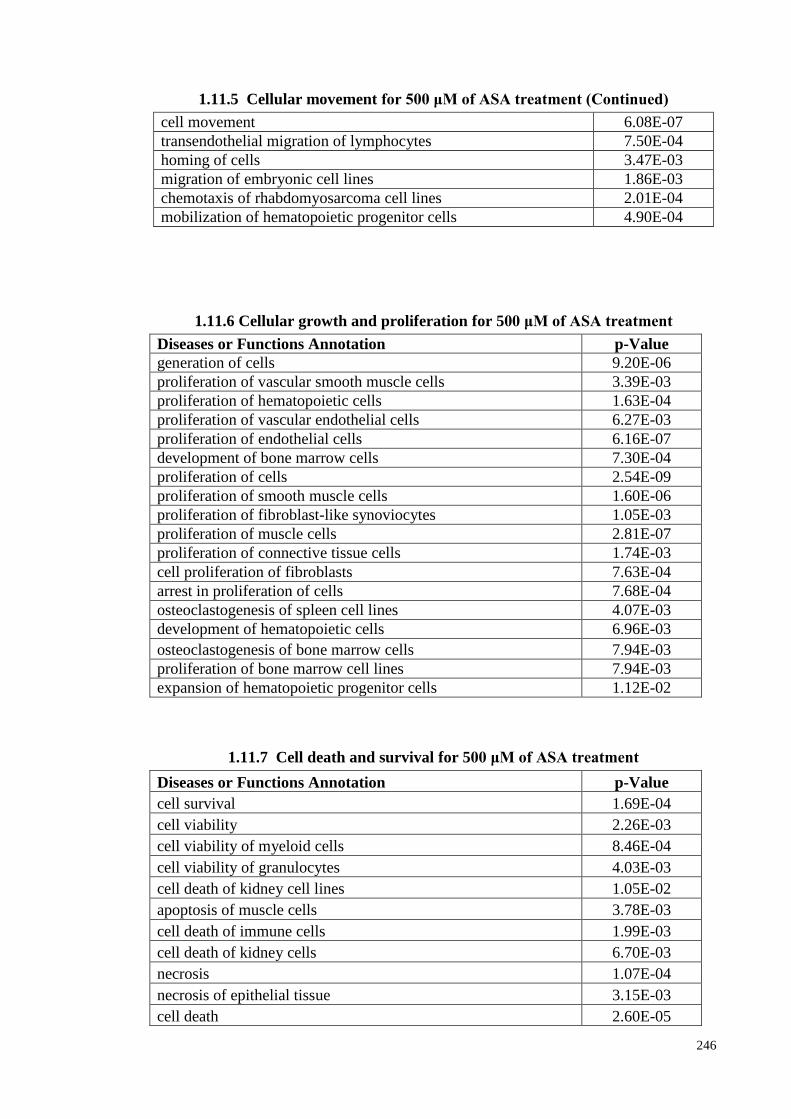
246
1.11.5 Cellular movement for 500 μM of ASA treatment (Continued)
cell movement 6.08E-07
transendothelial migration of lymphocytes 7.50E-04
homing of cells 3.47E-03
migration of embryonic cell lines 1.86E-03
chemotaxis of rhabdomyosarcoma cell lines 2.01E-04
mobilization of hematopoietic progenitor cells 4.90E-04
1.11.6 Cellular growth and proliferation for 500 μM of ASA treatment
Diseases or Functions Annotation p-Value
generation of cells 9.20E-06
proliferation of vascular smooth muscle cells 3.39E-03
proliferation of hematopoietic cells 1.63E-04
proliferation of vascular endothelial cells 6.27E-03
proliferation of endothelial cells 6.16E-07
development of bone marrow cells 7.30E-04
proliferation of cells 2.54E-09
proliferation of smooth muscle cells 1.60E-06
proliferation of fibroblast-like synoviocytes 1.05E-03
proliferation of muscle cells 2.81E-07
proliferation of connective tissue cells 1.74E-03
cell proliferation of fibroblasts 7.63E-04
arrest in proliferation of cells 7.68E-04
osteoclastogenesis of spleen cell lines 4.07E-03
development of hematopoietic cells 6.96E-03
osteoclastogenesis of bone marrow cells 7.94E-03
proliferation of bone marrow cell lines 7.94E-03
expansion of hematopoietic progenitor cells 1.12E-02
1.11.7 Cell death and survival for 500 μM of ASA treatment
Diseases or Functions Annotation p-Value
cell survival 1.69E-04
cell viability 2.26E-03
cell viability of myeloid cells 8.46E-04
cell viability of granulocytes 4.03E-03
cell death of kidney cell lines 1.05E-02
apoptosis of muscle cells 3.78E-03
cell death of immune cells 1.99E-03
cell death of kidney cells 6.70E-03
necrosis 1.07E-04
necrosis of epithelial tissue 3.15E-03
cell death 2.60E-05
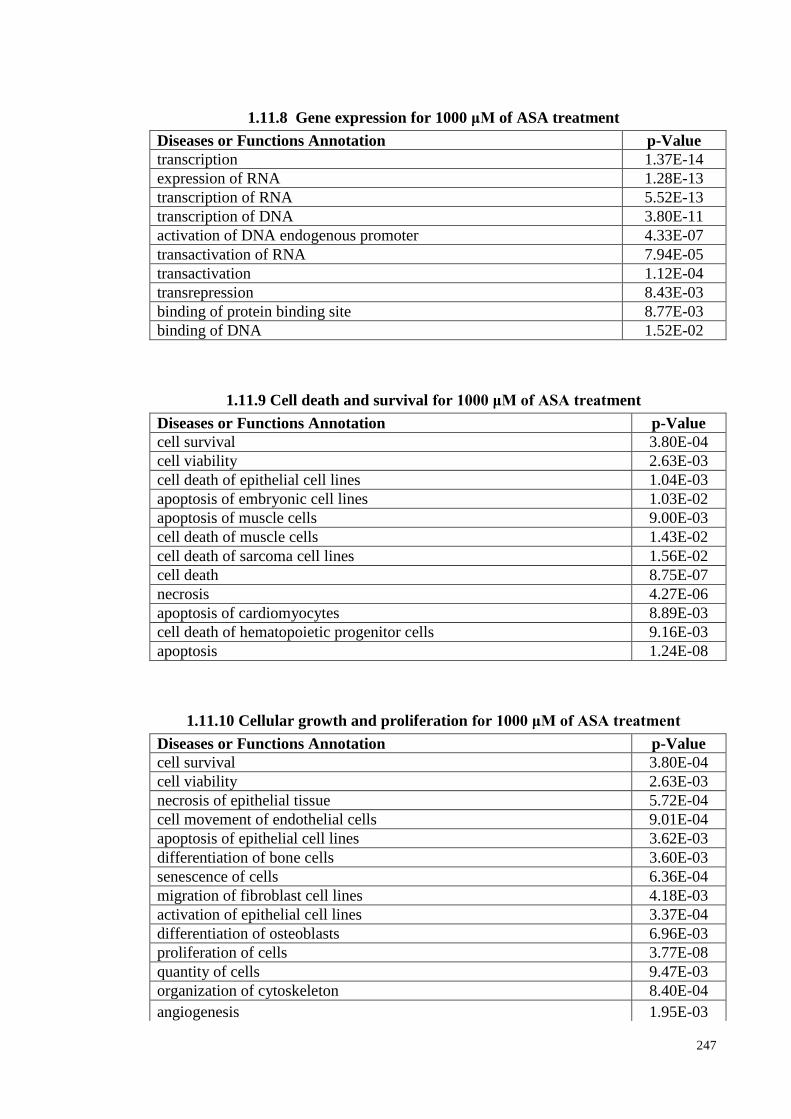
247
1.11.8 Gene expression for 1000 μM of ASA treatment
Diseases or Functions Annotation p-Value
transcription 1.37E-14
expression of RNA 1.28E-13
transcription of RNA 5.52E-13
transcription of DNA 3.80E-11
activation of DNA endogenous promoter 4.33E-07
transactivation of RNA 7.94E-05
transactivation 1.12E-04
transrepression 8.43E-03
binding of protein binding site 8.77E-03
binding of DNA 1.52E-02
1.11.9 Cell death and survival for 1000 μM of ASA treatment
Diseases or Functions Annotation p-Value
cell survival 3.80E-04
cell viability 2.63E-03
cell death of epithelial cell lines 1.04E-03
apoptosis of embryonic cell lines 1.03E-02
apoptosis of muscle cells 9.00E-03
cell death of muscle cells 1.43E-02
cell death of sarcoma cell lines 1.56E-02
cell death 8.75E-07
necrosis 4.27E-06
apoptosis of cardiomyocytes 8.89E-03
cell death of hematopoietic progenitor cells 9.16E-03
apoptosis 1.24E-08
1.11.10 Cellular growth and proliferation for 1000 μM of ASA treatment
Diseases or Functions Annotation p-Value
cell survival 3.80E-04
cell viability 2.63E-03
necrosis of epithelial tissue 5.72E-04
cell movement of endothelial cells 9.01E-04
apoptosis of epithelial cell lines 3.62E-03
differentiation of bone cells 3.60E-03
senescence of cells 6.36E-04
migration of fibroblast cell lines 4.18E-03
activation of epithelial cell lines 3.37E-04
differentiation of osteoblasts 6.96E-03
proliferation of cells 3.77E-08
quantity of cells 9.47E-03
organization of cytoskeleton 8.40E-04
angiogenesis 1.95E-03
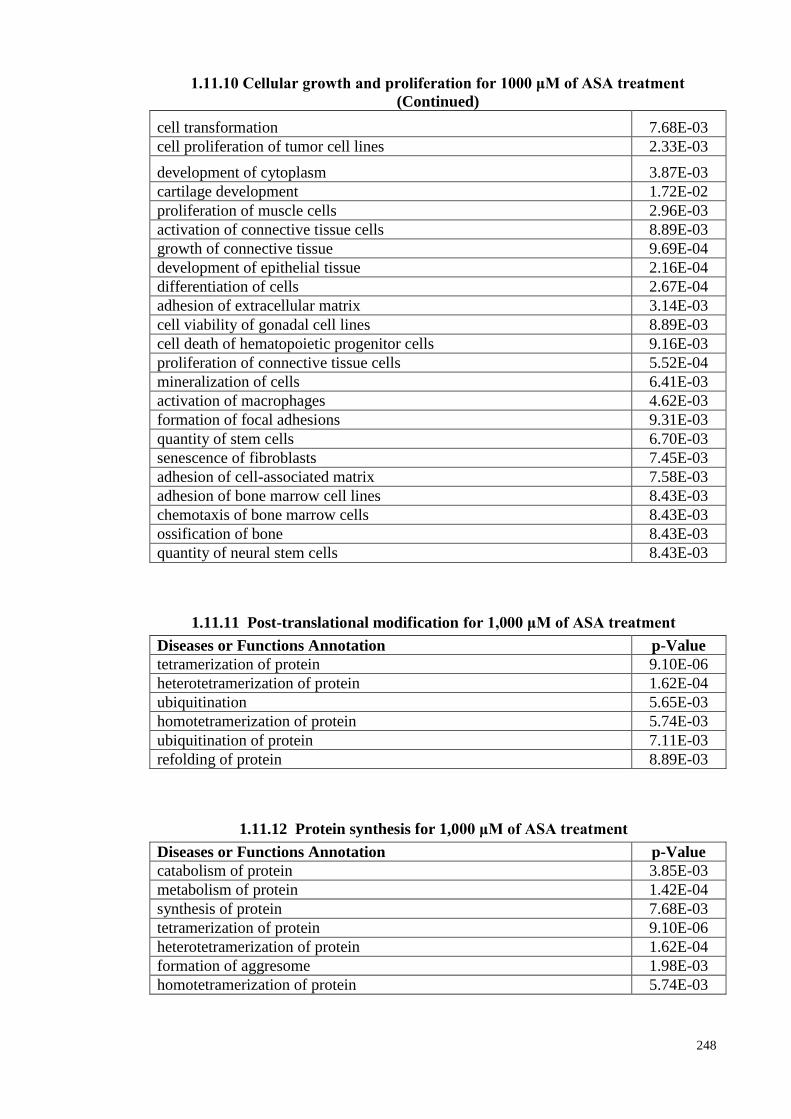
248
1.11.10 Cellular growth and proliferation for 1000 μM of ASA treatment
(Continued)
cell transformation 7.68E-03
cell proliferation of tumor cell lines 2.33E-03
development of cytoplasm 3.87E-03
cartilage development 1.72E-02
proliferation of muscle cells 2.96E-03
activation of connective tissue cells 8.89E-03
growth of connective tissue 9.69E-04
development of epithelial tissue 2.16E-04
differentiation of cells 2.67E-04
adhesion of extracellular matrix 3.14E-03
cell viability of gonadal cell lines 8.89E-03
cell death of hematopoietic progenitor cells 9.16E-03
proliferation of connective tissue cells 5.52E-04
mineralization of cells 6.41E-03
activation of macrophages 4.62E-03
formation of focal adhesions 9.31E-03
quantity of stem cells 6.70E-03
senescence of fibroblasts 7.45E-03
adhesion of cell-associated matrix 7.58E-03
adhesion of bone marrow cell lines 8.43E-03
chemotaxis of bone marrow cells 8.43E-03
ossification of bone 8.43E-03
quantity of neural stem cells 8.43E-03
1.11.11 Post-translational modification for 1,000 μM of ASA treatment
Diseases or Functions Annotation p-Value
tetramerization of protein 9.10E-06
heterotetramerization of protein 1.62E-04
ubiquitination 5.65E-03
homotetramerization of protein 5.74E-03
ubiquitination of protein 7.11E-03
refolding of protein 8.89E-03
1.11.12 Protein synthesis for 1,000 μM of ASA treatment
Diseases or Functions Annotation p-Value
catabolism of protein 3.85E-03
metabolism of protein 1.42E-04
synthesis of protein 7.68E-03
tetramerization of protein 9.10E-06
heterotetramerization of protein 1.62E-04
formation of aggresome 1.98E-03
homotetramerization of protein 5.74E-03