Embed Size (px)
Citation preview
EFFECT OF APPLICANT FAKING ON MEASUREMENT PROPERTIES OF
THE GLOBAL PERSONALITY INVENTORY
by
WEIWEI YANG
(Under the Direction of Charles E. Lance)
ABSTRACT
Personality measures are attractive to practitioners in personnel selection context due to
their effectiveness in predicting job performance and lack of adverse impact. However, the
susceptibility of personality measures to faking has been a concern. A potential problem with
the faking research is that measurement invariance of personality inventories across faking and
nonfaking groups is rarely examined before personality mean scores are compared. This renders
any interpretation of group differences suspect. The current study examined the effect of
applicant faking on the measurement properties of the Global Personality Inventory (GPI), a Big
Five personality measure. It was found that all the Big Five dimensions had higher latent means
for job applicants than incumbents. Emotional Stability had unequal intercepts across applicant
and incumbent groups. Conscientiousness and Extraversion had unequal intercepts and
uniquenesses across groups. Sources of non-invariance at the scale-level were explored using
three different approaches. The three approaches differed in terms of the scales identified for
scalar but not uniqueness non-invariance. Further latent variable analyses suggested that the
social desirability method bias existed for both the applicant and incumbent samples, but its

presence did not affect the Big Five factor loadings as well as the relationships among the Big
Five dimensions. Implications of the results were discussed.
INDEX WORDS: Personality measures, personnel selection, faking, social desirability, method effect, measurement invariance/equivalence
EFFECT OF APPLICANT FAKING ON MEASUREMENT PROPERTIES OF
THE GLOBAL PERSONALITY INVENTORY
by
WEIWEI YANG
B. S. S., The University of Hong Kong, Hong Kong, 2002
M. S., The University of Georgia, 2004
A Dissertation Submitted to the Graduate Faculty of The University of Georgia in Partial
Fulfillment of the Requirements for the Degree
DOCTOR OF PHILOSOPHY
ATHENS, GEORGIA
2006

© 2006
Weiwei Yang
All Rights Reserved
EFFECT OF APPLICANT FAKING ON MEASUREMENT PROPERTIES OF
THE GLOBAL PERSONALITY INVENTORY
by
WEIWEI YANG
Major Professor: Charles E. Lance
Committee: Lillian T. Eby Robert J. Vandenberg
Electronic Version Approved: Maureen Grasso Dean of the Graduate School The University of Georgia May 2006
iv
TABLE OF CONTENTS
Page
CHAPTER
1 INTRODUCTION .........................................................................................................1
2 LITERATURE REVIEW ..............................................................................................3
Big Five Personality and Personnel Selection...........................................................3
Faking on Personality Measures................................................................................5
3 THE CURRENT STUDY............................................................................................13
4 METHOD ....................................................................................................................18
Participants ..............................................................................................................18
Measure ...................................................................................................................18
Procedure.................................................................................................................20
Data Analysis ..........................................................................................................21
5 RESULTS ....................................................................................................................28
Descriptive Statistics ...............................................................................................28
Measurement Model................................................................................................28
ME/I.........................................................................................................................30
Social Desirability Method Effect ...........................................................................48
6 DISCUSSION..............................................................................................................59
Major Findings ........................................................................................................59
Implications .............................................................................................................62
v
Limitations...............................................................................................................65
Conclusions .............................................................................................................66
REFERENCES ..............................................................................................................................67
APPENDICES ...............................................................................................................................78
A Scale Definitions and Example Items of the Global Personality Inventory (GPI) ......79
B Tests of partial ME/I for Extraversion using the Model Comparison approach..........86
C Tests of partial ME/I for Extraversion using the MACS-MI approach .......................88
D Tests of partial ME/I for Extraversion using the Z test................................................89
E Tests of partial ME/I for Emotional Stability using the Model Comparison approach91
F Tests of partial ME/I for Emotional Stability using the MACS-MI approach ............92
G Tests of partial ME/I for Emotional Stability using the Z test.....................................93

1
CHAPTER 1
INTRODUCTION
Although there is no one standard definition of personality, most formal definitions agree
that personality refers to the unique organization of characteristics that defines an individual and
determines that person’s pattern of interaction with the environment (Gatewod & Feild, 2001).
There has been a resurgence of interest and increased optimism in recent years regarding the role
of personality measures in understanding work-related behavior. A major reason for the
increased interest in personality measures is the emergence of the Big Five personality structure
which provides a long missing framework for examining personality and performance
relationships (Mount & Barrick, 1995; Hough, 2003). The Big Five personality dimensions have
been proved to be effective in predicting job performance (Barrick & Mount, 1991; Tett, Jackson,
& Rothstein, 1991). In addition to providing incremental validity to cognitive ability test in
predicting job performance (Hogan, 1990), the use of personality measures is appealing because
they do not have adverse impact on different demographic groups (Hogan, Hogan, & Roberts,
1996). All of these factors have contributed to the attractiveness of using personality measures
for personnel selection.
However, many have argued that self-report personality measures are particularly
susceptible to faking. That is, people can consciously distort their responses to personality
measures to enhance their image (Mount & Barrick, 1995). The faking issue has been a concern
for researchers and practitioners. In studying the magnitude and prevalence of faking,
researchers have mostly relied on comparing faking and nonfaking groups on their personality

2
scores but have simply ignored the potential absence of measurement invariance of personality
inventories across groups. This is problematic because motivation to fake might actually trigger
the use of different frames of reference when responding to personality inventories. Under such
circumstances, personality inventories might be measuring different constructs for different
groups, and therefore the basis for drawing scientific inference from group differences is
severely lacking (Horn & McArdle, 1992; Vandenberg & Lance, 2000). It is imperative that
measurement invariance is established before personality mean scores could be compared across
groups. The current study, therefore, is devoted to examining the effect of faking on
measurement properties of personality measures. The specific research question being asked is:
do Big Five personality measures remain measurement equivalent when faking occurs? After
the usefulness of Big Five personality dimensions in personnel selection is introduced, the faking
literature will be reviewed in great detail, and finally the specifics of the current study will be
discussed.
3
CHAPTER 2
LITERATURE REVIEW
Big Five Personality and Personnel Selection
The relationship between personality and job performance has been a frequently studied
topic in I/O psychology, especially since the mid 1980s. The emergence of a useful personality
taxonomy known as Big Five (e.g., Costa & McCrae, 1995; Digman, 1990; Goldberg, 1990) is
most recognized among personnel selection researchers. According to Costa & McCrae (1992),
the Big Five personality dimensions are Extraversion, which is associated with being sociable,
gregarious, assertive, talkative, and active; Agreeableness, which is associated with being
courteous, flexible, trusting, good-natured, cooperative, and tolerant; Conscientiousness, which
is associated with being careful, thorough, responsible, and organized; Emotional Stability,
which is associated conversely with being anxious, depressed, angry, embarrassed, worried, and
insecure; and Openness to Experience, which is associated with being imaginative, curious,
original, broad-minded, and intelligent. During the past decade, an impressive body of literature
has provided compelling evidence for the robustness of the five-factor model across different
theoretical frameworks, using different instruments, in different cultures, using ratings obtained
from different sources, and with a variety of samples (Barrick & Mount, 1991; Chan & Schmitt,
1998).
The Big Five personality dimensions have been linked to numerous job relevant criteria,
most notably with respect to job performance. A number of meta-analyses (Barrick & Mount,
1991; Barrick, Mount, & Judge, 2001; Tett et al, 1991; Tett, Jackson, Rothstein, & Reddon, 1994)
4
found the Big Five to be valid predictors of overall job performance. It has been generally
concluded that (a) Conscientiousness and Emotional Stability are positively related to job
performance in virtually all jobs with Conscientiousness being somewhat more strongly related
to overall job performance; (b) Extraversion is related to job performance in occupations where
interactions with others are a significant portion of the job; (c) Agreeableness appears to have
high predictive validity in jobs that involve helping, cooperating and nurturing others; and (d)
Openness to experience demonstrates minimal validity in predicting job performance but
predicts relatively well for training proficiency. A number of studies (e.g., Hurtz & Donovan,
2000; Motowidlo & Van Scotter, 1994; Van Scotter & Motowidlo, 1996) further examined the
relationships between the Big Five and two performance dimensions, task performance
(activities that contribute to the organization’s technical core and are role-prescribed) and
contextual performance (activities that are not role-prescribed but support the environment in
which the technical core must function; e.g., organizational citizenship behavior) (Borman &
Motowidlo, 1993, 1997). It was found that while Conscientiousness and Emotional Stability
predict both task and contextual performance, Agreeableness and Extraversion predict contextual
performance relatively better. It can be seen that the Big Five have larger impact on the
contextual dimension of job performance. Taken together, these studies demonstrate that the Big
Five personality dimensions account for significant variance in overall job performance and its
dimensions.
In addition to being useful in predicting job performance, there are several advantages
associated with using personality measures in selection. First, personality data have been found
to be uncorrelated with other instruments such as cognitive ability tests and assessment centers
and therefore increase the prediction of job performance above the use of these instruments alone

5
(Hogan, 1990). Second, personality measures are cost effective compared to other selection
tools (e.g., assessment center) in that it can be administered using paper-and-pencil form in large
groups. Third, there is no adverse impact associated with personality measures. According to
Hogan et al (1996), there is no evidence that well-constructed personality inventories
systematically discriminate against any ethnic or national group, and persons with disabilities
receive, on average, the same scores as nondisabled persons. There are gender differences in
mean scale scores; however, these differences do not translate into differential selection rates for
men and women applying for jobs.
Despite all of their advantages, the use of personality measures in personnel selection is
not without drawbacks. In particular, there are concerns about the susceptibility of personality
measures to faking. This is an important issue that has not been adequately answered by the
literature (Mount & Barrick, 1995), and therefore the current study is devoted to addressing it.
The literature pertaining to faking of personality measures is reviewed in detail next.
Faking on Personality Measures
Faking on personality measures has been considered a serious issue for over 50 years (Ellis,
1946). Faking refers to the tendency of individuals to consciously distort answers on tests that
will result in others viewing them in the most favorable way (McFarland & Ryan, 2000). To the
extent that “response distortion”, “social desirability”, “impression management”, “self-
enhancement”, and “dissimulation” fit this definition, they are considered to be interchangeable
concepts (Ones, Viswesvaran, & Reiss, 1996). Research on the faking issue is around three
questions: are people able to fake on personality measures, does faking occur in selection context,
and what is the effect of faking?
6
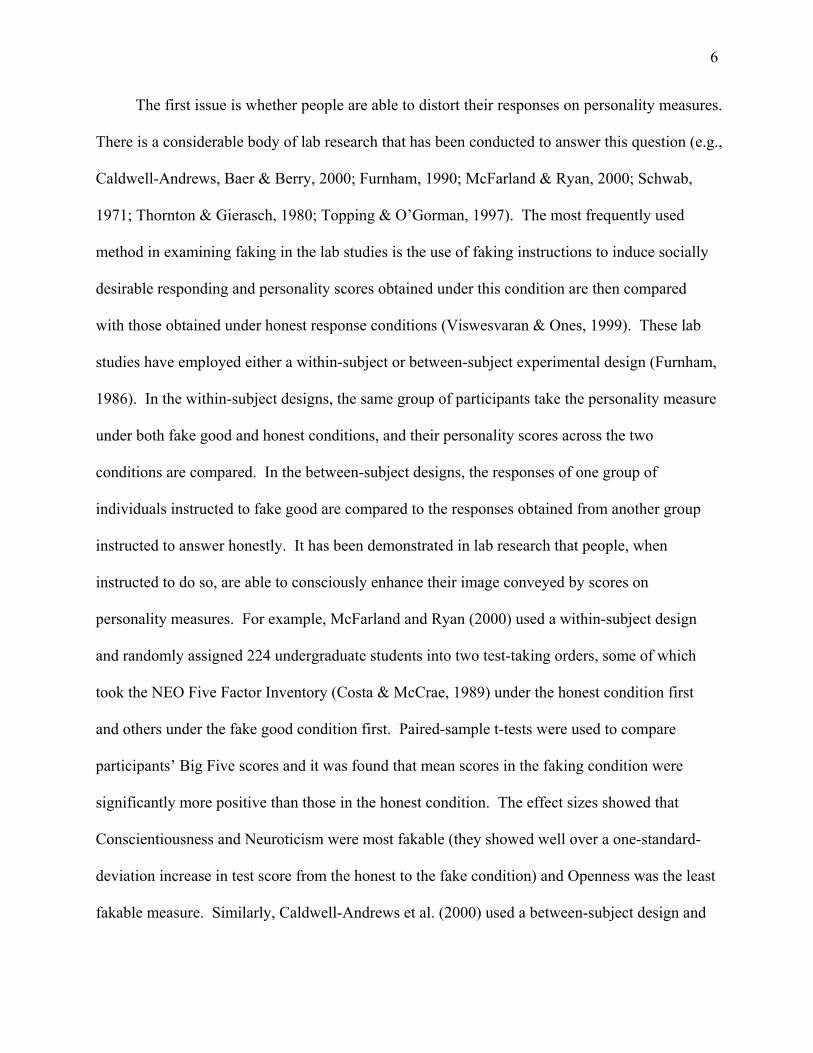
The first issue is whether people are able to distort their responses on personality measures.
There is a considerable body of lab research that has been conducted to answer this question (e.g.,
Caldwell-Andrews, Baer & Berry, 2000; Furnham, 1990; McFarland & Ryan, 2000; Schwab,
1971; Thornton & Gierasch, 1980; Topping & O’Gorman, 1997). The most frequently used
method in examining faking in the lab studies is the use of faking instructions to induce socially
desirable responding and personality scores obtained under this condition are then compared
with those obtained under honest response conditions (Viswesvaran & Ones, 1999). These lab
studies have employed either a within-subject or between-subject experimental design (Furnham,
1986). In the within-subject designs, the same group of participants take the personality measure
under both fake good and honest conditions, and their personality scores across the two
conditions are compared. In the between-subject designs, the responses of one group of
individuals instructed to fake good are compared to the responses obtained from another group
instructed to answer honestly. It has been demonstrated in lab research that people, when
instructed to do so, are able to consciously enhance their image conveyed by scores on
personality measures. For example, McFarland and Ryan (2000) used a within-subject design
and randomly assigned 224 undergraduate students into two test-taking orders, some of which
took the NEO Five Factor Inventory (Costa & McCrae, 1989) under the honest condition first
and others under the fake good condition first. Paired-sample t-tests were used to compare
participants’ Big Five scores and it was found that mean scores in the faking condition were
significantly more positive than those in the honest condition. The effect sizes showed that
Conscientiousness and Neuroticism were most fakable (they showed well over a one-standard-
deviation increase in test score from the honest to the fake condition) and Openness was the least
fakable measure. Similarly, Caldwell-Andrews et al. (2000) used a between-subject design and
7
had a sample of 150 undergraduate students take the NEO Personality Inventory-Revised (NEO-
PI-R; Costa & McCrae, 1992) under honest and fake good conditions. They found that
compared to the honest participants, the fake good participants scored significantly higher on
Conscientiousness and Agreeableness and lower on Neuroticism. That is, the fake good
participants described themselves as more conscientious and agreeable and less neurotic. Mean
score differences were largest on Conscientiousness and smallest on Openness. Viswesvaran
and Ones (1999) meta-analyzed 51 lab studies examining faking on personality measures. They
found that for between-subject designs, across the Big Five factors, fake good instructions inflate
responses by about half a standard deviation; for within-subject designs, Conscientiousness and
Emotional Stability (almost one-standard-deviation difference between mean scores in fake
versus honest conditions) appear to be almost twice as sensitive to faking as Extraversion and
Agreeableness (about half-standard-deviation difference between mean scores in fake versus
honest conditions).
Review of the lab studies examining faking suggests that individuals can fake their
responses on personality inventories by as large as one standard deviation if instructed to do so.
However, the finding that individuals can fake does not necessarily imply that they do fake in
real-world situations (especially in selection context). And even if they do fake in real-world
situations, what has been less clear is whether actual applicants engage in the levels of response
distortion as participants do in lab settings (Mount & Barrick, 1995). This leads to the second
question researchers ask about faking: does faking occur in selection context? A number of field
studies have been conducted around this question and they involve comparing the responses
obtained from various groups (e.g., job applicants, job incumbents, students, and general public)
(e.g., Bass, 1957; Kirchner, Dunnette, & Mousley, 1960; Michaelis & Eysenck, 1971; Robie,
8
Zickar, & Schmit, 2001; Rosse, Stecher, Miller, & Levin, 1998). They are aimed at determining
the operational level of faking in real-world settings (Viswesvaran & Ones, 1999). In one study,
Rosse et al. (1998) administered NEO-PI-R to a sample of 197 job applicants and 73 job
incumbents of a property management firm. They found that job applicants had significantly
higher means on facets of Extraversion, Conscientiousness, and Agreeableness and significantly
lower means on facets of Neuroticism. The effect size showed that these differences were
practically as well as statistically significant, with the average between-group difference
equaling .65 standard deviations. In another study comparing applicants for jobs as sales
managers and incumbent sales managers in a large retail organization, Robie et al. (2001)
reported higher observed means on six personality characteristics for the applicant group. The
effect sizes ranged from .34 to .67 with an average of approximately half a standard deviation
unit. The field research reveals that distortion in actual applicant settings is not as large as that
produced in directed faking studies; nonetheless, in an applicant situation in which the individual
is motivated to present himself/herself in a good light, distortion can and often does occur
(Hough, 1998).
The review of the faking literature thus far shows that the majority of the research
conducted in this field has focused primarily on comparative differences between fake
good/applicant groups and honest/nonapplicant groups, and such method is used as a vehicle for
understanding faking issues. However, what is problematic is that virtually none of such
research has examined the assumption of equivalence of the measures used to operationalize
personality constructs before mean score differences are interpreted. Measurement
equivalence/invariance (ME/I) can generally be defined as the extent to which individuals with
the same latent score will have the same observed score (Drasgow & Kanfer, 1985). According
9
to Vandenberg and Lance (2000), demonstration of ME/I is a logical prerequisite to the
evaluation of substantive hypotheses regarding group differences. That is, any comparison
between groups is only appropriate if ME/I is established first. Unambiguous interpretation of
observed mean differences is dependent upon the between-group equivalence of the personality
measures. If the between-group comparison is based on a non-equivalent personality measure,
the interpretations of mean score differences are potentially artifactual and may be substantively
misleading (Reise, Widaman, & Pugh, 1993). A number of studies have been conducted to
answer the research question “does faking affect anything that we should be concerned about,
such as measurement properties, predictive validity, and hiring decisions?” Those studies
pertaining to the effect of faking on measurement properties of personality measures will be
reviewed in detail next, as they may shed some light on the ME/I issue.
A number of lab and field studies investigating the extent to which faking may affect
measurement properties of personality measures have focused on factorial validity; that is,
whether the same personality factor structure is upheld in a sample replete with socially desirable
responding. Griffith (1997) used confirmatory factor analysis to examine the factorial invariance
between fake good and honest groups. He found differences in the factor structure of the NEO-
PI-R between these two groups. Using a within-subject design, Ellingson, Sackett, and Hough
(1999) compared the dimensionality of honest and fake good groups’ responses to the
Assessment of Background and Life Experiences (ABLE) personality inventory. The average
correlations across the ABLE scales were .46 for the honest group and .83 for the fake good
group respectively. In other words, faking dissolved a previously multidimensional factor
structure to one common factor for the inventory. Due to the concern that these findings resulted
from experimentally induced faking may not be generalizable to the real-world selection context,
10
Ellingson, Smith, and Sackett (2001) examined whether naturally occurring socially desirable
responding would alter the factor structure of personality measures. Four personality inventories,
ABLE, California Psychological Inventory (CPI), Sixteen Personality Factor Questionnaire
(16PF), and Hogan Personality Inventory (HPI-R), were administered in soldier, applicant,
incumbent, and student samples. Configural, metric, and uniqueness invariance models were
tested in these samples using multiple-group confirmatory factor analysis. It was concluded that
the factor structure and factor loadings remained invariant across the four inventories when
naturally occurring social desirability was present, but uniqueness was not invariant when faking
occurred. In another study, Schmit and Ryan (1993) compared the factor structure for the short-
form version of the NEO-PI in applicant and student samples. Using a confirmatory factor
analysis, they found that the five factor model was a good fit for the college sample but not for
the applicant sample. Further exploratory factor analysis revealed a six factor model (Big Five
plus a sixth factor) in the applicant sample. The authors interpreted the sixth factor as an “ideal
employee” factor, which is a combination of four factors (Neuroticism, Extraversion,
Agreeableness, and Conscientiousness) in Big Five. It was suggested that the sixth factor was
present in the applicant sample instead of the student sample because applicants were motivated
to convey that they were competent workers through self-presentation response styles. All these
research findings based on exploratory and confirmatory factor analyses indicate that faking does
affect measurement properties of personality measures in fake/applicant groups. In addition, two
studies based on Item Response Theory (IRT) analyses also explored the effect of faking on
personality tests’ measurement properties. One of these studies was conducted by Zickar and
Robie (1999), in which 1987 military recruits were experimentally instructed to complete the
ABLE under one of the three conditions: answer honestly, fake good (instructions of faking good
11
only without information on how to fake), or fake good with coaching (instructions of faking
good and how to fake good). Three scales, Emotional Stability (which is conceptually related to
the Big Five trait of Emotional Stability), Work Orientation, and Nondelinquency (both are
conceptually related to the Big Five trait of Conscientiousness), were analyzed with IRT. It was
found that out of the 56 items, 11 demonstrated differential item functioning (DIF) across faking
good vs. honest groups, and 14 demonstrated DIF across coached faking vs. honest groups.
Among the three scales, both Work Orientation and Nondelinquency demonstrated differential
test functioning (DTF) across faking (faking good and coached faking) vs. honest groups. The
other study based on IRT analyses was conducted by Robie et al. (2001), in which the effect of
naturally occurring faking was examined by comparing job applicant and incumbent groups.
Contrary to Zickar and Robie’s (1999) findings, it was found that out of the 47 items measuring
six personality traits, only two items of the Work Focus scale (which is conceptually related to
Big Five trait of Conscientiousness) functioned differently across groups and no DTF was
detected for all the six scales. The results of these two IRT studies are inconsistent, which might
be due to the fact that experimentally induced faking may not be isomorphic with response
distortion that occurs in real-world selection settings (Robie et al., 2001).
In addition to altering measurement properties, faking has also been thought to affect the
predictive validity of personality measures. Some researchers provided evidence that faking
attenuates the predictive validity of personality measures (e.g., Dunnette, McCartney, Carlson, &
Kirchner, 1962; Pannone, 1984). More recently, it has been argued that even if faking does
occur in selection context, it does not negatively influence the predictive validity of personality
measures (e.g., Barrick & Mount, 1996; Cunningham, Wong, & Barbee, 1994; Hough, Eaton,
Dunnette, Kamp, & McCloy, 1990; Ones & Viswesvaran, 1998). Despite the fact that the
12
predictive validity of personality measures seems intact by response distortion, there has been
some evidence that faking affects who is hired as fakers would rise to the top (e.g., Christiansen,
Goffin, Johnston, & Rothstein, 1994; Rosse, Stecher, Miller, & Levin, 1998).
In sum, the literature shows that people are able to fake good on personality inventories
when instructed to do so and faking does occur in real-world selection context. Although there is
evidence that faking does not attenuate predictive validity of personality measures, it does affect
hiring decisions as the rank ordering of applicants will change. Lab and field studies in the
faking literature have been primarily focused on comparing personality mean score differences
between faking and non-faking groups. The comparative differences are used to understand
faking phenomena and quantify levels of faking. This method is problematic because if
personality inventories are measuring different constructs in different groups, between-group
mean score differences on personality measures are not interpretable. Also, although personality
measures have proven to be valid predictors of job performance, they may not be valid for
individuals that distort their responses. Therefore, it is imperative that ME/I is examined for
personality measures for faking versus non-faking groups to see if faking alters the construct
validity of personality measures.
13
CHAPTER 3
THE CURRENT STUDY
The current study examined the effect of faking on the measurement properties of a Big
Five personality measure named Global Personality Inventory (GPI; Schmit, Kihm, & Robie,
2000). Although a number of studies have investigated the change of factor structure or item/test
functioning of personality measures due to faking, the current study has a number of advantages
over the previous ones.
First of all, the current study examined the effect of naturally occurring faking, rather than
lab induced faking such as in Griffith’s (1997), Ellingson et al.’s (1999), and Zickar and Robie’s
(1999) studies, on ME/I of the GPI by comparing job applicants with job incumbents. As
mentioned previously, it is very likely that the fakability of personality measures has been
exaggerated from induced faking (Costa, 1996). The major problem with this method is that
there is no guarantee that the magnitude and nature of faking would be the same as that occurs to
people who are faking to obtain a valued job (Levin & Zickar, 2002). Therefore, examining the
effect of naturally occurring faking such as what would happen in an actual organizational
setting would be of more interest to personnel psychologists. In an organizational setting,
assessment procedures (e.g., job application) create the motivation as well as the opportunity for
people to distort responses to create a favorable self-presentation. Given the motivation to get
the job they want, applicants are likely to exhibit the attributes of the prototypic or ideal
employee and convey an image that reflects the self-image in the biased positive direction
(Schmit & Ryan, 1993). Transparency of many personality test items also makes it possible for
14
job applicants to endorse those that will make them look good, and in addition, there is little
apparent chance of being caught in a lie (Rosse et al., 1998). Under these circumstances it would
be surprising if job applicants did not fake their answers. There is also empirical evidence that
job applicants, in general, are more likely to fake good than job incumbents in selection contexts.
One body of research relying on faking scales (e.g., unlikely virtues, Hough, 1998; impression
management, Paulhus, 1984; validity scales, Hogan, & Hogan, 1992) to detect faking indicates
that job applicants score higher on these self-report measures of social desirability than job
incumbents (e.g., Elliott, 1981; Rosse et al., 1998; Stokes, Hogan, & Snell, 1993). Research also
consistently found significantly higher personality scores for job applicants than for incumbents
(e.g., Hough, 1998; Bass, 1957; Dunnette et al., 1962; Michaelis & Eysenck, 1971; Smith,
Hanges & Dickson, 2001). Some would argue that the mean differences between job applicant
and incumbent groups on personality scores are true differences. However, empirical evidence
suggests that this is not the case. For example, Hough (1998) examined personality scores of
incumbent and applicant police officers. Participants’ personality scores were corrected based
on their scores on an Unlikely Virtues (UV) scale. This strategy produced applicants’
personality mean scores very close to incumbents’, and this was true for men, women, Whites
and minorities.
Another advantage of the current study over some existing studies is that the applicant and
incumbent samples in the current study have similar demographics. Some existing studies, such
as Schmit and Ryan’s (1993) and Ellingson et al.’s (2001) studies, compare applicants and
incumbents that differ extensively on demographic variables. The groups may initially differ on
personality scales due to these demographic differences rather than the differences in test-taking
motivation. Other studies contrast applicants (e.g., sales applicants) versus students and attribute

15
the differences between these two groups to test-taking motivation. However, it is possible that
sales applicants’ personalities have fundamental differences from students. Indeed, Holland’s
(1973, 1985, 1997) vocational interest theory clearly suggests that people with different
occupations have different personality profiles. In the current study, both the applicants and
incumbents are managers, and they have very similar demographics (e.g., gender, age, etc.). It is
very likely that these two groups do not differ much initially on personality characteristics.
Furthermore, unlike the existing studies that mostly concentrate on factorial invariance of
personality measures across faking and non-faking groups, the current study followed
Vandenberg and Lance’s (2000) recommended procedure to examine a full range of ME/I of the
GPI (i.e., from equal covariance matrices to equal factor means) across applicant and incumbent
groups. This provided us with deeper understanding of the effect of faking on GPI’s
measurement structure.
The current study used confirmatory factor analysis (CFA) framework to examine the
effect of applicant faking on ME/I of the GPI. Although the IRT framework is proved to have
some merits in examining ME/I (Embretson & Reise, 2000; Meade & Lautenschlager, 2004a),
CFA method is more appropriate for the current study because (a) one of the research goals of
the current study is examining ME/I of the five-factor model of personality, and CFA can
provide information regarding the relationship among the latent factors whereas IRT is
disadvantageous in this regard (Meade & Lautenschlager, 2004a; Zickar & Robie, 1999); and (b)
the relatively small sample sizes in the current study warrant the CFA because IRT requires very
large sample size for accurate parameter estimates (Embretson & Reise, 2000; Meade &
Lautenschlager, 2004a). In addition, IRT only relies on chi-square test, which is extremely
sensitive to sample size, and there are no practical fit indices (like those in CFA methods) to
16
reduce the dependence on sample size when assessing model fit. CFA is proved to be useful in
examining ME/I (Meade & Lautenschlager, 2004b) and it is likely to result in similar conclusion
as IRT (e.g., Maurer, Raju, & Collins, 1998; Raju, Laffitte, & Byrne, 2002; Reise et al., 1993).
The empirical evidence in the faking literature reviewed previously shows that faking
alters measurement structures of personality measures. Podsakoff, MacKenzie, Lee, and
Podsakoff (2003) suggest that such measurement differences are a result of method bias (i.e.,
social desirability in this case). Specifically, when faking occurs, all the indicators of latent
personality dimensions are affected by the method factor due to social desirability bias. Thus,
social desirability introduces an additional factor into the measurement model which causes the
change of the measurement structure. Because social desirability bias was expected to be present
in the job applicant sample but not in the job incumbent sample, difference in measurement
structure was expected between applicant and incumbent samples. Therefore, it was
hypothesized that the GPI would not show ME/I across applicant and incumbent samples.
Hypothesis: GPI will demonstrate measurement non-invariance across applicant and
incumbent samples.
When personality data are collected for use in making personnel selection decisions,
decision makers almost always rely on information at the scale-level, and therefore scale-level
ME/I is of practical importance. Thus, in the current study, GPI scales that function
differentially across incumbent and applicant samples were further explored. Four different
methods in the literature were considered for this purpose: (1) the multiple indicators multiple
causes approach (hereafter referred to as MIMIC approach) suggested by Muthen (1988), (2) the
model comparison approach suggested by Raju et al. (2002), (3) the multiple-group mean and
covariance structure analyses with modification index (hereafter referred to as MACS-MI

17
approach) suggested by Chan (2000), and (4) the Z test suggested by Cheung (2002). These
methods were compared to see if they resulted in the same conclusions.
In summary, the current study has two purposes. First, the effect of applicant faking on
the measurement properties of the GPI was examined. Specifically, it was hypothesized that GPI
would demonstrate measurement non-invariance across job incumbent and applicant samples.
Second, sources of non-invariance at the scale-level were explored using different approaches.
These approaches were compared to see if they resulted in the same conclusions.

18
CHAPTER 4
METHOD
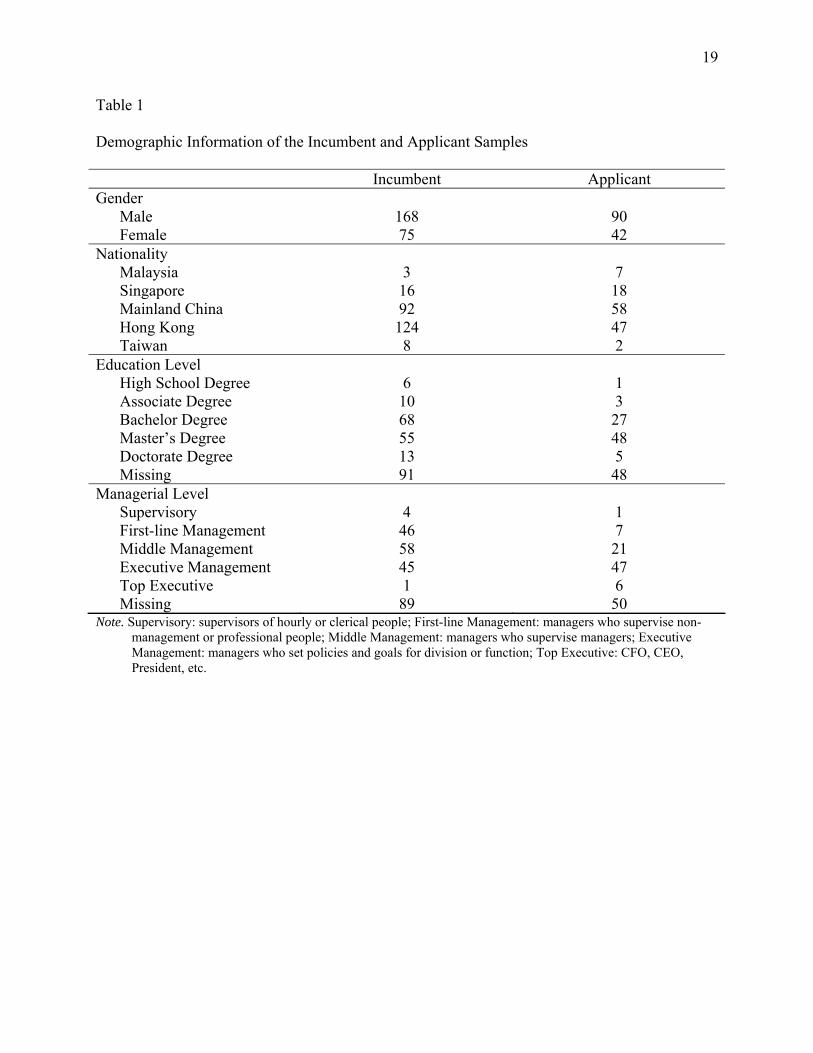
Participants The data were provided by Personnel Decisions International (PDI). The data set
comprised 132 job applicants and 243 job incumbents holding managerial positions. The
applicant sample had 68.18% males and 31.82% females. All of the applicants were Chinese,
with the majority from Mainland China (43.94%) and Hong Kong (35.61%). The applicants
reported a mean age of 39.85 years (SD = 6.48). The incumbent sample had 69.14% males and
30.86% females. All of the incumbents were Chinese, with the majority from Mainland China
(37.86%) and Hong Kong (51.03%). The incumbents reported a mean age of 40.40 (SD = 5.69).
Detailed demographic information of the two samples can be found in Table 1.
Measure
The GPI was used to measure participants’ Big Five personality characteristics. The GPI
was developed with input from PDI consultants and external researchers around the world based
on the five factor model of personality (please refer to Schmit et al (2000) for a detailed
documentation of the development procedure). It consists of 30 scales loaded on the Big Five
personality dimensions, five scales measuring management failure constructs, and two additional
trait composites (impressing and self-awareness/self-insight) (Definitions of the 37 scales along
with example items are presented in Appendix A). The total number of items is 300. Each scale
consists of seven to ten items anchored with a five-point Likert scale, ranging from strongly
disagree to strongly agree. Only the 30 scales loaded on the Big Five were included in the
19
Table 1
Demographic Information of the Incumbent and Applicant Samples
Incumbent Applicant Gender
Male 168 90 Female 75 42
Nationality Malaysia 3 7 Singapore 16 18 Mainland China 92 58 Hong Kong 124 47 Taiwan 8 2
Education Level High School Degree 6 1 Associate Degree 10 3 Bachelor Degree 68 27 Master’s Degree 55 48 Doctorate Degree 13 5 Missing 91 48
Managerial Level Supervisory 4 1 First-line Management 46 7 Middle Management 58 21 Executive Management 45 47 Top Executive 1 6 Missing 89 50
Note. Supervisory: supervisors of hourly or clerical people; First-line Management: managers who supervise non-management or professional people; Middle Management: managers who supervise managers; Executive Management: managers who set policies and goals for division or function; Top Executive: CFO, CEO, President, etc.
20
analyses. The coefficient alpha for these 30 scales reported by Schmit et al. (2000) ranged
from .65 (Openness) to .88 (Taking Charge), with an average of .75.
Procedure
Participants were recruited from client organizations of PDI from August 2002 to May
2005. The client organizations contracted with PDI to do leadership assessments for either
selection or development purpose. In some cases, they might use the assessment results to help
select the right external candidate for a managerial job, matching the individual's strengths to
specific job requirements. In this case, the job applicants were identified by the client
organizations and were told that the assessment results would be used for selection purpose. The
client organizations might also use the assessment results to help employees gain more insights
of their own strengths and weaknesses so as to stimulate leadership development activities. In
this case, the job incumbents identified by the client organizations were told that the assessment
data would be used for development purpose only and not for selection/promotion decisions. Job
applicants/incumbents participated in the assessment provided by PDI (which might involve the
GPI, cognitive ability tests, analytical skills tests, in-basket simulation, and a number of role
plays depending on the contract between the client organizations and PDI). The participants
took the GPI either at their workplace or at home. They were provided a link or URL address in
email to access PDI website where the GPI is located. After entering their username and
password, they were directed to a consent form page. By choosing "Decline", participants were
not allowed to continue the assessment process. By choosing "Agree", the participants were then
directed to the personal history data page on which they filled out demographics, work histories,
and career interests/aspirations. On the GPI page, they were asked to choose the reponses that
best described themselves. It usually took about 60 minutes for the participants to fill out the
21
questionnaires. The participants could either access their assessment results in their online
account once they completed the GPI or they can access the assessment feedback from their own
organization contact person (usually an HR representative). Only data from Chinese participants
were used for the current study.
Data Analysis
All negatively worded items were reverse coded so that all items were scored with high
values equivalent to high levels of the facet. All the items in the “negative affectivity” scale
were reverse coded to make the scale “positive affectivity” so that it was positively loaded on the
Emotional Stability factor. All the analyses described next were conducted using the LISREL
8.54 program.
Vandenberg and Lance (2000) conducted a thorough review of the ME/I literature of
CFA-based procedures and identified a series of tests to examine a full range of ME/I. In the
current study, lack of ME/I of GPI across incumbent and applicant samples was examined
following Vandenberg and Lance’s (2000) recommended procedure. First, an omnibus test of
equivalent covariance matrices across groups was conducted. The chi-square statistic was used
to evaluate the tenability of the null hypothesis. However, since the chi-square statistic is very
sensitive to the sample size and model complexity, other goodness-of-fit indices were also used
to evaluate model fit, such as the comparative fit index (CFI), Tucker-Lewis index (TLI), root
mean squared error of approximation (RMSEA), and standardized root mean squared residual
(SRMSR). For CFI and TLI, values above .95 suggest acceptable fit; RMSEA less than .06 and
SRMSR less than .08 represent a reasonable fit (Hu & Bentler, 1998, 1999). According to
Vandenberg and Lance (2000), failure to reject the null hypothesis is a demonstration of overall
measurement equivalence across groups, and further tests of specific aspects of ME/I are neither
22
needed nor warranted. However, the usefulness of the omnibus test has been questioned. For
example, the omnibus test may lead to contradictory findings (Raju et al., 2002). Sometimes the
null hypothesis of equal covariance matrices is tenable, but the subsequent tests of specific
aspects of ME/I do not hold; alternatively, the omnibus hypothesis is rejected but the subsequent
tests in fact support ME/I. Therefore, regardless of whether the omnibus test indicated a lack of
ME/I, a series of increasingly restrictive hypotheses of ME/I were tested.
The first test of a series of nested models was that the number of factors and factor
patterns remained the same across groups (a “configural invariance” model). Failure to reject the
null hypothesis of configural invariance meant that job incumbents and applicants were using the
same conceptual frame of reference and might be ultimately compared. Further tests of ME/I
could proceed in this case. However, if the null hypothesis was rejected, comparison between
these two groups would be meaningless and further tests of ME/I would not be justified.
The second model tested was that factor loadings of like indicators were equal across
groups. In addition to specifying an invariant factor pattern, factor loadings of like indicators
were constrained to be equal. This metric invariance model was compared with the configural
invariance model, and a significant change of chi-square statistic would indicate that the
additional constraints were not warranted and subsequent tests of ME/I should not be continued.
Should the metric invariance model hold, the scalar invariance model was tested next. In
this model, the vector of indicator intercepts was invariant across incumbent and applicant
groups. This model was compared against the metric invariance model to determine if additional
ME/I tests should proceed.
The next step was a test of the invariance of the unique variances across groups. In this
model, in addition to invariant factor pattern, factor loadings, and intercepts, like indicators’
23
uniqueness were constrained to be equal across incumbent and applicant groups. This model
was compared against the scalar invariance model and a significant change in chi-square statistic
would indicate that subsequent tests of ME/I were not justified.
The fifth step was a test for invariant factor variance. This test constrained the latent
factor variance to be equal across groups. Failure to reject the null hypothesis of equal factor
variance would indicate that job incumbents and applicants were using equivalent ranges of the
construct continuum to respond to the indicators reflecting the latent construct. This model was
compared with the model of invariant uniqueness to determine if test of ME/I should stop.
Next, equal factor covariance across groups was tested. This test (combining with the
previous test on equal factor variance) was to examine the equality of factor intercorrelations.
This model was compared with the model of equal factor variance and a nonsignificant change
of chi-square statistic would warrant the final test of ME/I.
The final test of ME/I was a test of equal factor means across groups. After ME/I being
established by the prior tests, this was the desired substantive test to determine whether job
incumbents and applicants differed in level on the underlying personality construct(s).
The aforementioned procedure on testing ME/I was conducted on each individual
personality factor of the Big Five (five one-factor models in which the individual Big Five factor
was the latent variable and its facets were the indicators) as well as to the five-factor of
personality model (one five-factor model in which the Big Five were the latent variables that
were intercorrelated with each other with the facets loaded on each factor respectively).
If there was a lack of full measurement invariance, sources of non-invariance would be
explored using four different methods. Among the four approaches, the MIMIC approach can
only be used to test for unequal factor loadings, but the other approaches can be used to test for
24
invariance of all the parameter estimates. The MIMIC approach (Muthen, 1988) has been
successfully employed to examine unequal factor loadings across groups (e.g., Griffin, Hesketh,
& Grayson, 2004; Grayson, Mackinnon, Jorm, Creasey, & Broe, 2000). Figure 1 illustrates the
model as applied to the Conscientiousness factor of the Big Five. The model consists of a
measurement model for Conscientiousness, with each of its four facets leading on it. A referent
indicator would be the one having the least different factor loadings in the configural invariance
model. The potential source of bias, that is being an applicant, is added as a covariate and direct
predictor of Conscientiousness with its effect labeled Beta. The differential effects of the
covariate (applicant) can be assessed by the direct paths to the facet scales. A significant
coefficient on the path from applicant to a facet scale, for example, Dutifulness, would indicate
that it operated differently across incumbent and applicant groups.
The model comparison approach was proposed by Raju et al. (2002). Being applied to
the Conscientiousness factor and its four facet scales (i.e., Attention to Detail, Dutifulness,
Responsibility, and Work Focus) to test for unequal factor loadings, this approach began by
testing a model in which only the factor loading of the first facet scale (Attention to Detail) was
constrained to be equal across groups. This model would be compared with the configural
invariance model. A significant change in chi-square statistic would indicate that the Attention
to Detail scale was operating differently across incumbent and applicant groups. The model
tested next would be constraining only the factor loading of the second facet scale (Dutifulness)
to be equal across groups, and it would be again compared with the configural invariance model
to determine whether the Dutifulness scale was operating equivalently. Continuing on this
manner, the equivalence of the next two facet scales would be tested one by one. If, for example,
there was evidence that the third facet scale (Responsibility) had equal factor loadings across

25
e1
e2
e3
Attention to Detail
Dutifulness
Responsibility
Group (Applicant = 1, Incumbent = 0)
Res
Conscientiousness
Work Focus e4
Figure 1. Path Diagram of MIMIC Model for Conscientiousness

26
groups, the next model tested for the invariance of the fourth facet scale (Work Focus) would be
concomitantly constraining both Responsibility and Work Focus to be equal across groups. In
other words, whenever there was evidence of invariant scales, their factor loadings would be
constrained to be equal, cumulatively, across groups. Such procedure would be continued until
all the four individual facet scales were tested for equal factor loadings. For all the models tested,
the facet scale that displayed the most similar factor loadings across groups in the configural
invariance model would be chosen as the referent indicator for identification purpose.
The MACS-MI approach (Chan, 2000) involved assessing a series of nested multiple-
group single-factor MACS models. Again, for identification purpose, for all MACS models, the
facet scale that displayed the most similar factor loadings across groups in the configural
invariance model would be chosen as the referent indicator. To detect the facet scales that
operated differently, a “fully constrained” model would be first tested in which all corresponding
factor loadings would be constrained to be equal across groups. The size of the modification
index (MI) associated with each factor loading would be used to flag the facet scales that
operated differently across groups. The statistical significance of an MI value would be
determined at a selected alpha value. The MI shows the expected reduction in the model chi-
square value when the associated factor loading is freely estimated without imposing the equality
constraint. When the largest MI value was significant, this meant that the associated facet scale
functioned differently across groups. The equality constraint on its factor loading would be
removed and the model would be refitted to identify the largest MI associated with the factor
loadings of the remaining scales upon which equality constraints would still be imposed. The
procedure was continued until the largest MI value was not significant. Because the iterative
procedure required that MI values of the facet scales on each factor be examined multiple times
27
for statistical significance, a Bonferonni correction was used to select the alpha value at each step
of the iterative procedure. For example, if six MIs were examined at a given step, then the alpha
value for determining the significance of the largest of the six MIs would be .05/6.
The Z test proposed by Cheung (2002) was also used to determine the difference of
parameter estimates. To test for equal factor loadings across groups, the Z statistic is defined as:
(λ1-λ2)/(SE12 + SE2
2)1/2 (1)
where λ1 and λ2 are comparable factor loadings in groups 1 and 2 and SE refers to the standard
errors associated with the factor loadings. This formula could be used to test between-group
difference on other parameters as well.
28
CHAPTER 5
RESULTS
Descriptive Statistics
Table 2 contains descriptive statistics for the 37 GPI scales for job incumbents and
applicants. An examination of the means in Table 2 shows that job applicants scored higher on
all the desirable traits (except Independence) and lower on all the undesirable traits (except
Impressing) than the job incumbents. It should be noted that Independence is considered as an
undesirable trait in collectivistic cultures such as China. Therefore it is not surprising that its
mean was higher for the incumbents. Impressing, although not designed to be a social
desirability/faking scale, seemed to capture the tendency to make good impressions on others in
test situations. In addition to inflated means, the alphas for the job applicants were consistently
higher than job incumbents across scales. This indicates that compared to job incumbents, job
applicants were more consistent in their responses to the items.
Measurement Model
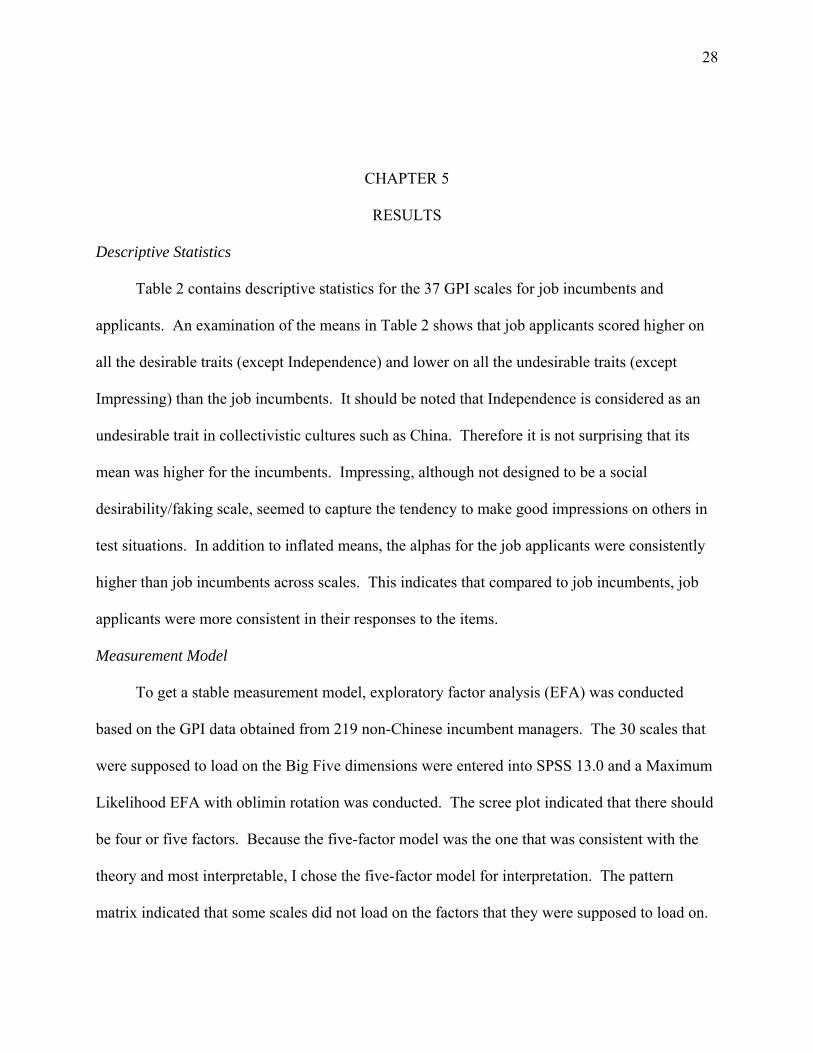
To get a stable measurement model, exploratory factor analysis (EFA) was conducted
based on the GPI data obtained from 219 non-Chinese incumbent managers. The 30 scales that
were supposed to load on the Big Five dimensions were entered into SPSS 13.0 and a Maximum
Likelihood EFA with oblimin rotation was conducted. The scree plot indicated that there should
be four or five factors. Because the five-factor model was the one that was consistent with the
theory and most interpretable, I chose the five-factor model for interpretation. The pattern
matrix indicated that some scales did not load on the factors that they were supposed to load on.

29
Table 2
Reliability, means, and standard deviations for the GPI scales
Incumbent Applicant α M SD α M SD Adaptability (8) .81 5.01 .85 .95 5.71 .88 Attention to Detail (9) .86 5.75 1.09 .96 6.22 1.42 Competitiveness (8) .80 4.54 1.01 .91 4.78 1.27 Consideration (10) .88 7.17 .90 .98 8.07 1.04 Drive for Achievement (8) .90 5.71 .96 .97 6.53 .92 Drive for Advancement (7) .81 4.25 .94 .93 4.57 1.14 Dutifulness (8) .81 5.40 .85 .95 5.94 1.00 Ego-Centered* (7) .71 3.32 .81 .88 3.45 1.02 Emotional Control (7) .81 4.35 .92 .93 4.91 .81 Empathy (7) .87 4.87 .71 .97 5.52 .73 Energy Level (9) .87 5.72 1.05 .96 6.61 1.01 Impressing* (7) .72 4.14 .69 .92 4.54 .83 Independence (8) .73 3.58 .88 .84 3.30 .90 Influence (9) .90 5.83 1.03 .97 6.80 1.05 Initiative (9) .89 6.05 .91 .97 6.96 .90 Innovativeness/Creativity (9) .89 6.07 1.03 .98 7.02 1.01 Interdependence (8) .83 5.27 .88 .96 5.87 1.07 Intimidating* (7) .60 2.79 .81 .78 2.61 .94 Manipulation* (10) .78 4.30 1.19 .86 3.73 1.35 Micro-Managing* (7) .64 2.44 .80 .77 2.20 .92 Negative Affectivity* (7) .59 2.03 .72 .70 1.56 .80 Passive-Aggressive* (7) .66 2.99 .86 .82 2.55 .98 Openness (7) .75 4.31 .76 .94 5.06 .78 Optimism (9) .87 6.17 .98 .96 7.14 .91 Responsibility (7) .91 5.59 .68 .98 6.24 .66 Risk-Taking (9) .85 5.45 1.18 .95 6.11 1.23 Self-Awareness/Self-Insight (9) .93 7.04 .82 .99 7.92 .87 Self-Confidence (7) .85 5.02 .64 .97 5.66 .68 Sociability (9) .87 5.71 1.13 .97 6.98 1.22 Social Astuteness (8) .87 5.35 .78 .97 5.98 .87 Stress Tolerance (8) .83 4.71 1.05 .94 5.50 1.00 Taking Charge (10) .91 6.98 1.10 .98 7.72 1.18 Thought Agility (9) .92 7.00 .84 .99 7.80 .85 Thought Focus (7) .90 4.89 .73 .97 5.60 .76 Trust (7) .85 5.06 .72 .97 5.52 .90 Vision (9) .90 6.09 .96 .98 6.95 1.00 Work Focus (9) .87 6.24 .99 .97 7.14 1.05 Note. Number of items for each scale are in parentheses. Each item is scored 1 = 0, 2 = .25, 3 = .5, 4 = .75, 5 = 1. * High scores on these scales are undesirable.

30
For example, the Independence scale did not load on any of the five factors, and the Adaptability
scale loaded on the Agreeableness factor instead of the Extraversion factor on which it was
supposed to load. The number of scales was finally trimmed down to 24 when a relatively clean
five-factor model was resulted (see Table 3 for the EFA factor loadings). All the 24 scales
loaded on their respective factors except for the Self-Confidence scale, which, according to
Schmit et al. (2000), should be loaded on the Emotional Stability factor. It should be admitted
that although the Big Five structure has received considerable support, there is no universal
agreement on the exact personality characteristics that should be assigned to each dimension
(Mount & Barrick, 1995). Given the fact that Self-confidence has been used by other personality
psychologists to describe extraverted people (e.g., Fiske, 1949), it makes sense to assign it to the
Extraversion factor.
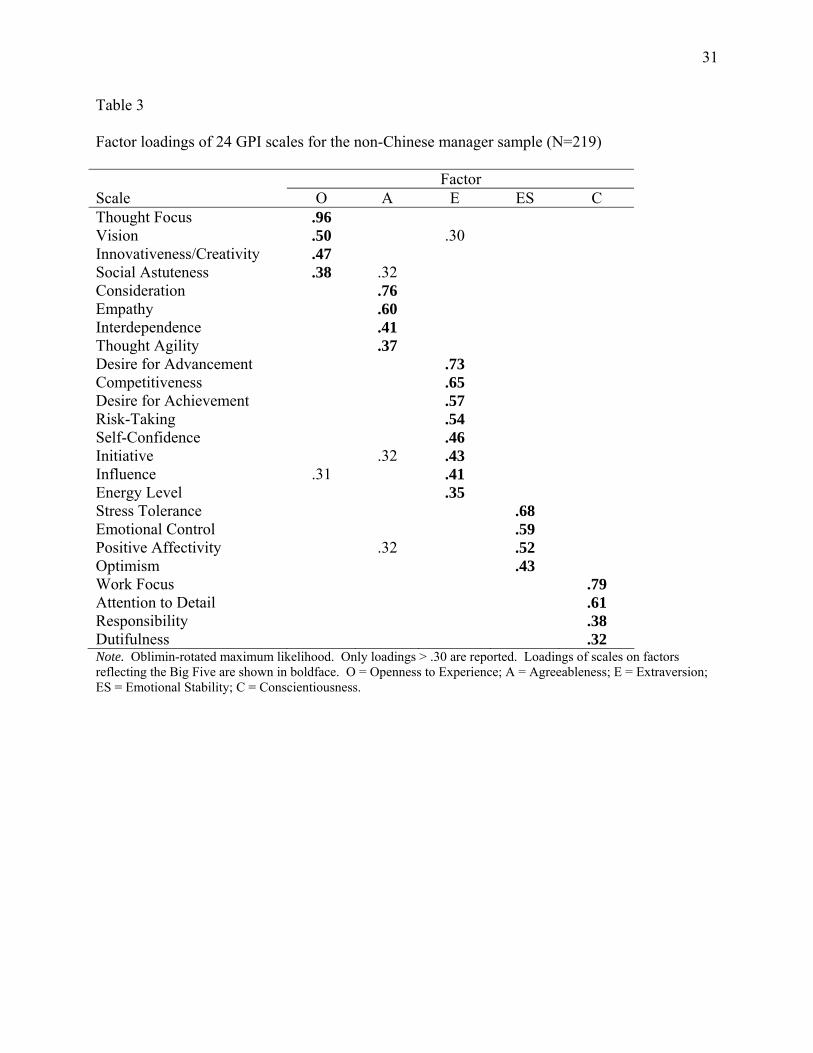
A CFA of the five-factor model with the 24 scales was conducted in the Chinese job
incumbent sample. The fit of this model was acceptable (χ2(242) = 678.95, p<.01, CFI = .94,
TLI = .93, RMSEA = .09, SRMSR = .08). Therefore, this model was treated as a relatively
stable measurement model (Figure 2) for the GPI scales and such a five-factor model was used
for the subsequent ME/I analyses.
ME/I
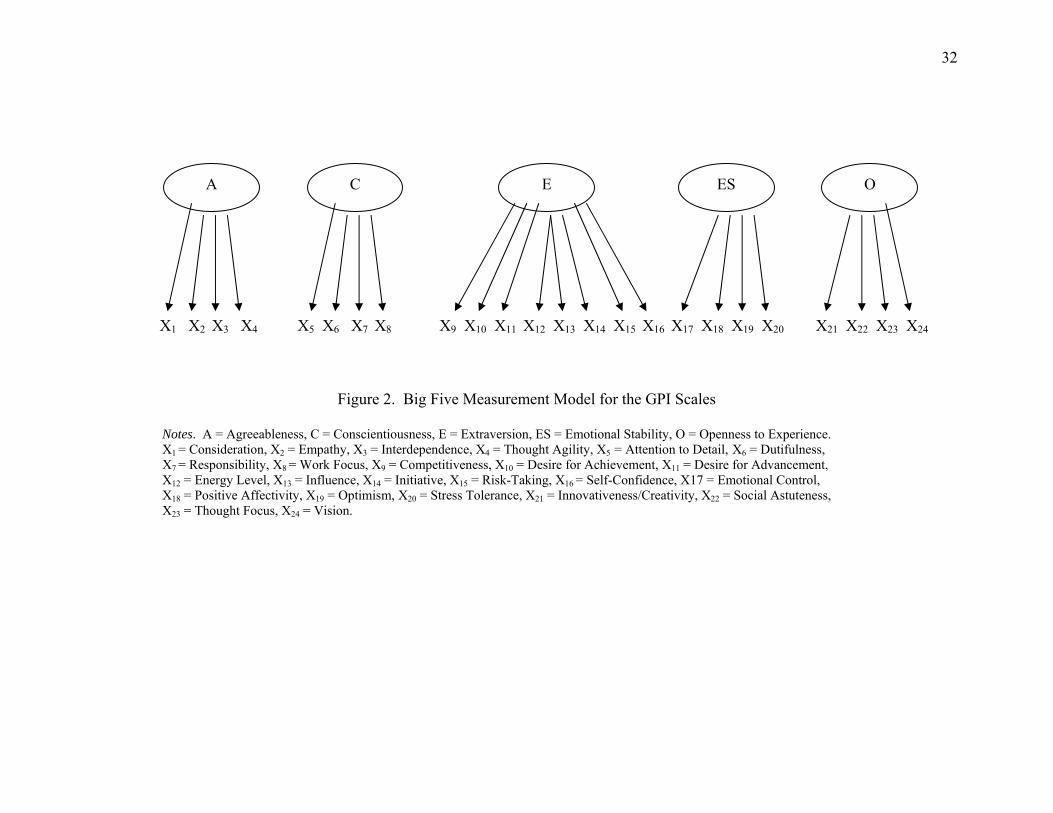
ME/I was tested for each individual personality factor of the Big Five following
Vandenberg and Lance’s (2000) recommended procedure using multiple-sample CFA. The
results are presented in Tables 4-8. Among the Big Five dimensions, Agreeableness and
Openness to Experience each had the same factor structures with the same factor loadings,
intercepts, uniquenesses, and factor variances across job incumbents and job applicants. The
31
Table 3
Factor loadings of 24 GPI scales for the non-Chinese manager sample (N=219) Factor Scale O A E ES C Thought Focus .96 Vision .50 .30 Innovativeness/Creativity .47 Social Astuteness .38 .32 Consideration .76 Empathy .60 Interdependence .41 Thought Agility .37 Desire for Advancement .73 Competitiveness .65 Desire for Achievement .57 Risk-Taking .54 Self-Confidence .46 Initiative .32 .43 Influence .31 .41 Energy Level .35 Stress Tolerance .68 Emotional Control .59 Positive Affectivity .32 .52 Optimism .43 Work Focus .79 Attention to Detail .61 Responsibility .38 Dutifulness .32 Note. Oblimin-rotated maximum likelihood. Only loadings > .30 are reported. Loadings of scales on factors reflecting the Big Five are shown in boldface. O = Openness to Experience; A = Agreeableness; E = Extraversion; ES = Emotional Stability; C = Conscientiousness.
32
A C ES O E
X1 X2 X3 X4 X5 X6 X7 X8 X9 X10 X11 X12 X13 X14 X15 X16 X17 X18 X19 X20 X21 X22 X23 X24
Figure 2. Big Five Measurement Model for the GPI Scales
Notes. A = Agreeableness, C = Conscientiousness, E = Extraversion, ES = Emotional Stability, O = Openness to Experience. X1 = Consideration, X2 = Empathy, X3 = Interdependence, X4 = Thought Agility, X5 = Attention to Detail, X6 = Dutifulness, X7 = Responsibility, X8 = Work Focus, X9 = Competitiveness, X10 = Desire for Achievement, X11 = Desire for Advancement, X12 = Energy Level, X13 = Influence, X14 = Initiative, X15 = Risk-Taking, X16 = Self-Confidence, X17 = Emotional Control, X18 = Positive Affectivity, X19 = Optimism, X20 = Stress Tolerance, X21 = Innovativeness/Creativity, X22 = Social Astuteness, X23 = Thought Focus, X24 = Vision.
33
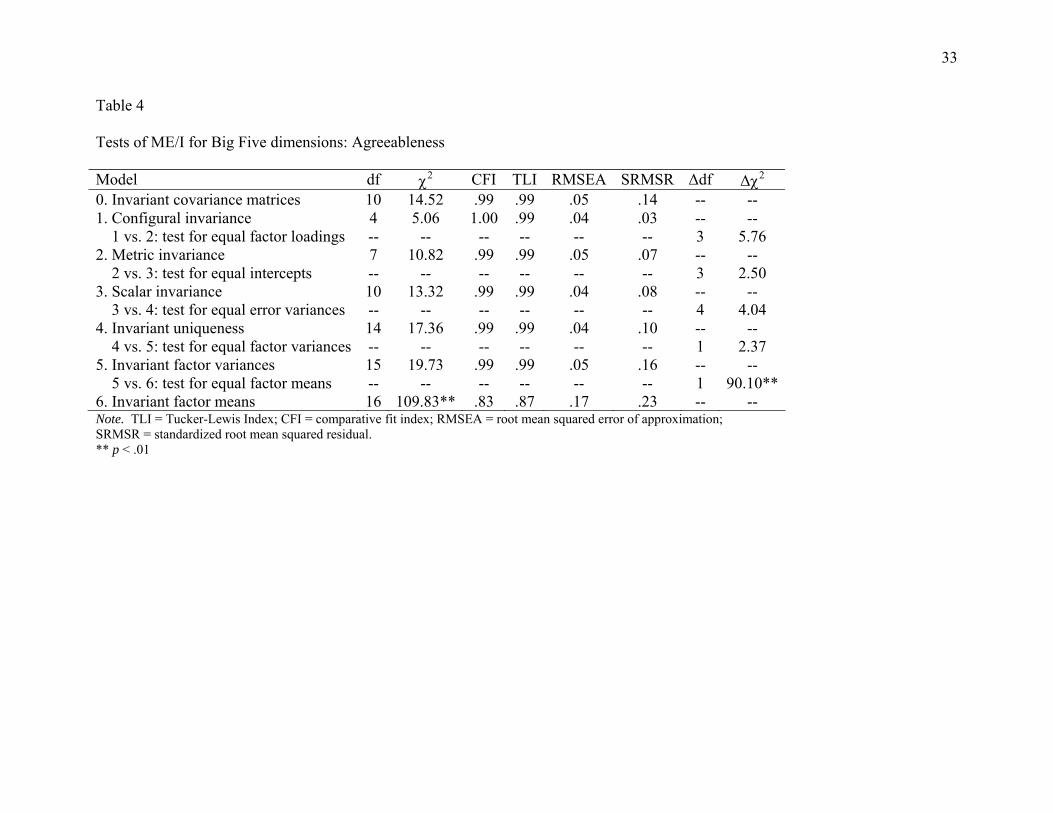
Table 4 Tests of ME/I for Big Five dimensions: Agreeableness Model df CFIχ2 TLI RMSEA SRMSR ∆df ∆χ2
0. Invariant covariance matrices 10 14.52 .99 .99 .05 .14 -- -- 1. Configural invariance 4 5.06 1.00 .99 .04 .03 -- -- 1 vs. 2: test for equal factor loadings -- -- -- -- -- -- 3 5.76 2. Metric invariance 7 10.82 .99 .99 .05 .07 -- -- 2 vs. 3: test for equal intercepts -- -- -- -- -- -- 3 2.50 3. Scalar invariance 10 13.32 .99 .99 .04 .08 -- -- 3 vs. 4: test for equal error variances -- -- -- -- -- -- 4 4.04 4. Invariant uniqueness 14 17.36 .99 .99 .04 .10 -- -- 4 vs. 5: test for equal factor variances -- -- -- -- -- -- 1 2.37 5. Invariant factor variances 15 19.73 .99 .99 .05 .16 -- -- 5 vs. 6: test for equal factor means -- -- -- -- -- -- 1 90.10**6. Invariant factor means 16 109.83** .83 .87 .17 .23 -- -- Note. TLI = Tucker-Lewis Index; CFI = comparative fit index; RMSEA = root mean squared error of approximation; SRMSR = standardized root mean squared residual. ** p < .01
34
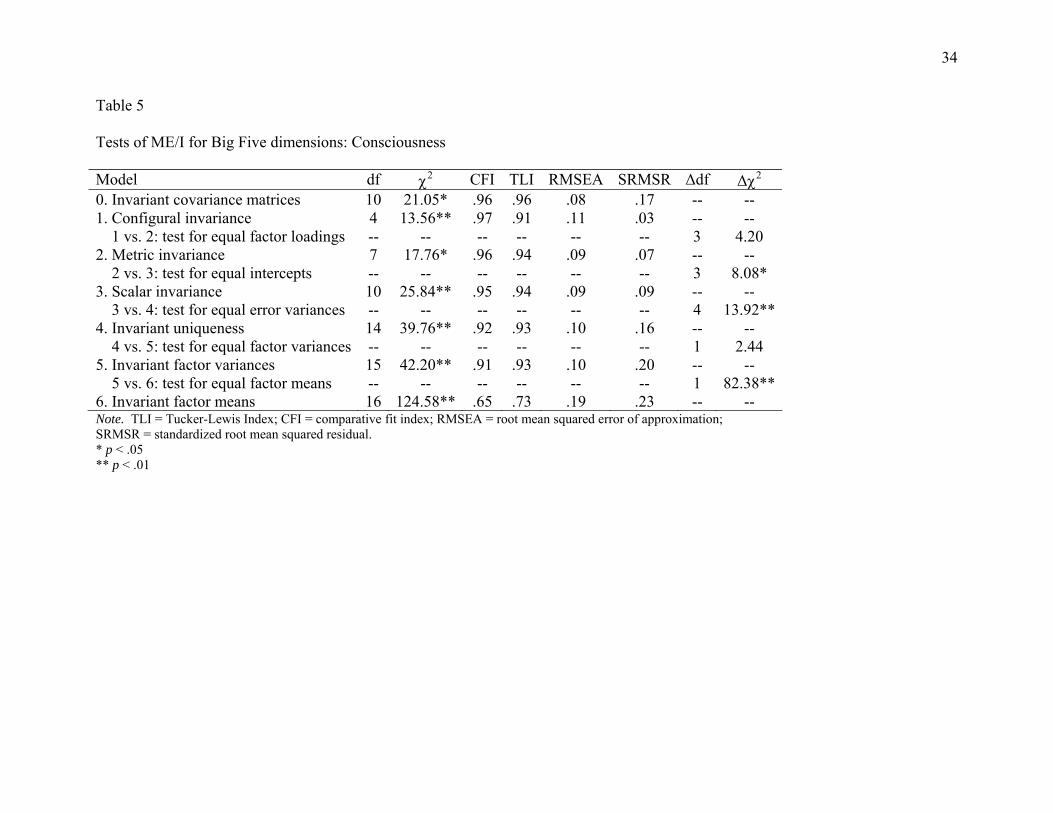
Table 5 Tests of ME/I for Big Five dimensions: Consciousness Model df CFIχ2 TLI RMSEA SRMSR ∆df ∆χ2
0. Invariant covariance matrices 10 21.05* .96 .96 .08 .17 -- -- 1. Configural invariance 4 13.56** .97 .91 .11 .03 -- -- 1 vs. 2: test for equal factor loadings -- -- -- -- -- -- 3 4.20 2. Metric invariance 7 17.76* .96 .94 .09 .07 -- -- 2 vs. 3: test for equal intercepts -- -- -- -- -- -- 3 8.08* 3. Scalar invariance 10 25.84** .95 .94 .09 .09 -- -- 3 vs. 4: test for equal error variances -- -- -- -- -- -- 4 13.92**4. Invariant uniqueness 14 39.76** .92 .93 .10 .16 -- -- 4 vs. 5: test for equal factor variances -- -- -- -- -- -- 1 2.44 5. Invariant factor variances 15 42.20** .91 .93 .10 .20 -- -- 5 vs. 6: test for equal factor means -- -- -- -- -- -- 1 82.38**6. Invariant factor means 16 124.58** .65 .73 .19 .23 -- -- Note. TLI = Tucker-Lewis Index; CFI = comparative fit index; RMSEA = root mean squared error of approximation; SRMSR = standardized root mean squared residual. * p < .05 ** p < .01
35
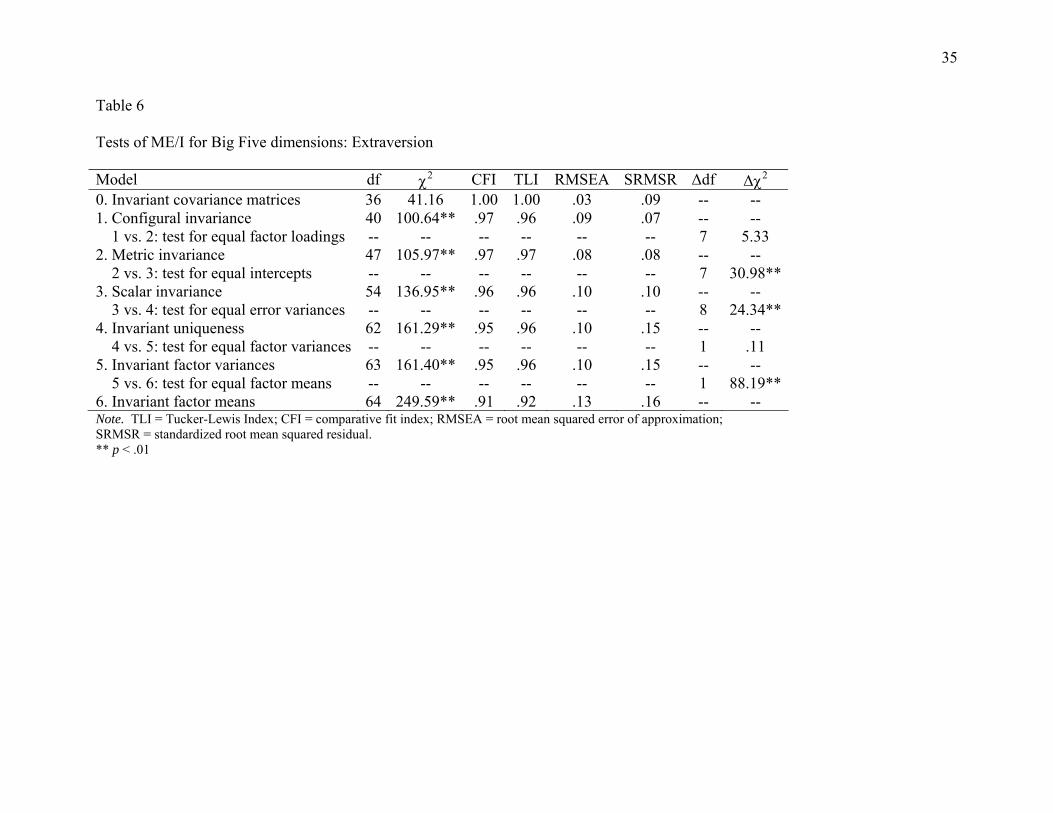
Table 6 Tests of ME/I for Big Five dimensions: Extraversion Model df CFIχ2 TLI RMSEA SRMSR ∆df ∆χ2
0. Invariant covariance matrices 36 41.16 1.00 1.00 .03 .09 -- -- 1. Configural invariance 40 100.64** .97 .96 .09 .07 -- -- 1 vs. 2: test for equal factor loadings -- -- -- -- -- -- 7 5.33 2. Metric invariance 47 105.97** .97 .97 .08 .08 -- -- 2 vs. 3: test for equal intercepts -- -- -- -- -- -- 7 30.98**3. Scalar invariance 54 136.95** .96 .96 .10 .10 -- -- 3 vs. 4: test for equal error variances -- -- -- -- -- -- 8 24.34**4. Invariant uniqueness 62 161.29** .95 .96 .10 .15 -- -- 4 vs. 5: test for equal factor variances -- -- -- -- -- -- 1 .11 5. Invariant factor variances 63 161.40** .95 .96 .10 .15 -- -- 5 vs. 6: test for equal factor means -- -- -- -- -- -- 1 88.19**6. Invariant factor means 64 249.59** .91 .92 .13 .16 -- -- Note. TLI = Tucker-Lewis Index; CFI = comparative fit index; RMSEA = root mean squared error of approximation; SRMSR = standardized root mean squared residual. ** p < .01

36
Table 7 Tests of ME/I for Big Five dimensions: Emotional Stability Model df CFIχ2 TLI RMSEA SRMSR ∆df ∆χ2
0. Invariant covariance matrices 10 7.48 1.00 1.01 .00 .09 -- -- 1. Configural invariance 4 5.43 .99 .98 .05 .02 -- -- 1 vs. 2: test for equal factor loadings -- -- -- -- -- -- 3 3.08 2. Metric invariance 7 8.51 .99 .99 .04 .05 -- -- 2 vs. 3: test for equal intercepts -- -- -- -- -- -- 3 8.79* 3. Scalar invariance 10 17.30 .97 .97 .07 .07 -- -- 3 vs. 4: test for equal error variances -- -- -- -- -- -- 4 3.22 4. Invariant uniqueness 14 20.52 .98 .98 .05 .09 -- -- 4 vs. 5: test for equal factor variances -- -- -- -- -- -- 1 .35 5. Invariant factor variances 15 20.87 .98 .98 .05 .09 -- -- 5 vs. 6: test for equal factor means -- -- -- -- -- -- 1 85.94**6. Invariant factor means 16 106.81** .66 .75 .16 .10 -- -- Note. TLI = Tucker-Lewis Index; CFI = comparative fit index; RMSEA = root mean squared error of approximation; SRMSR = standardized root mean squared residual. * p < .05 ** p < .01
37
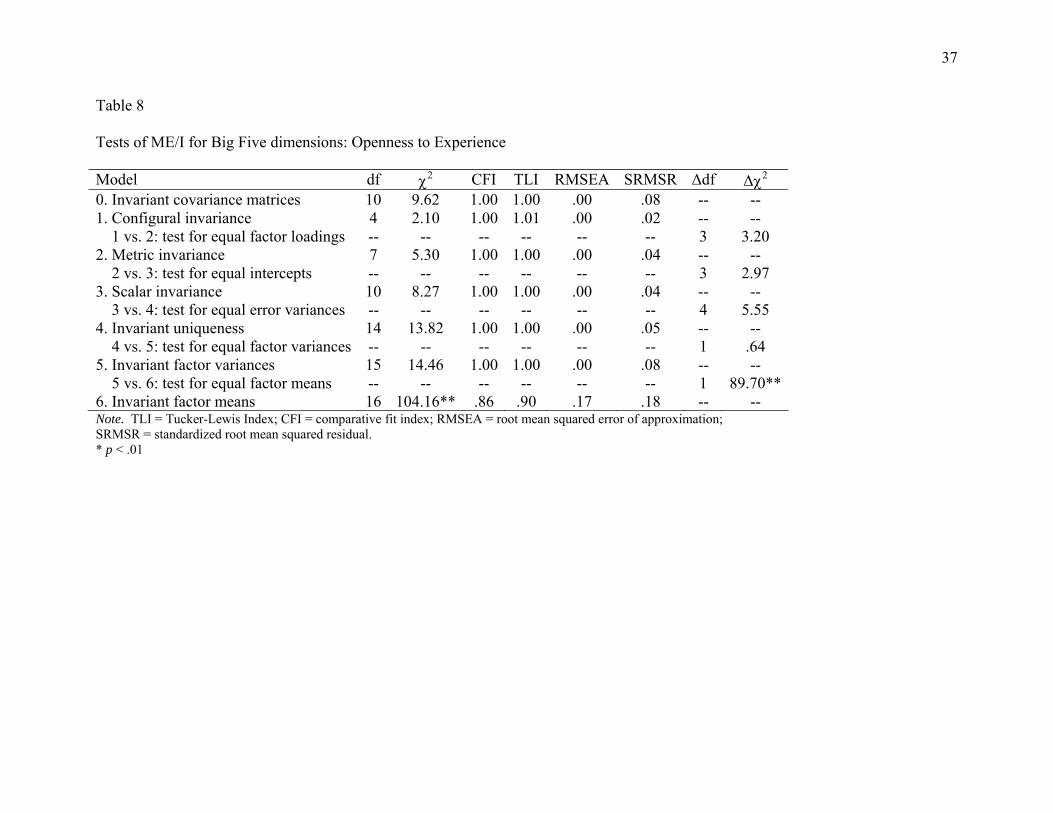
Table 8 Tests of ME/I for Big Five dimensions: Openness to Experience Model df CFIχ2 TLI RMSEA SRMSR ∆df ∆χ2
0. Invariant covariance matrices 10 9.62 1.00 1.00 .00 .08 -- -- 1. Configural invariance 4 2.10 1.00 1.01 .00 .02 -- -- 1 vs. 2: test for equal factor loadings -- -- -- -- -- -- 3 3.20 2. Metric invariance 7 5.30 1.00 1.00 .00 .04 -- -- 2 vs. 3: test for equal intercepts -- -- -- -- -- -- 3 2.97 3. Scalar invariance 10 8.27 1.00 1.00 .00 .04 -- -- 3 vs. 4: test for equal error variances -- -- -- -- -- -- 4 5.55 4. Invariant uniqueness 14 13.82 1.00 1.00 .00 .05 -- -- 4 vs. 5: test for equal factor variances -- -- -- -- -- -- 1 .64 5. Invariant factor variances 15 14.46 1.00 1.00 .00 .08 -- -- 5 vs. 6: test for equal factor means -- -- -- -- -- -- 1 89.70**6. Invariant factor means 16 104.16** .86 .90 .17 .18 -- -- Note. TLI = Tucker-Lewis Index; CFI = comparative fit index; RMSEA = root mean squared error of approximation; SRMSR = standardized root mean squared residual. * p < .01

38
latent means for the two personality dimensions were significantly higher for job applicants
versus job incumbents (∆χ2(1) = 90.10, p < .01 for Agreeableness and ∆χ2(1) = 89.70, p < .01 for
Openness to Experience). Emotional Stability demonstrated equal factor structure, factor
loadings, uniquenesses and factor variance across job incumbents and job applicants. However,
the indicator intercepts and factor means were not equal across groups. For Conscientiousness
and Extraversion, the factor structures, factor loadings and factor variances were the same across
groups, but the indicator intercepts, uniquenesses, and factor means were not equal. The Big
Five model was also tested for ME/I. The results in Table 9 suggest that the five-factor structure
only demonstrated equal factor structures and equal factor variances across groups. The rest of
the ME/I tests did not hold.
To detect the source of measurement non-invariance, partial ME/I was tested for
Conscientiousness, Extraversion, and Emotional Stability using the Model Comparison approach,
MACS-MI approach and the Z test. The MIMIC approach can only be used to test for unequal
factor loadings across groups, and to the extent that none of the Big Five factors demonstrated
metric non-invariance, this approach was judged inappropriate for the partial ME/I tests.
Table 10 displays the partial ME/I results for Conscientiousness using the Model
Comparison approach. The comparison between the full scalar invariance model (model 3) with
the full metric invariance model (model 2) yielded a significant change of chi-square statistic
(∆χ2 (3) = 8.08, p < .05), indicating that the facet scales of the Conscientiousness factor had
unequal intercepts. To identify the source of non-invariance, model 3a was tested in which only
the intercept of Dutifulness was constrained to be equal across groups (Attention to Detail was
the referent indicator). Comparison of this model (model 3a) with model 2 resulted a statistically

39
Table 9 Tests of ME/I for Big Five dimensions Model df CFIχ2 TLI RMSEA SRMSR ∆df ∆χ2
0. Invariant covariance matrices 300 398.15** .98 .96 .03 .09 -- -- 1. Configural invariance 484 1246.61** .94 .93 .09 .09 -- -- 1 versus 2: test for equal factor loadings -- -- -- -- -- -- 19 16.97 2. Metric invariance 503 1263.58** .94 .93 .09 .10 -- -- 2 vs. 3: test for equal intercepts -- -- -- -- -- -- 19 32.05* 3. Scalar invariance 522 1295.63** .94 .93 .09 .10 -- -- 3 vs. 4: test for equal error variances -- -- -- -- -- -- 24 52.88** 4. Invariant uniqueness 546 1348.51** .93 .93 .09 .11 -- -- 4 vs. 5: test for equal factor variances -- -- -- -- -- -- 5 17.17** 5. Invariant factor variances 551 1352.91** .93 .93 .09 .12 -- -- 5 vs. 6: test for equal factor covariances -- -- -- -- -- -- 10 12.77 6. Invariant factor covariances 561 1365.68** .93 .93 .09 .13 -- -- 6 vs. 7: test for equal factor means -- -- -- -- -- -- 5 132.01**7. Invariant factor means 566 1497.69** .92 .93 .10 .18 -- -- Note. TLI = Tucker-Lewis Index; CFI = comparative fit index; RMSEA = root mean squared error of approximation; SRMSR = standardized root mean squared residual. * p < .05 ** p < .01
40
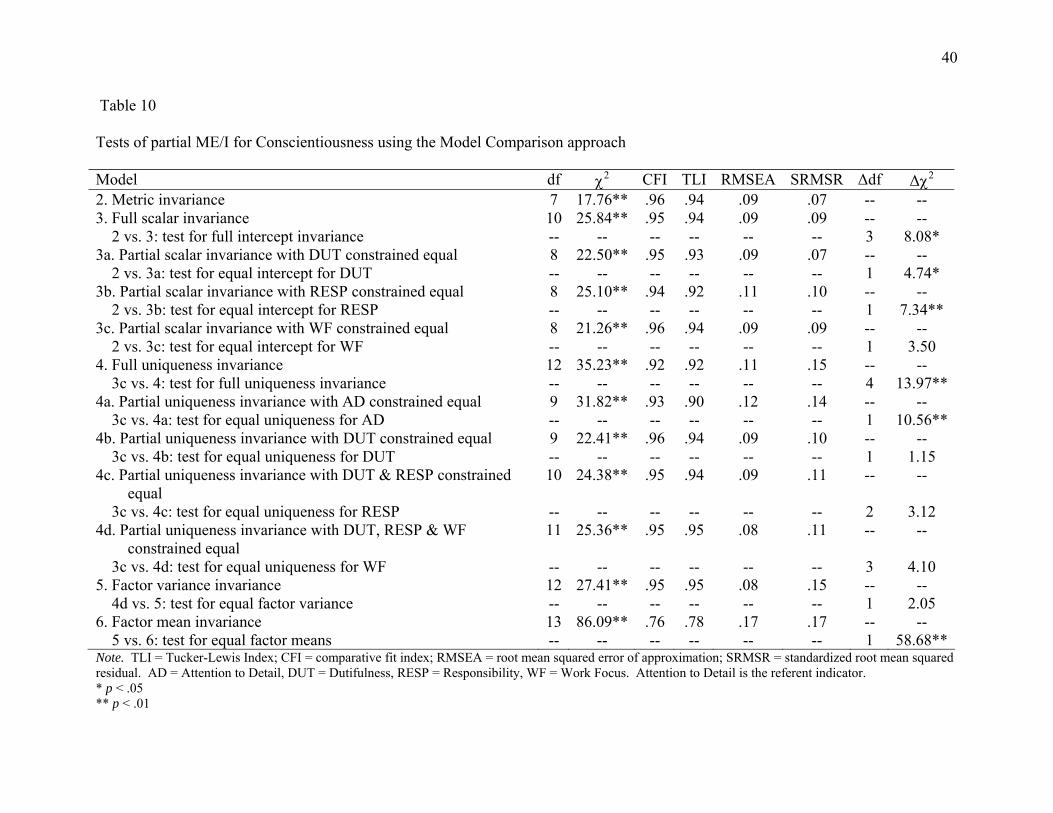
Table 10 Tests of partial ME/I for Conscientiousness using the Model Comparison approach Model df RMSEAχ2 CFI TLI SRMSR ∆df ∆χ2
2. Metric invariance 7 17.76** .96 .94 .09 .07 -- -- 3. Full scalar invariance 10 25.84** .95 .94 .09 .09 -- -- 2 vs. 3: test for full intercept invariance -- -- -- -- -- -- 3 8.08* 3a. Partial scalar invariance with DUT constrained equal 8 22.50** .95 .93 .09 .07 -- -- 2 vs. 3a: test for equal intercept for DUT -- -- -- -- -- -- 1 4.74* 3b. Partial scalar invariance with RESP constrained equal 8 25.10** .94 .92 .11 .10 -- -- 2 vs. 3b: test for equal intercept for RESP -- -- -- -- -- -- 1 7.34** 3c. Partial scalar invariance with WF constrained equal 8 21.26** .96 .94 .09 .09 -- -- 2 vs. 3c: test for equal intercept for WF -- -- -- -- -- -- 1 3.50 4. Full uniqueness invariance 12 35.23** .92 .92 .11 .15 -- -- 3c vs. 4: test for full uniqueness invariance -- -- -- -- -- -- 4 13.97**4a. Partial uniqueness invariance with AD constrained equal 9 31.82** .93 .90 .12 .14 -- -- 3c vs. 4a: test for equal uniqueness for AD -- -- -- -- -- -- 1 10.56**4b. Partial uniqueness invariance with DUT constrained equal 9 22.41** .96 .94 .09 .10 -- -- 3c vs. 4b: test for equal uniqueness for DUT -- -- -- -- -- -- 1 1.15
4c. Partial uniqueness invariance with DUT & RESP constrained equal
10 24.38**
.95 .94 .09 .11 -- --
3c vs. 4c: test for equal uniqueness for RESP -- -- -- -- -- -- 2 3.12 4d. Partial uniqueness invariance with DUT, RESP & WF
constrained equal 11 25.36** .95 .95 .08 .11 -- --
3c vs. 4d: test for equal uniqueness for WF -- -- -- -- -- -- 3 4.10 5. Factor variance invariance 12 27.41** .95 .95 .08 .15 -- -- 4d vs. 5: test for equal factor variance -- -- -- -- -- -- 1 2.05 6. Factor mean invariance 13 86.09** .76 .78 .17 .17 -- -- 5 vs. 6: test for equal factor means -- -- -- -- -- -- 1 58.68**Note. TLI = Tucker-Lewis Index; CFI = comparative fit index; RMSEA = root mean squared error of approximation; SRMSR = standardized root mean squared residual. AD = Attention to Detail, DUT = Dutifulness, RESP = Responsibility, WF = Work Focus. Attention to Detail is the referent indicator. * p < .05 ** p < .01
41
significant change in chi-square (∆χ2(1) = 4.74, p < .05), indicating that the intercept of
Dutifulness was significantly different for incumbents versus applicants. The next model tested
(model 3b) was one in which only the intercept of Responsibility was constrained to be equal
across groups. Comparing to model 2, model 3b had a significant change in chi-square (∆χ2(1) =
7.34, p < .01), meaning that the intercept of Responsibility was also different for incumbents
versus applicants. The next model (model 3c) with only the intercept of Work Focus constrained
to be equal did not have a significant change in chi-square when compared to model 2, indicating
that the intercept of Work Focus was equal across groups. A further inspection of the LISREL
output showed that the Dutifulness and Responsibility scales had significantly higher intercepts
for job applicants versus incumbents. Next, a full uniqueness invariance model (model 4) was
tested. In this model, the intercepts of Dutifulness and Responsibility were freely estimated, the
intercept of Work Focus was constrained to be equal, and the uniquenesses of all the scales were
constrained to be equal across groups. Comparison between model 4 and model 3c was a test for
full uniqueness invariance and such comparison resulted a significant change in chi-square
statistic (∆χ2(4) = 13.97, p < .01), and therefore not all the scales had equal uniquenesses across
groups. To identify the source of non-invariance, model 4a was tested in which only the
uniqueness of Attention to Detail was constrained to be equal across groups. This model had a
significant larger chi-square compared to model 3 (∆χ2(1) = 10.56, p < .01), indicating that
Attention to Detail had unequal uniquenesses for incumbents and applicants. The next model
tested was one in which only the uniqueness of Dutifulness was constrained to be equal across
groups (model 4b). Comparison of this model with model 3c did not yield a significant change
in model fit, and therefore it was concluded that Dutifulness had equal uniqueness for
incumbents and applicants. Next, model 4c was tested in which the uniquenesses of both
42
Dutifulness and Responsibility were constrained to be equal across groups, and this model did
not differ significantly from model 3c in terms of model fit. Following that model 4d was tested
in which the uniquenesses of Dutifulness, Responsibility, and Work Focus were constrained to
be equal across group. Comparison between model 4d and model 3c did not result in a
significant change in chi-square statistic. Thus far, it was concluded that among the four facet
scales of Conscientiousness factor, only Attention to Detail had unequal uniquenesses across
incumbents and applicants. The next step was testing for equal factor invariance. In model 5,
the uniquenesses of Attention to detail was freely estimated whereas the rest of the three facet
scales were constrained to be equal on uniqueness, and in addition, the factor variance was
constrained to be equal across groups. This model (model 5) was not significantly different from
model 4d in terms of model fit, and therefore it was concluded that the variance of the latent
factor (Conscientiousness) was equal for incumbents and applicants. Lastly, model 6 was tested
in which the factor mean was constrained to be equal across groups, and this model had a
significantly higher chi-square statistic than model 5 (∆χ2(1) = 58.68, p < .01). The latent factor
mean was significantly higher for applicants versus incumbents.
The MACS-MI approach was also used to test partial ME/I for Conscientiousness. The
results are shown in Table 11. First of all, a full scalar invariance model (model 3) was tested, in
which the intercepts of all the facet scales were constrained to be equal across groups (Attention
to Detail was treated as the referent indicator). MI values were inspected for the constrained
intercepts, and an adjusted alpha value was determined based on Bonferonni correction. Because
a total of three MIs were examined at this step, the alpha value for determining the significance
of the largest of the three MIs was .05/3. Although the comparison of the full scalar invariance
model (model 3) with the full metric invariance model (model 2) resulted a significant change in

43
Table 11 Tests of partial ME/I for Conscientiousness using the MACS-MI approach Model df CFIχ2 TLI RMSEA SRMSR Largest MI ∆df ∆χ2
2. Metric invariance 7 17.76** .96 .94 .09 .07 -- -- -- 3. Full scalar invariance 10 25.84** .95 .94 .09 .09 3.22 for RESP
(ns. at α= .0167)
--
--
2 vs. 3: test for full intercept invariance
-- -- -- -- -- -- -- 3 8.08*
4. Full uniqueness invariance 14 39.76** .92 .93 .10 .16 10.63 for AD (sig. at α= .0125)
-- --
4a. Partial uniqueness invariance with AD freely estimated
13 29.61** .95 .95 .11 .08 2.21 for RESP (ns. at α= .0167)
-- --
3 vs. 4a: test for partial uniqueness invariance
-- -- -- -- -- -- -- 3 3.77
5. Factor variance invariance 14 31.49** .94 .95 .08 .14 1.92 (ns. at α= .05)
-- --
4a vs. 5: test for equal factor variance -- -- -- -- -- -- -- 1 1.88 6. Factor mean invariance 15 114.78** .68 .74 .17 .19 74.51
(sig. at α= .05) -- --
5 vs. 6: test for equal factor means -- -- -- -- -- -- -- 1 58.68** Note. TLI = Tucker-Lewis Index; CFI = comparative fit index; RMSEA = root mean squared error of approximation; SRMSR = standardized root mean squared residual. AD = Attention to Detail. Attention to Detail is the referent indicator. * p < .05 ** p < .01
44
chi-square (∆χ2(3) = 8.08, p < .05), the largest MI associated with Responsibility was 3.22,
which was not significant (p > .0167), indicating that none of the equality constraints on
intercepts should be freed. Next, a full uniqueness invariance model (model 4) was tested, in
which the uniquenesses of all the four facet scales were constrained to be equal across groups. In
this model, the largest MI associated with Attention to Detail was significant (MI=10.63, p
< .0125), indicating that Attention to Detail had unequal uniquenesses across incumbents and
applicants and its equality constraints should be freed. Thus in the model tested next (model 4a)
the uniqueness of Attention to Detail was freely estimated. In this model, the largest MI
associated with Responsibility was not significant (MI = 2.21, p > .0167), meaning that none of
the equality constraints on the uniquenesses should be freed anymore. A comparison of model
4a and model 3 further did not result in a significant change in chi-square statistic, indicating that
the partial uniqueness invariance model with the error variance of Attention to detail to be freely
estimated was sound. Following that, equal factor variance was tested across groups (model 5),
and the MI was non-significant (MI = 1.92, p > .05), indicating that the equality constraint on the
factor variance should not be freed. A comparison between model 5 with model 4a yielded a
non-significant change in model fit, and therefore it was concluded that the factor variance was
equal across incumbents and applicants. Finally, the factor mean was constrained to be equal
across groups (model 6) and the MI was significant (MI = 74.51, p < .05), indicating that the
factor means should not have been constrained to be equal across groups. A comparison
between model 6 and model 5 resulted in a significant change in model fit (∆χ2(1) = 58.68, p
< .01), meaning that the latent mean was higher for the applicants.
Table 12 displays the partial ME/I results for Conscientiousness using the Z test. First of
all, as the full scalar invariance model (model 3) had a significantly different chi-square statistic

45
Table 12 Tests of partial ME/I for Conscientiousness using the Z test Model df CFIχ2 TLI RMSEA SRMSR Z ∆df ∆χ2
2. Metric invariance 7 17.76** .96 .94 .09 .07 -- -- -- 3. Full scalar invariance 10 25.84** .95 .94 .09 .09 .34 for DUT
.46 for RESP .28 for WF
--
--
2 vs. 3: test for full intercept invariance
-- -- -- -- -- -- -- 3 8.08*
4. Full uniqueness invariance 14 39.76** .92 .93 .10 .16 2.83** for AD 1.00 for DUT
-1.40 for RESP -.53 for WF
-- --
3 vs. 4: test for full uniqueness invariance
-- -- -- -- -- -- -- 4 13.92**
4a. Partial uniqueness invariance with AD freely estimated
13 29.61** .95 .95 .11 .08 -- -- --
3 vs. 4a: test for partial uniqueness invariance
-- -- -- -- -- -- -- 3 3.77
5. Factor variance invariance 14 31.49** .94 .95 .08 .14 -- -- -- 4a vs. 5: test for equal factor variance -- -- -- -- -- -- -- 1 1.88 6. Factor mean invariance 15 114.78** .68 .74 .17 .19 6.05** -- -- 5 vs. 6: test for equal factor means -- -- -- -- -- -- -- 1 58.68** Note. TLI = Tucker-Lewis Index; CFI = comparative fit index; RMSEA = root mean squared error of approximation; SRMSR = standardized root mean squared residual. AD = Attention to Detail. Attention to Detail is the referent indicator. * p < .05 ** p < .01
46
as compared to the metric invariance model (model 2) (∆χ2(3) = 8.08, p < .05), the intercept
estimates in the unconstrained model (model 2) were compared across groups using the Z test.
None of the Z statistic for the three facet scales was significant. Then a full uniqueness
invariance model (model 4) was tested and this model had a significantly different chi-square
statistic as compared to the full scalar invariance model (model 3). Cross-group comparisons on
uniqueness estimates were conducted using the Z test. The results suggest that among the four
facet scales, Attention to Detail had a significantly larger uniqueness for the job applicants
versus job incumbents (Z = 2.83, p < .01). Therefore the next model tested was a partial
uniqueness invariance model (model 4a) in which the uniqueness of Attention to Detail was
freely estimated. Comparison between model 4a with model 3 did not yield a statistically
significant change in model fit. Then equal factor variance was tested and the model (model 5)
did not result in a significant change in chi-square statistic, meaning that the factor variance was
equal for the applicant and incumbent groups. Finally, the factor mean was constrained to be
equal across groups (model 6) and the results suggested that the applicants had statistically larger
factor mean than the incumbents (∆χ2(1) = 58.68, Z = 6.05, p < .01).
A comparison between the results obtained from the three approaches (see Table 13)
indicated that all of them identified the same scale (Attention to Detail) to have unequal
uniqueness across groups. For the intercepts, however, the Model Comparison approach
identified Dutifulness and Responsibility to be non-invariant across groups, whereas the MACS-
MI approach and the Z test did not detect any of the non-invariant scales.
Following the aforementioned procedure, partial ME/I was tested for Extraversion and
Emotional Stability dimensions as well, and the results are summarized in Table 13 (for the
detailed analyses, please refer to Appendices B-G). For Extraversion, the Model Comparison
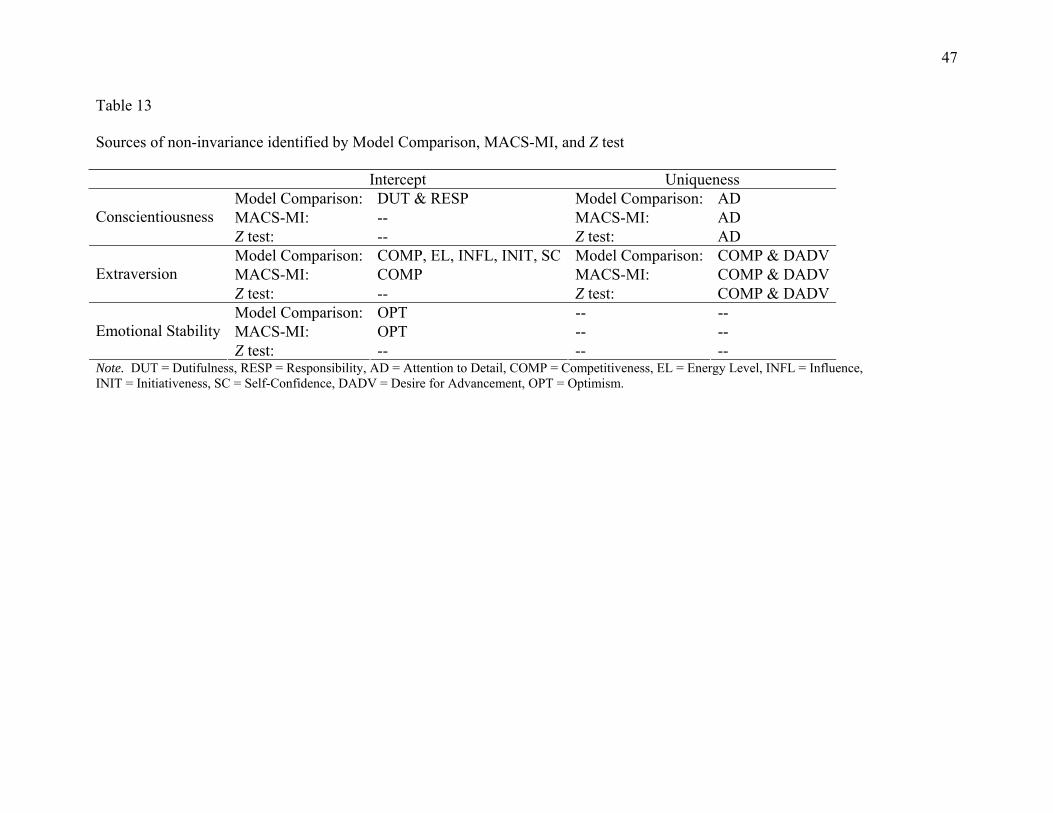
47
Table 13 Sources of non-invariance identified by Model Comparison, MACS-MI, and Z test
Intercept UniquenessModel Comparison: DUT & RESP Model Comparison: AD MACS-MI: -- MACS-MI: AD
Conscientiousness
Z test: -- Z test: AD Model Comparison: COMP, EL, INFL, INIT, SC Model Comparison: COMP & DADVMACS-MI: COMP MACS-MI: COMP & DADV
Extraversion
Z test: -- Z test: COMP & DADVModel Comparison: OPT -- -- MACS-MI: OPT -- --
Emotional Stability
Z test: -- -- -- Note. DUT = Dutifulness, RESP = Responsibility, AD = Attention to Detail, COMP = Competitiveness, EL = Energy Level, INFL = Influence, INIT = Initiativeness, SC = Self-Confidence, DADV = Desire for Advancement, OPT = Optimism.

48
approach identified five scales to have unequal intercepts across incumbents and applicants.
Among them, Competitiveness had lower intercepts for applicants, whereas Energy Level,
Influence, Initiativeness, and Self-Confidence had higher intercepts for applicants. The MACS
only identified Competitiveness to have lower intercepts for applicants. The Z test, however, did
not identify any scales to have differential intercepts across groups. In terms of uniquenesses, all
the three methods identified Competitiveness and Drive to Advancement to have unequal
uniquenesses across groups. All the three approaches also found the latent mean to be
significantly higher for job applicants. For Emotional Stability, both the Model Comparison and
MACS-MI approaches identified Optimism to have higher intercept for applicants, but the Z test
did not identify any scales to have unequal intercepts across groups. All the three approaches
concluded that the latent mean was higher for applicants versus incumbents.
Social Desirability Method Effect
In order to determine the extent to which social desirability affected the measurement
properties of the GPI, a series of models were tested according to the method bias methodology
suggested by Williams and Anderson (1994) for both the job incumbents and job applicants. In
the current study, five random items that had the lowest correlation with each other in the
incumbent sample were selected from the thirteen scales that were not loaded on the Big Five
dimensions, and the correlation among these random items was used as a proxy for common
method variance due to social desirability (Lindell & Whitney, 2001). The average
intercorrelation (absolute value) among the five random items was .09.
Figure 3 describes the series of method effect models tested in both the incumbent and
applicant samples (Stress Tolerance caused problems of model convergence and therefore was
excluded from the method effect analysis). There are three types of factor loadings in this figure:

49
a
X1 X2 X3 X4 X5 X6 X7 X8 X9 X10 X11 X12 X13 X14 X15 X16 X17 X18 X19 X20 X21 X22 X23
b X26 X24
c X27 X25 X28
Figure 3. Method Effect Model
Notes. A = Agreeableness, C = Conscientiousness, E = Extraversion, ES = Emotional Stability, O = Openness to Experience. X1 = Consideration, X2 =
Empathy, X3 = Interdependence, X4 = Thought Agility, X5 = Attention to Detail, X6 = Dutifulness, X7 = Responsibility, X8 = Work Focus, X9 = Competitiveness, X10 = Desire for Achievement, X11 = Desire for Advancement, X12 = Energy Level, X13 = Influence, X14 = Initiative, X15 = Risk-Taking, X16 = Self-Confidence, X17 = Emotional Control, X18 = Positive Affectivity, X19 = Optimism, X20 = Innovativeness/Creativity, X21 = Social Astuteness, X22 = Thought Focus, X23 = Vision. X24 = item5, X25 = item20, X26 = item97, X27 = item135, X28 = item163.
O
Method Effect
ES E C A
50
(a) GPI facet scales are loaded on their respective Big Five dimensions, (b) GPI facet scales are
loaded on the method factor, and (c) the five random items are loaded on the method factor.
According to Williams and Anderson’s (1994) approach, the first model (model A) tested
consisted of six factors, five personality dimensions each with their respective facet scales as
indicators and one method effect factor with the five random items as indicators. This model
served as the baseline model in which the a-type loadings and c-type loadings were freely
estimated, the b-type loadings were constrained to zero, and the five substantive personality
dimensions were allowed to correlate with each other. As can be seen from Table 14 and Table
15, the fit of the baseline model was acceptable for both the applicants (χ2(340) = 713.68, p<.01,
CFI = .94, TLI = .94, RMSEA = .10, SRMSR = .11) and the incumbents (χ2(340) = 792.54,
p<.01, CFI = .94, TLI = .93, RMSEA = .08, SRMSR = .09). The factor loadings of this baseline
model are reported in Table 16 and Table 17 for job applicants and job incumbents respectively.
For both samples, the GPI scales had strong factor loadings to their respective Big Five
dimensions. The random items did not have strong loadings to the method effect factor, and this
is not surprising because they were conceptually unrelated items and should not go together.
In order to determine whether there existed a method effect due to social desirability,
model B was tested in which the GPI scales were not only loaded on their respective Big Five
dimensions but also on the method effect factor. That is, a-type, b-type, and c-type loadings
depicted in Figure 3 were all freely estimated in model B. This model fit both applicant (∆χ2 (23)
= 151.97, p < .01) and incumbent (∆χ2(23) = 146.24, p < .01) samples significantly better than
model A. The change of chi-square statistic was larger for the applicants despite the fact that the
sample size of the applicant sample was much smaller than that of the incumbent sample. The
changes of other fit indices, such as CFI (from .94 to .96), RMSEA (from .10 to .08), and
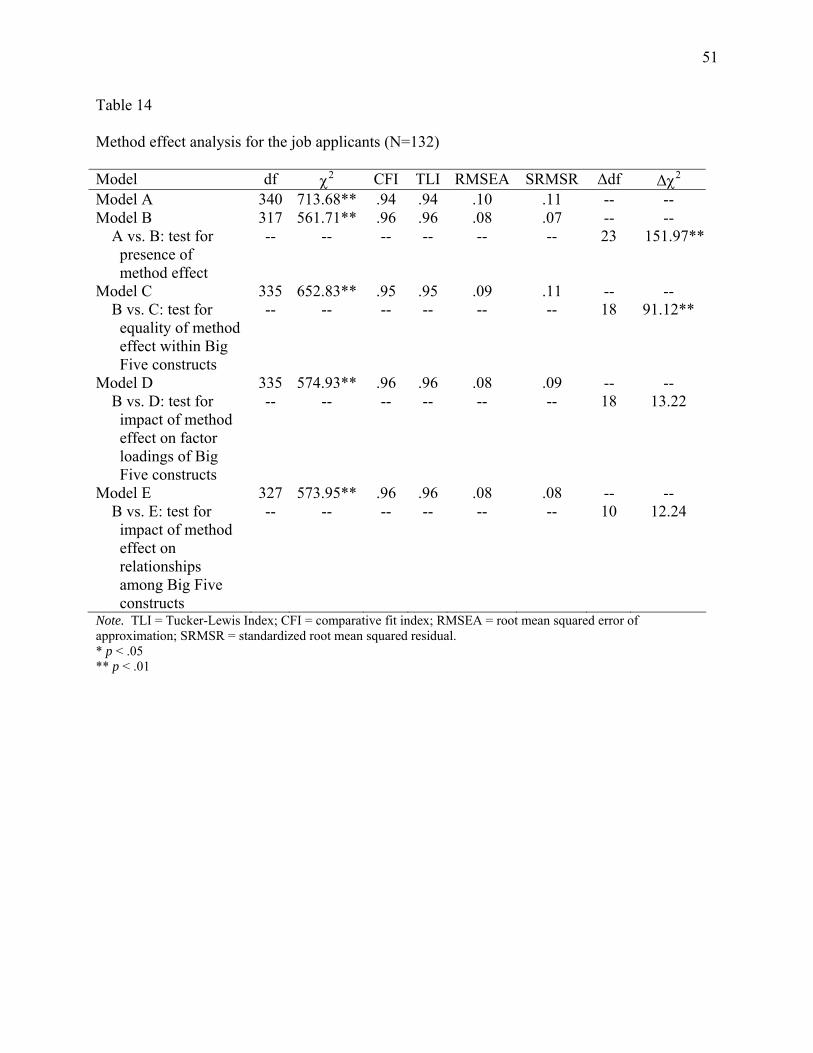
51
Table 14 Method effect analysis for the job applicants (N=132) Model df χ2 CFI TLI RMSEA SRMSR ∆df ∆χ2
Model A 340 713.68** .94 .94 .10 .11 -- -- Model B 317 561.71** .96 .96 .08 .07 -- --
A vs. B: test for presence of method effect
-- -- -- -- -- -- 23 151.97**
Model C 335 652.83** .95 .95 .09 .11 -- -- B vs. C: test for
equality of method effect within Big Five constructs
-- -- -- -- -- -- 18 91.12**
Model D 335 574.93** .96 .96 .08 .09 -- -- B vs. D: test for
impact of method effect on factor loadings of Big Five constructs
-- -- -- -- -- -- 18 13.22
Model E 327 573.95** .96 .96 .08 .08 -- -- B vs. E: test for
impact of method effect on relationships among Big Five constructs
-- -- -- -- -- -- 10 12.24
Note. TLI = Tucker-Lewis Index; CFI = comparative fit index; RMSEA = root mean squared error of approximation; SRMSR = standardized root mean squared residual. * p < .05 ** p < .01

52
Table 15 Method effect analysis for the job incumbents (N=243) Model df χ2 CFI TLI RMSEA SRMSR ∆df ∆χ2
Model A 340 792.54** .94 .93 .08 .09 -- -- Model B 317 646.30** .95 .95 .08 .07 -- --
A vs. B: test for presence of method effect
-- -- -- -- -- -- 23 146.24**
Model C 335 749.49** .94 .94 .07 .08 -- -- B vs. C: test for
equality of method effect within Big Five constructs
-- -- -- -- -- -- 18 103.19**
Model D 335 667.63** .95 .95 .06 .08 -- -- B vs. D: test for
impact of method effect on factor loadings of Big Five constructs
-- -- -- -- -- -- 18 21.33
Model E 327 653.75** .95 .95 .06 .07 -- -- B vs. E: test for
impact of method effect on relationships among Big Five constructs
-- -- -- -- -- -- 10 7.45
Note. TLI = Tucker-Lewis Index; CFI = comparative fit index; RMSEA = root mean squared error of approximation; SRMSR = standardized root mean squared residual. * p < .05 ** p < .01

53
Table 16 Factor loadings of the baseline method effect model (model A) for job applicants (N=132) A C E ES O M CONS .66** -- -- -- -- -- EMP .77** -- -- -- -- -- INTD .55** -- -- -- -- -- TA .75** -- -- -- -- -- AD -- .47** -- -- -- -- DUT -- .35** -- -- -- -- RESP -- .74** -- -- -- -- WF -- .69** -- -- -- -- COMP -- -- .52** -- -- -- DACH -- -- .80** -- -- -- DADV -- -- .49** -- -- -- EL -- -- .68** -- -- -- INFL -- -- .76** -- -- -- INIT -- -- .79** -- -- -- RISK -- -- .61** -- -- -- SC -- -- .62** -- -- -- EC -- -- -- .41** -- -- POS -- -- -- .40** -- -- OPT -- -- -- .84** -- -- INOV -- -- -- -- .70** -- AST -- -- -- -- .63** -- TF -- -- -- -- .77** -- VIS -- -- -- -- .78** -- ITEM5 -- -- -- -- -- .29* ITEM20 -- -- -- -- -- -.07 ITEM97 -- -- -- -- -- -.22* ITEM135 -- -- -- -- -- -.47** ITEM163 -- -- -- -- -- .34* Notes. CONS = Consideration, EMP = Empathy, INTD = Interdependence, TA = Thought Agility, AD = Attention to Detail, DUT = Dutifulness, RESP = Responsibility, WF = Work Focus, COMP = Competitiveness, DACH = Drive for Achievement, DADV = Drive for Advancement, EL = Energy Level, INFL = Influence, INIT = Initiativeness, RISK = Risk-Taking, SC = Self-Confidence, EC = Emotional Control, POS = Positive Affectivity, OPT = Optimism, INOV = Innovativeness/Creativity, AST = Social Astuteness, TF = Thought Focus, VIS = Vision. * p < .05 ** p < .01
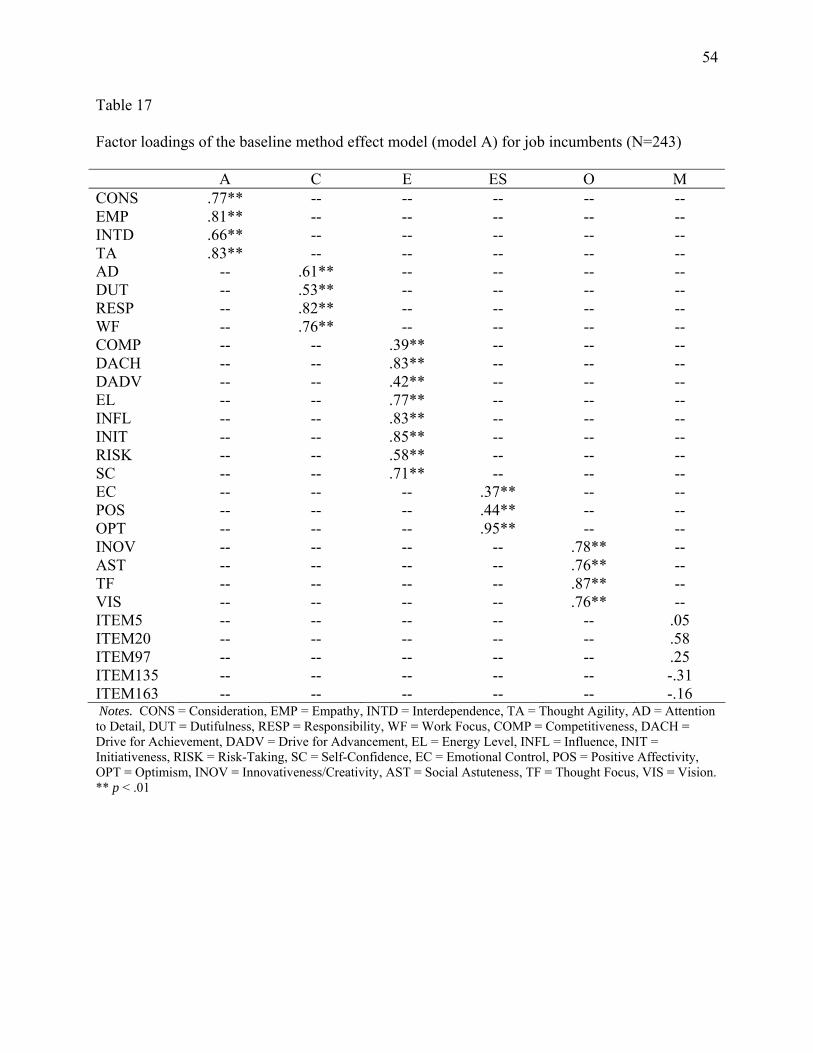
54
Table 17 Factor loadings of the baseline method effect model (model A) for job incumbents (N=243) A C E ES O M CONS .77** -- -- -- -- -- EMP .81** -- -- -- -- -- INTD .66** -- -- -- -- -- TA .83** -- -- -- -- -- AD -- .61** -- -- -- -- DUT -- .53** -- -- -- -- RESP -- .82** -- -- -- -- WF -- .76** -- -- -- -- COMP -- -- .39** -- -- -- DACH -- -- .83** -- -- -- DADV -- -- .42** -- -- -- EL -- -- .77** -- -- -- INFL -- -- .83** -- -- -- INIT -- -- .85** -- -- -- RISK -- -- .58** -- -- -- SC -- -- .71** -- -- -- EC -- -- -- .37** -- -- POS -- -- -- .44** -- -- OPT -- -- -- .95** -- -- INOV -- -- -- -- .78** -- AST -- -- -- -- .76** -- TF -- -- -- -- .87** -- VIS -- -- -- -- .76** -- ITEM5 -- -- -- -- -- .05 ITEM20 -- -- -- -- -- .58 ITEM97 -- -- -- -- -- .25 ITEM135 -- -- -- -- -- -.31 ITEM163 -- -- -- -- -- -.16 Notes. CONS = Consideration, EMP = Empathy, INTD = Interdependence, TA = Thought Agility, AD = Attention to Detail, DUT = Dutifulness, RESP = Responsibility, WF = Work Focus, COMP = Competitiveness, DACH = Drive for Achievement, DADV = Drive for Advancement, EL = Energy Level, INFL = Influence, INIT = Initiativeness, RISK = Risk-Taking, SC = Self-Confidence, EC = Emotional Control, POS = Positive Affectivity, OPT = Optimism, INOV = Innovativeness/Creativity, AST = Social Astuteness, TF = Thought Focus, VIS = Vision. ** p < .01
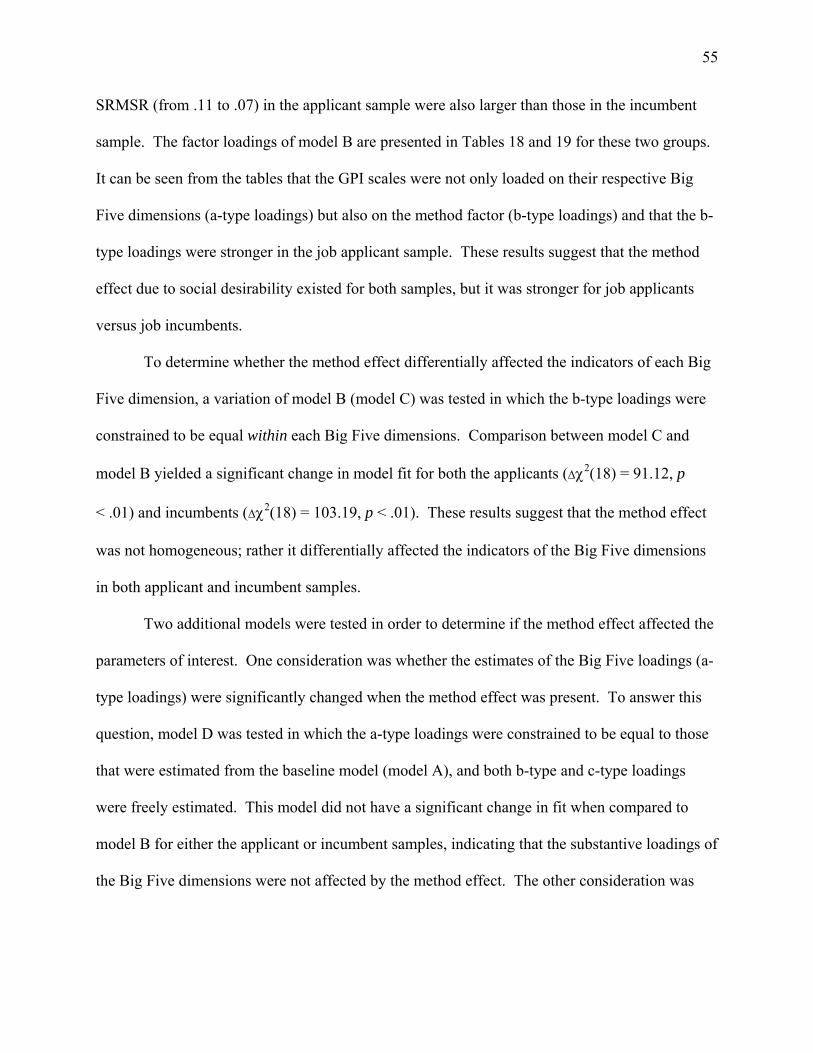
55
SRMSR (from .11 to .07) in the applicant sample were also larger than those in the incumbent
sample. The factor loadings of model B are presented in Tables 18 and 19 for these two groups.
It can be seen from the tables that the GPI scales were not only loaded on their respective Big
Five dimensions (a-type loadings) but also on the method factor (b-type loadings) and that the b-
type loadings were stronger in the job applicant sample. These results suggest that the method
effect due to social desirability existed for both samples, but it was stronger for job applicants
versus job incumbents.
To determine whether the method effect differentially affected the indicators of each Big
Five dimension, a variation of model B (model C) was tested in which the b-type loadings were
constrained to be equal within each Big Five dimensions. Comparison between model C and
model B yielded a significant change in model fit for both the applicants (∆χ2(18) = 91.12, p
< .01) and incumbents (∆χ2(18) = 103.19, p < .01). These results suggest that the method effect
was not homogeneous; rather it differentially affected the indicators of the Big Five dimensions
in both applicant and incumbent samples.
Two additional models were tested in order to determine if the method effect affected the
parameters of interest. One consideration was whether the estimates of the Big Five loadings (a-
type loadings) were significantly changed when the method effect was present. To answer this
question, model D was tested in which the a-type loadings were constrained to be equal to those
that were estimated from the baseline model (model A), and both b-type and c-type loadings
were freely estimated. This model did not have a significant change in fit when compared to
model B for either the applicant or incumbent samples, indicating that the substantive loadings of
the Big Five dimensions were not affected by the method effect. The other consideration was

56
Table 18 Factor loadings of the method effect model (model B) for job applicants (N=132) A C E ES O M CONS .47** -- -- -- -- .71** EMP .33** -- -- -- -- .77** INTD .37** -- -- -- -- .57** TA .09 -- -- -- -- .79** AD -- .23* -- -- -- .52** DUT -- .76** -- -- -- .44** RESP -- .15* -- -- -- .76** WF -- .18* -- -- -- .65** COMP -- -- .67** -- -- .23* DACH -- -- .36** -- -- .76** DADV -- -- .59** -- -- .32** EL -- -- .13 -- -- .75** INFL -- -- .15* -- -- .81** INIT -- -- .20** -- -- .82** RISK -- -- .53** -- -- .48** SC -- -- .21* -- -- .67** EC -- -- -- .32** -- .37** POS -- -- -- .78** -- .28** OPT -- -- -- .27** -- .73** INOV -- -- -- -- .18* .77** AST -- -- -- -- -.11 .76** TF -- -- -- -- .24** .84** VIS -- -- -- -- .37** .73** ITEM5 -- -- -- -- -- -.26* ITEM20 -- -- -- -- -- -.29** ITEM97 -- -- -- -- -- .12 ITEM135 -- -- -- -- -- .13 ITEM163 -- -- -- -- -- .13 Notes. CONS = Consideration, EMP = Empathy, INTD = Interdependence, TA = Thought Agility, AD = Attention to Detail, DUT = Dutifulness, RESP = Responsibility, WF = Work Focus, COMP = Competitiveness, DACH = Drive for Achievement, DADV = Drive for Advancement, EL = Energy Level, INFL = Influence, INIT = Initiativeness, RISK = Risk-Taking, SC = Self-Confidence, EC = Emotional Control, POS = Positive Affectivity, OPT = Optimism, INOV = Innovativeness/Creativity, AST = Social Astuteness, TF = Thought Focus, VIS = Vision. * p < .05 ** p < .01
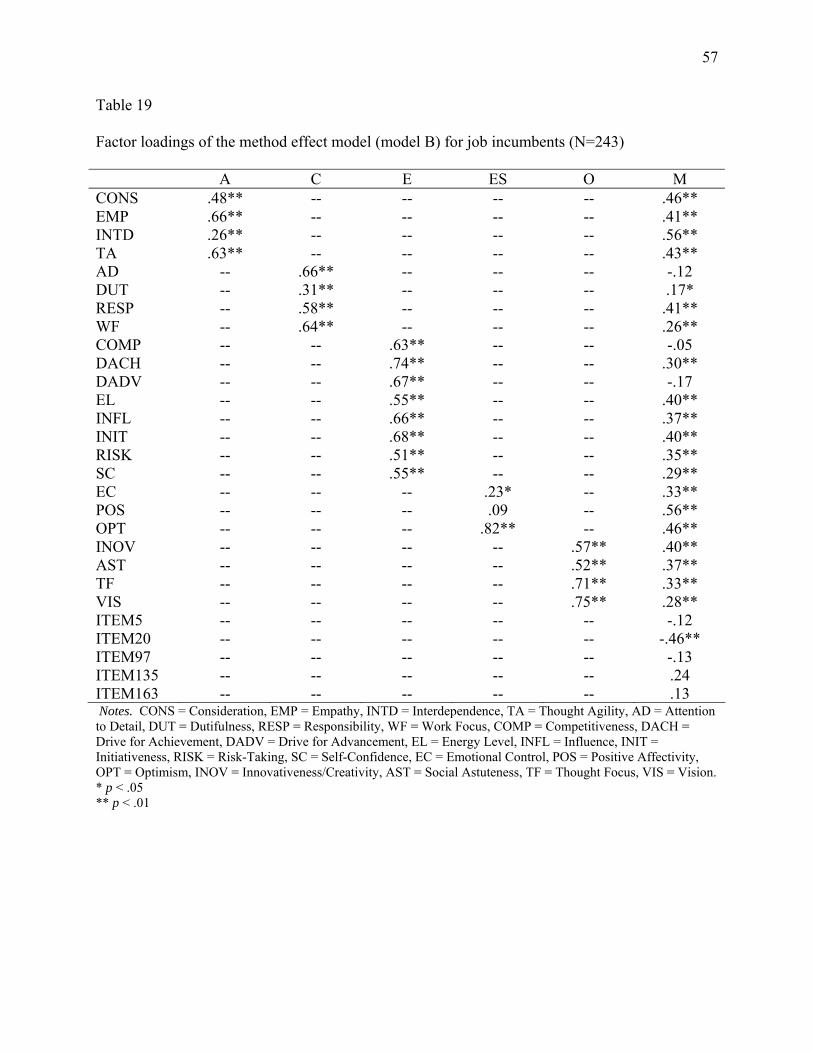
57
Table 19 Factor loadings of the method effect model (model B) for job incumbents (N=243) A C E ES O M CONS .48** -- -- -- -- .46** EMP .66** -- -- -- -- .41** INTD .26** -- -- -- -- .56** TA .63** -- -- -- -- .43** AD -- .66** -- -- -- -.12 DUT -- .31** -- -- -- .17* RESP -- .58** -- -- -- .41** WF -- .64** -- -- -- .26** COMP -- -- .63** -- -- -.05 DACH -- -- .74** -- -- .30** DADV -- -- .67** -- -- -.17 EL -- -- .55** -- -- .40** INFL -- -- .66** -- -- .37** INIT -- -- .68** -- -- .40** RISK -- -- .51** -- -- .35** SC -- -- .55** -- -- .29** EC -- -- -- .23* -- .33** POS -- -- -- .09 -- .56** OPT -- -- -- .82** -- .46** INOV -- -- -- -- .57** .40** AST -- -- -- -- .52** .37** TF -- -- -- -- .71** .33** VIS -- -- -- -- .75** .28** ITEM5 -- -- -- -- -- -.12 ITEM20 -- -- -- -- -- -.46** ITEM97 -- -- -- -- -- -.13 ITEM135 -- -- -- -- -- .24 ITEM163 -- -- -- -- -- .13 Notes. CONS = Consideration, EMP = Empathy, INTD = Interdependence, TA = Thought Agility, AD = Attention to Detail, DUT = Dutifulness, RESP = Responsibility, WF = Work Focus, COMP = Competitiveness, DACH = Drive for Achievement, DADV = Drive for Advancement, EL = Energy Level, INFL = Influence, INIT = Initiativeness, RISK = Risk-Taking, SC = Self-Confidence, EC = Emotional Control, POS = Positive Affectivity, OPT = Optimism, INOV = Innovativeness/Creativity, AST = Social Astuteness, TF = Thought Focus, VIS = Vision. * p < .05 ** p < .01

58
whether the relationships among the Big Five dimensions were significantly changed due to the
method effect. To answer this question, model E was tested in which the intercorrelations
among the Big Five factors were constrained to be equal to those that were estimated from the
baseline model (model A). Comparison between model E and model B did not yield a
significant change in model fit for applicants and incumbents, indicating that the relationships
among the substantive constructs were not affected by the method effect.
59
CHAPTER 6
DISCUSSION
The current study examined the measurement properties of the GPI to address the
following questions: Do the measurement properties of the GPI change in selection context? If
the answer is yes, where do these changes occur?
Major Findings
Consistent with previous studies (e.g., Ellingson et al., 2001; Griffith, 1997), the current
study found changes in measurement structure of personality inventories when test-taking
context is different. The current study examined a full range of ME/I between job applicants and
job incumbents using multiple group CFA analyses. All the Big Five personality dimensions
demonstrated equal factor structures, equal factor loadings, and equal factor variances between
job applicants and job incumbents. The implication is that job applicants and incumbents adopt
the same conceptual frame of reference as well as the equivalent ranges of the construct
continuum in responding to the GPI; in addition, the GPI scales are calibrated in the same way
for these two groups. Among the Big Five personality dimensions, Agreeableness and Openness
to Experience demonstrated measurement invariance and therefore their means were directly
comparable across job applicants and incumbents. Conscientiousness, Extraversion, and
Emotional Stability demonstrated scalar non-invariance across the two groups and further partial
ME/I analyses suggested that job applicants had larger intercepts on some of the facet scales than
job incumbents. Intercept (τ) is the value of an observed variable when the value of its
corresponding latent variable is zero, and therefore, it is interpreted as a location parameter or

60
parameter of indicator difficulty (Chan, 2000; Vandenberg & Lance, 2000). The findings that
job applicants had larger intercepts for some of the facets scales of Conscientiousness,
Extraversion, and Emotional Stability indicate that these facet scales evoke a higher average
response level in the applicant group than the incumbent group given the same level on the latent
personality dimensions. Conscientiousness and Extraversion also demonstrated unequal
uniquenesses across job applicants and job incumbents, indicating that the facet scales of these
two personality dimensions are not equally reliable across groups. Further partial ME/I analyses
and inspection of the LISREL output suggested that there was a lack of consistency in the
direction of between-group differences in uniquenesses. All the Big Five personality dimensions
had higher latent means for job applicants versus job incumbents, indicating that job applicants
may have manipulated their responses to present themselves more favorably in selection context.
The overall pattern of ME/I observed in the current study might shed some light on the
strategy used by job applicants when they respond to personality inventories. The constructs that
were affected most in this study were Conscientiousness, Extraversion, and Emotional Stability
dimensions as they demonstrated more signs of measurement non-invariance. What is
interesting is that these three personality dimensions have been proved to be relevant to
managerial performance (e.g., Barrick & Mount, 1991). It seems that job applicants may be able
to identify the traits that are particularly relevant to the position and make deliberate effort in
distorting these traits specifically (Paulhus, Bruce & Trapnell, 1995).
The current study also examined the presence of method effect due to social desirability
and its impact on substantive parameter estimates of the GPI. It was found that the method bias
was stronger in the applicant sample, indicating that job applicants might have engaged more in
response distortion compared to their incumbent counterparts. What is surprising is that the GPI

61
was susceptible to social desirability method effect in the incumbent sample as well. One
possibility could be that the method effect present in the incumbent sample was due to self-
deception. Paulhus (1984, 1986) suggests that socially desirable responding contains two
components: self-deception and impression management. Self-deception refers to the
unconscious tendency to see oneself in a favorable manner. Impression management is a
conscious attempt to present false information to create a favorable impression on others.
Research suggests that self-deception is not affected by situational cues and thus remain constant
regardless of the situation, whereas impression management is heavily dependent on the situation
(Paulhus & Reid, 1991). To the extent that the social desirability method bias was not separated
into these two subcomponents but was modeled as one factor in the current study, this conjecture
could not be tested. Future research should separate these two components of social desirability
responding and more fine-grained findings might be obtained.
More importantly, in the current study the method effect was shown to have little impact
on the parameter estimates of interest. Specifically, social desirability did not change either the
Big Five factor loadings or the relationships among the Big Five dimensions. Adopting similar
latent variable approach in studying the method effect of negative affectivity in organizational
behavior research, Williams and his colleagues (Williams & Anderson, 1994; William, Gavin &
Williams, 1996) did not find negative affectivity to affect the relationship among substantive
constructs. With regard to social desirability responding, a number of studies used regression
approaches and found that controlling for it has little impact on the underlying nature of the
substantive relationships reported in organizational behavior research (e.g., Barrick & Mount,
1996; Hough et al., 1990; Moorman & Podsakoff, 1992). It should be noted that the current
study used the latent variable approach and examined the social desirability effect at the item
62
level. Therefore, the results from the current study should be more accurate than those resulted
from the regression approach. Nonetheless, replication of the findings in the current study is
needed before final conclusions can be reached about the impact of social desirability method
bias. Future researchers need to consider alternative approaches in examining method effect of
social desirability (see Podsakoff et al. (2003) for a summary of different approaches). In
addition, alternative measures of social desirability should be considered, such as the Balanced
Inventory of Desirable Responding (Paulhus, 1989).
In addition to examining the impact of social desirability on GPI’s measurement
properties, the current study also compared three methods in identifying sources of measurement
non-invariance. It was found that the three methods identified exactly the same scales that had
unequal uniquenesses across groups; but for intercepts, the Model Comparison approach
generally identified more scales that had unequal intercepts across groups, followed by the
MACS-MI approach, and the Z test identified the least number of scales that had between-group
difference on intercepts. These different results might be due to different alpha levels used. The
Bonferonni correction was applied to the MACS-MI approach but not the others based on what
is specified in the literature. This issue should be resolved. In addition, simulation studies are
needed to determine the rigor of these approaches in testing partial ME/I. Furthermore, the
current study only allowed partial ME/I tests on intercepts and uniquenesses. Future research
needs to determine the merits of different approaches in detecting between-group differences on
other parameters of interest (e.g., factor loadings).
Implications
The current study extends the literature by examining the social desirability phenomenon
in the Chinese population. Some of the literature in cross-cultural psychology suggests a link
63
between culture and social desirability. According to Middleton and Jones (2000), individuals
from Eastern cultures that exhibit strong uncertainty avoidance (i.e., people’s tolerance of
uncertainty and ambiguity; Hofstede, 1984, 1991) are more likely to provide socially desirable
responses in order to reduce personal risk. Other researchers suggest that collectivism is
associated with deception (Triandis et al., 2001), lying (Triandis & Suh, 2002), and face-saving
behavior (Ho, 1976; Triandis et al., 2001) in order to meet interpersonal goals. Supporting these
notions, some studies (Eysenck & Chan, 1982; Dudley, McFarland, Goodman, Hunt, & Sydell,
2005; Van Hemert, Van de Vijver, Poortinga, & Georgas, 2002) report that people from
eastern/collectivistic cultures score higher on social desirability scales. However, to my
knowledge, no research has been done to examine the impact of social desirability on
measurement properties of personality inventories in other cultures. Despite of the different
cultural context, the current study replicates some of the findings obtained in US populations.
The findings of the current study suggest that as social desirability responding is present,
some aspects of ME/I of personality inventories do not hold. It should be noted that the current
study focuses on naturally occurring faking in actual selection context. Lab induced faking
might be exaggerated (Zickar & Robie, 1999) and therefore it may seriously affect the
measurement properties of personality inventories (e.g., Griffith, 1997). Researchers interested
in the faking issue should stop relying on personality mean differences across faking and non-
faking groups to quantify the magnitude of faking, because the observed between-group
differences are partly due to measurement artifacts and therefore are not interpretable. Some of
the research findings cumulated in the faking literature may be questionable and different
conclusions may have been made if researchers had made between-group comparisons after
ME/I was tested (Vandenberg & Lance, 2000; Vandenberg, 2002).
64
In addition, the findings of the current study contributed to our understanding of the
validity of the Big Five personality model and its measures in personnel selection context. It
turns out that social desirability, as it occurs in actual selection context, does not seriously alter
the measurement properties of the GPI. Job applicants and incumbents adopt the same
conceptual frames of reference and equivalent ranges of the construct continuum in responding
to the GPI; in addition, the GPI scales are calibrated in the same way for these two groups.
Furthermore, the presence of the social desirability method bias does not influence the constructs
being measured and the relationships among them. To the extent that between-group difference
on intercepts and error variances are viewed as relatively minor aspects of ME/I (Bollen, 1989),
the GPI could be considered as a relatively valid measure of the Big Five personality dimensions
for the job applicants in selection context.
Socially desirable responding is a wide-ranging concern in organizational research that it
has been viewed almost exclusively as a contaminant to the accuracy of self-reports (Zerbe &
Paulhus, 1987). The results of the current study suggest that controlling socially desirable
responding does not impact the relationships among the Big Five. Yet, concluding that social
desirability does not affect substantive relationships is premature because the current study did
not examine the relationships between the Big Five and other criterion variables. More research
is needed in this area. In selection context, however, socially desirable responding is a problem
and should warrant some attention. The results of the current study suggest that responding in a
socially desirable manner may have translated into the addition of a constant to personality
scores. As a result, individuals responding in a highly socially desirable manner will obtain
artificially inflated scores on personality dimensions. This will lead to the selection of more
individuals who are highly socially desirable in their responses, assuming that organizations
65
select individuals from the top down. In this case, controlling for the effect of social desirability
is warranted.
Limitations
The small sample size for the job applicant group is a limitation. CFA estimation
procedures are based on asymptotic (large-sample) theory (Lance & Vandenberg, 2002) and
MacCallum, Widaman, Zhang, and Hong (1999) suggest that a sample size of around two
hundred is generally adequate to achieve stable factor solutions. Therefore, the inadequate
sample size for the job applicant group may hinder the robustness of the findings. However, due
to some practical issues (e.g., time constraint) in collecting real world data, this is what was
available at the time the study was conducted.
The participants in the current study took the GPI in its computerized version on the
Internet (instead of in the traditional paper-and-pencil version). It should be noted that the
method of administration might also influence the findings obtained in the current study.
Evidently, Davis and Cowles (1989) administered the Eysenck Personality Inventory on two
occasions (paper-and-pencil version versus computerized version) and compared participants’
responses. They found that the participants in the computer condition demonstrated stronger
social desirability tendency. Therefore, readers are cautioned not to overgeneralize the findings
of the current study.
Lastly, it should be noted that the findings of the current study are based on only one Big
Five inventory. Whether the results generalize to other Big Five inventories is unknown. More
research is encouraged before this question can be answered with confidence.
66
Conclusions
With the use of personality inventories as selection devices increasing, research has been
called for to examine the usefulness of the Big Five model and its measures in employment
context (Schmit & Ryan, 1993). The current study conducted a comprehensive investigation into
whether social desirability influences the measurement properties of the GPI in selection context.
The conclusion is that by and large, social desirability does not seriously contaminate GPI’s
measurement properties and that the GPI is a relatively valid measure of the Big Five dimensions
in selection context. The readers should be cautioned that the conclusions are limited to the GPI
as applied to the Chinese population. More research needs to be conducted to determine if the
findings of the current study are generalizable to other Big Five measures and other populations.
Nonetheless, the findings of this study have enriched our understanding of the effect of faking on
measurement properties of personality measures, which is an important issue that has not
received much attention and research efforts in the faking literature. One must also recognize
that demonstrating that the measurement properties of personality inventories are largely
maintained in the presence of social desirability does not mean that the effects of social
desirability as a whole are negligible. Socially desirable responding still has the potential to
influence other aspects of the selection process (e.g., predictive validity, hiring decisions, etc.)
and some of the issues have not been resolved in the faking literature. More research is called
for to investigate the unresolved issues related to faking.
67
REFERENCES
Barrick, M. R., & Mount, M. K. (1991). The Big Five personality dimensions and job
performance: A meta-analysis. Personnel Psychology, 44, 1-26.
Barrick, M. R., & Mount, M. K. (1996). Effects of impression management and self-deception
on the predictive validity of personality constructs. Journal of Applied Psychology, 81
(3), 261-272.
Barrick, M. R., Mount, M. K., & Judge, T. A. (2001). Personality and performance at the new
millennium: What do we know and where do we go next? International Journal of
Selection and Assessment, 9, 9-30.
Bass, B. M. (1957). Faking by sales applicants of a forced choice personality inventory. Journal
of Applied Psychology, 41, 403-404.
Bollen, K. A. (1989). Structural Equations with Latent Variables. New York: Wiley.
Borman, W. C., & Motowidlo, S. J. (1993). Expanding the criterion domain to include elements
of contextual performance. In Schmitt, N., Borman, W. C. & Associates (Eds.),
Personnel selection in organizations. San Francisco: Jossey-Bass Publishers.
Borman, W. C., & Motowidlo, S. J. (1997). Task performance and contextual performance: The
meaning for personnel selection research. Human Performance, 10, 99-109.
Caldwell-Andrews, A., Baer, R. A., & Berry, D. T. R. (2000). Effects of response sets on NEO-
PI-R scores and their relations to external criteria. Journal of Personality Assessment, 74
(3), 472-488.
68
Chan, D. (2000). Detection of differential item functioning on the Kirton Adaption-Innovation
Inventory using multiple-group mean and covariance structure analyses. Multivariate
Behavior Research, 35 (2), 169-199.
Chan, D., & Schmitt, N. (1998). Personnel selection: A theoretical approach. Thousand Oaks:
Sage.
Cheung, G. W. (2002). The identification of a partial metric invariance model for multi-group
studies. Paper presented at the Academy of Management Annual Meeting, Denver, CO.
Christiansen, N. D., Goffin, R. D., Johnston, N. G., & Rothstein, M. G. (1994). Correcting the
16PF for faking: Effects on criterion-related validity and individual hiring decisions.
Personnel Psychology, 47, 847-860.
Costa, P. T. (1996). Work and personality: Use of the NEO-PI-R in industrial/organizational
psychology. Applied Psychology: An International Review, 45 (3), 225-241.
Costa, P. T., & McCrae, R. R. (1989). The NEO PI/FFI manual supplement. Odessa, FL:
Psychological Assessment Resources.
Costa, P. T., & McCrae, R. R. (1992). Revised NEO-Personality Inventory (NEO PI-R) and
NEO Five Factor Inventory (NEO-FFI) professional manual. Odessa, FL: Psychological
Assessment Resources.
Costa, P. T., & McCare, R. R. (1995). Solid grounds in the wetland of personality: A reply to
Block. Psychological Bulletin, 117, 216-220.
Cunningham, M. R., Wong, D. T., & Barbee, A. P. (1994). Self-presentation dynamics on overt
integrity tests: Experimental studies of the Reid Report. Journal of Applied Psychology,
79, 643-658.
69
Davis, C., & Cowles, M. (1989). Automated psychological testing: Method of administration,
need for approval, and measures of anxiety. Educational and Psychological
Measurement, 49 (2), 311-320.
Dudley, N. M., McFarland, L. A., Goodman, S. A., Hunt, S. T., & Sydell, E. J. (2005). Racial
differences in socially desirable responding in selection contexts: Magnitude and
consequences. Journal of Personality Assessment, 85 (1), 50-64.
Digman, J. M. (1990). Personality structure: Emergence of the five factor model. Annual
Review of Psychology, 41, 417-440.
Drasgow, F., & Kanfer, R. (1985). Equivalence of psychological measurement in heterogeneous
populations. Journal of Applied Psychology, 70, 662-680.
Dunnette, M. D., McCartney, J., Carlson, H. C., & Kirchner, W. K. (1962). A study of faking
behavior on a forced-choice self-description checklist. Personnel Psychology, 15, 13-24.
Ellingson, J. E., Smith, D. B., & Sackett, P. R. (2001). Investigating the influence of social
desirability on personality factor structure. Journal of Applied Psychology, 86 (1), 122-
133.
Elingson, J. E., Sackett, P. R., & Hough, L. M. (1999). Social desirability corrections in
personality measurement: Issues of applicant comparison and construct validity. Journal
of Applied Psychology, 84 (2), 155-166.
Elliott, A. G. P. (1981). Some implications of lie scale scores in real-life selection. Journal of
Occupational Psychology, 54, 9-16.
Ellis, A. (1946). The validity of personality questionnaires. Psychological Bulletin, 43, 385-440.
Embrestson, S. E., & Reise, S. P. (2000). Item response theory for psychologists. Mahwah, NJ:
Lawrence Erlbaum Associates.

70
Eysenck, S. B., & Chan, J. (1982). A comparative study of personality in adults and children:
Hong Kong vs. England. Personality and Individual Differences, 3, 153-160.
Furnham, A. (1986). Response bias, social desirability, and dissimulation. Personality and
Individual differences, 7, 385-400.
Furnham, A. (1990). Faking personality questionnaires: Fabricating different profiles for
different purposes. Current Psychology, 9, 46-55.
Gatewood, R. D., & Field, H. S. (2001). Human resource selection (5th ed.). Mason, OH:
South-Western.
Goldberg, L. R. (1990). An alternative “description of personality”: The Big Five factor
structure. Journal of Personality and Social Psychology, 59, 1216-1229.
Grayson, D. A., Mackinnon, A., Jorm, A. F., Creasey, H., & Broe, G. A. (2000). Item bias in the
Center for Epidemiologic Studies Depression Scale: Effects of physical disorders and
disability in an elderly community sample. Journal of Gerontology: Psychological
Sciences, 55B (5), 273-282.
Griffin, B., Hesketh, B., & Grayson, D. A. (2004). Applicants faking good: evidence of item bias
in the NEO PI-R. Personality and Individual Differences, 36, 1545-1558.
Griffith, R. (1997). Faking of noncognitive selection devices: Red herring is hard to swallow.
Dissertation. University of Akron.
Ho, D. Y. F. (1976). On the concept of face. American Journal of Sociology, 81, 867-890.
Hofstede, G. (1984). Culture’s Consequences: International Differences in Work-related Values.
Beverly Hills, CA: Sage.
Hofstede, G. (1991). Cultures and Organizations: Software of the Mind. London: McGraw-Hill.
71
Hogan, R. (1991). Personality and personality measure. In Dunnette, M. D., & Hough, L. M.
(Eds.), Handbook of industrial and organizational psychology (Vol. 2). Palo Alto:
Consulting Psychologists Press, Inc.
Hogan, R., & Hogan, J. (1992). Hogan personality inventory manual. Tulsa, OK: Hogan
Assessment Systems.
Hogan, R., Hogan, J., & Roberts, B. W. (1996). Personality measurement and employment
decisions: Questions and answers. American Psychologist, 51 (5), 469-477.
Holland, J. L. (1973). Making Vocational Choices: A Theory of Careers. New Jersey:
Englewood Cliffs.
Holland, J. L. (1985). Making Vocational Choices: A Theory of Vocational Personalities and
Work Environments (1st Ed). New Jersey: Englewood Cliffs.
Holland, J. L. (1997). Making Vocational Choices: A Theory of Vocational Personalities and
Work Environments (2nd Ed). New Jersey: Englewood Cliffs.
Horn, J. L., & McArdle, J. J. (1992). A practical and theoretical guide to measurement
invariance in aging research. Experimental Aging Research, 18, 117-144.
Hough, L. A. (1998). Effects of intentional distortion in personality measurement and evaluation
of suggested palliatives. Human Performance, 11, 209-244.
Hough, L. M. (2003). Emerging trends and needs in personality research and practice beyond
mean effects. In Barrick, M. R. & Ryan, A. M. (Eds.), Personality and Work:
Reconsidering the Role of Personality in Organizations. San Francisco, CA: Jossey-Bass.
Hough, L. M., Eaton, N. K., Dunnette, M. D., Kamp, J. D., & McCloy, R. A. (1990). Criterion-
related validities of personality constructs and the effect of response distortion on those
validities. Journal of Applied Psychology, 75 (5), 581-595.
72
Hu, L., & Bentler, P. M. (1998). Fit indices in covariance structure modeling: Sensitivity to
underparameterized model misspecification. Psychological Methods, 3 (4), 424-453.
Hu, L., & Bentler, P. M. (1999). Cutoff criteria for fit indexes in covariance structure analysis:
Conventional criteria versus new alternatives. Structural Equation Modeling, 6 (1), 1-55.
Hurtz, G. M., & Donovan, J. J. (2000). Personality and job performance: The Big Five revisited.
Journal of Applied Psychology, 85 (6), 869-879.
Kirchner, W. E., Dunnette, M. D., & Mousley, N. (1960). Use of the Edwards Personal
Preference Schedule in the selection of salesmen. Personnel Psychology, 13, 421-424.
Lance, C. E., & Vandenberg, R. J. (2002). Confirmatory factor analysis. In Drasgow, F., &
Schmitt, N. (Eds.), Advances in Measurement and Data Analysis. San Francisco, Jossey-
Bass.
Levin, R. A., & Zickar, M. J. (2002). Investigating self-presentation, lies, and bullshit:
Understanding faking and its effects on selection decisions using theory, field research,
and simulation. In Brett, J. M., & Drasgow, F. (Eds.), Psychology of work: Theoretically
based empirical research. Mahwah, NJ: Lawrence Erlbaum Associates.
Lindell, M. K., & Whitney, D. J. (2001). Accounting for common method variance in cross-
sectional research designs. Journal of Applied Psychology, 86 (1), 114-121.
MacCallum, R. C., Widaman, K. F., Zhang, S., & Hong, S. (1999). Sample size in factor
analysis. Psychological Methods, 4, 84-99.
Maurer, T. J., Raju, N. S., & Collins, W. C. (1998). Peer and subordinate performance appraisal
measurement equivalence. Journal of Applied Psychology, 83 (5), 693-702.
McFarland, L. A., & Ryan, A. M. (2000). Variance in faking across noncognitive measures.
Journal of Applied Psychology, 85 (5), 812-821.
73
Meade, A. W., & Lautenschlager, G. J. (2004a). A comparison of item response theory and
confirmatory factor analytic methodologies for establishing measurement
equivalence/invariance. Organizational Research Methods, 7 (4), 361-388.
Meade, A. W., & Lautenschlager, G. J. (2004b). A Monte-Carlo study of confirmatory factor
analytic tests of measurement equivalence/invariance. Structural Equation Modeling, 11
(1), 60-72.
Michaelis, W., & Eysenck, H. J. (1971). The determination of personality inventory factor
patterns and intercorrelations by changes in real-life motivation. Journal of Genetic
Psychology, 118, 223-234.
Middleton, K. L., & Jones, J. L. (2000). Socially desirable response sets: The impact of country
culture. Psychology and Marketing, 17 (2), 149-163.
Moorman, R. H., & Podsakoff, P. M. (1992). A meta-analytic review and empirical test of the
potential confounding effects of social desirability response sets in organizational
behavior research. Journal of Occupational and Organizational Psychology, 65, 131-149.
Motowidlo, S. J., & Van Scotter, J. R. (1994). Evidence that task performance should be
distinguished from contextual performance. Journal of Applied Psychology, 79 (4), 475-
480.
Mount, M. K., & Barrick, M. R. (1995). The Big Five personality dimensions: Implications for
research and practice in human resources management. Research in Personnel and
Human Resources Management, 13, 153-200.
Muthen, B. O. (1988). Some uses of structural equation modeling in validity studies: Extending
IRT to external variables. In Wainer, H., & Braun, H. I. (Eds.), Test validity. Hillsdale,
NJ: Erlbaum.
74
Ones, D. S., Viswesvaran, C., & Reiss, A. D. (1996). Role of social desirability in personality
testing for personnel selection: The red herring. Journal of Applied Psychology, 81 (6),
660-679.
Ones, D. S., & Viswesvaran, C. (1998). The effects of social desirability and faking on
personality and integrity assessment for personnel selection. Human Performance, 11
(2/3), 245-269.
Pannone, R. D. (1984). Predicting test performance: A content valid approach to screening
applicants. Personnel Psychology, 37, 507-514.
Paulhus, D. L. (1984). Two-component models of socially desirable responding. Journal of
Personality and Social Psychology, 46, 598-609.
Paulhus, D. L., (1986). Self-deception and impression management in test responses. In
Angleiner, A., & Wiggins, J. S., (Eds.), Personality Assessment via Questionnaire. New
York: Springer.
Paulhus, D. L. (1989). Measurement and control of response biases. In Robinson, J. P., Shaver,
P. R., & Wrightsman, L. (Eds.), Measures of Social Psychological Attitudes. San Diego,
CA: Academic Press.
Paulhus, D. L., Bruce, M. N., & Trapnell, P. D. (1995). Effects of self-presentation strategies on
personality profiles and their structure. Personality and Social Psychology Bulletin, 21
(2), 100-108.
Paulhus, D. L., & Reid, D. B. (1991). Enhancement and denial in socially desirable responding.
Journal of Personality and Social Psychology, 60, 307-317.
75
Podsakoff, P. M., MacKenzie, S. B., Lee, J. Y., & Podsakoff, N. P. (2003). Common method
biases in behavioral research: A critical review of the literature and recommended
remedies. Journal of Applied Psychology, 88 (5), 879-903.
Raju, N. S., Laffitte, L. J., & Byrne, B. M. (2002). Measurement equivalence: A comparison of
methods based on confirmatory factor analysis and item response theory. Journal of
Applied Psychology, 87 (3), 517-529.
Reise, S. P., Widaman, K, F., & Pugh, R. H. (1993). Confirmatory factor analysis and item
response theory: Two approaches for exploring measurement invariance. Psychological
Bulletin, 114 (3), 552-566.
Robie, C., Zickar, M. J., & Schmit, M. J. (2001). Measurement equivalence between applicant
and incumbent groups: An IRT analysis of personality scales. Human Performance, 14
(2), 187-207.
Rosse, J. G., Stecher, M. D., Miller, J. L., & Levin, R. A. (1998). The impact of response
distortion on preemployment personality testing and hiring decisions. Journal of Applied
Psychology, 83 (4), 634-644.
Schmit, M. J., Kihm, J. A., & Robie, C. (2000). Development of a global measure of personality.
Personnel Psychology, 53, 153-193.
Schmit, M. J., & Ryan, A. M. (1993). The Big Five in personnel selection: Factor structure in
applicant and nonapplicant populations. Journal of Applied Psychology, 78 (6), 966-974.
Schwab, D. P. (1971). Issues in response distortion studies of personality inventories: A critique
and replicated study. Personnel Psychology, 24, 637-647.
76
Smith, D. B., Hanges, P. J., & Dickson, M. W. (2001). Personnel selection and the five-factor
model: Reexamining the effects of applicant’s frame of reference. Journal of Applied
Psychology, 86 (2), 304-315.
Stokes, G. S., Hogan, J. B., & Snell, A. F. (1993). Comparability of incumbent and applicant
samples for the development of biodata keys: The influence of social desirability.
Personnel Psychology, 46, 739-762.
Tett, R. P., Jackson, D. N., & Rothstein, M. (1991). Personality measures as predictors of job
performance: A meta-analytic review. Personnel Psychology, 44, 703-742.
Tett, R. P., Jackson, D. N., Rothstein, M., & Reddon, J. R. (1994). Meta-analysis of personality-
job performance relations: A reply to Ones, Mount, Barrick, and Hunter (1994).
Personnel Psychology, 74, 157-172.
Thornton, G. C., & Gierasch, P. F. (1980). Fakability of an empirically-derived selection
instrument. Journal of Personality Assessment, 44, 48-51.
Topping, G. D., & O’Groman, J. G. (1997). Effects of faking set on validity of the NEO-FFI.
Personality and Individual Differences, 23 (1), 117-124.
Triandis, H. C., Carnevale, P., Gelfand, M., Robert, C., Wasti, A., & Probst, T. (2001). Culture
and deception in business negotiations: A multilevel analysis. International Journal of
Cross-Cultural Management, 1, 73-90.
Triandis, H. C., & Suh, E. M. (2002). Cultural Influences on personality. Annual Review of
Psychology, 53, 133-160.
Van Hemert, D. A., Van de Vijver, F. J. R., Poortinga, Y. H., & Georgas, J. (2002). Structural
and functional equivalence of the Eysenck Personality Questionnaire within and between
countries. Personality and Individual Differences, 33, 1229-1249.
77
Van Scotter, J. R., & Motowidlo, S. J. (1996). Interpersonal facilitation and job dedication as
separate facets of contextual performance. Journal of Applied Psychology, 81 (5), 525-
531.
Vandenberg, R. J. (2002). Toward a further understanding of and improvement in measurement
invariance methods and procedures. Organizational Research Methods, 5 (2), 139-158.
Vandenberg, R. J., & Charles, L. E. (2000). A review and synthesis of the measurement
invariance literature: Suggestions, practices, and recommendations for organizational
research. Organizational Research Methods, 3 (1), 4-69.
Viswesvaran, C., & Ones, D. S. (1999). Meta-analyses of fakability estimates: Implications for
personality measurement. Educational and Psychological Measurement, 59 (2), 197-210.
Williams, L. J., & Anderson, S. E. (1994). An alternative approach to method effects by using
latent-variable models: Applications in organizational behavior research. Journal of
Applied Psychology, 79 (3), 323-331.
Williams, L. J., Gavin, M. B., & Williams, M. L. (1996). Measurement and nonmeasurement
processes with negative affectivity and employee attitudes. Journal of Applied
Psychology, 81 (1), 88-101.
Zerbe, W. J., & Paulhus, D. L. (1987). Socially desirable responding in organizational behavior:
A reconception. Academy of Management Review, 12 (2), 250-264.
Zickar, M. J., & Robie, C. (1999). Modeling faking good on personality items: An item-level
analysis. Journal of Applied Psychology, 84 (4), 551-563.

78
APPENDICES
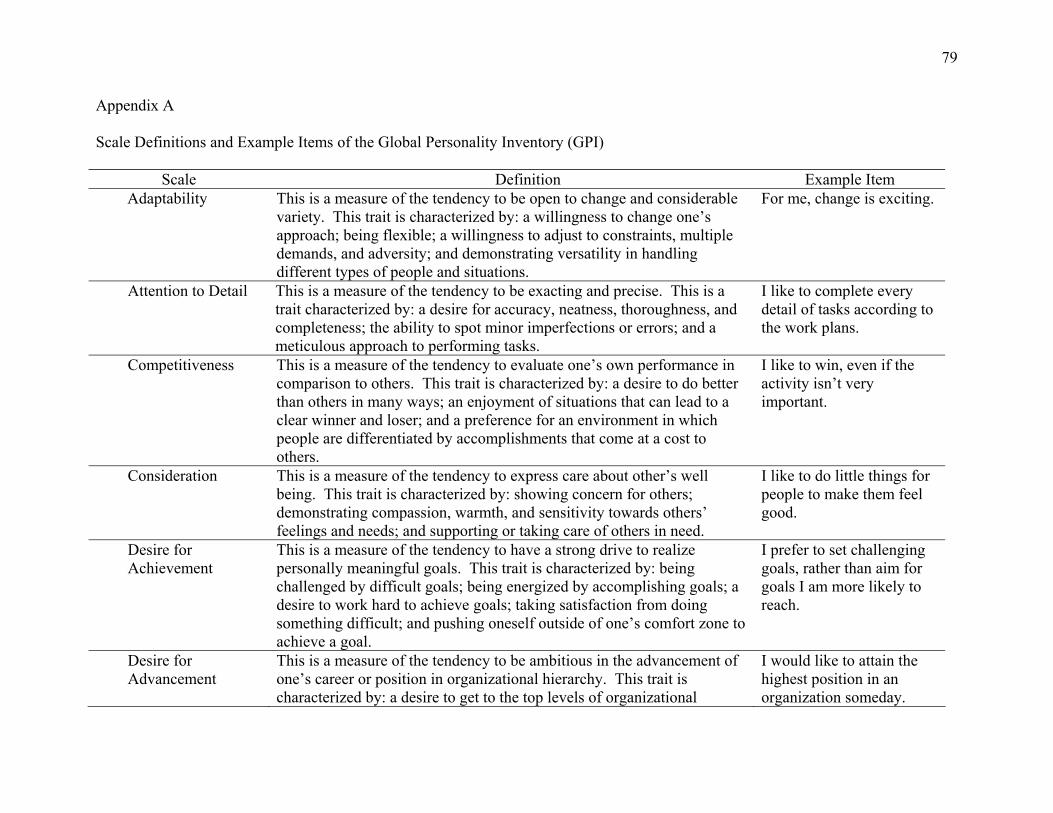
79
Appendix A
Scale Definitions and Example Items of the Global Personality Inventory (GPI)
Scale Definition Example ItemAdaptability This is a measure of the tendency to be open to change and considerable
variety. This trait is characterized by: a willingness to change one’s approach; being flexible; a willingness to adjust to constraints, multiple demands, and adversity; and demonstrating versatility in handling different types of people and situations.
For me, change is exciting.
Attention to Detail This is a measure of the tendency to be exacting and precise. This is a trait characterized by: a desire for accuracy, neatness, thoroughness, and completeness; the ability to spot minor imperfections or errors; and a meticulous approach to performing tasks.
I like to complete every detail of tasks according to the work plans.
Competitiveness This is a measure of the tendency to evaluate one’s own performance in comparison to others. This trait is characterized by: a desire to do better than others in many ways; an enjoyment of situations that can lead to a clear winner and loser; and a preference for an environment in which people are differentiated by accomplishments that come at a cost to others.
I like to win, even if the activity isn’t very important.
Consideration This is a measure of the tendency to express care about other’s well being. This trait is characterized by: showing concern for others; demonstrating compassion, warmth, and sensitivity towards others’ feelings and needs; and supporting or taking care of others in need.
I like to do little things for people to make them feel good.
Desire for Achievement
This is a measure of the tendency to have a strong drive to realize personally meaningful goals. This trait is characterized by: being challenged by difficult goals; being energized by accomplishing goals; a desire to work hard to achieve goals; taking satisfaction from doing something difficult; and pushing oneself outside of one’s comfort zone to achieve a goal.
I prefer to set challenging goals, rather than aim for goals I am more likely to reach.
Desire for Advancement
This is a measure of the tendency to be ambitious in the advancement of one’s career or position in organizational hierarchy. This trait is characterized by: a desire to get to the top levels of organizational
I would like to attain the highest position in an organization someday.
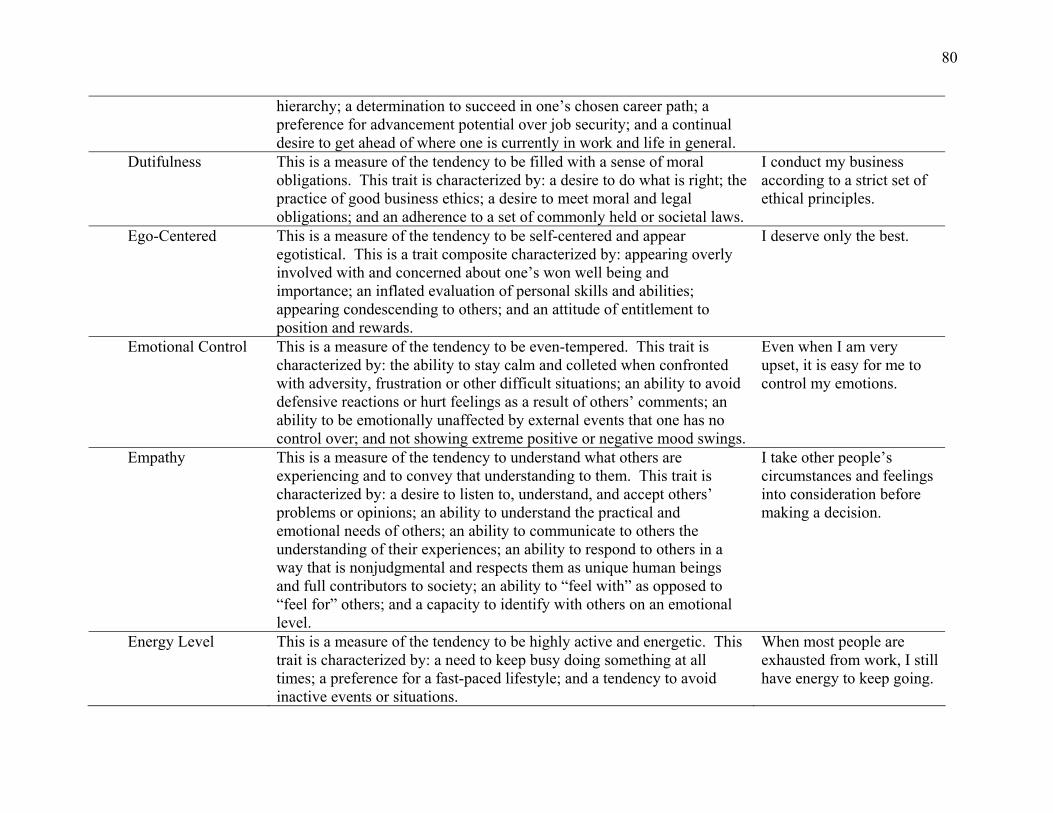
80
hierarchy; a determination to succeed in one’s chosen career path; a preference for advancement potential over job security; and a continual desire to get ahead of where one is currently in work and life in general.
Dutifulness This is a measure of the tendency to be filled with a sense of moral obligations. This trait is characterized by: a desire to do what is right; the practice of good business ethics; a desire to meet moral and legal obligations; and an adherence to a set of commonly held or societal laws.
I conduct my business according to a strict set of ethical principles.
Ego-Centered This is a measure of the tendency to be self-centered and appear egotistical. This is a trait composite characterized by: appearing overly involved with and concerned about one’s won well being and importance; an inflated evaluation of personal skills and abilities; appearing condescending to others; and an attitude of entitlement to position and rewards.
I deserve only the best.
Emotional Control This is a measure of the tendency to be even-tempered. This trait is characterized by: the ability to stay calm and colleted when confronted with adversity, frustration or other difficult situations; an ability to avoid defensive reactions or hurt feelings as a result of others’ comments; an ability to be emotionally unaffected by external events that one has no control over; and not showing extreme positive or negative mood swings.
Even when I am very upset, it is easy for me to control my emotions.
Empathy This is a measure of the tendency to understand what others are experiencing and to convey that understanding to them. This trait is characterized by: a desire to listen to, understand, and accept others’ problems or opinions; an ability to understand the practical and emotional needs of others; an ability to communicate to others the understanding of their experiences; an ability to respond to others in a way that is nonjudgmental and respects them as unique human beings and full contributors to society; an ability to “feel with” as opposed to “feel for” others; and a capacity to identify with others on an emotional level.
I take other people’s circumstances and feelings into consideration before making a decision.
Energy Level This is a measure of the tendency to be highly active and energetic. This trait is characterized by: a need to keep busy doing something at all times; a preference for a fast-paced lifestyle; and a tendency to avoid inactive events or situations.
When most people are exhausted from work, I still have energy to keep going.

81
Impressing This is a measure of the tendency to try to make a good impression on others. This trait is characterized by: a desire to please others; a tendency to tell people what they want to hear; the use of flattery and craftiness to manipulate the impressions held by others; being cautious not to expose one’s true self image; and not being frank and forthcoming.
I always do more than is required in my work.
Independence This is a measure of the tendency to be autonomous. This trait is characterized by: a preference to make decisions without input from others; a preference to not be dependent on others; and a desire to not be closely supervised or work in an interdependent group or organization.
I tend to work on projects alone, even if others volunteer to help me.
Influence This is a measure of the tendency to get others to view and do things in a certain way. This trait is characterized by: being persuasive; negotiating well; impacting the thoughts and actions of others; gaining support and commitment from others; being diplomatic; and using tact.
People come to me for inspiration and direction.
Initiative This is a measure of the tendency to take action in a proactive, rather than reactive, manner. This trait is characterized by: a desire to take action where others might take a wait-and-see approach; a desire to find ways to get things started; a desire to volunteers to take on new responsibilities; and a willingness to take on new or additional challenges.
I am always looking for opportunities to start new projects.
Innovativeness/ Creativity
This is a measure of the tendency to produce unique and original things. It is a measure of divergent thinking that is focused on the generation and output of unique ideas and expressions of ideas. This treat is characterized by being inventive; being imaginative; being expressive of ideas and feelings through original and unique output.
I work best in an environment that allows me to be creative and expressive.
Interdependence This is a measure of the tendency to work well with others. This trait is characterized by: an ability to perform well in groups; a desire to work closely with others on shared work; active cooperation with others; a desire to build supportive networks of communications; flexible cooperation in conflict resolution situations; and a preference to work toward the goals of the group rather than individual goals.
I tend to put group goals first and individual goals second.
Intimidating This is a measure of the tendency to use power in a threatening way. This syndrome is characterized by: acting cold and aloof; an abrasive approach to others, a bullying style; and the use of knowledge or power
It doesn’t bother me to intimidate people if I need to.
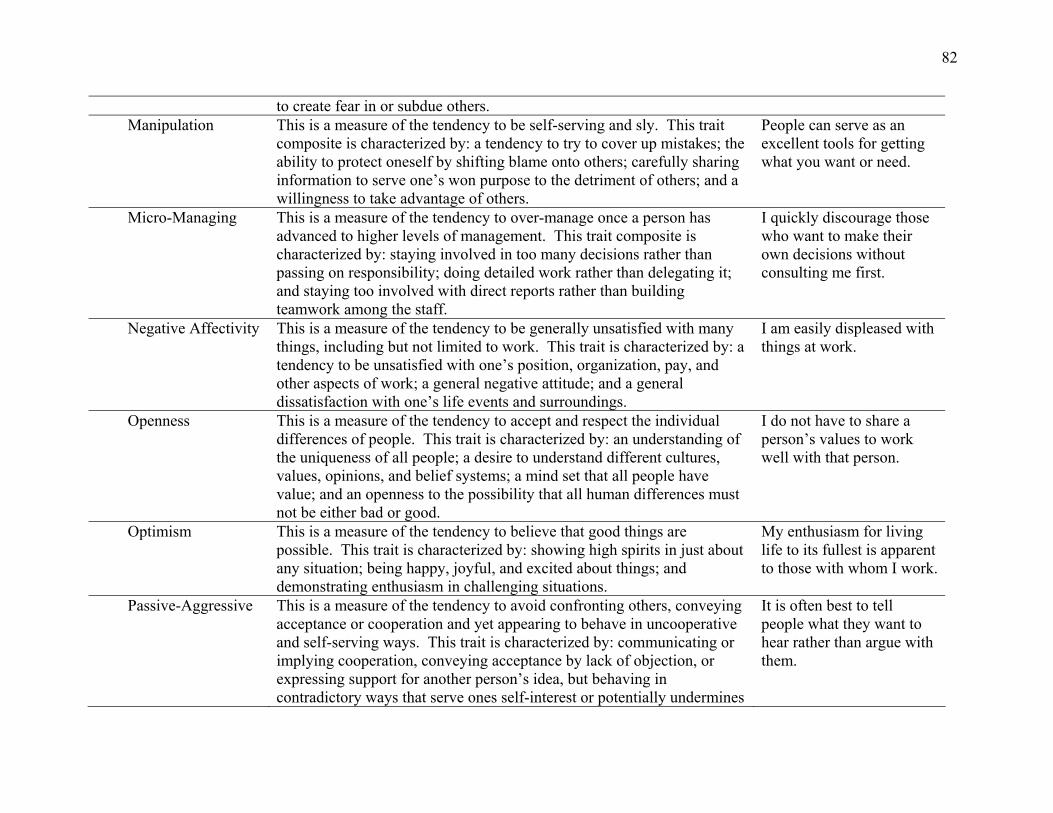
82
to create fear in or subdue others. Manipulation This is a measure of the tendency to be self-serving and sly. This trait
composite is characterized by: a tendency to try to cover up mistakes; the ability to protect oneself by shifting blame onto others; carefully sharing information to serve one’s won purpose to the detriment of others; and a willingness to take advantage of others.
People can serve as an excellent tools for getting what you want or need.
Micro-Managing This is a measure of the tendency to over-manage once a person has advanced to higher levels of management. This trait composite is characterized by: staying involved in too many decisions rather than passing on responsibility; doing detailed work rather than delegating it; and staying too involved with direct reports rather than building teamwork among the staff.
I quickly discourage those who want to make their own decisions without consulting me first.
Negative Affectivity This is a measure of the tendency to be generally unsatisfied with many things, including but not limited to work. This trait is characterized by: a tendency to be unsatisfied with one’s position, organization, pay, and other aspects of work; a general negative attitude; and a general dissatisfaction with one’s life events and surroundings.
I am easily displeased with things at work.
Openness This is a measure of the tendency to accept and respect the individual differences of people. This trait is characterized by: an understanding of the uniqueness of all people; a desire to understand different cultures, values, opinions, and belief systems; a mind set that all people have value; and an openness to the possibility that all human differences must not be either bad or good.
I do not have to share a person’s values to work well with that person.
Optimism This is a measure of the tendency to believe that good things are possible. This trait is characterized by: showing high spirits in just about any situation; being happy, joyful, and excited about things; and demonstrating enthusiasm in challenging situations.
My enthusiasm for living life to its fullest is apparent to those with whom I work.
Passive-Aggressive This is a measure of the tendency to avoid confronting others, conveying acceptance or cooperation and yet appearing to behave in uncooperative and self-serving ways. This trait is characterized by: communicating or implying cooperation, conveying acceptance by lack of objection, or expressing support for another person’s idea, but behaving in contradictory ways that serve ones self-interest or potentially undermines
It is often best to tell people what they want to hear rather than argue with them.
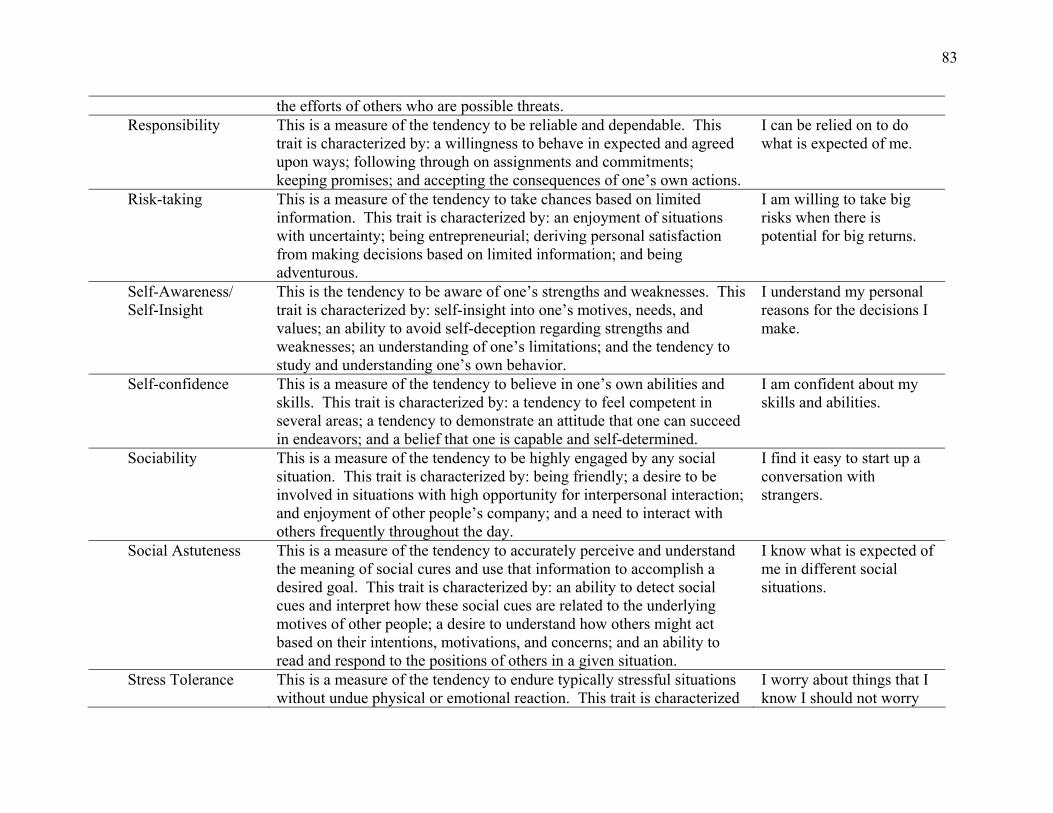
83
the efforts of others who are possible threats. Responsibility This is a measure of the tendency to be reliable and dependable. This
trait is characterized by: a willingness to behave in expected and agreed upon ways; following through on assignments and commitments; keeping promises; and accepting the consequences of one’s own actions.
I can be relied on to do what is expected of me.
Risk-taking This is a measure of the tendency to take chances based on limited information. This trait is characterized by: an enjoyment of situations with uncertainty; being entrepreneurial; deriving personal satisfaction from making decisions based on limited information; and being adventurous.
I am willing to take big risks when there is potential for big returns.
Self-Awareness/ Self-Insight
This is the tendency to be aware of one’s strengths and weaknesses. This trait is characterized by: self-insight into one’s motives, needs, and values; an ability to avoid self-deception regarding strengths and weaknesses; an understanding of one’s limitations; and the tendency to study and understanding one’s own behavior.
I understand my personal reasons for the decisions I make.
Self-confidence This is a measure of the tendency to believe in one’s own abilities and skills. This trait is characterized by: a tendency to feel competent in several areas; a tendency to demonstrate an attitude that one can succeed in endeavors; and a belief that one is capable and self-determined.
I am confident about my skills and abilities.
Sociability This is a measure of the tendency to be highly engaged by any social situation. This trait is characterized by: being friendly; a desire to be involved in situations with high opportunity for interpersonal interaction; and enjoyment of other people’s company; and a need to interact with others frequently throughout the day.
I find it easy to start up a conversation with strangers.
Social Astuteness This is a measure of the tendency to accurately perceive and understand the meaning of social cures and use that information to accomplish a desired goal. This trait is characterized by: an ability to detect social cues and interpret how these social cues are related to the underlying motives of other people; a desire to understand how others might act based on their intentions, motivations, and concerns; and an ability to read and respond to the positions of others in a given situation.
I know what is expected of me in different social situations.
Stress Tolerance This is a measure of the tendency to endure typically stressful situations without undue physical or emotional reaction. This trait is characterized
I worry about things that I know I should not worry
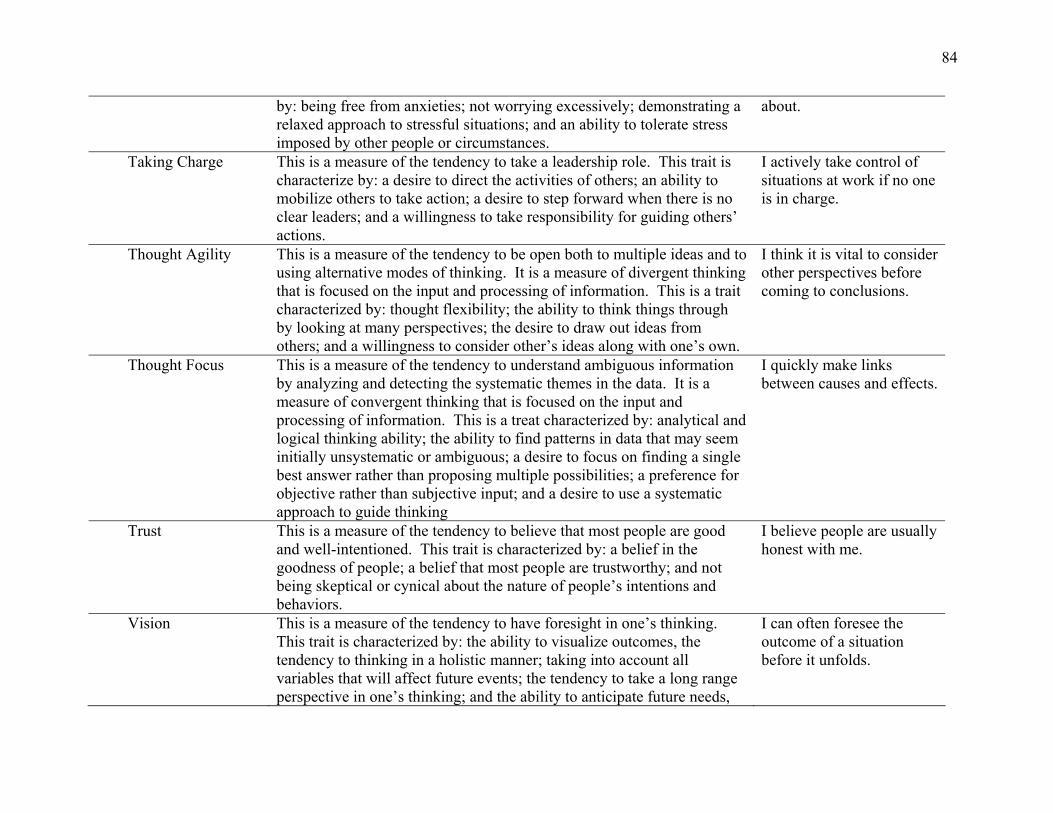
84
by: being free from anxieties; not worrying excessively; demonstrating a relaxed approach to stressful situations; and an ability to tolerate stress imposed by other people or circumstances.
about.
Taking Charge This is a measure of the tendency to take a leadership role. This trait is characterize by: a desire to direct the activities of others; an ability to mobilize others to take action; a desire to step forward when there is no clear leaders; and a willingness to take responsibility for guiding others’ actions.
I actively take control of situations at work if no one is in charge.
Thought Agility This is a measure of the tendency to be open both to multiple ideas and to using alternative modes of thinking. It is a measure of divergent thinking that is focused on the input and processing of information. This is a trait characterized by: thought flexibility; the ability to think things through by looking at many perspectives; the desire to draw out ideas from others; and a willingness to consider other’s ideas along with one’s own.
I think it is vital to consider other perspectives before coming to conclusions.
Thought Focus This is a measure of the tendency to understand ambiguous information by analyzing and detecting the systematic themes in the data. It is a measure of convergent thinking that is focused on the input and processing of information. This is a treat characterized by: analytical and logical thinking ability; the ability to find patterns in data that may seem initially unsystematic or ambiguous; a desire to focus on finding a single best answer rather than proposing multiple possibilities; a preference for objective rather than subjective input; and a desire to use a systematic approach to guide thinking
I quickly make links between causes and effects.
Trust This is a measure of the tendency to believe that most people are good and well-intentioned. This trait is characterized by: a belief in the goodness of people; a belief that most people are trustworthy; and not being skeptical or cynical about the nature of people’s intentions and behaviors.
I believe people are usually honest with me.
Vision This is a measure of the tendency to have foresight in one’s thinking. This trait is characterized by: the ability to visualize outcomes, the tendency to thinking in a holistic manner; taking into account all variables that will affect future events; the tendency to take a long range perspective in one’s thinking; and the ability to anticipate future needs,
I can often foresee the outcome of a situation before it unfolds.
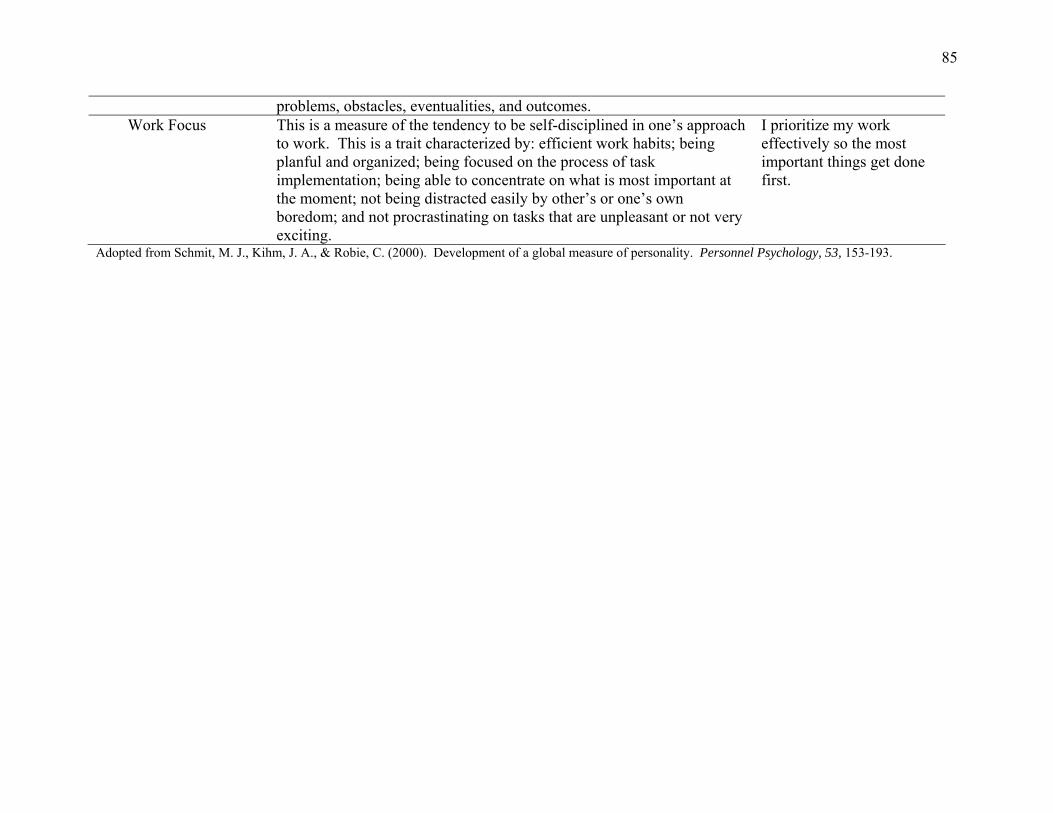
85
problems, obstacles, eventualities, and outcomes. Work Focus This is a measure of the tendency to be self-disciplined in one’s approach
to work. This is a trait characterized by: efficient work habits; being planful and organized; being focused on the process of task implementation; being able to concentrate on what is most important at the moment; not being distracted easily by other’s or one’s own boredom; and not procrastinating on tasks that are unpleasant or not very exciting.
I prioritize my work effectively so the most important things get done first.
Adopted from Schmit, M. J., Kihm, J. A., & Robie, C. (2000). Development of a global measure of personality. Personnel Psychology, 53, 153-193.
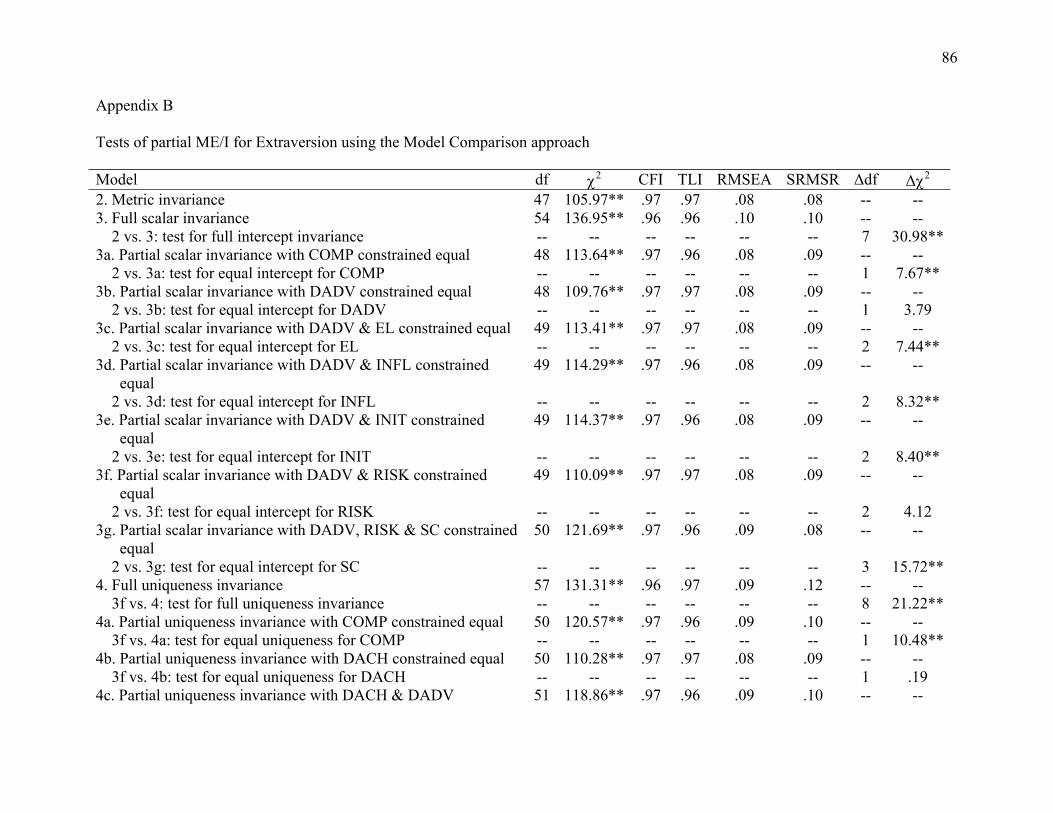
86
Appendix B Tests of partial ME/I for Extraversion using the Model Comparison approach Model df RMSEAχ2 CFI TLI SRMSR ∆df ∆χ2
2. Metric invariance 47 105.97** .97 .97 .08 .08 -- -- 3. Full scalar invariance 54 136.95** .96 .96 .10 .10 -- -- 2 vs. 3: test for full intercept invariance -- -- -- -- -- -- 7 30.98**3a. Partial scalar invariance with COMP constrained equal 48 113.64** .97 .96 .08 .09 -- -- 2 vs. 3a: test for equal intercept for COMP -- -- -- -- -- -- 1 7.67** 3b. Partial scalar invariance with DADV constrained equal 48 109.76** .97 .97 .08 .09 -- -- 2 vs. 3b: test for equal intercept for DADV -- -- -- -- -- -- 1 3.79 3c. Partial scalar invariance with DADV & EL constrained equal 49 113.41** .97 .97 .08 .09 -- -- 2 vs. 3c: test for equal intercept for EL -- -- -- -- -- -- 2 7.44**
3d. Partial scalar invariance with DADV & INFL constrained equal
49 114.29**
.97 .96 .08 .09 -- --
2 vs. 3d: test for equal intercept for INFL -- -- -- -- -- -- 2 8.32** 3e. Partial scalar invariance with DADV & INIT constrained
equal 49 114.37** .97 .96 .08 .09 -- --
2 vs. 3e: test for equal intercept for INIT -- -- -- -- -- -- 2 8.40** 3f. Partial scalar invariance with DADV & RISK constrained
equal 49 110.09** .97 .97 .08 .09 -- --
2 vs. 3f: test for equal intercept for RISK -- -- -- -- -- -- 2 4.12 3g. Partial scalar invariance with DADV, RISK & SC constrained
equal 50 121.69** .97 .96 .09 .08 -- --
2 vs. 3g: test for equal intercept for SC -- -- -- -- -- -- 3 15.72**4. Full uniqueness invariance 57 131.31** .96 .97 .09 .12 -- -- 3f vs. 4: test for full uniqueness invariance -- -- -- -- -- -- 8 21.22**4a. Partial uniqueness invariance with COMP constrained equal 50 120.57** .97 .96 .09 .10 -- -- 3f vs. 4a: test for equal uniqueness for COMP -- -- -- -- -- -- 1 10.48**4b. Partial uniqueness invariance with DACH constrained equal 50 110.28** .97 .97 .08 .09 -- -- 3f vs. 4b: test for equal uniqueness for DACH -- -- -- -- -- -- 1 .19 4c. Partial uniqueness invariance with DACH & DADV 51 118.86** .97 .96 .09 .10 -- --
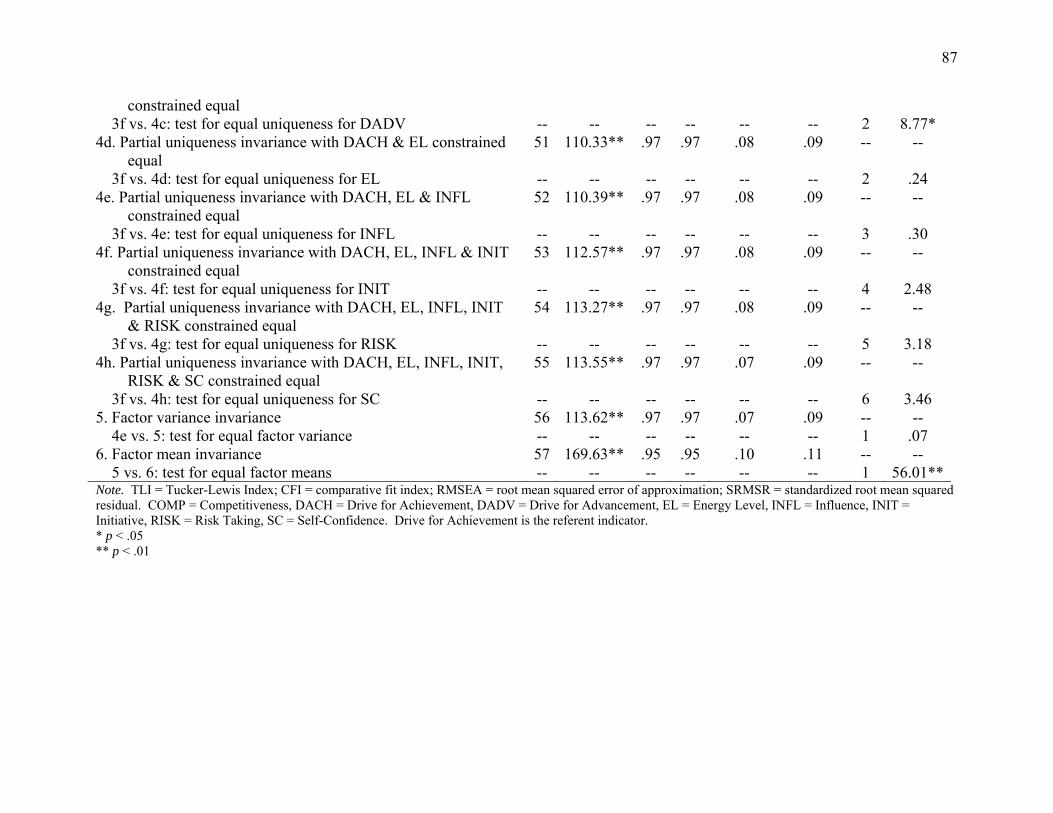
87
constrained equal 3f vs. 4c: test for equal uniqueness for DADV -- -- -- -- -- -- 2 8.77*
4d. Partial uniqueness invariance with DACH & EL constrained equal
51 110.33**
.97 .97 .08 .09 -- --
3f vs. 4d: test for equal uniqueness for EL -- -- -- -- -- -- 2 .24 4e. Partial uniqueness invariance with DACH, EL & INFL
constrained equal 52 110.39** .97 .97 .08 .09 -- --
3f vs. 4e: test for equal uniqueness for INFL -- -- -- -- -- -- 3 .30 4f. Partial uniqueness invariance with DACH, EL, INFL & INIT
constrained equal 53 112.57** .97 .97 .08 .09 -- --
3f vs. 4f: test for equal uniqueness for INIT -- -- -- -- -- -- 4 2.48 4g. Partial uniqueness invariance with DACH, EL, INFL, INIT
& RISK constrained equal 54 113.27** .97 .97 .08 .09 -- --
3f vs. 4g: test for equal uniqueness for RISK -- -- -- -- -- -- 5 3.18 4h. Partial uniqueness invariance with DACH, EL, INFL, INIT,
RISK & SC constrained equal 55 113.55** .97 .97 .07 .09 -- --
3f vs. 4h: test for equal uniqueness for SC -- -- -- -- -- -- 6 3.46 5. Factor variance invariance 56 113.62** .97 .97 .07 .09 -- -- 4e vs. 5: test for equal factor variance -- -- -- -- -- -- 1 .07 6. Factor mean invariance 57 169.63** .95 .95 .10 .11 -- -- 5 vs. 6: test for equal factor means -- -- -- -- -- -- 1 56.01**Note. TLI = Tucker-Lewis Index; CFI = comparative fit index; RMSEA = root mean squared error of approximation; SRMSR = standardized root mean squared residual. COMP = Competitiveness, DACH = Drive for Achievement, DADV = Drive for Advancement, EL = Energy Level, INFL = Influence, INIT = Initiative, RISK = Risk Taking, SC = Self-Confidence. Drive for Achievement is the referent indicator. * p < .05 ** p < .01
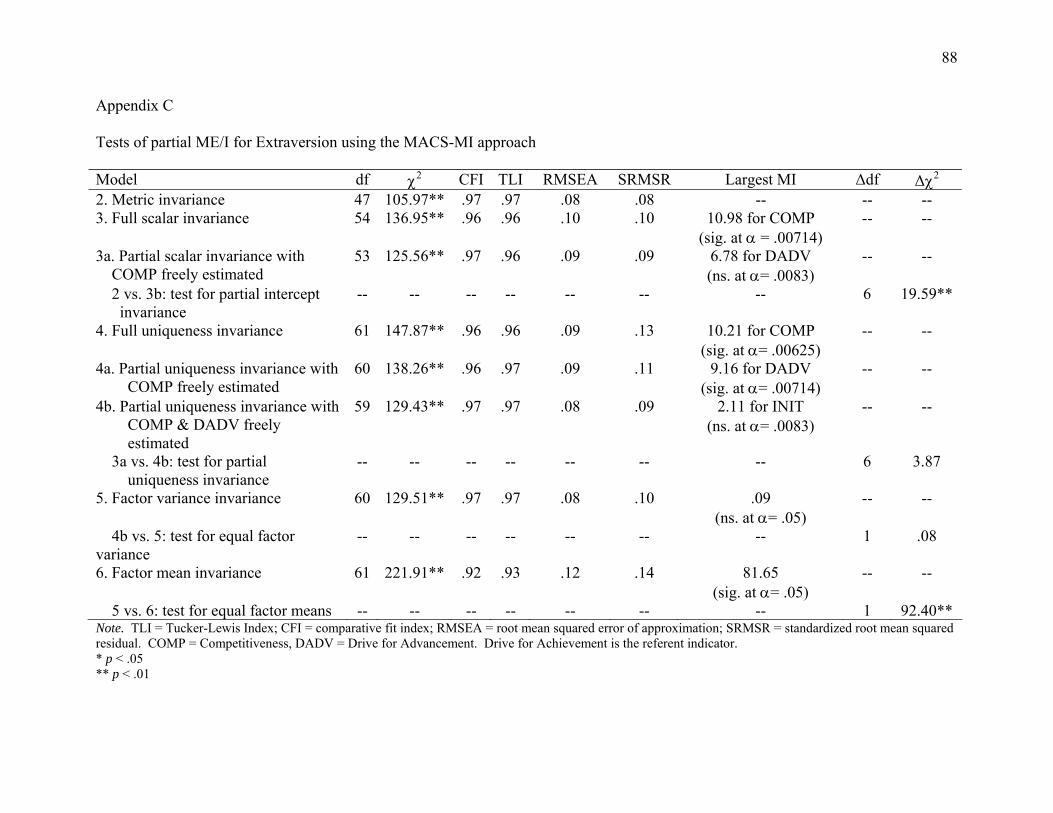
88
Appendix C Tests of partial ME/I for Extraversion using the MACS-MI approach Model df CFIχ2 TLI RMSEA SRMSR Largest MI ∆df ∆χ2
2. Metric invariance 47 105.97** .97 .97 .08 .08 -- -- -- 3. Full scalar invariance 54 136.95** .96 .96 .10 .10 10.98 for COMP
(sig. at α = .00714) --
--
3a. Partial scalar invariance with COMP freely estimated
53 125.56** .97 .96 .09 .09 6.78 for DADV (ns. at α= .0083)
-- --
2 vs. 3b: test for partial intercept invariance
-- -- -- -- -- -- -- 6 19.59**
4. Full uniqueness invariance 61 147.87** .96 .96 .09 .13 10.21 for COMP (sig. at α= .00625)
-- --
4a. Partial uniqueness invariance with COMP freely estimated
60 138.26** .96 .97 .09 .11 9.16 for DADV (sig. at α= .00714)
-- --
4b. Partial uniqueness invariance with COMP & DADV freely estimated
59 129.43** .97 .97 .08 .09 2.11 for INIT (ns. at α= .0083)
-- --
3a vs. 4b: test for partial uniqueness invariance
-- -- -- -- -- -- -- 6 3.87
5. Factor variance invariance 60 129.51** .97 .97 .08 .10 .09 (ns. at α= .05)
-- --
4b vs. 5: test for equal factor variance
-- -- -- -- -- -- -- 1 .08
6. Factor mean invariance 61 221.91** .92 .93 .12 .14 81.65 (sig. at α= .05)
-- --
5 vs. 6: test for equal factor means -- -- -- -- -- -- -- 1 92.40** Note. TLI = Tucker-Lewis Index; CFI = comparative fit index; RMSEA = root mean squared error of approximation; SRMSR = standardized root mean squared residual. COMP = Competitiveness, DADV = Drive for Advancement. Drive for Achievement is the referent indicator. * p < .05 ** p < .01

89
Appendix D Tests of partial ME/I for Extraversion using the Z test Model df CFIχ2 TLI RMSEA SRMSR Z ∆df ∆χ2
2. Metric invariance 47 105.97** .97 .97 .08 .08 -- -- -- 3. Full scalar invariance 54 136.95** .96 .96 .10 .10 -.57 for COMP
-.40 for DADV .31 for EL
.34 for INFL .32 for INIT .16 for RISK
.57 for SC
--
--
2 vs. 3: test for full intercept invariance
-- -- -- -- -- -- -- 7 30.98**
4. Full uniqueness invariance 62 161.29** .95 .96 .10 .15 3.14** for COMP -.53 for DACH
2.73** for DADV .30 for EL
-.12 for INFL -1.41 for INIT .92 for RISK -.48 for SC
-- --
3 vs. 4: test for full uniqueness invariance
-- -- -- -- -- -- -- 8 24.34**
4a. Partial uniqueness invariance with COMP & DADV freely estimated
60 140.92** .96 .96 .09 .10 -- -- --
3 vs. 4a: test for partial uniqueness invariance
-- -- -- -- -- -- -- 6 3.97
5. Factor variance invariance 61 140.97**
.96 .97 .09 .11 -- -- -- 4a vs. 5: test for equal factor variance
-- -- -- -- -- -- -- 1 .05
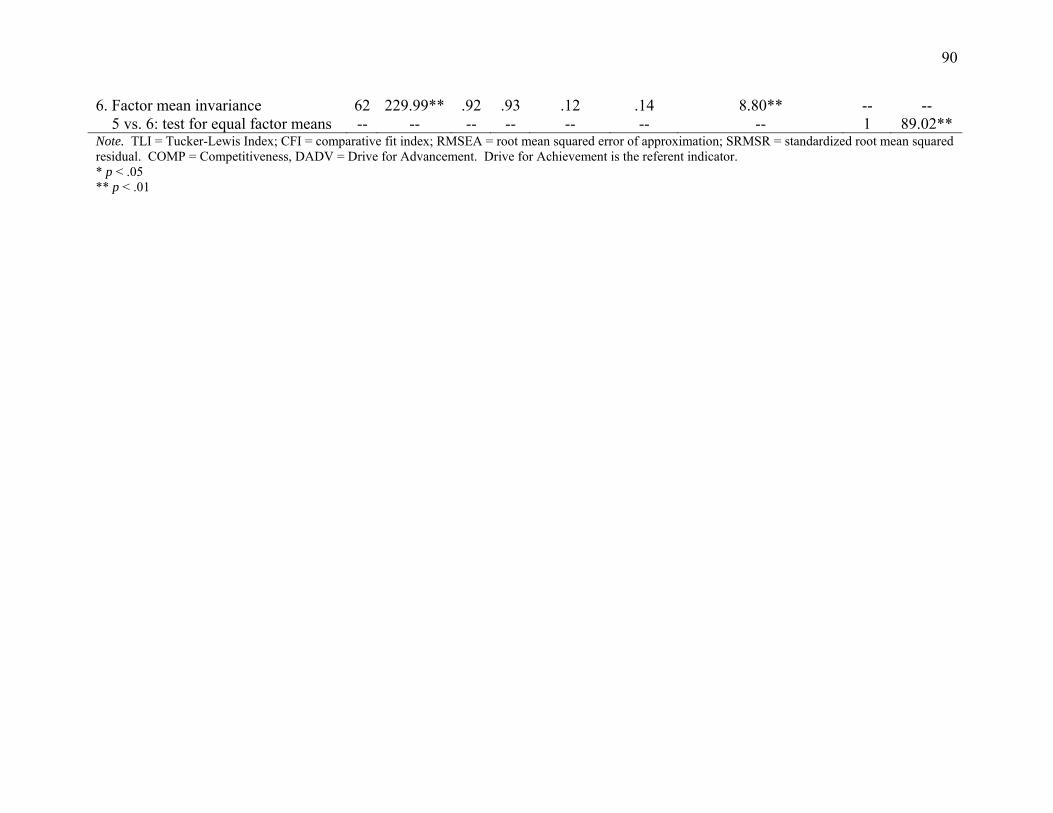
90
6. Factor mean invariance 62 229.99** .92 .93 .12 .14 8.80** -- -- 5 vs. 6: test for equal factor means -- -- -- -- -- -- -- 1 89.02** Note. TLI = Tucker-Lewis Index; CFI = comparative fit index; RMSEA = root mean squared error of approximation; SRMSR = standardized root mean squared residual. COMP = Competitiveness, DADV = Drive for Advancement. Drive for Achievement is the referent indicator. * p < .05 ** p < .01
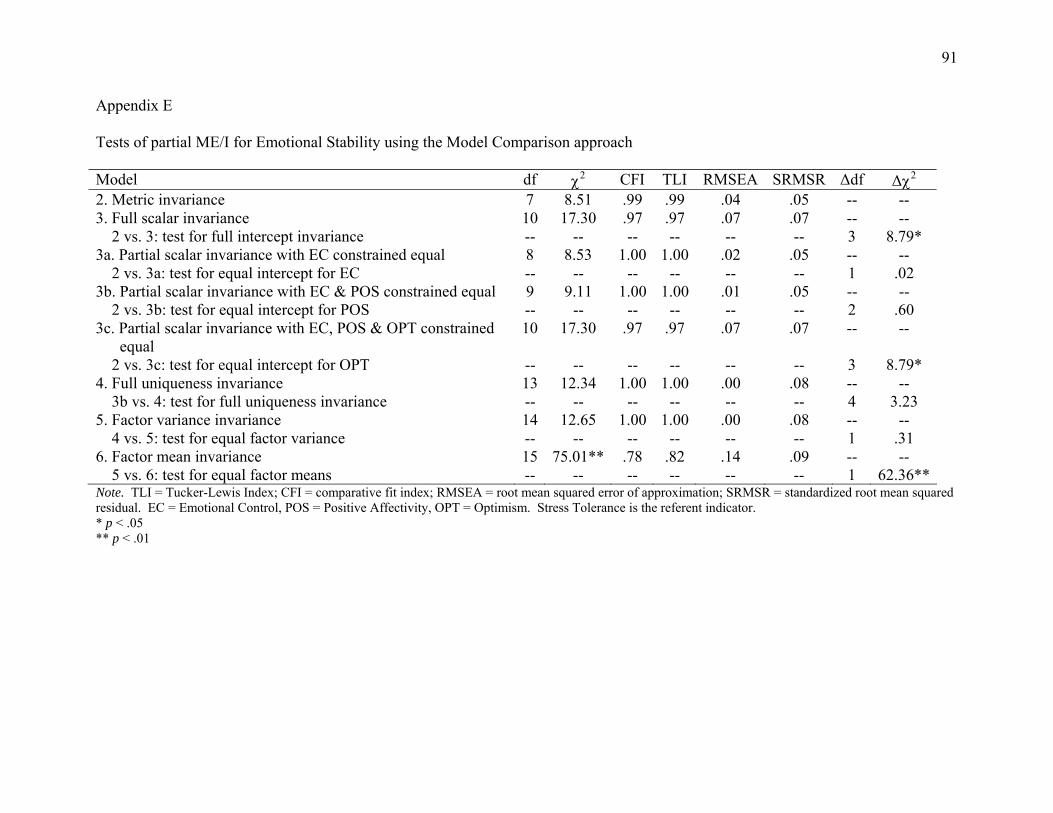
91
Appendix E Tests of partial ME/I for Emotional Stability using the Model Comparison approach Model df RMSEAχ2 CFI TLI SRMSR ∆df ∆χ2
2. Metric invariance 7 8.51 .99 .99 .04 .05 -- -- 3. Full scalar invariance 10 17.30 .97 .97 .07 .07 -- -- 2 vs. 3: test for full intercept invariance -- -- -- -- -- -- 3 8.79* 3a. Partial scalar invariance with EC constrained equal 8 8.53 1.00 1.00 .02 .05 -- -- 2 vs. 3a: test for equal intercept for EC -- -- -- -- -- -- 1 .02 3b. Partial scalar invariance with EC & POS constrained equal 9 9.11 1.00 1.00 .01 .05 -- -- 2 vs. 3b: test for equal intercept for POS -- -- -- -- -- -- 2 .60 3c. Partial scalar invariance with EC, POS & OPT constrained
equal 10 17.30 .97 .97 .07 .07 -- --
2 vs. 3c: test for equal intercept for OPT -- -- -- -- -- -- 3 8.79* 4. Full uniqueness invariance 13 12.34 1.00 1.00 .00 .08 -- -- 3b vs. 4: test for full uniqueness invariance -- -- -- -- -- -- 4 3.23 5. Factor variance invariance 14 12.65 1.00 1.00 .00 .08 -- -- 4 vs. 5: test for equal factor variance -- -- -- -- -- -- 1 .31 6. Factor mean invariance 15 75.01** .78 .82 .14 .09 -- -- 5 vs. 6: test for equal factor means -- -- -- -- -- -- 1 62.36**Note. TLI = Tucker-Lewis Index; CFI = comparative fit index; RMSEA = root mean squared error of approximation; SRMSR = standardized root mean squared residual. EC = Emotional Control, POS = Positive Affectivity, OPT = Optimism. Stress Tolerance is the referent indicator. * p < .05 ** p < .01
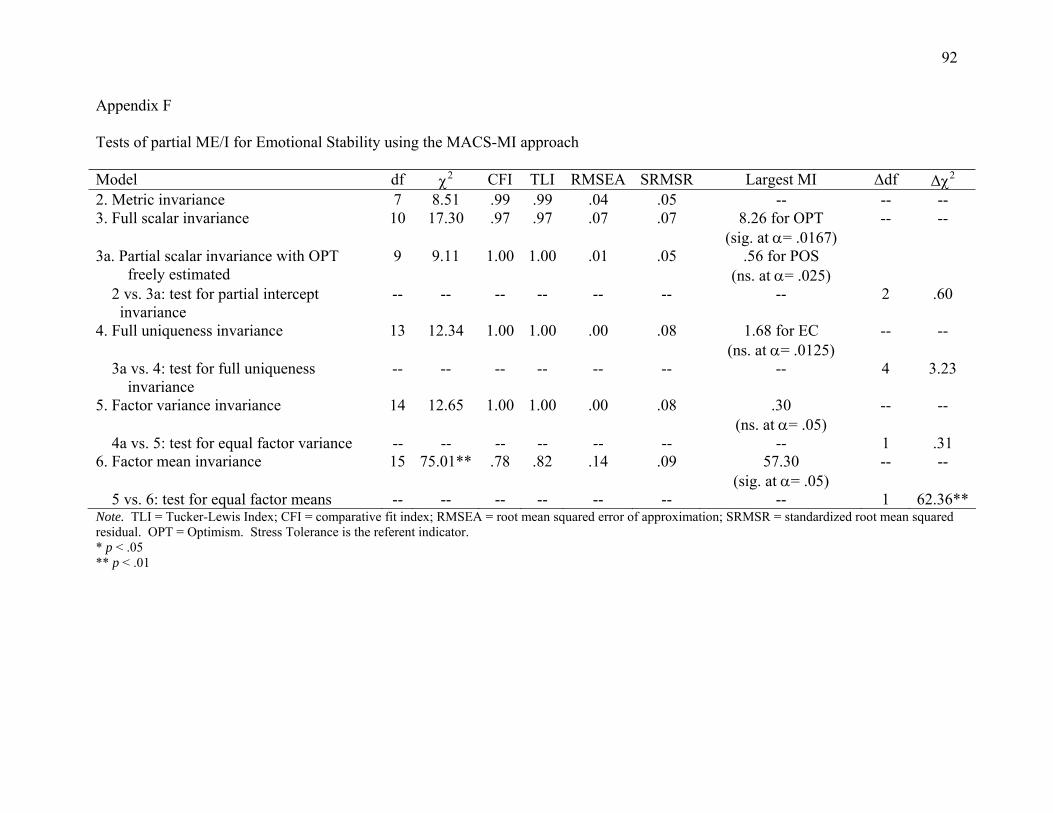
92
Appendix F Tests of partial ME/I for Emotional Stability using the MACS-MI approach Model df TLIχ2 CFI RMSEA SRMSR Largest MI ∆df ∆χ2
2. Metric invariance 7 8.51 .99 .99 .04 .05 -- -- -- 3. Full scalar invariance 10 17.30 .97 .97 .07 .07 8.26 for OPT
(sig. at α= .0167) --
--
3a. Partial scalar invariance with OPT freely estimated
9 9.11 1.00 1.00 .01 .05 .56 for POS (ns. at α= .025)
2 vs. 3a: test for partial intercept invariance
-- -- -- -- -- -- -- 2 .60
4. Full uniqueness invariance 13 12.34 1.00 1.00 .00 .08 1.68 for EC (ns. at α= .0125)
-- --
3a vs. 4: test for full uniqueness invariance
-- -- -- -- -- -- -- 4 3.23
5. Factor variance invariance 14 12.65 1.00 1.00 .00 .08 .30 (ns. at α= .05)
-- --
4a vs. 5: test for equal factor variance -- -- -- -- -- -- -- 1 .31 6. Factor mean invariance 15 75.01** .78 .82 .14 .09 57.30
(sig. at α= .05) -- --
5 vs. 6: test for equal factor means -- -- -- -- -- -- -- 1 62.36**Note. TLI = Tucker-Lewis Index; CFI = comparative fit index; RMSEA = root mean squared error of approximation; SRMSR = standardized root mean squared residual. OPT = Optimism. Stress Tolerance is the referent indicator. * p < .05 ** p < .01
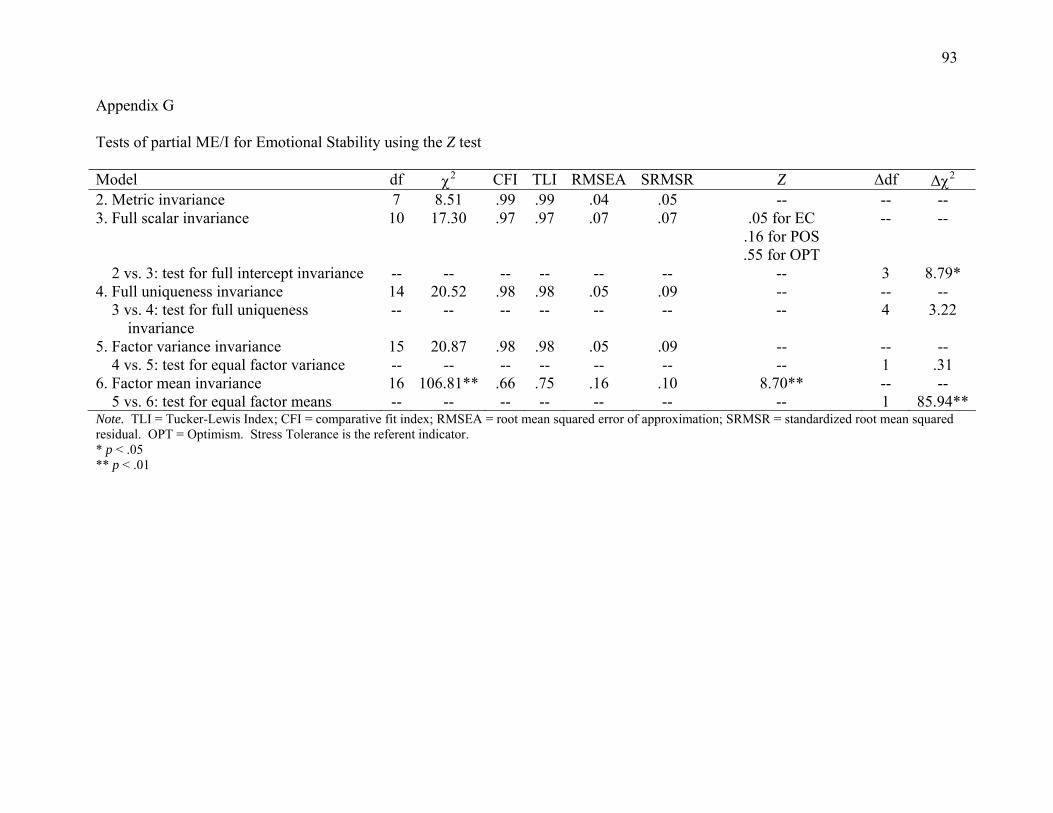
93
Appendix G Tests of partial ME/I for Emotional Stability using the Z test Model df χ2 CFI TLI RMSEA SRMSR Z ∆df ∆χ2
2. Metric invariance 7 8.51 .99 .99 .04 .05 -- -- -- 3. Full scalar invariance 10 17.30 .97 .97 .07 .07 .05 for EC
.16 for POS
.55 for OPT
--
--
2 vs. 3: test for full intercept invariance -- -- -- -- -- -- -- 3 8.79* 4. Full uniqueness invariance 14 20.52 .98 .98
.05 .09 -- -- --
3 vs. 4: test for full uniqueness invariance
-- -- -- -- -- -- -- 4 3.22
5. Factor variance invariance 15 20.87 .98 .98 .05 .09 -- -- -- 4 vs. 5: test for equal factor variance -- -- -- -- -- -- -- 1 .31 6. Factor mean invariance 16 106.81** .66 .75 .16 .10 8.70** -- -- 5 vs. 6: test for equal factor means -- -- -- -- -- -- -- 1 85.94**Note. TLI = Tucker-Lewis Index; CFI = comparative fit index; RMSEA = root mean squared error of approximation; SRMSR = standardized root mean squared residual. OPT = Optimism. Stress Tolerance is the referent indicator. * p < .05 ** p < .01