Embed Size (px)
Citation preview
EECS 598 Week 13
Single spin detection by magnetic resonance force microscopy
Paul LeeWayne FungGeorge IoannouSmitesh Bakrania
Outline
• Magnetic Resonancetheory behind itNMR and MRI applications
• MRFM instrumentcantilever fabricationsample preparation principle
• Single Spin Detectiondetection method
• MRFM results single spin signal
• Other applicationqubit readout device
Nuclear Spin
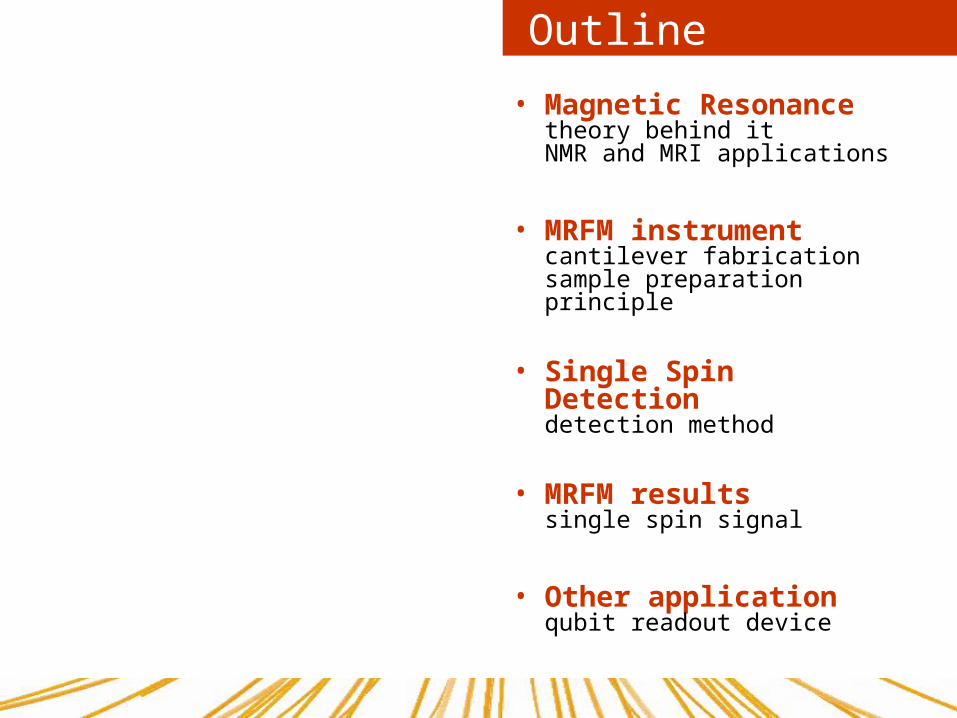
Spinning charge on
proton generates
magnetic dipole
Classical representation of a proton
precessing in a magnetic field of
magnitude Bo in analogy with a
precessing spinning top
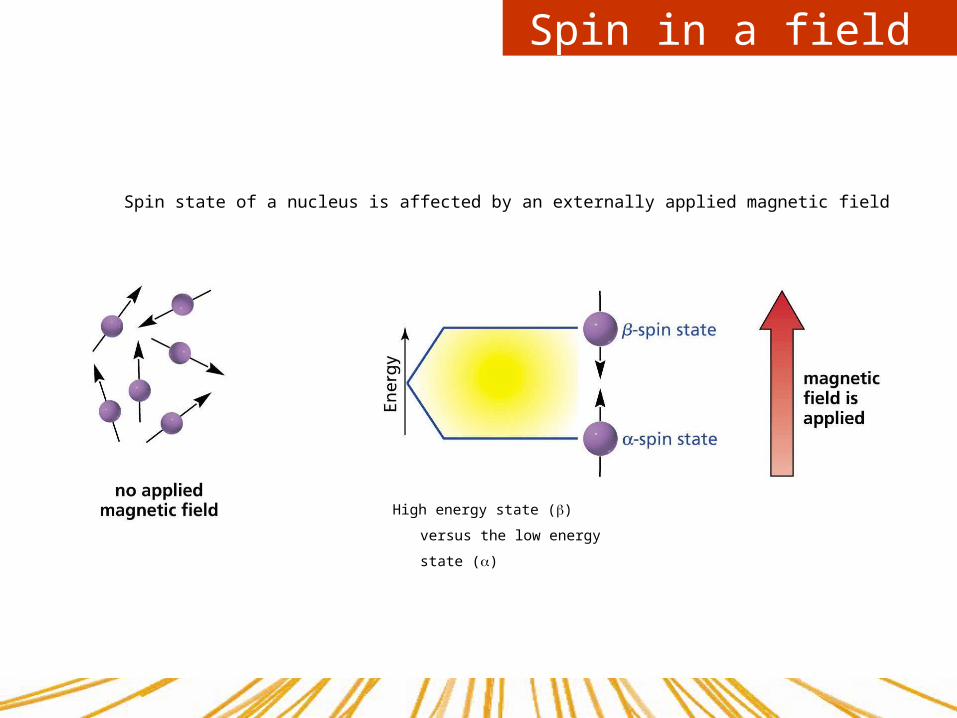
Spin in a field
Spin state of a nucleus is affected by an externally applied magnetic field
High energy state () versus
the low energy state ()
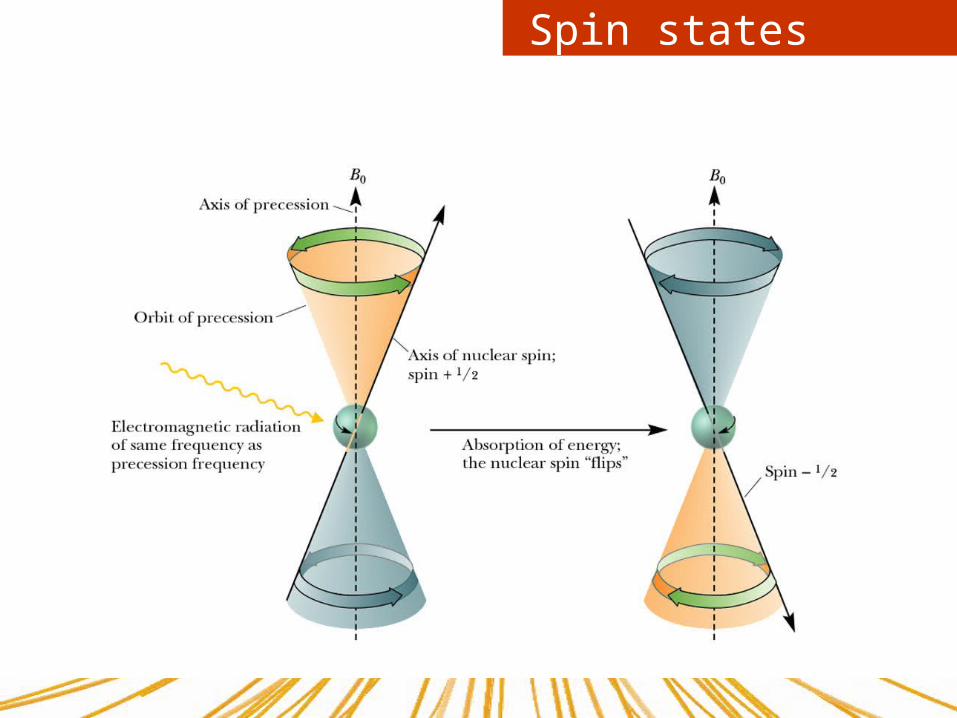
Spin states
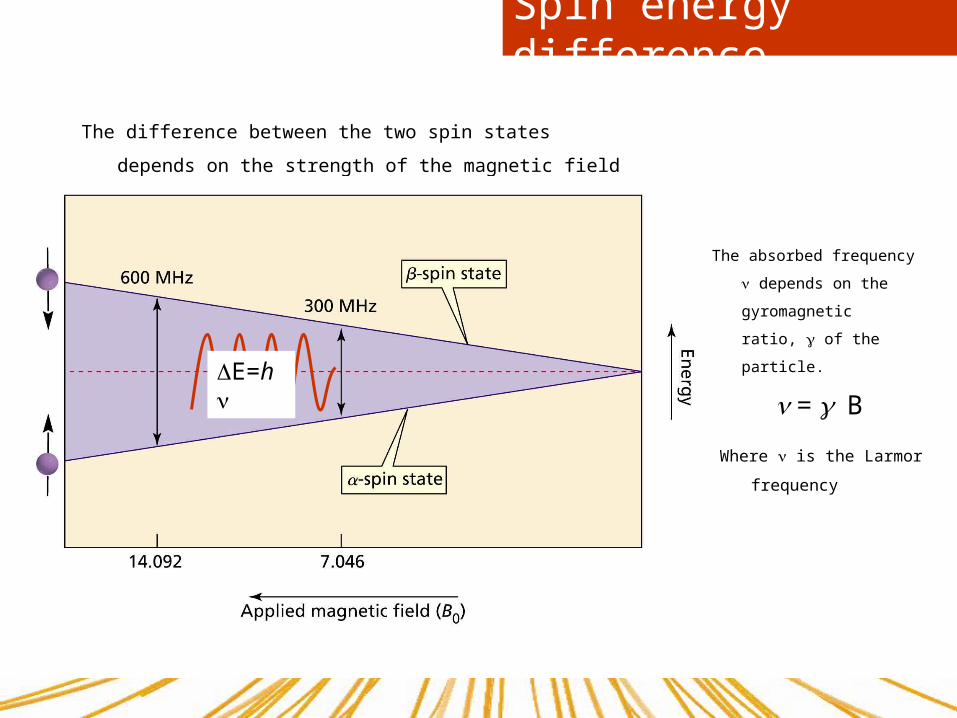
Spin energy difference
The difference between the two spin states depends on the
strength of the magnetic field
E=h = B
The absorbed frequency
depends on the
gyromagnetic ratio,
of the particle.
Where is the Larmor
frequency
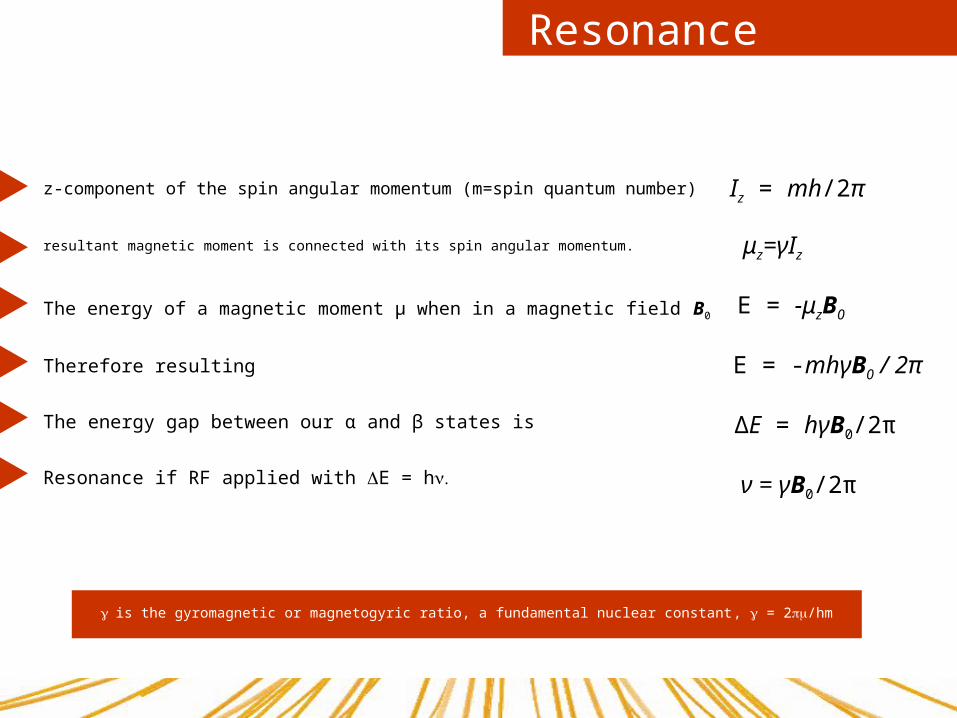
z-component of the spin angular momentum (m=spin quantum number) Iz = mh/2π
μz=γIz
E = -μzB0
E = -mhγB0 / 2π
ΔE = hγB0/2π
ν = γB0/2π
resultant magnetic moment is connected with its spin angular momentum.
The energy of a magnetic moment μ when in a magnetic field B0
Therefore resulting
The energy gap between our α and β states is
Resonance if RF applied with E = h
is the gyromagnetic or magnetogyric ratio, a fundamental nuclear constant, = 2/hm
Resonance
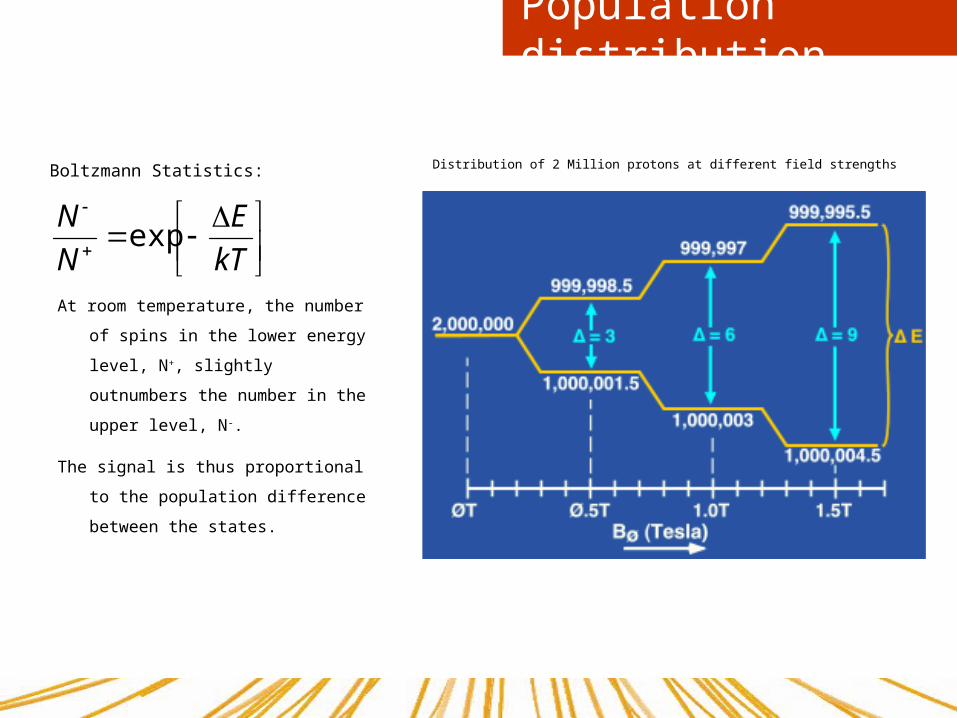
Distribution of 2 Million protons at different field strengthsBoltzmann Statistics:
kT
E
N
Nexp
At room temperature, the number of
spins in the lower energy level,
N+, slightly outnumbers the
number in the upper level, N-.
The signal is thus proportional to the
population difference between
the states.
Population distribution
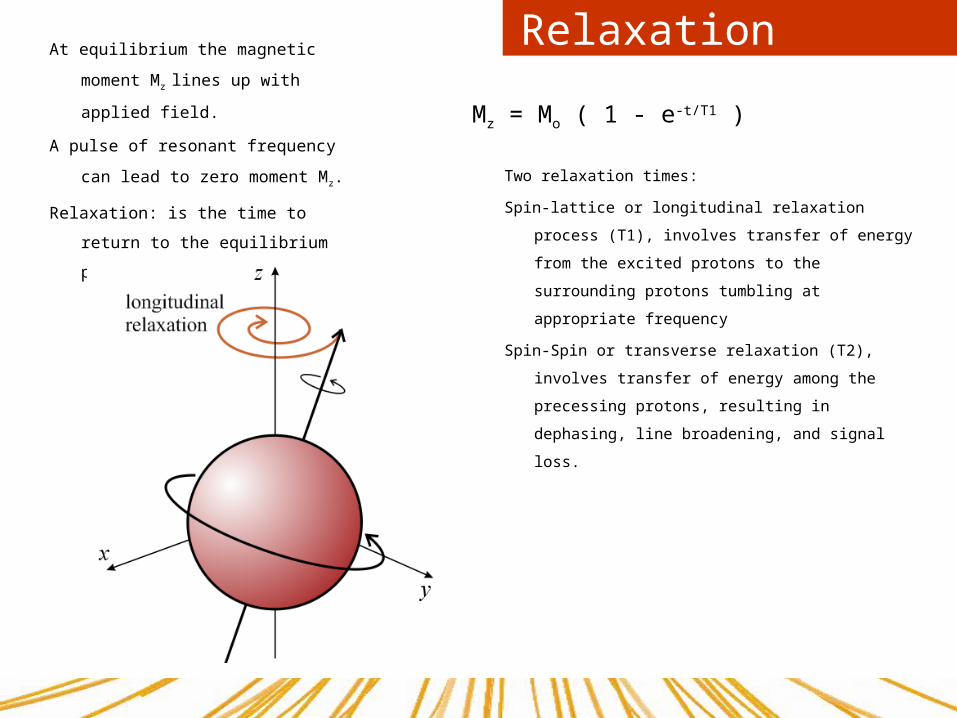
At equilibrium the magnetic moment
Mz lines up with applied field.
A pulse of resonant frequency can
lead to zero moment Mz.
Relaxation: is the time to return to
the equilibrium position
Relaxation
Two relaxation times:
Spin-lattice or longitudinal relaxation process
(T1), involves transfer of energy from the
excited protons to the surrounding protons
tumbling at appropriate frequency
Spin-Spin or transverse relaxation (T2), involves
transfer of energy among the precessing
protons, resulting in dephasing, line
broadening, and signal loss.
Mz = Mo ( 1 - e-t/T1 )

Magnetic resonance
When the energy of the RF
matches E absorption of
energy occurs which can be
detected.
The E also depends on the
surrounding molecules.
In NMR spectroscopy, is
between 60 and 800 MHz for
hydrogen nuclei. (or carbon
atoms using 13C-NMR
spectroscopy phosphorus
atoms using 31P-NMR
spectroscopy)
In clinical MRI, is typically
between 15 and 80 MHz for
hydrogen imaging.
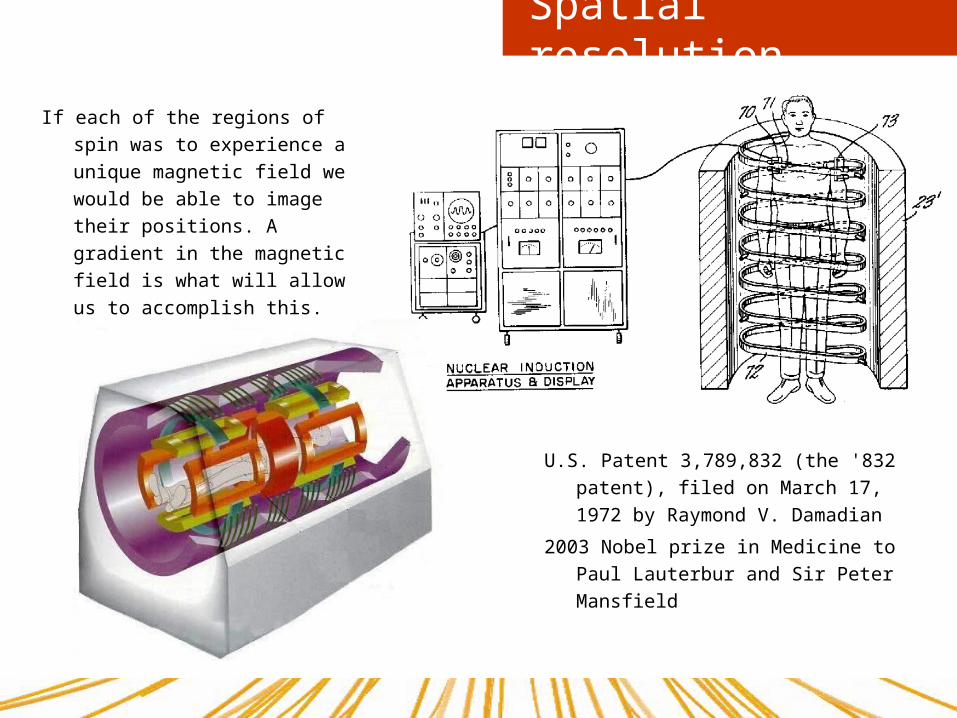
Spatial resolution
If each of the regions of spin was
to experience a unique
magnetic field we would be
able to image their positions.
A gradient in the magnetic
field is what will allow us to
accomplish this.
U.S. Patent 3,789,832 (the '832
patent), filed on March 17, 1972
by Raymond V. Damadian
2003 Nobel prize in Medicine to Paul
Lauterbur and Sir Peter Mansfield

Magnetic resonance
Magnetic Resonance Imaging (MRI)
MRI based on NMR principles - an image
of the NMR signal in a thin slice
through the human body.
The human body is primarily fat and water
- human body approximately 63%
hydrogen atoms.
Two or more particles with spins having
opposite signs can pair up to eliminate
the observable manifestations of spin.
An example is helium. In nuclear
magnetic resonance, it is unpaired
nuclear spins that are of importance.
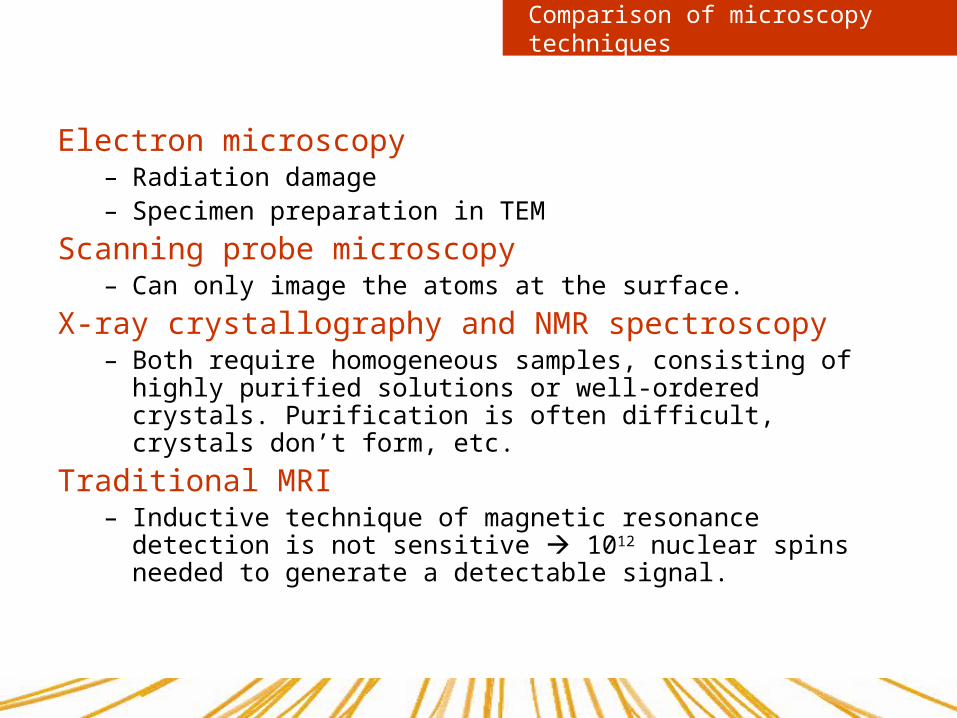
Comparison of microscopy techniques
Electron microscopy– Radiation damage– Specimen preparation in TEM
Scanning probe microscopy– Can only image the atoms at the surface.
X-ray crystallography and NMR spectroscopy– Both require homogeneous samples, consisting of highly purified
solutions or well-ordered crystals. Purification is often difficult, crystals don’t form, etc.
Traditional MRI– Inductive technique of magnetic resonance detection is not
sensitive 1012 nuclear spins needed to generate a detectable signal.
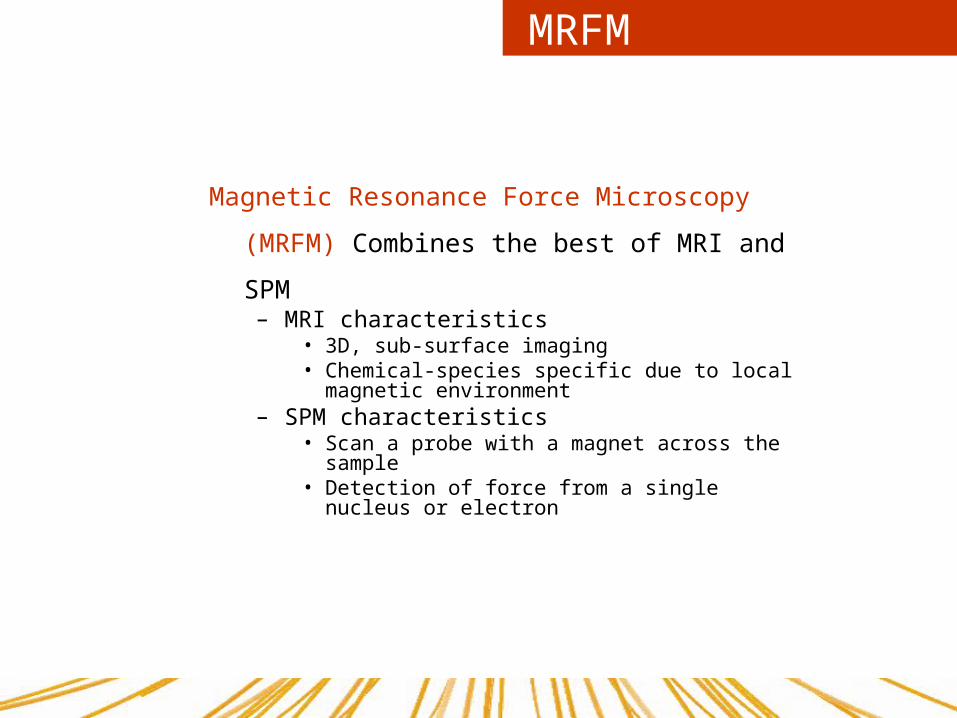
MRFM
Magnetic Resonance Force Microscopy (MRFM)
Combines the best of MRI and SPM– MRI characteristics
• 3D, sub-surface imaging• Chemical-species specific due to local magnetic
environment– SPM characteristics
• Scan a probe with a magnet across the sample• Detection of force from a single nucleus or electron
Single spin sensitivity demonstrated
Rugar et al. detected the force from the spin of a single electron, thus demonstrating the ultimate resolution limit of MRFM.
Basic idea– The magnetic moment of the electron exerts a force on a
magnet mounted on a cantilever– The cantilever’s resonant frequency fc shifts due to the change in
effective stiffness.– Challenge: detect the tiny frequency shift δfc.
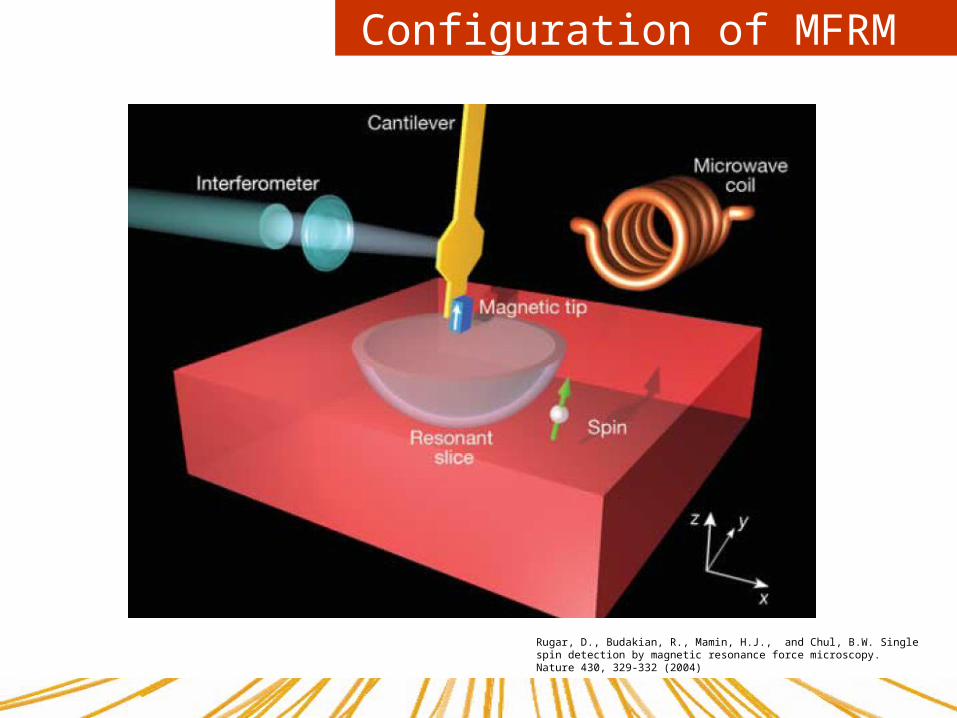
Configuration of MFRM
Rugar, D., Budakian, R., Mamin, H.J., and Chul, B.W. Single spin detection by magnetic resonance force microscopy. Nature 430, 329-332 (2004)
MRFM Instrument
• Cantilever fabrication
• Sample preparation

Cantilever Fabrication
• Cantilever requirements and responses
– Minimize dissipation – Uniform thickness
• Made from SCS, very clean surface
– Minimize RF/laser induced self-heating
• Must have low electrical conductivity
– SCS must be undoped or light doped
– Minimize reduce clamping losses• Overhang at base of cantilever
must be minimized• Base should be thickened and
stiffened
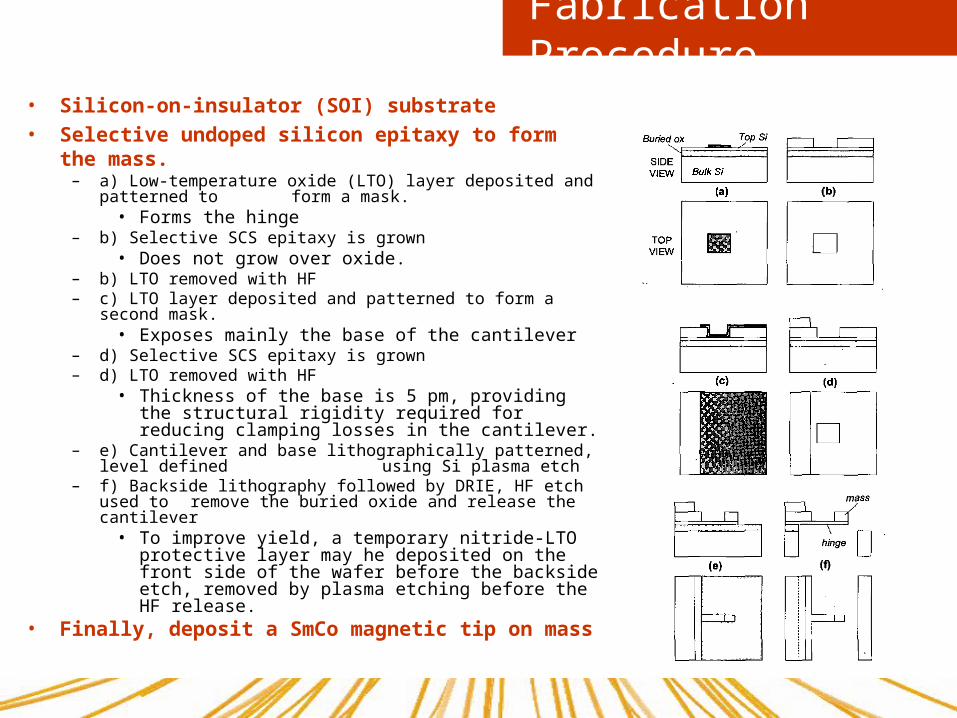
Fabrication Procedure
• Silicon-on-insulator (SOI) substrate• Selective undoped silicon epitaxy to form the mass.
– a) Low-temperature oxide (LTO) layer deposited and patterned to form a mask.
• Forms the hinge– b) Selective SCS epitaxy is grown
• Does not grow over oxide. – b) LTO removed with HF – c) LTO layer deposited and patterned to form a second mask.
• Exposes mainly the base of the cantilever – d) Selective SCS epitaxy is grown– d) LTO removed with HF
• Thickness of the base is 5 pm, providing the structural rigidity required for reducing clamping losses in the cantilever.
– e) Cantilever and base lithographically patterned, level defined using Si plasma etch
– f) Backside lithography followed by DRIE, HF etch used to remove the buried oxide and release the cantilever
• To improve yield, a temporary nitride-LTO protective layer may he deposited on the front side of the wafer before the backside etch, removed by plasma etching before the HF release.
• Finally, deposit a SmCo magnetic tip on mass

Alternative Fabrications
• a) Long-hinge design
• b) Short-hinge design
• c) Design using LOCOS – (LOCal Oxidation of
Silicon)
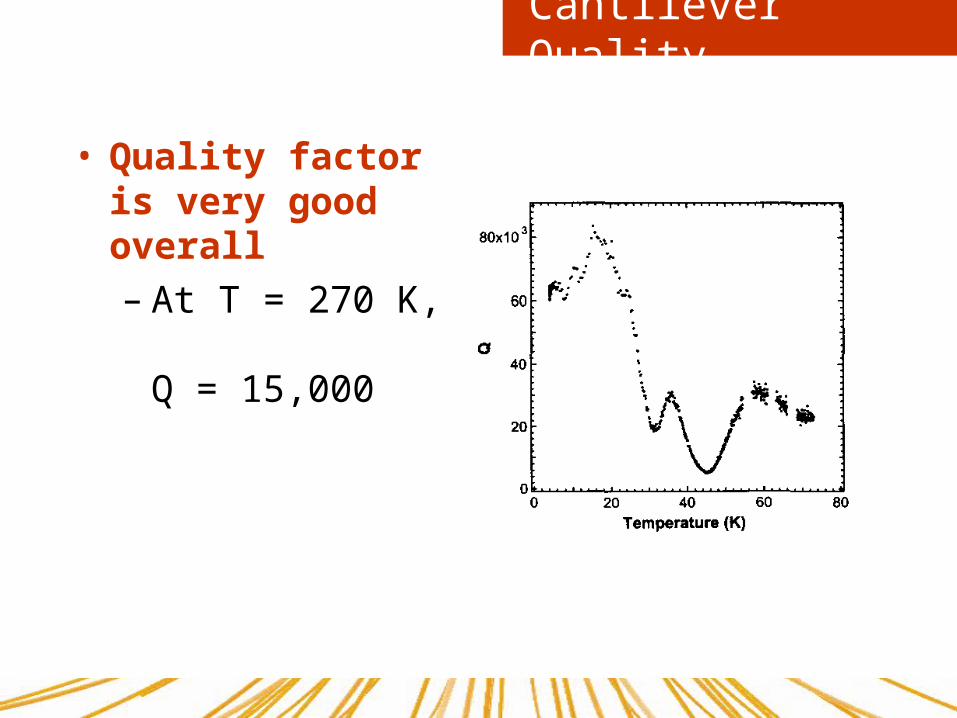
Cantilever Quality
• Quality factor is very good overall– At T = 270 K,
Q = 15,000
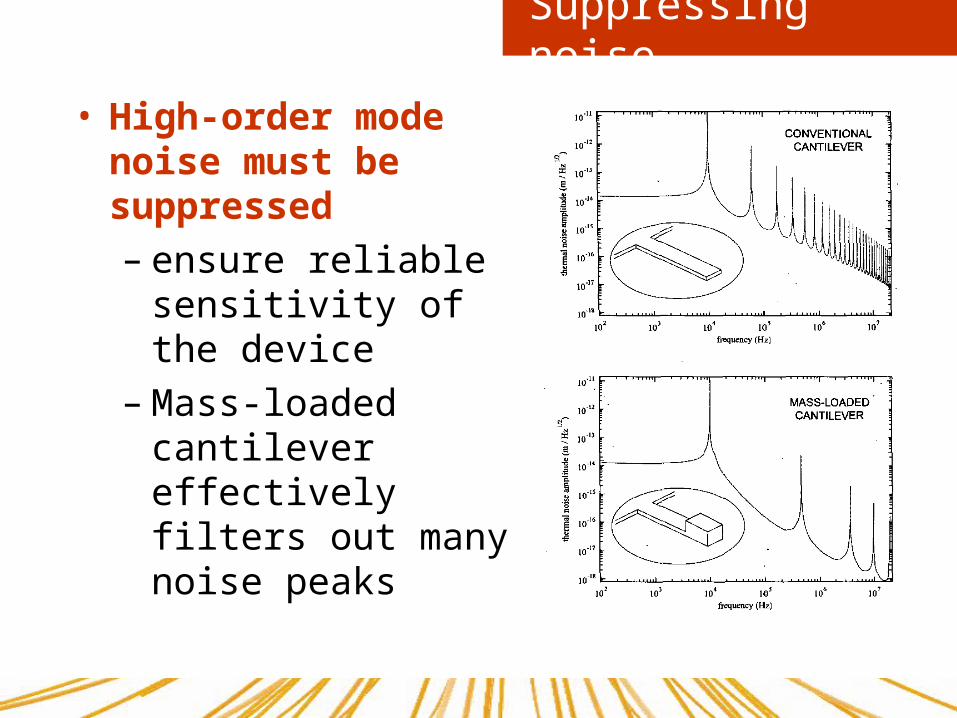
Suppressing noise
• High-order mode noise must be suppressed– ensure reliable
sensitivity of the device
– Mass-loaded cantilever effectively filters out many noise peaks
Cantilever Sensitivity
• Minimum detectable force in a bandwidth– Fmin = (SFB)(1/2) ≈ (wt2/lQ)(1/2)(Eρ)(1/4)(kBTB)(1/2)
– The ferromagnetic tip of the beam will suffer magnetostatic forces on the order 10-16 N (aN)
– For our beam, Fmin = 36 aN• Within desirable limits
Sample Preparation
• Substrate consists of vitreous Silica (Suprasil W2)
– Irradiated with 2-Gy dose of Co60 gamma rays
• Produces a low concentration of Si dangling bonds containing unpaired electron spins
– Known as E΄ centres
Proposed E΄ centre models
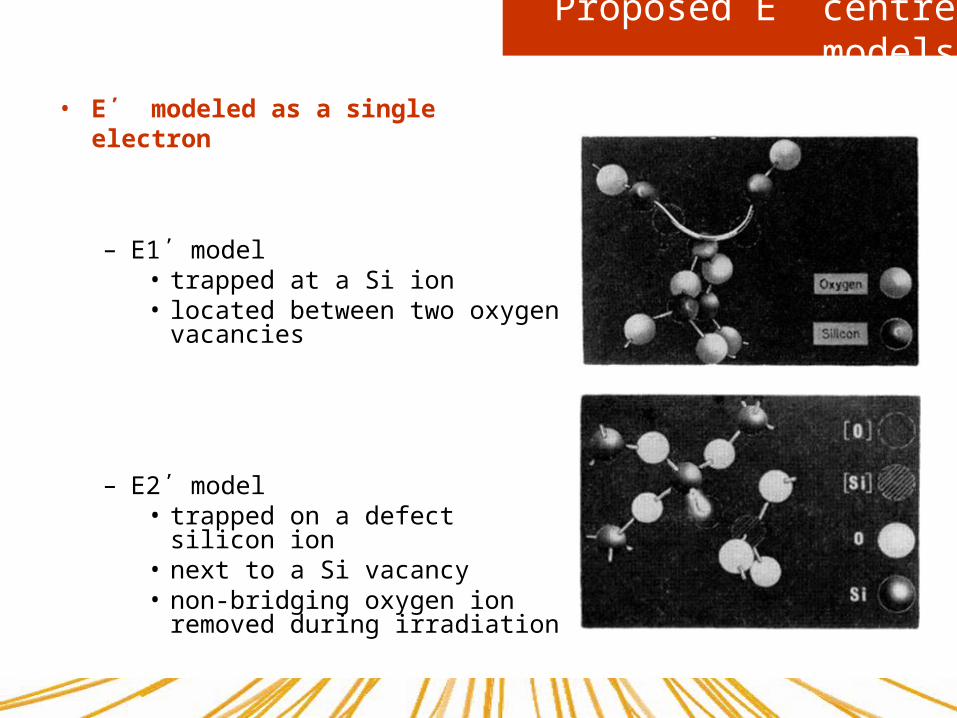
• E΄ modeled as a single electron
– E1΄ model• trapped at a Si ion• located between two oxygen
vacancies
– E2΄ model• trapped on a defect silicon ion • next to a Si vacancy • non-bridging oxygen ion
removed during irradiation
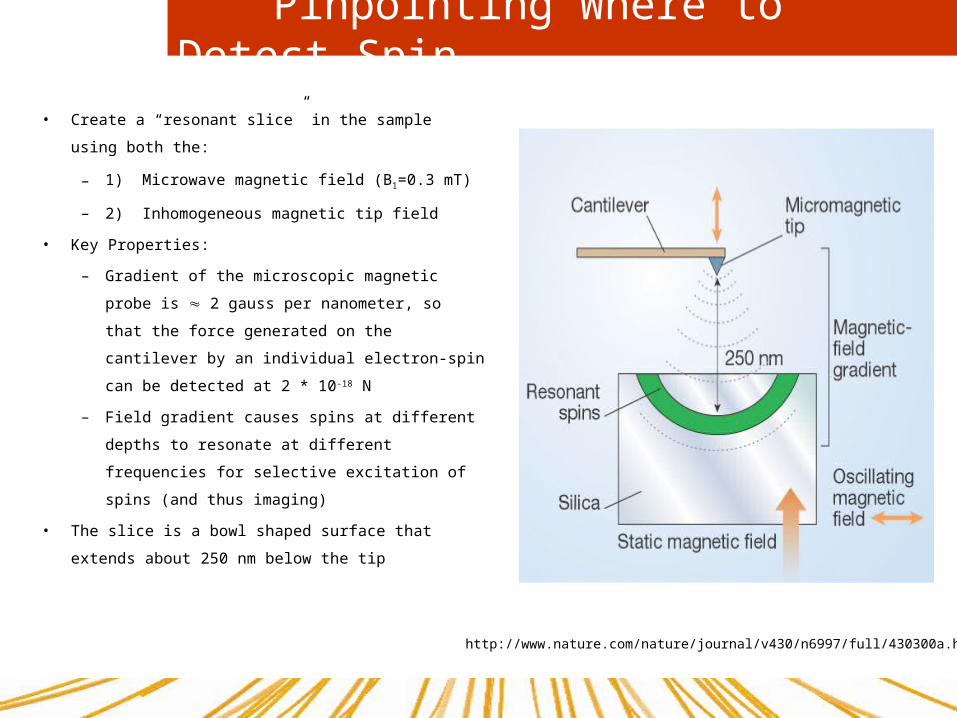
Pinpointing Where to Detect Spin
• Create a “resonant slice” in the sample using both
the:
– 1) Microwave magnetic field (B1=0.3 mT)
– 2) Inhomogeneous magnetic tip field
• Key Properties:
– Gradient of the microscopic magnetic probe is
2 gauss per nanometer, so that the force
generated on the cantilever by an individual
electron-spin can be detected at 2 * 10-18 N
– Field gradient causes spins at different depths
to resonate at different frequencies for
selective excitation of spins (and thus imaging)
• The slice is a bowl shaped surface that extends
about 250 nm below the tip
http://www.nature.com/nature/journal/v430/n6997/full/430300a.html
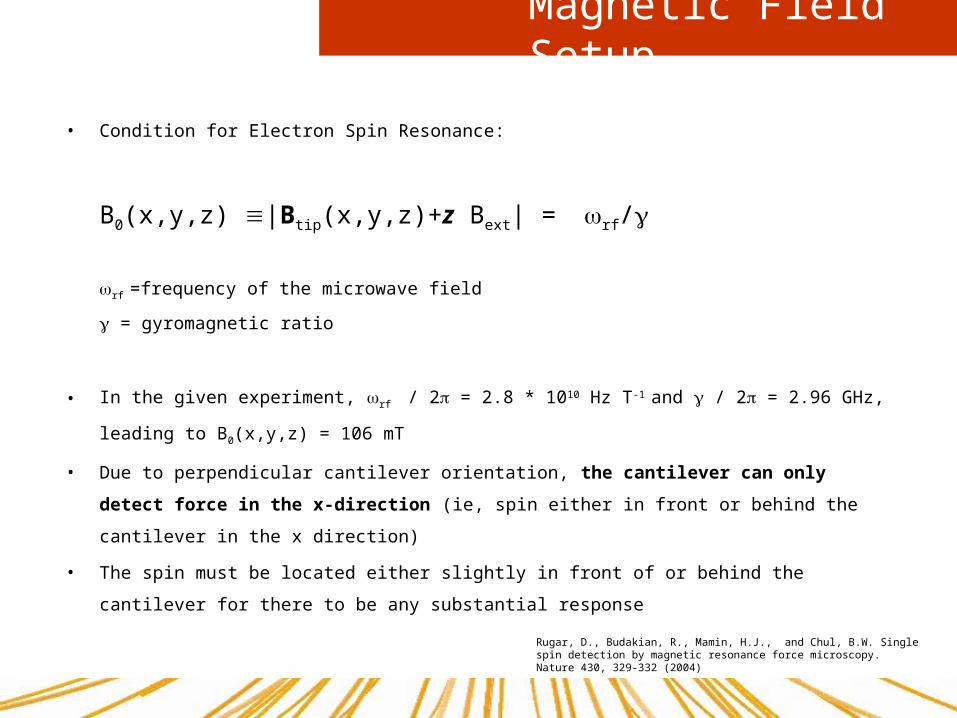
Magnetic Field Setup
• Condition for Electron Spin Resonance:
B0(x,y,z) |Btip(x,y,z)+z Bext| = rf/
rf =frequency of the microwave field
= gyromagnetic ratio
• In the given experiment, rf / 2 = 2.8 * 1010 Hz T-1 and / 2 = 2.96 GHz, leading to B0(x,y,z) =
106 mT
• Due to perpendicular cantilever orientation, the cantilever can only detect force in the x-
direction (ie, spin either in front or behind the cantilever in the x direction)
• The spin must be located either slightly in front of or behind the cantilever for there to be any
substantial response
Rugar, D., Budakian, R., Mamin, H.J., and Chul, B.W. Single spin detection by magnetic resonance force microscopy. Nature 430, 329-332 (2004)
Manipulating Spins
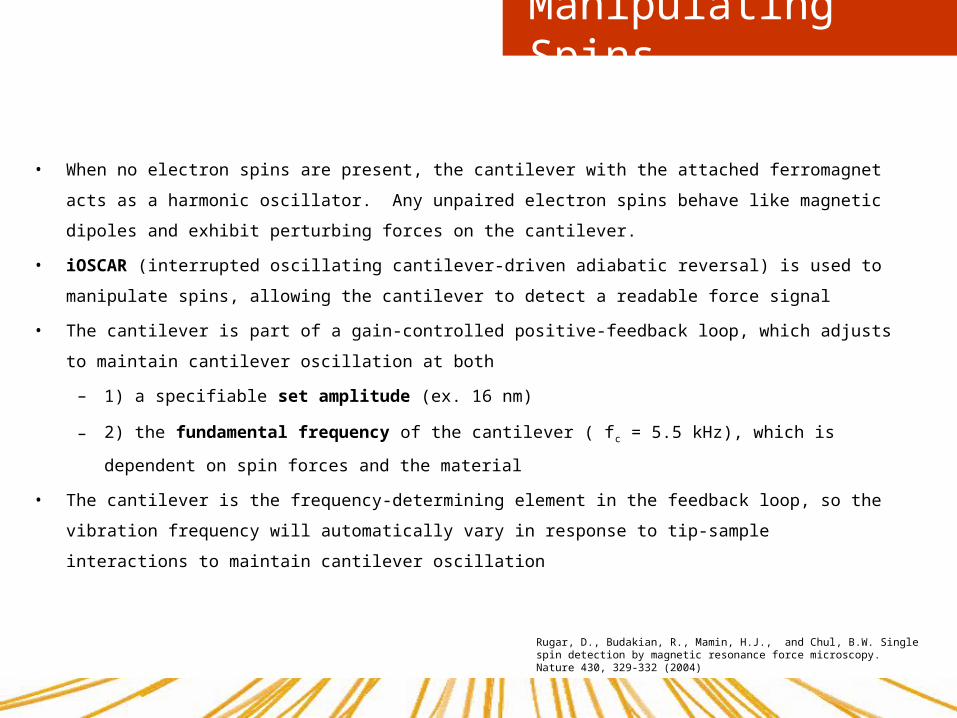
• When no electron spins are present, the cantilever with the attached ferromagnet acts as a
harmonic oscillator. Any unpaired electron spins behave like magnetic dipoles and exhibit
perturbing forces on the cantilever.
• iOSCAR (interrupted oscillating cantilever-driven adiabatic reversal) is used to manipulate spins,
allowing the cantilever to detect a readable force signal
• The cantilever is part of a gain-controlled positive-feedback loop, which adjusts to maintain
cantilever oscillation at both
– 1) a specifiable set amplitude (ex. 16 nm)
– 2) the fundamental frequency of the cantilever ( fc = 5.5 kHz), which is dependent on spin
forces and the material
• The cantilever is the frequency-determining element in the feedback loop, so the vibration frequency
will automatically vary in response to tip-sample interactions to maintain cantilever oscillation
Rugar, D., Budakian, R., Mamin, H.J., and Chul, B.W. Single spin detection by magnetic resonance force microscopy. Nature 430, 329-332 (2004)
iOSCAR Setup
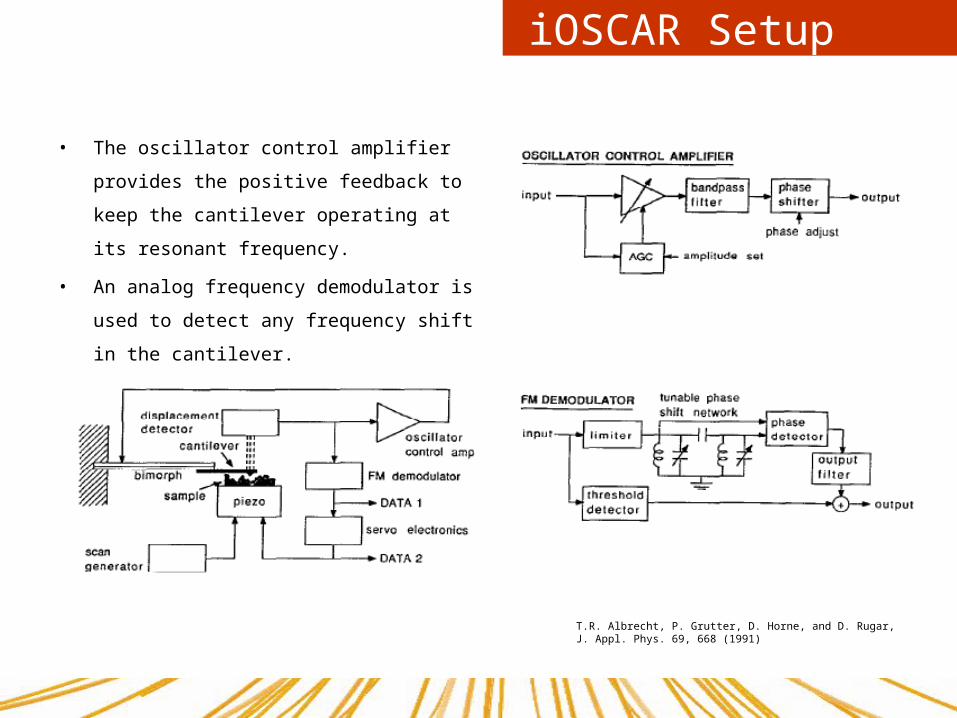
• The oscillator control amplifier provides the
positive feedback to keep the cantilever
operating at its resonant frequency.
• An analog frequency demodulator is used to
detect any frequency shift in the cantilever.
T.R. Albrecht, P. Grutter, D. Horne, and D. Rugar, J. Appl. Phys. 69, 668 (1991)
iOSCAR Explained
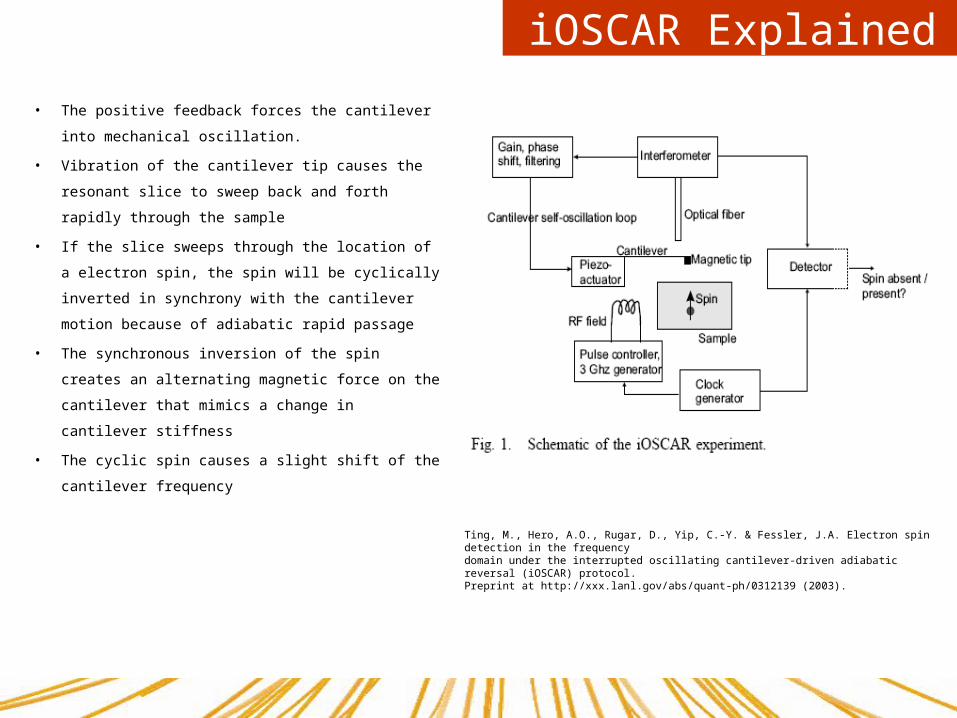
• The positive feedback forces the cantilever into
mechanical oscillation.
• Vibration of the cantilever tip causes the resonant
slice to sweep back and forth rapidly through the
sample
• If the slice sweeps through the location of a
electron spin, the spin will be cyclically inverted in
synchrony with the cantilever motion because of
adiabatic rapid passage
• The synchronous inversion of the spin creates an
alternating magnetic force on the cantilever that
mimics a change in cantilever stiffness
• The cyclic spin causes a slight shift of the
cantilever frequencyTing, M., Hero, A.O., Rugar, D., Yip, C.-Y. & Fessler, J.A. Electron spin detection in the frequencydomain under the interrupted oscillating cantilever-driven adiabatic reversal (iOSCAR) protocol.Preprint at http://xxx.lanl.gov/abs/quant-ph/0312139 (2003).
iOSCAR Explained
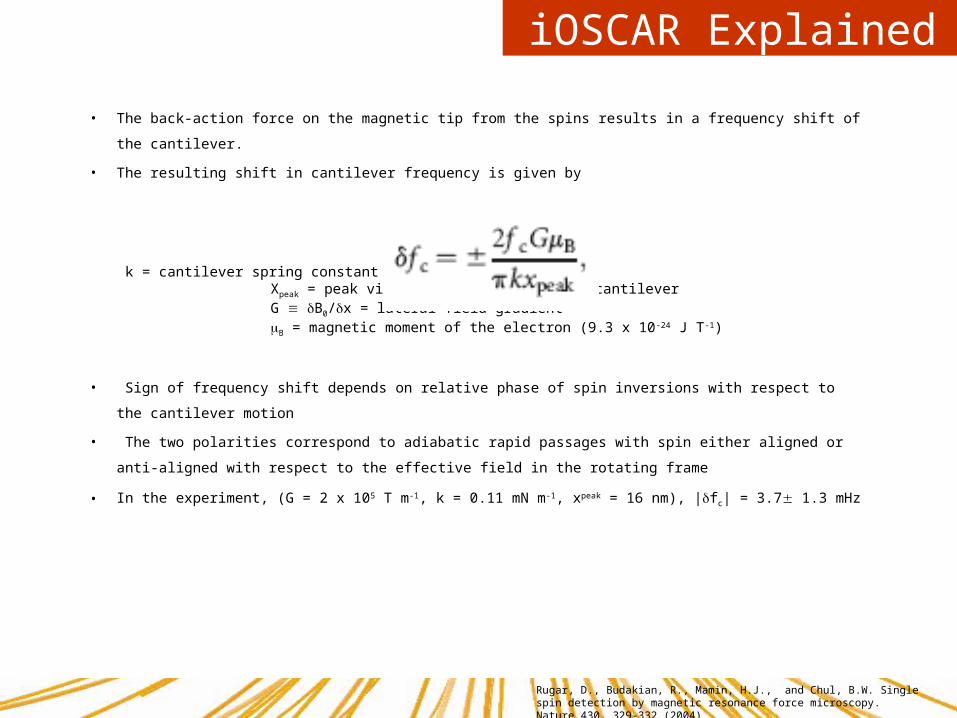
• The back-action force on the magnetic tip from the spins results in a frequency shift of the cantilever.
• The resulting shift in cantilever frequency is given by
k = cantilever spring constant Xpeak = peak vibration amplitude of the cantilever G B0/x = lateral field gradient B = magnetic moment of the electron (9.3 x 10 -24 J T-1)
• Sign of frequency shift depends on relative phase of spin inversions with respect to the cantilever
motion
• The two polarities correspond to adiabatic rapid passages with spin either aligned or anti-aligned
with respect to the effective field in the rotating frame
• In the experiment, (G = 2 x 10⁵ T m-1, k = 0.11 mN m-1, xpeak = 16 nm), |fc| = 3.7 1.3 mHz
Rugar, D., Budakian, R., Mamin, H.J., and Chul, B.W. Single spin detection by magnetic resonance force microscopy. Nature 430, 329-332 (2004)
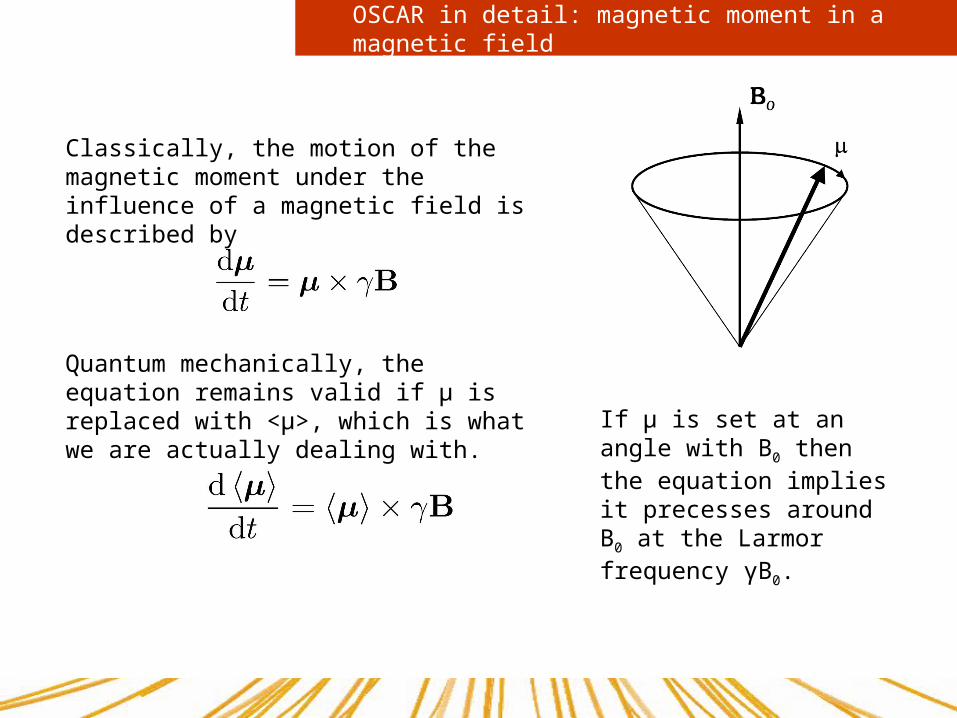
OSCAR in detail: magnetic moment in a magnetic field
Classically, the motion of the magnetic moment under the influence of a magnetic field is described by
Quantum mechanically, the equation remains valid if µ is replaced with <µ>, which is what we are actually dealing with. If µ is set at an angle with B0
then the equation implies it precesses around B0 at the Larmor frequency γB0.
OSCAR in detail:
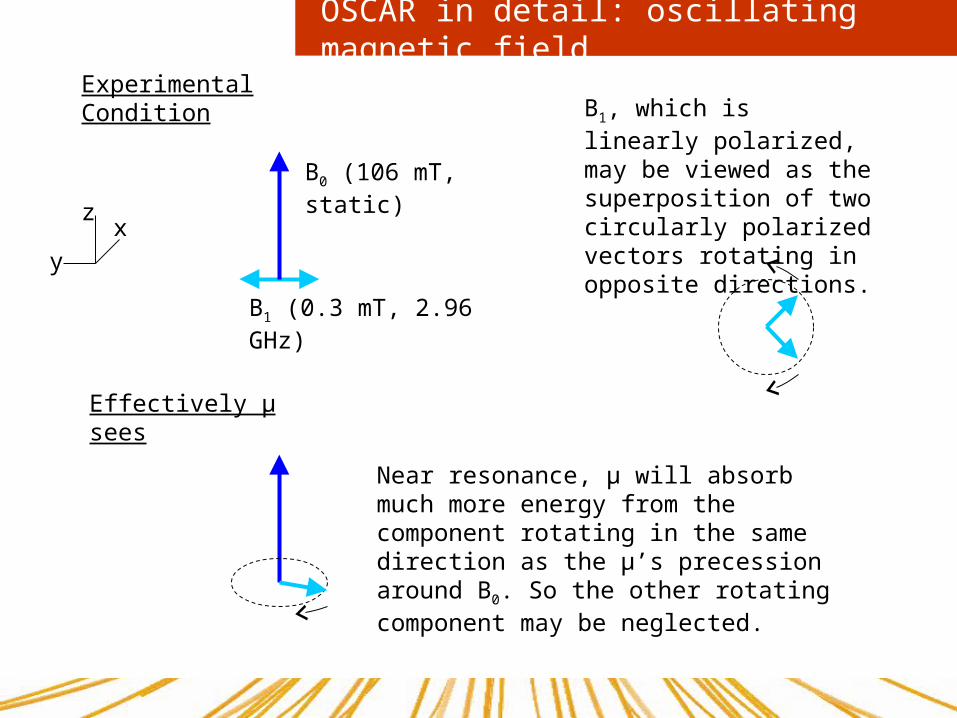
B1 (0.3 mT, 2.96 GHz)
B0 (106 mT, static)
xz
y
Experimental Condition
Near resonance, µ will absorb much more energy from the component rotating in the same direction as the µ’s precession around B0. So the other rotating component may be neglected.
B1, which is linearly polarized, may be viewed as the superposition of two circularly polarized vectors rotating in opposite directions.
Effectively µ sees
OSCAR in detail: oscillating magnetic field
Magnetic resonance
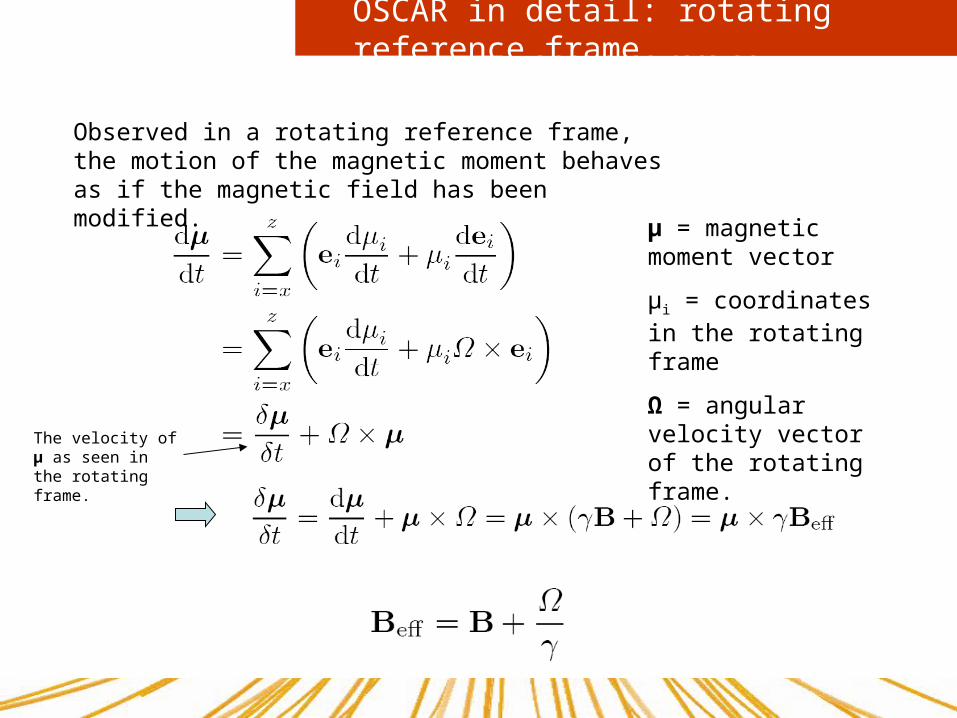
Observed in a rotating reference frame, the motion of the magnetic moment behaves as if the magnetic field has been modified.
μ = magnetic moment vector
μi = coordinates in the rotating frame
Ω = angular velocity vector of the rotating frame.The velocity of μ as
seen in the rotating frame.
OSCAR in detail: rotating reference frame
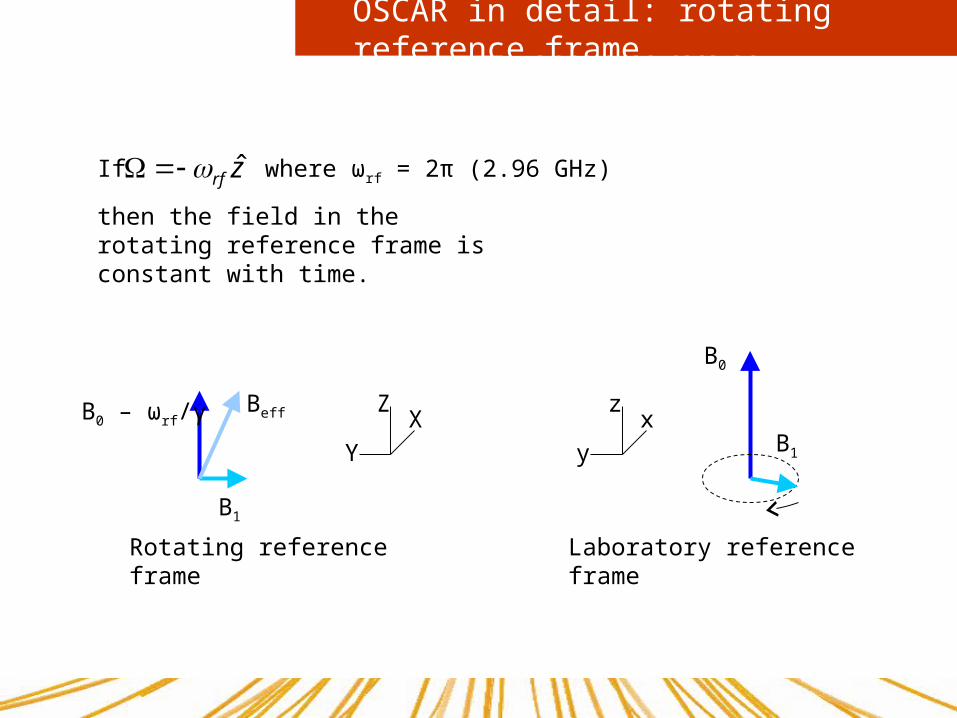
zrf ˆ where ωrf = 2π (2.96 GHz)If
then the field in the rotating reference frame is constant with time.
B0
B1
xz
y
Laboratory reference frame
B0 – ωrf/γ
B1
Beff XZ
Y
Rotating reference frame
Magnetic resonanceOSCAR in detail: rotating reference frame
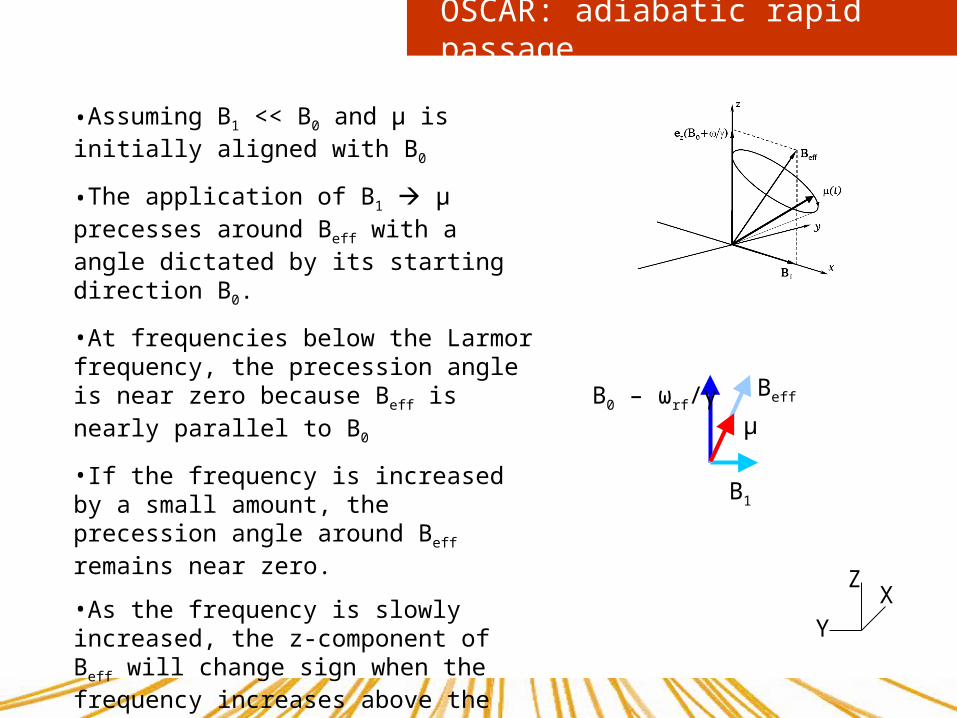
OSCAR: adiabatic rapid passage
•Assuming B1 << B0 and μ is initially aligned with B0
•The application of B1 µ precesses around Beff with a angle dictated by its starting direction B0.
•At frequencies below the Larmor frequency, the precession angle is near zero because Beff is nearly parallel to B0
•If the frequency is increased by a small amount, the precession angle around Beff remains near zero.
•As the frequency is slowly increased, the z-component of Beff will change sign when the frequency increases above the Larmor frequency, with µ following suit. This method of flipping µ is called adiabatic rapid passage.
B0 – ωrf/γ
B1
Beff
XZ
Y
μ
Magnetic resonance
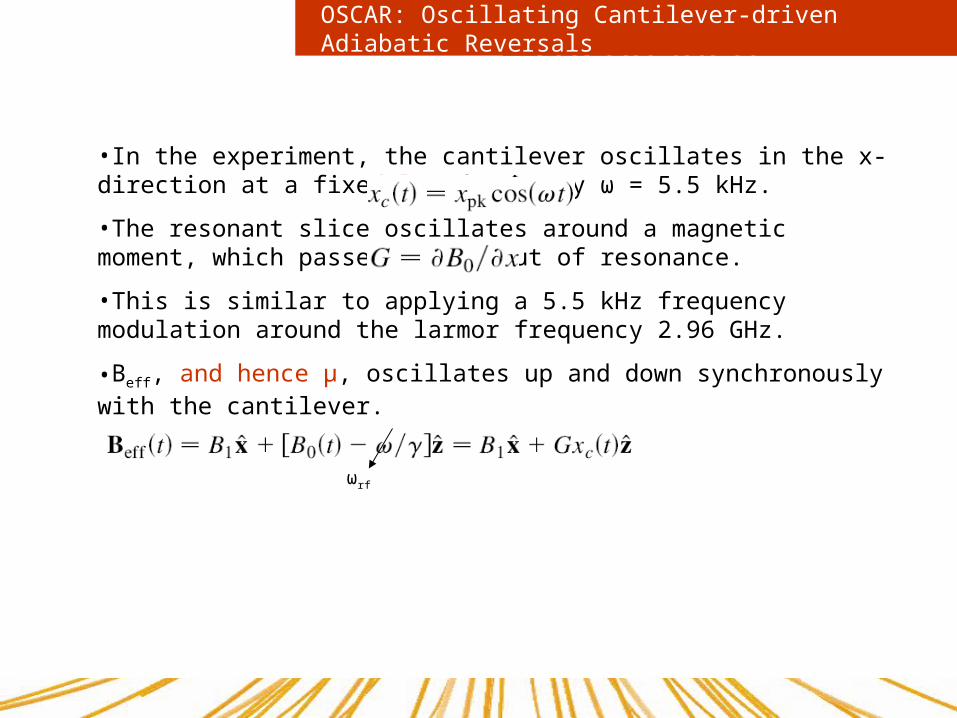
•In the experiment, the cantilever oscillates in the x-direction at a fixed low frequency ω = 5.5 kHz.
•The resonant slice oscillates around a magnetic moment, which passes in and out of resonance.
•This is similar to applying a 5.5 kHz frequency modulation around the larmor frequency 2.96 GHz.
•Beff, and hence µ, oscillates up and down synchronously with the cantilever.
ωrf
OSCAR: Oscillating Cantilever-driven Adiabatic Reversals
iOSCAR Animation
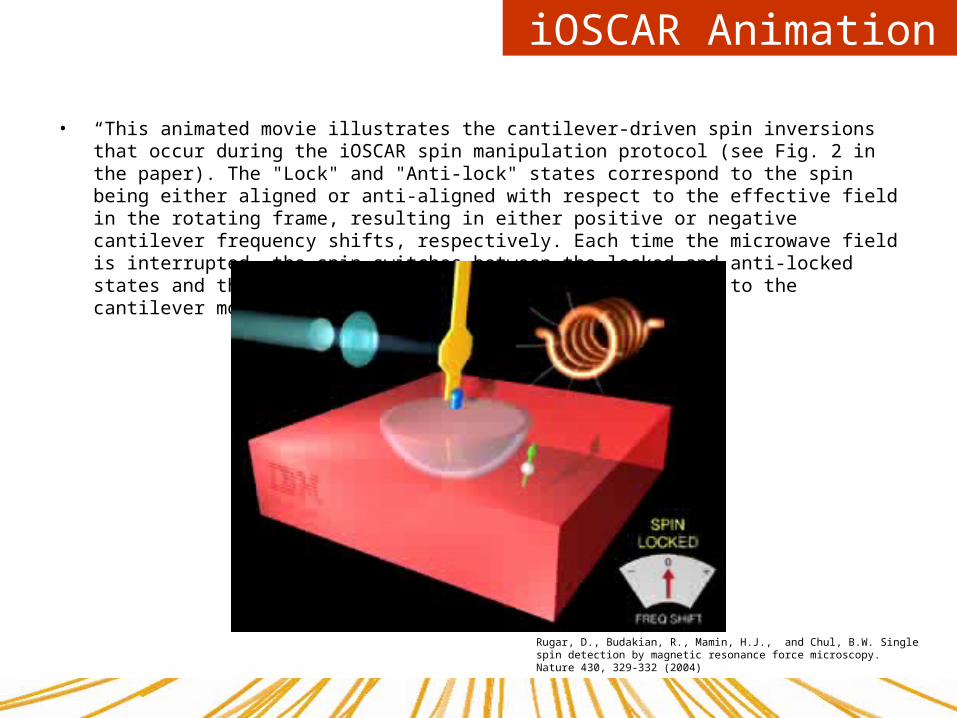
• “This animated movie illustrates the cantilever-driven spin inversions that occur during the iOSCAR spin manipulation protocol (see Fig. 2 in the paper). The "Lock" and "Anti-lock" states correspond to the spin being either aligned or anti-aligned with respect to the effective field in the rotating frame, resulting in either positive or negative cantilever frequency shifts, respectively. Each time the microwave field is interrupted, the spin switches between the locked and anti-locked states and the phase of the spin inversions with respect to the cantilever motion is reversed. “
Rugar, D., Budakian, R., Mamin, H.J., and Chul, B.W. Single spin detection by magnetic resonance force microscopy. Nature 430, 329-332 (2004)
Why OSCAR•A single spin results in a small shift in cantilever resonant frequency δfc ~ 3.7E-3 Hz
•Long integration times are needed to detect this change.
•Integration times are limited by relaxation processes.
•In conventional MRI, the signal comes from the precession of the transverse (xy plane) component of μ.
•Spin-spin relaxation time T2 is difficult to control because it is due to fields of nearby spins, among other causes.
•T2 < T1 in general
•In the OSCAR method, oscillations of the longitudinal component of μ give rise to the signal.
•Spin-lattice relaxation time T1 is mainly caused by thermal perturbations from nearby atoms.
•T1 can be lengthened by operating at cryogenic temps
•According to the experiment, T1 ~ 760 ms coherent through thousands of spin flip cycles (5.5kHz).
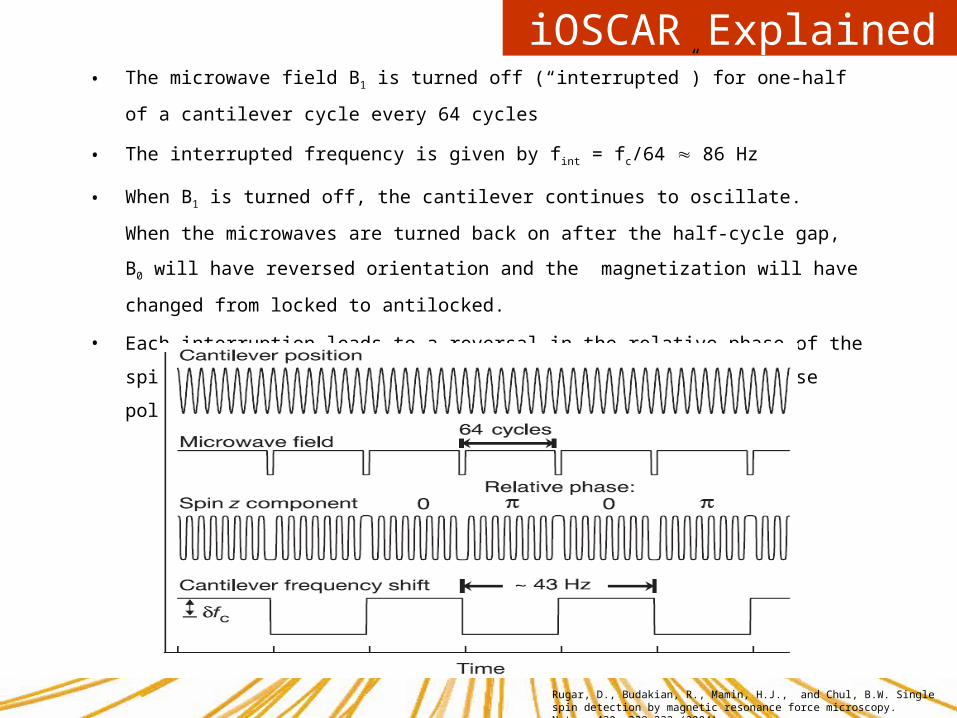
iOSCAR Explained• The microwave field B1 is turned off (“interrupted”) for one-half of a cantilever cycle every
64 cycles
• The interrupted frequency is given by f int = fc/64 86 Hz
• When B1 is turned off, the cantilever continues to oscillate. When the microwaves are
turned back on after the half-cycle gap, B0 will have reversed orientation and the
magnetization will have changed from locked to antilocked.
• Each interruption leads to a reversal in the relative phase of the spin and cantilever,
causing the frequency to shift to reverse polarity.
Rugar, D., Budakian, R., Mamin, H.J., and Chul, B.W. Single spin detection by magnetic resonance force microscopy. Nature 430, 329-332 (2004)

iOSCAR Animation
• “This animated movie illustrates the cantilever-driven spin inversions that occur during the iOSCAR spin manipulation protocol (see Fig. 2 in the paper). The "Lock" and "Anti-lock" states correspond to the spin being either aligned or anti-aligned with respect to the effective field in the rotating frame, resulting in either positive or negative cantilever frequency shifts, respectively. Each time the microwave field is interrupted, the spin switches between the locked and anti-locked states and the phase of the spin inversions with respect to the cantilever motion is reversed. “
Rugar, D., Budakian, R., Mamin, H.J., and Chul, B.W. Single spin detection by magnetic resonance force microscopy. Nature 430, 329-332 (2004)
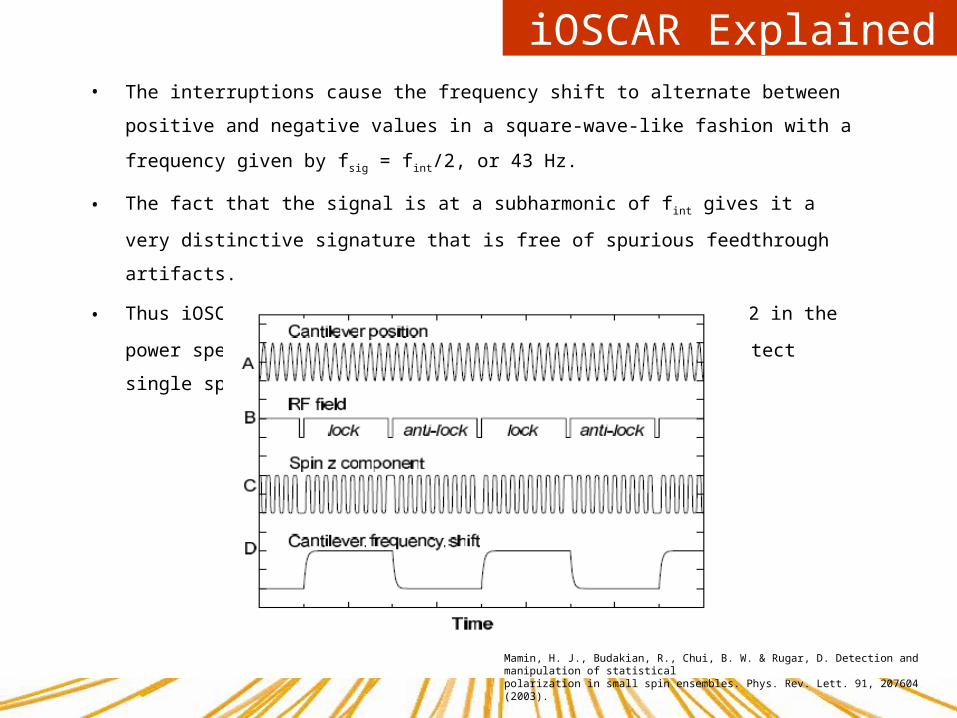
iOSCAR Explained• The interruptions cause the frequency shift to alternate between positive and negative
values in a square-wave-like fashion with a frequency given by fsig = fint/2, or 43 Hz.
• The fact that the signal is at a subharmonic of f int gives it a very distinctive signature that
is free of spurious feedthrough artifacts.
• Thus iOSCAR allows one to simply look for a peak at f int/2 in the power spectrum of the
frequency demodulated signal to detect single spins
Mamin, H. J., Budakian, R., Chui, B. W. & Rugar, D. Detection and manipulation of statisticalpolarization in small spin ensembles. Phys. Rev. Lett. 91, 207604 (2003).
Frequency Shift
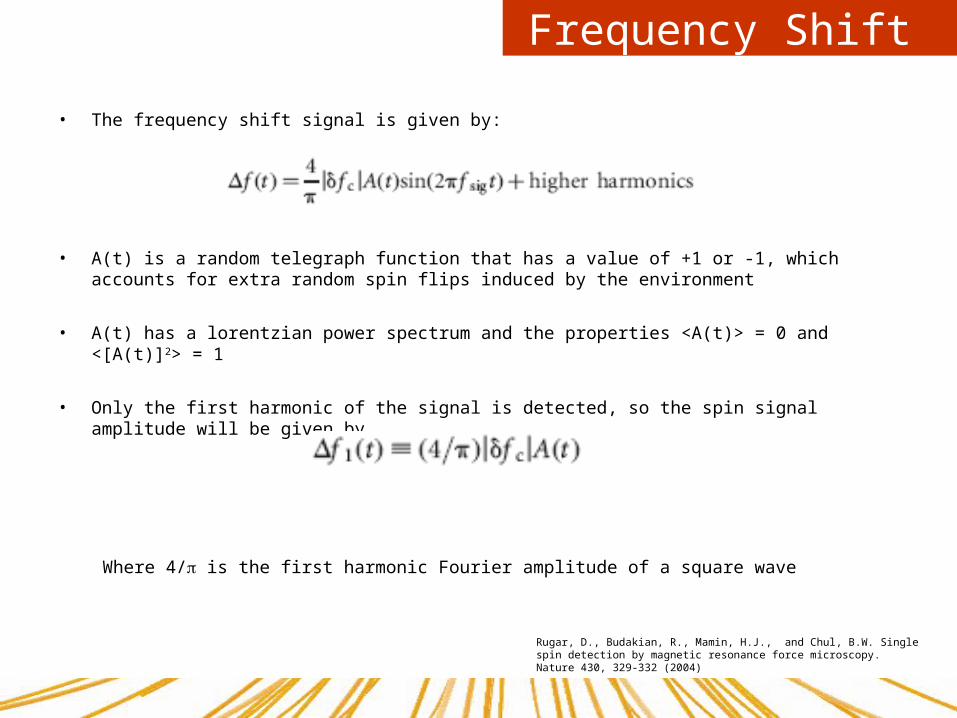
• The frequency shift signal is given by:
• A(t) is a random telegraph function that has a value of +1 or -1, which accounts for extra random spin flips induced by the environment
• A(t) has a lorentzian power spectrum and the properties <A(t)> = 0 and <[A(t)]2> = 1
• Only the first harmonic of the signal is detected, so the spin signal amplitude will be given by
Where 4/ is the first harmonic Fourier amplitude of a square wave
Rugar, D., Budakian, R., Mamin, H.J., and Chul, B.W. Single spin detection by magnetic resonance force microscopy. Nature 430, 329-332 (2004)
Overcoming Noise
• Frequency modulation due to the spin is only a few mHz, which is small in comparison to
frequency noise of the cantilever from thermal motion and tip-sample interactions (25 mHz)
• Signal averaging is needed to detect the spin signal, so we average the square of the signal
‘energy’ (rather than the signal amplitude)
• Frequency modulation of the cantilever is detected using an analogue frequency discriminator
followed by a digital lock-in amplifier that has been implemented in software
• Lock-in amplifier consists of a bank of low-pass filters that determines the energy (variance) of the
in-phase ( I) and quadrature components (Q) of the frequency-shift signal f(t) as a function of
detection bandwidth
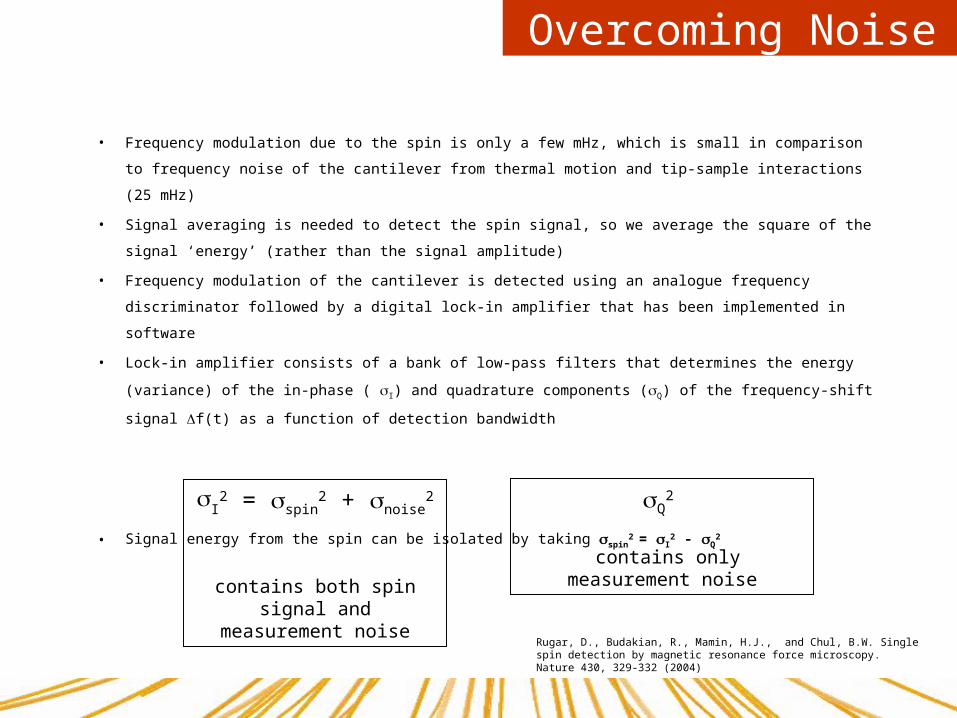
• Signal energy from the spin can be isolated by taking spin2 = I
2 - Q2
Q2
contains only measurement noise
I2 = spin
2 + noise2
contains both spin signal and measurement noise
Rugar, D., Budakian, R., Mamin, H.J., and Chul, B.W. Single spin detection by magnetic resonance force microscopy. Nature 430, 329-332 (2004)
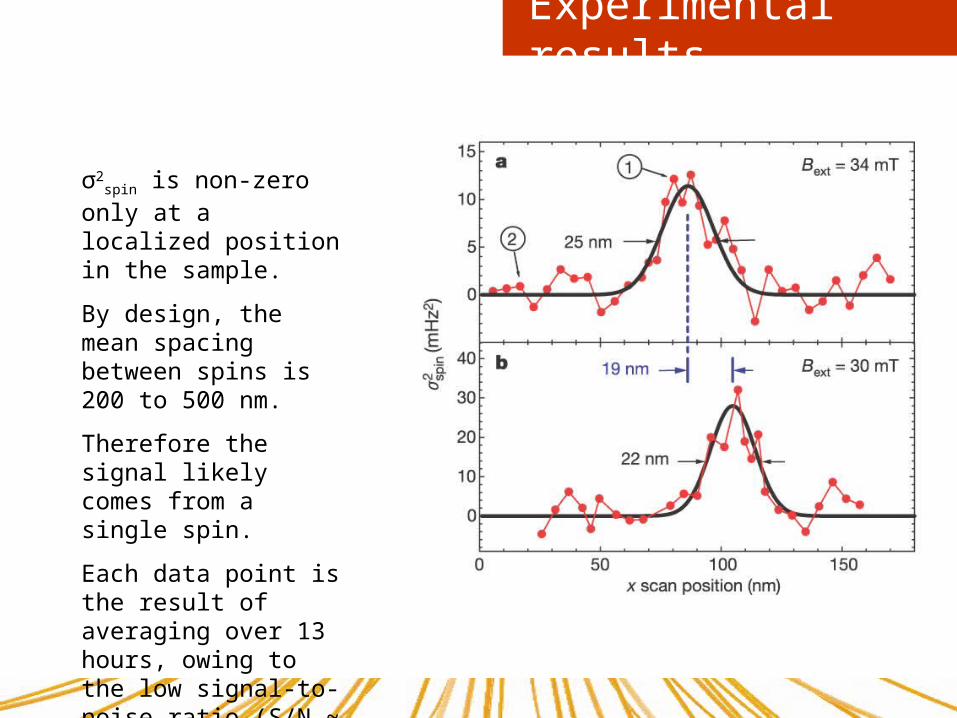
Experimental results
σ2spin is non-zero only at
a localized position in the sample.
By design, the mean spacing between spins is 200 to 500 nm.
Therefore the signal likely comes from a single spin.
Each data point is the result of averaging over 13 hours, owing to the low signal-to-noise ratio (S/N ~ 0.06)
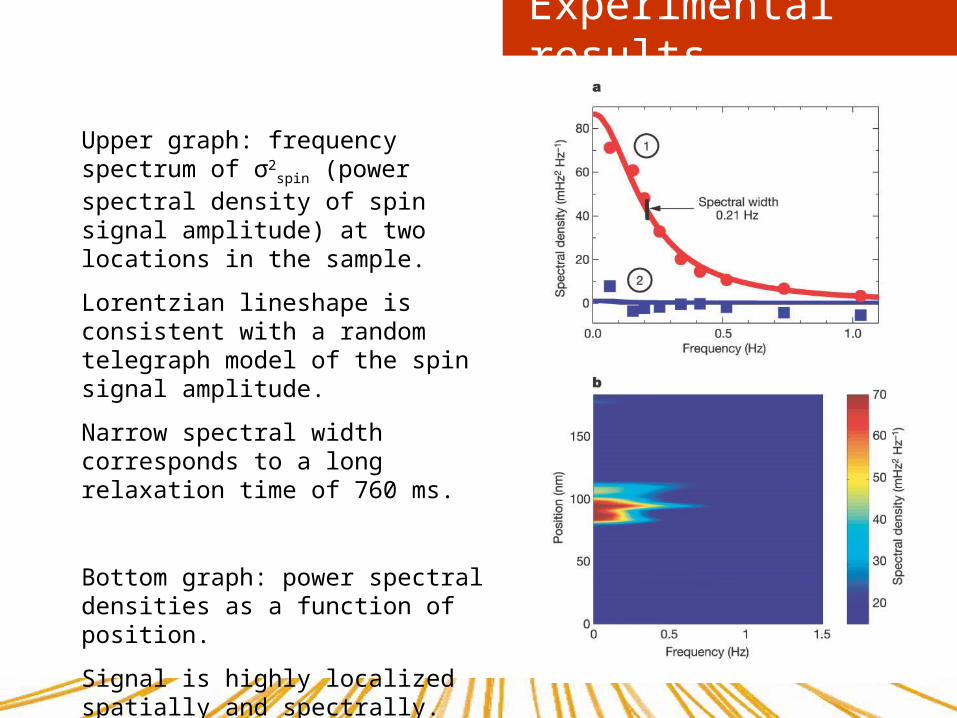
Experimental results
Upper graph: frequency spectrum of σ2
spin (power spectral density of spin signal amplitude) at two locations in the sample.
Lorentzian lineshape is consistent with a random telegraph model of the spin signal amplitude.
Narrow spectral width corresponds to a long relaxation time of 760 ms.
Bottom graph: power spectral densities as a function of position.
Signal is highly localized spatially and spectrally.

Magnetic resonance
But the ability to detect individual spins is about more than imaging — it
implies the power to manipulate individual spins as well. Present-day
information processing relies on the electron's charge, through
manipulating and detecting voltages in electronic circuits. Exploiting the
electron's magnetic moment, or spin, could lead to significant
enhancements in electronic information processing, including
nonvolatile memory, increased integration densities and reduced power
consumption. Furthermore, the spin of the electron is a natural two-
state quantum system ('qubit') for quantum computing; the spin can
also be isolated from its physical environment to achieve the long
decoherence times needed for successful computation.

Quantum Computing
• Classical Computer– Data stored as bits – Either 0 or 1
• Quantum Computer– Data stored as qubits
• Either 0 or 1 • Or both!
– Qubit can exist as both a 0 or 1, with a probability for each state
• Allows computations at unimaginable speeds
Quantum Computing
• Imagine a system of 500 qubits– 2500 possible quantum states– Apply a quantum operation with a particular pulse of
radio waves (ie. controlled-NOT)• Would compute not just one machine state, but all
2500 machine states at once• Equivalent to performing same operation on 10150
separate processors!
Qubit readout device
• How can we use MRFM to build a quantum computer?– Use electron spins as qubits– Apply pulses to the electron spins to perform unitary
operations• Unitary operations act like rotations or reflections• product of two unitary operations is a unitary
operation
Qubit readout device
• Procedure– Initialize qubits (polarize spins)– Apply unitary transformation to selected set
of qubits– Measure qubits to get final result
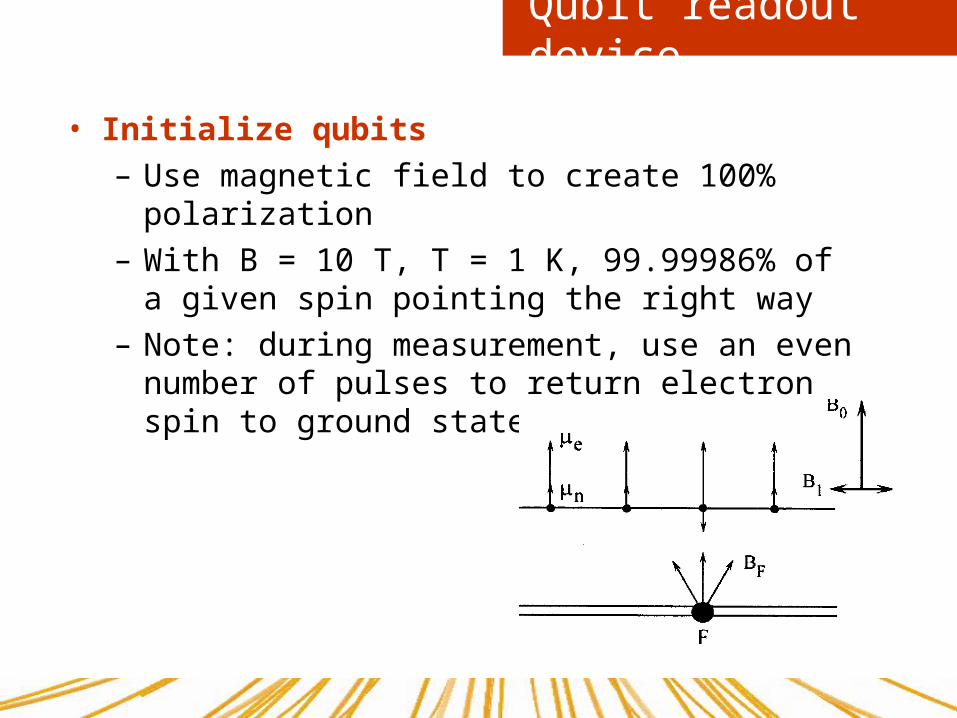
Qubit readout device
• Initialize qubits– Use magnetic field to create 100% polarization– With B = 10 T, T = 1 K, 99.99986% of a given spin
pointing the right way– Note: during measurement, use an even number of
pulses to return electron spin to ground state
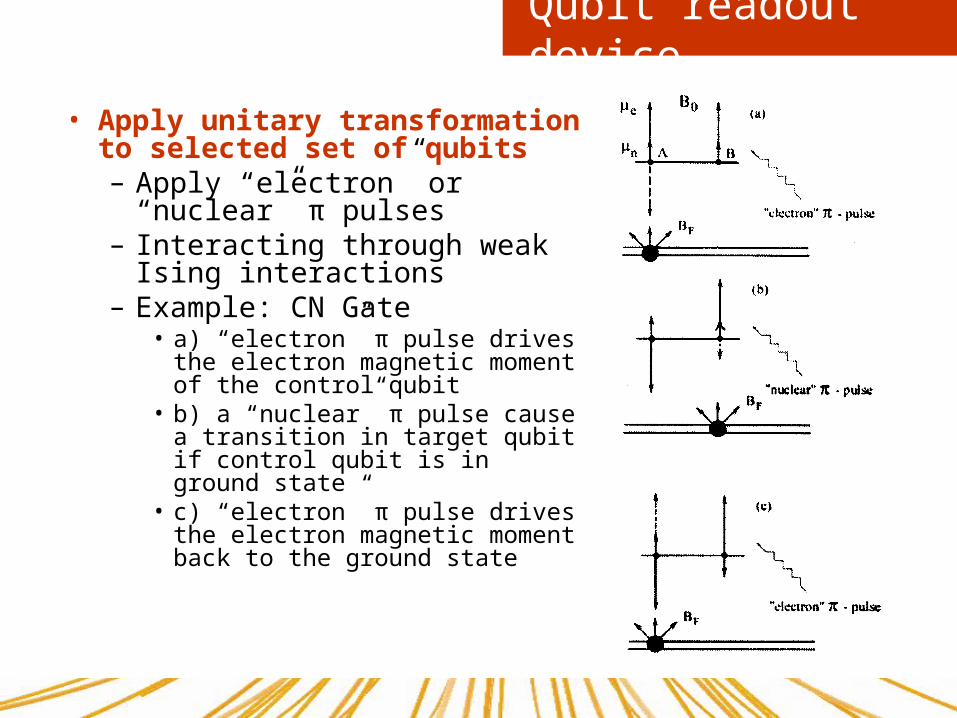
Qubit readout device
• Apply unitary transformation to selected set of qubits– Apply “electron” or “nuclear” π
pulses– Interacting through weak Ising
interactions– Example: CN Gate
• a) “electron” π pulse drives the electron magnetic moment of the control qubit
• b) a “nuclear” π pulse cause a transition in target qubit if control qubit is in ground state
• c) “electron” π pulse drives the electron magnetic moment back to the ground state
Qubit readout device
• Measure qubits to get final result– Use MRFM to measure the result (spins)
Conclusion
• MRFM is capable of detecting individual electron spins
• MRFM can image spins below the surface with nanometre spatial resolution
• Even a small increase in field gradient can dramatically speed up the
acquisition time for 2D and 3D imaging
• Reducing the measurement time below correlation time m can enable real-
time imaging of the spin quantum state!
• The present experiment using iOSCAR presents a sensitivity improvement
of 107 times over the original MRFM experiment, but a further 1000 fold
improvement in magnetic moment sensitivity is still needed for molecular
imaging
• There is still room (“at the bottom”) to increase the field gradient and lower
the operating temperature to make this improvement possible!
http://www.mr-tip.com/serv1.php?type=img&img=Cardiac%20Infarct%20Short%20Axis%20Cine%206