Embed Size (px)
Citation preview

Edward A. White Elementary School Profile
Page 1
Edward A. White Elementary School School Profile
300 First Division Road Fort Benning, GA 31905
706-545-4623 (school)
706-545-5469 (fax)
Dr. Renee Mallory, Principal
GA/AL SCHOOL DISTRICT Dr. Christy Cabezas
Superintendent

Edward A. White Elementary School Profile
Page 2
Table of Contents
Contents: Page:
Mission, Vision, & Purpose ………………………………………………………………. 3 Unique Local Insights
Our School ……………………………………………………………………………… 4
Parent Perceptions/Opinions ………………………………………………….. 5
Teacher Perceptions/Opinions ………………………………………………… 9
Student Perceptions/Opinions ………………………………………………… 10
School Student Data
Standardized Test Data …………………………………………………………… 11
Other Common Measures ………………………………………………………. 57 School Instructional Data
Teacher Instructional Practices ………………………………………………… 59
Student Instructional Practices ………………………………………………… 61
Student Engaged Time …………………………………………………………….. 62
Staff Development …………………………………………………………………… 63
School Organization …………………………………………………………………. 64
Support and Enrichment Programs …………………………………………. 72
Community Data Demographics …………………………………………………………………………. 77
Community Programs ………………………………………………………………. 77
School/Community Change Patterns ………………………………………… 77
Parent and Community Organization s……………………………………….. 77 Appendix A: Goal Statements & Triangulation of Data Appendix B: Environmental Scan

Edward A. White Elementary School Profile
Page 3
DoDEA Mission We educate, engage, and empower each student to succeed in
a dynamic world.
Edward A. White Vision We aspire to provide an environment for student excellence in
academics, behavior, and leadership that result in lifelong learners who contribute to a global society.
Purpose At Edward A. White School we work together to create a strong mind, healthy body, and giving spirit so that we can be the best
we can be.
Edward A. White Elementary School Profile
Page 4
Unique Local Insights
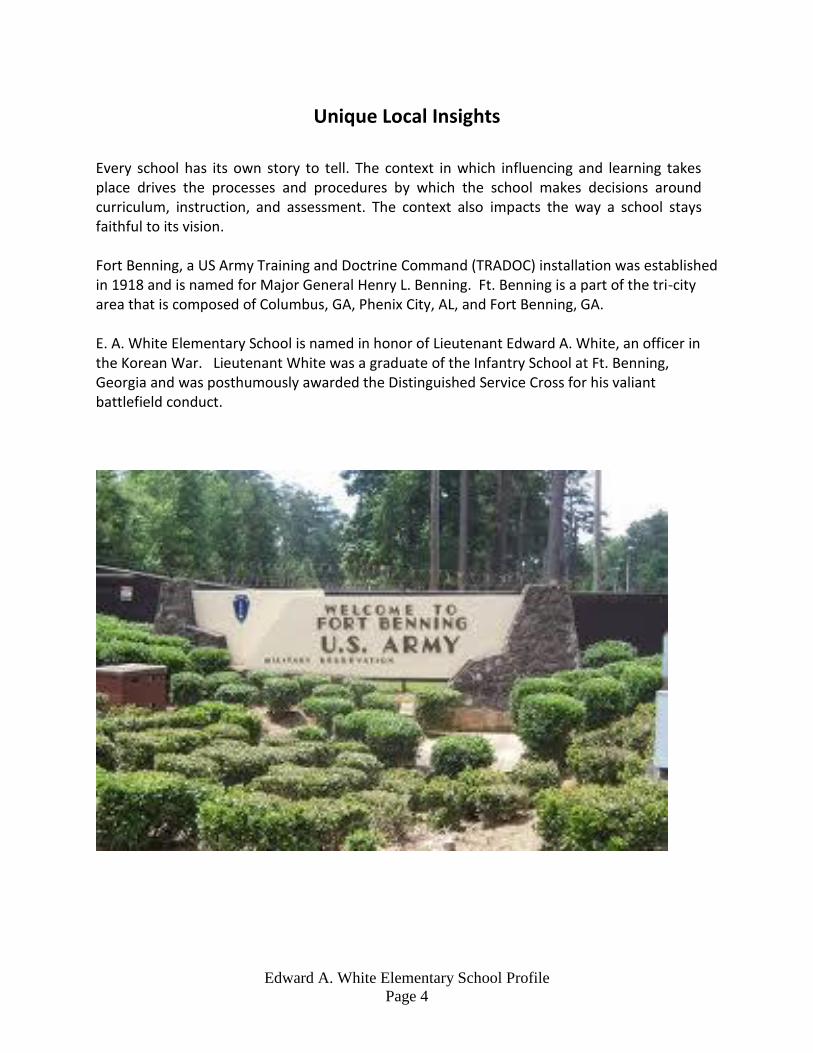
Every school has its own story to tell. The context in which influencing and learning takes place drives the processes and procedures by which the school makes decisions around curriculum, instruction, and assessment. The context also impacts the way a school stays faithful to its vision. Fort Benning, a US Army Training and Doctrine Command (TRADOC) installation was established in 1918 and is named for Major General Henry L. Benning. Ft. Benning is a part of the tri-city area that is composed of Columbus, GA, Phenix City, AL, and Fort Benning, GA. E. A. White Elementary School is named in honor of Lieutenant Edward A. White, an officer in the Korean War. Lieutenant White was a graduate of the Infantry School at Ft. Benning, Georgia and was posthumously awarded the Distinguished Service Cross for his valiant battlefield conduct.

Edward A. White Elementary School Profile
Page 5
N (2008-2009) N (2013-2014) Grade 3 = 34 Grade 3 = 31 Grade 4 = 29 Grade 4 = 24 Grade 5 = 29 Grade 5 = 30 Findings: The Terra Nova Multi Assessment, Third Edition Reading Sub-Skill: Evaluate and Extend Meaning data shows third grade in the upper quartile. Analysis: The Terra Nova Multi Assessment, Third Edition test sub-skill assessment: Evaluate and Extend Meaning.
75
73
81
84
73
75
Grade 3 Grade 4 Grade 5
Edward A. White School Terra Nova Reading Subskill: Evaluate/Extend Meaning
2008-2009 2013-2014

Edward A. White Elementary School Profile
Page 6
N (2008-2009) N (2013-2014) Grade 3 = 34 Grade 3 = 31 Grade 4 = 29 Grade 4 = 24 Grade 5 = 25 Grade 5 = 30 Findings: The Terra Nova Multiple Assessment, Third Edition, Reading Sub-Skill: Analyze Text data shows that grades three and four had an increase across test years 2008-2014; while grade five continues to need academic support. Analysis: These scores are from the Terra Nova Multiple Assessment, Third Edition. Fifth grade scored lower than the third and fourth grades on the sub-skill of analyze text.
78 87
78 80
68 60
0
10
20
30
40
50
60
70
80
90
100
2008-2009 2013-2014
P
e
r
c
e
n
t
i
l
e
Years
Edward A. White School Terra Nova Subskill: Analyze Text 2008-2014
Grade 3
Grade 4
Grade 5
Edward A. White Elementary School Profile
Page 7
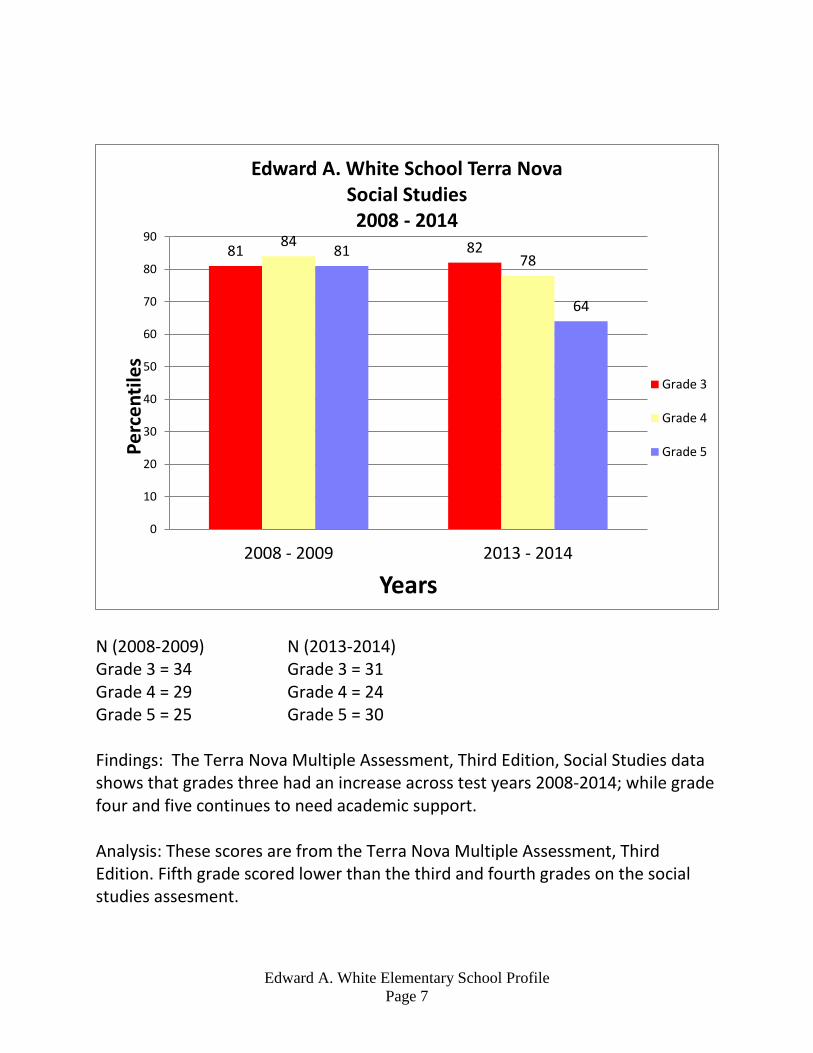
N (2008-2009) N (2013-2014) Grade 3 = 34 Grade 3 = 31 Grade 4 = 29 Grade 4 = 24 Grade 5 = 25 Grade 5 = 30 Findings: The Terra Nova Multiple Assessment, Third Edition, Social Studies data shows that grades three had an increase across test years 2008-2014; while grade four and five continues to need academic support. Analysis: These scores are from the Terra Nova Multiple Assessment, Third Edition. Fifth grade scored lower than the third and fourth grades on the social studies assesment.
81 82 84 78
81
64
0
10
20
30
40
50
60
70
80
90
2008 - 2009 2013 - 2014
Pe
rce
nti
les
Years
Edward A. White School Terra Nova Social Studies 2008 - 2014
Grade 3
Grade 4
Grade 5

Edward A. White Elementary School Profile
Page 8
75
88
75
85 87
73
0
10
20
30
40
50
60
70
80
90
100
2008 - 2009 2013 - 2014
Pe
rce
nti
les
Years
Edward A. White School Terra Nova Science
2008 - 2014
Grade 3
Grade 4
Grade 5
N (2008-2009) N (2013-2014) Grade 3 = 34 Grade 3 = 31 Grade 4 = 29 Grade 4 = 24 Grade 5 = 25 Grade 5 = 30 Findings: The Terra Nova Multiple Assessment, Third Edition, Science data shows that grades three and four had increase across test years 2008-2014; while grade ive continues to need academic support. Analysis: These scores are from the Terra Nova Multiple Assessment, Third Edition. Fourth and fifth grade scored lower than the third grade on the science assesment

Edward A. White Elementary School Profile
Page 9
N = 39 Findings: Fall Baseline 2012: Does Not Meet 46% Approaches 23% Meets 15% Exceeds 15% Analysis: Baseline BAS for 2012 reflects 30% of Kindergarten students measured at the meets or exceeds level on the reading comprehension as measured by BAS.

Edward A. White Elementary School Profile
Page 10
N = 42 Findings: End of the Year 2013: Does Not Meet 5% Approaches 7% Meets 33% Exceeds 55% Analysis: End of the Year for 2013 reflects 88% of Kindergarten students measured at the meets or exceeds level on the reading comprehension as measured by BAS.
Edward A. White Elementary School Profile
Page 11
2% 2%
22%
73%
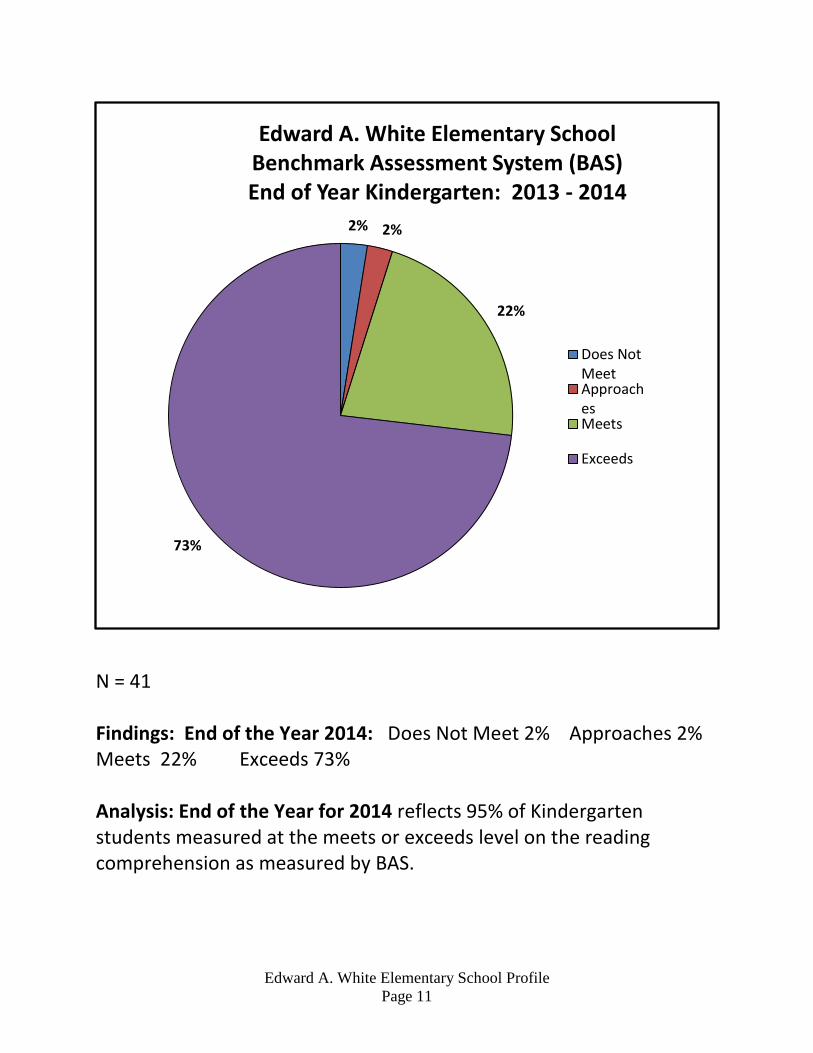
Edward A. White Elementary School Benchmark Assessment System (BAS) End of Year Kindergarten: 2013 - 2014
Does NotMeetApproachesMeets
Exceeds
N = 41 Findings: End of the Year 2014: Does Not Meet 2% Approaches 2% Meets 22% Exceeds 73% Analysis: End of the Year for 2014 reflects 95% of Kindergarten students measured at the meets or exceeds level on the reading comprehension as measured by BAS.

Edward A. White Elementary School Profile
Page 12
N = 45
40%
22%
16%
22%
Edward A. White Elementary School Benchmark Assessment System
Baseline Kindergarten: 2014 - 2015
Does Not Meet
Approaches
Meets
Exceeds

Edward A. White Elementary School Profile
Page 13
N = 52 Findings: Fall Baseline 2012: Does Not Meet 39% Approaches 0% Meets 3% Exceeds 58% Analysis: Baseline BAS for 2012 reflects 61% of first grade students measured Meets or Exceeds levels on the reading comprehension level as measured by BAS.

Edward A. White Elementary School Profile
Page 14
N = 52 Findings: End of the Year 2013: Does Not Meet 15% Approaches 4% Meets 0% Exceeds 81% Analysis: End of the Year BAS for 2013 reflects 81% of first grade students measured Meets or Exceeds levels on the reading comprehension level as measured by BAS.

Edward A. White Elementary School Profile
Page 15
N = 40 Findings: Fall Baseline 2013: Does Not Meet 70% Approaches 7% Meets 8% Exceeds 15% Analysis: Baseline BAS for 2013 reflects 23% of first grade students measured Meets or Exceeds levels on the reading comprehension level as measured by BAS.

Edward A. White Elementary School Profile
Page 16
N = 40 Findings: End of the Year BAS 2014: Does Not Meet 10% Approaches 0% Meets 20% Exceeds 70% Analysis: End of the Year BAS for 2014 reflects 90% of first grade students measured Meets or Exceeds levels on the reading comprehension level as measured by BAS.
10%
0%
20%
70%
Edward A. White Elementary School Benchmark Assessment System(BAS)
End of the Year First Grade: 2013 - 2014
Does Not Meet
Approaches
Meets
Exceeds

Edward A. White Elementary School Profile
Page 17
N = 37
73%
8%
5%
14%
Edward A. White Elementary School Benchmark Assessment System(BAS)
Baseline First Grade: 2014 - 2015
Does Not Meet
Approaches
Meets
Exceeds

Edward A. White Elementary School Profile
Page 18
N = 42 Findings: Fall Baseline 2012: Does Not Meet 33% Approaches 5% Meets 7% Exceeds 55% Analysis: Baseline BAS for 2012 reflects 62% of second grade students measured on the Meets or Exceeds levels on the reading comprehension level as measured by BAS.

Edward A. White Elementary School Profile
Page 19
N = 47 Findings: End of Year 2012: Does Not Meet 11% Approaches 9% Meets 26% Exceeds 55% Analysis: End of Year BAS for 2013 reflects 81% of second grade students measured on the Meets or Exceeds levels on the reading comprehension level as measured by BAS.

Edward A. White Elementary School Profile
Page 20
N = 43 Findings: Fall Baseline 2013: Does Not Meet 49% Approaches 7% Meets 9% Exceeds 35% Analysis: Baseline BAS for 2013 reflects 44% of second grade students measured on the Meets or Exceeds levels on the reading comprehension level as measured by BAS.

Edward A. White Elementary School Profile
Page 21
N = 44 Findings: End of the Year BAS 2014: Does Not Meet 11% Approaches 0% Meets 14% Exceeds 75% Analysis: End of the Year BAS for 2014 reflects 89% of second grade students measured on the Meets or Exceeds levels on the reading comprehension level as measured by BAS.
11%
0%
14%
75%
Edward A. White Elementary School Benchmark Assessment System (BAS)
End of Year Second Grade: 2013 - 2014
Does Not Meet
Approaches
Meets
Exceeds
Edward A. White Elementary School Profile
Page 22
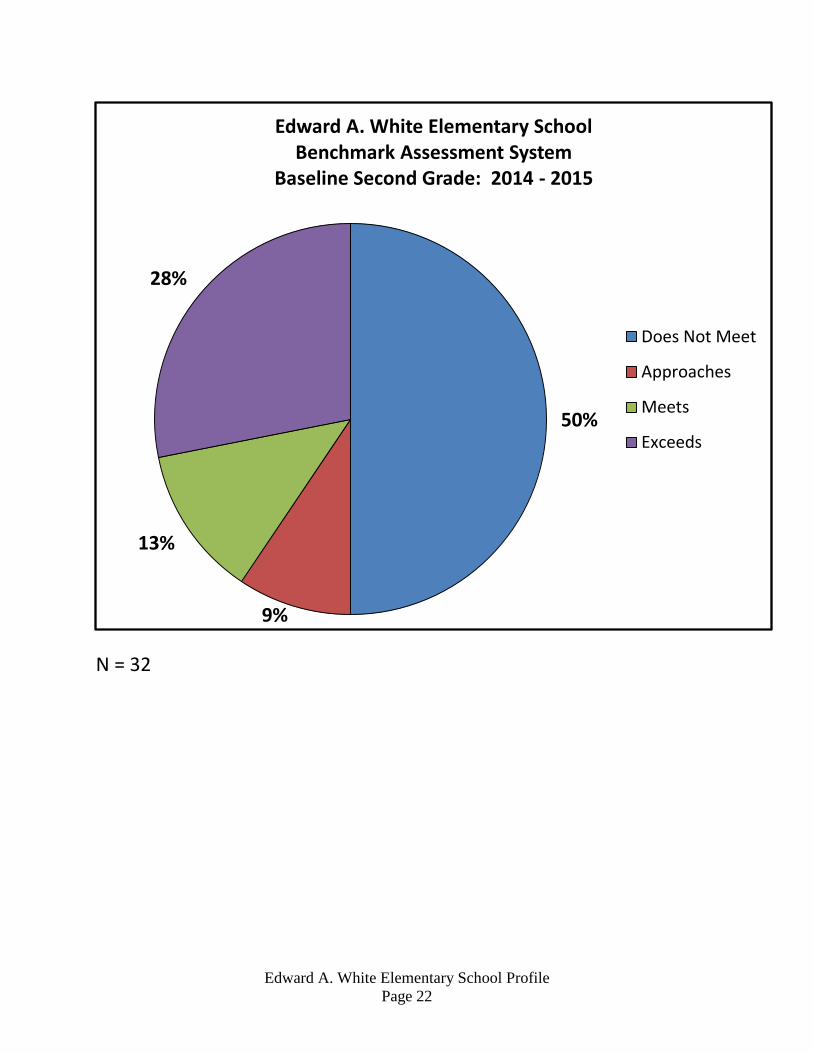
N = 32
50%
9%
13%
28%
Edward A. White Elementary School Benchmark Assessment System
Baseline Second Grade: 2014 - 2015
Does Not Meet
Approaches
Meets
Exceeds

Edward A. White Elementary School Profile
Page 23
N = 26 Findings: Fall Baseline 2012: Does Not Meet 36% Approaches 0% Meets 0% Exceeds 64% Analysis: Baseline BAS for 2012 reflects 64% of third grade students measured on the Exceeds level on the reading comprehension level as measured by BAS.

Edward A. White Elementary School Profile
Page 24
N = 26 Findings: End of Year 2012: Does Not Meet 31% Approaches 0% Meets 8% Exceeds 62% Analysis: End of Year BAS for 2013 reflects 70% of third grade students measured on the Meets or Exceeds levels on the reading comprehension level as measured by BAS.

Edward A. White Elementary School Profile
Page 25
N = 35 Findings: Fall Baseline 2013: Does Not Meet 37% Approaches 26% Meets 14% Exceeds 23% Analysis: Baseline BAS for 2013 reflects 37% of third grade students measured Meets or Exceeds levels on the reading comprehension level as measured by BAS.

Edward A. White Elementary School Profile
Page 26
7%
7%
3%
83%
Edward A. White Elementary School Benchmark Assessment System (BAS) End of Year Third Grade: 2013 - 2014
Does Not Meet
Approaches
Meets
Exceeds
N = 30 Findings: End of the Year 2014: Does Not Meet 7% Approaches 7% Meets 3% Exceeds 83% Analysis: End of the Year BAS for 2014 reflects 86% of third grade students measured Meets or Exceeds levels on the reading comprehension level as measured by BAS.

Edward A. White Elementary School Profile
Page 27
N = 30
70%
8%
0%
23%
Edward A. White Elementary School Benchmark Assessment System (BAS)
Baseline Third Grade: 2014 - 2015
Does Not Meet
Approaches
Meets
Exceeds

Edward A. White Elementary School Profile
Page 28
N = 3rd 29
4th 33
5th 28 Findings: The SRI (Scholastic Reading Inventory) test is administered quarterly and indicates that from 39% to 50 % of Edward A. White students in grades 3-5 are in the Proficient reading levels and 21% to 32% are Advanced. Analysis: The SRI test shows that the students in grade three through five have the highest numbers of students in the Proficient reading level at an average of 45.

Edward A. White Elementary School Profile
Page 29
N =
3rd 27 4th 35
5th 33
Findings: The SRI (Scholastic Reading Inventory) test is administered quarterly and indicates that from 37% to 44 % of Edward A. White students in grades 3-5 are in the Proficient reading levels and 19% to 37% are Advanced. Analysis: The SRI test shows that the students in grade three through five have the highest numbers of students in the Proficient reading level at an average of 41%

Edward A. White Elementary School Profile
Page 30
N =
3rd 43 4th 33
5th 33
Findings: The SRI (Scholastic Reading Inventory) test is administered quarterly and indicates that from 42% to 64 % of Edward A. White students in grades 3-5 are in the Proficient reading levels and 21% to 39% are Advanced. Analysis: The SRI test shows that the students in grade three through five have the highest numbers of students in the Proficient reading level at an average of 51%.

Edward A. White Elementary School Profile
Page 31
N = 2nd 46
3rd 42 4th 40
5th 33
Findings: The SRI (Scholastic Reading Inventory) test is administered quarterly and indicates that from 28% to 62 % of Edward A. White students in grades 2-5 are in the Proficient reading levels and 27% to 50% are Advanced. Analysis: The SRI test shows that the students in grade two through five have the highest numbers of students in the Proficient and Advanced reading levels at an average of 41%.

Edward A. White Elementary School Profile
Page 32
N = 2nd 46
3rd 26 4th 35
5th 29
Findings: The SRI (Scholastic Reading Inventory) test is administered quarterly and when compared to the baseline data indicates the largest percentage of students in grades 3-5 scored in the Proficient or Advanced levels. The range for the Advanced and Proficient levels indicated an increase of 12% from the baseline when averaged. The Basic level range indicated a decrease of 7% average. The Below Basic level indicated decrease of 4% average. Analysis: The SRI test shows that the students in grades 2-5 show progression from levels Below Basic and Basic to Proficient and Advanced grade level.

Edward A. White Elementary School Profile
Page 33
N = 3rd 34
4th 31 5th 35
Findings: The SRI (Scholastic Reading Inventory) test is administered quarterly and indicates that from 40% to 53 % of Edward A. White students in grades 3-5 are in the Proficient reading levels and 15% to 26% are Advanced. Analysis: The SRI test shows that the students in grade three through five have the highest numbers of students in the Proficient reading level at an average of 46%.

Edward A. White Elementary School Profile
Page 34
N = 3rd 28
4th 28
5th 34 Findings: The SRI (Scholastic Reading Inventory) test is administered quarterly and indicates that from 39% to 54 % of Edward A. White students in grades 3-5 are in the Proficient reading levels and 25% to 29% are Advanced. Analysis: The SRI test shows that the students in grade three through five have the highest numbers of students in the Proficient reading level at an average of 47%.

Edward A. White Elementary School Profile
Page 35
N =
3rd 34
4th 29 5th 35
Findings: The SRI (Scholastic Reading Inventory) test is administered quarterly and indicates that from 35% to 49 % of Edward A. White students in grades 3-5 are in the Proficient reading levels and 24% to 44% are Advanced. Analysis: The SRI test shows that the students in grade three through five have the highest numbers of students in the Proficient reading level at an average of 43% and 34% advanced.
6%
15%
35%
44%
17%
14%
45%
24%
0%
17%
49%
34%
-10% 10% 30% 50% 70% 90%
Below Basic
Basic
Proficient
Advanced
Percentile
L
e
v
e
l
s
Edward A. White School SRI Performance Quarter 2
2013 - 2014
5th
4th
3rd

Edward A. White Elementary School Profile
Page 36
N =
Findings: The SRI (Scholastic Reading Inventory) test is administered quarterly and indicates that from 33% to 52 % of Edward A. White students in grades 2-5 are in the Proficient reading levels and 21% to 44% are Advanced. Analysis: The SRI test shows that the students in grade two through five have the highest numbers of students in the Proficient reading level at an average of 42% and 37% advanced.
7%
18%
33%
42%
6%
12%
38%
44%
6%
21%
52%
21%
3%
6%
52%
39%
-10% 10% 30% 50% 70% 90%
Below Basic
Basic
Proficient
Advanced
Percentiles
L
e
v
e
l
s
Edward A. White School SRI Performance Quarter 3
2013 - 2014
5th
4th
3rd
2nd
2nd 45
3rd 34 4th 29
5th 31

Edward A. White Elementary School Profile
Page 37
N =
Findings: The SRI (Scholastic Reading Inventory) test is administered quarterly and indicates that from 26% to 54 % of Edward A. White students in grades 2-5 are in the Proficient reading levels and 28% to 53% are Advanced. Analysis: The SRI test shows that the students in grade two through five have the highest numbers of students in the Proficient reading level at an average of 44% and 44% advanced. 88% of our students are proficient or higher.
5%
16%
26%
53%
3%
3%
44%
50%
4%
18%
50%
28%
0%
3%
54%
43%
-10% 10% 30% 50% 70% 90%
Below Basic
Basic
Proficient
Advanced
Percentile
L
e
v
e
l
s
Edward A. White School SRI Performance - End of the Year
2013 - 2014
5th
4th
3rd
2nd
2nd 43
3rd 32 4th 28
5th 30

Edward A. White Elementary School Profile
Page 38
N=
3rd 40
4th 31
5th 32
25%
20%
35%
20%
13%
23%
55%
10%
22%
16%
38%
25%
-10% 10% 30% 50% 70% 90%
Below Basic
Basic
Proficient
Advanced
Percentile
L
e
v
e
l
s
Edward A. White School SRI Performance Baseline
2014 - 2015
5th
4th
3rd
Edward A. White Elementary School Profile
Page 39
18%
18%
48%
18%
9%
12%
56%
24%
15%
21%
32%
32%
-10% 10% 30% 50% 70% 90%
Below Basic
Basic
Proficient
Advanced
Percentile
L
e
v
e
l
s
Edward A. White School SRI Performance Quarter 1
2014 - 2015
5th
4th
3rd
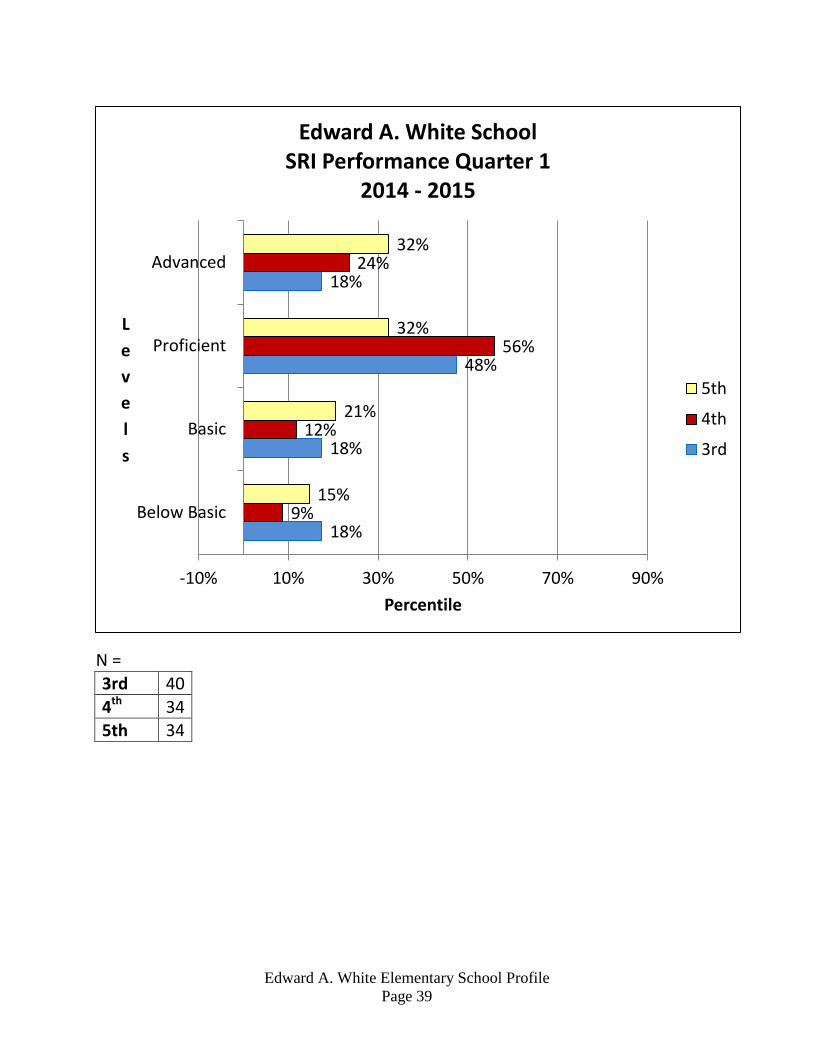
N =
3rd 40
4th 34 5th 34

Edward A. White Elementary School Profile
Page 40
N =
14%
19%
50%
17%
14%
11%
46%
29%
11%
23%
32%
34%
-10% 10% 30% 50% 70% 90%
Below Basic
Basic
Proficient
Advanced
Percentile
L
e
v
e
l
s
Edward A. White School SRI Performance 2nd Quarter
2014 - 2015
5th
4th
3rd
3rd 42
4th 35 5th 38

Edward A. White Elementary School Profile
Page 41
13%
20%
43%
25%
9%
9%
47%
35%
6%
17%
31%
46%
0% 10% 20% 30% 40% 50% 60% 70% 80% 90%
Below Basic
Basic
Proficient
Advanced
Percentiles
L
e
v
e
l
s
Edward A. White School SRI Performance Quarter 3
2014 - 2015
5th
4th
3rd
N=
3rd 40 4th 34
5th 35

Edward A. White Elementary School Profile
Page 42
Edward A. White School SPI Performance Baseline
2014 – 2015
Pre-Decoder 59%
Beginning Decoder
19%
Developing Decoder or Advanced
22%
Kindergarten SPI Baseline
Not Scored 20%
Pre-Decoder 58%
Beginning Decoder
22%
Developing Decoder or Advanced
0%
1st Grade SPI Baseline

Edward A. White Elementary School Profile
Page 43
N =
Not Scored 21%
Pre-Decoder 21% Beginning
Decoder 41%
Developing Decoder or Advanced
17%
2nd Grade SPI Baseline
Not Scored 15%
Pre-Decoder 35%
Beginning Decoder
46%
Developing Decoder or Advanced
4%
Kindergarten SPI Midyear
K 41
1st 36 2nd 29

Edward A. White Elementary School Profile
Page 44
N =
Not Scored 17%
Pre-Decoder 63%
Beginning Decoder
20%
Developing Decoder or Advanced
0%
1st Grade SPI Midyear
Not Scored 21%
Pre-Decoder 21%
Beginning Decoder
41%
Developing Decoder or Advanced
17%
2nd Grade SPI Midyearof Year
K 47 1st 40
2nd 29

Edward A. White Elementary School Profile
Page 45
Edward A. White School Reading Comprehension Baseline
2014 – 2015
N =
Below Basic 38%
Basic 21%
Proficient 23%
Advanced 18%
4th Grade Reading Comprehension
Below Basic 62%
Basic 18%
Proficient 20%
Advanced 0%
5th Grade Reading Comprehension
4th 34
5th 34

Edward A. White Elementary School Profile
Page 46
Below Basic 32%
Basic 15% Proficient
8%
Advanced 45%
1st Grade Fluency Baseline
Edward A. White School Fluency Performance Baseline
2014 – 2015
Below Basic 29%
Basic 56%
Proficient 5%
Advanced 10%
Kindergarten Fluency Baseline

Edward A. White Elementary School Profile
Page 47
N=
Below Basic 65%
Basic 6%
Proficient 6%
Advanced 23%
K 41
1st 40 2nd 31
Edward A. White Elementary School Profile
Page 48
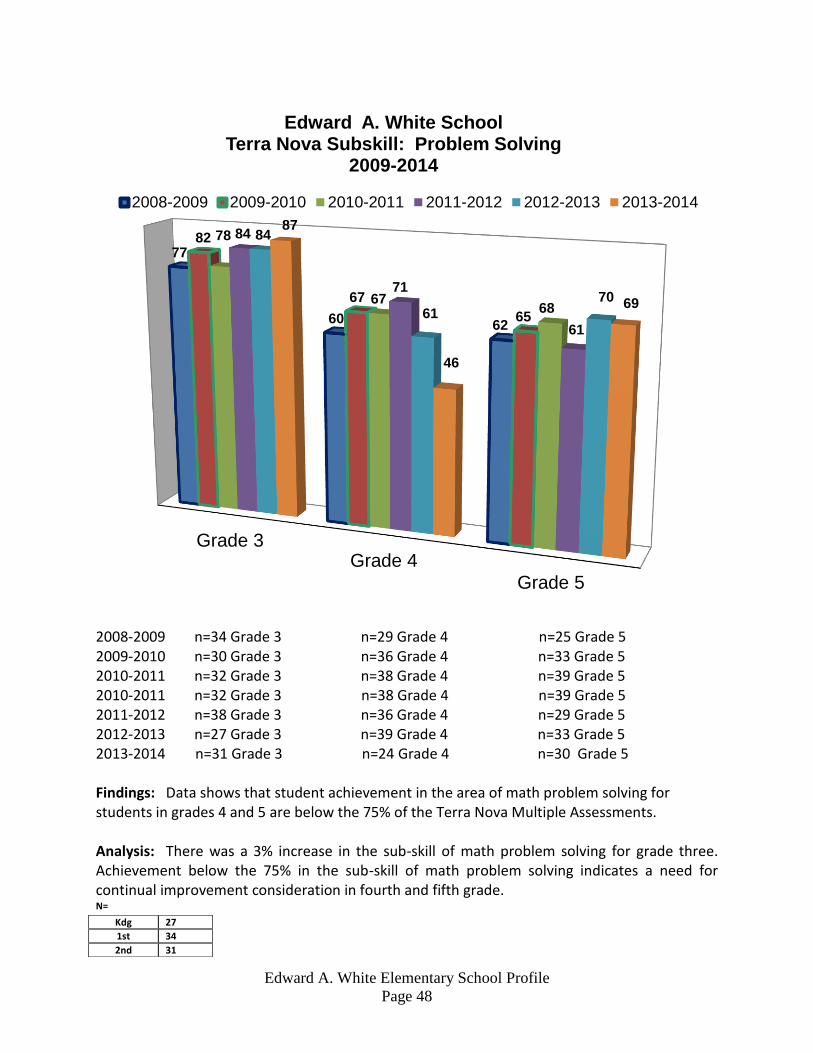
2008-2009 n=34 Grade 3 n=29 Grade 4 n=25 Grade 5 2009-2010 n=30 Grade 3 n=36 Grade 4 n=33 Grade 5 2010-2011 n=32 Grade 3 n=38 Grade 4 n=39 Grade 5 2010-2011 n=32 Grade 3 n=38 Grade 4 n=39 Grade 5 2011-2012 n=38 Grade 3 n=36 Grade 4 n=29 Grade 5 2012-2013 n=27 Grade 3 n=39 Grade 4 n=33 Grade 5 2013-2014 n=31 Grade 3 n=24 Grade 4 n=30 Grade 5 Findings: Data shows that student achievement in the area of math problem solving for students in grades 4 and 5 are below the 75% of the Terra Nova Multiple Assessments. Analysis: There was a 3% increase in the sub-skill of math problem solving for grade three. Achievement below the 75% in the sub-skill of math problem solving indicates a need for continual improvement consideration in fourth and fifth grade. N=
Grade 3Grade 4
Grade 5
77
60 62
82
67
65
78
67 68
84
71
61
84
61
70
87
46
69
Edward A. White School Terra Nova Subskill: Problem Solving
2009-2014
2008-2009 2009-2010 2010-2011 2011-2012 2012-2013 2013-2014
Kdg 27
1st 34
2nd 31

Edward A. White Elementary School Profile
Page 49
N=
Kdg 36
1st 36
2nd 43
3rd 29
4th 37
5th 30
Findings: Novice 23-81%, Apprentice 14-47%, Practitioner 0-28%, Expert 0-5% Analysis: The Math Problem Solving Baseline Data indicated a need for growth in math multi-step problem solving at all grade levels.

Edward A. White Elementary School Profile
Page 50
N=
Kdg 47
1st 35
2nd 41
3rd 15
4th 22
5th 23
Findings: Novice 2-55%, Apprentice 17-62%, Practitioner 0-70%, Expert 0-40% Analysis: The Math Problem Solving Mid-Year Data indicated there is growth from Novice to Apprentice in all grade levels, Apprentice to Practitioner in all grade levels, and Practitioner to Expert in all grade levels in the math multi-step problem solving activity.
0% 20% 40% 60% 80% 100%
K
1st
2nd
3rd
4th
5th
38%
6%
2%
20%
55%
9%
62%
31%
37%
53%
0%
17%
0%
23%
54%
20%
41%
70%
0%
40%
7%
7%
5%
4%
Percentile
G
r
a
d
e
L
e
v
e
l
s
E. A. White School Math Problem Solving Mid-Year 2012 - 2013
Novice
Apprentice
Practitioner
Expert

Edward A. White Elementary School Profile
Page 51
N=
Kdg 47
1st 35
2nd 41
3rd 15
4th 22
5th 23
Findings: Novice 0-20%, Apprentice 16-33%, Practitioner 27- 77%, Expert 11-30% Analysis: The Math Problem Solving End of the Year Data indicated there is growth from Novice to Apprentice in all grade levels, Apprentice to Practitioner in all grade levels, and Practitioner to Expert in all grade levels in the math multi-step problem solving activity. The Data indicates that 73% of the students are Practitioner or higher in math problem solving.

Edward A. White Elementary School Profile
Page 52
N=
Kdg 45
1st 44
2nd 43
3rd 39
4th 32
5th 35
Findings: Novice 7 - 93%, Apprentice 7 - 66%, Practitioner 0-58%, Expert 0-6% Analysis: The Math Problem Solving Baseline Data indicated a need for growth in math multi-step problem solving at all grade levels.

Edward A. White Elementary School Profile
Page 53
N=
Kdg 44
1st 44
2nd 41
3rd 34
4th 31
5th 34
Findings: Novice 0 - 41%, Apprentice 18 - 94%, Practitioner 11 – 44 %, Expert 0 - 32% Analysis: The Math Problem Solving Midyear Data indicates growth in math multi-step problem solving.
0% 20% 40% 60% 80% 100%
Kinder
1st
2nd
3rd
4th
5th
41%
7%
0%
3%
3%
18%
48%
36%
41%
18%
94%
38%
11%
27%
44%
39%
3%
32%
0%
30%
15%
32%
0%
12%
Percentile
G
r
a
d
e
L
e
v
e
l
s
E. A. White School Math Problem Solving Midyear 2013 - 2014
Novice
Apprentice
Practitioner
Expert

Edward A. White Elementary School Profile
Page 54
N=
Kdg 40
1st 40
2nd 43
3rd 30
4th 27
5th 29
Findings: Novice 0% - 7%, Apprentice 7% - 55%, Practitioner 3% - 63 %, Expert 18% - 83% Analysis: The Math Problem Solving End of the Year Data indicates growth in math multi-step problem solving with an average of 87% at the Practitioner or Expert Levels.
0% 20% 40% 60% 80% 100%
K
1st
2nd
3rd
4th
5th
2%
2%
0%
7%
4%
7%
20%
55%
7%
7%
25%
27%
48%
25%
63%
3%
52%
45%
30%
18%
30%
83%
19%
21%
Percentile
G
r
a
d
e
L
e
v
e
l
s
E. A. White School Math Problem Solving
End of Year 2013 - 2014
Novice
Apprentice
Practitioner
Expert
Edward A. White Elementary School Profile
Page 55
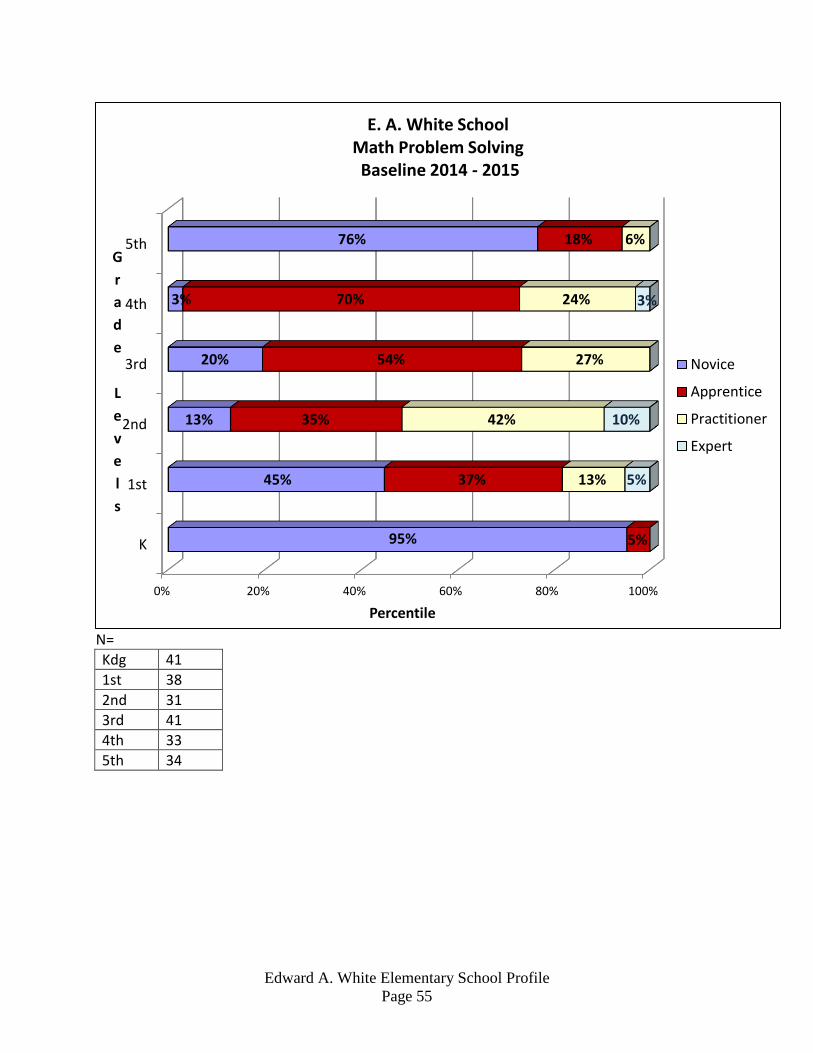
N=
Kdg 41
1st 38
2nd 31
3rd 41
4th 33
5th 34
0% 20% 40% 60% 80% 100%
K
1st
2nd
3rd
4th
5th
95%
45%
13%
20%
3%
76%
5%
37%
35%
54%
70%
18%
13%
42%
27%
24%
6%
5%
10%
3%
Percentile
G
r
a
d
e
L
e
v
e
l
s
E. A. White School Math Problem Solving Baseline 2014 - 2015
Novice
Apprentice
Practitioner
Expert

Edward A. White Elementary School Profile
Page 56
N=
Kdg 45
1st 40
2nd 27
3rd 42
4th 34
5th 37
0% 20% 40% 60% 80% 100%
K
1st
2nd
3rd
4th
5th
29%
3%
0%
21%
24%
24%
42%
8%
11%
31%
56%
22%
18%
18%
52%
40%
21%
46%
11%
73%
37%
7%
0%
8%
Percentile
G
r
a
d
e
L
e
v
e
l
s
E. A. White School Math Problem Solving Midyear 2014 - 2015
Novice
Apprentice
Practitioner
Expert

Edward A. White Elementary School Profile
Page 57
Edward A. White School Kindergarten Math Checklist Baseline
2014 – 2015
N = 41
Below Basic 19%
Basic 49%
Proficient 32%
Advanced 0%
Edward A. White Elementary School Profile
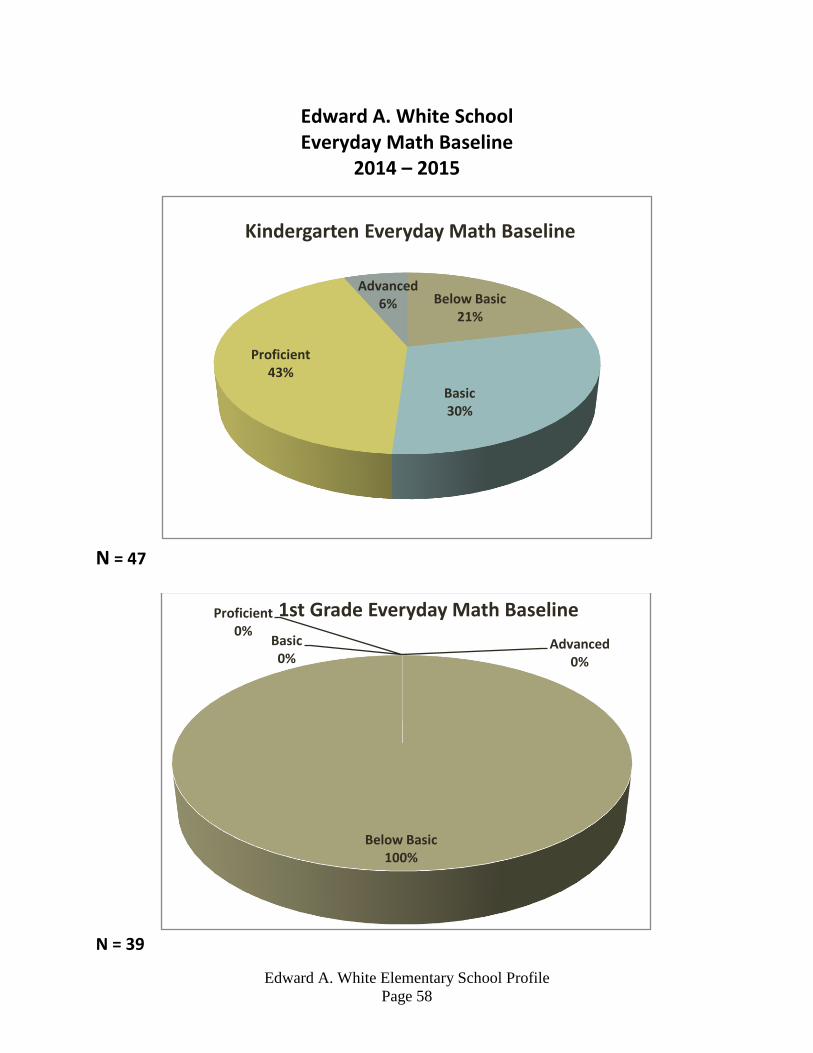
Page 58
Below Basic 21%
Basic 30%
Proficient 43%
Advanced 6%
Kindergarten Everyday Math Baseline
Edward A. White School Everyday Math Baseline
2014 – 2015
N = 47
N = 39
Below Basic 100%
Basic 0%
Proficient 0%
Advanced 0%
1st Grade Everyday Math Baseline

Edward A. White Elementary School Profile
Page 59
N=30
Below Basic 97%
Basic 3%
Proficient 0%
Advanced 0%
2nd Grade Everyday Math Baseline

Edward A. White Elementary School Profile
Page 60
Edward A. White School SMI Baseline 2014 – 2015
N=38
N=32
Below Basic 42%
Basic 40%
Proficient 13%
Advanced 5% 1st Grade SMI Baseline
Below Basic 66%
Basic 25%
Proficient 6%
Advanced 3% 2nd Grade SMI Baseline

Edward A. White Elementary School Profile
Page 61
Edward A. White School enVision Math Baseline
2014 – 2015
N = 40
N = 34
Below Basic 95%
Basic 2%
Proficient 3%
Advanced 0%
3rd Grade
Below Basic 85%
Basic 9%
Proficient 6%
Advanced 0%
4th Grade
Edward A. White Elementary School Profile
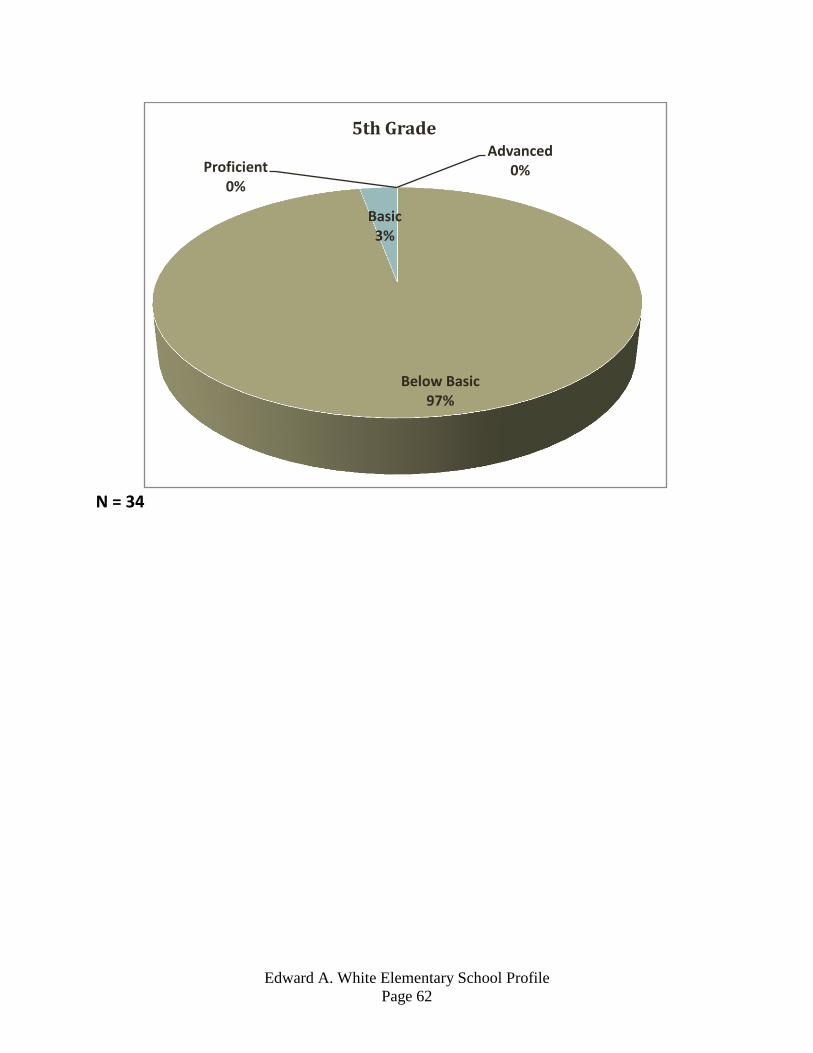
Page 62
N = 34
Below Basic 97%
Basic 3%
Proficient 0%
Advanced 0%
5th Grade

Edward A. White Elementary School Profile
Page 63
Edward A. White School
Terra Nova 3 National Percentile – Assessment Summary Part II Spring 2009-2014
2013 Target – 75% of students at or above standard (<51) and fewer than 5% of students below standard (>25)
Grade 3 - All Students
Percentile Rank
(09/10/11/12/13/14)
% At or Above
Standard (2014)
% Below Standard
(2014)
Reading 71/60/66/71/79/84 100 0
Language 68/55/66/64/66/89 100 0
Math 68/77/68/82/80/90 97 3
Science 85/77/70/77/78/89 97 3
Soc. Stud. 85/72/75/86/83/81 97 3
Grade 4 - All Students
Percentile Rank
(09/10/11/12/13/14)
% At or Above
Standard (2014)
% Below Standard
(2014)
Reading 69/76/69/73/72/71 74 26
Language 52/67/69/67/78/67 67 33
Math 57/73/63/81/69/60 58 42
Science 68/58/70/67/74/73 67 33
Soc. Stud. 7184/71/77/70/67 74 26
Grade 5 - All Students
Percentile Rank
(09/10/11/12/13/14)
% At or Above
Standard (2014)
% Below Standard
(2014)
Reading 88/76/83/67/79/67 67 33
Language 68/69/76/66/85/74 67 33
Math 84/74/81/72/89/77 76 24
Science 88/79/87/73/85/77 80 20
Soc. Stud. 80/82/89/81/83/76 77 23

Edward A. White Elementary School Profile
Page 64
Analysis of Data and Implications 2009-2010
Terra Nova Multiple Assessments: The analysis of data from the Terra Nova Multiple Assessments over time indicates the need to address specific reading and math content standards in daily classroom instruction to raise overall student achievement. Disaggregated data by gender and ethnicity shows the need to continually enhance the learning environment for English Language Learners and male students. The data from the Terra Nova sub-skill of problem solving is no longer among the lowest areas of student achievement in grades 3, 4, and 5. There was a 3 to 7 percent increase in the sub-skill of math problem solving for grades 3-5. Achievement below the 75 percentile in the sub-skill of problem solving indicates a need for continual improvement. The data from the Terra Nova sub-skill of Evaluate and Extend Meaning over a three year period shows a decline in student achievement in grades 3, 4, and 5. Achievement on Terra Nova sub-skill in Evaluate and Extend Meaning reflects 75%. Analyze Text shows increase of an average for grades 3-5 of .833 from 2009-2010 Terra Nova Implications - Non-Hispanic students scored higher than Hispanic students in every subject on the Terra Nova test in grades 3-5. Teachers will use this data to continue to provide researched based instruction in order to meet the need of the Hispanic students. Teachers will continue school-wide collaboration focusing on the ELL and Hispanic students while collecting further data to indicate future trends. There is further need for faculty input and discussion of assessment data to better facilitate the needs of ELL students. Females scored higher in language arts/reading and math than the males on the Terra Nova test in grades 3-5. Teachers will actively engage males more often during instruction in language arts/reading and math. The Terra Nova scores in math problem solving declined from 2005-2008. Through the disaggregation of data the faculty chose math problem solving as an area of need. There was a 3 to 7 percent increase in the sub-skill of math problem solving for grades 3-5, 2009 -2010 Terra Nova. Achievement below the 75 percentile in the sub-skill of problem solving indicates a need for continual improvement. . The data indicates a need for continuous work in these areas. Both goals will continue for the school year 2010/2011. Developmental Reading Assessment: Students at Edward A. White Elementary School show growth in reading as assessed by the Developmental Reading Assessment. By the end of school year 2009, 70% or greater of students in grades K, 1, 2 and 3 performed At or Above grade level as measured by the DRA. At the end of the school year 2010, 83% of students in K, 1, 2, and 3 performed AT or Above grade level as measured by the DRA. Implications - Teachers will be provided staff development in the utilization of research based graphic organizers to include advanced organizers. The use and improvement of guided reading, Scholastic Achievement Manager, and higher order thinking/questioning techniques will assist in the improvement of Reading Comprehension. This provides data to support the
Edward A. White Elementary School Profile
Page 65
reading comprehension goal with the increase in Below or Partial categories. The faculty will also be provided staff development in the new system wide reading series, Reading Streets.
Environmental Scan: Research has shown that students need to have the following attributes in order to be effective in the workforce: critical thinkers, problem solvers, innovators, and effective communicators. They have also found that high school students who have been recently hired are lacking operational skills in critical thinking, problem solving, written communication, leadership, work ethic, and self-direction. Research also shows that the skills and content areas that will be growing in importance in the next five years will include: critical thinking, information technology, health and wellness, collaboration, innovation and personal financial responsibility. An analysis of data regarding what students should know and be able to do to be competitive in the 21st Century, points to the ability to read and understand text well and to be problem solvers in math and in social and work situations. According to 21st Century Skills the core subjects are as follows:
English, reading or language arts World languages Arts Mathematics Economics Science Geography History Government and Civics
Employers are looking for the application and knowledge of skills utilizing oral communication, collaboration, professional work ethic, written communication, critical thinking and problem solving from employees that have graduated from college as stated in a research survey.
Implications- The faculty and staff should incorporate 21st century skills and proficiencies into the school curriculum within the context of academic standards. The expectation for the students we teach today will be to use 21st century skills and reading comprehension skills to problem solve, to understand, and address global issues.

Edward A. White Elementary School Profile
Page 66
Analysis of Data and Implications 2012-2013
Terra Nova Multiple Assessments: The analysis of data from the Terra Nova Multiple Assessments over time indicates the need to address specific reading and math content standards in daily classroom instruction to raise overall student achievement. Disaggregated data by gender and ethnicity shows the need to continually enhance the learning environment for English Language Learners and male students. The data from the Terra Nova sub-skill of problem solving is no longer among the lowest areas of student achievement in grades 3, 4, and 5. There was a 1 to 8 percent increase in the sub-skill of math problem solving for grades 3-5. However fourth grade growth of 1% indicates a continued need of focus. Achievement below the 75 percentile in the sub-skill of problem solving indicates a need for continual improvement. The data from the Terra Nova sub-skill of Evaluate and Extend Meaning over a three year period shows steady progress in student achievement in grades 3, 4, and 5. Analyze Text shows increase of an average for grades 3-5 of .23 from 2012-2013 Terra Nova Implications - Non-Hispanic students scored higher than Hispanic students in every subject on the Terra Nova test in grades 3-5. Teachers will use this data to continue to provide researched based instruction in order to meet the need of the Hispanic students. Teachers will continue school-wide collaboration focusing on the ELL and Hispanic students while collecting further data to indicate future trends. There is further need for faculty input and discussion of assessment data to better facilitate the needs of ELL students. Third grade males outscored females in reading and language arts, while at fourth grade females outscored males. At fifth grade all students scored at the same level. Teachers will actively engage subgroups more often during instruction of the curriculum. The Terra Nova scores in math problem solving show growth for third and fifth grade and remained the same for the fourth grade from 2008-2013. Through the disaggregation of data the faculty chose math problem solving as an area of need. Achievement below the 25 percentile in the sub-skill of problem solving indicates a need for continual improvement in third and fourth grades. The data indicates a need for continuous work in these areas. Both goals will continue for the school year 2013 - 2014. Benchmark Assessment System (BAS) Students at Edward A. White Elementary School show growth in reading as assessed by the Benchmark Assessment System (BAS). By the end of school year 2009, 70% or greater of students in grades K, 1, 2 and 3 performed At or Above grade level as measured by the Developmental Reading Assessment. At the end of the school year 2013, 80% of students in K, 1, 2, and 3 performed AT or Above grade level as measured by the BAS.

Edward A. White Elementary School Profile
Page 67
Implications – Goal 1 -Teachers will continue staff development in the utilization of research based graphic organizers to include advanced organizers. The use and improvement of guided reading, Scholastic Achievement Manager, and higher order thinking/questioning techniques will assist in the improvement of Reading Comprehension. This provides data to support the reading comprehension goal with the increase in Below or Partial categories. The faculty will also be provided staff development in the system wide reading series, Pearson. Goal 2 – Teachers will be provided staff development in the utilization of Scholastic Mathematics Inventory (SMI), to assist in the improvement of problem solving. Staff development will continue in the area of concise mathematical writing skills.
Environmental Scan: Research has shown that students need to have the following attributes in order to be effective in the workforce: critical thinking, problem solving, innovation, and effective communication. They have also found that high school students who have been recently hired are lacking operational skills in critical thinking, problem solving, written communication, leadership, work ethic, and self-direction. Research also shows that the skills and content areas that will be growing in importance in the next five years will include: critical thinking, information technology, health and wellness, collaboration, innovation and personal financial responsibility. An analysis of data regarding what students should know and be able to do to be competitive in the 21st Century, points to the ability to read and understand text well and to be problem solvers in math and in social and work situations. According to 21st Century Skills the core subjects are as follows:
English, reading or language arts World languages Arts Mathematics Economics Science Geography History Government and Civics
Employers are looking for the application and knowledge of skills utilizing oral communication, collaboration, professional work ethic, written communication, critical thinking and problem solving from employees that have graduated from college, as stated in a research survey.
Implications- The faculty and staff should incorporate 21st century skills and proficiencies into the school curriculum within the context of academic standards. The expectation for the students we teach today will be to use 21st century skills and reading comprehension skills to problem solve, to understand, and address global issues.

Edward A. White Elementary School Profile
Page 68
Other Common Measures
District or school wide criterion referenced tests – Our school uses Susan
O’Connell Math Problem Solving to assess their problem solving abilities. It is used in the
beginning, middle and end of the school year. Teachers analyze and record the data in
our Data Tracker. This local assessment is used to drive instruction, assist with school
goals, and enhance student achievement.
Enrollment data - E. A. White Elementary School serves students in grades
Kindergarten - 5th grade. The average enrollment is 251 students. 16% = IEP,
17% = Free & Reduced Lunch, 34% = Mobility and 14% = Deployment Rate
Retention Rates – During school year 2012-2013, 5 students out of 250 = 12% were
retained.
Suspension, Expulsion – There has been zero suspension in the last three years, and
zero expulsion.
Achievement and failure patterns across grade levels – E.A. White’s Goal One
focuses on Analyze Text and Evaluate/Extend Meaning from Terra Nova which shows an
increase across the 3rd -5th grade levels of 11 to 14 points above the National Percentile
Average, with a low of 64% and a high of 84%. E.A. White’s Goal Two focuses on
Problem Solving and Reasoning from Terra Nova which shows an increase across the 3rd
-5th grade levels of 9 to 23 points above the National Percentile Average, with a low of
61% and a high of 84%.
Co-curricular participation – From 8:15 – 8:45 teachers collaborate both vertically
and horizontally to better define the needs of students. Every Tuesday, Wednesday, and
Thursday mornings vertical collaboration with grade level teachers and the core
collaborate group (principal, counselor, special education) meet weekly. IS reading, ESL
and gifted education teachers join in collaboration every other week. Also, Art, Music,
and the Information Specialist join in each 2nd and 4th week of the month. Vertical
collaboration provides a consistent focus on the standards and individual student needs.
Issues of school climate – Parents have expressed how our teachers and staff
provide a happy, warm, and embracing environment that encourages students to learn and recognizes the unique learning needs of each child. They also like the activities and programs involving parents providing a family atmosphere. We hold true to the ideal neighborhood school where faculty, parents, students, and stakeholders mean community.

Edward A. White Elementary School Profile
Page 69
Current Military Ranks of Parents
Rank # sponsors % enrollment
1LT - 1st Lieutenant – O-2 8 3.2%
2LT - 2nd Lieutenant – O-1 4 1.6%
CAPT – Captain – O-3 26 10.6%
COL – Colonel – O-6 11 2.5%
CSM - Command Sergeant Major – E9 16 6.5%
CW2 - Chief Warrant 2 1 .4%
CW3 – Chief Warrant 3 2 .8%
CW4 - Chief Warrant 4 3 1.2%
LCDR - Lieutenant Commander 0 0.0%
LTC - Lieutenant Colonel – O-5 60 24.5%
MAJ – Major – O-4 90 36.8%
MSG – Master Sergeant – E-8 6 2.4%
PFC – Private First Class 0 0%
SFC – Sergeant 1st Class – E-7 5 2.0%
SGT – Sergeant – E-5 7 2.8%
SPC – Specialist – E-4 1 .4%
SSG – Staff Sergeant – E-6 3 1.2%
WO1 – Warrant Officer 1 1 .4%
Null - No rank for parent present. (Sponsor deployed) 0 0.0%
Total commissioned officers - 206 Total noncommissioned – 38

Edward A. White Elementary School Profile
Page 70
Findings: Questioning and Inquiry Based 48% Guided Practice 61% Learning Centers 35% Cooperative Groups 35% Small Group 83 % Whole Group 87% Analysis: The findings indicate that classroom teachers at Edward A. White Elementary School utilize a variety of instructional practices that engage students in learning activities on a daily basis. Whole group instruction is used frequently to introduce or model the skill which leads to differentiated student practice.
Edward A. White School
Instructional Models Used Daily Teacher Survey
October 2009
33%
91%
86%
38%
17%
38%
42%
67%
67%
52%
26%
0% 10% 20% 30% 40% 50% 60% 70% 80% 90% 100%
Lecture
Whole Group
Small Group
Cooperative Group
Project Based Learning
Independent Study
Peer Tutoring
Learning Centers
Guided Practice
Questioning & Inquiry Based
Inegrated Units
Mo
de
ls
Percentile
n=23

Edward A. White Elementary School Profile
Page 71
Student Instructional Technique 2013-2014 The school collected data from a student feedback form about the instructional techniques they experience in the classroom. Smart Board 30% Computer/Technology based activities 23% Guided Practice 22% Small Group 13% Learning Centers 11%
We took the top five instructional techniques and asked students what they experience the most and they felt that they use the Smart Board and Computer/Technology based activities the most in the classroom.

Edward A. White Elementary School Profile
Page 72
Teacher Instructional Techniques 2014 – 2015
We collected data from an electronic teacher feedback form about the
instructional techniques teachers use in the classroom.
0
10
20
30
40
50
60
70
80
90
Daily
Weekly
Monthly
Don't Use

Edward A. White Elementary School Profile
Page 73
Student Instructional Technique 2014 - 2015
The school collected data from an electronic student feedback form about the
instructional techniques they experience in the classroom. The students selected
the three best ways that they learn.
48
133
57
157
109
87
65
136
162
115
95
82
107
Student Instructional Techniques
Number
of
students
Edward A. White Elementary School Profile
Page 74
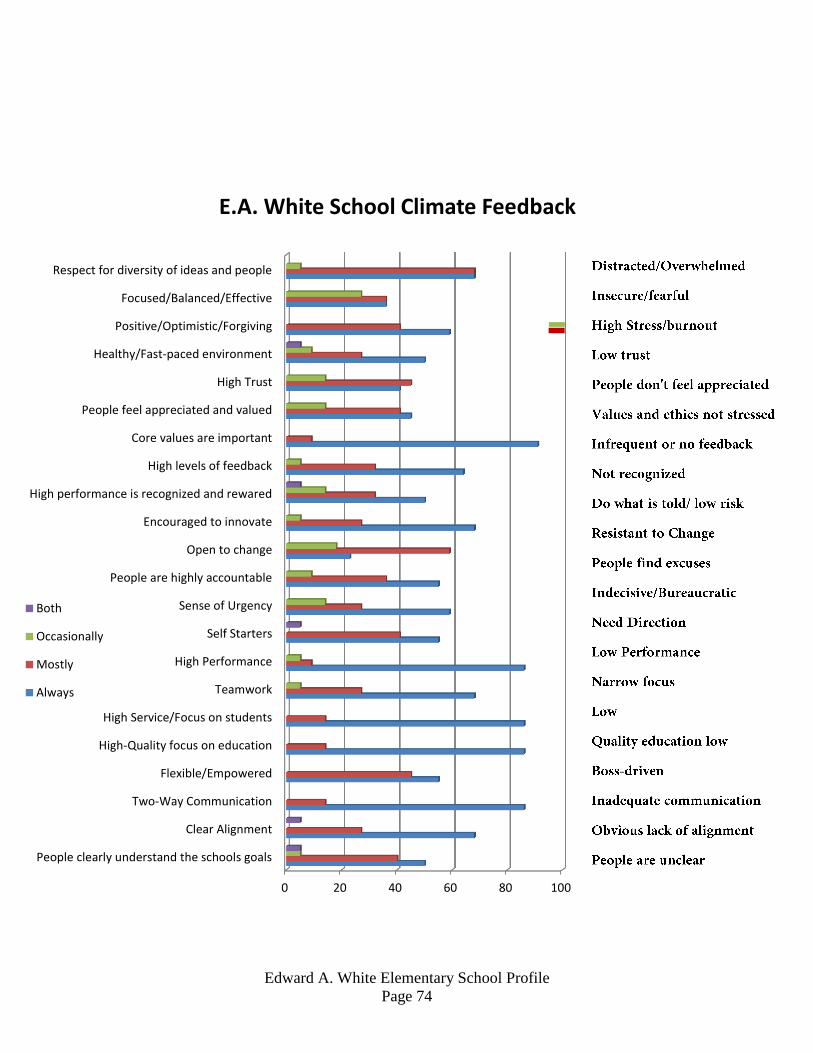
0 20 40 60 80 100
People clearly understand the schools goals
Clear Alignment
Two-Way Communication
Flexible/Empowered
High-Quality focus on education
High Service/Focus on students
Teamwork
High Performance
Self Starters
Sense of Urgency
People are highly accountable
Open to change
Encouraged to innovate
High performance is recognized and rewared
High levels of feedback
Core values are important
People feel appreciated and valued
High Trust
Healthy/Fast-paced environment
Positive/Optimistic/Forgiving
Focused/Balanced/Effective
Respect for diversity of ideas and people
E.A. White School Climate Feedback
Both
Occasionally
Mostly
Always

Edward A. White Elementary School Profile
Page 75
Student Engaged Time
The instructional day at White begins at 9:00 AM and ends at 3:30 PM. The duty day for professional staff members is from 8:15 AM to 3:45 PM on Mondays, Wednesdays, Thursdays, and Fridays. On Tuesdays, students are dismissed at 2:15 PM and the duty day for professional staff members ends at 4:15 PM. The early release of students on Tuesday afternoon provides time for professional development, collaboration meetings, faculty meetings, district training sessions, and Continuous School Improvement committee meetings. The designation of this time on a weekly basis provides many opportunities for staff members to grow as a professional learning team to better serve the needs of students and to enrich teaching practices. In addition, daily from 8:15-8:45 teachers collaborate both vertically and horizontally to better define the needs of students.

Edward A. White Elementary School Profile
Page 76
Staff Development Opportunities for 2014 - 2015
One full Wednesday per month-Principal’s training June 26-HAZMAT training-custodians, secretaries, supply, Administrative assistants July-Asbestos Training-selected staff August 3-CSI Team Training August 4-PD-Nurses’ training August 6-8-STEM training for selected teachers August 7-Data Review training-all August 7-8-Read 180: The Next Generation-Read 180 teacher August 9-SST training and Art/Music/PE curriculum review August 13-GradeSpeed-4th and 5th grade teachers August 11-15-AM Collab-Assessments and Protocols-all August 19-PD-Assessment Webinar-Principals August 19-Early Release-Playground Safety and Trafficking in Persons training-all August 21-BAS training-K-3 August 22-PD-Educational Technologists August 26-IPAD training-Spec. Ed teachers August 29-PD Day-Action Plan/AdvEd training-all September 2-Early Release-Required DoDEA training-all September 8-9-PD-STEM training-Callaway Gardens-Principals and District IS September 8-11 and September 17-Literacy Intervention training-LII teacher September 12-PD Day-Project-Based Learning-All September 15-AM Collab-BAS Reporting-K-3 September 16-Early Release-Required DoDEA training September 17-19-AM Collab-Rubrics and Exemplars-all September 18-PD-Co-teaching training-selected teachers September 18-19-PD-Webmaster training-Educational Technologists September 19-PD-Multiage classroom training-selected teachers September 23-PD-SPED Intervention training-Principals and selected teachers September 23-Early Release-Family Advocacy training-all September 25-AM Collab-LII Reading Review-all September 26-AM Collab-Guided Reading Review-all September 29-30-ESL Math training-ESL teachers September 30-AM Collab-Tech Tuesday-Google-all

Edward A. White Elementary School Profile
Page 77
September 30-Early Release-Regie Routman Book Study, Writing for Audience and Purpose-all October 1-AM Collab-Adult to Student Sexual Harassment training-all October 6-DDESS Administrators’ Training October 7-AM Collab-Tech Tuesday-Graphic Organizers-all October 9-AM Collab-Regie Routman Book Study, Writing for Audience and Purpose-all October 10-PM-Aspen training-Secretaries October 16-SST training-Counselors October 21-AM Collab-Tech Tuesday-Google and ENCORE-all October 21-Early Release-Regie Routman Book Study, Writing for Audience and Purpose October 23-PD Child Abuse Prevention and Resiliency training-Counselors October 23-PD-Gifted records training-Gifted teacher October 23-24-AM Collab-Data Analysis and Display October 24-PD-Counselor training October 27-PD-SPARKS training-P.E. Teachers October 27-AM-Ebola update and preparedness-nurses October 28-AM Collab-Tech Tuesday-ENCORE and Google-all November 6-AM-Health Update and hand washing training November 10-PD-21st Century STEM-Principal and selected teachers November 13-AM-Tech Thursday-Interactive SMART Board training-all November 12-13-PD-CEDR training: Communication and Conflict Resolution-Principals and Case Study Chairs for Spec. Ed. November 18-AM-Tech Tuesday-Interactive SMART Board training-all November 18-Early Release-Susan O’Connell Problem Solving Review-all November 19-1/2 day-District Network Team -Principals November 20-21-AM-Looking at Student Work review-all December 2, 9, 16-AM-Tech Tuesday-all December 10-Leveled Literacy Training-Principals December 14-AM-DoDEA TN Data January 6-Early Release-Tiered Instruction with Technology-District IS-all January 8-9-AM-Padlet Training-District IS-all January 13-AM-RazKids Review-all January 28-AM BAS Review-District IS-Kindergarten teachers February 5 and 6-AM-Analysis of 2nd Quarter Data-all February 13-Professional Dev. Day-AdvEd Standards Review-all

Edward A. White Elementary School Profile
Page 78
February 24-Early Release-Strategies Review-all March 5 and 12-AM-Review of Marzano strategies-all March 3, 10 and 17-AM-Tech Tuesday-all March 31-Early Release-ELEOT Review April 2 and 3-AM-Analysis of 3rd Quarter Data-all

Edward A. White Elementary School Profile
Page 79
School Organization The Department of Defense Education Activity (DoDEA) has a continuous cycle of evaluating and revising all subject area programs. The process begins with evaluating the current program, finding programs that are co-existent with the standards, utilizing a pre-implementation timeframe, and ending with the implementation and assessment of the new textbooks and materials.
E.A. White Elementary School Staff for 2014 – 2015

Edward A. White Elementary School Profile
Page 80
Position Name
Principal Renee Mallory
Secretary Beth Roberts
Nurse Crystal LeMarQuand
Supply Technician Willine Burgess
Custodian Betty Johnson
Custodian Raymond McClendon
Custodian Al Morris
Kindergarten Kindergarten Aide
Tammy Ashley Janet Snow
Kindergarten Kindergarten Aide
Tammy Logan Mary McAnulty
First Grade Nichole Stryjek Angel Nelson
Second Grade Melody Vaillant Crystal Banks
Third Grade Virginia Suich Lisa Madler
Fourth Grade Penny Wilson
Fourth-Fifth Grade Multi-age Robert Thorne
Fifth Grade Shelia Brown
Guidance Counselor Evelyn Montgomery
Educational Technologist Tammy Kleiber
Speech Pathologist Shelia Dade
Special Education Teacher Kaytalyn Winston
ESL Teacher Zoraida Andrade
Gifted Education Teacher Marie Hand
Physical Education Teacher Michael Campos
Music Teacher Troy Dobbs
Art Teacher Maribell Valentin
Read 180/IS Support Dana Pollard
Media Specialist Mitzi Crow
Media Automation Clerk Doris Lamb
Math IS Support Evelyn Braman
Special Education Aides Katie Rice

Edward A. White Elementary School Profile
Page 81
PROFESSIONAL STAFF TEACHING EXPERIENCE
Findings: n=21 Years of Experience = 0-1 years 5% Years of Experience = 1-3 years 5% Years of Experience = 4-6 years 19% Years of Experience = 7-10 years 14% Years of Experience = 10+ years 57% Analysis: The findings indicate that all certified personnel have a majority of 10 or more years of teaching experience
0 2 4 6 8 10 12
0
1 - 3
4 - 6
7 - 10
>10
E.A. White School Educator's Years of Teaching Experience
2014 - 2015
12
3
4
1
1

Edward A. White Elementary School Profile
Page 82
Findings: n=21 Teachers having a BA/BS degree = 38% Teachers having a Master’s degree = 29% Teachers having an Education Specialist = 29% Teachers having a Doctorate = 5% Analysis: The faculty of Edward A. White is highly qualified with the majority of degrees in the fields of Masters and Education Specialist.
0
1
2
3
4
5
6
7
8
BA/BS Masters Ed. Spec. Doctorate
E.A. White School Teachers' Highest Degree
2014 - 2015
BA/BS
Masters
Ed. Spec.
DoctorateHighest Degree Held
N u m b er of Teachers
8
6 6
1

Edward A. White Elementary School Profile
Page 83
School Organization cont.
INTEGRATED LANGUAGE ARTS AND READING
The focus of the Integrated Language Arts and Reading Standards includes reading, writing, speaking and listening skills. Instructional strategies include, but are not limited to, flexible grouping, guided reading, whole/small group instruction, cooperative learning opportunities and peer buddy reading.
Edward A. White Elementary School Profile
Page 84
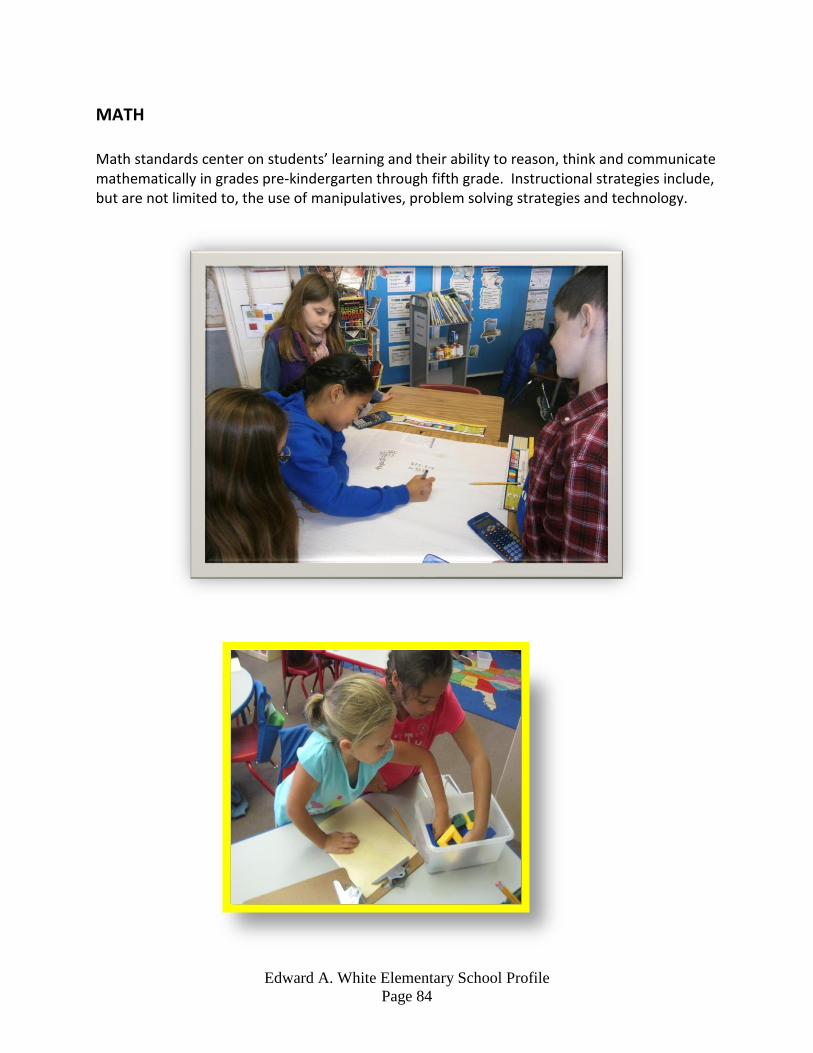
MATH
Math standards center on students’ learning and their ability to reason, think and communicate mathematically in grades pre-kindergarten through fifth grade. Instructional strategies include, but are not limited to, the use of manipulatives, problem solving strategies and technology.

Edward A. White Elementary School Profile
Page 85
SCIENCE Science standards stress a hands-on inquiry based approach; students acquire skills in the fields of our universe, world, and lives. The standards enhance curiosity, stimulate the thinking process, and promote higher order questioning techniques for 21st century learners.
Building A Model Knee
Making Play Dough

Edward A. White Elementary School Profile
Page 86
Little Engineers
Goldie Blox
Edward A. White Elementary School Profile
Page 87
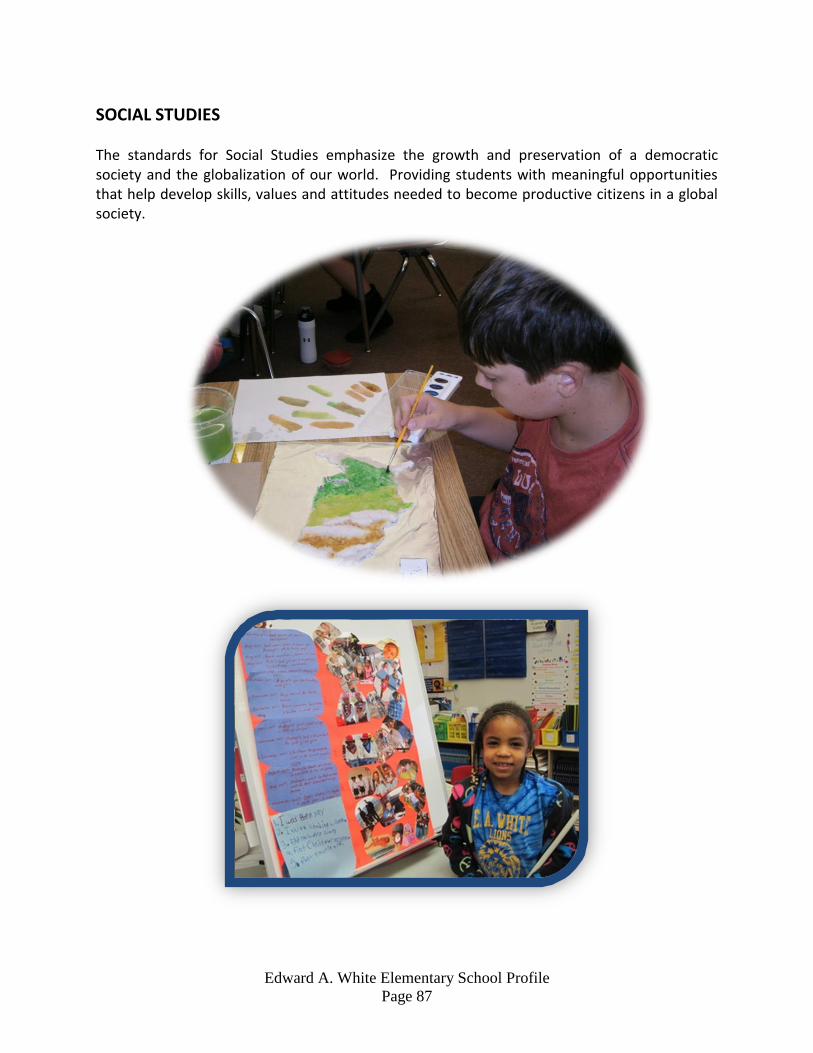
SOCIAL STUDIES The standards for Social Studies emphasize the growth and preservation of a democratic society and the globalization of our world. Providing students with meaningful opportunities that help develop skills, values and attitudes needed to become productive citizens in a global society.

Edward A. White Elementary School Profile
Page 88
HEALTH The DODEA standards in Health Education prepare students to make informed decisions on topics concerning individual, family and public health. Teachers, school nurse, counselor, and physical education instructor emphasize topics such as nutrition, conflict resolution, building good character, drug awareness, and fitness.
Paw Pals

Edward A. White Elementary School Profile
Page 89

Edward A. White Elementary School Profile
Page 90
Class Buddies

Edward A. White Elementary School Profile
Page 91
Support and Enrichment Programs
A vital part of E. A. White is the "spirit" of the school. The faculty is responsive and
compassionate thus creating a dynamic school. Many parents and visitors have commented on how everyone at school is committed to do whatever it takes to ensure that all children succeed. A variety of activities can be found at E. A. White! The student-led morning announcements kick off each day and remind us of upcoming events, including Red Ribbon Week, Scholastic Book Fairs, Field day, Field Trips, Robotics Competitions, and Chorus Concerts. Our reading incentive program encourages all students to become “REEL READERS”, where points earned are redeemed for an end of year celebration with popcorn and a movie at the local post theater. As visitors and parents walk through our school, they may see students engaged in the outdoor classroom, or working in the garden. More often than not, visitors entering our school leave with the vivid impression of the columns which display patriotic and academic art down our sidewalk. We still hold true to the ideal neighborhood school where faculty, parents, students, and stakeholders mean community.
The following programs and services are provided, as indicated for our students:
Special Education: 5%
Speech and Language: 5%
Gifted Education: 10%
English as a Second Language: 10%
The DoDEA English as a Second Language Program (ESL) provides service for students to increase English language skills so their academic performance is equivalent to native English-speaking students of the same age and grade level. The focus is to provide the educational opportunities that will enable the English Language Learner (ELL) to be an independent learner, successful in the classroom, and a productive member of society. Most of the ESL students at E. A. White School are children of foreign officers in WHINSEC. Non-English speaking students of other military sponsors are also serviced by this program. The percentage of ESL students at White School is approximately 16%.
Edward A. White Elementary School Profile
Page 92
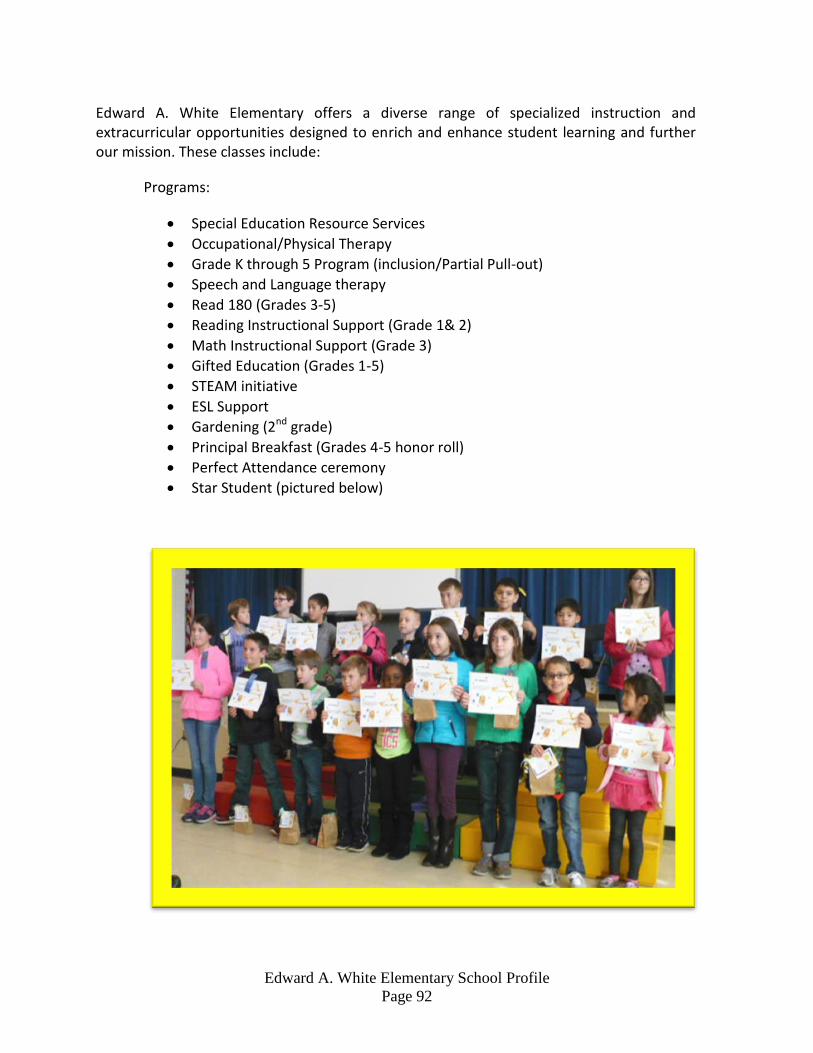
Edward A. White Elementary offers a diverse range of specialized instruction and extracurricular opportunities designed to enrich and enhance student learning and further our mission. These classes include:
Programs:
Special Education Resource Services
Occupational/Physical Therapy
Grade K through 5 Program (inclusion/Partial Pull-out)
Speech and Language therapy
Read 180 (Grades 3-5)
Reading Instructional Support (Grade 1& 2)
Math Instructional Support (Grade 3)
Gifted Education (Grades 1-5)
STEAM initiative
ESL Support
Gardening (2nd grade)
Principal Breakfast (Grades 4-5 honor roll)
Perfect Attendance ceremony
Star Student (pictured below)

Edward A. White Elementary School Profile
Page 93
Edward A. White Elementary Extracurricular Opportunities
News Production - Eligibility: 4th - 5th Graders
Teacher/Sponsor: Mrs. C.
Meetings: Before School
Students present the daily news on a live broadcast every school morning. Teams are rotated on a regular basis.
Roaring Leaders- Eligibility: 3rd - 5th Graders
Teacher/Sponsor: Mrs. M.
Meetings: Thursday Mornings
Students represent the school in school-community activities

Edward A. White Elementary School Profile
Page 94
LEGO Mindstorm NXT Robotics
Eligibility: 4th and 5th Graders
Teacher/Sponsor: Mrs. H.
Meetings: Before School and After School
Students will utilize higher order thinking skills to solve the Robotic Challenges. The students will participate in at least
one of the Lego League Robotics Competitions.
Roaring Readers (2 groups) - Eligibility: 2n - 3
rd grade and
KDG-1st
grade
Teacher/Sponsor: Mrs. V. and Mrs. M. Meetings: After school Students participate in a reading tutorial program.

Edward A. White Elementary School Profile
Page 95
Technology Club - Eligibility: 3rd
– 5th
Teacher/Sponsor: Mrs. K. Meetings: After school Students use computer programs and other technology tools to participate in technology bases activities.
Safety Patrol - Eligibility: 4th - 5th Graders
Teacher/Sponsor: Mr. C.
Meetings: Before and after school
Students help monitor the sidewalks and walking areas around the school before and after school hours.

Edward A. White Elementary School Profile
Page 96
Community Data Demographics – This school year 2014 – 2015 E.A. White school serves 225 students. Approximately 50% are male and 50% are female. The school enrollment consists of the following ethnic classifications: 25% Hispanic, 75% Non-Hispanic (Asian/Hawaiian/Pacific Islander 8%, Black/African American 6%, Indian/Alaskan Native 2%, Not Specific 1%, and White 83%.) E.A. White School serves students in grades Kindergarten – 5th grade. Local, state, and federal mandates that impact the school program – E.A. White was chosen as one of three schools in the Georgia/Alabama District to be designated a STEAM (Science, Technology, Engineering, Arts, & Math) school. Community programs and facilities available to students –Family & Morale, Welfare & Recreation, Fort Benning, GA School/business partnerships – Our PIE Partners in Education partners are OCS (Officer Candidate School) and WHINSEC (Western Hemisphere Institute for Security Cooperation). The influence of Partners in Education is evident at through our Honor Breakfast, Reading Incentive, classroom support, and the arts. PIE led a school wide assembly to kick off the school’s purpose of Strong Minds, Healthy Bodies, and a Giving Spirit as their contribution. Parent and community organizations - E.A. White Elementary School has a very active Parent Teacher Organization. The teachers and staff work closely with the PTO in planning and hosting a variety of school-wide events, with a teacher liaison attending monthly PTO meetings. Our PTO supports teachers and students by purchasing additional classroom materials designed to enhance student learning. The PTO logged in 33 volunteers with a total of 641.50 hours for the 2012 - 2013 school year. The PTO’s purpose is to support the school’s interventions, instructional program and activities, such as, planning events to foster educational and social opportunities for families and children. PTO has supported the school by the following:
Student planners
ESL workbooks
Attendance to Columbus State University Program
Attendance at Springer production
Science Assembly
Teacher/classroom supplies
Science Fair Ribbons/Trophies
Teacher appreciation gifts & meals
Volunteer appreciation gifts
Quarterly Family Night
Reading Counts Celebration
Book Fairs
Seasonal Festivals
Silent Auction
Plays at our local historical Springer Opera House
Teacher Appreciation Week which includes a wonderful luncheon for all faculty and staff.

Edward A. White Elementary School Profile
Page 97
Parent Survey
Findings: The Parent Survey showed that 71% of the parents surveyed felt that reading comprehension and 51% of the parents surveyed felt math problem solving should be an area of emphasis Analysis: The Parent Survey reveals that reading comprehension and math problem solving should be the major areas of emphasis.
Reading comprehension n=101/142
Writing n=66/142
Oral communication n=24/142
Listening n=9/142
Math computation n=28/142
Math reasoning/ problem solving n=73/142
Science n=21/142
Social Studies/History n=2/142
Health/Physical Education n=5/142
Reasoning/Inquiry n=17/142
Using technology n=11/142
Leadership n=9/142
Personal Discipline/Self-control n=11/142
Foreign Language n=20/142
Art n=5/142
Music n=0/142
Problem Solving n=16/142
E. A. White School
Parent Survey October 2008
Question: 1. On which THREE of the following areas do you think your child’s school
should place the most emphasis?
71%
46%
17%
6%
20%
51%
15%
1%4%
12%8% 6% 8%
14%
4%0%
11%
0%
10%
20%
30%
40%
50%
60%
70%
80%
Readin
g com
prehensi
on
Writ
ing
Ora
l com
munic
ation
Liste
ning
Math
com
putatio
n
Math
reaso
ning/ p
roble
m s
olvin
g
Science
Social S
tudie
s/Histo
ry
Health
/Phys
ical E
ducatio
n
Reaso
ning/In
quiry
Using te
chnolo
gy
Leadership
Personal D
isciplin
e/Self-
contro
l
Foreig
n Language
Art
Musi
c
Proble
m S
olvin
g
Subjects
Pe
rcen
tile
Responses

Edward A. White Elementary School Profile
Page 98
Very Effective
43%
Somewhat Effective
55%
Somewhat Infeffective
2%
Very Ineffective
0%
Parents rate how effective DoD Schools are in preparing students for the 21st Century
2010 – 2011 Customer Satisfaction Survey
0
10
20
30
40
50
60
70
80
90
10093
88 88 83 85
81
18
65
78
Parents Grade the school on preparing students for the
subject areas

Edward A. White Elementary School Profile
Page 99
Very satisfied 43%
Somewhat satisfied
29%
Somewhat Dissatisfied
3%
Very Dissatisfied
1% Don't Know 24%
Parents rate how satisfied they are with the assistance available to students

Edward A. White Elementary School Profile
Page 100
Appendix A: Goal Statements
Edward A. White School Goals 2013 -2014
Goal 1: By May 2014, all students will improve in reading comprehension across the curriculum, as measured by system wide and local assessments. Goal 2: By May 2014, all students will improve problem solving and reasoning in mathematics through higher level critical thinking, as measured by system wide and local assessments.

Edward A. White Elementary School Profile
Page 101
Appendix A: Triangulation of Data Student Goal #1: By May 2014, all students will improve in reading comprehension across the curriculum, as measured by system wide and local assessments. Edward A. White Elementary school chose this goal based on the triangulation of the following data sources: 1. Terra Nova Multiple Assessments, 3rd Edition, 2009 - 2013 Reading OPI: Evaluate and Extend Meaning, Reading and Writing Strategies, Analyze Text and Language Arts OPI: Writing Strategies 2. Parent Survey 3. Environmental Scan Student Goal #2: By May 2014, all students will improve problem solving and reasoning in mathematics through higher level critical thinking, as measured by system wide and local assessments. Edward A. White Elementary School chose this goal based on triangulating the following data sources: 1. Terra Nova Multiple Assessments, 3rd Edition, 2009 - 2013 Problem Solving and Reasoning 2. Parent Survey 3. Environmental Scan
Edward A. White Elementary School Profile
Page 102
Appendix B: Environmental Scan The staff at Edward A. White Elementary School conducted a review of current research to determine the needs of students in the 21st Century. The research supporting instructional focus and strategies based upon data collected on the student achievement of students at Edward A. White Elementary School is summarized below.
Reading Classroom Instruction That Works, Marzano, Pickering & Pollick, 2007. The strategy of using advanced organizers helps all students retrieve what they already know about a topic. Putting Reading First: The Research Building blocks for Teaching Children to Read Research over 30 years has shown that instruction and comprehension can help students understand what they read and communicate with others about what they read. Graphic organizers help students focus on concepts and how they are related to other concepts. P21 Strategic Council Members, 21st Century Skills: Learning for Life in Our Times - An analysis of data regarding what students should know and be able to do to be competitive in the 21st Century, points to the ability to read and understand text well and to be problem solvers in math and in social and work situations. According to 21st Century Skills these core subjects are included: •English, reading or language arts •World languages •Arts •Mathematics
Math Roads to Reasoning- The development of reasoning power is a primary objective of elementary mathematics. Problem solving, which is the basis for developing reasoning power, has been at the forefront of the mathematics curriculum for many years. The National Council of Teachers of Mathematics’ Principles and Standards, released in 2000, continue to emphasize both of these areas.
Edward A. White Elementary School Profile
Page 103
P21 Strategic Council Members, 21st Century Skills: Learning for Life in Our Times - Research has shown that students need to have the following attributes in order to be effective in the workforce: critical thinkers, problem solvers, innovators, and effective communicators. They have also found that high school students who have been recently hired are lacking operational skills in critical thinking, problem solving, written communication, leadership, work ethics, and self-direction. National Council of Teachers of Math Standards, Students need to develop a range of strategies for problem solving, such as using diagrams, looking for patterns, or using Read Alouds. These strategies need to become embedded across the curriculum for optimal student learning. Students need to be capable of self-monitoring in order to adjust the strategies they are using as they solve a problem. Susan O’Connell, Introduction to Problem Solving – Strategies for the Elementary Math Classroom – In order to be effective mathematicians, students need to develop understanding of critical math content. They need to understand numbers and operations, algebra, measurement, geometry, data analysis, and probability. Students must learn to problem solve, communicate their ideas, reason through math situations, prove their conjectures, make connections between and among math concepts, and represent their mathematical thinking.