Embed Size (px)
Citation preview
Cognitive Diagnostic Assessment - Informing Responses and Interventions
Angela Broaddus Julia Shaftel [email protected] [email protected]
Center for Educational Testing & Evaluation
University of Kansas
Agenda
§ Some issues with CBM
§ Statistic Methods and Models
§ Cognitive diagnostic assessment
§ Cognitive models
§ Example
Curriculum Based Measurement
§ Based on fluency § Standardized § Drawn from student’s curriculum § Sensitive to change § Not intended to be diagnostic
Changes in CBM
§ Development of local norms § Identification of benchmarks § Development of general probes § Use in program evaluation § Use in response to intervention models § Use in special education eligibility
decisions
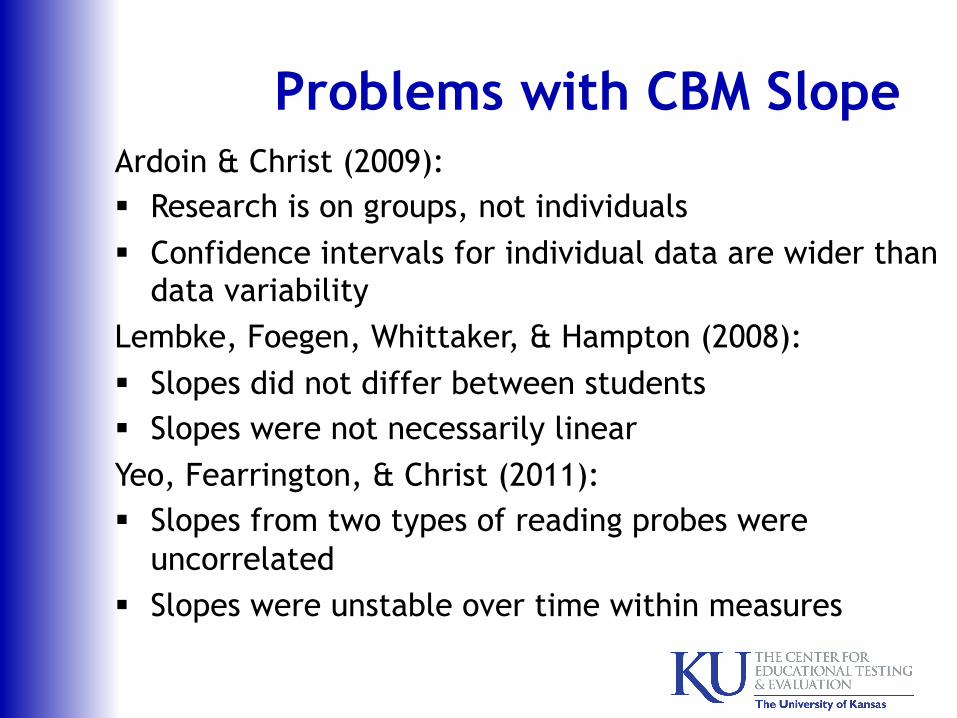
Problems with CBM Slope Ardoin & Christ (2009): § Research is on groups, not individuals § Confidence intervals for individual data are wider than
data variability Lembke, Foegen, Whittaker, & Hampton (2008): § Slopes did not differ between students § Slopes were not necessarily linear Yeo, Fearrington, & Christ (2011): § Slopes from two types of reading probes were
uncorrelated § Slopes were unstable over time within measures
CBM Data Collection
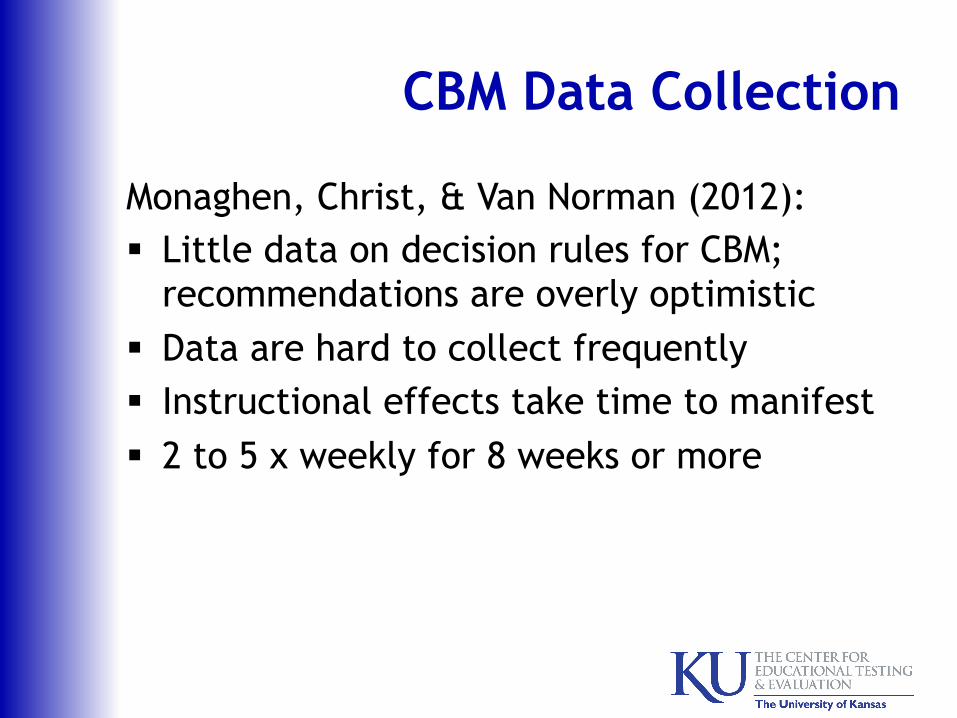
Monaghen, Christ, & Van Norman (2012): § Little data on decision rules for CBM;
recommendations are overly optimistic § Data are hard to collect frequently § Instructional effects take time to manifest § 2 to 5 x weekly for 8 weeks or more
Scores v. Growth
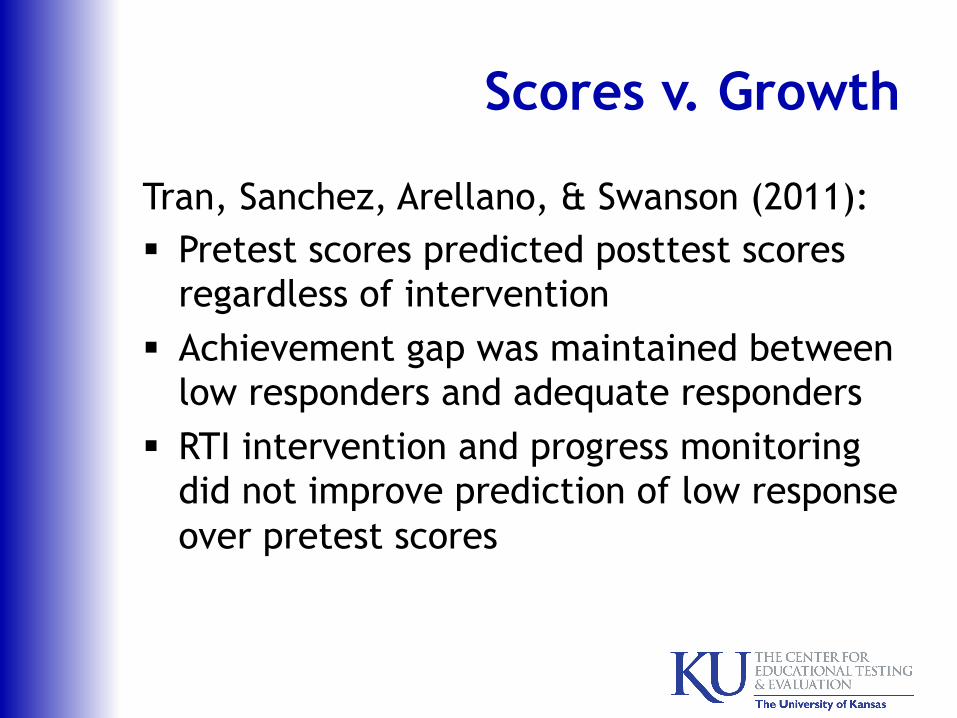
Tran, Sanchez, Arellano, & Swanson (2011): § Pretest scores predicted posttest scores
regardless of intervention § Achievement gap was maintained between
low responders and adequate responders § RTI intervention and progress monitoring
did not improve prediction of low response over pretest scores
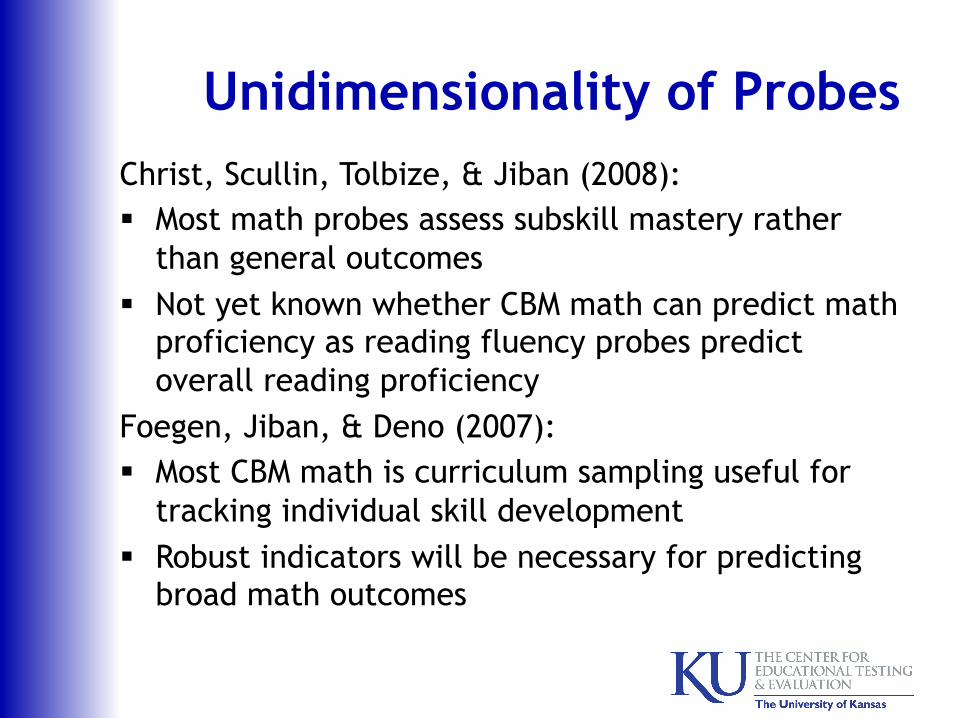
Unidimensionality of Probes Christ, Scullin, Tolbize, & Jiban (2008): § Most math probes assess subskill mastery rather
than general outcomes § Not yet known whether CBM math can predict math
proficiency as reading fluency probes predict overall reading proficiency
Foegen, Jiban, & Deno (2007): § Most CBM math is curriculum sampling useful for
tracking individual skill development § Robust indicators will be necessary for predicting
broad math outcomes
Summary
§ More research needed on CBM math § All measurement contains error; CBM
contains large amounts § CBM math probes usually unidimensional;
correspondence to broad outcomes unknown § CBM data are unstable when used to show
growth for individual students § CBM is not diagnostic § CBM does not tell us what kids don’t know
Scientific Thinking
§ What is it that we want to know?
§ What evidence will address our questions?
§ Collecting data is not enough.
Statistical Methods and Models
§ Dimensionality
DiBello, 2007
Dimensionality
§ Unidimensional theories assume a single underlying ability or latent trait that determines test responses.
§ Multidimensional theories assume multiple underlying abilities or latent traits that work in combination to determine test responses.
§ Is mathematics unidimensional or multidimensional?
Statistical Methods and Models
§ Dimensionality § Q-matrix
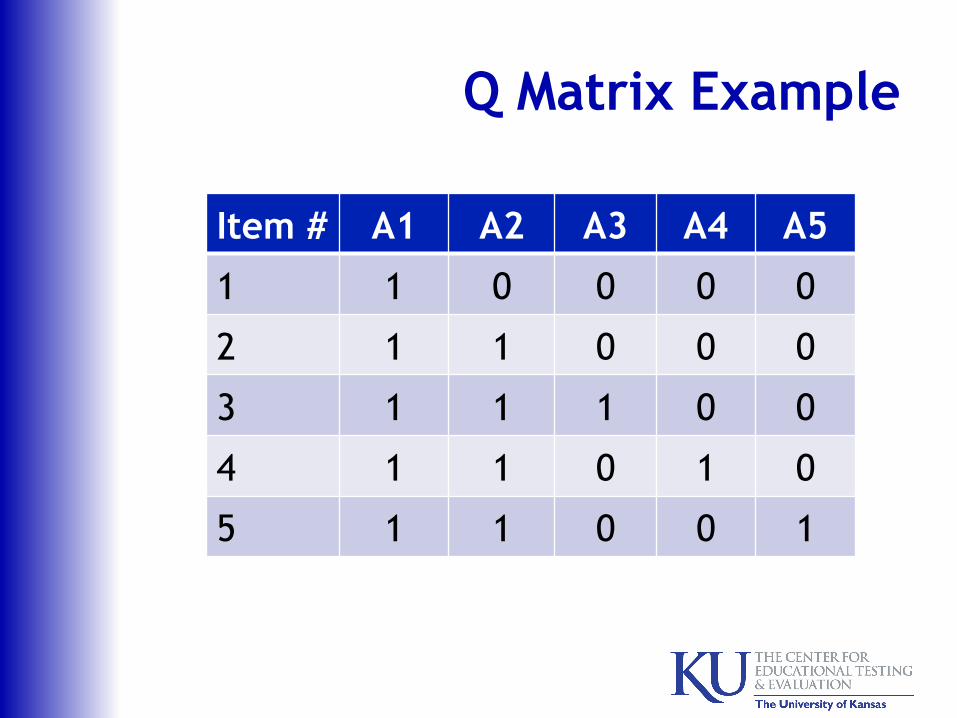
Q Matrix Example
Item # A1 A2 A3 A4 A5
1 1 0 0 0 0
2 1 1 0 0 0
3 1 1 1 0 0
4 1 1 0 1 0
5 1 1 0 0 1
Statistical Methods and Models
§ Dimensionality § Q-matrix § Assumptions
o Conjunctive o Disjunctive
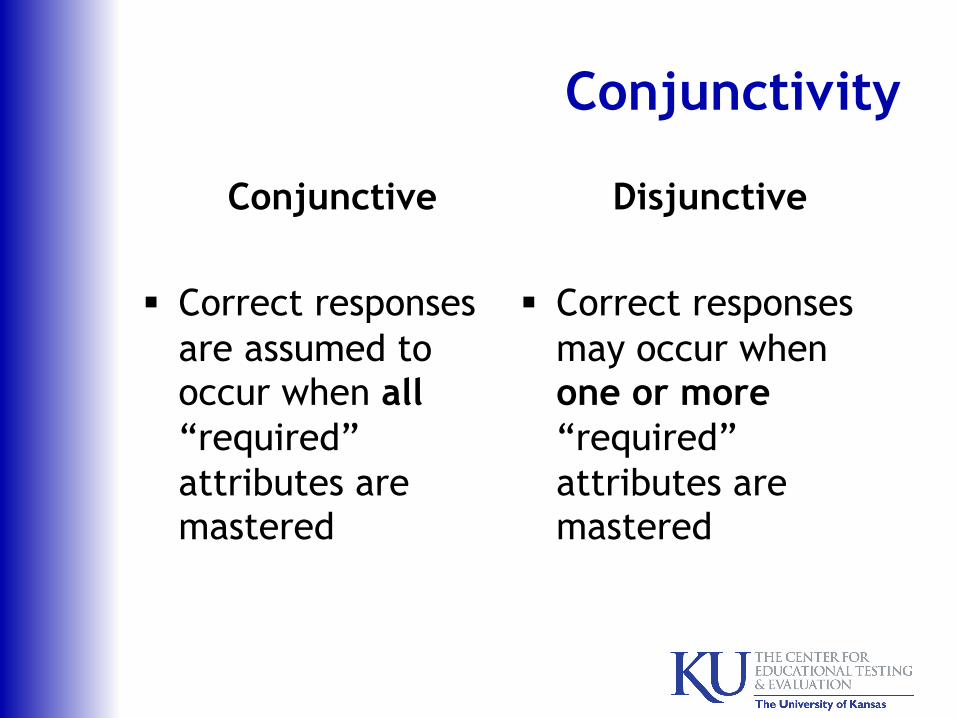
Conjunctivity
Conjunctive
§ Correct responses are assumed to occur when all “required” attributes are mastered
Disjunctive
§ Correct responses may occur when one or more “required” attributes are mastered
Statistical Methods and Models
§ Dimensionality § Q-matrix § Assumptions that
o Conjunctive o Disjunctive o Compensatory o Noncompensatory
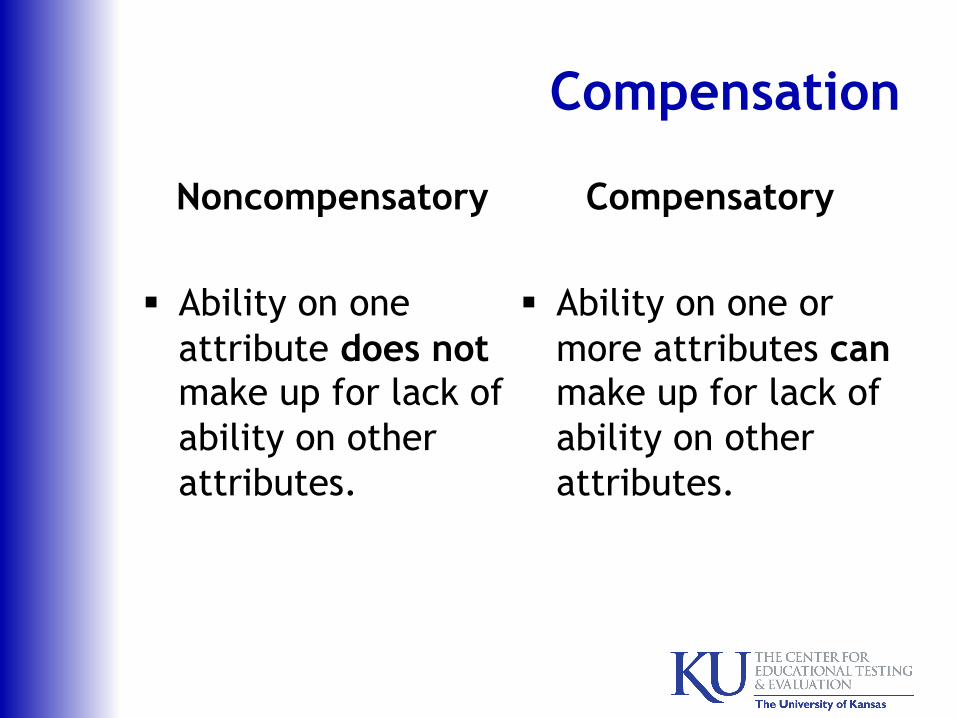
Compensation
Noncompensatory
§ Ability on one attribute does not make up for lack of ability on other attributes.
Compensatory
§ Ability on one or more attributes can make up for lack of ability on other attributes.
Statistical Methods and Models
§ Dimensionality § Q-matrix § Assumptions that
o Conjunctive o Disjunctive o Compensatory o Noncompensatory o Slipping o Guessing
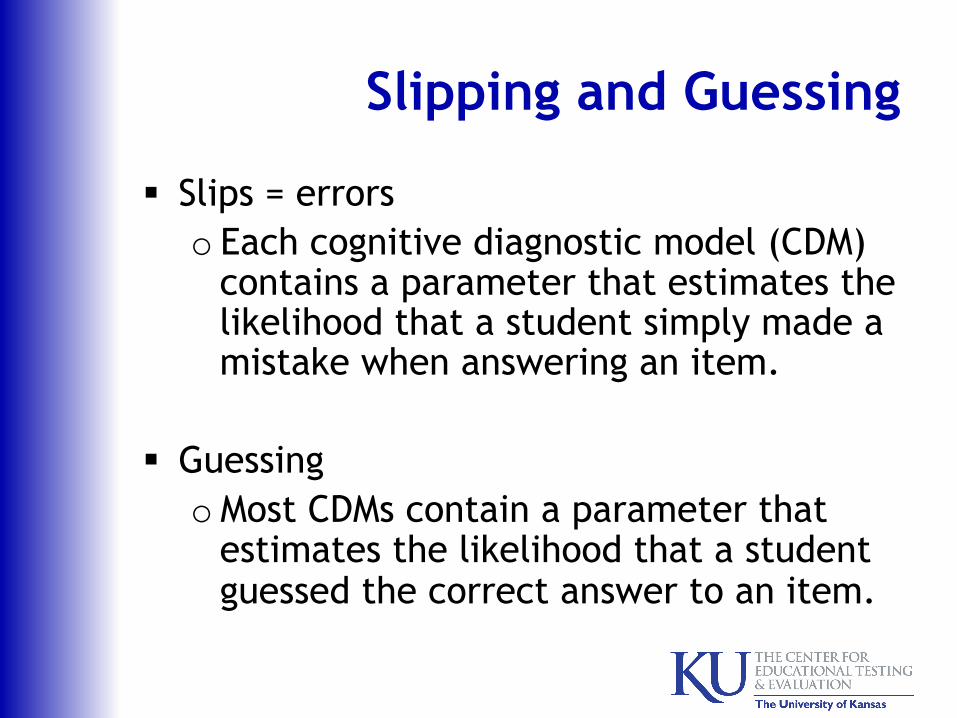
Slipping and Guessing
§ Slips = errors o Each cognitive diagnostic model (CDM)
contains a parameter that estimates the likelihood that a student simply made a mistake when answering an item.
§ Guessing o Most CDMs contain a parameter that
estimates the likelihood that a student guessed the correct answer to an item.
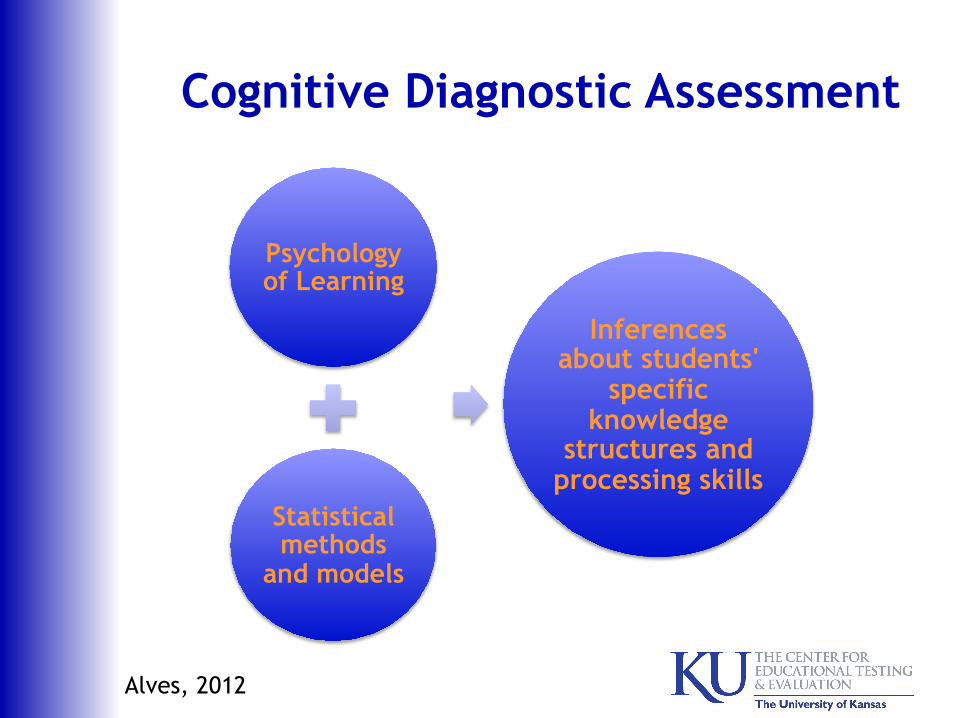
Cognitive Diagnostic Assessment
Psychology of Learning
Statistical methods
and models
Inferences about students'
specific knowledge
structures and processing skills
Alves, 2012
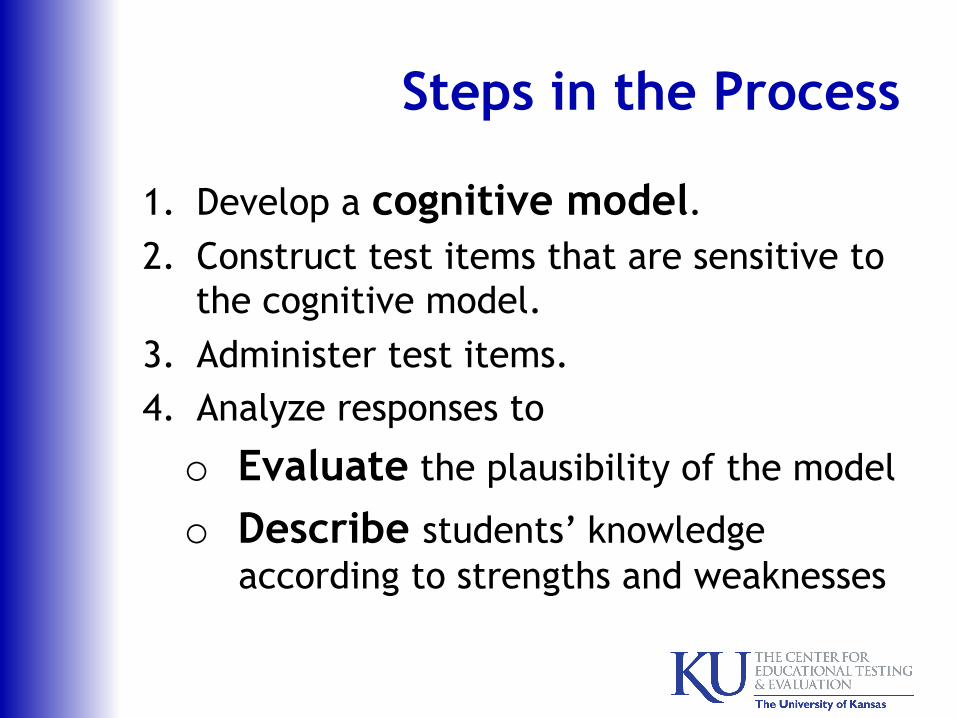
Steps in the Process
1. Develop a cognitive model. 2. Construct test items that are sensitive to
the cognitive model. 3. Administer test items. 4. Analyze responses to
o Evaluate the plausibility of the model
o Describe students’ knowledge according to strengths and weaknesses
Cognitive Models
§ Theoretical maps of how people learn and organize content knowledge.
§ New things are learned most easily when they can be connected to existing knowledge.
§ Cognitive models are useful tools for guiding instruction and assessment
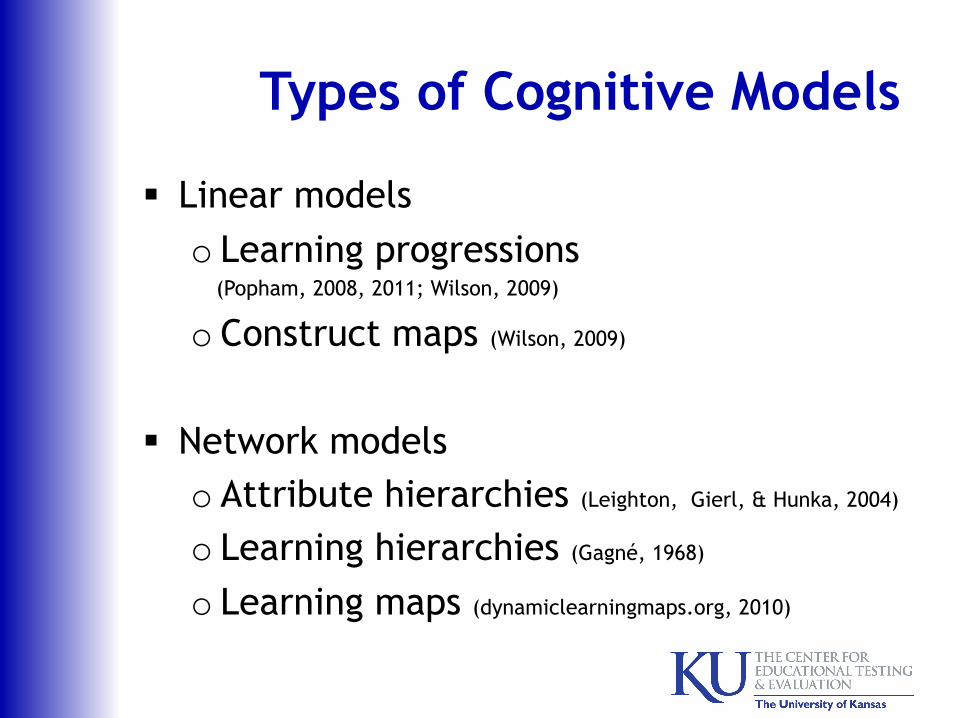
Types of Cognitive Models
§ Linear models o Learning progressions (Popham, 2008, 2011; Wilson, 2009)
o Construct maps (Wilson, 2009)
§ Network models o Attribute hierarchies (Leighton, Gierl, & Hunka, 2004)
o Learning hierarchies (Gagné, 1968)
o Learning maps (dynamiclearningmaps.org, 2010)
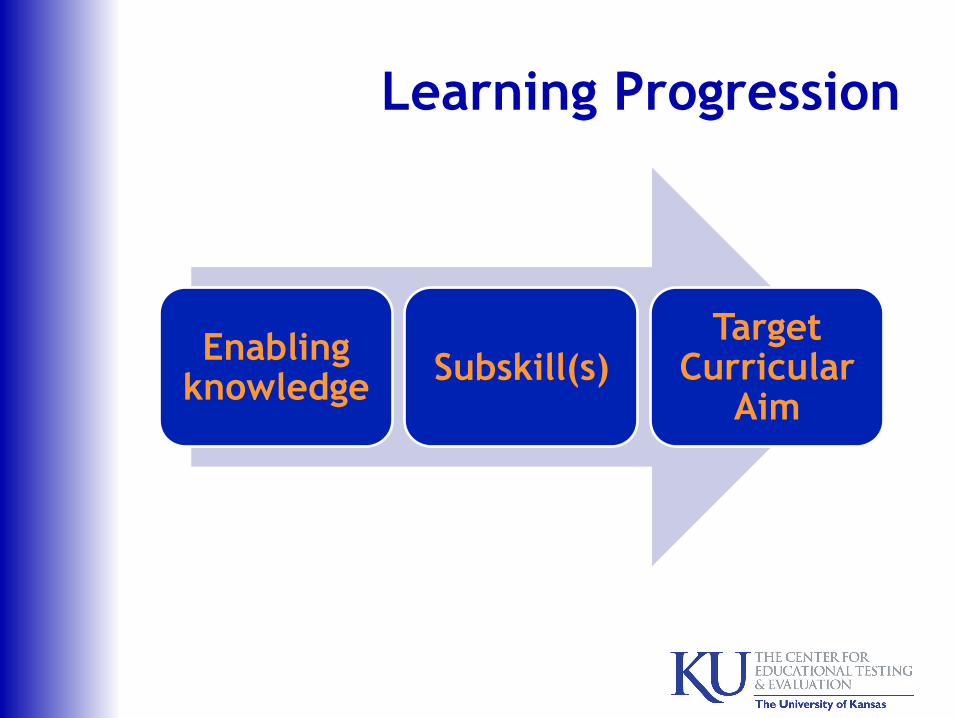
Learning Progression
Enabling knowledge Subskill(s)
Target Curricular
Aim
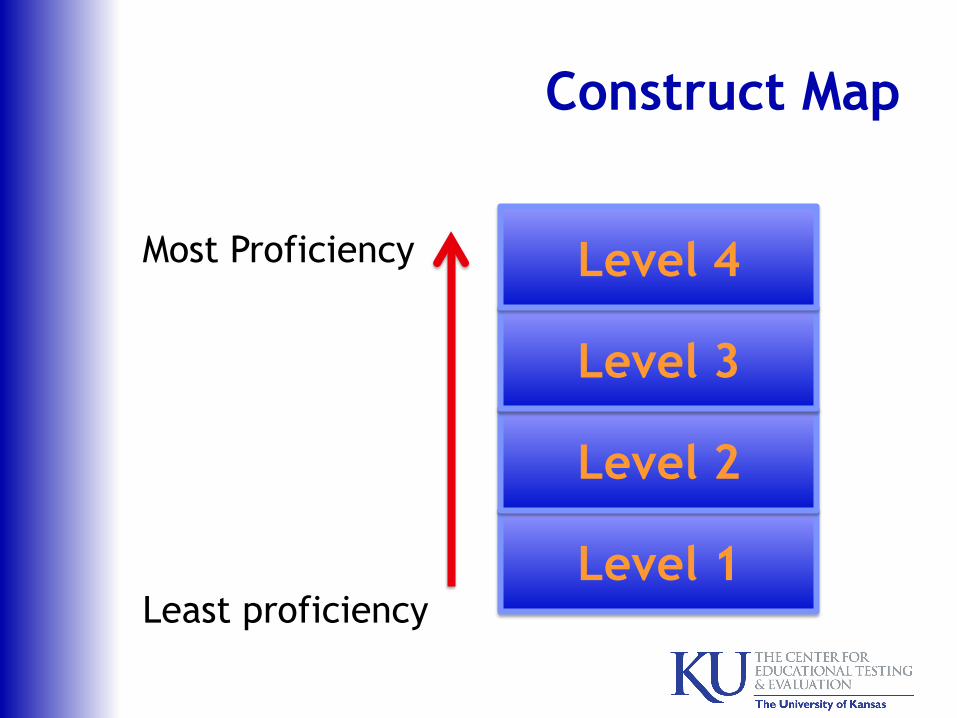
Construct Map
Most Proficiency
Least proficiency
Level 1
Level 2
Level 3
Level 4
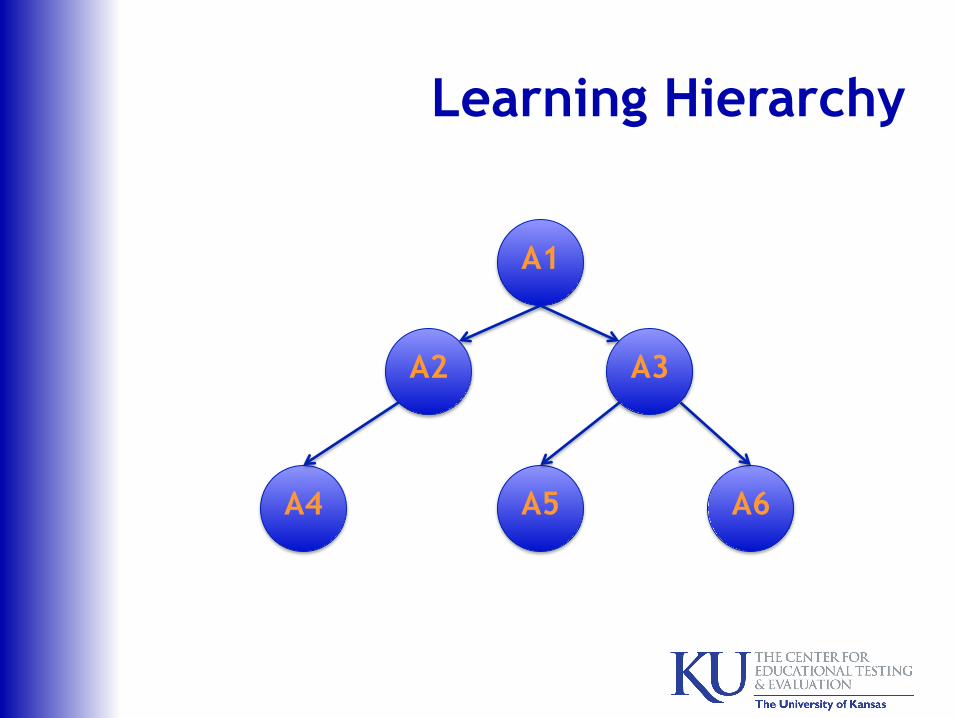
Learning Hierarchy
A1
A4 A5
A3
A6
A2
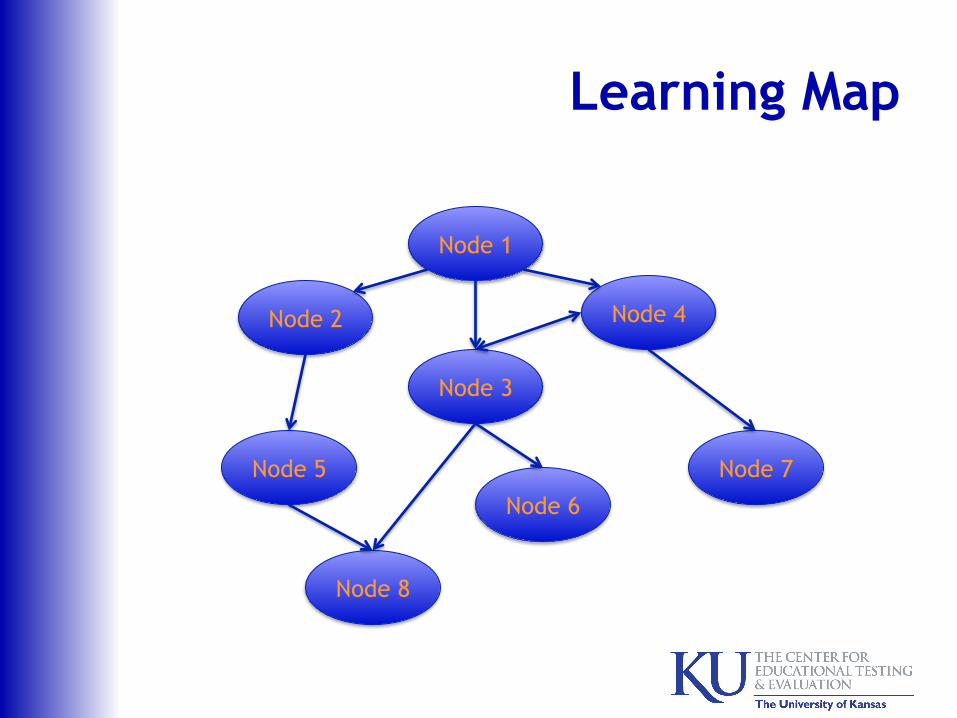
Learning Map
Node 2
Node 1
Node 5
Node 3
Node 8
Node 6
Node 7
Node 4
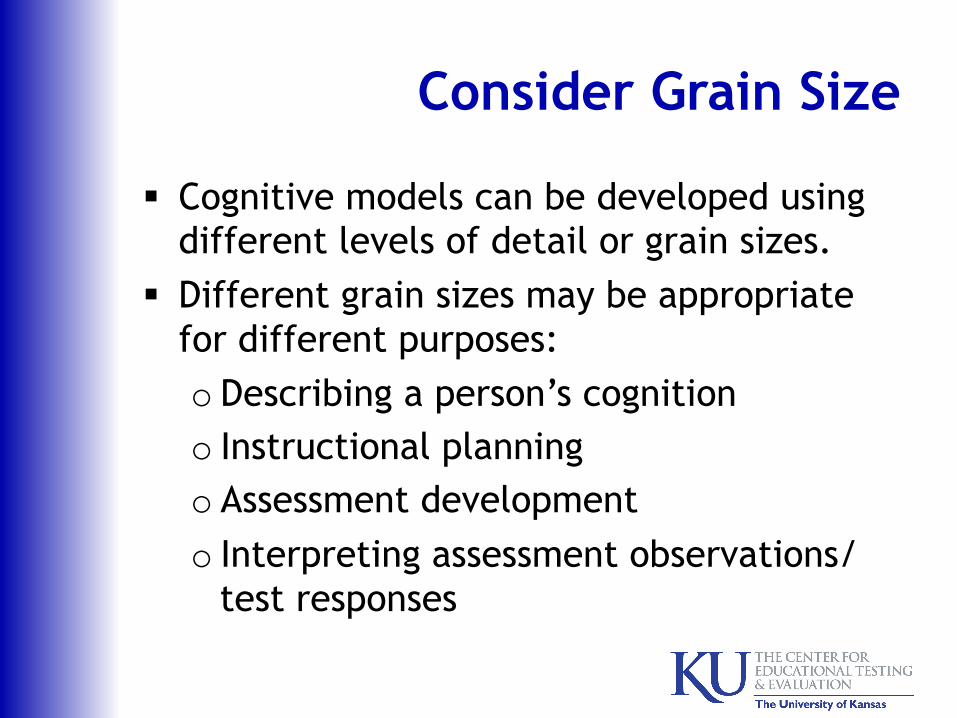
Consider Grain Size
§ Cognitive models can be developed using different levels of detail or grain sizes.
§ Different grain sizes may be appropriate for different purposes: o Describing a person’s cognition o Instructional planning o Assessment development o Interpreting assessment observations/
test responses
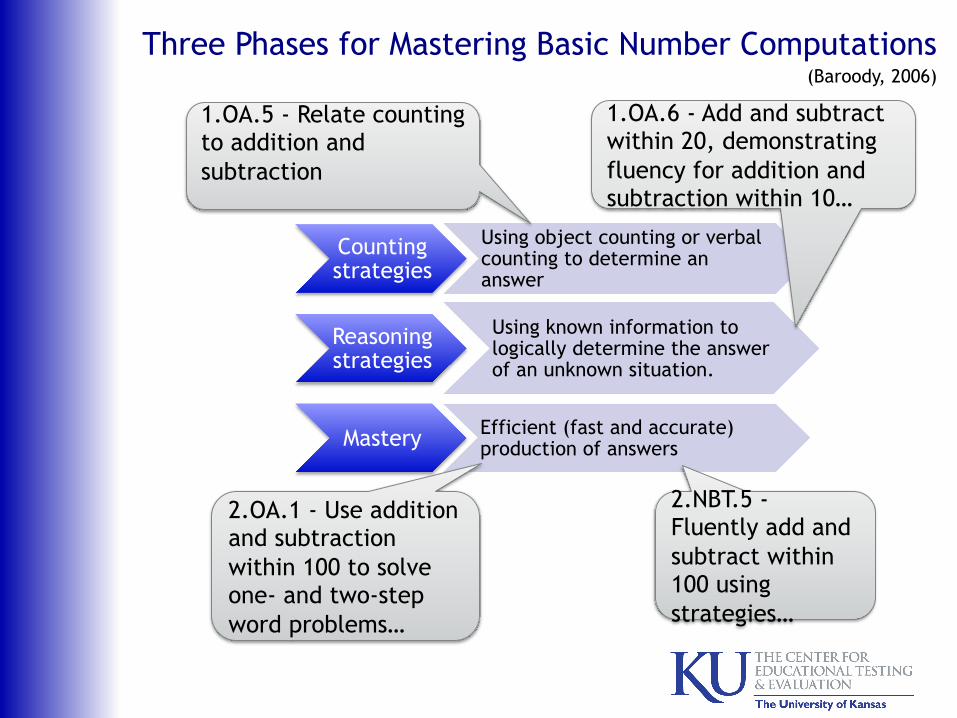
(Baroody, 2006)
Counting strategies
Using object counting or verbal counting to determine an answer
Reasoning strategies
Using known information to logically determine the answer of an unknown situation.
Mastery Efficient (fast and accurate) production of answers
2.NBT.5 - Fluently add and subtract within 100 using strategies…
2.OA.1 - Use addition and subtraction within 100 to solve one- and two-step word problems…
1.OA.5 - Relate counting to addition and subtraction
1.OA.6 - Add and subtract within 20, demonstrating fluency for addition and subtraction within 10…
Three Phases for Mastering Basic Number Computations
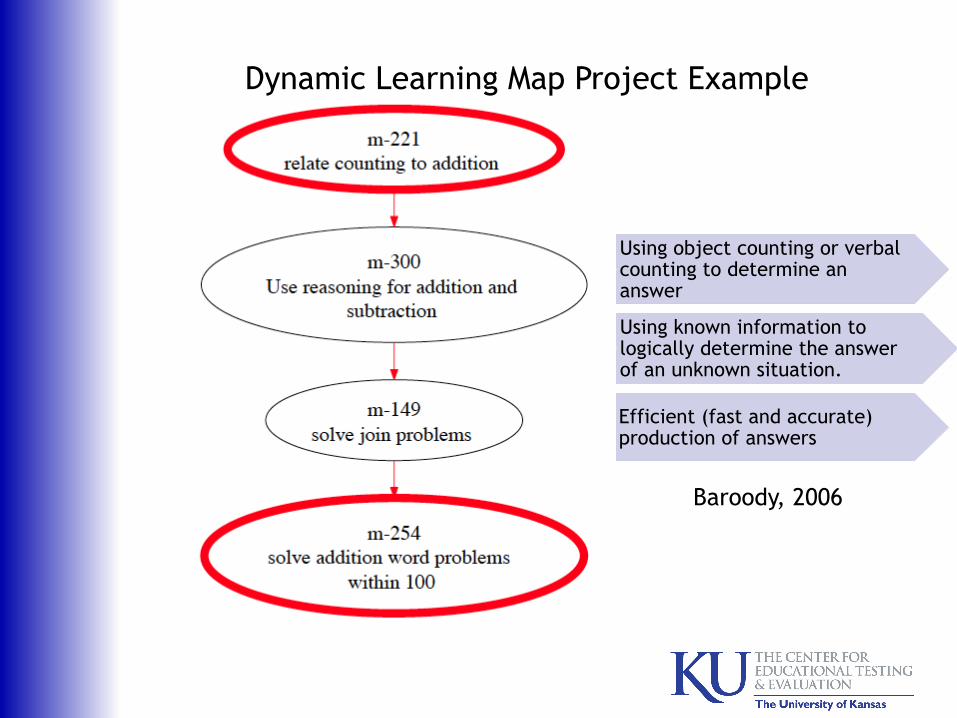
Counting strategies
Using object counting or verbal counting to determine an answer
Reasoning strategies
Using known information to logically determine the answer of an unknown situation.
Mastery Efficient (fast and accurate) production of answers
Baroody, 2006
Dynamic Learning Map Project Example
What do you think?
§ What grain size models are appropriate for tools used within the RtI process? o Assessment tools o Intervention goals
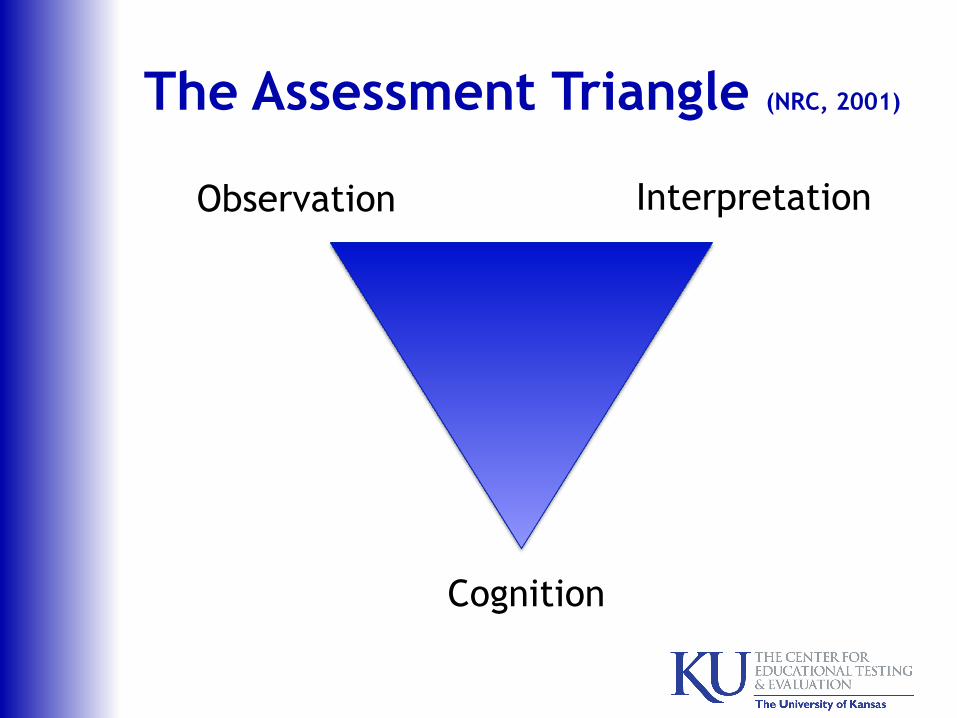
The Assessment Triangle (NRC, 2001)
Observation
Cognition
Interpretation
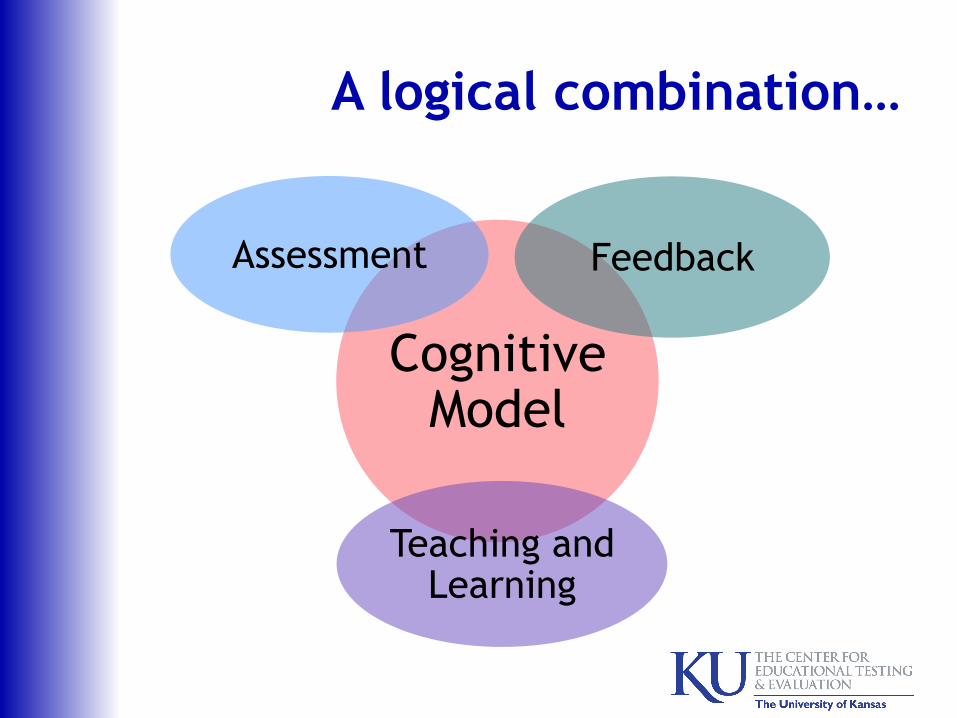
Cognitive Model
Teaching and Learning
Assessment Feedback
A logical combination…
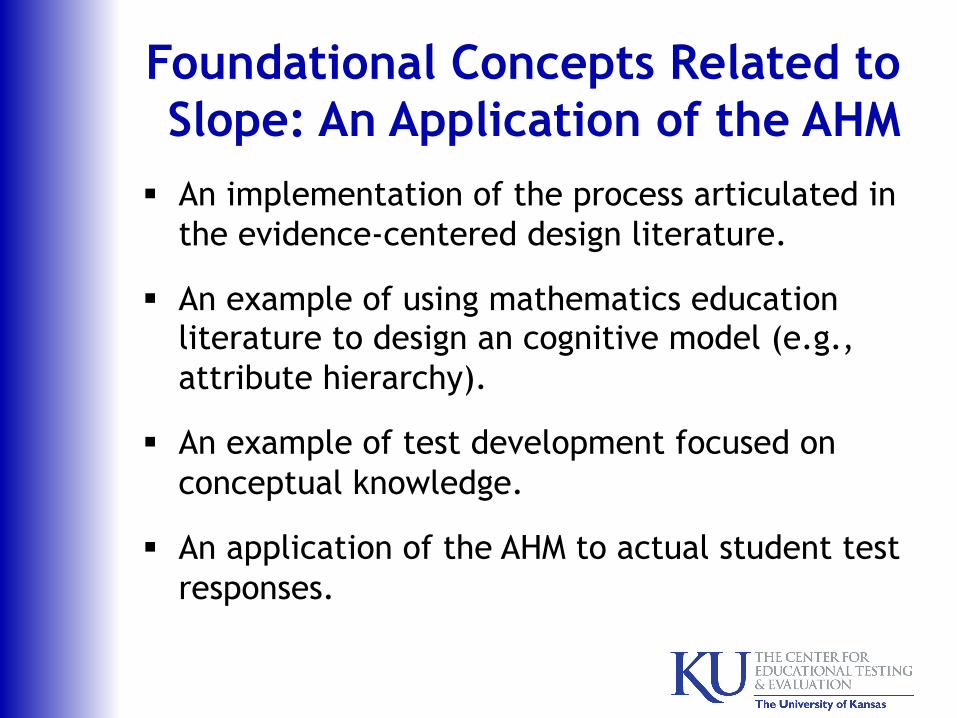
Foundational Concepts Related to Slope: An Application of the AHM
§ An implementation of the process articulated in the evidence-centered design literature.
§ An example of using mathematics education literature to design an cognitive model (e.g., attribute hierarchy).
§ An example of test development focused on conceptual knowledge.
§ An application of the AHM to actual student test responses.
Concepts § A concept is a cognitive representation of
something that is real (Ausubel, 1968; Bruner, Goodnow & Austin, 1956; Martorella, 1972).
§ Conceptions mature over time and experience (Martorella, 1972).
§ Concepts are classified in a variety of ways (Bruner, et al.1956; Henderson, 1970).
§ Concept learning is influenced by prior knowledge, thinking, and experience (Bruner, et al.,1956; Gagné, 1971; Inhelder & Piaget, 1964).
§ Misconceptions arise when flawed information or erroneous connections are associated with a concept (Glaser, 1986; Henderson, 1970).
§ Misconceptions may also be viewed as immature (Klausmeier, 1992; Wilson, 2009).
Slope is Essential Mathematics
§ Necessary to work with linear functions (National Mathematics Advisory Panel, 2008; NCTM, 2009)
§ Necessary for calculus and statistics (Wilhelm & Confrey, 2003)
§ “One of the most important mathematical concepts students encounter”
(Joram & Oleson, 2007)
Foundations for Understanding Slope § Covariational Reasoning (Adamson, 2005)
o Detecting which quantities are related in a mathematical situation
o Detecting the direction of the relationship in a variation problem
§ Proportional Reasoning (Kurtz & Karplus, 1979) o More than determining a missing number
o Detecting the constant rate that governs a proportional relationship and using the rate to reason about the quantities in the proportion
Sources of Misconceptions
§ Additive reasoning (Heller, Post, Behr, & Lesh, 1990)
§ Incorrect quantities identified for the slope ratio (Moritz, 2005)
§ Opposite slope (Barr, 1980)
§ Reciprocal slope (Barr, 1980)
§ Total amount confused with amount of change (Bell & Janvier, 1981)
§ Univariate reasoning (Moritz, 2005)
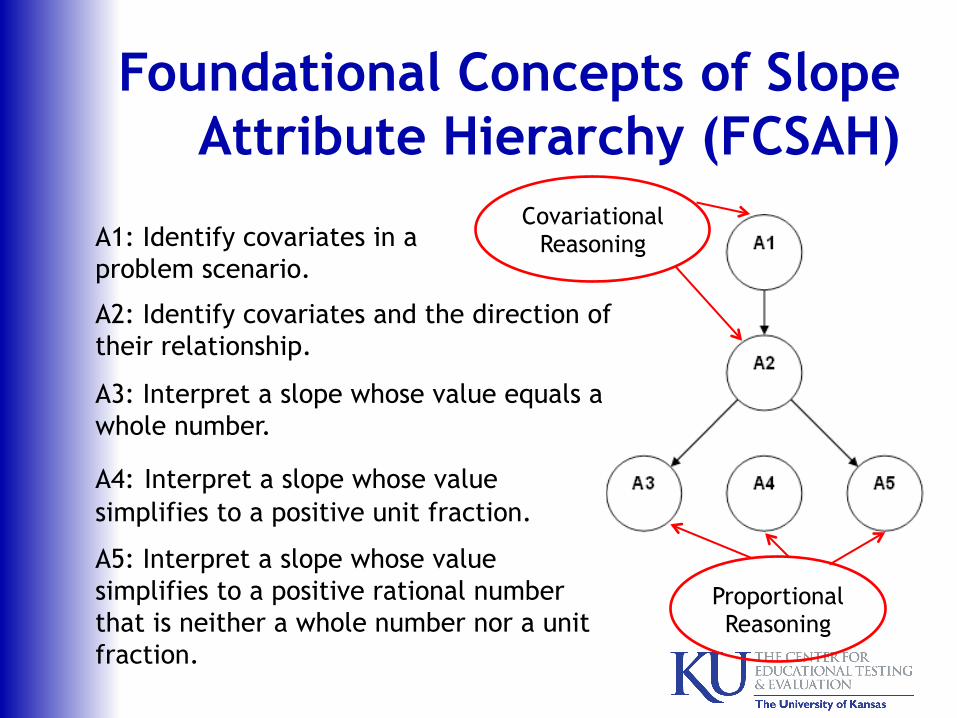
Foundational Concepts of Slope Attribute Hierarchy (FCSAH)
A1: Identify covariates in a problem scenario.
A2: Identify covariates and the direction of their relationship.
A3: Interpret a slope whose value equals a whole number.
A4: Interpret a slope whose value simplifies to a positive unit fraction.
A5: Interpret a slope whose value simplifies to a positive rational number that is neither a whole number nor a unit fraction.
Covariational Reasoning
Proportional Reasoning
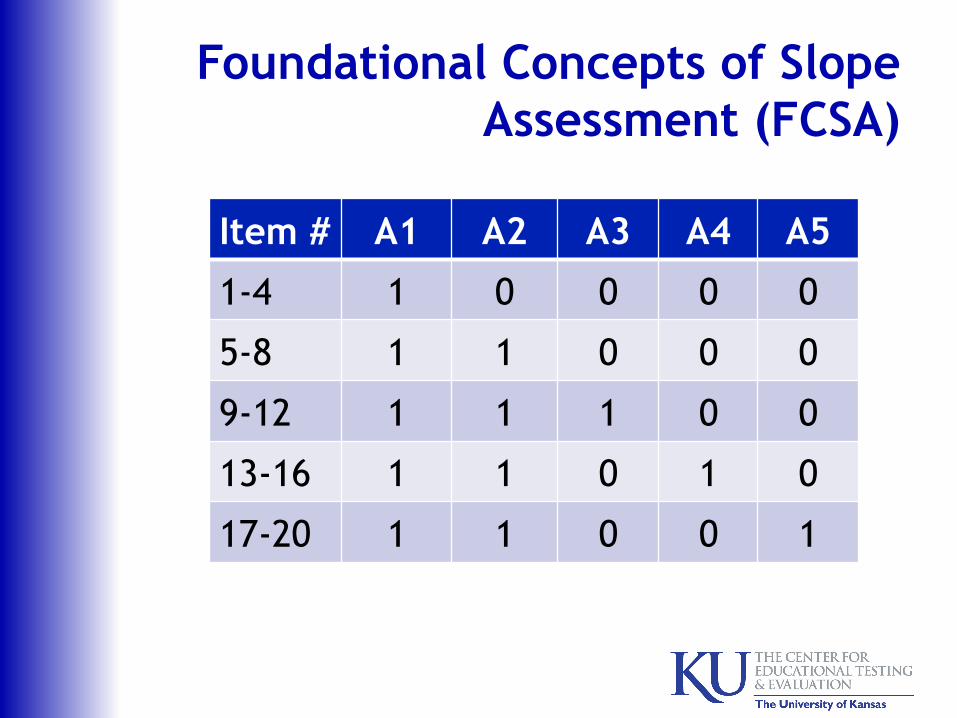
Foundational Concepts of Slope Assessment (FCSA)
Item # A1 A2 A3 A4 A5
1-4 1 0 0 0 0
5-8 1 1 0 0 0
9-12 1 1 1 0 0
13-16 1 1 0 1 0
17-20 1 1 0 0 1
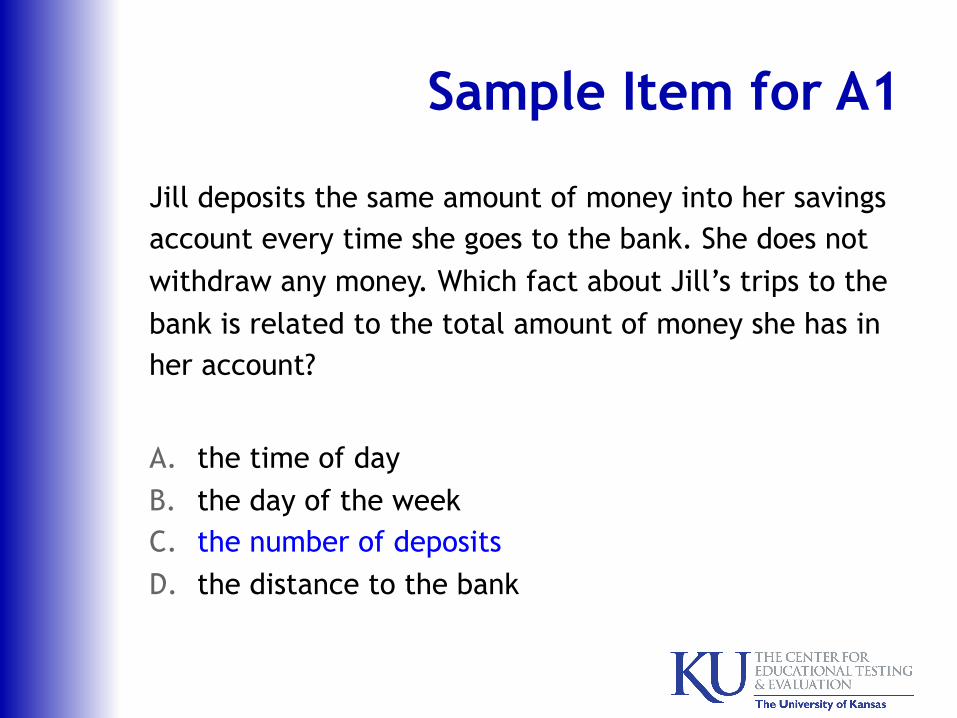
Sample Item for A1
Jill deposits the same amount of money into her savings account every time she goes to the bank. She does not withdraw any money. Which fact about Jill’s trips to the bank is related to the total amount of money she has in her account?
A. the time of day B. the day of the week C. the number of deposits D. the distance to the bank
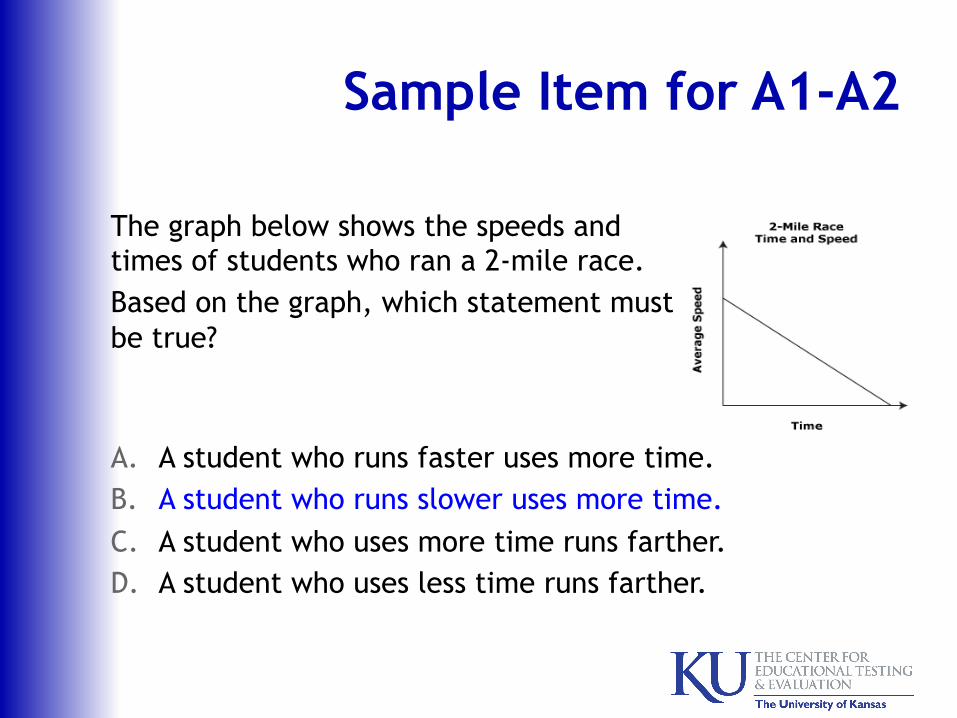
Sample Item for A1-A2
The graph below shows the speeds and times of students who ran a 2-mile race. Based on the graph, which statement must be true? A. A student who runs faster uses more time. B. A student who runs slower uses more time. C. A student who uses more time runs farther. D. A student who uses less time runs farther.
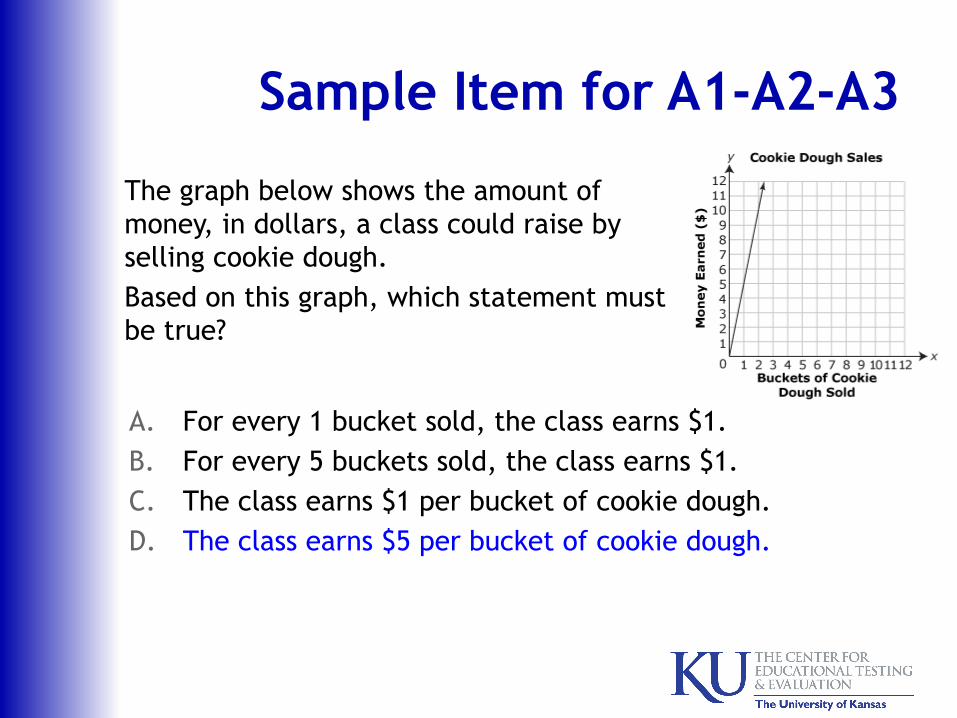
Sample Item for A1-A2-A3
The graph below shows the amount of money, in dollars, a class could raise by selling cookie dough. Based on this graph, which statement must be true?
A. For every 1 bucket sold, the class earns $1. B. For every 5 buckets sold, the class earns $1. C. The class earns $1 per bucket of cookie dough. D. The class earns $5 per bucket of cookie dough.
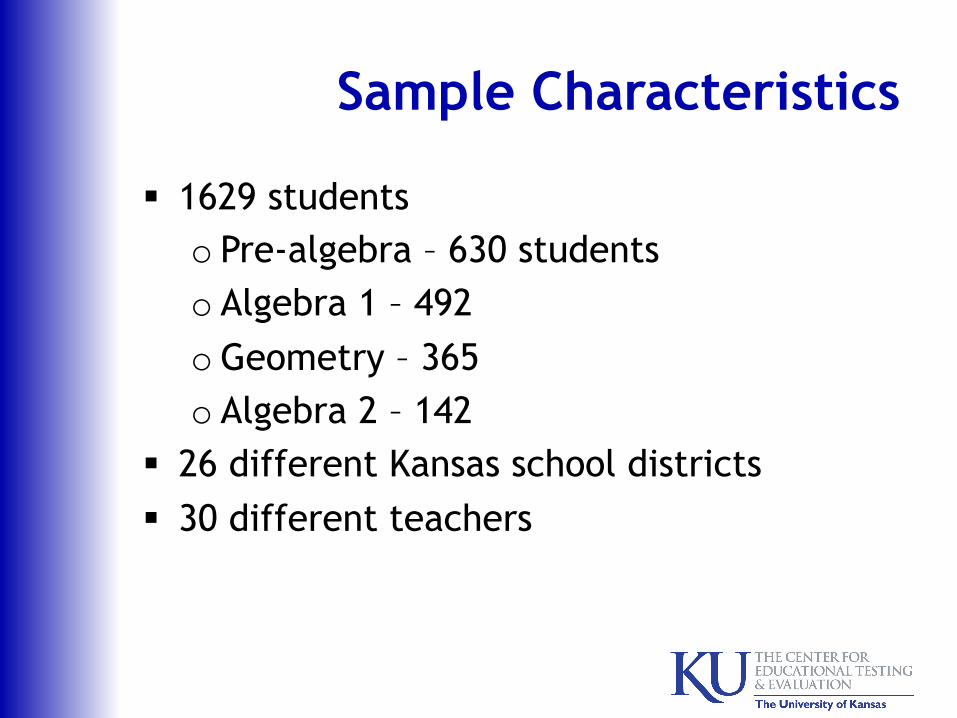
Sample Characteristics
§ 1629 students o Pre-algebra – 630 students o Algebra 1 – 492 o Geometry – 365 o Algebra 2 – 142
§ 26 different Kansas school districts § 30 different teachers
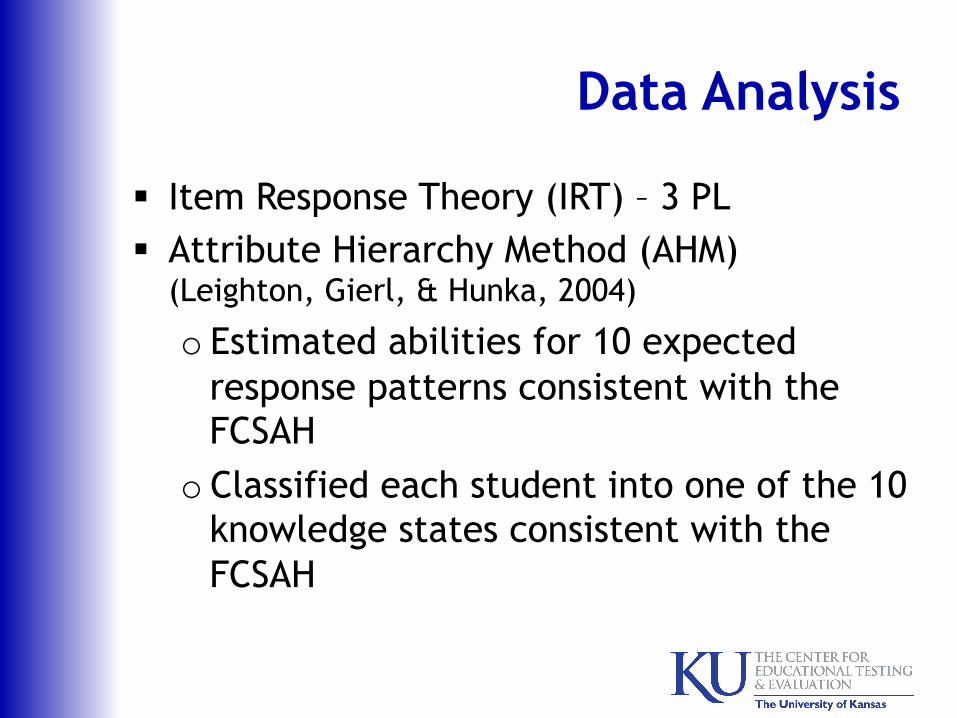
Data Analysis
§ Item Response Theory (IRT) – 3 PL § Attribute Hierarchy Method (AHM)
(Leighton, Gierl, & Hunka, 2004)
o Estimated abilities for 10 expected response patterns consistent with the FCSAH
o Classified each student into one of the 10 knowledge states consistent with the FCSAH
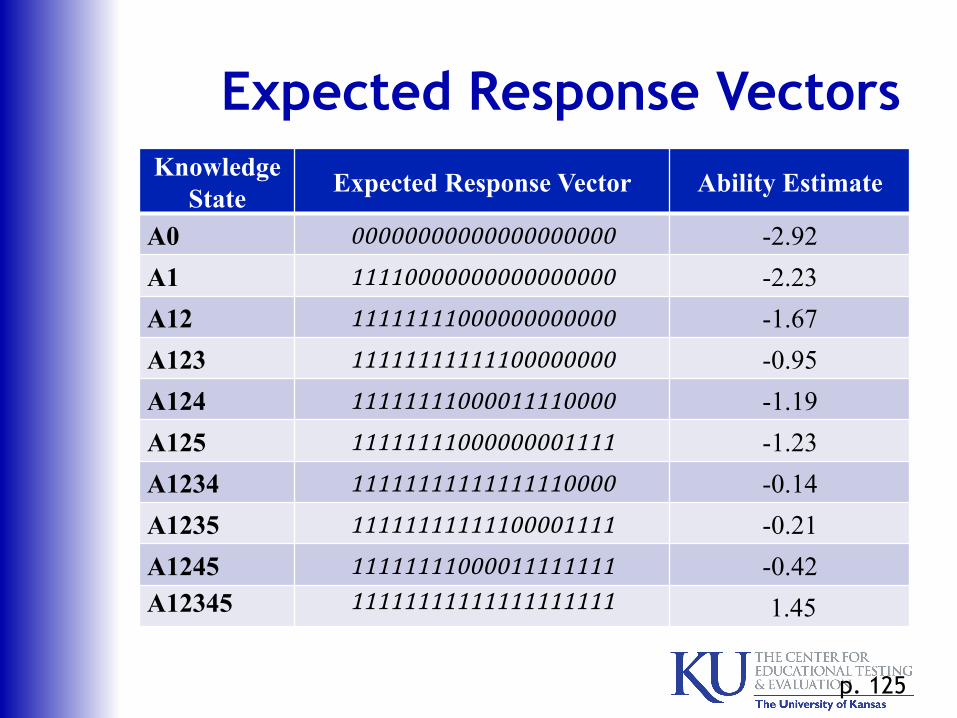
Expected Response Vectors Knowledge
State Expected Response Vector Ability Estimate
A0 00000000000000000000 -2.92 A1 11110000000000000000 -2.23 A12 11111111000000000000 -1.67 A123 11111111111100000000 -0.95 A124 11111111000011110000 -1.19 A125 11111111000000001111 -1.23 A1234 11111111111111110000 -0.14 A1235 11111111111100001111 -0.21 A1245 11111111000011111111 -0.42 A12345 11111111111111111111 1.45
p. 125
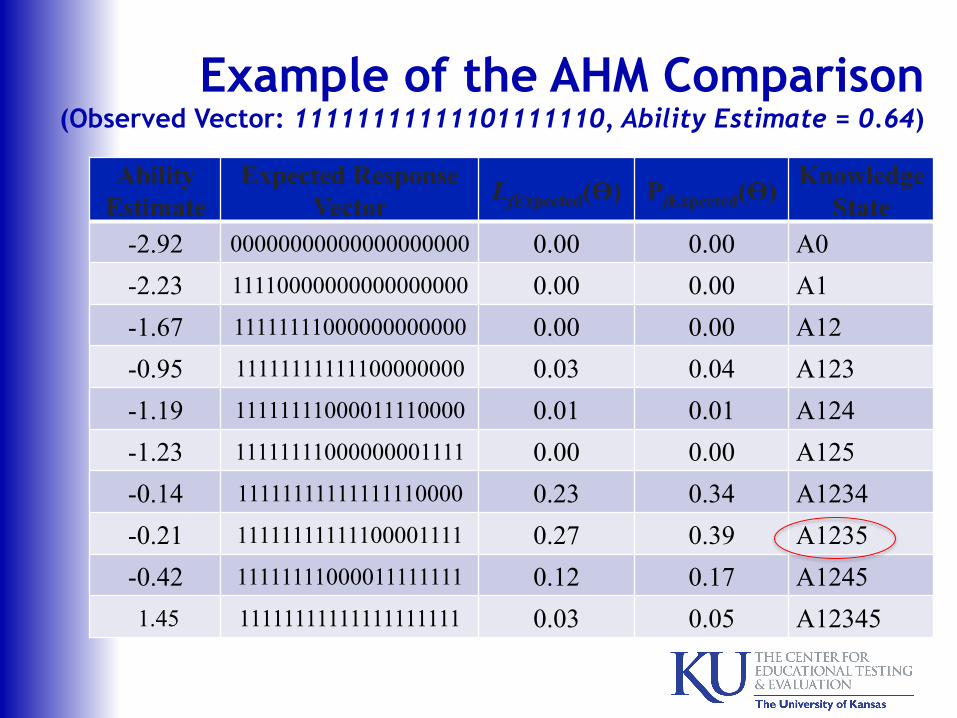
Example of the AHM Comparison (Observed Vector: 11111111111101111110, Ability Estimate = 0.64)
Ability Estimate
Expected Response Vector LjExpected(ϴ) PjExpected(ϴ) Knowledge
State -2.92 00000000000000000000 0.00 0.00 A0 -2.23 11110000000000000000 0.00 0.00 A1 -1.67 11111111000000000000 0.00 0.00 A12 -0.95 11111111111100000000 0.03 0.04 A123 -1.19 11111111000011110000 0.01 0.01 A124 -1.23 11111111000000001111 0.00 0.00 A125 -0.14 11111111111111110000 0.23 0.34 A1234 -0.21 11111111111100001111 0.27 0.39 A1235 -0.42 11111111000011111111 0.12 0.17 A1245 1.45 11111111111111111111 0.03 0.05 A12345
0
10
20
30
40
50
60
70
80
90
100
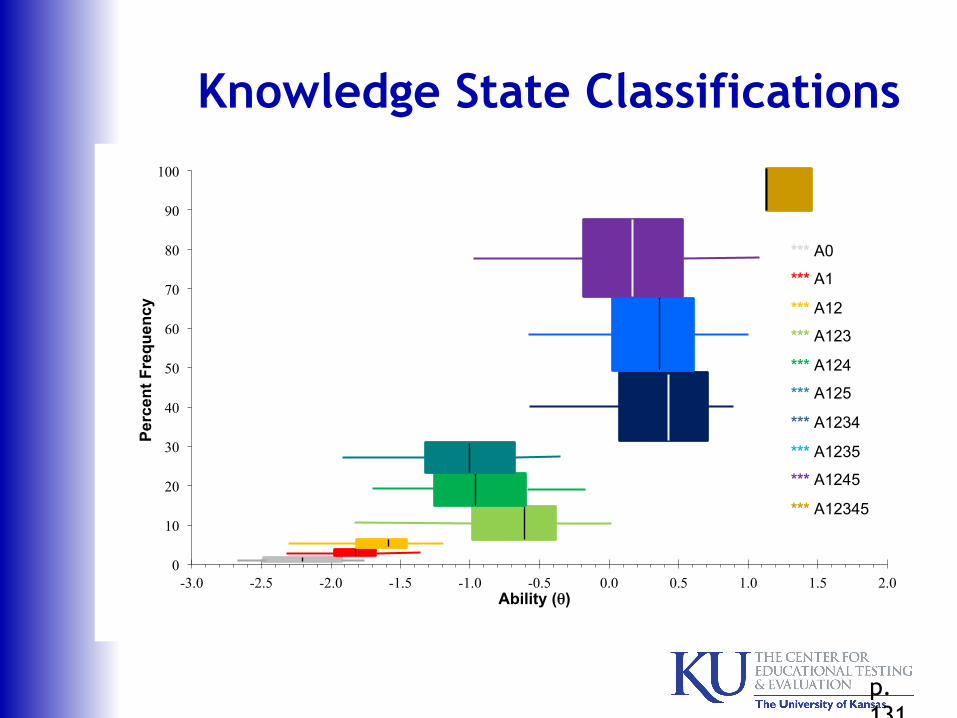
-3.0 -2.5 -2.0 -1.5 -1.0 -0.5 0.0 0.5 1.0 1.5 2.0
Perc
ent F
requ
ency
Ability (θ)
*** A0
*** A1
*** A12
*** A123
*** A124
*** A125
*** A1234
*** A1235
*** A1245
*** A12345
Knowledge State Classifications
p. 131
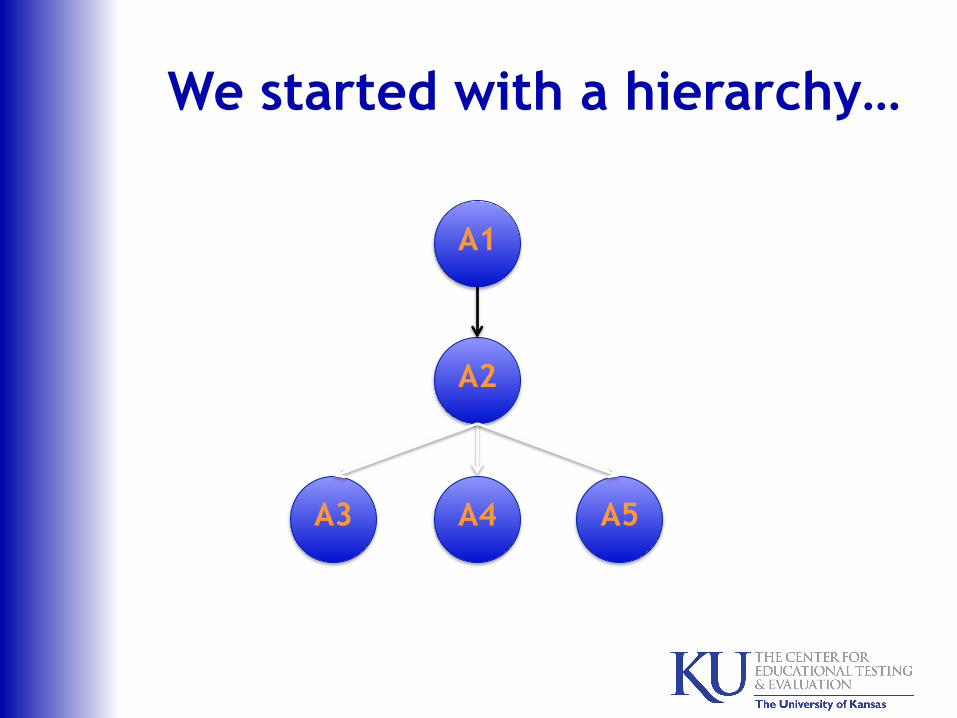
We started with a hierarchy…
A1
A4 A5 A3
A2
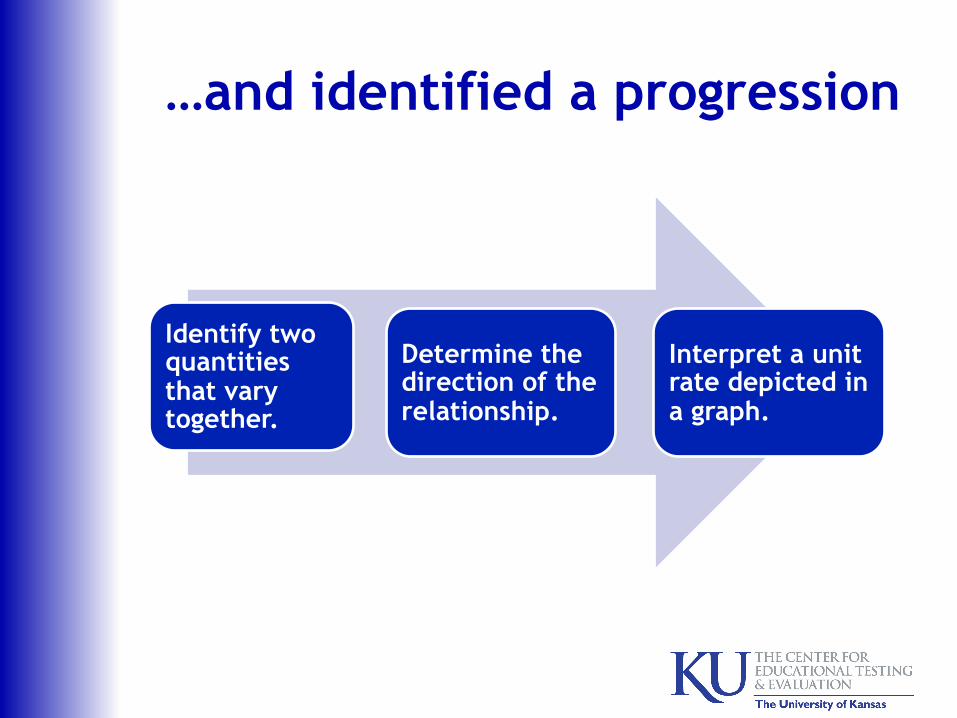
…and identified a progression
Identify two quantities that vary together.
Determine the direction of the relationship.
Interpret a unit rate depicted in a graph.
Recommendations
§ Mathematics education research should be consulted in to the development of theories and cognitive models used in assessment development.
§ Instructional planning, responses, and interventions should be sensitive to theories of how students learn.
§ Classroom assessments should be developed using the same theories about learning that guide instruction.
Cognitive Models and Curriculum
§ Should the cognitive model and assessment tools be associated directly with curriculum materials?
§ Is it possible to develop cognitive models
to guide instruction that are curriculum agnostic?
Grade Level Considerations
§ How far off grade level should assessments go in order to query prerequisite skills and understandings?
Professional Development
§ What professional development opportunities in what modalities should be developed for teachers to: o Acquaint them with models of how
students learn mathematics? o Help them plan instruction that is
sensitive to how students learn?
References Adamson, S. L. (2005). Student sense-making in an intermediate algebra classroom:
Investigating student understanding of slope. (Doctoral Dissertation). Available from ProQuest Dissertations and Theses database. (UMI No. 3166918)
Alves, C. (2012). Making Diagnostic Inferences about Student Performance on the Alberta Education Diagnostic Mathematics Project: An Application of the Attribute Hierarchy Method. Ph.D. dissertation, University of Alberta (Canada), Canada. Retrieved April 22, 2012, from Dissertations & Theses: Full Text.(Publication No. AAT NR81451).
Ausubel, D. P. (1968). Educational psychology: A cognitive view. New York, NY: Holt, Rinehart and Winston, Inc.
Baroody, A. (2006). Why children have difficulties mastering the basic number combinations and how to help them. Teaching Children Mathematics, 13(1), 22-31.
Barr, G. (1980). Graphs, gradients and intercepts. Mathematics in School, 9(1), 5-6. Bell, A., & Janvier, C. (1981). The interpretation of graphs representing situations. For
the Learning of Mathematics, 2(1), 34-42. Bruner, J. S., Goodnow, J. J., & Austin, G. A. (1956). A study of thinking. New York, NY:
John Wiley & Sons, Inc. DiBello, L, Roussos, L. & Stout, W. (2007) Review of Cognitively Diagnostic
Assessment and a Summary of Psychometric Models, Handbook of Statistics, Vol. 26.
References Dynamic Learning Maps (2010). Retrieved from www.dynamiclearningmaps.org. Gagné, R. (1968). Learning hierarchies. Educational Psychologist, 6, 1-9. Gagné, R. (1971). Gagné on the learning of mathematics: A product orientation. In D. B.
Aichele & R. E. Reys (Eds.), Readings in secondary school mathematics. Boston, MA: Prindle, Weber & Schmidt, Inc.
Glaser, R. (1986). The integration of instruction and testing. Paper presented at the Redesign of Testing for the 21st Century: Proceedings of the 1985 ETS Invitational Conference, New York, NY.
Heller, P. M., Post, T. R., Behr, M., & Lesh, R. (1990). Qualitative and numerical reasoning about fractions and rates by seventh- and eighth-grade students. Journal for Research in Mathematics Education, 21(5), 388-402.
Henderson, K. B. (1970). Concepts. In M. F. Rosskopf (Ed.), The teaching of secondary school mathematics: Thirty-third yearbook (pp. 166-195). Washington, D.C.: NCTM.
Inhelder, B., & Piaget, J. (1964). The early growth of logic in the child: Classification and seriation. New York, NY: Harper & Row.
Joram, E., & Oleson, V. (2007). How fast do trees grow: Using tables and graphs to explore slope. Mathematics Teacher, 13(5), 260-265.
References Klausmeier, H. J. (1992). Concept learning and concept teaching. Educational
Psychologist, 27(3), 267. Kurtz, B., & Karplus, R. (1979). Intellectual development beyond elementary school VII:
Teaching for proportional reasoning. School Science and Mathematics, 79(5), 387-398.
Leighton, J. P., Gierl, M. J., & Hunka, S. M. (2004). The attribute hierarchy method for cognitive assessment: A variation on Tatsuoka's rule-space approach. Journal of Educational Measurement, 41(3), 205-237.
Martorella, P. H. (1972). Concept learning: Designs for instruction. Scranton, PA: Intext Educational Publishers.
Moritz, J. (2005). Reasoning about covariation. In D. Ben-Zvi & J. Garfield (Eds.), The challenge of developing statistical literacy, reasoning and thinking (pp. 227-255). Netherlands: Springer.
National Mathematics Advisory Panel. (2008). Summary of foundations for success: The final report. Retrieved from http://www.ride.ri.gov.
National Research Council. (2001). Knowing What Students Know: The Science and Design of Educational Assessment: The National Academies Press.
NCTM. (2009). Focus in high school mathematics: Reasoning and sense making. Reston, VA: Author.
References Popham, W. J. (2008). Transformative assessment. Alexandria, VA: Association for
Supervision and Curriculum Development. Popham, W. J. (2011). Transformative assessment in action: An inside look at applying
the process. Alexandria, VA: ASCD. Wilhelm, J. A., & Confrey, J. (2003). Projecting rate of change in the context of motion
onto the context of money. International Journal of Mathematical Education in Science & Technology, 34(6), 887-904.
Wilson, M. (2009). Measuring progressions: Assessment structures underlying a learning progression. Journal of Research in Science Teaching, 46(6), 716-730.
References § Ardoin, S. P. & Christ, T. J. (2009). Curriculum-based measurement of oral reading:
Standard errors associated with progress monitoring outcomes from DIBELS, AIMSweb, and an experimental passage set. School Psychology Review, 38, 266–283.
§ Christ, T. J., Scullin, S., Tolbize, A., & Jiban, C. L. (2008). Implications of recent research : Curriculum-based measurement of math computation. Assessment for Effective Intervention, 33, 198-205. doi: 10.1177/1534508407313480
§ Foegen, A., Jiban, C., & Deno, S. (2007). Progress monitoring measures in mathematics: A review of the literature. Journal of Special Education, 41, 121- 139. doi: 10.1177/1534508407313479
§ Lembke, E. S., Foegen, A., Whittaker, T. A., & Hampton, D. (2008). Establishing technically adequate measures of progress in early numeracy. Assessment for Effective Intervention, 33, 206-214. doi: 10.1177/1534508407313479
§ Tran, L., Sanchez, T., Arellano, B., & Swanson, H. L. (2011). A meta-analys DOI: 10.1177/1534508407313480 is of the RTI literature for children at risk for reading disabilities. Journal of Learning Disabilities, 44, 283–295. doi: 10.1177/0022219410378447
§ Monaghen, B., Christ, T. J., Van Norman, Ethan R., & Zopluoglu, C. (2012, February). Curriculum Based Measurement of oral Reading (CBM-R): Evaluation of trend line growth estimates, Symposium presented at the annual conference for the National Association of School Psychologists, Philadelphia, PA.
§ Yeo, S., Fearrington, J. Y., & Christ, T. J. (2011). Relation between CBM-R and CBM-MR slopes: An application of latent growth modeling. Assessment for Effective Intervention, published online 4 October 2011. doi: 10.1177/1534508411420129