Embed Size (px)
Citation preview
U.S. DEPARTMENT OF EDUCATIONNCES 2010-003
Educational Technology in Public School Districts: Fall 2008
First Look

This page intentionally left blank.
NCES 2010-003U.S. DEPARTMENT OF EDUCATION
Educational Technology in Public School Districts: Fall 2008
First Look
DECEMBER 2009
Lucinda GrayLaurie LewisWestat
Peter TiceProject OfficerNational Center for Education Statistics

U.S. Department of EducationArne DuncanSecretary
Institute of Education SciencesJohn Q. EastonDirector
National Center for Education StatisticsStuart KerachskyDeputy Commissioner
The National Center for Education Statistics (NCES) is the primary federal entity for collecting, analyzing, and reporting data related to education in the United States and other nations. It fulfills a congressional mandate to collect, collate, analyze, and report full and complete statistics on the condition of education in the United States; conduct and publish reports and specialized analyses of the meaning and significance of such statistics; assist state and local education agencies in improving their statistical systems; and review and report on education activities in foreign countries.
NCES activities are designed to address high-priority education data needs; provide consistent, reliable, complete, and accurate indicators of education status and trends; and report timely, useful, and high-quality data to the U.S. Department of Education, the Congress, the states, other education policymakers, practitioners, data users, and the general public. Unless specifically noted, all information contained herein is in the public domain.
We strive to make our products available in a variety of formats and in language that is appropriate to a variety of audiences. You, as our customer, are the best judge of our success in communicating information effectively. If you have any comments or suggestions about this or any other NCES product or report, we would like to hear from you. Please direct your comments to
National Center for Education Statistics Institute of Education Sciences U.S. Department of Education 1990 K Street NW Washington, DC 20006-5651
December 2009
The NCES World Wide Web Home Page address is http://nces.ed.gov.The NCES World Wide Web Electronic Catalog address is http://nces.ed.gov/pubsearch.
Suggested CitationGray, L., and Lewis, L. (2009). Educational Technology in Public School Districts: Fall 2008 (NCES 2010–003). National Center for Education Statistics, Institute of Education Sciences, U.S. Department of Education. Washington, DC.
For ordering information on this report, write to
U.S. Department of Education ED Pubs P.O. Box 22207 Alexandria, VA 22304
or call toll free 1-877-4ED-Pubs or order online at http://www.edpubs.gov.
Content ContactPeter Tice(202) [email protected]

iii
Acknowledgments
The authors would like to recognize the respondents from public school districts who provided data
on educational technology upon which the report is based. We also thank the sponsors from the Office of
Educational Technology.

This page intentionally left blank.

v
Contents
Page
Acknowledgments ...................................................................................................................... iii
List of Tables .............................................................................................................................. vi
Appendix A Tables ..................................................................................................................... vii
Appendix B Tables ...................................................................................................................... viii
First Look Summary ................................................................................................................... 1
Introduction ........................................................................................................................ 1
Selected Findings ............................................................................................................... 2
Tables ......................................................................................................................................... 5
Related Reports .......................................................................................................................... 21
Appendix A: Standard Error Tables ........................................................................................... A-1
Appendix B: Technical Notes .................................................................................................... B-1
Appendix C: Questionnaire ........................................................................................................ C-1
vi
List of Tables
Table Page
1. Percent of public school districts with local area (school-level) network(s), percent
with a district network, and of those with a district network, percent connected to
the Internet, by district characteristics: Fall 2008 ........................................................... 5
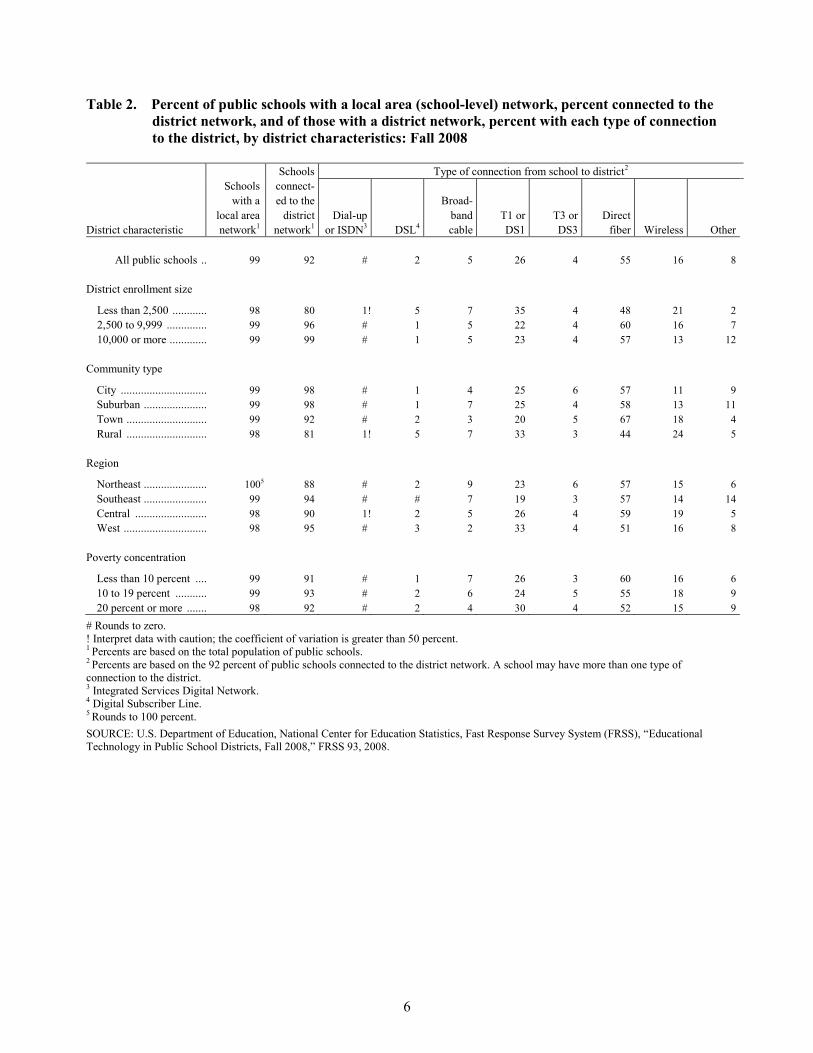
2. Percent of public schools with a local area (school-level) network, percent
connected to the district network, and of those with a district network, percent with
each type of connection to the district, by district characteristics: Fall 2008 ................. 6
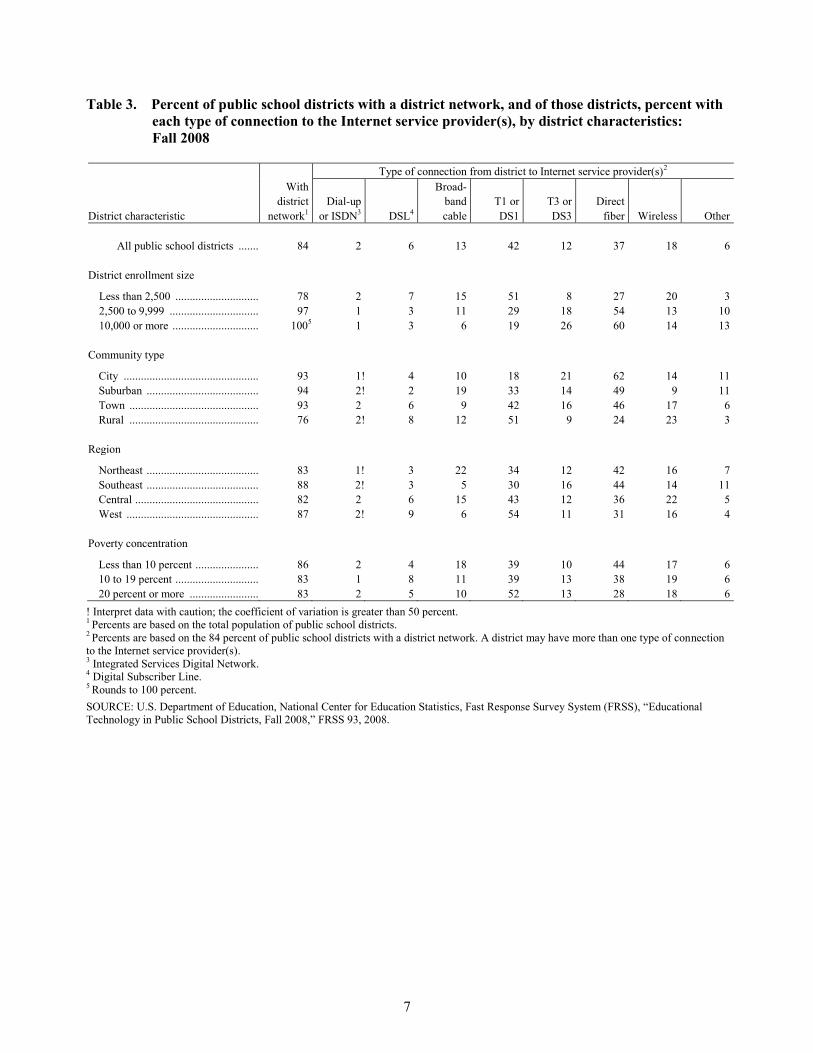
3. Percent of public school districts with a district network, and of those districts,
percent with each type of connection to the Internet service provider(s),
by district characteristics: Fall 2008 ............................................................................... 7
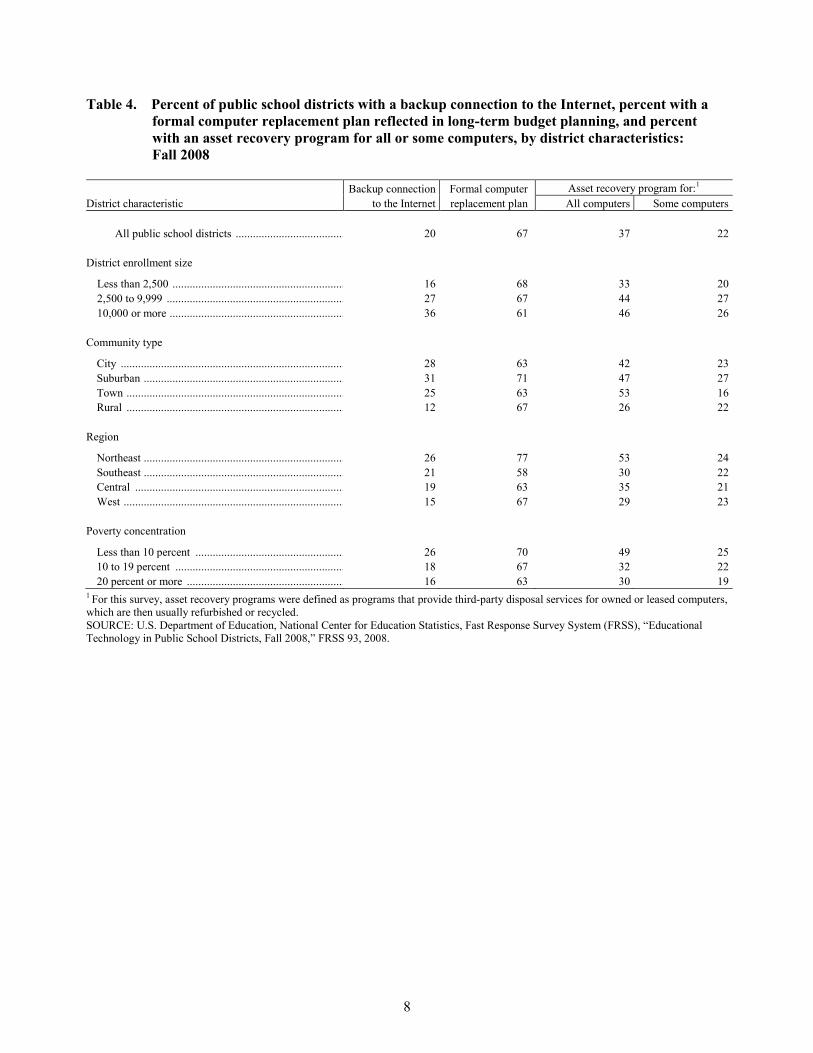
4. Percent of public school districts with a backup connection to the Internet, percent
with a formal computer replacement plan reflected in long-term budget planning,
and percent with an asset recovery program for all or some computers, by district
characteristics: Fall 2008 ................................................................................................ 8
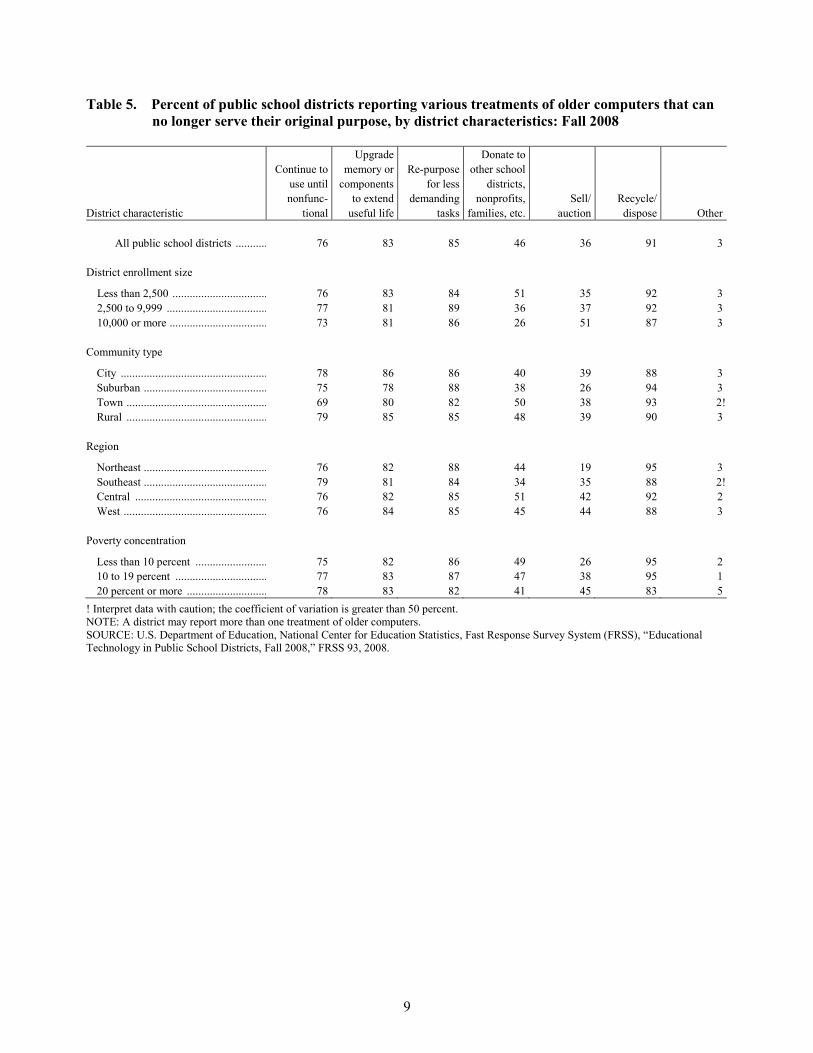
5. Percent of public school districts reporting various treatments of older computers
that can no longer serve their original purpose, by district characteristics: Fall 2008 .... 9
6. Percent of public school districts offering various technology resources to all or
some elementary school or secondary school teachers, by district characteristics:
Fall 2008 ......................................................................................................................... 10
7. Percent of public school districts offering various technology resources to all or
some elementary school or secondary school students, by district characteristics:
Fall 2008 ......................................................................................................................... 12
8. Percent of public school districts with written policies on acceptable student use for
specific types of technology, by district characteristics: Fall 2008 ................................. 14
9. Percent of public school districts keeping various types of student data in an
electronic data system, by district characteristics: Fall 2008 .......................................... 15
10. Percentage distribution of public school districts reporting whether they employ an
individual responsible for educational technology leadership full or part time, by
district characteristics: Fall 2008 .................................................................................... 16
11. Percent of public school districts offering teacher professional development and
percent requiring teachers to take professional development in various educational
technology topics, by district characteristics: Fall 2008 ................................................. 17
12. Percentage distribution of public school districts reporting agreement or
disagreement with various statements on using educational technology in the
instructional program in the district, by district characteristics: Fall 2008 ..................... 19
vii
Appendix A Tables Table Page
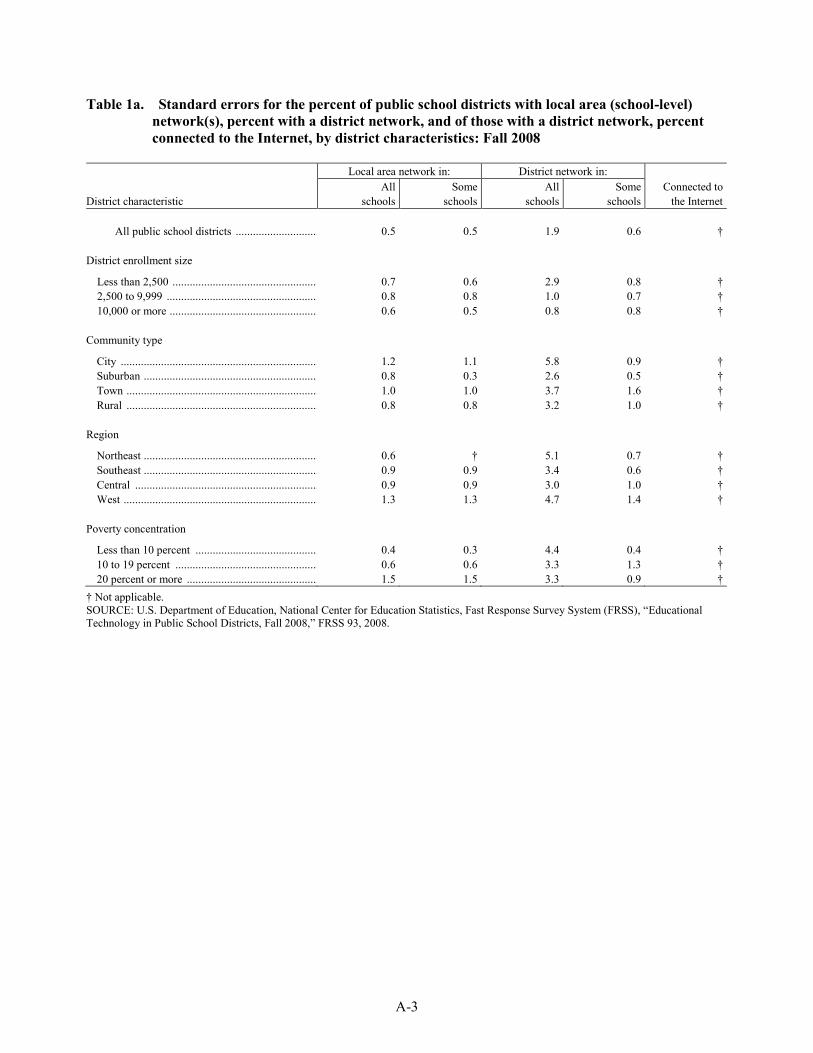
1a. Standard errors for the percent of public school districts with local area (school-
level) network(s), percent with a district network, and of those with a district
network, percent connected to the Internet, by district characteristics: Fall 2008 .......... A-3
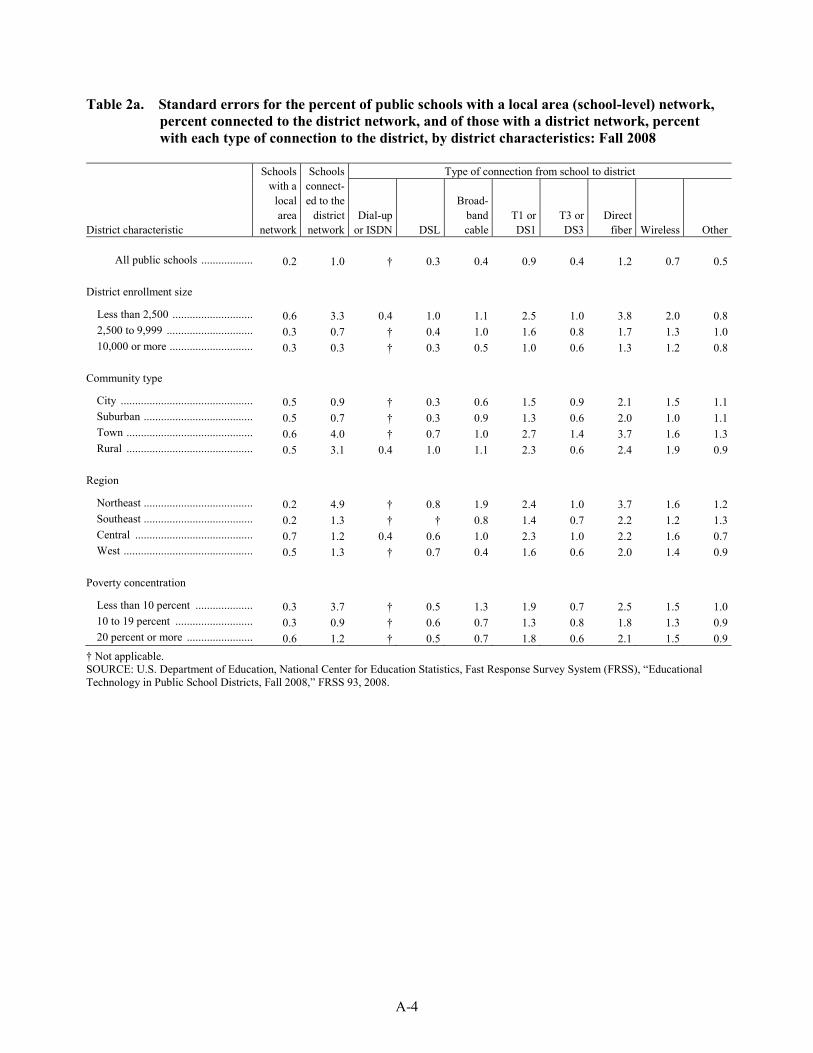
2a. Standard errors for the percent of public schools with a local area (school-level)
network, percent connected to the district network, and of those with a district
network, percent with each type of connection to the district, by district
characteristics: Fall 2008 ................................................................................................ A-4
3a. Standard errors for the percent of public school districts with a district network, and
of those districts, percent with each type of connection to the Internet service
provider(s), by district characteristics: Fall 2008 ............................................................ A-5
4a. Standard errors for the percent of public school districts with a backup connection to
the Internet, percent with a formal computer replacement plan reflected in long-term
budget planning, and percent with an asset recovery program for all or some
computers, by district characteristics: Fall 2008 ............................................................. A-6
5a. Standard errors for the percent of public school districts reporting various treatments
of older computers that can no longer serve their original purpose, by district
characteristics: Fall 2008 ................................................................................................ A-7
6a. Standard errors for the percent of public school districts offering various technology
resources to all or some elementary school or secondary school teachers, by district
characteristics: Fall 2008 ................................................................................................ A-8
7a. Standard errors for the percent of public school districts offering various technology
resources to all or some elementary school or secondary school students, by district
characteristics: Fall 2008 ................................................................................................ A-10
8a. Standard errors for the percent of public school districts with written policies on
acceptable student use for specific types of technology, by district characteristics:
Fall 2008 ......................................................................................................................... A-12
9a. Standard errors for the percent of public school districts keeping various types of
student data in an electronic data system, by district characteristics: Fall 2008 ............. A-13
10a. Standard errors for the percentage distribution of public school districts reporting
whether they employ an individual responsible for educational technology
leadership full or part time, by district characteristics: Fall 2008 ................................... A-14
11a. Standard errors for the percent of public school districts offering teacher
professional development and percent requiring teachers to take professional
development in various educational technology topics, by district characteristics:
Fall 2008 ......................................................................................................................... A-15
12a. Standard errors for the percentage distribution of public school districts reporting agreement or disagreement with various statements on using educational technology
in the instructional program in the district, by district characteristics: Fall 2008 ........... A-17
viii
Appendix B Tables Table Page
B-1. Number and percent of responding public school districts in the study sample, and
estimated number and percent of public school districts the sample represents,
by district characteristics: Fall 2008 ................................................................................ B-4
B-2. Percent of cases with imputed data in the study sample, and percent of cases with
imputed data the sample represents, by questionnaire item: Fall 2008 ............................ B-5
1
First Look Summary
Introduction This report provides national data on the availability and use of educational technology in public school
districts during fall 2008. The data are the results of a national district-level survey that is one of a set that
includes district, school, and teacher surveys on educational technology. Every year between 1994 and 2005
(with the exception of 2004), the Office of Educational Technology (OET) in the U.S. Department of
Education asked the National Center for Education Statistics (NCES) to conduct a survey of public schools to
track access to information technology in schools and classrooms. NCES used its Fast Response Survey
System (FRSS) to conduct these surveys. For fall 2008, this OET-sponsored technology study was redesigned
and expanded to incorporate surveys at the district, school, and teacher levels. These three surveys provide
complementary information and together cover a broader range of topics than would be possible with one
survey alone. Prior to 2008, the surveys focused on computer and Internet access and use, as well as
procedures to prevent student access to inappropriate material on the Internet and teacher professional
development on technology use.1 The set of 2008 surveys collected data on availability and use for a range of
educational technology resources, such as district and school networks, computers, devices that enhance the
capabilities of computers for instruction, and computer software. They also collected information on leadership
and staff support for educational technology within districts and schools. During the design phase for the 2008 study, research was conducted to determine how specific topics and
survey questions should be distributed across the three surveys. The surveys were developed to reflect how
information on educational technology is kept within most public school systems. This report presents results
from the district-level survey, including information on networks and Internet capacity, technology policies,
district-provided resources, teacher professional development, and district-level leadership for technology. The
district survey covers the following specific topics:
Number of schools in the district with a local area network connecting computers within the school;
District networks connecting schools to the district and the number of schools with each type of district
network connection;
Types of connections from districts to Internet service providers and backup connections to the Internet;
Formal computer replacement plans, asset recovery programs (i.e., third-party disposal services) for
computers, and treatment of older computers that can no longer serve their original purposes;
Types of technology resources that districts offer to elementary and secondary teachers and students;
Written policies on acceptable student use of various technologies;
Types of student data kept in an electronic data system;
Employment of an individual responsible for educational technology leadership;
Teacher professional development offered or required by districts in various educational technology
topics; and
Opinions of district respondents about statements related to the use of educational technology in the
instructional program in the district.
1 A list of related reports from the 1994 through 2005 FRSS technology surveys of public schools may be found on page 21.
2
The questionnaire instructed districts to answer the survey using fall 2008 information and provided the
following definitions to be used when answering the survey.
Technology: Information technology such as computers, devices that can be attached to computers
(e.g., LCD projector, interactive whiteboard, digital camera), networks (e.g., Internet, local networks),
and computer software. We specifically are not including non-computer technologies such as
overhead projectors and VCRs.
Asset recovery program: Asset recovery programs provide third-party disposal services for owned or
leased computers, which are then usually refurbished or recycled.
Blogs: Websites where an individual or group creates a running log of entries that can be read by
other users, such as in a journal. Wikis: Collaborative websites that allow users to freely create and edit web page content (e.g.,
Wikipedia). Social networking websites: Online social networks for communities of people who share interests
and activities or who are interested in exploring the interests and activities of others (e.g., Facebook,
MySpace). NCES in the Institute of Education Sciences conducted this FRSS survey in fall 2008. FRSS is a survey
system designed to collect small amounts of issue-oriented data from a nationally representative sample of
districts, schools, or teachers with minimal burden on respondents and within a relatively short period of time.
Questionnaires were mailed to approximately 1,600 public school districts in the 50 states and the District of
Columbia. The unweighted survey response rate was 92 percent and the weighted response rate was 90
percent. The survey weights were adjusted for questionnaire nonresponse and the data were then weighted to
yield national estimates that represent all public school districts in the United States. Because the purpose of this report is to introduce new NCES data through the presentation of tables containing
descriptive information, only selected findings are presented. These findings have been chosen to demonstrate
the range of information available from the FRSS study rather than to discuss all of the observed differences;
they are not meant to emphasize any particular issue. The findings are based on self-reported data from public
school districts. All specific statements of comparisons made in the bullets have been tested for statistical significance at the
.05 level using Student’s t-statistics to ensure that the differences are larger than those that might be expected
due to sampling variation. Adjustments for multiple comparisons were not included. Many of the variables
examined are related to one another, and complex interactions and relationships have not been explored.
Tables of standard error estimates are provided in appendix A. Detailed information about the survey
methodology is provided in appendix B, and the questionnaire can be found in appendix C.
Selected Findings This section presents key findings on educational technology in public school districts in fall 2008.
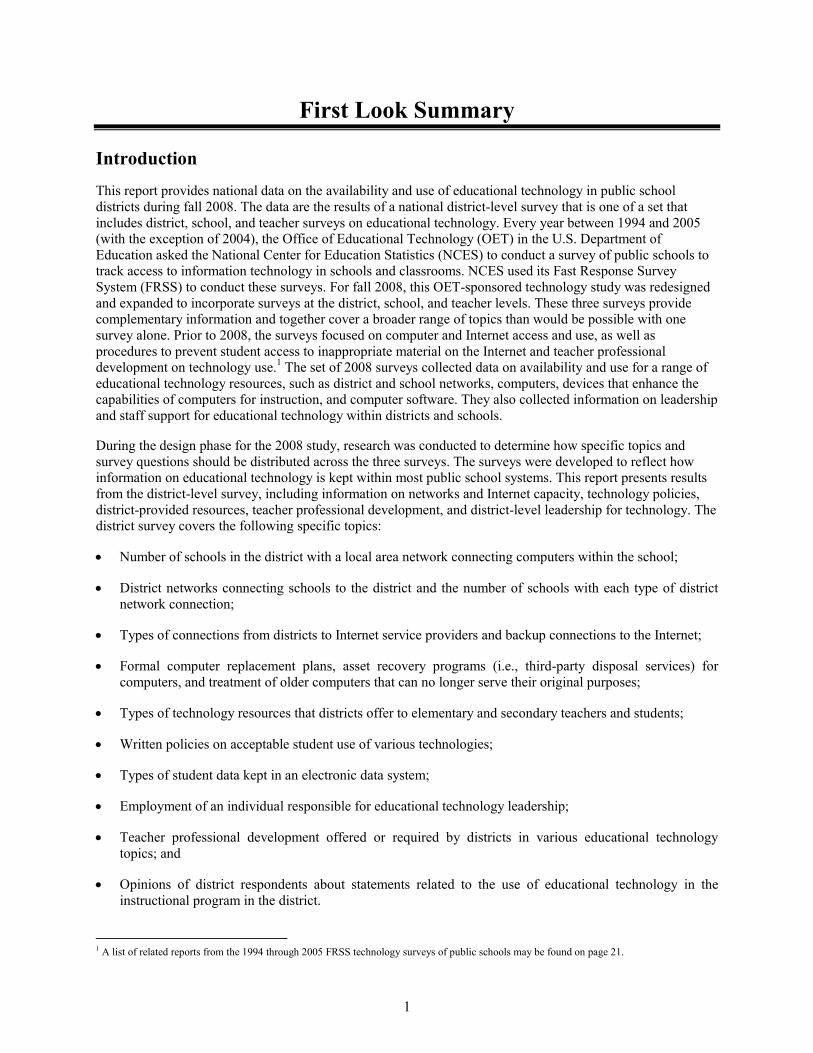
Districts reported information on local area networks connecting computers within a school, district
networks connecting schools to the district, and connections to the Internet. Ninety-seven percent of
districts had a local area network in all schools and 2 percent had it in some schools (table 1). Eighty-one
percent of districts provided a district network to all schools and 3 percent provided it to some schools. Of
the districts surveyed, 100 percent of those with a district network were connected to the Internet.2
2 Data on Internet connections were collected only from districts with district networks.
3
Districts reported that 92 percent of public schools were connected to a district network (table 2). Among
these schools, the types of connections from schools to districts included direct fiber (55 percent), T1 or
DS1 lines (26 percent), and wireless connections (16 percent).3
Among the 84 percent of districts with a district network, the types of connections from districts to
Internet service provider(s) included T1 or DS1 lines (42 percent), direct fiber (37 percent), wireless
connections (18 percent), broadband cable (13 percent), and T3 or DS3 lines (12 percent) (table 3). Direct
fiber connections were reported by a larger percentage of city districts than by suburban, town, or rural
districts (62 percent versus 49 percent, 46 percent, and 24 percent, respectively). Relatively more rural
districts than city districts reported T1 or DS1 connections (51 percent versus 18 percent).
Sixty-seven percent of districts had a formal computer replacement plan reflected in long-term budget
planning (table 4). An asset recovery program for computers was used by 37 percent of districts for all
computers and by 22 percent for some computers. Districts treated older computers that could no longer
serve their original purpose by recycling or disposing (91 percent), re-purposing for less demanding tasks
(85 percent), and upgrading memory or components to extend useful life (83 percent) (table 5).
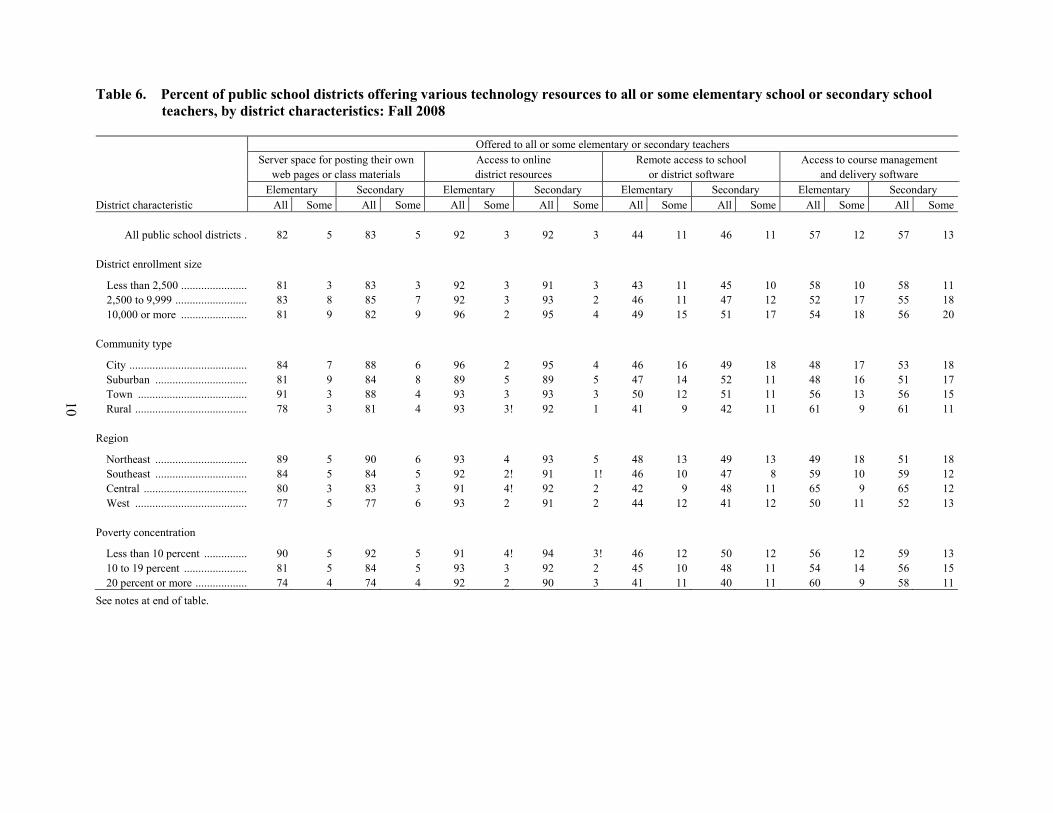
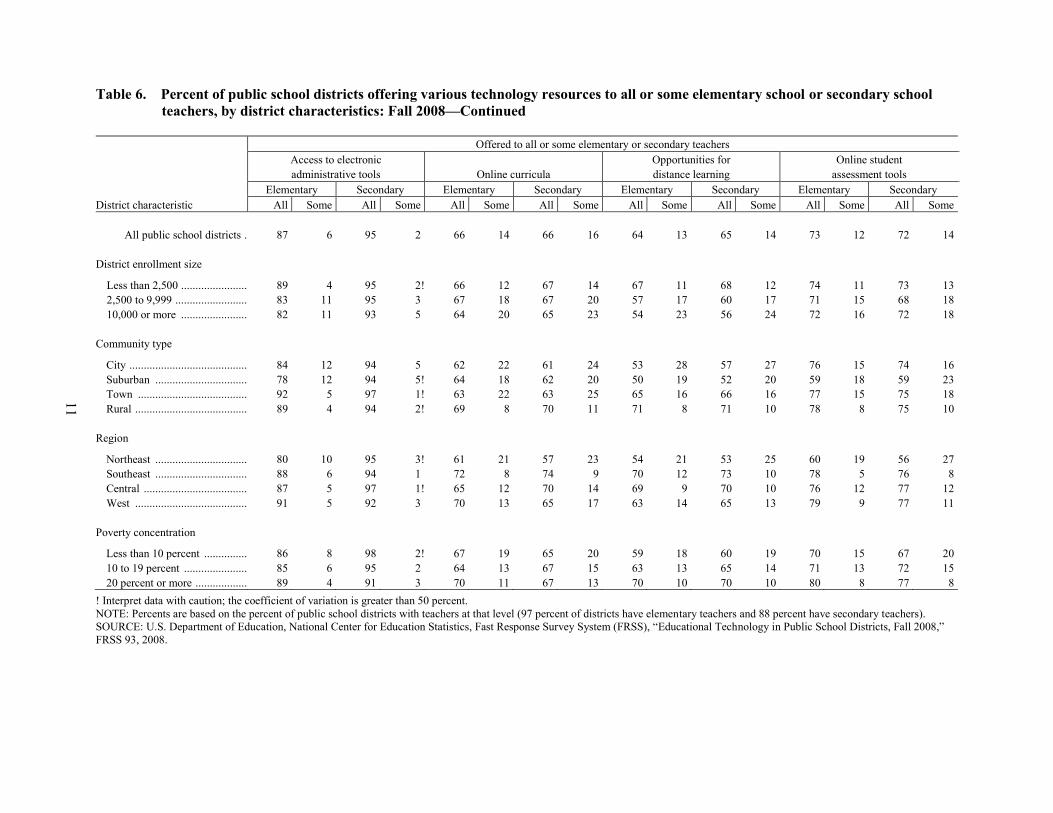
The percentage of districts that offered access to online district resources to all elementary or all secondary
teachers was 92 percent (table 6). The percentage that offered access to electronic administrative tools to
all teachers was 87 percent for elementary and 95 percent for secondary. The percentage that offered
server space for posting web pages or class materials to all teachers was 82 percent for elementary and 83
percent for secondary.
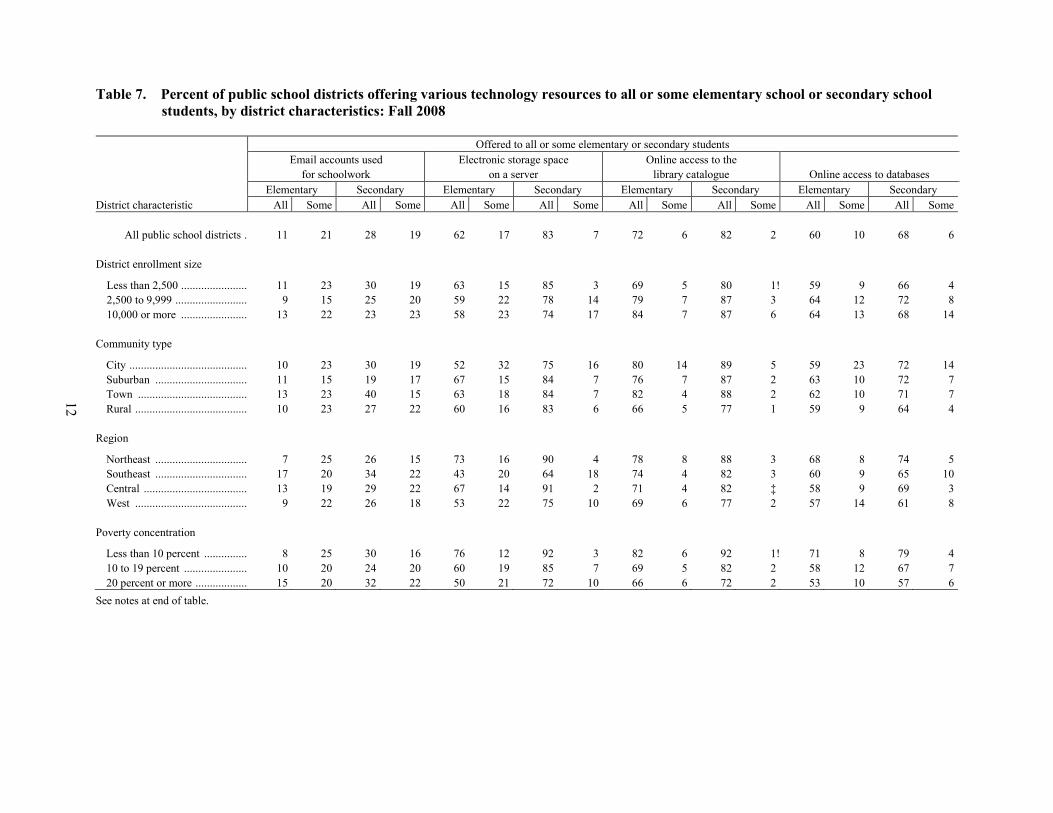
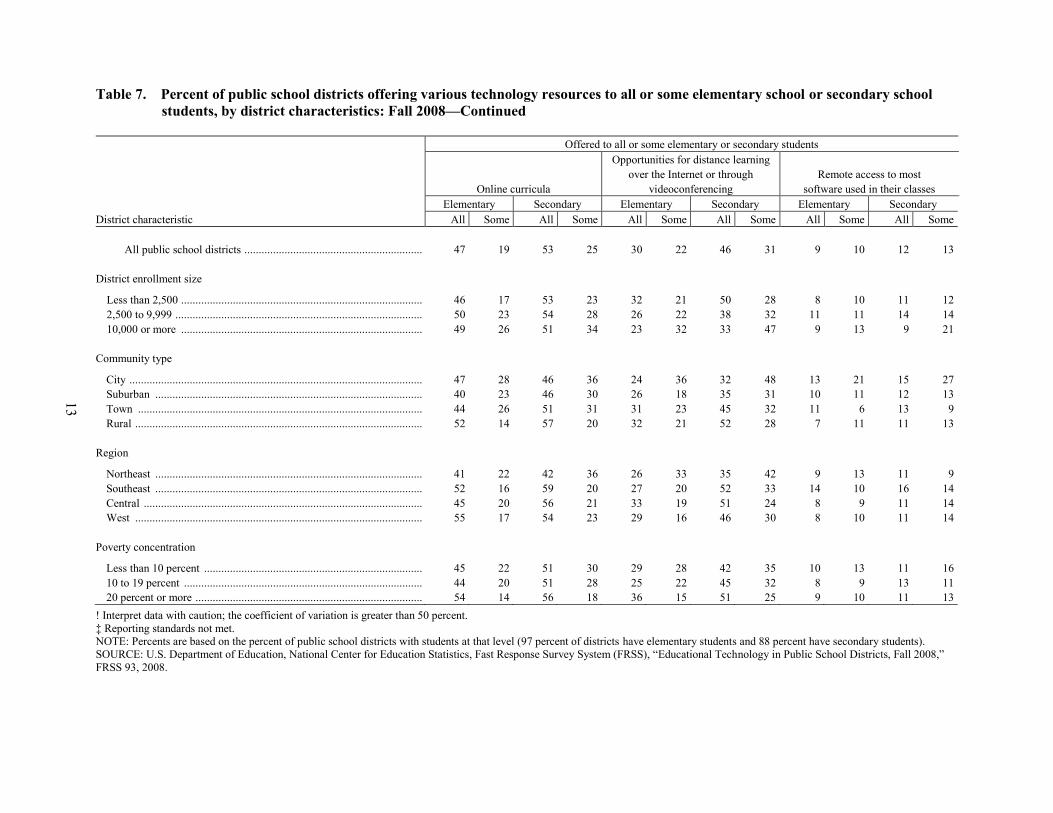
The percentage of districts that offered online access to the library catalogue to all students was 72 percent
for elementary and 82 percent for secondary (table 7). The percentage that offered electronic storage space
on a server to all students was 62 percent for elementary and 83 percent for secondary.
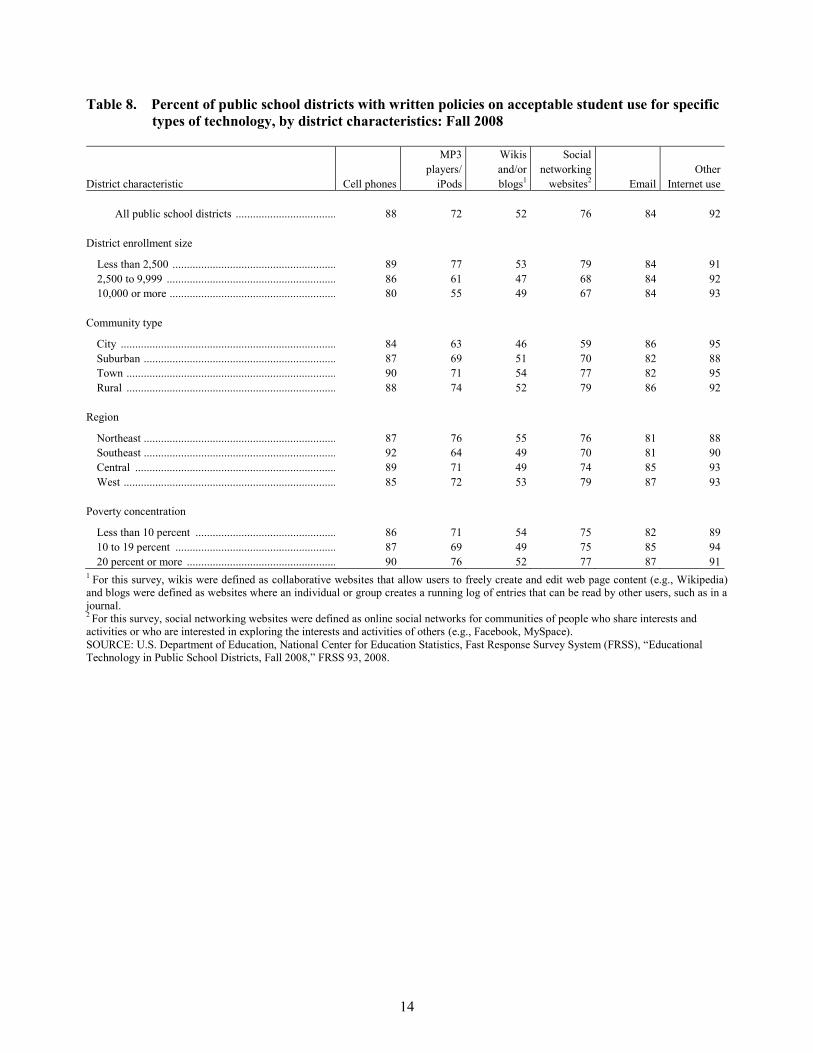
Districts had written policies on acceptable student use of email (84 percent), social networking websites
(76 percent), wikis and/or blogs (52 percent), and other Internet use (92 percent) (table 8).
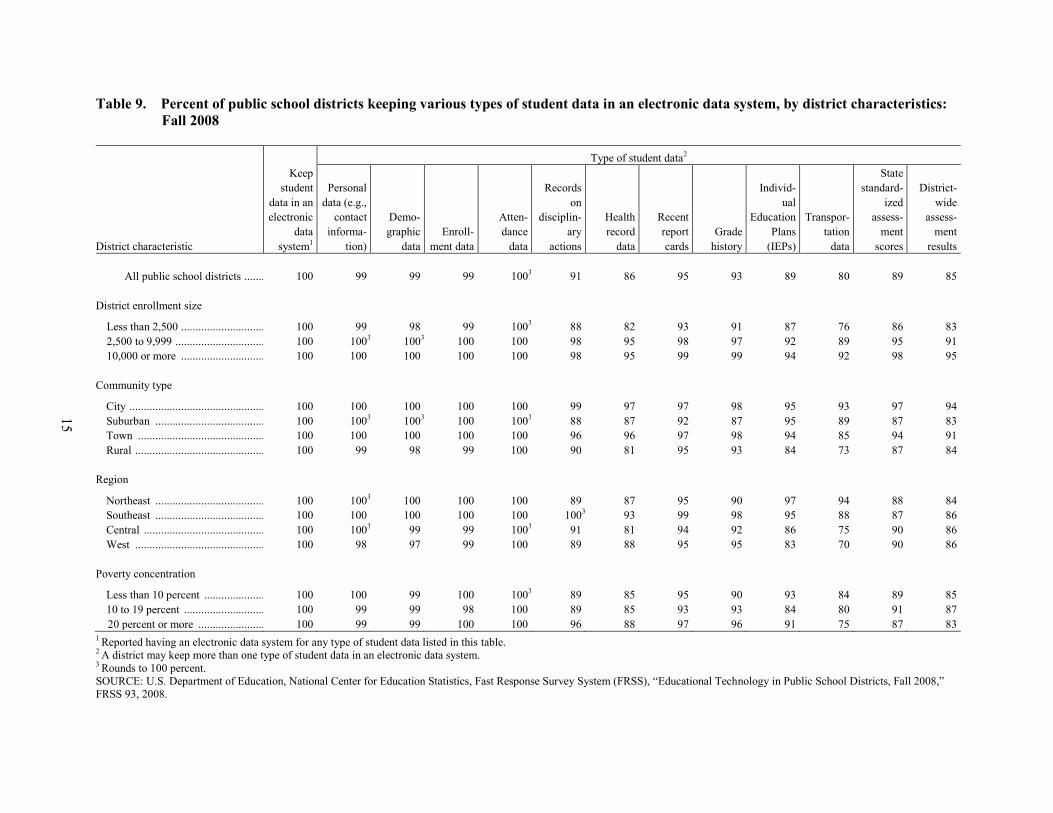
Of the districts surveyed, 100 percent kept student data in an electronic data system (table 9). The
percentage of districts that used an electronic system to keep each type of student data asked about in the
survey ranged from 80 percent for transportation data to 100 percent for attendance data. Eighty-nine
percent of districts reported keeping state standardized assessment scores, and 85 percent reported keeping
district-wide assessment results in their electronic data systems.
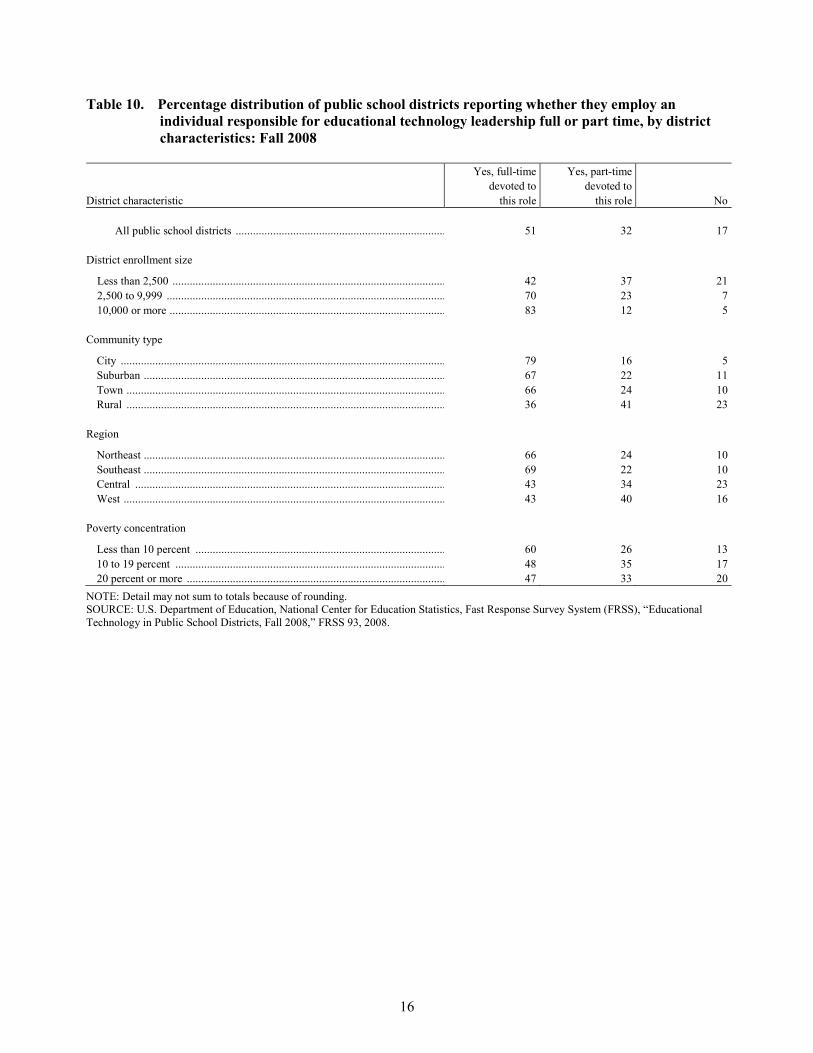
Districts reported employing an individual responsible for educational technology leadership who was
devoted to this role full time (51 percent) or part time (32 percent) (table 10). Seventeen percent of
districts reported no one in this role; more small districts than large districts reported no one with this
function (21 percent of districts with an enrollment size less than 2,500 compared to 5 percent of districts
with an enrollment size of 10,000 or more).
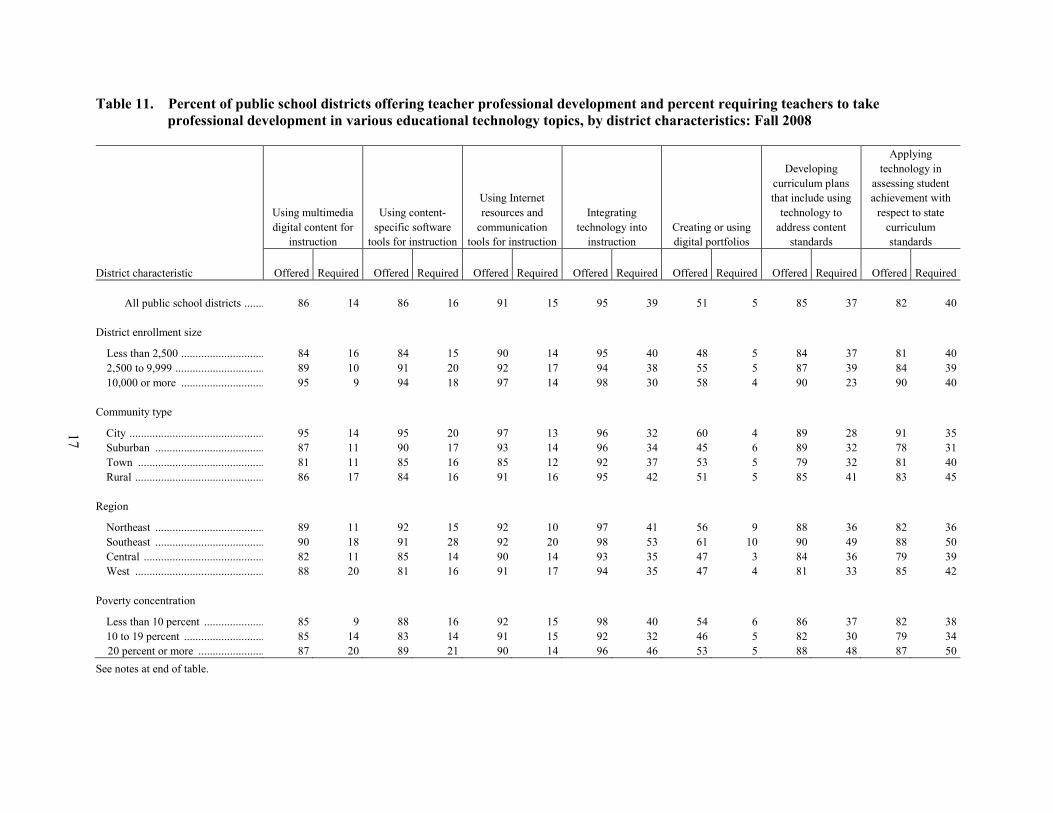
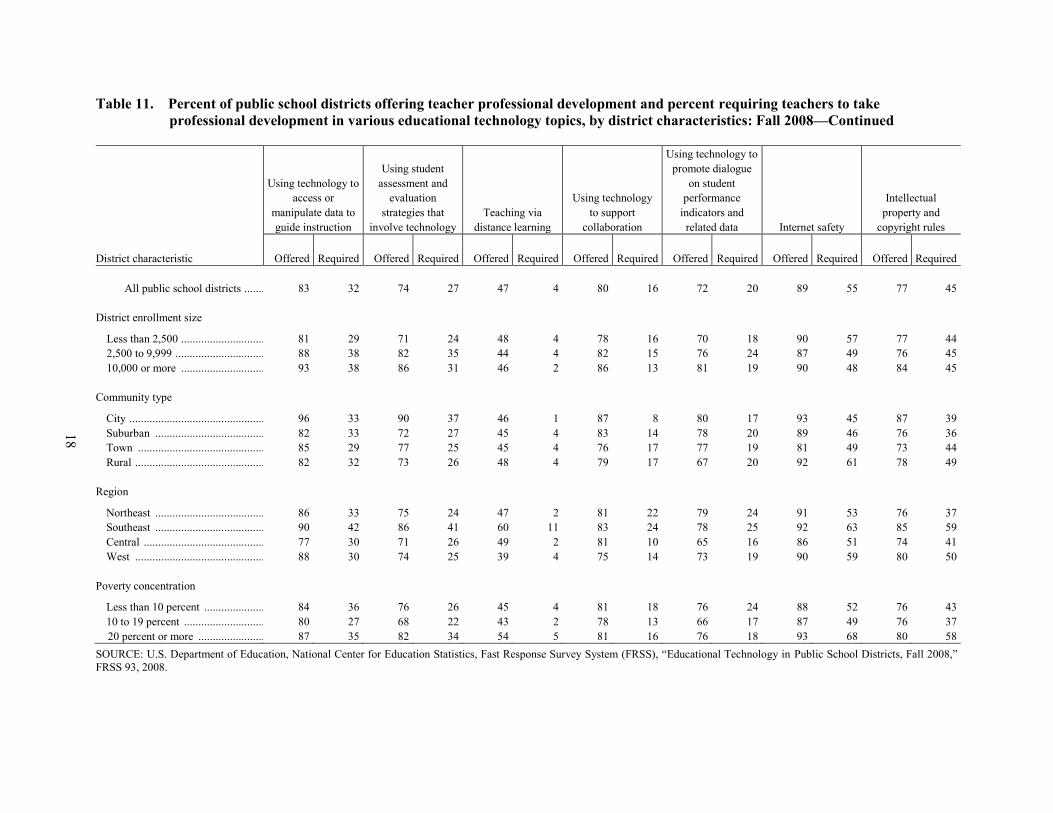
Districts reported offering teacher professional development in topics such as integrating technology into
instruction (95 percent), using Internet resources and communication tools for instruction (91 percent), and
Internet safety (89 percent) (table 11). Fifty-five percent of districts required teachers to take professional
development in Internet safety.
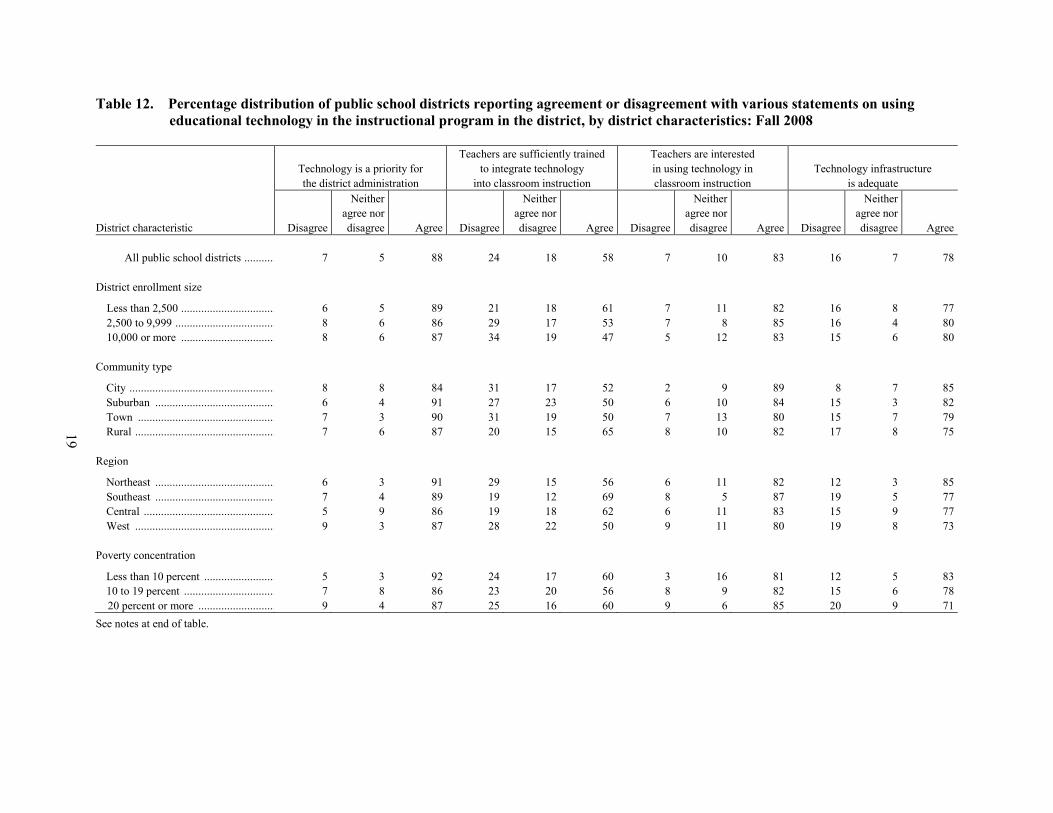
Eighty-three percent of district respondents agreed with the statement ―teachers are interested in using
technology in classroom instruction,‖ while 58 percent agreed that ―teachers are sufficiently trained to
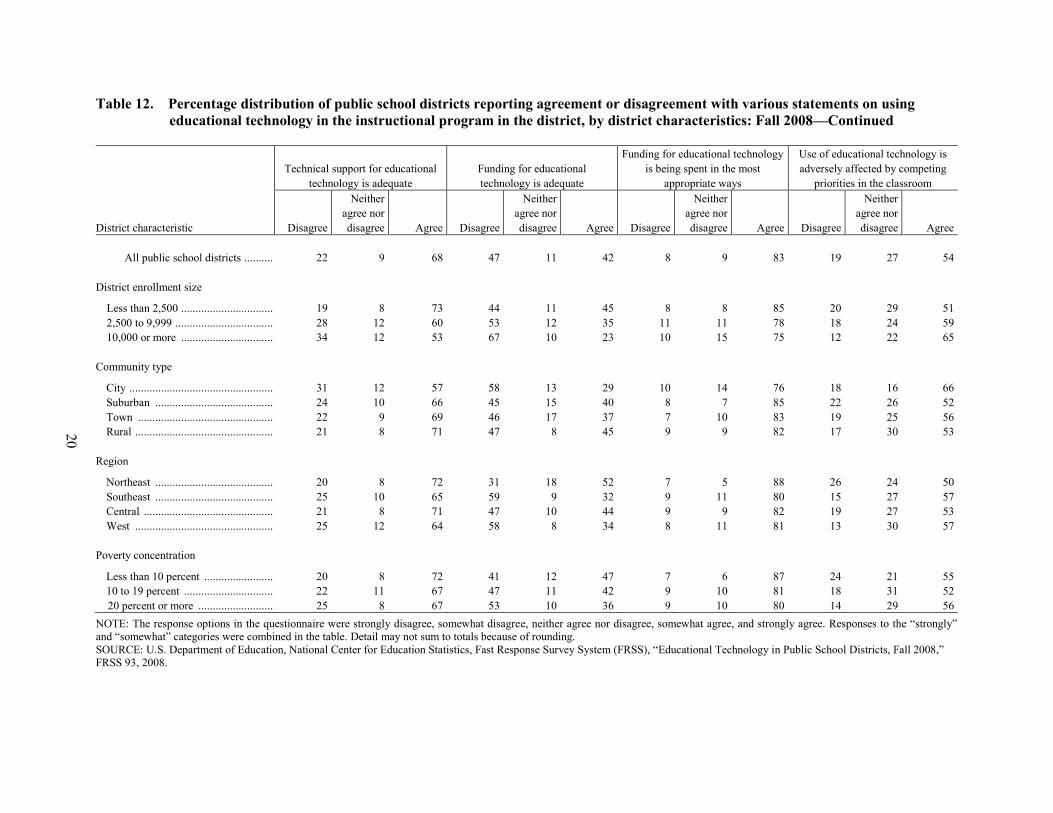
integrate technology into classroom instruction‖ (table 12). Forty-two percent of respondents agreed that
―funding for educational technology is adequate,‖ and 83 percent agreed that ―funding for educational
technology is being spent in the most appropriate ways.‖
3 For definitions of network connections, see the technical notes, page B-11.

This page intentionally left blank.
5
Table 1. Percent of public school districts with local area (school-level) network(s), percent with a
district network, and of those with a district network, percent connected to the Internet,
by district characteristics: Fall 2008
District characteristic
Local area network in:1 District network in:
1
Connected to
the Internet2
All
schools
Some
schools
All
schools
Some
schools
All public school districts .................................... 97 2 81 3 100
District enrollment size
Less than 2,500 .......................................................... 98 2 75 3 100
2,500 to 9,999 ............................................................ 97 3 94 3 100
10,000 or more ........................................................... 97 2 96 4 100
Community type
City ............................................................................ 97 3 89 3 100
Suburban .................................................................... 98 1 92 1 100
Town ........................................................................... 97 3 88 5 100
Rural .......................................................................... 97 3 73 3 100
Region
Northeast .................................................................... 99 1! 81 2 100
Southeast .................................................................... 98 2 86 2 100
Central ....................................................................... 97 2 78 4 100
West ........................................................................... 96 4 83 3 100
Poverty concentration
Less than 10 percent .................................................. 99 1 85 1 100
10 to 19 percent ......................................................... 98 2 78 5 100
20 percent or more ..................................................... 95 5 80 3 100
! Interpret data with caution; the coefficient of variation is greater than 50 percent. 1 The base for these percentages is the total population of public school districts.
2 The base for this column is the 84 percent of public school districts with a district network.
SOURCE: U.S. Department of Education, National Center for Education Statistics, Fast Response Survey System (FRSS), ―Educational
Technology in Public School Districts, Fall 2008,‖ FRSS 93, 2008.
6
Table 2. Percent of public schools with a local area (school-level) network, percent connected to the
district network, and of those with a district network, percent with each type of connection
to the district, by district characteristics: Fall 2008
District characteristic
Schools
with a
local area
network1
Schools
connect-
ed to the
district
network1
Type of connection from school to district2
Dial-up
or ISDN3
DSL4
Broad-
band
cable
T1 or
DS1
T3 or
DS3
Direct
fiber Wireless Other
All public schools ................................................ 99 92 # 2 5 26 4 55 16 8
District enrollment size
Less than 2,500 .......................................................... 98 80 1! 5 7 35 4 48 21 2
2,500 to 9,999 ............................................................ 99 96 # 1 5 22 4 60 16 7
10,000 or more ........................................................... 99 99 # 1 5 23 4 57 13 12
Community type
City ............................................................................ 99 98 # 1 4 25 6 57 11 9
Suburban .................................................................... 99 98 # 1 7 25 4 58 13 11
Town .......................................................................... 99 92 # 2 3 20 5 67 18 4
Rural .......................................................................... 98 81 1! 5 7 33 3 44 24 5
Region
Northeast .................................................................... 1005 88 # 2 9 23 6 57 15 6
Southeast .................................................................... 99 94 # # 7 19 3 57 14 14
Central ....................................................................... 98 90 1! 2 5 26 4 59 19 5
West ........................................................................... 98 95 # 3 2 33 4 51 16 8
Poverty concentration
Less than 10 percent .................................................. 99 91 # 1 7 26 3 60 16 6
10 to 19 percent ......................................................... 99 93 # 2 6 24 5 55 18 9
20 percent or more ..................................................... 98 92 # 2 4 30 4 52 15 9
# Rounds to zero.
! Interpret data with caution; the coefficient of variation is greater than 50 percent. 1 Percents are based on the total population of public schools.
2 Percents are based on the 92 percent of public schools connected to the district network. A school may have more than one type of
connection to the district. 3 Integrated Services Digital Network.
4 Digital Subscriber Line.
5 Rounds to 100 percent.
SOURCE: U.S. Department of Education, National Center for Education Statistics, Fast Response Survey System (FRSS), ―Educational
Technology in Public School Districts, Fall 2008,‖ FRSS 93, 2008.
7
Table 3. Percent of public school districts with a district network, and of those districts, percent with
each type of connection to the Internet service provider(s), by district characteristics:
Fall 2008
District characteristic
With
district
network1
Type of connection from district to Internet service provider(s)2
Dial-up
or ISDN3
DSL4
Broad-
band
cable
T1 or
DS1
T3 or
DS3
Direct
fiber Wireless Other
All public school districts .................................... 84 2 6 13 42 12 37 18 6
District enrollment size
Less than 2,500 .......................................................... 78 2 7 15 51 8 27 20 3
2,500 to 9,999 ............................................................ 97 1 3 11 29 18 54 13 10
10,000 or more ........................................................... 1005
1 3 6 19 26 60 14 13
Community type
City ............................................................................ 93 1! 4 10 18 21 62 14 11
Suburban .................................................................... 94 2! 2 19 33 14 49 9 11
Town .......................................................................... 93 2 6 9 42 16 46 17 6
Rural .......................................................................... 76 2! 8 12 51 9 24 23 3
Region
Northeast .................................................................... 83 1! 3 22 34 12 42 16 7
Southeast .................................................................... 88 2! 3 5 30 16 44 14 11
Central ........................................................................ 82 2 6 15 43 12 36 22 5
West ........................................................................... 87 2! 9 6 54 11 31 16 4
Poverty concentration
Less than 10 percent ................................................... 86 2 4 18 39 10 44 17 6
10 to 19 percent .......................................................... 83 1 8 11 39 13 38 19 6
20 percent or more ..................................................... 83 2 5 10 52 13 28 18 6
! Interpret data with caution; the coefficient of variation is greater than 50 percent. 1 Percents are based on the total population of public school districts.
2 Percents are based on the 84 percent of public school districts with a district network. A district may have more than one type of connection
to the Internet service provider(s). 3 Integrated Services Digital Network.
4 Digital Subscriber Line.
5 Rounds to 100 percent.
SOURCE: U.S. Department of Education, National Center for Education Statistics, Fast Response Survey System (FRSS), ―Educational
Technology in Public School Districts, Fall 2008,‖ FRSS 93, 2008.
8
Table 4. Percent of public school districts with a backup connection to the Internet, percent with a
formal computer replacement plan reflected in long-term budget planning, and percent
with an asset recovery program for all or some computers, by district characteristics:
Fall 2008
District characteristic
Backup connection
to the Internet
Formal computer
replacement plan
Asset recovery program for:1
All computers Some computers
All public school districts ..................................................................... 20 67 37 22
District enrollment size
Less than 2,500 ........................................................................................... 16 68 33 20
2,500 to 9,999 ............................................................................................. 27 67 44 27
10,000 or more ............................................................................................ 36 61 46 26
Community type
City ............................................................................................................. 28 63 42 23
Suburban ..................................................................................................... 31 71 47 27
Town ........................................................................................................... 25 63 53 16
Rural ........................................................................................................... 12 67 26 22
Region
Northeast ..................................................................................................... 26 77 53 24
Southeast ..................................................................................................... 21 58 30 22
Central ........................................................................................................ 19 63 35 21
West ............................................................................................................ 15 67 29 23
Poverty concentration
Less than 10 percent ................................................................................... 26 70 49 25
10 to 19 percent .......................................................................................... 18 67 32 22
20 percent or more ...................................................................................... 16 63 30 19 1 For this survey, asset recovery programs were defined as programs that provide third-party disposal services for owned or leased computers,
which are then usually refurbished or recycled.
SOURCE: U.S. Department of Education, National Center for Education Statistics, Fast Response Survey System (FRSS), ―Educational
Technology in Public School Districts, Fall 2008,‖ FRSS 93, 2008.
9
Table 5. Percent of public school districts reporting various treatments of older computers that can
no longer serve their original purpose, by district characteristics: Fall 2008
District characteristic
Continue to
use until
nonfunc-
tional
Upgrade
memory or
components
to extend
useful life
Re-purpose
for less
demanding
tasks
Donate to
other school
districts,
nonprofits,
families, etc.
Sell/
auction
Recycle/
dispose Other
All public school districts .................................... 76 83 85 46 36 91 3
District enrollment size
Less than 2,500 .......................................................... 76 83 84 51 35 92 3
2,500 to 9,999 ............................................................ 77 81 89 36 37 92 3
10,000 or more ........................................................... 73 81 86 26 51 87 3
Community type
City ............................................................................ 78 86 86 40 39 88 3
Suburban .................................................................... 75 78 88 38 26 94 3
Town .......................................................................... 69 80 82 50 38 93 2!
Rural .......................................................................... 79 85 85 48 39 90 3
Region
Northeast .................................................................... 76 82 88 44 19 95 3
Southeast .................................................................... 79 81 84 34 35 88 2!
Central ....................................................................... 76 82 85 51 42 92 2
West ........................................................................... 76 84 85 45 44 88 3
Poverty concentration
Less than 10 percent .................................................. 75 82 86 49 26 95 2
10 to 19 percent ......................................................... 77 83 87 47 38 95 1
20 percent or more ..................................................... 78 83 82 41 45 83 5
! Interpret data with caution; the coefficient of variation is greater than 50 percent.
NOTE: A district may report more than one treatment of older computers.
SOURCE: U.S. Department of Education, National Center for Education Statistics, Fast Response Survey System (FRSS), ―Educational
Technology in Public School Districts, Fall 2008,‖ FRSS 93, 2008.
10
Table 6. Percent of public school districts offering various technology resources to all or some elementary school or secondary school
teachers, by district characteristics: Fall 2008
District characteristic
Offered to all or some elementary or secondary teachers
Server space for posting their own
web pages or class materials
Access to online
district resources
Remote access to school
or district software
Access to course management
and delivery software
Elementary Secondary Elementary Secondary Elementary Secondary Elementary Secondary
All Some All Some All Some All Some All Some All Some All Some All Some
All public school districts .................................... 82 5 83 5 92 3 92 3 44 11 46 11 57 12 57 13
District enrollment size
Less than 2,500 .......................................................... 81 3 83 3 92 3 91 3 43 11 45 10 58 10 58 11
2,500 to 9,999 ............................................................ 83 8 85 7 92 3 93 2 46 11 47 12 52 17 55 18
10,000 or more .......................................................... 81 9 82 9 96 2 95 4 49 15 51 17 54 18 56 20
Community type
City ............................................................................ 84 7 88 6 96 2 95 4 46 16 49 18 48 17 53 18
Suburban ................................................................... 81 9 84 8 89 5 89 5 47 14 52 11 48 16 51 17
Town ......................................................................... 91 3 88 4 93 3 93 3 50 12 51 11 56 13 56 15
Rural .......................................................................... 78 3 81 4 93 3! 92 1 41 9 42 11 61 9 61 11
Region
Northeast ................................................................... 89 5 90 6 93 4 93 5 48 13 49 13 49 18 51 18
Southeast ................................................................... 84 5 84 5 92 2! 91 1! 46 10 47 8 59 10 59 12
Central ....................................................................... 80 3 83 3 91 4! 92 2 42 9 48 11 65 9 65 12
West .......................................................................... 77 5 77 6 93 2 91 2 44 12 41 12 50 11 52 13
Poverty concentration
Less than 10 percent .................................................. 90 5 92 5 91 4! 94 3! 46 12 50 12 56 12 59 13
10 to 19 percent ......................................................... 81 5 84 5 93 3 92 2 45 10 48 11 54 14 56 15
20 percent or more ..................................................... 74 4 74 4 92 2 90 3 41 11 40 11 60 9 58 11
See notes at end of table.
11
Table 6. Percent of public school districts offering various technology resources to all or some elementary school or secondary school
teachers, by district characteristics: Fall 2008—Continued
District characteristic
Offered to all or some elementary or secondary teachers
Access to electronic
administrative tools Online curricula
Opportunities for
distance learning
Online student
assessment tools
Elementary Secondary Elementary Secondary Elementary Secondary Elementary Secondary
All Some All Some All Some All Some All Some All Some All Some All Some
All public school districts .................................... 87 6 95 2 66 14 66 16 64 13 65 14 73 12 72 14
District enrollment size
Less than 2,500 .......................................................... 89 4 95 2! 66 12 67 14 67 11 68 12 74 11 73 13
2,500 to 9,999 ............................................................ 83 11 95 3 67 18 67 20 57 17 60 17 71 15 68 18
10,000 or more .......................................................... 82 11 93 5 64 20 65 23 54 23 56 24 72 16 72 18
Community type
City ............................................................................ 84 12 94 5 62 22 61 24 53 28 57 27 76 15 74 16
Suburban ................................................................... 78 12 94 5! 64 18 62 20 50 19 52 20 59 18 59 23
Town ......................................................................... 92 5 97 1! 63 22 63 25 65 16 66 16 77 15 75 18
Rural .......................................................................... 89 4 94 2! 69 8 70 11 71 8 71 10 78 8 75 10
Region
Northeast ................................................................... 80 10 95 3! 61 21 57 23 54 21 53 25 60 19 56 27
Southeast ................................................................... 88 6 94 1 72 8 74 9 70 12 73 10 78 5 76 8
Central ....................................................................... 87 5 97 1! 65 12 70 14 69 9 70 10 76 12 77 12
West .......................................................................... 91 5 92 3 70 13 65 17 63 14 65 13 79 9 77 11
Poverty concentration
Less than 10 percent .................................................. 86 8 98 2! 67 19 65 20 59 18 60 19 70 15 67 20
10 to 19 percent ......................................................... 85 6 95 2 64 13 67 15 63 13 65 14 71 13 72 15
20 percent or more ..................................................... 89 4 91 3 70 11 67 13 70 10 70 10 80 8 77 8
! Interpret data with caution; the coefficient of variation is greater than 50 percent.
NOTE: Percents are based on the percent of public school districts with teachers at that level (97 percent of districts have elementary teachers and 88 percent have secondary teachers).
SOURCE: U.S. Department of Education, National Center for Education Statistics, Fast Response Survey System (FRSS), ―Educational Technology in Public School Districts, Fall 2008,‖
FRSS 93, 2008.
12
Table 7. Percent of public school districts offering various technology resources to all or some elementary school or secondary school
students, by district characteristics: Fall 2008
District characteristic
Offered to all or some elementary or secondary students
Email accounts used
for schoolwork
Electronic storage space
on a server
Online access to the
library catalogue Online access to databases
Elementary Secondary Elementary Secondary Elementary Secondary Elementary Secondary
All Some All Some All Some All Some All Some All Some All Some All Some
All public school districts .................................... 11 21 28 19 62 17 83 7 72 6 82 2 60 10 68 6
District enrollment size
Less than 2,500 .......................................................... 11 23 30 19 63 15 85 3 69 5 80 1! 59 9 66 4
2,500 to 9,999 ............................................................ 9 15 25 20 59 22 78 14 79 7 87 3 64 12 72 8
10,000 or more .......................................................... 13 22 23 23 58 23 74 17 84 7 87 6 64 13 68 14
Community type
City ............................................................................ 10 23 30 19 52 32 75 16 80 14 89 5 59 23 72 14
Suburban ................................................................... 11 15 19 17 67 15 84 7 76 7 87 2 63 10 72 7
Town ......................................................................... 13 23 40 15 63 18 84 7 82 4 88 2 62 10 71 7
Rural .......................................................................... 10 23 27 22 60 16 83 6 66 5 77 1 59 9 64 4
Region
Northeast ................................................................... 7 25 26 15 73 16 90 4 78 8 88 3 68 8 74 5
Southeast ................................................................... 17 20 34 22 43 20 64 18 74 4 82 3 60 9 65 10
Central ....................................................................... 13 19 29 22 67 14 91 2 71 4 82 ‡ 58 9 69 3
West .......................................................................... 9 22 26 18 53 22 75 10 69 6 77 2 57 14 61 8
Poverty concentration
Less than 10 percent .................................................. 8 25 30 16 76 12 92 3 82 6 92 1! 71 8 79 4
10 to 19 percent ......................................................... 10 20 24 20 60 19 85 7 69 5 82 2 58 12 67 7
20 percent or more ..................................................... 15 20 32 22 50 21 72 10 66 6 72 2 53 10 57 6
See notes at end of table.
13
Table 7. Percent of public school districts offering various technology resources to all or some elementary school or secondary school
students, by district characteristics: Fall 2008—Continued
District characteristic
Offered to all or some elementary or secondary students
Online curricula
Opportunities for distance learning
over the Internet or through
videoconferencing
Remote access to most
software used in their classes
Elementary Secondary Elementary Secondary Elementary Secondary
All Some All Some All Some All Some All Some All Some
All public school districts .............................................................. 47 19 53 25 30 22 46 31 9 10 12 13
District enrollment size
Less than 2,500 .................................................................................... 46 17 53 23 32 21 50 28 8 10 11 12
2,500 to 9,999 ...................................................................................... 50 23 54 28 26 22 38 32 11 11 14 14
10,000 or more .................................................................................... 49 26 51 34 23 32 33 47 9 13 9 21
Community type
City ...................................................................................................... 47 28 46 36 24 36 32 48 13 21 15 27
Suburban ............................................................................................. 40 23 46 30 26 18 35 31 10 11 12 13
Town ................................................................................................... 44 26 51 31 31 23 45 32 11 6 13 9
Rural .................................................................................................... 52 14 57 20 32 21 52 28 7 11 11 13
Region
Northeast ............................................................................................. 41 22 42 36 26 33 35 42 9 13 11 9
Southeast ............................................................................................. 52 16 59 20 27 20 52 33 14 10 16 14
Central ................................................................................................. 45 20 56 21 33 19 51 24 8 9 11 14
West .................................................................................................... 55 17 54 23 29 16 46 30 8 10 11 14
Poverty concentration
Less than 10 percent ............................................................................ 45 22 51 30 29 28 42 35 10 13 11 16
10 to 19 percent ................................................................................... 44 20 51 28 25 22 45 32 8 9 13 11
20 percent or more ............................................................................... 54 14 56 18 36 15 51 25 9 10 11 13
! Interpret data with caution; the coefficient of variation is greater than 50 percent.
‡ Reporting standards not met.
NOTE: Percents are based on the percent of public school districts with students at that level (97 percent of districts have elementary students and 88 percent have secondary students).
SOURCE: U.S. Department of Education, National Center for Education Statistics, Fast Response Survey System (FRSS), ―Educational Technology in Public School Districts, Fall 2008,‖
FRSS 93, 2008.
14
Table 8. Percent of public school districts with written policies on acceptable student use for specific
types of technology, by district characteristics: Fall 2008
District characteristic Cell phones
MP3
players/
iPods
Wikis
and/or
blogs1
Social
networking
websites2 Email
Other
Internet use
All public school districts .................................... 88 72 52 76 84 92
District enrollment size
Less than 2,500 .......................................................... 89 77 53 79 84 91
2,500 to 9,999 ............................................................ 86 61 47 68 84 92
10,000 or more ........................................................... 80 55 49 67 84 93
Community type
City ............................................................................ 84 63 46 59 86 95
Suburban .................................................................... 87 69 51 70 82 88
Town .......................................................................... 90 71 54 77 82 95
Rural .......................................................................... 88 74 52 79 86 92
Region
Northeast .................................................................... 87 76 55 76 81 88
Southeast .................................................................... 92 64 49 70 81 90
Central ....................................................................... 89 71 49 74 85 93
West ........................................................................... 85 72 53 79 87 93
Poverty concentration
Less than 10 percent .................................................. 86 71 54 75 82 89
10 to 19 percent ......................................................... 87 69 49 75 85 94
20 percent or more ..................................................... 90 76 52 77 87 91 1
For this survey, wikis were defined as collaborative websites that allow users to freely create and edit web page content (e.g., Wikipedia)
and blogs were defined as websites where an individual or group creates a running log of entries that can be read by other users, such as in a
journal. 2 For this survey, social networking websites were defined as online social networks for communities of people who share interests and
activities or who are interested in exploring the interests and activities of others (e.g., Facebook, MySpace).
SOURCE: U.S. Department of Education, National Center for Education Statistics, Fast Response Survey System (FRSS), ―Educational
Technology in Public School Districts, Fall 2008,‖ FRSS 93, 2008.
15
Table 9. Percent of public school districts keeping various types of student data in an electronic data system, by district characteristics:
Fall 2008
District characteristic
Keep
student
data in an
electronic
data
system1
Type of student data2
Personal
data (e.g.,
contact
informa-
tion)
Demo-
graphic
data
Enroll-
ment data
Atten-
dance
data
Records
on
disciplin-
ary
actions
Health
record
data
Recent
report
cards
Grade
history
Individ-
ual
Education
Plans
(IEPs)
Transpor-
tation
data
State
standard-
ized
assess-
ment
scores
District-
wide
assess-
ment
results
All public school districts ........................................... 100 99 99 99 1003
91 86 95 93 89 80 89 85
District enrollment size
Less than 2,500 .......................................................... 100 99 98 99 1003
88 82 93 91 87 76 86 83
2,500 to 9,999 ............................................................ 100 1003
1003
100 100 98 95 98 97 92 89 95 91
10,000 or more .......................................................... 100 100 100 100 100 98 95 99 99 94 92 98 95
Community type
City ............................................................................ 100 100 100 100 100 99 97 97 98 95 93 97 94
Suburban ................................................................... 100 1003
1003
100 1003
88 87 92 87 95 89 87 83
Town ......................................................................... 100 100 100 100 100 96 96 97 98 94 85 94 91
Rural .......................................................................... 100 99 98 99 100
90 81 95 93 84 73 87 84
Region
Northeast ................................................................... 100 1003
100 100 100 89 87 95 90 97 94 88 84
Southeast ................................................................... 100 100 100 100 100 1003
93 99 98 95 88 87 86
Central ....................................................................... 100 1003
99 99 1003
91 81 94 92 86 75 90 86
West .......................................................................... 100 98 97 99 100
89 88 95 95 83 70 90 86
Poverty concentration
Less than 10 percent .................................................. 100 100 99 100 1003 89 85 95 90 93 84 89 85
10 to 19 percent ......................................................... 100 99 99 98 100
89 85 93 93 84 80 91 87
20 percent or more ............................................................................. 100 99 99 100 100 96 88 97 96 91 75 87 83 1 Reported having an electronic data system for any type of student data listed in this table.
2 A district may keep more than one type of student data in an electronic data system.
3 Rounds to 100 percent.
SOURCE: U.S. Department of Education, National Center for Education Statistics, Fast Response Survey System (FRSS), ―Educational Technology in Public School Districts, Fall 2008,‖
FRSS 93, 2008.
16
Table 10. Percentage distribution of public school districts reporting whether they employ an
individual responsible for educational technology leadership full or part time, by district
characteristics: Fall 2008
District characteristic
Yes, full-time
devoted to
this role
Yes, part-time
devoted to
this role No
All public school districts ......................................................................... 51 32 17
District enrollment size
Less than 2,500 ............................................................................................... 42 37 21
2,500 to 9,999 ................................................................................................. 70 23 7
10,000 or more ................................................................................................ 83 12 5
Community type
City ................................................................................................................. 79 16 5
Suburban ......................................................................................................... 67 22 11
Town ............................................................................................................... 66 24 10
Rural ............................................................................................................... 36 41 23
Region
Northeast ......................................................................................................... 66 24 10
Southeast ......................................................................................................... 69 22 10
Central ............................................................................................................ 43 34 23
West ................................................................................................................ 43 40 16
Poverty concentration
Less than 10 percent ....................................................................................... 60 26 13
10 to 19 percent .............................................................................................. 48 35 17
20 percent or more .......................................................................................... 47 33 20
NOTE: Detail may not sum to totals because of rounding.
SOURCE: U.S. Department of Education, National Center for Education Statistics, Fast Response Survey System (FRSS), ―Educational
Technology in Public School Districts, Fall 2008,‖ FRSS 93, 2008.
17
Table 11. Percent of public school districts offering teacher professional development and percent requiring teachers to take
professional development in various educational technology topics, by district characteristics: Fall 2008
District characteristic
Using multimedia
digital content for
instruction
Using content-
specific software
tools for instruction
Using Internet
resources and
communication
tools for instruction
Integrating
technology into
instruction
Creating or using
digital portfolios
Developing
curriculum plans
that include using
technology to
address content
standards
Applying
technology in
assessing student
achievement with
respect to state
curriculum
standards
Offered Required Offered Required Offered Required Offered Required Offered Required Offered Required Offered Required
All public school districts ........................................... 86 14 86 16 91 15 95 39 51 5 85 37 82 40
District enrollment size
Less than 2,500 .......................................................... 84 16 84 15 90 14 95 40 48 5 84 37 81 40
2,500 to 9,999 ............................................................ 89 10 91 20 92 17 94 38 55 5 87 39 84 39
10,000 or more .......................................................... 95 9 94 18 97 14 98 30 58 4 90 23 90 40
Community type
City ............................................................................ 95 14 95 20 97 13 96 32 60 4 89 28 91 35
Suburban ................................................................... 87 11 90 17 93 14 96 34 45 6 89 32 78 31
Town ......................................................................... 81 11 85 16 85 12 92 37 53 5 79 32 81 40
Rural .......................................................................... 86 17 84 16 91 16 95 42 51 5 85 41 83 45
Region
Northeast ................................................................... 89 11 92 15 92 10 97 41 56 9 88 36 82 36
Southeast ................................................................... 90 18 91 28 92 20 98 53 61 10 90 49 88 50
Central ....................................................................... 82 11 85 14 90 14 93 35 47 3 84 36 79 39
West .......................................................................... 88 20 81 16 91 17 94 35 47 4 81 33 85 42
Poverty concentration
Less than 10 percent .................................................. 85 9 88 16 92 15 98 40 54 6 86 37 82 38
10 to 19 percent ......................................................... 85 14 83 14 91 15 92 32 46 5 82 30 79 34
20 percent or more ............................................................................. 87 20 89 21 90 14 96 46 53 5 88 48 87 50
See notes at end of table.
18
Table 11. Percent of public school districts offering teacher professional development and percent requiring teachers to take
professional development in various educational technology topics, by district characteristics: Fall 2008—Continued
District characteristic
Using technology to
access or
manipulate data to
guide instruction
Using student
assessment and
evaluation
strategies that
involve technology
Teaching via
distance learning
Using technology
to support
collaboration
Using technology to
promote dialogue
on student
performance
indicators and
related data Internet safety
Intellectual
property and
copyright rules
Offered Required Offered Required Offered Required Offered Required Offered Required Offered Required Offered Required
All public school districts ........................................... 83 32 74 27 47 4 80 16 72 20 89 55 77 45
District enrollment size
Less than 2,500 .......................................................... 81 29 71 24 48 4 78 16 70 18 90 57 77 44
2,500 to 9,999 ............................................................ 88 38 82 35 44 4 82 15 76 24 87 49 76 45
10,000 or more .......................................................... 93 38 86 31 46 2 86 13 81 19 90 48 84 45
Community type
City ............................................................................ 96 33 90 37 46 1 87 8 80 17 93 45 87 39
Suburban ................................................................... 82 33 72 27 45 4 83 14 78 20 89 46 76 36
Town ......................................................................... 85 29 77 25 45 4 76 17 77 19 81 49 73 44
Rural .......................................................................... 82 32 73 26 48 4 79 17 67 20 92 61 78 49
Region
Northeast ................................................................... 86 33 75 24 47 2 81 22 79 24 91 53 76 37
Southeast ................................................................... 90 42 86 41 60 11 83 24 78 25 92 63 85 59
Central ....................................................................... 77 30 71 26 49 2 81 10 65 16 86 51 74 41
West .......................................................................... 88 30 74 25 39 4 75 14 73 19 90 59 80 50
Poverty concentration
Less than 10 percent .................................................. 84 36 76 26 45 4 81 18 76 24 88 52 76 43
10 to 19 percent ......................................................... 80 27 68 22 43 2 78 13 66 17 87 49 76 37
20 percent or more ............................................................................. 87 35 82 34 54 5 81 16 76 18 93 68 80 58
SOURCE: U.S. Department of Education, National Center for Education Statistics, Fast Response Survey System (FRSS), ―Educational Technology in Public School Districts, Fall 2008,‖
FRSS 93, 2008.
19
Table 12. Percentage distribution of public school districts reporting agreement or disagreement with various statements on using
educational technology in the instructional program in the district, by district characteristics: Fall 2008
District characteristic
Technology is a priority for
the district administration
Teachers are sufficiently trained
to integrate technology
into classroom instruction
Teachers are interested
in using technology in
classroom instruction
Technology infrastructure
is adequate
Disagree
Neither
agree nor
disagree Agree Disagree
Neither
agree nor
disagree Agree Disagree
Neither
agree nor
disagree Agree Disagree
Neither
agree nor
disagree Agree
All public school districts ........................................... 7 5 88 24 18 58 7 10 83 16 7 78
District enrollment size
Less than 2,500 .......................................................... 6 5 89 21 18 61 7 11 82 16 8 77
2,500 to 9,999 ............................................................ 8 6 86 29 17 53 7 8 85 16 4 80
10,000 or more .......................................................... 8 6 87 34 19 47 5 12 83 15 6 80
Community type
City ............................................................................ 8 8 84 31 17 52 2 9 89 8 7 85
Suburban ................................................................... 6 4 91 27 23 50 6 10 84 15 3 82
Town ......................................................................... 7 3 90 31 19 50 7 13 80 15 7 79
Rural .......................................................................... 7 6 87 20 15 65 8 10 82 17 8 75
Region
Northeast ................................................................... 6 3 91 29 15 56 6 11 82 12 3 85
Southeast ................................................................... 7 4 89 19 12 69 8 5 87 19 5 77
Central ....................................................................... 5 9 86 19 18 62 6 11 83 15 9 77
West .......................................................................... 9 3 87 28 22 50 9 11 80 19 8 73
Poverty concentration
Less than 10 percent .................................................. 5 3 92 24 17 60 3 16 81 12 5 83
10 to 19 percent ......................................................... 7 8 86 23 20 56 8 9 82 15 6 78
20 percent or more ............................................................................. 9 4 87 25 16 60 9 6 85 20 9 71
See notes at end of table.
20
Table 12. Percentage distribution of public school districts reporting agreement or disagreement with various statements on using
educational technology in the instructional program in the district, by district characteristics: Fall 2008—Continued
District characteristic
Technical support for educational
technology is adequate
Funding for educational
technology is adequate
Funding for educational technology
is being spent in the most
appropriate ways
Use of educational technology is
adversely affected by competing
priorities in the classroom
Disagree
Neither
agree nor
disagree Agree Disagree
Neither
agree nor
disagree Agree Disagree
Neither
agree nor
disagree Agree Disagree
Neither
agree nor
disagree Agree
All public school districts ........................................... 22 9 68 47 11 42 8 9 83 19 27 54
District enrollment size
Less than 2,500 .......................................................... 19 8 73 44 11 45 8 8 85 20 29 51
2,500 to 9,999 ............................................................ 28 12 60 53 12 35 11 11 78 18 24 59
10,000 or more .......................................................... 34 12 53 67 10 23 10 15 75 12 22 65
Community type
City ............................................................................ 31 12 57 58 13 29 10 14 76 18 16 66
Suburban ................................................................... 24 10 66 45 15 40 8 7 85 22 26 52
Town ......................................................................... 22 9 69 46 17 37 7 10 83 19 25 56
Rural .......................................................................... 21 8 71 47 8 45 9 9 82 17 30 53
Region
Northeast ................................................................... 20 8 72 31 18 52 7 5 88 26 24 50
Southeast ................................................................... 25 10 65 59 9 32 9 11 80 15 27 57
Central ....................................................................... 21 8 71 47 10 44 9 9 82 19 27 53
West .......................................................................... 25 12 64 58 8 34 8 11 81 13 30 57
Poverty concentration
Less than 10 percent .................................................. 20 8 72 41 12 47 7 6 87 24 21 55
10 to 19 percent ......................................................... 22 11 67 47 11 42 9 10 81 18 31 52
20 percent or more ............................................................................. 25 8 67 53 10 36 9 10 80 14 29 56
NOTE: The response options in the questionnaire were strongly disagree, somewhat disagree, neither agree nor disagree, somewhat agree, and strongly agree. Responses to the ―strongly‖
and ―somewhat‖ categories were combined in the table. Detail may not sum to totals because of rounding.
SOURCE: U.S. Department of Education, National Center for Education Statistics, Fast Response Survey System (FRSS), ―Educational Technology in Public School Districts, Fall 2008,‖
FRSS 93, 2008.
21
Related Reports
Bare, J., and Meek, A. (1998). Internet Access in Public Schools (NCES 98–031). National Center for
Education Statistics, U.S. Department of Education. Washington, DC.
Cattagni, A., and Farris, E. (2001). Internet Access in U.S. Public Schools and Classrooms: 1994–2000 (NCES
2001–071). National Center for Education Statistics, U.S. Department of Education. Washington, DC.
Heaviside, S., Farris, E., and Malitz, G. (1995). Advanced Telecommunications in U.S. Public Schools, K–12
(NCES 95–731). National Center for Education Statistics, U.S. Department of Education. Washington,
DC.
Heaviside, S., Farris, E., and Malitz, G. (1996). Advanced Telecommunications in U.S. Public Elementary and
Secondary Schools, 1995 (NCES 96–854). National Center for Education Statistics, U.S. Department of
Education. Washington, DC.
Heaviside, S., Riggins, T., and Farris, E. (1997). Advanced Telecommunications in U.S. Public Elementary and
Secondary Schools, Fall 1996 (NCES 97–944). National Center for Education Statistics, U.S.
Department of Education. Washington, DC.
Kleiner, A., and Farris, E. (2002). Internet Access in U.S. Public Schools and Classrooms: 1994–2001 (NCES
2002–018). National Center for Education Statistics, Institute of Education Sciences, U.S. Department
of Education. Washington, DC.
Kleiner, A., and Lewis, L. (2003). Internet Access in U.S. Public Schools and Classrooms: 1994–2002 (NCES
2004–011). National Center for Education Statistics, Institute of Education Sciences, U.S. Department
of Education. Washington, DC.
Lanahan, L. (2002). Beyond School-Level Internet Access: Support for Instructional Use of Technology (NCES
2002–029). National Center for Education Statistics, Institute of Education Sciences, U.S. Department
of Education. Washington, DC.
Parsad, B., and Jones, J. (2005). Internet Access in U.S. Public Schools and Classrooms: 1994–2003 (NCES
2005–015). National Center for Education Statistics, Institute of Education Sciences, U.S. Department
of Education. Washington, DC.
Rowand, C. (1999). Internet Access in Public Schools and Classrooms: 1994–98 (NCES 1999–017). National
Center for Education Statistics, U.S. Department of Education. Washington, DC.
Smerdon, B., Cronen, S., Lanahan, L., Anderson, J., Iannotti, N., and Angeles, J. (2000). Teachers’ Tools for the 21st Century: A Report on Teachers’ Use of Technology (NCES 2000–102). National Center for
Education Statistics, U.S. Department of Education. Washington, DC.
Wells, J., and Lewis, L. (2006). Internet Access in U.S. Public Schools and Classrooms: 1994–2005 (NCES
2007-020). National Center for Education Statistics, Institute of Education Sciences, U.S. Department
of Education. Washington, DC.
Williams, C. (2000). Internet Access in Public Schools and Classrooms: 1994–99 (NCES 2000–086). National
Center for Education Statistics, U.S. Department of Education. Washington, DC.

This page intentionally left blank.

A-1
Appendix A
Standard Error Tables

This page intentionally left blank.
A-3
Table 1a. Standard errors for the percent of public school districts with local area (school-level)
network(s), percent with a district network, and of those with a district network, percent
connected to the Internet, by district characteristics: Fall 2008
District characteristic
Local area network in: District network in:
Connected to
the Internet
All
schools
Some
schools
All
schools
Some
schools
All public school districts .................................... 0.5 0.5 1.9 0.6 †
District enrollment size
Less than 2,500 .......................................................... 0.7 0.6 2.9 0.8 †
2,500 to 9,999 ............................................................ 0.8 0.8 1.0 0.7 †
10,000 or more ........................................................... 0.6 0.5 0.8 0.8 †
Community type
City ............................................................................ 1.2 1.1 5.8 0.9 †
Suburban .................................................................... 0.8 0.3 2.6 0.5 †
Town .......................................................................... 1.0 1.0 3.7 1.6 †
Rural .......................................................................... 0.8 0.8 3.2 1.0 †
Region
Northeast .................................................................... 0.6 † 5.1 0.7 †
Southeast .................................................................... 0.9 0.9 3.4 0.6 †
Central ....................................................................... 0.9 0.9 3.0 1.0 †
West ........................................................................... 1.3 1.3 4.7 1.4 †
Poverty concentration
Less than 10 percent .................................................. 0.4 0.3 4.4 0.4 †
10 to 19 percent ......................................................... 0.6 0.6 3.3 1.3 †
20 percent or more ..................................................... 1.5 1.5 3.3 0.9 †
† Not applicable.
SOURCE: U.S. Department of Education, National Center for Education Statistics, Fast Response Survey System (FRSS), ―Educational
Technology in Public School Districts, Fall 2008,‖ FRSS 93, 2008.
A-4
Table 2a. Standard errors for the percent of public schools with a local area (school-level) network,
percent connected to the district network, and of those with a district network, percent
with each type of connection to the district, by district characteristics: Fall 2008
District characteristic
Schools
with a
local
area
network
Schools
connect-
ed to the
district
network
Type of connection from school to district
Dial-up
or ISDN
DSL
Broad-
band
cable
T1 or
DS1
T3 or
DS3
Direct
fiber Wireless Other
All public schools ................................................ 0.2 1.0 † 0.3 0.4 0.9 0.4 1.2 0.7 0.5
District enrollment size
Less than 2,500 .......................................................... 0.6 3.3 0.4 1.0 1.1 2.5 1.0 3.8 2.0 0.8
2,500 to 9,999 ............................................................ 0.3 0.7 † 0.4 1.0 1.6 0.8 1.7 1.3 1.0
10,000 or more ........................................................... 0.3 0.3 † 0.3 0.5 1.0 0.6 1.3 1.2 0.8
Community type
City ............................................................................ 0.5 0.9 † 0.3 0.6 1.5 0.9 2.1 1.5 1.1
Suburban .................................................................... 0.5 0.7 † 0.3 0.9 1.3 0.6 2.0 1.0 1.1
Town .......................................................................... 0.6 4.0 † 0.7 1.0 2.7 1.4 3.7 1.6 1.3
Rural .......................................................................... 0.5 3.1 0.4 1.0 1.1 2.3 0.6 2.4 1.9 0.9
Region
Northeast .................................................................... 0.2 4.9 † 0.8 1.9 2.4 1.0 3.7 1.6 1.2
Southeast .................................................................... 0.2 1.3 † † 0.8 1.4 0.7 2.2 1.2 1.3
Central ....................................................................... 0.7 1.2 0.4 0.6 1.0 2.3 1.0 2.2 1.6 0.7
West ........................................................................... 0.5 1.3 † 0.7 0.4 1.6 0.6 2.0 1.4 0.9
Poverty concentration
Less than 10 percent .................................................. 0.3 3.7 † 0.5 1.3 1.9 0.7 2.5 1.5 1.0
10 to 19 percent ......................................................... 0.3 0.9 † 0.6 0.7 1.3 0.8 1.8 1.3 0.9
20 percent or more ..................................................... 0.6 1.2 † 0.5 0.7 1.8 0.6 2.1 1.5 0.9
† Not applicable.
SOURCE: U.S. Department of Education, National Center for Education Statistics, Fast Response Survey System (FRSS), ―Educational
Technology in Public School Districts, Fall 2008,‖ FRSS 93, 2008.
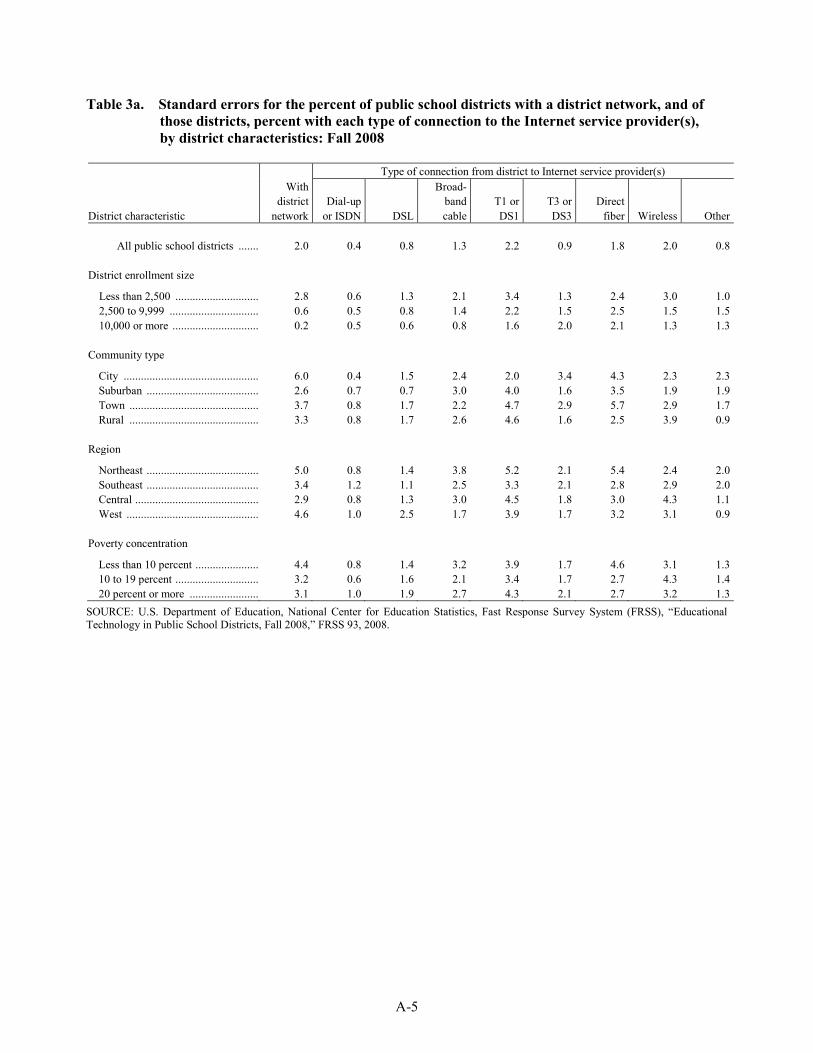
A-5
Table 3a. Standard errors for the percent of public school districts with a district network, and of
those districts, percent with each type of connection to the Internet service provider(s),
by district characteristics: Fall 2008
District characteristic
With
district
network
Type of connection from district to Internet service provider(s)
Dial-up
or ISDN
DSL
Broad-
band
cable
T1 or
DS1
T3 or
DS3
Direct
fiber Wireless Other
All public school districts .................................... 2.0 0.4 0.8 1.3 2.2 0.9 1.8 2.0 0.8
District enrollment size
Less than 2,500 .......................................................... 2.8 0.6 1.3 2.1 3.4 1.3 2.4 3.0 1.0
2,500 to 9,999 ............................................................ 0.6 0.5 0.8 1.4 2.2 1.5 2.5 1.5 1.5
10,000 or more ........................................................... 0.2 0.5 0.6 0.8 1.6 2.0 2.1 1.3 1.3
Community type
City ............................................................................ 6.0 0.4 1.5 2.4 2.0 3.4 4.3 2.3 2.3
Suburban .................................................................... 2.6 0.7 0.7 3.0 4.0 1.6 3.5 1.9 1.9
Town .......................................................................... 3.7 0.8 1.7 2.2 4.7 2.9 5.7 2.9 1.7
Rural .......................................................................... 3.3 0.8 1.7 2.6 4.6 1.6 2.5 3.9 0.9
Region
Northeast .................................................................... 5.0 0.8 1.4 3.8 5.2 2.1 5.4 2.4 2.0
Southeast .................................................................... 3.4 1.2 1.1 2.5 3.3 2.1 2.8 2.9 2.0
Central ........................................................................ 2.9 0.8 1.3 3.0 4.5 1.8 3.0 4.3 1.1
West ........................................................................... 4.6 1.0 2.5 1.7 3.9 1.7 3.2 3.1 0.9
Poverty concentration
Less than 10 percent ................................................... 4.4 0.8 1.4 3.2 3.9 1.7 4.6 3.1 1.3
10 to 19 percent .......................................................... 3.2 0.6 1.6 2.1 3.4 1.7 2.7 4.3 1.4
20 percent or more ..................................................... 3.1 1.0 1.9 2.7 4.3 2.1 2.7 3.2 1.3
SOURCE: U.S. Department of Education, National Center for Education Statistics, Fast Response Survey System (FRSS), ―Educational
Technology in Public School Districts, Fall 2008,‖ FRSS 93, 2008.
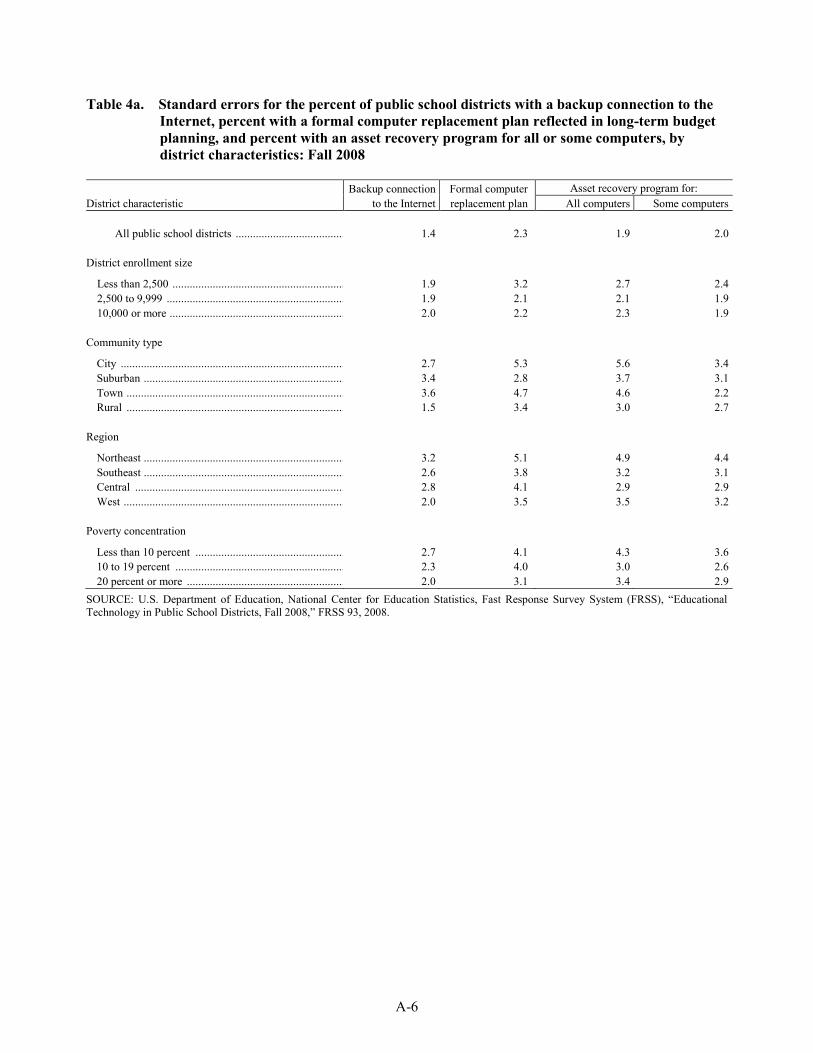
A-6
Table 4a. Standard errors for the percent of public school districts with a backup connection to the
Internet, percent with a formal computer replacement plan reflected in long-term budget
planning, and percent with an asset recovery program for all or some computers, by
district characteristics: Fall 2008
District characteristic
Backup connection
to the Internet
Formal computer
replacement plan
Asset recovery program for:
All computers Some computers
All public school districts ..................................................................... 1.4 2.3 1.9 2.0
District enrollment size
Less than 2,500 ........................................................................................... 1.9 3.2 2.7 2.4
2,500 to 9,999 ............................................................................................. 1.9 2.1 2.1 1.9
10,000 or more ............................................................................................ 2.0 2.2 2.3 1.9
Community type
City ............................................................................................................. 2.7 5.3 5.6 3.4
Suburban ..................................................................................................... 3.4 2.8 3.7 3.1
Town ........................................................................................................... 3.6 4.7 4.6 2.2
Rural ........................................................................................................... 1.5 3.4 3.0 2.7
Region
Northeast ..................................................................................................... 3.2 5.1 4.9 4.4
Southeast ..................................................................................................... 2.6 3.8 3.2 3.1
Central ........................................................................................................ 2.8 4.1 2.9 2.9
West ............................................................................................................ 2.0 3.5 3.5 3.2
Poverty concentration
Less than 10 percent ................................................................................... 2.7 4.1 4.3 3.6
10 to 19 percent .......................................................................................... 2.3 4.0 3.0 2.6
20 percent or more ...................................................................................... 2.0 3.1 3.4 2.9
SOURCE: U.S. Department of Education, National Center for Education Statistics, Fast Response Survey System (FRSS), ―Educational
Technology in Public School Districts, Fall 2008,‖ FRSS 93, 2008.
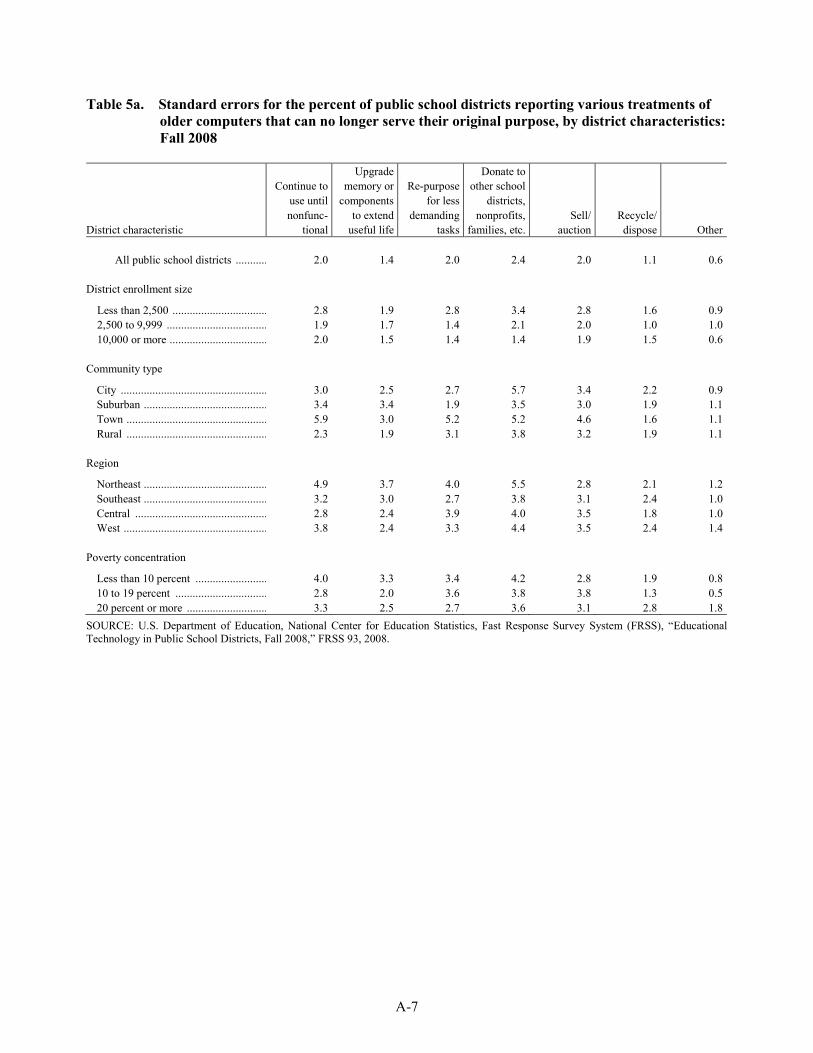
A-7
Table 5a. Standard errors for the percent of public school districts reporting various treatments of
older computers that can no longer serve their original purpose, by district characteristics:
Fall 2008
District characteristic
Continue to
use until
nonfunc-
tional
Upgrade
memory or
components
to extend
useful life
Re-purpose
for less
demanding
tasks
Donate to
other school
districts,
nonprofits,
families, etc.
Sell/
auction
Recycle/
dispose Other
All public school districts .................................... 2.0 1.4 2.0 2.4 2.0 1.1 0.6
District enrollment size
Less than 2,500 .......................................................... 2.8 1.9 2.8 3.4 2.8 1.6 0.9
2,500 to 9,999 ............................................................ 1.9 1.7 1.4 2.1 2.0 1.0 1.0
10,000 or more ........................................................... 2.0 1.5 1.4 1.4 1.9 1.5 0.6
Community type
City ............................................................................ 3.0 2.5 2.7 5.7 3.4 2.2 0.9
Suburban .................................................................... 3.4 3.4 1.9 3.5 3.0 1.9 1.1
Town .......................................................................... 5.9 3.0 5.2 5.2 4.6 1.6 1.1
Rural .......................................................................... 2.3 1.9 3.1 3.8 3.2 1.9 1.1
Region
Northeast .................................................................... 4.9 3.7 4.0 5.5 2.8 2.1 1.2
Southeast .................................................................... 3.2 3.0 2.7 3.8 3.1 2.4 1.0
Central ....................................................................... 2.8 2.4 3.9 4.0 3.5 1.8 1.0
West ........................................................................... 3.8 2.4 3.3 4.4 3.5 2.4 1.4
Poverty concentration
Less than 10 percent .................................................. 4.0 3.3 3.4 4.2 2.8 1.9 0.8
10 to 19 percent ......................................................... 2.8 2.0 3.6 3.8 3.8 1.3 0.5
20 percent or more ..................................................... 3.3 2.5 2.7 3.6 3.1 2.8 1.8
SOURCE: U.S. Department of Education, National Center for Education Statistics, Fast Response Survey System (FRSS), ―Educational
Technology in Public School Districts, Fall 2008,‖ FRSS 93, 2008.
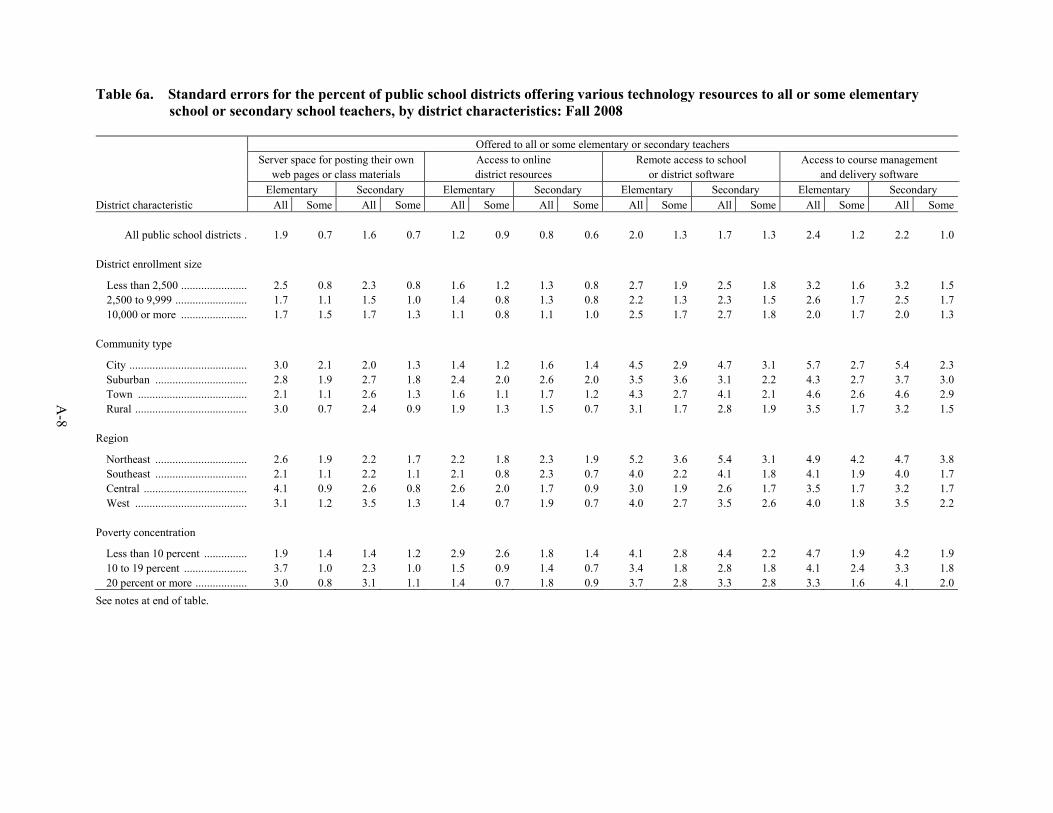
A-8
Table 6a. Standard errors for the percent of public school districts offering various technology resources to all or some elementary
school or secondary school teachers, by district characteristics: Fall 2008
District characteristic
Offered to all or some elementary or secondary teachers
Server space for posting their own
web pages or class materials
Access to online
district resources
Remote access to school
or district software
Access to course management
and delivery software
Elementary Secondary Elementary Secondary Elementary Secondary Elementary Secondary
All Some All Some All Some All Some All Some All Some All Some All Some
All public school districts .................................... 1.9 0.7 1.6 0.7 1.2 0.9 0.8 0.6 2.0 1.3 1.7 1.3 2.4 1.2 2.2 1.0
District enrollment size
Less than 2,500 .......................................................... 2.5 0.8 2.3 0.8 1.6 1.2 1.3 0.8 2.7 1.9 2.5 1.8 3.2 1.6 3.2 1.5
2,500 to 9,999 ............................................................ 1.7 1.1 1.5 1.0 1.4 0.8 1.3 0.8 2.2 1.3 2.3 1.5 2.6 1.7 2.5 1.7
10,000 or more .......................................................... 1.7 1.5 1.7 1.3 1.1 0.8 1.1 1.0 2.5 1.7 2.7 1.8 2.0 1.7 2.0 1.3
Community type
City ............................................................................ 3.0 2.1 2.0 1.3 1.4 1.2 1.6 1.4 4.5 2.9 4.7 3.1 5.7 2.7 5.4 2.3
Suburban ................................................................... 2.8 1.9 2.7 1.8 2.4 2.0 2.6 2.0 3.5 3.6 3.1 2.2 4.3 2.7 3.7 3.0
Town ......................................................................... 2.1 1.1 2.6 1.3 1.6 1.1 1.7 1.2 4.3 2.7 4.1 2.1 4.6 2.6 4.6 2.9
Rural .......................................................................... 3.0 0.7 2.4 0.9 1.9 1.3 1.5 0.7 3.1 1.7 2.8 1.9 3.5 1.7 3.2 1.5
Region
Northeast ................................................................... 2.6 1.9 2.2 1.7 2.2 1.8 2.3 1.9 5.2 3.6 5.4 3.1 4.9 4.2 4.7 3.8
Southeast ................................................................... 2.1 1.1 2.2 1.1 2.1 0.8 2.3 0.7 4.0 2.2 4.1 1.8 4.1 1.9 4.0 1.7
Central ....................................................................... 4.1 0.9 2.6 0.8 2.6 2.0 1.7 0.9 3.0 1.9 2.6 1.7 3.5 1.7 3.2 1.7
West .......................................................................... 3.1 1.2 3.5 1.3 1.4 0.7 1.9 0.7 4.0 2.7 3.5 2.6 4.0 1.8 3.5 2.2
Poverty concentration
Less than 10 percent .................................................. 1.9 1.4 1.4 1.2 2.9 2.6 1.8 1.4 4.1 2.8 4.4 2.2 4.7 1.9 4.2 1.9
10 to 19 percent ......................................................... 3.7 1.0 2.3 1.0 1.5 0.9 1.4 0.7 3.4 1.8 2.8 1.8 4.1 2.4 3.3 1.8
20 percent or more ..................................................... 3.0 0.8 3.1 1.1 1.4 0.7 1.8 0.9 3.7 2.8 3.3 2.8 3.3 1.6 4.1 2.0
See notes at end of table.
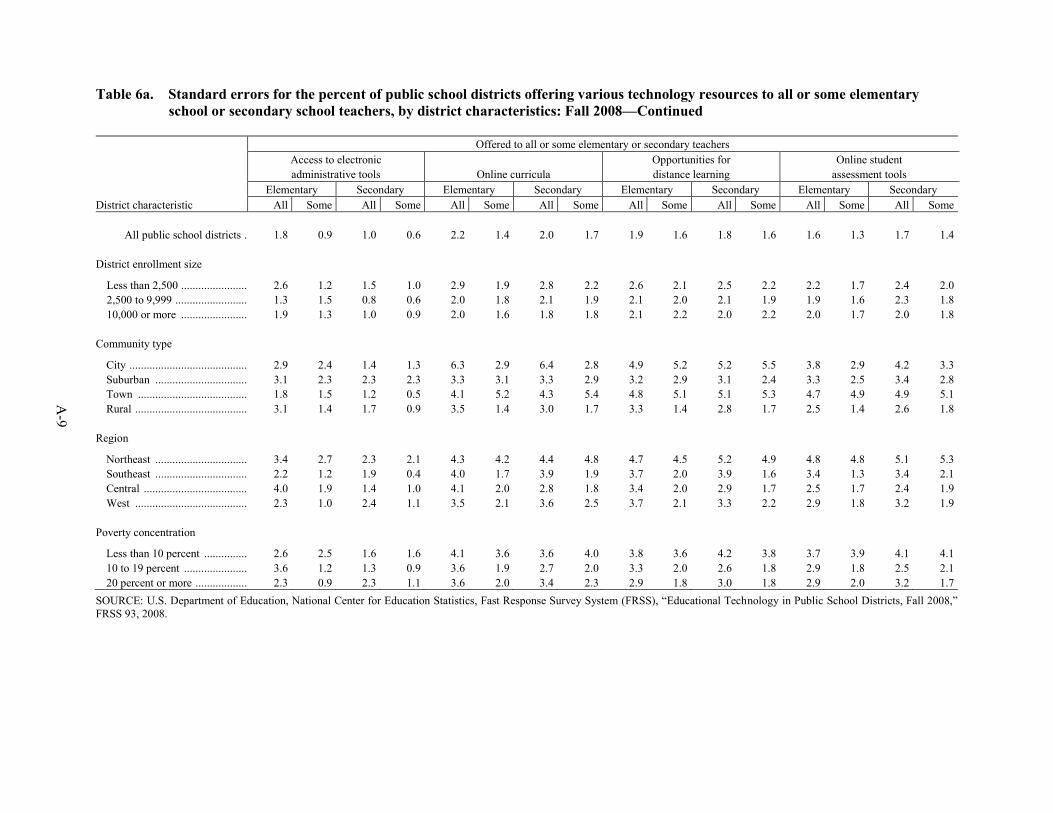
A-9
Table 6a. Standard errors for the percent of public school districts offering various technology resources to all or some elementary
school or secondary school teachers, by district characteristics: Fall 2008—Continued
District characteristic
Offered to all or some elementary or secondary teachers
Access to electronic
administrative tools Online curricula
Opportunities for
distance learning
Online student
assessment tools
Elementary Secondary Elementary Secondary Elementary Secondary Elementary Secondary
All Some All Some All Some All Some All Some All Some All Some All Some
All public school districts .................................... 1.8 0.9 1.0 0.6 2.2 1.4 2.0 1.7 1.9 1.6 1.8 1.6 1.6 1.3 1.7 1.4
District enrollment size
Less than 2,500 .......................................................... 2.6 1.2 1.5 1.0 2.9 1.9 2.8 2.2 2.6 2.1 2.5 2.2 2.2 1.7 2.4 2.0
2,500 to 9,999 ............................................................ 1.3 1.5 0.8 0.6 2.0 1.8 2.1 1.9 2.1 2.0 2.1 1.9 1.9 1.6 2.3 1.8
10,000 or more .......................................................... 1.9 1.3 1.0 0.9 2.0 1.6 1.8 1.8 2.1 2.2 2.0 2.2 2.0 1.7 2.0 1.8
Community type
City ............................................................................ 2.9 2.4 1.4 1.3 6.3 2.9 6.4 2.8 4.9 5.2 5.2 5.5 3.8 2.9 4.2 3.3
Suburban ................................................................... 3.1 2.3 2.3 2.3 3.3 3.1 3.3 2.9 3.2 2.9 3.1 2.4 3.3 2.5 3.4 2.8
Town ......................................................................... 1.8 1.5 1.2 0.5 4.1 5.2 4.3 5.4 4.8 5.1 5.1 5.3 4.7 4.9 4.9 5.1
Rural .......................................................................... 3.1 1.4 1.7 0.9 3.5 1.4 3.0 1.7 3.3 1.4 2.8 1.7 2.5 1.4 2.6 1.8
Region
Northeast ................................................................... 3.4 2.7 2.3 2.1 4.3 4.2 4.4 4.8 4.7 4.5 5.2 4.9 4.8 4.8 5.1 5.3
Southeast ................................................................... 2.2 1.2 1.9 0.4 4.0 1.7 3.9 1.9 3.7 2.0 3.9 1.6 3.4 1.3 3.4 2.1
Central ....................................................................... 4.0 1.9 1.4 1.0 4.1 2.0 2.8 1.8 3.4 2.0 2.9 1.7 2.5 1.7 2.4 1.9
West .......................................................................... 2.3 1.0 2.4 1.1 3.5 2.1 3.6 2.5 3.7 2.1 3.3 2.2 2.9 1.8 3.2 1.9
Poverty concentration
Less than 10 percent .................................................. 2.6 2.5 1.6 1.6 4.1 3.6 3.6 4.0 3.8 3.6 4.2 3.8 3.7 3.9 4.1 4.1
10 to 19 percent ......................................................... 3.6 1.2 1.3 0.9 3.6 1.9 2.7 2.0 3.3 2.0 2.6 1.8 2.9 1.8 2.5 2.1
20 percent or more ..................................................... 2.3 0.9 2.3 1.1 3.6 2.0 3.4 2.3 2.9 1.8 3.0 1.8 2.9 2.0 3.2 1.7
SOURCE: U.S. Department of Education, National Center for Education Statistics, Fast Response Survey System (FRSS), ―Educational Technology in Public School Districts, Fall 2008,‖
FRSS 93, 2008.
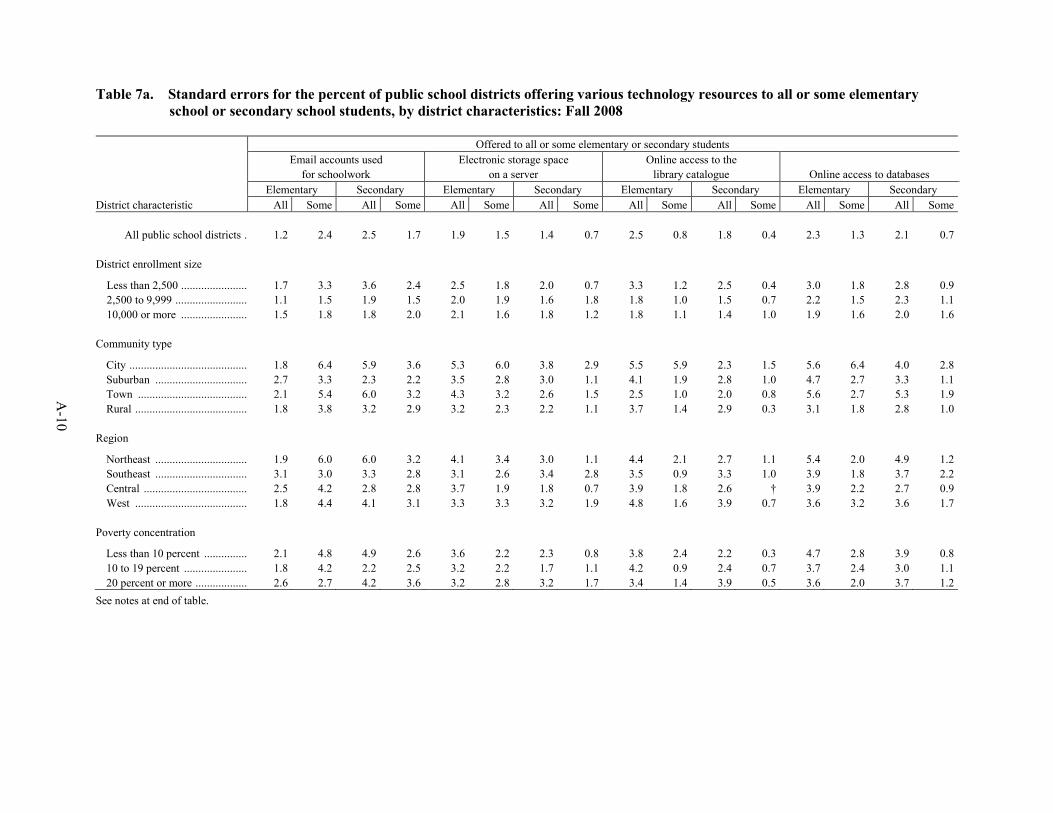
A-1
0
Table 7a. Standard errors for the percent of public school districts offering various technology resources to all or some elementary
school or secondary school students, by district characteristics: Fall 2008
District characteristic
Offered to all or some elementary or secondary students
Email accounts used
for schoolwork
Electronic storage space
on a server
Online access to the
library catalogue Online access to databases
Elementary Secondary Elementary Secondary Elementary Secondary Elementary Secondary
All Some All Some All Some All Some All Some All Some All Some All Some
All public school districts .................................... 1.2 2.4 2.5 1.7 1.9 1.5 1.4 0.7 2.5 0.8 1.8 0.4 2.3 1.3 2.1 0.7
District enrollment size
Less than 2,500 .......................................................... 1.7 3.3 3.6 2.4 2.5 1.8 2.0 0.7 3.3 1.2 2.5 0.4 3.0 1.8 2.8 0.9
2,500 to 9,999 ............................................................ 1.1 1.5 1.9 1.5 2.0 1.9 1.6 1.8 1.8 1.0 1.5 0.7 2.2 1.5 2.3 1.1
10,000 or more .......................................................... 1.5 1.8 1.8 2.0 2.1 1.6 1.8 1.2 1.8 1.1 1.4 1.0 1.9 1.6 2.0 1.6
Community type
City ............................................................................ 1.8 6.4 5.9 3.6 5.3 6.0 3.8 2.9 5.5 5.9 2.3 1.5 5.6 6.4 4.0 2.8
Suburban ................................................................... 2.7 3.3 2.3 2.2 3.5 2.8 3.0 1.1 4.1 1.9 2.8 1.0 4.7 2.7 3.3 1.1
Town ......................................................................... 2.1 5.4 6.0 3.2 4.3 3.2 2.6 1.5 2.5 1.0 2.0 0.8 5.6 2.7 5.3 1.9
Rural .......................................................................... 1.8 3.8 3.2 2.9 3.2 2.3 2.2 1.1 3.7 1.4 2.9 0.3 3.1 1.8 2.8 1.0
Region
Northeast ................................................................... 1.9 6.0 6.0 3.2 4.1 3.4 3.0 1.1 4.4 2.1 2.7 1.1 5.4 2.0 4.9 1.2
Southeast ................................................................... 3.1 3.0 3.3 2.8 3.1 2.6 3.4 2.8 3.5 0.9 3.3 1.0 3.9 1.8 3.7 2.2
Central ....................................................................... 2.5 4.2 2.8 2.8 3.7 1.9 1.8 0.7 3.9 1.8 2.6 † 3.9 2.2 2.7 0.9
West .......................................................................... 1.8 4.4 4.1 3.1 3.3 3.3 3.2 1.9 4.8 1.6 3.9 0.7 3.6 3.2 3.6 1.7
Poverty concentration
Less than 10 percent .................................................. 2.1 4.8 4.9 2.6 3.6 2.2 2.3 0.8 3.8 2.4 2.2 0.3 4.7 2.8 3.9 0.8
10 to 19 percent ......................................................... 1.8 4.2 2.2 2.5 3.2 2.2 1.7 1.1 4.2 0.9 2.4 0.7 3.7 2.4 3.0 1.1
20 percent or more ..................................................... 2.6 2.7 4.2 3.6 3.2 2.8 3.2 1.7 3.4 1.4 3.9 0.5 3.6 2.0 3.7 1.2
See notes at end of table.
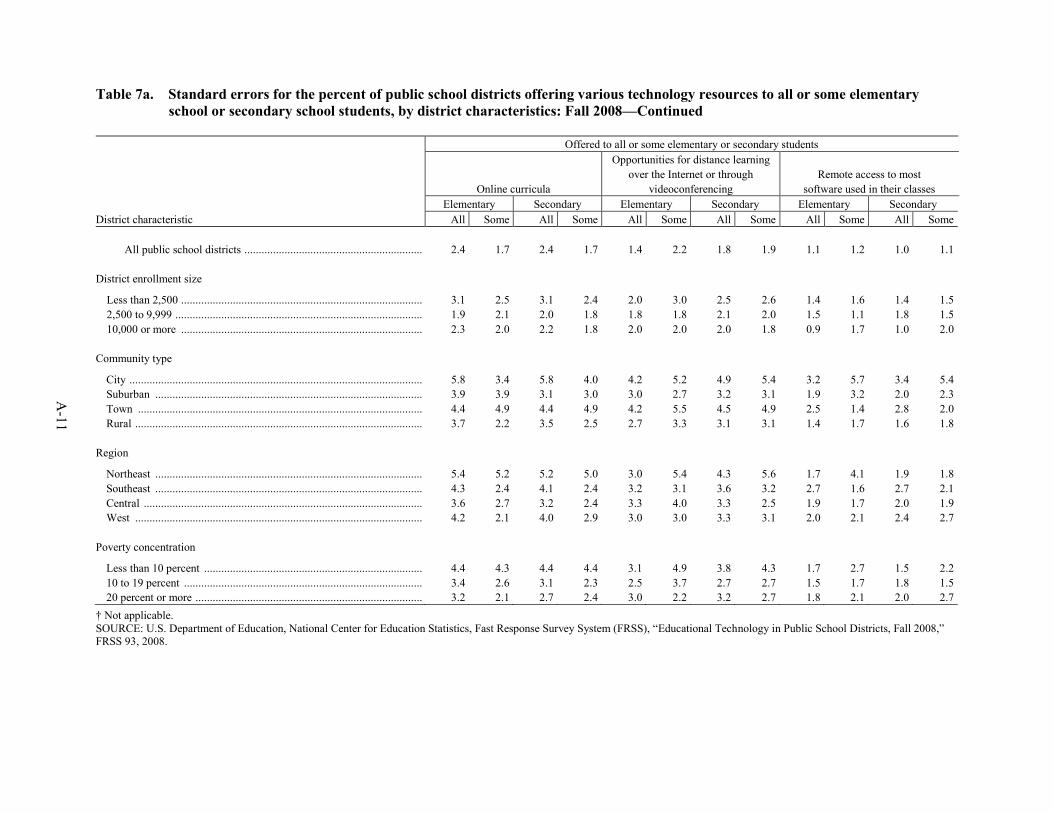
A-1
1
Table 7a. Standard errors for the percent of public school districts offering various technology resources to all or some elementary
school or secondary school students, by district characteristics: Fall 2008—Continued
District characteristic
Offered to all or some elementary or secondary students
Online curricula
Opportunities for distance learning
over the Internet or through
videoconferencing
Remote access to most
software used in their classes
Elementary Secondary Elementary Secondary Elementary Secondary
All Some All Some All Some All Some All Some All Some
All public school districts .............................................................. 2.4 1.7 2.4 1.7 1.4 2.2 1.8 1.9 1.1 1.2 1.0 1.1
District enrollment size
Less than 2,500 .................................................................................... 3.1 2.5 3.1 2.4 2.0 3.0 2.5 2.6 1.4 1.6 1.4 1.5
2,500 to 9,999 ...................................................................................... 1.9 2.1 2.0 1.8 1.8 1.8 2.1 2.0 1.5 1.1 1.8 1.5
10,000 or more .................................................................................... 2.3 2.0 2.2 1.8 2.0 2.0 2.0 1.8 0.9 1.7 1.0 2.0
Community type
City ...................................................................................................... 5.8 3.4 5.8 4.0 4.2 5.2 4.9 5.4 3.2 5.7 3.4 5.4
Suburban ............................................................................................. 3.9 3.9 3.1 3.0 3.0 2.7 3.2 3.1 1.9 3.2 2.0 2.3
Town ................................................................................................... 4.4 4.9 4.4 4.9 4.2 5.5 4.5 4.9 2.5 1.4 2.8 2.0
Rural .................................................................................................... 3.7 2.2 3.5 2.5 2.7 3.3 3.1 3.1 1.4 1.7 1.6 1.8
Region
Northeast ............................................................................................. 5.4 5.2 5.2 5.0 3.0 5.4 4.3 5.6 1.7 4.1 1.9 1.8
Southeast ............................................................................................. 4.3 2.4 4.1 2.4 3.2 3.1 3.6 3.2 2.7 1.6 2.7 2.1
Central ................................................................................................. 3.6 2.7 3.2 2.4 3.3 4.0 3.3 2.5 1.9 1.7 2.0 1.9
West .................................................................................................... 4.2 2.1 4.0 2.9 3.0 3.0 3.3 3.1 2.0 2.1 2.4 2.7
Poverty concentration
Less than 10 percent ............................................................................ 4.4 4.3 4.4 4.4 3.1 4.9 3.8 4.3 1.7 2.7 1.5 2.2
10 to 19 percent ................................................................................... 3.4 2.6 3.1 2.3 2.5 3.7 2.7 2.7 1.5 1.7 1.8 1.5
20 percent or more ............................................................................... 3.2 2.1 2.7 2.4 3.0 2.2 3.2 2.7 1.8 2.1 2.0 2.7
† Not applicable.
SOURCE: U.S. Department of Education, National Center for Education Statistics, Fast Response Survey System (FRSS), ―Educational Technology in Public School Districts, Fall 2008,‖
FRSS 93, 2008.
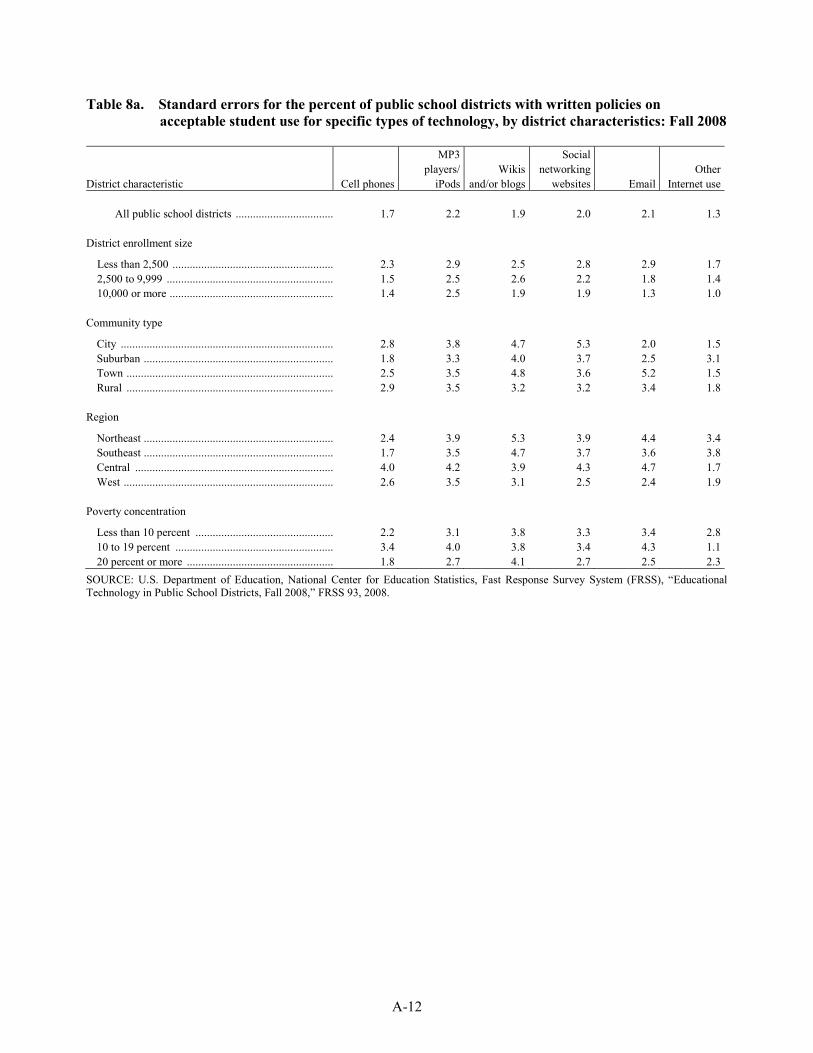
A-12
Table 8a. Standard errors for the percent of public school districts with written policies on
acceptable student use for specific types of technology, by district characteristics: Fall 2008
District characteristic Cell phones
MP3
players/
iPods
Wikis
and/or blogs
Social
networking
websites Email
Other
Internet use
All public school districts .................................... 1.7 2.2 1.9 2.0 2.1 1.3
District enrollment size
Less than 2,500 .......................................................... 2.3 2.9 2.5 2.8 2.9 1.7
2,500 to 9,999 ............................................................ 1.5 2.5 2.6 2.2 1.8 1.4
10,000 or more ........................................................... 1.4 2.5 1.9 1.9 1.3 1.0
Community type
City ............................................................................ 2.8 3.8 4.7 5.3 2.0 1.5
Suburban .................................................................... 1.8 3.3 4.0 3.7 2.5 3.1
Town .......................................................................... 2.5 3.5 4.8 3.6 5.2 1.5
Rural .......................................................................... 2.9 3.5 3.2 3.2 3.4 1.8
Region
Northeast .................................................................... 2.4 3.9 5.3 3.9 4.4 3.4
Southeast .................................................................... 1.7 3.5 4.7 3.7 3.6 3.8
Central ....................................................................... 4.0 4.2 3.9 4.3 4.7 1.7
West ........................................................................... 2.6 3.5 3.1 2.5 2.4 1.9
Poverty concentration
Less than 10 percent .................................................. 2.2 3.1 3.8 3.3 3.4 2.8
10 to 19 percent ......................................................... 3.4 4.0 3.8 3.4 4.3 1.1
20 percent or more ..................................................... 1.8 2.7 4.1 2.7 2.5 2.3
SOURCE: U.S. Department of Education, National Center for Education Statistics, Fast Response Survey System (FRSS), ―Educational
Technology in Public School Districts, Fall 2008,‖ FRSS 93, 2008.
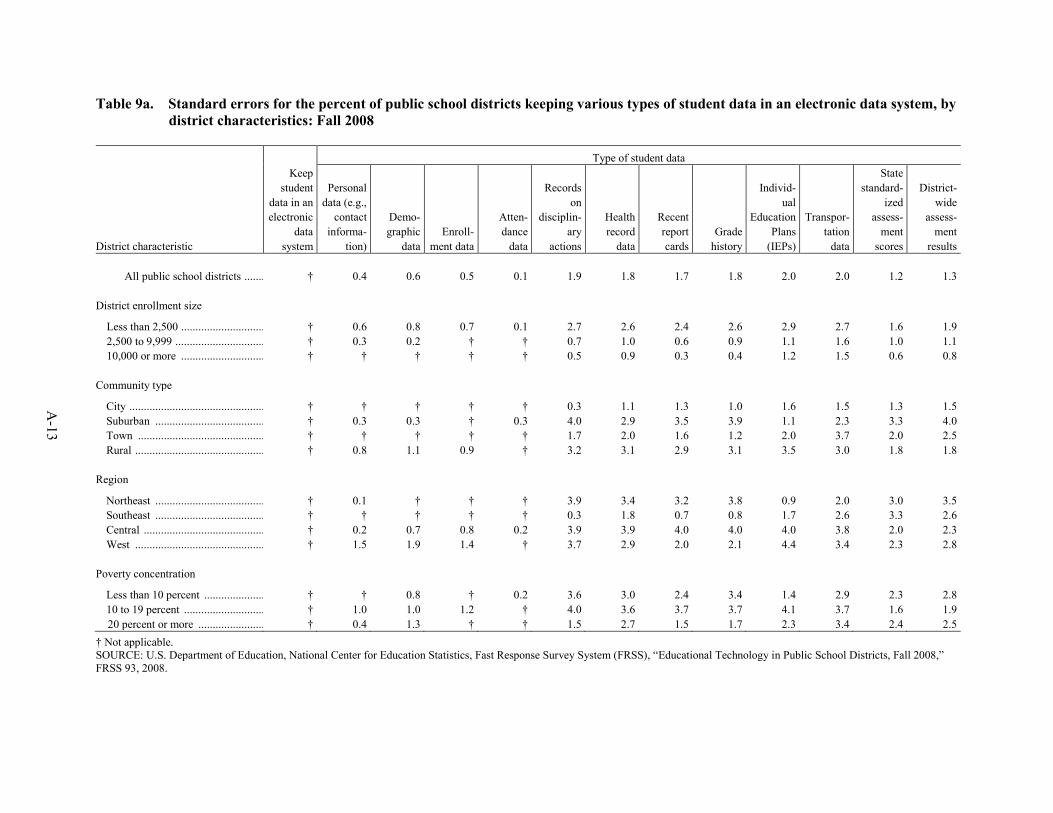
A-1
3
Table 9a. Standard errors for the percent of public school districts keeping various types of student data in an electronic data system, by
district characteristics: Fall 2008
District characteristic
Keep
student
data in an
electronic
data
system
Type of student data
Personal
data (e.g.,
contact
informa-
tion)
Demo-
graphic
data
Enroll-
ment data
Atten-
dance
data
Records
on
disciplin-
ary
actions
Health
record
data
Recent
report
cards
Grade
history
Individ-
ual
Education
Plans
(IEPs)
Transpor-
tation
data
State
standard-
ized
assess-
ment
scores
District-
wide
assess-
ment
results
All public school districts ........................................... † 0.4 0.6 0.5 0.1 1.9 1.8 1.7 1.8 2.0 2.0 1.2 1.3
District enrollment size
Less than 2,500 .......................................................... † 0.6 0.8 0.7 0.1 2.7 2.6 2.4 2.6 2.9 2.7 1.6 1.9
2,500 to 9,999 ............................................................ † 0.3 0.2 † † 0.7 1.0 0.6 0.9 1.1 1.6 1.0 1.1
10,000 or more .......................................................... † † † † † 0.5 0.9 0.3 0.4 1.2 1.5 0.6 0.8
Community type
City ............................................................................ † † † † † 0.3 1.1 1.3 1.0 1.6 1.5 1.3 1.5
Suburban ................................................................... † 0.3 0.3 † 0.3 4.0 2.9 3.5 3.9 1.1 2.3 3.3 4.0
Town ......................................................................... † † † † † 1.7 2.0 1.6 1.2 2.0 3.7 2.0 2.5
Rural .......................................................................... † 0.8 1.1 0.9 † 3.2 3.1 2.9 3.1 3.5 3.0 1.8 1.8
Region
Northeast ................................................................... † 0.1 † † † 3.9 3.4 3.2 3.8 0.9 2.0 3.0 3.5
Southeast ................................................................... † † † † † 0.3 1.8 0.7 0.8 1.7 2.6 3.3 2.6
Central ....................................................................... † 0.2 0.7 0.8 0.2 3.9 3.9 4.0 4.0 4.0 3.8 2.0 2.3
West .......................................................................... † 1.5 1.9 1.4 † 3.7 2.9 2.0 2.1 4.4 3.4 2.3 2.8
Poverty concentration
Less than 10 percent .................................................. † † 0.8 † 0.2 3.6 3.0 2.4 3.4 1.4 2.9 2.3 2.8
10 to 19 percent ......................................................... † 1.0 1.0 1.2 † 4.0 3.6 3.7 3.7 4.1 3.7 1.6 1.9
20 percent or more ............................................................................. † 0.4 1.3 † † 1.5 2.7 1.5 1.7 2.3 3.4 2.4 2.5
† Not applicable.
SOURCE: U.S. Department of Education, National Center for Education Statistics, Fast Response Survey System (FRSS), ―Educational Technology in Public School Districts, Fall 2008,‖
FRSS 93, 2008.
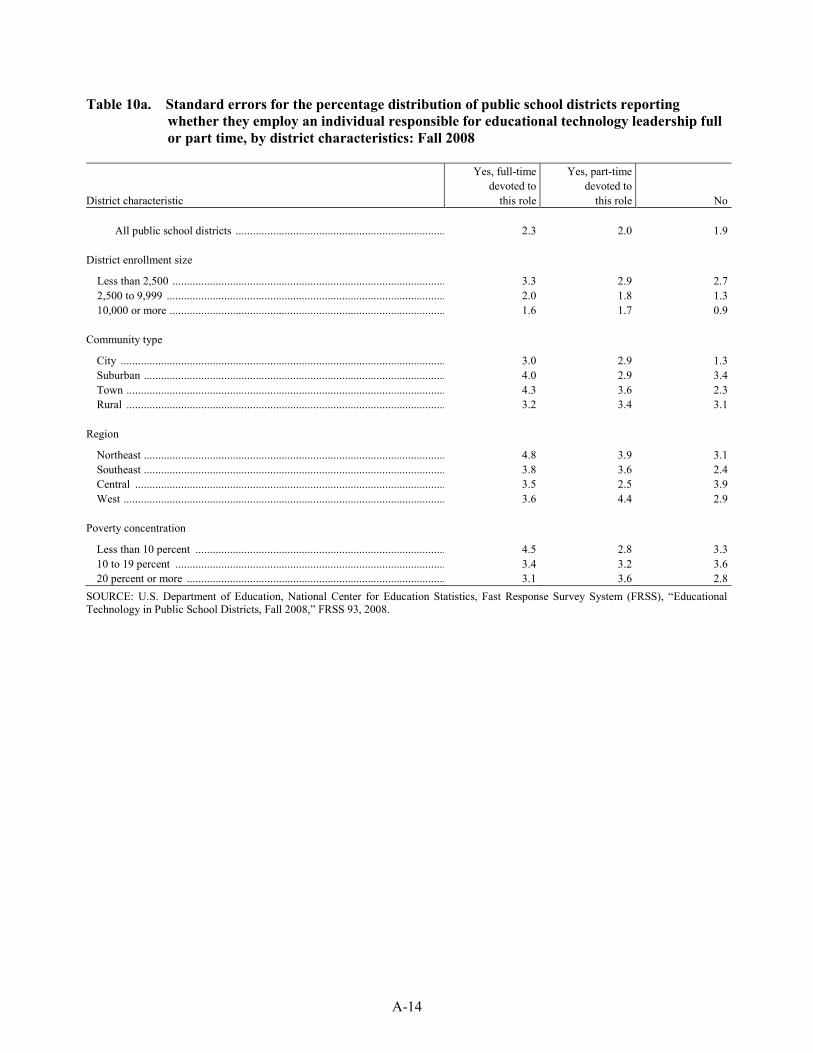
A-14
Table 10a. Standard errors for the percentage distribution of public school districts reporting
whether they employ an individual responsible for educational technology leadership full
or part time, by district characteristics: Fall 2008
District characteristic
Yes, full-time
devoted to
this role
Yes, part-time
devoted to
this role No
All public school districts ......................................................................... 2.3 2.0 1.9
District enrollment size
Less than 2,500 ............................................................................................... 3.3 2.9 2.7
2,500 to 9,999 ................................................................................................. 2.0 1.8 1.3
10,000 or more ................................................................................................ 1.6 1.7 0.9
Community type
City ................................................................................................................. 3.0 2.9 1.3
Suburban ......................................................................................................... 4.0 2.9 3.4
Town ............................................................................................................... 4.3 3.6 2.3
Rural ............................................................................................................... 3.2 3.4 3.1
Region
Northeast ......................................................................................................... 4.8 3.9 3.1
Southeast ......................................................................................................... 3.8 3.6 2.4
Central ............................................................................................................ 3.5 2.5 3.9
West ................................................................................................................ 3.6 4.4 2.9
Poverty concentration
Less than 10 percent ....................................................................................... 4.5 2.8 3.3
10 to 19 percent .............................................................................................. 3.4 3.2 3.6
20 percent or more .......................................................................................... 3.1 3.6 2.8
SOURCE: U.S. Department of Education, National Center for Education Statistics, Fast Response Survey System (FRSS), ―Educational
Technology in Public School Districts, Fall 2008,‖ FRSS 93, 2008.
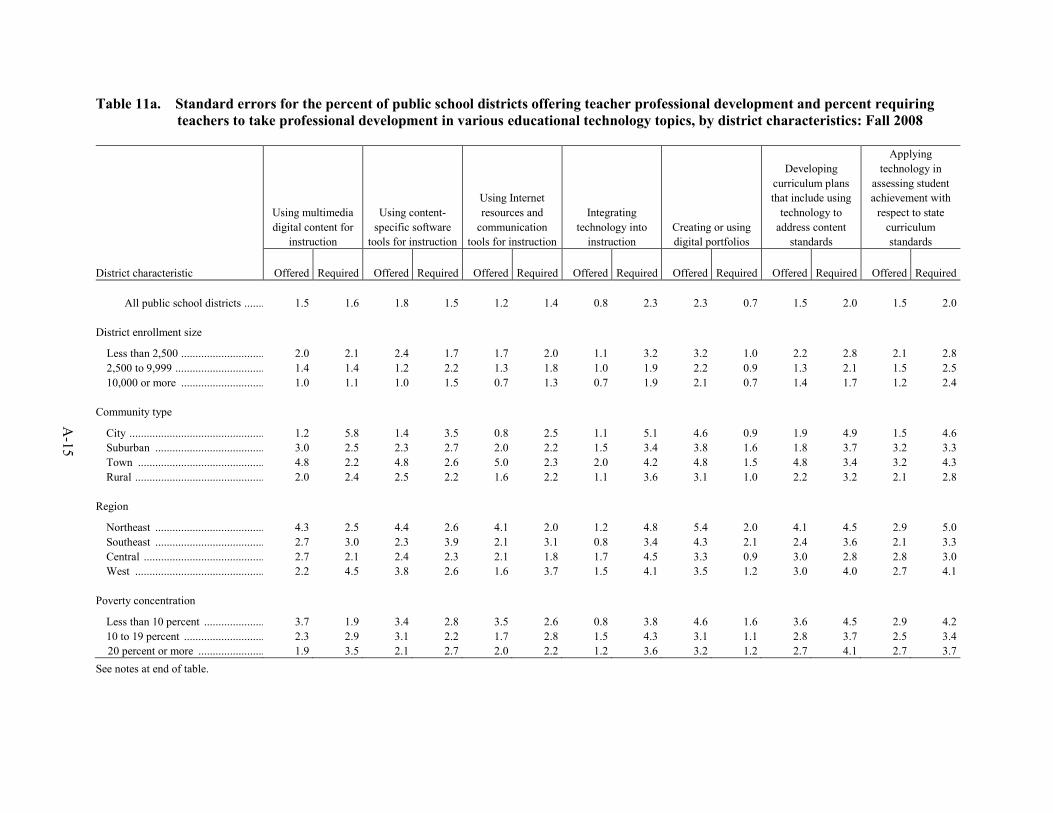
A-1
5
Table 11a. Standard errors for the percent of public school districts offering teacher professional development and percent requiring
teachers to take professional development in various educational technology topics, by district characteristics: Fall 2008
District characteristic
Using multimedia
digital content for
instruction
Using content-
specific software
tools for instruction
Using Internet
resources and
communication
tools for instruction
Integrating
technology into
instruction
Creating or using
digital portfolios
Developing
curriculum plans
that include using
technology to
address content
standards
Applying
technology in
assessing student
achievement with
respect to state
curriculum
standards
Offered Required Offered Required Offered Required Offered Required Offered Required Offered Required Offered Required
All public school districts ........................................... 1.5 1.6 1.8 1.5 1.2 1.4 0.8 2.3 2.3 0.7 1.5 2.0 1.5 2.0
District enrollment size
Less than 2,500 .......................................................... 2.0 2.1 2.4 1.7 1.7 2.0 1.1 3.2 3.2 1.0 2.2 2.8 2.1 2.8
2,500 to 9,999 ............................................................ 1.4 1.4 1.2 2.2 1.3 1.8 1.0 1.9 2.2 0.9 1.3 2.1 1.5 2.5
10,000 or more .......................................................... 1.0 1.1 1.0 1.5 0.7 1.3 0.7 1.9 2.1 0.7 1.4 1.7 1.2 2.4
Community type
City ............................................................................ 1.2 5.8 1.4 3.5 0.8 2.5 1.1 5.1 4.6 0.9 1.9 4.9 1.5 4.6
Suburban ................................................................... 3.0 2.5 2.3 2.7 2.0 2.2 1.5 3.4 3.8 1.6 1.8 3.7 3.2 3.3
Town ......................................................................... 4.8 2.2 4.8 2.6 5.0 2.3 2.0 4.2 4.8 1.5 4.8 3.4 3.2 4.3
Rural .......................................................................... 2.0 2.4 2.5 2.2 1.6 2.2 1.1 3.6 3.1 1.0 2.2 3.2 2.1 2.8
Region
Northeast ................................................................... 4.3 2.5 4.4 2.6 4.1 2.0 1.2 4.8 5.4 2.0 4.1 4.5 2.9 5.0
Southeast ................................................................... 2.7 3.0 2.3 3.9 2.1 3.1 0.8 3.4 4.3 2.1 2.4 3.6 2.1 3.3
Central ....................................................................... 2.7 2.1 2.4 2.3 2.1 1.8 1.7 4.5 3.3 0.9 3.0 2.8 2.8 3.0
West .......................................................................... 2.2 4.5 3.8 2.6 1.6 3.7 1.5 4.1 3.5 1.2 3.0 4.0 2.7 4.1
Poverty concentration
Less than 10 percent .................................................. 3.7 1.9 3.4 2.8 3.5 2.6 0.8 3.8 4.6 1.6 3.6 4.5 2.9 4.2
10 to 19 percent ......................................................... 2.3 2.9 3.1 2.2 1.7 2.8 1.5 4.3 3.1 1.1 2.8 3.7 2.5 3.4
20 percent or more ............................................................................. 1.9 3.5 2.1 2.7 2.0 2.2 1.2 3.6 3.2 1.2 2.7 4.1 2.7 3.7
See notes at end of table.
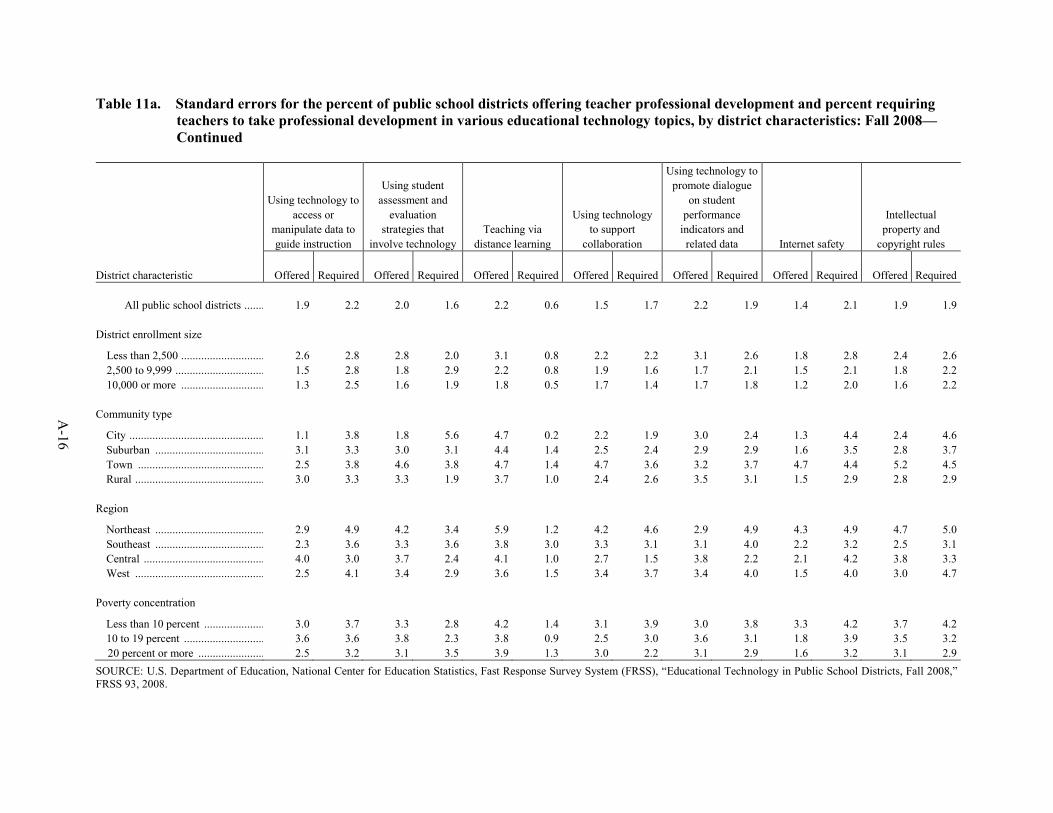
A-1
6
Table 11a. Standard errors for the percent of public school districts offering teacher professional development and percent requiring
teachers to take professional development in various educational technology topics, by district characteristics: Fall 2008—
Continued
District characteristic
Using technology to
access or
manipulate data to
guide instruction
Using student
assessment and
evaluation
strategies that
involve technology
Teaching via
distance learning
Using technology
to support
collaboration
Using technology to
promote dialogue
on student
performance
indicators and
related data Internet safety
Intellectual
property and
copyright rules
Offered Required Offered Required Offered Required Offered Required Offered Required Offered Required Offered Required
All public school districts ........................................... 1.9 2.2 2.0 1.6 2.2 0.6 1.5 1.7 2.2 1.9 1.4 2.1 1.9 1.9
District enrollment size
Less than 2,500 .......................................................... 2.6 2.8 2.8 2.0 3.1 0.8 2.2 2.2 3.1 2.6 1.8 2.8 2.4 2.6
2,500 to 9,999 ............................................................ 1.5 2.8 1.8 2.9 2.2 0.8 1.9 1.6 1.7 2.1 1.5 2.1 1.8 2.2
10,000 or more .......................................................... 1.3 2.5 1.6 1.9 1.8 0.5 1.7 1.4 1.7 1.8 1.2 2.0 1.6 2.2
Community type
City ............................................................................ 1.1 3.8 1.8 5.6 4.7 0.2 2.2 1.9 3.0 2.4 1.3 4.4 2.4 4.6
Suburban ................................................................... 3.1 3.3 3.0 3.1 4.4 1.4 2.5 2.4 2.9 2.9 1.6 3.5 2.8 3.7
Town ......................................................................... 2.5 3.8 4.6 3.8 4.7 1.4 4.7 3.6 3.2 3.7 4.7 4.4 5.2 4.5
Rural .......................................................................... 3.0 3.3 3.3 1.9 3.7 1.0 2.4 2.6 3.5 3.1 1.5 2.9 2.8 2.9
Region
Northeast ................................................................... 2.9 4.9 4.2 3.4 5.9 1.2 4.2 4.6 2.9 4.9 4.3 4.9 4.7 5.0
Southeast ................................................................... 2.3 3.6 3.3 3.6 3.8 3.0 3.3 3.1 3.1 4.0 2.2 3.2 2.5 3.1
Central ....................................................................... 4.0 3.0 3.7 2.4 4.1 1.0 2.7 1.5 3.8 2.2 2.1 4.2 3.8 3.3
West .......................................................................... 2.5 4.1 3.4 2.9 3.6 1.5 3.4 3.7 3.4 4.0 1.5 4.0 3.0 4.7
Poverty concentration
Less than 10 percent .................................................. 3.0 3.7 3.3 2.8 4.2 1.4 3.1 3.9 3.0 3.8 3.3 4.2 3.7 4.2
10 to 19 percent ......................................................... 3.6 3.6 3.8 2.3 3.8 0.9 2.5 3.0 3.6 3.1 1.8 3.9 3.5 3.2
20 percent or more ............................................................................. 2.5 3.2 3.1 3.5 3.9 1.3 3.0 2.2 3.1 2.9 1.6 3.2 3.1 2.9
SOURCE: U.S. Department of Education, National Center for Education Statistics, Fast Response Survey System (FRSS), ―Educational Technology in Public School Districts, Fall 2008,‖
FRSS 93, 2008.
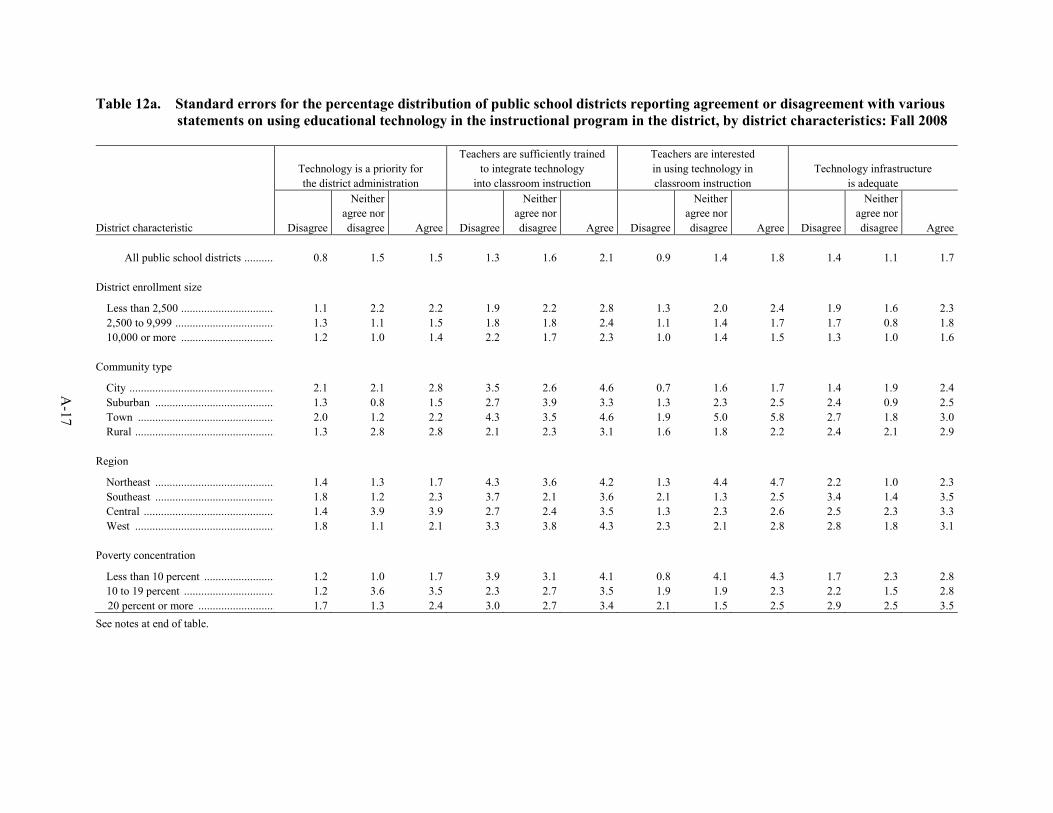
A-1
7
Table 12a. Standard errors for the percentage distribution of public school districts reporting agreement or disagreement with various
statements on using educational technology in the instructional program in the district, by district characteristics: Fall 2008
District characteristic
Technology is a priority for
the district administration
Teachers are sufficiently trained
to integrate technology
into classroom instruction
Teachers are interested
in using technology in
classroom instruction
Technology infrastructure
is adequate
Disagree
Neither
agree nor
disagree Agree Disagree
Neither
agree nor
disagree Agree Disagree
Neither
agree nor
disagree Agree Disagree
Neither
agree nor
disagree Agree
All public school districts ........................................... 0.8 1.5 1.5 1.3 1.6 2.1 0.9 1.4 1.8 1.4 1.1 1.7
District enrollment size
Less than 2,500 .......................................................... 1.1 2.2 2.2 1.9 2.2 2.8 1.3 2.0 2.4 1.9 1.6 2.3
2,500 to 9,999 ............................................................ 1.3 1.1 1.5 1.8 1.8 2.4 1.1 1.4 1.7 1.7 0.8 1.8
10,000 or more .......................................................... 1.2 1.0 1.4 2.2 1.7 2.3 1.0 1.4 1.5 1.3 1.0 1.6
Community type
City ............................................................................ 2.1 2.1 2.8 3.5 2.6 4.6 0.7 1.6 1.7 1.4 1.9 2.4
Suburban ................................................................... 1.3 0.8 1.5 2.7 3.9 3.3 1.3 2.3 2.5 2.4 0.9 2.5
Town ......................................................................... 2.0 1.2 2.2 4.3 3.5 4.6 1.9 5.0 5.8 2.7 1.8 3.0
Rural .......................................................................... 1.3 2.8 2.8 2.1 2.3 3.1 1.6 1.8 2.2 2.4 2.1 2.9
Region
Northeast ................................................................... 1.4 1.3 1.7 4.3 3.6 4.2 1.3 4.4 4.7 2.2 1.0 2.3
Southeast ................................................................... 1.8 1.2 2.3 3.7 2.1 3.6 2.1 1.3 2.5 3.4 1.4 3.5
Central ....................................................................... 1.4 3.9 3.9 2.7 2.4 3.5 1.3 2.3 2.6 2.5 2.3 3.3
West .......................................................................... 1.8 1.1 2.1 3.3 3.8 4.3 2.3 2.1 2.8 2.8 1.8 3.1
Poverty concentration
Less than 10 percent .................................................. 1.2 1.0 1.7 3.9 3.1 4.1 0.8 4.1 4.3 1.7 2.3 2.8
10 to 19 percent ......................................................... 1.2 3.6 3.5 2.3 2.7 3.5 1.9 1.9 2.3 2.2 1.5 2.8
20 percent or more ............................................................................. 1.7 1.3 2.4 3.0 2.7 3.4 2.1 1.5 2.5 2.9 2.5 3.5
See notes at end of table.
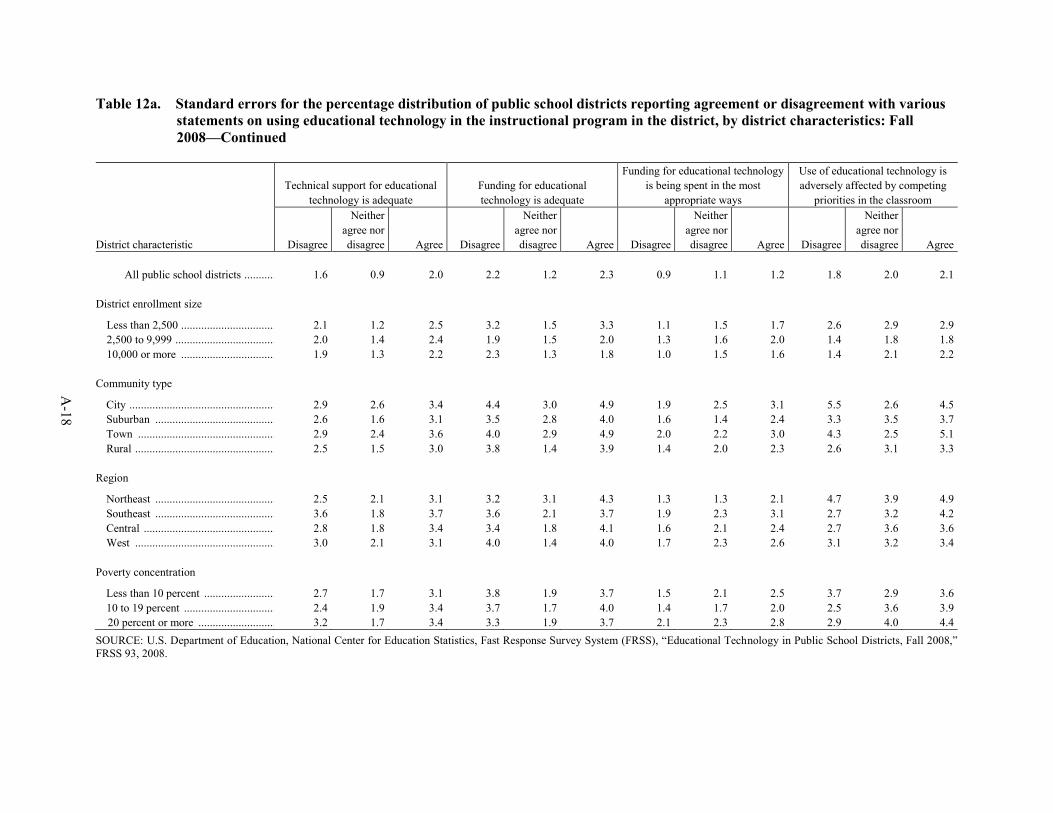
A-1
8
Table 12a. Standard errors for the percentage distribution of public school districts reporting agreement or disagreement with various
statements on using educational technology in the instructional program in the district, by district characteristics: Fall
2008—Continued
District characteristic
Technical support for educational
technology is adequate
Funding for educational
technology is adequate
Funding for educational technology
is being spent in the most
appropriate ways
Use of educational technology is
adversely affected by competing
priorities in the classroom
Disagree
Neither
agree nor
disagree Agree Disagree
Neither
agree nor
disagree Agree Disagree
Neither
agree nor
disagree Agree Disagree
Neither
agree nor
disagree Agree
All public school districts ........................................... 1.6 0.9 2.0 2.2 1.2 2.3 0.9 1.1 1.2 1.8 2.0 2.1
District enrollment size
Less than 2,500 .......................................................... 2.1 1.2 2.5 3.2 1.5 3.3 1.1 1.5 1.7 2.6 2.9 2.9
2,500 to 9,999 ............................................................ 2.0 1.4 2.4 1.9 1.5 2.0 1.3 1.6 2.0 1.4 1.8 1.8
10,000 or more .......................................................... 1.9 1.3 2.2 2.3 1.3 1.8 1.0 1.5 1.6 1.4 2.1 2.2
Community type
City ............................................................................ 2.9 2.6 3.4 4.4 3.0 4.9 1.9 2.5 3.1 5.5 2.6 4.5
Suburban ................................................................... 2.6 1.6 3.1 3.5 2.8 4.0 1.6 1.4 2.4 3.3 3.5 3.7
Town ......................................................................... 2.9 2.4 3.6 4.0 2.9 4.9 2.0 2.2 3.0 4.3 2.5 5.1
Rural .......................................................................... 2.5 1.5 3.0 3.8 1.4 3.9 1.4 2.0 2.3 2.6 3.1 3.3
Region
Northeast ................................................................... 2.5 2.1 3.1 3.2 3.1 4.3 1.3 1.3 2.1 4.7 3.9 4.9
Southeast ................................................................... 3.6 1.8 3.7 3.6 2.1 3.7 1.9 2.3 3.1 2.7 3.2 4.2
Central ....................................................................... 2.8 1.8 3.4 3.4 1.8 4.1 1.6 2.1 2.4 2.7 3.6 3.6
West .......................................................................... 3.0 2.1 3.1 4.0 1.4 4.0 1.7 2.3 2.6 3.1 3.2 3.4
Poverty concentration
Less than 10 percent .................................................. 2.7 1.7 3.1 3.8 1.9 3.7 1.5 2.1 2.5 3.7 2.9 3.6
10 to 19 percent ......................................................... 2.4 1.9 3.4 3.7 1.7 4.0 1.4 1.7 2.0 2.5 3.6 3.9
20 percent or more ............................................................................. 3.2 1.7 3.4 3.3 1.9 3.7 2.1 2.3 2.8 2.9 4.0 4.4
SOURCE: U.S. Department of Education, National Center for Education Statistics, Fast Response Survey System (FRSS), ―Educational Technology in Public School Districts, Fall 2008,‖
FRSS 93, 2008.

B-1
Appendix B
Technical Notes

This page intentionally left blank.
B-3
Technical Notes
Fast Response Survey System
The Fast Response Survey System (FRSS) was established in 1975 by the National Center for Education
Statistics (NCES), U.S. Department of Education. FRSS is designed to collect issue-oriented data within a
relatively short time frame. FRSS collects data from state education agencies, local education agencies, public
and private elementary and secondary schools, public school teachers, and public libraries. To ensure minimal
burden on respondents, the surveys are generally limited to three pages of questions, with a response burden of
about 30 minutes per respondent. Sample sizes are relatively small (usually about 1,000 to 1,500 respondents
per survey) so that data collection can be completed quickly. Data are weighted to produce national estimates
of the sampled education sector. The sample size permits limited breakouts by classification variables.
However, as the number of categories within the classification variables increases, the sample size within
categories decreases, which results in larger sampling errors for the breakouts by classification variables.
Sample Design The sample for the FRSS 2008 district survey on educational technology consisted of 1,589 public school
districts in the 50 states and the District of Columbia. This survey was one of three related FRSS surveys
conducted under a nested design involving a sample of schools, districts that administered the sampled
schools, and teachers within the sampled schools. The selection of districts included two stages.
For the first stage, a nationally representative sample of regular U.S. public schools was selected from the
2005–06 NCES Common Core of Data (CCD) Public School Universe file, which was the most current file
available at the time of selection. The sampling frame included 85,719 regular schools. Excluded from the
sampling frame were schools with a high grade of prekindergarten or kindergarten and ungraded schools,
along with special education, vocational, and alternative/other schools; schools outside the 50 states and the
District of Columbia; and schools with zero or missing enrollment. The public school sampling frame was
stratified by level (elementary or secondary/combined), categories of enrollment size, and categories for
percent of students eligible for free/reduced-price lunch. Schools in the frame were then sorted by type of
locale and region to induce additional implicit stratification.
For the second stage, the public school districts that contained at least one sampled school were identified
using the 2005–06 CCD Local Education Agency file. The district sample is representative of all public school
districts in the nation that administer at least one regular school as described above.
Data Collection and Response Rates Questionnaires and cover letters for the study were mailed to the superintendent of each sampled school
district in early August 2008. The letter introduced the study and requested that the questionnaire be completed
by the person most knowledgeable about educational technology in the district. Respondents were offered the
option of completing the survey via the Web. Telephone follow-up for survey nonresponse and data
clarification was initiated in late August 2008 and completed in January 2009.
Of the 1,589 school districts in the sample, 60 were found to be ineligible for the survey because the district
had closed or merged with another district. This left a total of 1,529 eligible school districts in the sample. Completed questionnaires were received from 1,408 districts, or 92 percent of the eligible districts (table B-1).
Of the districts that completed the survey, 75 percent completed it by the Web, 21 percent completed it by
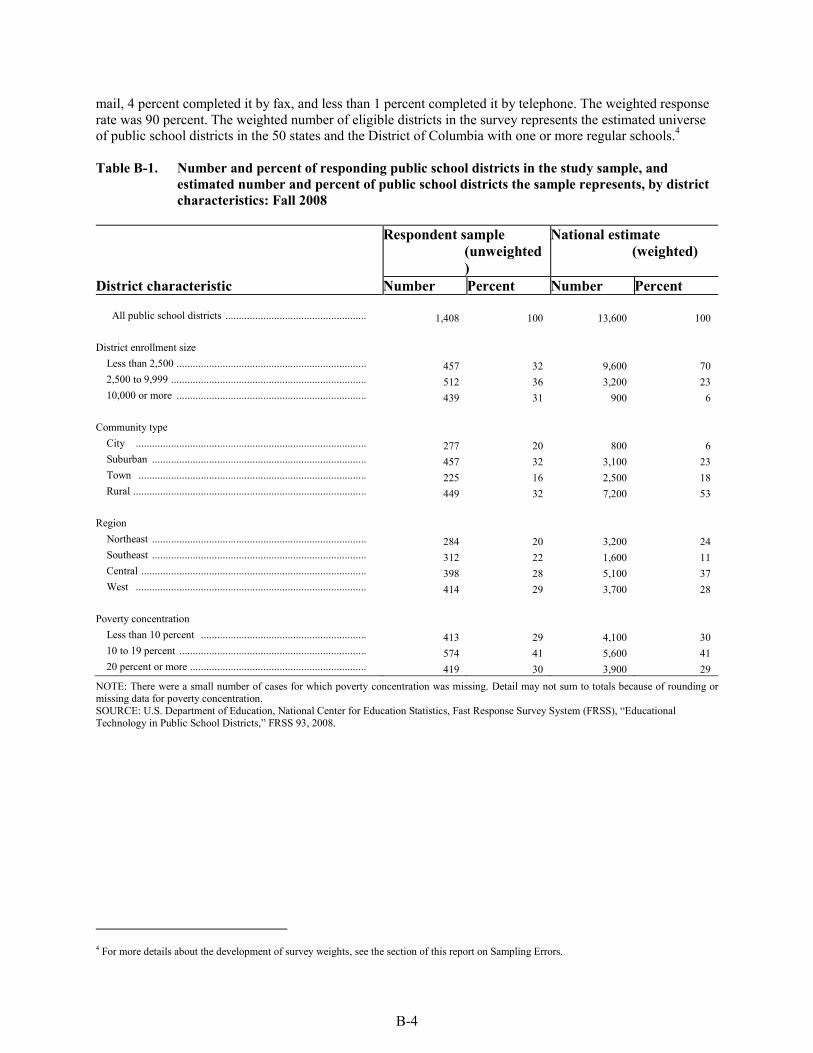
B-4
mail, 4 percent completed it by fax, and less than 1 percent completed it by telephone. The weighted response
rate was 90 percent. The weighted number of eligible districts in the survey represents the estimated universe
of public school districts in the 50 states and the District of Columbia with one or more regular schools.4
Table B-1. Number and percent of responding public school districts in the study sample, and
estimated number and percent of public school districts the sample represents, by district
characteristics: Fall 2008
District characteristic
Respondent sample
(unweighted
)
National estimate
(weighted)
Number Percent Number Percent
All public school districts .................................................... 1,408 100 13,600 100
District enrollment size
Less than 2,500 ...................................................................... 457 32 9,600 70
2,500 to 9,999 ........................................................................ 512 36 3,200 23
10,000 or more ...................................................................... 439 31 900 6
Community type
City ..................................................................................... 277 20 800 6
Suburban ............................................................................... 457 32 3,100 23
Town .................................................................................... 225 16 2,500 18
Rural ...................................................................................... 449 32 7,200 53
Region
Northeast ............................................................................... 284 20 3,200 24
Southeast ............................................................................... 312 22 1,600 11
Central ................................................................................... 398 28 5,100 37
West ..................................................................................... 414 29 3,700 28
Poverty concentration
Less than 10 percent ............................................................. 413 29 4,100 30
10 to 19 percent ..................................................................... 574 41 5,600 41
20 percent or more ................................................................. 419 30 3,900 29
NOTE: There were a small number of cases for which poverty concentration was missing. Detail may not sum to totals because of rounding or missing data for poverty concentration.
SOURCE: U.S. Department of Education, National Center for Education Statistics, Fast Response Survey System (FRSS), ―Educational
Technology in Public School Districts,‖ FRSS 93, 2008.
4 For more details about the development of survey weights, see the section of this report on Sampling Errors.
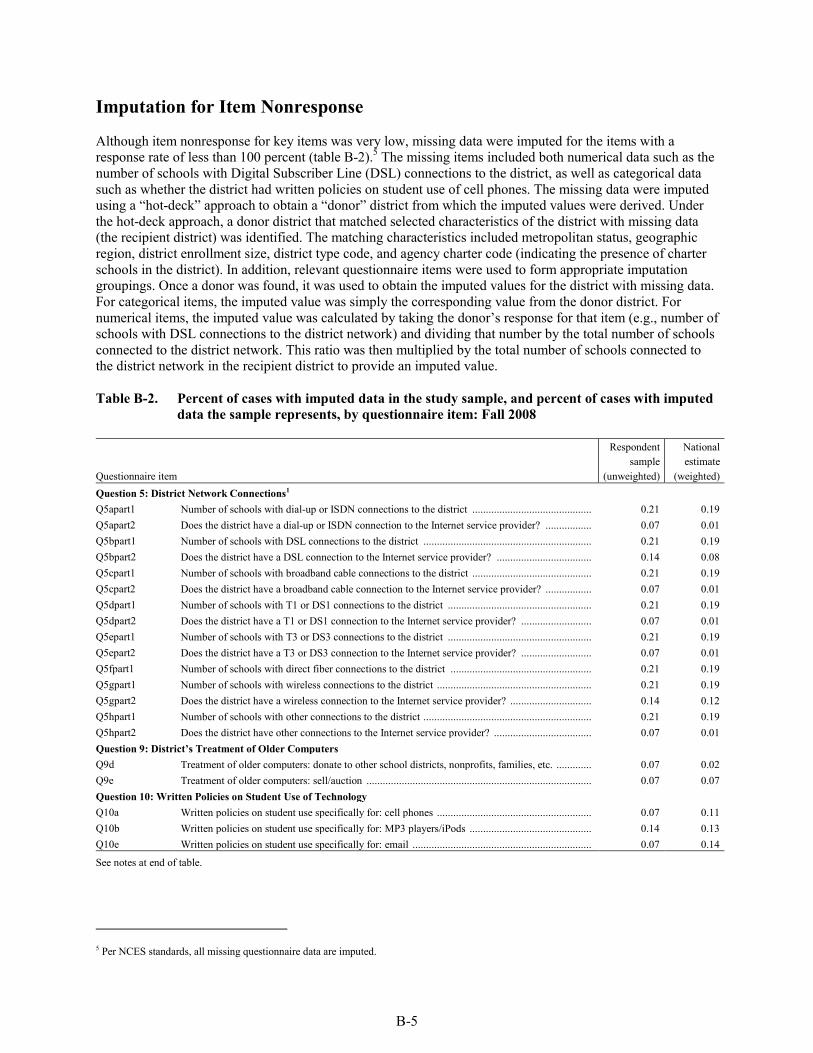
B-5
Imputation for Item Nonresponse
Although item nonresponse for key items was very low, missing data were imputed for the items with a
response rate of less than 100 percent (table B-2).5 The missing items included both numerical data such as the
number of schools with Digital Subscriber Line (DSL) connections to the district, as well as categorical data
such as whether the district had written policies on student use of cell phones. The missing data were imputed
using a ―hot-deck‖ approach to obtain a ―donor‖ district from which the imputed values were derived. Under
the hot-deck approach, a donor district that matched selected characteristics of the district with missing data
(the recipient district) was identified. The matching characteristics included metropolitan status, geographic
region, district enrollment size, district type code, and agency charter code (indicating the presence of charter
schools in the district). In addition, relevant questionnaire items were used to form appropriate imputation
groupings. Once a donor was found, it was used to obtain the imputed values for the district with missing data.
For categorical items, the imputed value was simply the corresponding value from the donor district. For
numerical items, the imputed value was calculated by taking the donor’s response for that item (e.g., number of
schools with DSL connections to the district network) and dividing that number by the total number of schools
connected to the district network. This ratio was then multiplied by the total number of schools connected to
the district network in the recipient district to provide an imputed value.
Table B-2. Percent of cases with imputed data in the study sample, and percent of cases with imputed
data the sample represents, by questionnaire item: Fall 2008
Questionnaire item
Respondent
sample
(unweighted)
National
estimate
(weighted)
Question 5: District Network Connections1
Q5apart1 Number of schools with dial-up or ISDN connections to the district ............................................ 0.21 0.19
Q5apart2 Does the district have a dial-up or ISDN connection to the Internet service provider? ................. 0.07 0.01
Q5bpart1 Number of schools with DSL connections to the district .............................................................. 0.21 0.19
Q5bpart2 Does the district have a DSL connection to the Internet service provider? ................................... 0.14 0.08
Q5cpart1 Number of schools with broadband cable connections to the district ............................................ 0.21 0.19
Q5cpart2 Does the district have a broadband cable connection to the Internet service provider? ................. 0.07 0.01
Q5dpart1 Number of schools with T1 or DS1 connections to the district ..................................................... 0.21 0.19
Q5dpart2 Does the district have a T1 or DS1 connection to the Internet service provider? .......................... 0.07 0.01
Q5epart1 Number of schools with T3 or DS3 connections to the district ..................................................... 0.21 0.19
Q5epart2 Does the district have a T3 or DS3 connection to the Internet service provider? .......................... 0.07 0.01
Q5fpart1 Number of schools with direct fiber connections to the district .................................................... 0.21 0.19
Q5gpart1 Number of schools with wireless connections to the district ......................................................... 0.21 0.19
Q5gpart2 Does the district have a wireless connection to the Internet service provider? .............................. 0.14 0.12
Q5hpart1 Number of schools with other connections to the district .............................................................. 0.21 0.19
Q5hpart2 Does the district have other connections to the Internet service provider? .................................... 0.07 0.01
Question 9: District’s Treatment of Older Computers
Q9d Treatment of older computers: donate to other school districts, nonprofits, families, etc. ............. 0.07 0.02
Q9e Treatment of older computers: sell/auction ................................................................................... 0.07 0.07
Question 10: Written Policies on Student Use of Technology
Q10a Written policies on student use specifically for: cell phones ......................................................... 0.07 0.11
Q10b Written policies on student use specifically for: MP3 players/iPods ............................................. 0.14 0.13
Q10e Written policies on student use specifically for: email .................................................................. 0.07 0.14
See notes at end of table.
5 Per NCES standards, all missing questionnaire data are imputed.
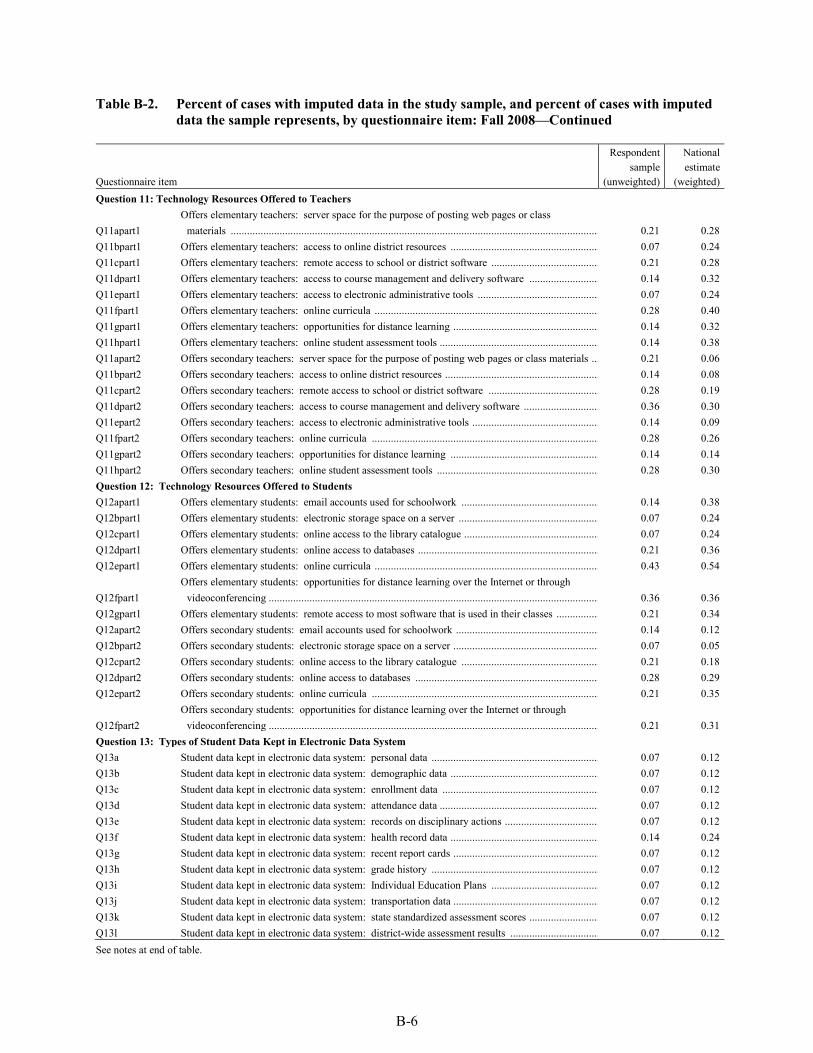
B-6
Table B-2. Percent of cases with imputed data in the study sample, and percent of cases with imputed
data the sample represents, by questionnaire item: Fall 2008—Continued
Questionnaire item
Respondent
sample
(unweighted)
National
estimate
(weighted)
Question 11: Technology Resources Offered to Teachers
Q11apart1
Offers elementary teachers: server space for the purpose of posting web pages or class
materials ......................................................................................................................................... 0.21 0.28
Q11bpart1 Offers elementary teachers: access to online district resources ........................................................ 0.07 0.24
Q11cpart1 Offers elementary teachers: remote access to school or district software ......................................... 0.21 0.28
Q11dpart1 Offers elementary teachers: access to course management and delivery software ........................... 0.14 0.32
Q11epart1 Offers elementary teachers: access to electronic administrative tools .............................................. 0.07 0.24
Q11fpart1 Offers elementary teachers: online curricula .................................................................................... 0.28 0.40
Q11gpart1 Offers elementary teachers: opportunities for distance learning ....................................................... 0.14 0.32
Q11hpart1 Offers elementary teachers: online student assessment tools ............................................................ 0.14 0.38
Q11apart2 Offers secondary teachers: server space for the purpose of posting web pages or class materials .... 0.21 0.06
Q11bpart2 Offers secondary teachers: access to online district resources .......................................................... 0.14 0.08
Q11cpart2 Offers secondary teachers: remote access to school or district software .......................................... 0.28 0.19
Q11dpart2 Offers secondary teachers: access to course management and delivery software ............................. 0.36 0.30
Q11epart2 Offers secondary teachers: access to electronic administrative tools ................................................ 0.14 0.09
Q11fpart2 Offers secondary teachers: online curricula ..................................................................................... 0.28 0.26
Q11gpart2 Offers secondary teachers: opportunities for distance learning ........................................................ 0.14 0.14
Q11hpart2 Offers secondary teachers: online student assessment tools ............................................................. 0.28 0.30
Question 12: Technology Resources Offered to Students
Q12apart1 Offers elementary students: email accounts used for schoolwork .................................................... 0.14 0.38
Q12bpart1 Offers elementary students: electronic storage space on a server ..................................................... 0.07 0.24
Q12cpart1 Offers elementary students: online access to the library catalogue ................................................... 0.07 0.24
Q12dpart1 Offers elementary students: online access to databases .................................................................... 0.21 0.36
Q12epart1 Offers elementary students: online curricula .................................................................................... 0.43 0.54
Q12fpart1
Offers elementary students: opportunities for distance learning over the Internet or through
videoconferencing ........................................................................................................................... 0.36 0.36
Q12gpart1 Offers elementary students: remote access to most software that is used in their classes ................. 0.21 0.34
Q12apart2 Offers secondary students: email accounts used for schoolwork ...................................................... 0.14 0.12
Q12bpart2 Offers secondary students: electronic storage space on a server ....................................................... 0.07 0.05
Q12cpart2 Offers secondary students: online access to the library catalogue .................................................... 0.21 0.18
Q12dpart2 Offers secondary students: online access to databases ..................................................................... 0.28 0.29
Q12epart2 Offers secondary students: online curricula ..................................................................................... 0.21 0.35
Q12fpart2
Offers secondary students: opportunities for distance learning over the Internet or through
videoconferencing ........................................................................................................................... 0.21 0.31
Question 13: Types of Student Data Kept in Electronic Data System
Q13a Student data kept in electronic data system: personal data ............................................................... 0.07 0.12
Q13b Student data kept in electronic data system: demographic data ........................................................ 0.07 0.12
Q13c Student data kept in electronic data system: enrollment data ........................................................... 0.07 0.12
Q13d Student data kept in electronic data system: attendance data ............................................................ 0.07 0.12
Q13e Student data kept in electronic data system: records on disciplinary actions .................................... 0.07 0.12
Q13f Student data kept in electronic data system: health record data ........................................................ 0.14 0.24
Q13g Student data kept in electronic data system: recent report cards ....................................................... 0.07 0.12
Q13h Student data kept in electronic data system: grade history ............................................................... 0.07 0.12
Q13i Student data kept in electronic data system: Individual Education Plans ......................................... 0.07 0.12
Q13j Student data kept in electronic data system: transportation data ....................................................... 0.07 0.12
Q13k Student data kept in electronic data system: state standardized assessment scores ........................... 0.07 0.12
Q13l Student data kept in electronic data system: district-wide assessment results .................................. 0.07 0.12
See notes at end of table.
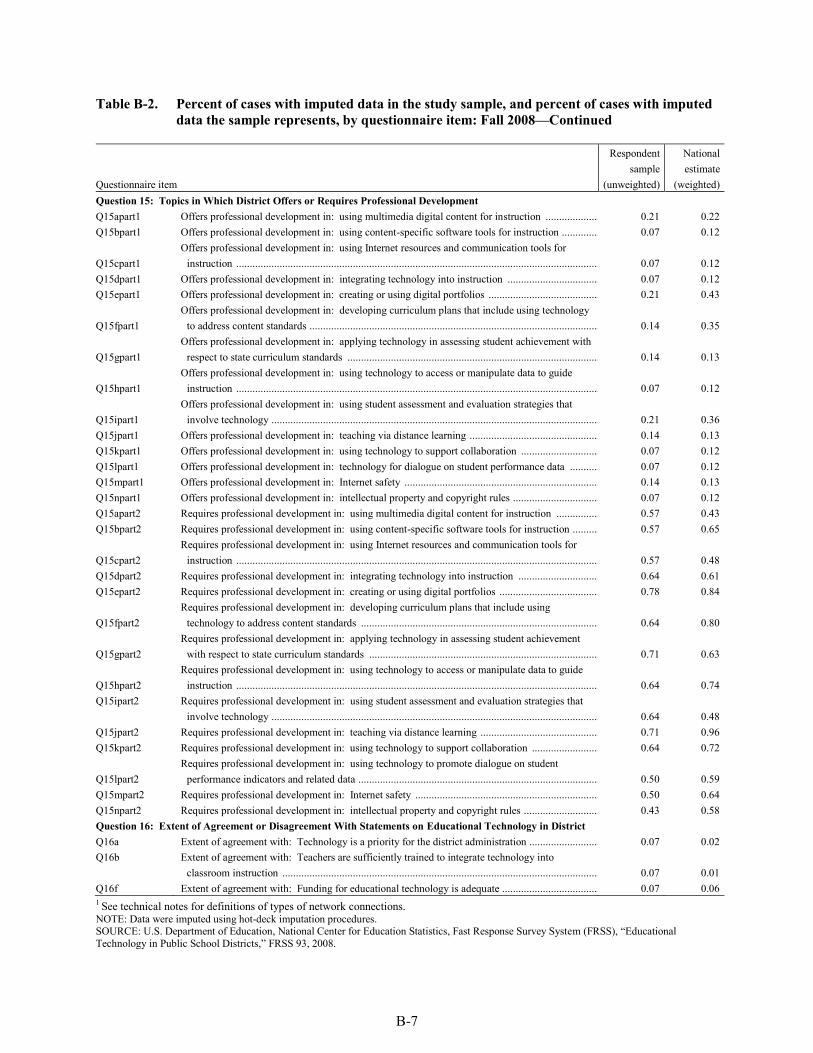
B-7
Table B-2. Percent of cases with imputed data in the study sample, and percent of cases with imputed
data the sample represents, by questionnaire item: Fall 2008—Continued
Questionnaire item
Respondent
sample
(unweighted)
National
estimate
(weighted)
Question 15: Topics in Which District Offers or Requires Professional Development
Q15apart1 Offers professional development in: using multimedia digital content for instruction ..................... 0.21 0.22
Q15bpart1 Offers professional development in: using content-specific software tools for instruction ............... 0.07 0.12
Q15cpart1
Offers professional development in: using Internet resources and communication tools for
instruction ....................................................................................................................................... 0.07 0.12
Q15dpart1 Offers professional development in: integrating technology into instruction ................................... 0.07 0.12
Q15epart1 Offers professional development in: creating or using digital portfolios .......................................... 0.21 0.43
Q15fpart1
Offers professional development in: developing curriculum plans that include using technology
to address content standards ............................................................................................................ 0.14 0.35
Q15gpart1
Offers professional development in: applying technology in assessing student achievement with
respect to state curriculum standards .............................................................................................. 0.14 0.13
Q15hpart1
Offers professional development in: using technology to access or manipulate data to guide
instruction ....................................................................................................................................... 0.07 0.12
Q15ipart1
Offers professional development in: using student assessment and evaluation strategies that
involve technology .......................................................................................................................... 0.21 0.36
Q15jpart1 Offers professional development in: teaching via distance learning ................................................. 0.14 0.13
Q15kpart1 Offers professional development in: using technology to support collaboration .............................. 0.07 0.12
Q15lpart1 Offers professional development in: technology for dialogue on student performance data ............ 0.07 0.12
Q15mpart1 Offers professional development in: Internet safety ......................................................................... 0.14 0.13
Q15npart1 Offers professional development in: intellectual property and copyright rules ................................. 0.07 0.12
Q15apart2 Requires professional development in: using multimedia digital content for instruction ................. 0.57 0.43
Q15bpart2 Requires professional development in: using content-specific software tools for instruction ........... 0.57 0.65
Q15cpart2
Requires professional development in: using Internet resources and communication tools for
instruction ....................................................................................................................................... 0.57 0.48
Q15dpart2 Requires professional development in: integrating technology into instruction ............................... 0.64 0.61
Q15epart2 Requires professional development in: creating or using digital portfolios ...................................... 0.78 0.84
Q15fpart2
Requires professional development in: developing curriculum plans that include using
technology to address content standards ......................................................................................... 0.64 0.80
Q15gpart2
Requires professional development in: applying technology in assessing student achievement
with respect to state curriculum standards ...................................................................................... 0.71 0.63
Q15hpart2
Requires professional development in: using technology to access or manipulate data to guide
instruction ....................................................................................................................................... 0.64 0.74
Q15ipart2 Requires professional development in: using student assessment and evaluation strategies that
involve technology .......................................................................................................................... 0.64 0.48
Q15jpart2 Requires professional development in: teaching via distance learning ............................................. 0.71 0.96
Q15kpart2 Requires professional development in: using technology to support collaboration .......................... 0.64 0.72
Q15lpart2
Requires professional development in: using technology to promote dialogue on student
performance indicators and related data .......................................................................................... 0.50 0.59
Q15mpart2 Requires professional development in: Internet safety ..................................................................... 0.50 0.64
Q15npart2 Requires professional development in: intellectual property and copyright rules ............................. 0.43 0.58
Question 16: Extent of Agreement or Disagreement With Statements on Educational Technology in District
Q16a Extent of agreement with: Technology is a priority for the district administration ........................... 0.07 0.02
Q16b Extent of agreement with: Teachers are sufficiently trained to integrate technology into
classroom instruction ...................................................................................................................... 0.07 0.01
Q16f Extent of agreement with: Funding for educational technology is adequate ..................................... 0.07 0.06
1 See technical notes for definitions of types of network connections.
NOTE: Data were imputed using hot-deck imputation procedures. SOURCE: U.S. Department of Education, National Center for Education Statistics, Fast Response Survey System (FRSS), ―Educational
Technology in Public School Districts,‖ FRSS 93, 2008.
B-8
Data Reliability
Although the Educational Technology in Public School Districts survey was designed to account for sampling
error and to minimize nonsampling error, estimates produced from the data collected are subject to both types
of error. Sampling error occurs because the data are collected from a sample rather than a census of the
population, and nonsampling errors are errors made during the collection and processing of the data.
Sampling Errors
The responses were weighted to produce national estimates (table B-1). The weights were designed to reflect
the variable probabilities of selection of the sampled districts and were adjusted for differential unit
(questionnaire) nonresponse. The nonresponse weighting adjustments were made within classes defined by
variables correlated with response propensity: district size class, metropolitan status of the district, and a
measure of poverty status defined by the estimated percentage of children in the district with families living
below the poverty level.6 Within the final weighting classes, the base weights (i.e., the reciprocal of districts’
probabilities of selection) of the responding districts were inflated by the inverse of the weighted response rate
for the class. The findings in this report are estimates based on the sample selected and, consequently, are
subject to sampling variability. General sampling theory was used to estimate the sampling variability of the
estimates and to test for statistically significant differences between estimates.
The standard error is a measure of the variability of an estimate due to sampling. It indicates the variability of a
sample estimate that would be obtained from all possible samples of a given design and size. Standard errors
are used as a measure of the precision expected from a particular sample. If all possible samples were surveyed
under similar conditions, intervals of 1.96 standard errors below to 1.96 standard errors above a particular
statistic would include the true population parameter being estimated in about 95 percent of the samples. This
is a 95 percent confidence interval. For example, the estimated percentage of public school districts with a
district network is 84.0 percent, and the standard error is 2.0 percent (tables 3 and 3a). The 95 percent
confidence interval for the statistic extends from [84.0 – (2.0 x 1.96)] to [84.0 + (2.0 x 1.96)], or from 80.1 to
87.9 percent. The 1.96 is the critical value for a statistical test at the 0.05 significance level (where 0.05
indicates the 5 percent of all possible samples that would be outside the range of the confidence interval).
Because the data from the FRSS educational technology survey were collected using a complex sampling
design, the variances of the estimates from this survey (e.g., estimates of proportions) are typically different
from what would be expected from data collected with a simple random sample. Not taking the complex
sample design into account can lead to an underestimation of the standard errors associated with such
estimates. To generate accurate standard errors for the estimates in this report, standard errors were computed
using a technique known as jackknife replication. As with any replication method, jackknife replication
involves constructing a number of subsamples (replicates) from the full sample and computing the statistic of
interest for each replicate. The mean square error of the replicate estimates around the full sample estimate
provides an estimate of the variance of the statistic. To construct the replications, 50 stratified subsamples of
the full sample were created and then dropped one at a time to define 50 jackknife replicates. A computer
program (WesVar) was used to calculate the estimates of standard errors.
All specific statements of comparisons made in this report have been tested for statistical significance at the
.05 level using Student’s t-statistic to ensure that the differences are larger than those that might be expected
due to sampling variation. Adjustments for multiple comparisons were not included. Student’s t values were
computed to test the difference between estimates with the following formula:
6 For more information about poverty status, see the section of this report on Definitions of Analysis Variables.
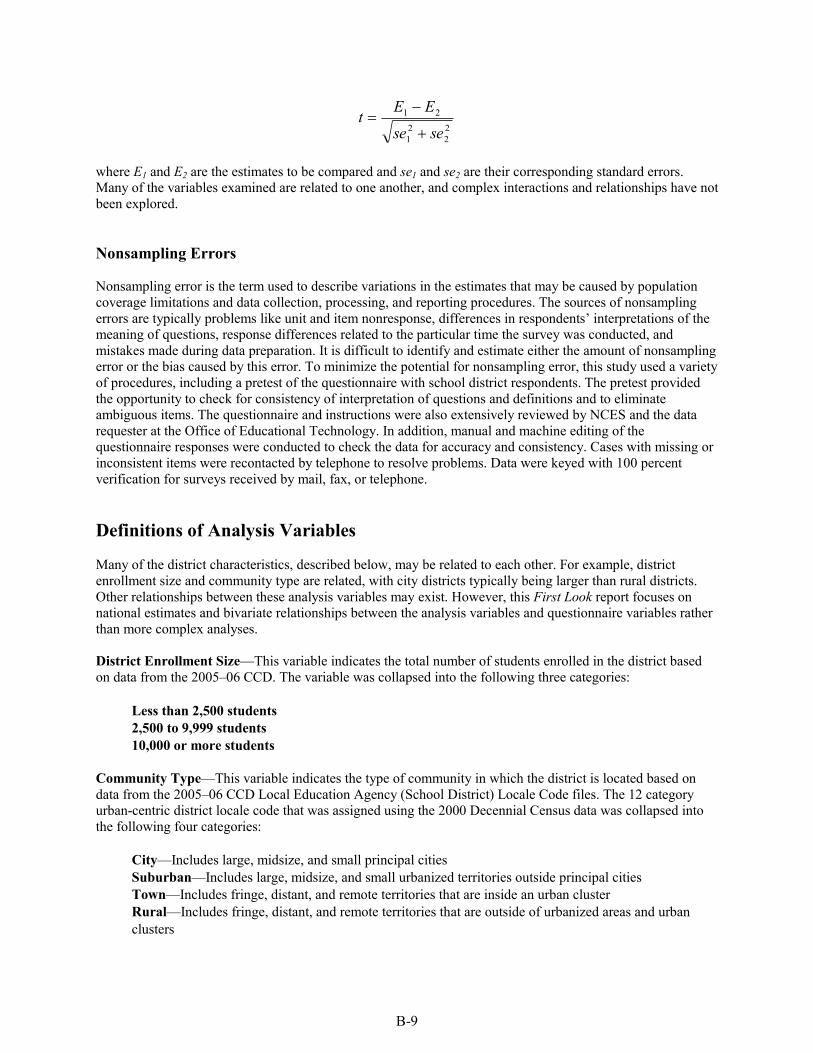
B-9
2
2
2
1
21
sese
EEt
where E1 and E2 are the estimates to be compared and se1 and se2 are their corresponding standard errors.
Many of the variables examined are related to one another, and complex interactions and relationships have not
been explored.
Nonsampling Errors Nonsampling error is the term used to describe variations in the estimates that may be caused by population
coverage limitations and data collection, processing, and reporting procedures. The sources of nonsampling
errors are typically problems like unit and item nonresponse, differences in respondents’ interpretations of the
meaning of questions, response differences related to the particular time the survey was conducted, and
mistakes made during data preparation. It is difficult to identify and estimate either the amount of nonsampling
error or the bias caused by this error. To minimize the potential for nonsampling error, this study used a variety
of procedures, including a pretest of the questionnaire with school district respondents. The pretest provided
the opportunity to check for consistency of interpretation of questions and definitions and to eliminate
ambiguous items. The questionnaire and instructions were also extensively reviewed by NCES and the data
requester at the Office of Educational Technology. In addition, manual and machine editing of the
questionnaire responses were conducted to check the data for accuracy and consistency. Cases with missing or
inconsistent items were recontacted by telephone to resolve problems. Data were keyed with 100 percent
verification for surveys received by mail, fax, or telephone.
Definitions of Analysis Variables Many of the district characteristics, described below, may be related to each other. For example, district
enrollment size and community type are related, with city districts typically being larger than rural districts.
Other relationships between these analysis variables may exist. However, this First Look report focuses on
national estimates and bivariate relationships between the analysis variables and questionnaire variables rather
than more complex analyses.
District Enrollment Size—This variable indicates the total number of students enrolled in the district based
on data from the 2005–06 CCD. The variable was collapsed into the following three categories:
Less than 2,500 students
2,500 to 9,999 students
10,000 or more students
Community Type—This variable indicates the type of community in which the district is located based on
data from the 2005–06 CCD Local Education Agency (School District) Locale Code files. The 12 category
urban-centric district locale code that was assigned using the 2000 Decennial Census data was collapsed into
the following four categories:
City—Includes large, midsize, and small principal cities
Suburban—Includes large, midsize, and small urbanized territories outside principal cities
Town—Includes fringe, distant, and remote territories that are inside an urban cluster
Rural—Includes fringe, distant, and remote territories that are outside of urbanized areas and urban
clusters
B-10
Region—This variable classifies districts into one of the four geographic regions used by the Bureau of
Economic Analysis of the U.S. Department of Commerce. Data were obtained from the 2005–06 CCD Local
Education Agency Universe file. The geographic regions are as follows:
Northeast—Connecticut, Delaware, District of Columbia, Maine, Maryland, Massachusetts, New
Hampshire, New Jersey, New York, Pennsylvania, Rhode Island, and Vermont
Southeast—Alabama, Arkansas, Florida, Georgia, Kentucky, Louisiana, Mississippi, North Carolina,
South Carolina, Tennessee, Virginia, and West Virginia
Central—Illinois, Indiana, Iowa, Kansas, Michigan, Minnesota, Missouri, Nebraska, North Dakota,
Ohio, South Dakota, and Wisconsin
West—Alaska, Arizona, California, Colorado, Hawaii, Idaho, Montana, Nevada, New Mexico,
Oklahoma, Oregon, Texas, Utah, Washington, and Wyoming
Poverty Concentration—This variable indicates the percentage of children in the district ages 5–17 in
families living below the poverty level, based on the Title I data provided to the U.S. Department of Education
by the U.S. Census Bureau, ―Small Area Income and Poverty Estimates.‖ For detailed information on the
methodology used to create these estimates, please refer to http://www.census.gov/did/www/saipe/index.html.
Data on this variable were missing for a small number of responding districts; districts with missing data were
excluded from all analyses involving poverty concentration. The variable was collapsed into the following
three categories:
Less than 10 percent
10 to 19 percent
20 percent or more
Definitions of Terms Used in this Report
Definitions included on the questionnaire:
Technology: Information technology such as computers, devices that can be attached to computers
(e.g., LCD projector, interactive whiteboard, digital camera), networks (e.g., Internet, local networks),
and computer software. We specifically are not including non-computer technologies such as
overhead projectors and VCRs.
Asset recovery program: Asset recovery programs provide third-party disposal services for owned or
leased computers, which are then usually refurbished or recycled.
Blogs: Websites where an individual or group creates a running log of entries that can be read by
other users, such as in a journal.
Wikis: Collaborative websites that allow users to freely create and edit web page content (e.g.,
Wikipedia).
Social networking websites: Online social networks for communities of people who share interests
and activities or who are interested in exploring the interests and activities of others (e.g., Facebook,
MySpace).
B-11
Definitions for types of network connections (these definitions were not included on the questionnaire):
Dial-up connection: Data transmission through a normal telephone line upon command, at the
maximum speed of 56 KB per second.
ISDN (Integrated Services Digital Network): Sends voice and data over digital telephone lines or
normal telephone wires at the speed of up to 128 KB per second.
DSL (Digital Subscriber Line): Refers collectively to a group of digital subscriber lines, including
ADSL (Asymmetric Digital Subscriber Line), SDSL (Symmetric Digital Subscriber Line), HDSL
(High Data Rate Digital Subscriber Line), and SHDSL (Single-Pair High-Speed Digital Subscriber
Line). Available transmission speeds vary according to provider and geographic area.
Broadband cable: Dedicated transmission of data through cable TV lines. Available transmission
speeds vary according to provider and geographic area.
T1 or DS1: Dedicated digital transmission of data and voice at a speed up to 1.5 MB per second;
composed of 24 channels.
T3 or DS3: Dedicated digital transmission of data and voice at a speed up to 45 MB per second;
composed of 672 channels.
Direct fiber: Transmission of data by sending pulses of light through an optical fiber. With direct
fiber architecture, each fiber leaving the central location goes to exactly one customer. Available
transmission speeds vary according to provider and geographic area.
Wireless: Transmission of data without the use of physical wires or cables. Generally uses
electromagnetic waves, such as radio waves, microwaves, or laser beams. Available transmission
speeds vary according to provider and geographic area.
Contact Information For more information about the survey, contact Peter Tice, Early Childhood, International, and
Crosscutting Studies Division, National Center for Education Statistics, Institute of Education Sciences,
U.S. Department of Education, 1990 K Street NW, Washington, DC 20006, e-mail: [email protected];
telephone: (202) 502-7497.

This page intentionally left blank.

C-1
Appendix C
Questionnaire

This page intentionally left blank.

C-3
Info
rmat
ion
Cop
y - D
o N
ot C
ompl
ete
U.S. DEPARTMENT OF EDUCATION FORM APPROVED
NATIONAL CENTER FOR EDUCATION STATISTICS O.M.B. No.: 1850–0733
WASHINGTON, D.C. 20006–5651 EXPIRATION DATE: 10/2009 EDUCATIONAL TECHNOLOGY IN PUBLIC SCHOOL DISTRICTS, FALL 2008 FAST RESPONSE SURVEY SYSTEM
This survey is authorized by law (P.L. 103-382). While participation in this survey is voluntary, your cooperation is critical
to make the results of this survey comprehensive, accurate, and timely. Your answers may be used only for statistical
purposes and may not be disclosed, or used, in identifiable form for any other purpose unless otherwise compelled by
law. (Public Law 107-279, Education Sciences Reform Act, Section 183.)
Please answer this survey using Fall 2008 information.
Definitions
Technology: Information technology such as computers, devices that can be attached to computers (e.g., LCD projector,
interactive whiteboard, digital camera), networks (e.g., Internet, local networks), and computer software. We specifically
are not including non-computer technologies such as overhead projectors and VCRs.
Asset recovery program: Asset recovery programs provide third-party disposal services for owned or leased computers,
which are then usually refurbished or recycled.
Blogs: Websites where an individual or group creates a running log of entries that can be read by other users, such as in
a journal.
Wikis: Collaborative websites that allow users to freely create and edit web page content (e.g., Wikipedia).
Social networking websites: Online social networks for communities of people who share interests and activities or who
are interested in exploring the interests and activities of others (e.g., Facebook, MySpace).
IF ABOVE DISTRICT INFORMATION IS INCORRECT, PLEASE UPDATE DIRECTLY ON LABEL.
Name of Person Completing This Form: _________________________________________________________________ Title/Position: ______________________________________________________________________________________ Telephone Number: __________________________________ Email: ______________________________________
Best days and times to reach you (in case of questions): ___________________________________________________
THANK YOU. PLEASE KEEP A COPY OF THE SURVEY FOR YOUR RECORDS.
PLEASE RETURN COMPLETED FORM TO: IF YOU HAVE ANY QUESTIONS OR COMMENTS, CONTACT:
Mail: Cindy Gray (8096.13.03) Cindy Gray at Westat Westat 800-937-8281, Ext. 4336 or 301-251-4336 1650 Research Boulevard Email: [email protected] Rockville, Maryland 20850-3195 Fax: 800-254-0984
According to the Paperwork Reduction Act of 1995, no persons are required to respond to a collection of information unless it displays a valid OMB control number. The valid OMB control number for this information collection is 1850-0733. The time required to complete this information collection is estimated to average 30 minutes per response, including the time to review instructions, search existing data resources, gather the data needed, and complete and review the information collection. If you have any comments concerning the accuracy of the time estimate or suggestions for improving this form, please write to: U.S. Department of Education, Washington, DC 20202-4651. If you have any comments or concerns regarding the status of your individual submission of this form, write directly to: National Center for Education Statistics, 1990 K Street, NW, Washington, DC 20006. FRSS 93, 08/2008

C-4
Info
rmat
ion
Cop
y - D
o N
ot C
ompl
ete
Please answer this survey using Fall 2008 information.
1. How many schools are there in your district? ______
2. How many schools in your district have a local area network (LAN) connecting the computers within the school? ____
3. Does your district have a network connecting the district to its schools (e.g., a Wide Area Network)?
Yes ................... 1 No .................... 2 (Skip to question 6.)
4. How many schools are connected to the district network? _____
5. Please provide information on your district network connections:
In part 1, indicate the number of schools that have each type of connection to the district. (Exclude connections that
are only internal to schools. If no schools have a specific connection type, enter 0.)
In part 2, indicate “yes” or “no” for each connection type from the district to the Internet service provider(s). (If you
obtain Internet service through a regional or state network, include the connection from your district to that network.)
Type of district network connection
1. From district
to schools
2. From district to Internet
service provider(s)
Number of schools Yes No
a. Dial-up or ISDN ........................................................... _________ 1 2
b. DSL ............................................................................. _________ 1 2
c. Broadband cable ......................................................... _________ 1 2
d. T1 or DS1 .................................................................... _________ 1 2
e. T3 or DS3 .................................................................... _________ 1 2
f. Direct fiber ................................................................... _________ 1 2
g. Wireless ....................................................................... _________ 1 2
h. Other (specify type for each “other” connection): ........
(1) From district to schools: ____________________
(2) From district to Internet: ____________________
_________ 1 2
6. Does your district have the ability to switch to a backup connection to the Internet if a primary connection goes down?
Yes .................. 1 No ................... 2 7. Does your district have a formal computer replacement plan (for some or all computers) that is reflected in long-term
district budget planning?
Yes .................. 1 No ................... 2 8. Does your district participate in an asset recovery program for its computers? (See definition on cover.)
Yes, for all computers ................... 1 Yes, for some computers ............... 2 No ....................... 3
9. What does your district generally do with older computers that can no longer serve their original purpose? (Circle one
on each line.)
Yes No
a. Continue to use until nonfunctional ............................................................................................... 1 2
b. Upgrade memory or components to extend useful life ................................................................. 1 2
c. Re-purpose for less demanding tasks .......................................................................................... 1 2
d. Donate to other school districts, nonprofits, families, etc. ............................................................. 1 2
e. Sell/auction .................................................................................................................................... 1 2
f. Recycle/dispose ............................................................................................................................ 1 2
g. Other (please specify): _________________________________________________________ 1 2 10. Please indicate whether your district has written policies restricting use (e.g., blocking access) or specifying
acceptable use by students that specifically address each of the following: (Circle one on each line.)
Yes No
a. Cell phones ................................................................................................................................... 1 2
b. MP3 players/iPods ........................................................................................................................ 1 2
c. Wikis and/or blogs (definitions on cover) ...................................................................................... 1 2
d. Social networking websites (definition on cover) .......................................................................... 1 2
e. Email ............................................................................................................................................. 1 2
f. Other Internet use. ........................................................................................................................ 1 2
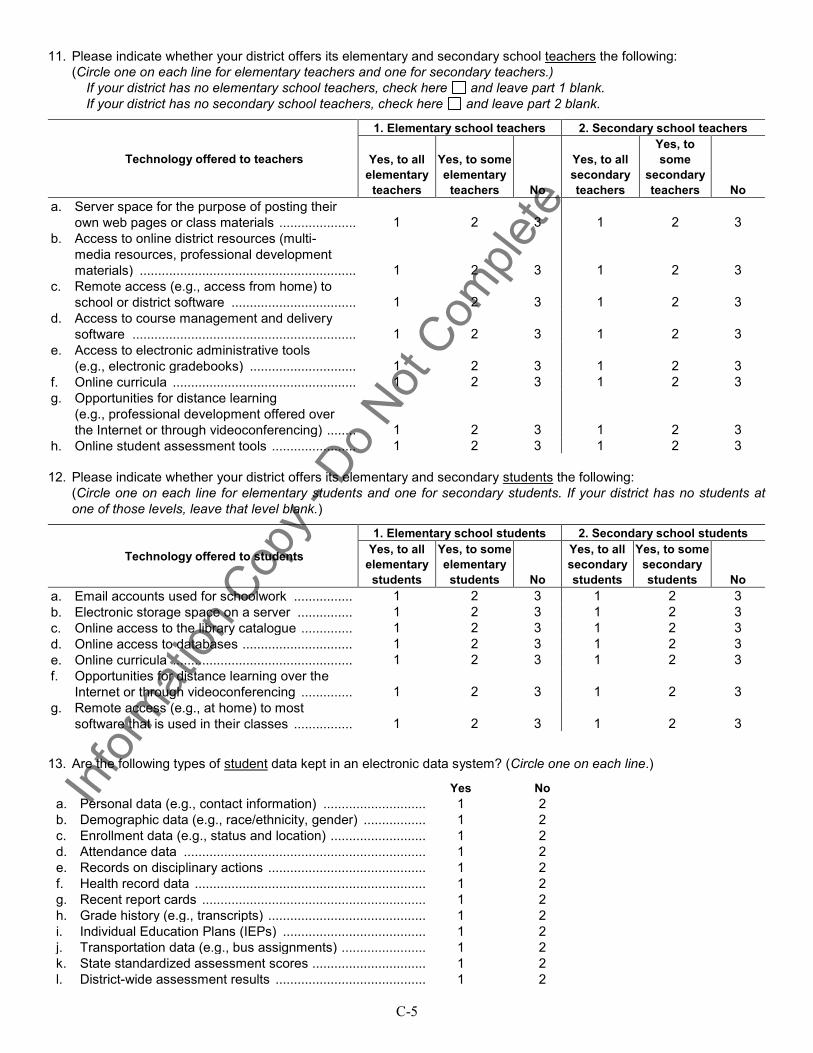
C-5
Info
rmat
ion
Cop
y - D
o N
ot C
ompl
ete
11. Please indicate whether your district offers its elementary and secondary school teachers the following:
(Circle one on each line for elementary teachers and one for secondary teachers.)
If your district has no elementary school teachers, check here and leave part 1 blank.
If your district has no secondary school teachers, check here and leave part 2 blank.
Technology offered to teachers
1. Elementary school teachers 2. Secondary school teachers
Yes, to all
elementary
teachers
Yes, to some
elementary
teachers No
Yes, to all
secondary
teachers
Yes, to
some
secondary
teachers No
a. Server space for the purpose of posting their
own web pages or class materials ..................... 1 2 3 1 2 3
b. Access to online district resources (multi-
media resources, professional development
materials) ........................................................... 1 2 3 1 2 3
c. Remote access (e.g., access from home) to
school or district software .................................. 1 2 3 1 2 3
d. Access to course management and delivery
software ............................................................. 1 2 3 1 2 3
e. Access to electronic administrative tools
(e.g., electronic gradebooks) ............................. 1 2 3 1 2 3
f. Online curricula .................................................. 1 2 3 1 2 3
g. Opportunities for distance learning
(e.g., professional development offered over
the Internet or through videoconferencing) ........ 1 2 3 1 2 3
h. Online student assessment tools ....................... 1 2 3 1 2 3
12. Please indicate whether your district offers its elementary and secondary students the following:
(Circle one on each line for elementary students and one for secondary students. If your district has no students at
one of those levels, leave that level blank.)
Technology offered to students
1. Elementary school students 2. Secondary school students
Yes, to all
elementary
students
Yes, to some
elementary
students No
Yes, to all
secondary
students
Yes, to some
secondary
students No
a. Email accounts used for schoolwork ................ 1 2 3 1 2 3
b. Electronic storage space on a server ............... 1 2 3 1 2 3
c. Online access to the library catalogue .............. 1 2 3 1 2 3
d. Online access to databases .............................. 1 2 3 1 2 3
e. Online curricula ................................................. 1 2 3 1 2 3
f. Opportunities for distance learning over the
Internet or through videoconferencing .............. 1 2 3 1 2 3
g. Remote access (e.g., at home) to most
software that is used in their classes ................ 1 2 3 1 2 3
13. Are the following types of student data kept in an electronic data system? (Circle one on each line.)
Yes No
a. Personal data (e.g., contact information) .................................. 1 2
b. Demographic data (e.g., race/ethnicity, gender) ....................... 1 2
c. Enrollment data (e.g., status and location) ................................ 1 2
d. Attendance data ........................................................................ 1 2
e. Records on disciplinary actions ................................................. 1 2
f. Health record data ..................................................................... 1 2
g. Recent report cards ................................................................... 1 2
h. Grade history (e.g., transcripts) ................................................. 1 2
i. Individual Education Plans (IEPs) ............................................. 1 2
j. Transportation data (e.g., bus assignments) ............................. 1 2
k. State standardized assessment scores ..................................... 1 2
l. District-wide assessment results ............................................... 1 2
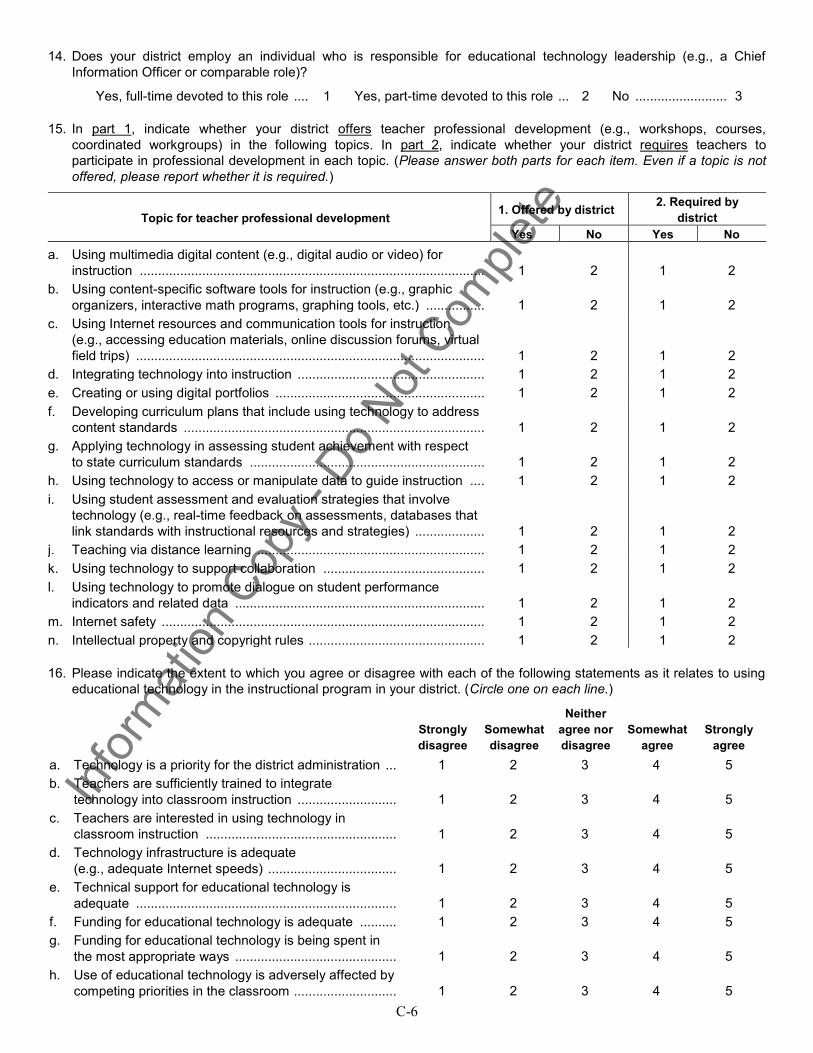
C-6
Info
rmat
ion
Cop
y - D
o N
ot C
ompl
ete
14. Does your district employ an individual who is responsible for educational technology leadership (e.g., a Chief
Information Officer or comparable role)?
Yes, full-time devoted to this role .... 1 Yes, part-time devoted to this role ... 2 No ......................... 3
15. In part 1, indicate whether your district offers teacher professional development (e.g., workshops, courses,
coordinated workgroups) in the following topics. In part 2, indicate whether your district requires teachers to
participate in professional development in each topic. (Please answer both parts for each item. Even if a topic is not
offered, please report whether it is required.)
Topic for teacher professional development 1. Offered by district
2. Required by
district
Yes No Yes No
a. Using multimedia digital content (e.g., digital audio or video) for
instruction .............................................................................................. 1 2 1 2
b. Using content-specific software tools for instruction (e.g., graphic
organizers, interactive math programs, graphing tools, etc.) ................ 1 2 1 2
c. Using Internet resources and communication tools for instruction
(e.g., accessing education materials, online discussion forums, virtual
field trips) ............................................................................................... 1 2 1 2
d. Integrating technology into instruction ................................................... 1 2 1 2
e. Creating or using digital portfolios ......................................................... 1 2 1 2
f. Developing curriculum plans that include using technology to address
content standards .................................................................................. 1 2 1 2
g. Applying technology in assessing student achievement with respect
to state curriculum standards ................................................................ 1 2 1 2
h. Using technology to access or manipulate data to guide instruction .... 1 2 1 2
i. Using student assessment and evaluation strategies that involve
technology (e.g., real-time feedback on assessments, databases that
link standards with instructional resources and strategies) ................... 1 2 1 2
j. Teaching via distance learning .............................................................. 1 2 1 2
k. Using technology to support collaboration ............................................ 1 2 1 2
l. Using technology to promote dialogue on student performance
indicators and related data .................................................................... 1 2 1 2
m. Internet safety ........................................................................................ 1 2 1 2
n. Intellectual property and copyright rules ................................................ 1 2 1 2
16. Please indicate the extent to which you agree or disagree with each of the following statements as it relates to using
educational technology in the instructional program in your district. (Circle one on each line.)
Strongly
disagree
Somewhat
disagree
Neither
agree nor
disagree
Somewhat
agree
Strongly
agree
a. Technology is a priority for the district administration ... 1 2 3 4 5
b. Teachers are sufficiently trained to integrate
technology into classroom instruction ........................... 1 2 3 4 5
c. Teachers are interested in using technology in
classroom instruction .................................................... 1 2 3 4 5
d. Technology infrastructure is adequate
(e.g., adequate Internet speeds) ................................... 1 2 3 4 5
e. Technical support for educational technology is
adequate ....................................................................... 1 2 3 4 5
f. Funding for educational technology is adequate .......... 1 2 3 4 5
g. Funding for educational technology is being spent in
the most appropriate ways ............................................ 1 2 3 4 5
h. Use of educational technology is adversely affected by
competing priorities in the classroom ............................ 1 2 3 4 5