Embed Size (px)
Citation preview

Email: [email protected] Press office: 020 7783 8300 Public enquiries: 0370 000 2288
Education and Training Statistics for the
United Kingdom 2019
21 November 2019
This release compiles information on education systems across the United Kingdom. Section 1
focuses on school, pupil and teacher numbers, section 2 focuses on Further and Higher Education
and section 3 focuses on students’ qualifications, typically taken at ages 16 and 18.
Education is devolved in the UK, so each country has a separate education system, with different
attainment measures. In addition, the UK population is 66.4 million1, of which England makes up
84%, Scotland 8%, Wales 5% and Northern Ireland 3%. As such, this release does not present
direct comparisons of numbers between the countries. Instead, it presents percentages, ratios and
trends that can be compared, along with some figures covering the whole of the UK.
Pupil numbers increased across the UK, rising fastest in England and fastest in Special Schools in all countries, but pupil teacher ratios remained stable
Females outperform males in the main measures of attainment across the UK, make up a greater share of higher education students and have a higher level of qualification among 19-64 year olds
1 Estimates taken from the Office of National Statistics 2018 mid-year estimate.

Page 2 of 14
Contents
In this publication
The following tables are included in the publication:
• Education and Training Statistics for the United Kingdom 2019 (UKETS_2019_Tables.xlsx or UKETS_2019_Tables.ods)
The accompanying technical information provides information on the education systems in the UK and their data sources.
Previous releases
Some tables from Education and Training Statistics for the United Kingdom 2018 have been updated to correct errors in the calculations. These are:
• Table 1.2 – Corrected pupil number figures for nursery schools in Scotland and primary schools in Wales.
• Table 3.2c(ii) – Percentages have been corrected.
Feedback
We are changing how our releases look and welcome feedback on any aspect of this document at [email protected]

Page 3 of 14
Schools, pupils and teachers
Section 1 provides an overview of the total numbers of schools, pupils and teachers across the UK2.
In 2018/19, there were 32,095 schools across the UK (Figure 1.1), with the majority of these at nursery and
primary level. England has a higher percentage of its schools that are independent (non-maintained
mainstream schools) compared to Wales and Northern Ireland (Scotland figures for independent schools are
unavailable). At nursery level, Scotland figures include all providers of funded Early Learning and childcare,
whereas figures across the rest of the UK only account for nurseries.
Figure 1.1 Total number of schools and percentage of schools by school type across the UK, 2018/19
The number of pupils continued to rise in 2018/19 across the UK, with an increase of 1.0% in England, 0.3%
in Wales, 0.6% in Scotland and 0.8% in Northern Ireland. There has been a greater increase in the
percentage of pupils in special schools than in other school types across the UK.
Figure 1.2 Percentage change in the number of pupils between 2017/18 and 2018/19 by school type
2 This section covers all schools across the UK where appropriate data sources exist. This includes independent (non-maintained), schools for England, Wales and Northern Ireland. Data for independent schools in Scotland is not available. At nursery level, Scotland figures include all providers of funded Early Learning and childcare, whereas figures across the rest of the UK only account for nurseries. Figures for middle schools are only applicable for Wales, as middle schools do not exist in the rest of the UK.
School Type England Wales Scotland Northern Ireland
Total number of schools 24,323 1,569 5,046 1,157
Nursery 1.6 0.6 50.4 8.2
Primary 68.9 78.9 39.9 70.3
Middle N/A 1.2 N/A N/A
Secondary 14.2 11.9 7.1 16.9
Non-maintained mainstream 9.5 4.8 Unavailable 1.2
Special schools 4.3 2.6 2.6 3.4
Pupil referral units 1.4 Unavailable N/A N/A

Page 4 of 14
The number of full-time equivalent teachers across all schools remains stable across the UK, with a slight increase in England and Scotland and a small decrease in Wales and Northern Ireland. The changes however are very small, with Wales, which has the highest percentage decrease, only seeing the number of FTE teachers fall from 25,100 to 24,800. There has been an increase in the number of teachers in all phases in Scotland. In England, there has been a small increase in teachers in primary schools and a small decrease in secondary schools. In both Wales and Northern Ireland the number of teachers in both primary and secondary has fallen slightly. Although, in Wales, there has also been an increase in the number of teachers in middle schools, reflecting the increase in the number of middle schools in 2018/19, which balances out the decrease in teacher numbers in primary and secondary schools. England, Scotland and Wales have seen a rise in the number of teachers in special schools (in Northern Ireland they have remained the same) which balances out the overall change in teacher numbers and reflects the growing number of pupils in special schools shown in Figure 1.2. Figure 1.3 Percentage change in the number of full-time equivalent qualified teachers between 2017/18 and 2018/19 by school type

Page 5 of 14
Pupil teacher ratios (PTR) show the number of pupils for every teacher. Across the UK the PTRs follow a similar pattern across all phases, with Scotland having the lowest PTRs and England, Wales and Northern Ireland all having very similar PTRs. The UK PTRs are highest in nursery and primary schools and lowest in special schools.
Overall, UK PTRs have remained stable between 2012/13 and 2018/19, with a small increase from 16.2 in 2012/13 to 16.4 in 2018/19. However, there has been some variation between different parts of the UK and across different school type. Wales saw the biggest change, with overall PTRs going from 17.8 to 18.7, with Northern Ireland going from 17.5 to 18.2, England going from 16.2 to 16.5 and Scotland remaining unchanged at 13.8.
In primary schools, the PTR has remained at 20.5 between 2012/13 and 2018/19, with no change in
England, a small decrease in Scotland and an increase in both Wales and Northern Ireland. PTRs have
risen in secondary schools across the whole of the UK over the same time period, from a rise of 0.1 in
Scotland to a rise of 0.8 in England.
Figure 1.4 Pupil teacher ratio by school type, 2018/19
Page 6 of 14
Post-compulsory Education
Section 2 provides an overview of the total numbers of institutions providing post-compulsory education
and training across the UK, as well as total enrolment and full-time academic staff.
The number of full-time academic staff in further education (FE)3 and higher education (HE) institutions remained stable in 2017/18, continuing a trend going back to 2012/13. The gender balance between staff has also remained stable within both FE and HE institutions: 52% of staff in FE institutions and 41% of staff in HE institutions were female. In 2017/18 there were 2.5 million students in UK HE institutions, with about two thirds of these studying first degrees, 1 in 5 studying a masters, 1 in 20 doing a PhD and 1 in 8 on other undergraduate courses. Females make up a greater share of students at every level other than for PhDs, where males make up 52% of all students. Figure 2.1 Number of students in higher education in the UK 2017/18, by level and gender (thousands)
3 FE Colleges have the power under the F&HE Act 1992 to provide education to 14-16 year olds (either directly or through an arrangement with the school at which the young person is receiving his/her education), as well as offering education and training to those aged 16 to 19. Additionally, the RPA (the duty to participate in education or training) has been raised to 18 in England. This means that a proportion of 14-19 year olds will be receiving compulsory education in an English FE institution and that teaching staff in FE colleges in England will include staff that teach learners between 14 and 19 who are in compulsory education.
Page 7 of 14
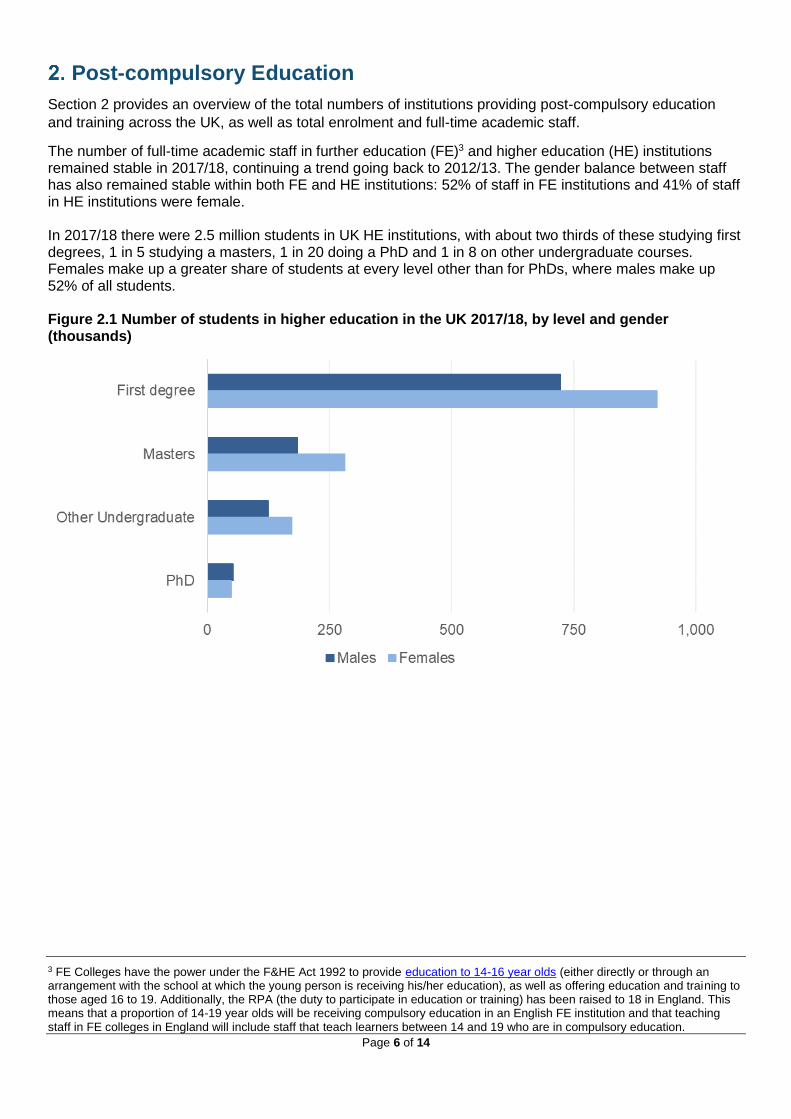
The most popular subject group in the UK in Higher Education is Business and Administrative Studies, which is studied by 380,000 students. There are clear gender differences in the figures, with at least twice as many females than males studying Subjects Allied to Medicine, Education, Languages and Veterinary Science, Agriculture and related courses. Males are more likely to be studying Engineering and Technology, and Mathematical and Computing Sciences, with at least three times as many males enrolled on these courses than females. Figure 2.2: Students in higher education in the UK by gender and subject group, 2017/18 (thousands)

Page 8 of 14
The percentage of 16-24 year-olds not in education, employment or training (NEET) in the UK remained at 11.3% in 2018; however, there was a change when looking at the gender breakdown. The percentage of males who were NEET decreased by 0.9 percentage points whereas the percentage of females who were NEET increased by 1.0 percentage points in the last year. Although the 16-24 NEET rate remained at 11.3%, there was an increase of 0.4 percentage points in the NEET rate of 16-17 year olds in 2018. Similarly to the NEET rate of 16-24 year olds, there was a more significant increase in the NEET rate of females than males, with the female NEET rate going up by 0.7 percentage points whereas the male NEET rate went up by 0.1 percentage points. Figure 2.3: Percentage of 16 to 24 year olds Not in Education, Employment or Training (NEET) in the UK from 2013 to 2018, by age

Page 9 of 14
Qualifications
This section takes a closer look at the qualifications that pupils have attained, typically at ages 16 and 184.
England, Scotland, Wales and Northern Ireland have different headline measures for the performance of
students in examinations, using different methodologies to calculate the relevant percentages or scores. The
headline measures across the UK are presented in the accompanying tables as well as subject breakdowns
of number of entries and the percentage achieving different attainment levels. More detail on the national
performance measures used across the UK (and the recent reforms) can be found in the accompanying
“Country Information and Data Sources” document.
Given the different qualifications systems and headline measures, it is not suitable to present a direct
comparative picture of pupil performance across the UK. The following section, therefore, looks at some
trends in pupil performance that can be considered comparable: differences between male and female
performance, and trends in subject entries.
More analysis on the qualifications of school leavers in each part of the UK is available from the following
sources:
England: GCSE and equivalent results
England: A levels and other 16 to 18 results
Wales: Results of external examinations taken by pupils in Year 11 or aged 17, which includes GCSE and A Levels.
Scotland: School leaver attainment and initial destinations
Northern Ireland: Year 12 and Year 14 Examination Performance at Post-Primary Schools
4 In chapter 3, the figures cover pupils entered for GCSE and A level (or equivalent) qualifications in maintained and non-maintained (independent) schools in England and Wales. However, figures for Scotland and Northern Ireland cover only maintained schools (grant-aided schools in Northern Ireland).

Page 10 of 14
One trend that is seen across the UK is that females perform better in all headline measures than males, and
the gap increases as the level of education goes up. This trend feeds through to the figures seen earlier in
Higher Education, where female students outnumber male students in the UK.
Figure 3.1: The difference between females and males achieving headline attainment measures, 2017/18 The Level 3 and A Level pass rates are calculated as a percentage of the total population aged 17

Page 11 of 14
In England, Wales and Northern Ireland there has been an increase in entries to science subjects at GCSE. In each of Scotland, Wales and Northern Ireland, there has been a change in language entries. Scotland has seen an increase in Gaelic and Other Languages while entries in French (at level 3-5) and German (at level 6) have declined; Wales has seen a decrease in Spanish at GCSEs and Northern Ireland has seen a decrease in French GCSEs. In the UK there has been a shift in the type of computing learning taking place in schools, with Information and communications technology (ICT) entries falling in all countries at different levels. However, in England the subject with the highest increase in entries at A Level is Computing (or Computer Science) and in Northern Ireland it is the subject with the second highest increase in A Levels. Figure 3.2: Subjects with the largest percentage increase in entries between 2016/17 and 2017/18 by qualification type
Figure 3.3: Subjects with the largest percentage decrease in entries between 2016/17 and 2017/18 qualification type
1st 2nd 3rd
GCSE Biological Science Chemistry Physics
A Level Computing Other Social Studies Business Studies
GCSE Home Economics Physics Business Studies
A Level Business Studies Welsh Further Mathematics
Level 3-5 Gaelic Other Languages Media Studies
Level 6 Media Studies Physical Education Vocational Studies
GCSE Science Single Award Science Double Award Classical Studies
A Level Business Studies Computing Music
Country
England
Wales
Scotland
Northern Ireland
Subjects with the largest percentage increase in entries (minimum 100 entries in both years)Qualification
1st 2nd 3rd
GCSE Vocational Studies Home Economics Communication Studies
A Level General Studies Home Economics ICT
GCSE Vocational Studies Other Sciences Spanish
A Level ICT Religious Studies Economics
Level 3-5 French Information Technology Geography
Level 6 Classical studies German Geography
GCSE French Music Economics
A Level ICT Drama Physical Education
England
Wales
Scotland
Northern Ireland
Country Qualification Subjects with the largest percentage decrease in entries (minimum 100 entries in both years)

Page 12 of 14
Accompanying tables
The following tables are available in Excel format on the department’s website
Table Chapter/Table Name
1 Schools
1.1 Number of schools, by type of school
1.2 Full-time and part-time pupils by age, gender and school type
1.2.1 Full-time and part-time pupils by gender and school type
1.2.2 Full-time and part-time pupils by age, gender and school type (Time series)
1.3 Qualified teachers by type of school and gender
1.4 Pupil: teacher ratios (PTRs) and pupil: adult ratios (PARs) within schools, by type of school
2 Post compulsory education
2.1 Number of establishments of further and higher education by type, and full-time academic staff by gender
2.2 Students in higher education by level, mode of study, gender and subject group
2.2.1 Home and Overseas Students in higher education by mode of study, gender and subject group
2.3 Students in further education by country of study, mode of study, gender and age
2.4 Students in further education by gender and higher education, by gender, level of study and mode of attendance
2.5 People aged from 16 to 24 Not in Education, Employment or Training ('NEET') by gender
3 Qualifications
3.1a(i) GCSE and equivalent entries and achievements of pupils at the end of Key Stage 4 by gender, England
3.1a(ii) GCSE entries and achievements for pupils at the end of key stage 4 by subject and gender, England
3.1b(i) GCSE and vocational qualifications obtained by pupils in their last year of compulsory education by gender, Wales
3.1b(ii) GCSE entries and achievements for pupils in their last year of compulsory education by subject and gender, Wales
3.1c(i) SQA qualifications obtained by school leavers
3.1c(ii) SQA qualifications entries and achievements at SCQF levels 3-5 by subject, all learners
3.1d(i) GCSE and vocational qualifications obtained by pupils in their last year of compulsory education by gender, Northern Ireland
3.1d(ii) GCSE entries and achievements for pupils in their last year of compulsory education by subject and gender, Northern Ireland
3.2a(i) A level and equivalent vocational qualifications obtained by young people in Schools and Further Education Colleges by gender, England
3.2a(ii) A level entries and achievements for young people in schools by subject and gender, England
3.2b(i) A level and equivalent vocational qualifications obtained by young people in schools by gender, Wales
3.2b(ii) A level entries and achievements for young people in schools by subject and gender, Wales
3.2c(i) SQA qualifications obtained by school leavers
3.2c(ii) SQA qualifications entries and achievements at SCQF level 6 (Highers) by subject, all learners
3.2d(i) A level and equivalent vocational qualifications obtained by young people in schools by gender, Northern Ireland
3.2d(ii) A level entries and achievements for young people in schools by subject and gender, Northern Ireland
3.3 Highest qualification held by working age adults, by gender and age
4 Education Expenditure
4 Education expenditure on services

13
When reviewing the tables, please note that:
Rounding conventions
and suppression
The National Statistics Code of Practice requires that reasonable steps should be taken to ensure that all published or disseminated statistics produced by the Department for Education protect confidentiality. In most tables the figures are presented as whole numbers while in some tables, percentages are displayed to 1 decimal point. The rounding convention is a follows: any fractions of 0.5 and above will be rounded up, anything less than 0.5 will be rounded down. The following conventions have been used in the tables: . not applicable .. not available - nil or negligible
x suppressed because of small numbers
National Statistics
The United Kingdom Statistics Authority designated these statistics as National Statistics in November
2012, in accordance with the Statistics and Registration Service Act 2007 and signifying compliance with
the Code of Practice for Official Statistics.
Designation can be broadly interpreted to mean that the statistics:
meet identified user needs;
are well explained and readily accessible;
are produced according to sound methods, and
are managed impartially and objectively in the public interest.
Once statistics have been designated as National Statistics it is a statutory requirement that the Code of
Practice shall continue to be observed.
The Department has a set of statistical policies in line with the Code of Practice for Official Statistics.
Technical Information
An additional document accompanies this publication providing further information on the education
systems in each country and detail of the data sources used in producing the data.
Get in touch
Media enquiries
Press Office News Desk, Department for Education, Sanctuary Buildings, Great Smith Street, London
SW1P 3BT.
Tel: 020 7783 8300
Other enquiries/feedback
Email: [email protected]
© Crown copyright 2019
This publication (not including logos) is licensed under the terms of the
Open Government Licence v3.0 except where otherwise stated. Where
we have identified any third party copyright information you will need to
obtain permission from the copyright holders concerned.
To view this licence:
visit www.nationalarchives.gov.uk/doc/open-government-licence/version/3
email [email protected]
write to Information Policy Team, The National Archives, Kew, London, TW9 4DU
About this publication:
enquiries Email: [email protected]
https://www.gov.uk/government/collections/statistics-education-and-training
Reference: [Education and training statistics for the UK: 2019]
Follow us on Twitter: @educationgovuk
Like us on Facebook: facebook.com/educationgovuk