Embed Size (px)
Citation preview
DIGEST OF UNITED KINGDOM ENERGY STATISTICS 2017
July 2017

This document is available in large print, audio and braille
on request. Please email [email protected] with the version
you require.
Digest of United Kingdom Energy Statistics
Enquiries about statistics in this publication should be made to the contact named at the
end of the relevant chapter. Brief extracts from this publication may be reproduced
provided that the source is fully acknowledged. General enquiries about the publication,
and proposals for reproduction of larger extracts, should be addressed to BEIS, at the
address given in paragraph XXVIII of the Introduction.
The Department for Business, Energy and Industrial Strategy (BEIS) reserves the right
to revise or discontinue the text or any table contained in this Digest without prior notice
This is a National Statistics publication
The United Kingdom Statistics Authority has designated these statistics as National
Statistics, in accordance with the Statistics and Registration Service Act 2007 and
signifying compliance with the UK Statistics Authority: Code of Practice for Official
Statistics.
ONCE STATISTICS HAVE BEEN DESIGNATED AS NATIONAL STATISTICS IT IS A STATUTORY REQUIREMENT THAT THE CODE OF PRACTICE SHALL CONTINUE TO BE OBSERVED.
Designation can be broadly interpreted to mean that the statistics:
meet identified user needs are well explained and readily accessible are produced according to sound methods, and are managed impartially and objectively in the public interest
Once statistics have been designated as National Statistics it is a statutory
requirement that the Code of Practice shall continue to be observed
© Crown copyright 2017
You may re-use this information (not including logos) free of charge in any format or
medium, under the terms of the Open Government Licence.
To view this licence, visit www.nationalarchives.gov.uk/doc/open-government-
licence/version/3/ or write to the Information Policy Team, The National Archives, Kew,
London TW9 4DU, or email: [email protected].
Any enquiries regarding this publication should be sent to us at
This publication is available for download at www.gov.uk/government/collections/digest-
of-uk-energy-statistics-dukes
1
Contents
Page
Introduction 5
Contact list 9
Comparison of table numbers 10
Chapter 1 Energy 11
Chapter 2 Solid fuels and derived gases 37
Chapter 3 Petroleum 59
Chapter 4 Natural gas 89
Chapter 5 Electricity 111
Chapter 6 Renewable sources of energy 153
Chapter 7 Combined heat and power 193
Annex A Energy and commodity balances, conversion
factors and calorific values
225
Annex B Glossary and acronyms 239
Annex C Further sources of UK energy publications 251
Annex D Major events in the energy industry 257
Monthly and quarterly data are also available for Energy, Solid fuels and derived
gases, Petroleum, Gas, Electricity and Renewables at:
www.gov.uk/government/organisations/department-for-business-energy-and-
industrial-strategy/about/statistics
Information on Energy Prices is also available at:
www.gov.uk/government/organisations/department-for-business-energy-and-
industrial-strategy/about/statistics
2
A list of tables Table number Page
Chapter 1 Energy
1.1-1.3 Aggregate energy balance 30
1.4-1.6 Value balance of traded energy 33
1.7 Sales of electricity and gas by sector 36
Chapter 2 Solid fuels and derived gases
2.1-2.3 Coal: Commodity balances 52
2.4 Supply and consumption of coal 55
2.5 Supply and consumption of coke oven coke, coke breeze and other manufactured solid fuels
56
2.6 Supply and consumption of coke oven gas, blast furnace gas, benzole and tars 57
2.7 Deep mines and surface mines in production, December 2016 58
Chapter 3 Petroleum
3.1 Primary oil: Commodity balances 77
3.2-3.4 Petroleum products: Commodity balances 78
3.5 Supply and disposal of petroleum 84
3.6 Additional information on inland deliveries of selected products 85
3.7 Stocks of crude oil and petroleum products at end of year 86
3.8 Additional information on inland deliveries for non-energy uses 87
Chapter 4 Natural gas
4.1 Commodity balances 105
4.2 Supply and consumption of natural gas and colliery methane 106
4.3 UK continental shelf and onshore natural gas production and supply 107
4.4 Gas storage sites and import/export facilities in the United Kingdom, November 2016 108
4.5 Natural gas imports and exports 109
4.6 Liquefied Natural Gas imports by terminal 110
Chapter 5 Electricity
5.1 Commodity balances 134
5.2 Commodity balances, public distribution system and other generators 136
5.3 Fuel used in generation 137
5.4 Fuels consumed for electricity generation (autogeneration) by main industrial groups 138
5.5 Electricity supply, electricity supplied (net), electricity available, electricity consumption and electricity sales
140
5.6 Electricity fuel use, generation and supply 141
5.7 Plant capacity – United Kingdom 143
5.8 Major Power Producers Plant capacity – England and Wales, Scotland and Northern Ireland 144
5.9 Capacity of other generators 144
5.10 Plant loads, demand and efficiency 145
5.11 Power stations in the United Kingdom, May 2017 146
5.12 Plant installed capacity, by connection - United Kingdom 151
3
Chapter 6 Renewable sources of energy
6.1-6.3 Commodity balances 182
6.4 Capacity of, and electricity generated from, renewable sources 188
6.5 Load factors for renewable electricity generation 189
6.6 Renewable sources used to generate electricity and heat and for transport fuels 190
6.7 Renewable sources data used to indicate progress under the 2009 EU Renewable Energy Directive (measured using net calorific values) 191
Chapter 7 Combined heat and power
7.1 CHP installations by capacity and size range 210
7.2 Fuel used to generate electricity and heat in CHP installations 210
7.3 Fuel used by types of CHP installation 211
7.4 CHP - electricity generated by fuel and type of installation 212
7.5 CHP - electrical capacity by fuel and type of installation 213
7.6 CHP - heat generated by fuel and type of installation 214
7.7 CHP - heat capacity by fuel and type of installation 215
7.8 CHP capacity, output and total fuel use by sector 216
7.9 CHP - use of fuels by sector 218
7.10 Large scale CHP schemes in the United Kingdom, December 2016 220
Annex A Energy and commodity balances, conversion
factors and calorific values
Standard conversion factors 233
A.1 Estimated average calorific values of fuels 2016 235
A.2 Estimated average gross calorific values of fuels 1980, 1990, 2000, 2010 and 2014 to 2016 236
A.3 Estimated average net calorific values of fuels, 1980, 1990, 2000, 2010 and 2014 to 2016 237

4
5
Introduction I This issue of the Digest of United Kingdom Energy Statistics (DUKES) continues a series which commenced with the Ministry of Fuel and Power Statistical Digest for the years 1948 and 1949, published in 1950. The Ministry of Fuel and Power Statistical Digest was previously published as a Command Paper, the first being that for the years 1938 to 1943, published in July 1944 (Cmd. 6538). A publication tracing the history of energy production and use over the past 60 years was produced in 2009 to mark the 60
th anniversary of DUKES. The publication is available at:
www.gov.uk/government/collections/digest-of-uk-energy-statistics-dukes II The current issue updates the figures given in the Department for Business, Energy and Industrial Strategy’s (BEIS) Digest of United Kingdom Energy Statistics 2016, published in July 2016. III This publication consists of seven chapters and four annexes. The first chapter deals with overall energy. The other chapters cover the specific fuels, renewable sources of energy and combined heat and power. The annexes cover conversion factors and calorific values, a glossary of terms, further sources of information and major events in the energy industries. IV Some additional information appears on the internet. The tables on the internet are provided in Microsoft Excel format. Most internet versions of the tables include data for earlier years, which are not provided in this publication. For example commodity and energy balances (see VII and VIII, below) for 1998 to 2013 are included on the internet, and tables that show five years in this publication show nineteen years in their internet form because page sizes are not a limiting factor. In addition, the following appear on the internet:
Long term trends tables Major events from 1990 to 2017 - Annex D (only Major events for 2015 to 2017 appear in this publication) Energy and the environment – Annex E UK oil and gas resources - Annex F Foreign trade – Annex G Flow charts – Annex H Energy balance: net calorific values – Annex I Heat reconciliation – Annex J
V Annual information on prices is included in the publication Energy Prices. The data are also available on the Department for Business, Energy and Industrial Strategy (BEIS) section of the GOV.UK website. Further information on these publications can be found in Annex C. VI Where necessary, data have been converted or adjusted to provide consistent series. However, in some cases changes in methods of data collection have affected the continuity of the series. The presence of remaining discontinuities is indicated in the chapter text or in footnotes to the tables. VII Chapters 2, 3, 4, 5 and 6 contain production and consumption of individual fuels and are presented using commodity balances. A commodity balance illustrates the flows of an individual fuel through from production to final consumption, showing its use in transformation (including heat generation) and energy industry own use. Further details of commodity balances and their use are given in Annex A, paragraphs A.7 to A.42. VIII The individual commodity balances are combined in an energy balance, presented in Chapter 1, Energy. The energy balance differs from a commodity balance in that it shows the interactions between different fuels in addition to illustrating their consumption. The energy balance thus gives a fuller picture of the production, transformation and use of energy showing all the flows. Expenditure on energy is also presented in energy balance format in Chapter 1. Further details of the energy balance and its use, including the methodology introduced in the 2003 Digest for heat, are given in Annex A, paragraphs A.43 to A.58.
6
IX Chapter 1 also covers general energy statistics and includes tables showing energy consumption by final users and an analysis of energy consumption by main industrial groups. Fuel production and consumption statistics are derived mainly from the records of fuel producers and suppliers. X Chapters 6 and 7 summarise the results of surveys conducted by Ricardo Energy & Environment on behalf of BEIS which complement work undertaken by BEIS. These chapters estimate the contribution made by renewable energy sources to energy and combined heat and power (CHP) production and consumption in the United Kingdom. XI Some of the data shown in this Digest may contain previously unpublished revisions and estimates of trade from HM Revenue and Customs and the Office for National Statistics. These data are included in Annex G.
Definitions XII The text at the beginning of each chapter explains the main features of the tables. Technical notes and definitions, given at the end of this text, provide detailed explanations of the figures in the tables and how they are derived. Further information on methodologies are also provided on the BEIS section of the GOV.UK website for each fuel XIII Most chapters contain some information on ‘oil’ or ‘petroleum’; these terms are used in a general sense and vary according to usage in the field examined. In their widest sense they are used to include all mineral oil and related hydrocarbons (except methane) and any derived products. XIV An explanation of the terms used to describe electricity generating companies is given in Chapter 5, paragraphs 5.62 to 5.69. XV Data in this issue have been prepared on the basis of the Standard Industrial Classification (SIC 2007) as far as is practicable. For further details of classification of consumers see Chapter 1, paragraphs 1.57 to 1.61. XVI Where appropriate, further explanations and qualifications are given in footnotes to the tables.
Proposed change to use net calorific values when producing energy statistics XVII A consultation was launched in the 2005 edition of the Digest seeking views of users as to whether Net Calorific Values (NCVs) should be used in place of Gross Calorific Values (GCVs). As a result of this consultation, it was recognised that there are good arguments both for and against moving from GCV to NCV. However it was concluded that there would be no demonstrable advantage to changing the method of presenting UK Energy statistics, and so GCVs continue to be used in this edition and will be used in future editions of the Digest. The fuel specific NCVs will continue to be published, and are shown in Annex A. The total energy balances on a net calorifc basis are now produced as part of the additional internet content of the Digest, Annex I.
Geographical coverage XVIII The geographical coverage of the statistics is the United Kingdom. However, within UK trade statistics, shipments to the Channel Islands and the Isle of Man from the United Kingdom are not classed as exports. Supplies of solid fuel and petroleum to these islands, from the UK, are therefore included as part of United Kingdom inland consumption or deliveries.
Periods XIX Data in this Digest are for calendar years or periods of 52 weeks, depending on the reporting procedures within the fuel industry concerned. Actual periods covered are given in the notes to the individual fuel chapters
Revisions XX The tables contain revisions to some of the previously published figures, and where practicable the revised data have been indicated by an ‘r’. The ‘r’ marker is used whenever the figure has been revised from that published in the 2016 Digest, even though some figures may have been amended on the internet version of the tables. A table showing the size of revisions to key aggregates is available
7
(Chapter 1, table 1J). Statistics on energy in this Digest are classified as National Statistics. This means that they are produced to high professional standards as set out in the UK Statistics Authority’s Code of Practice for Official Statistics. The Code of Practice requires that all the public bodies that produce official statistics “Publish a revisions policy for those outputs that are subject to scheduled revisions, and provide a statement explaining the nature and extent of revisions at the same time that they are released”. The following statement outlines the policy on revisions for energy statistics.
Revisions to data published in the Digest of UK Energy Statistics. It is intended that any revisions should be made to previous years' data only at the time of the publication of the Digest (i.e. in July 2017 when this Digest is published, revisions can be made to 2015 and earlier years). In exceptional circumstances previous years' data can be amended between Digest publication dates, but this will only take place when quarterly Energy Trends is published. The reasons for substantial revisions will be explained in the 'Highlights' sheet of the internet version of the table concerned. Valid reasons for revisions of Digest data include:
revised and validated data received from a data supplier;
the figure in the Digest was wrong because of a typographical or similar error.
In addition, when provisional annual data for a new calendar year (e.g. 2017) are published in Energy Trends in March of the following year (e.g. March 2018), percentage growth rates are liable to be distorted if the prior year (i.e. 2016) data are constrained to the Digest total, when revisions are known to be required. In these circumstances the prior year (i.e. 2016) data will be amended for all affected tables in Energy Trends and all affected Digest tables will be clearly annotated to show that the data has been up-dated in Energy Trends.
Revisions to 2017 data published in Energy Trends prior to publication in the 2018 edition of
the Digest of UK Energy Statistics.
All validated amendments from data suppliers will be updated when received and published in the next statistical release.
All errors will be amended as soon as identified and published in the next statistical release.
Data in energy and commodity balances format will be revised on a quarterly basis, to coincide with the publication of Energy Trends.
Further details on the UK Statistics Authority’s Code of Practice for Official Statistics can be found at: www.statisticsauthority.gov.uk/monitoring-and-assessment/code-of-practice/. BEIS’s statements of compliance with the Code are available at: www.gov.uk/government/organisations/department-for-business-energy-and-industrial-strategy/about/statistics. The UK Statistics Authority undertake regular assessments of BEIS’s energy statistics and their reports can be accessed at: www.statisticsauthority.gov.uk/publications-list/?keyword=&type=assessment-report. The authority’s recommendations have been incorporated into this publication and other BEIS energy statistical publications and outputs.
Energy data on the internet XXI Energy data are held on the BEIS section of the GOV.UK website, under “statistics”. The Digest is available at: www.gov.uk/government/collections/digest-of-uk-energy-statistics-dukes. Information on further BEIS energy publications is given in Annex C. XXII The Department for Business, Energy and Industrial Strategy was created on 14 July 2016. This Department took over energy policy from the former Department of Energy and Climate Change. Within this publication references to BEIS’s predecessor Department refer to DECC.
XXIII Short term statistics are published:
monthly, by BEIS;
quarterly, by BEIS in Energy Trends, and Energy Prices;
quarterly, by BEIS in a Statistical Press Release which provides a summary of information published in Energy Trends and Energy Prices;
Table numbering XXIV Page 10 contains a list showing the tables in the order in which they appear in this issue, and their corresponding numbers in previous issues.

8
Symbols used XXV The following symbols are used in this Digest: .. not available - nil or not separately available r revised since the previous edition
Rounding convention XXVI Individual entries in the tables are rounded independently and this can result in totals, which are different from the sum of their constituent items.
Acknowledgements XXVII Acknowledgement is made to the main coal producing companies, the electricity companies, the oil companies, the gas pipeline operators, the gas suppliers, National Grid, the Institute of Petroleum, the Coal Authority, the United Kingdom International Steel Statistics Bureau, Ricardo Energy & Environment, the Department for Environment, Food and Rural Affairs, the Department for Transport, OFGEM, Building Research Establishment, HM Revenue and Customs, the Office for National Statistics, and other contributors to the enquiries used in producing this publication.
Contacts XXVIII For general enquiries on energy statistics contact: BEIS Energy Statistics (e-mail:[email protected])
Department for Business, Energy and Industrial Strategy Energy Statistics Team 1
st Floor – Abbey 2,
1 Victoria Street, London SW1H 0ET
XXIX For enquiries concerning particular data series or chapters contact those named on page 9 or at the end of the relevant chapter.
9
Contact List
The following people in the Department for Business, Energy and Industrial Strategy may be contacted for further information about the topics listed:
Topic Contact Telephone E-mail 0300 068 Total energy Warren Evans 5059 [email protected] Solid fuels and derived gases
Chris Michaels 5050 [email protected]
Oil and upstream gas resources
Matthew Curds 8414 [email protected]
Petroleum (downstream)
Natalie Cartwright 5260 [email protected]
Gas supply (downstream)
James Halliwell 8121 [email protected]
Electricity Stephen Ashcroft 2928 [email protected]
Renewable sources of energy
James Hemingway 5042 [email protected]
Combined heat and power
Liz Waters 5735 [email protected]
Prices and values, industrial, international and oil prices
Anwar Annut 5060 [email protected]
Regional and Local Authority Energy
Greg Haigh 6093 [email protected]
Calorific values and conversion factors
Iain MacLeay 5048 [email protected]
General enquiries
BEIS Energy Statistics
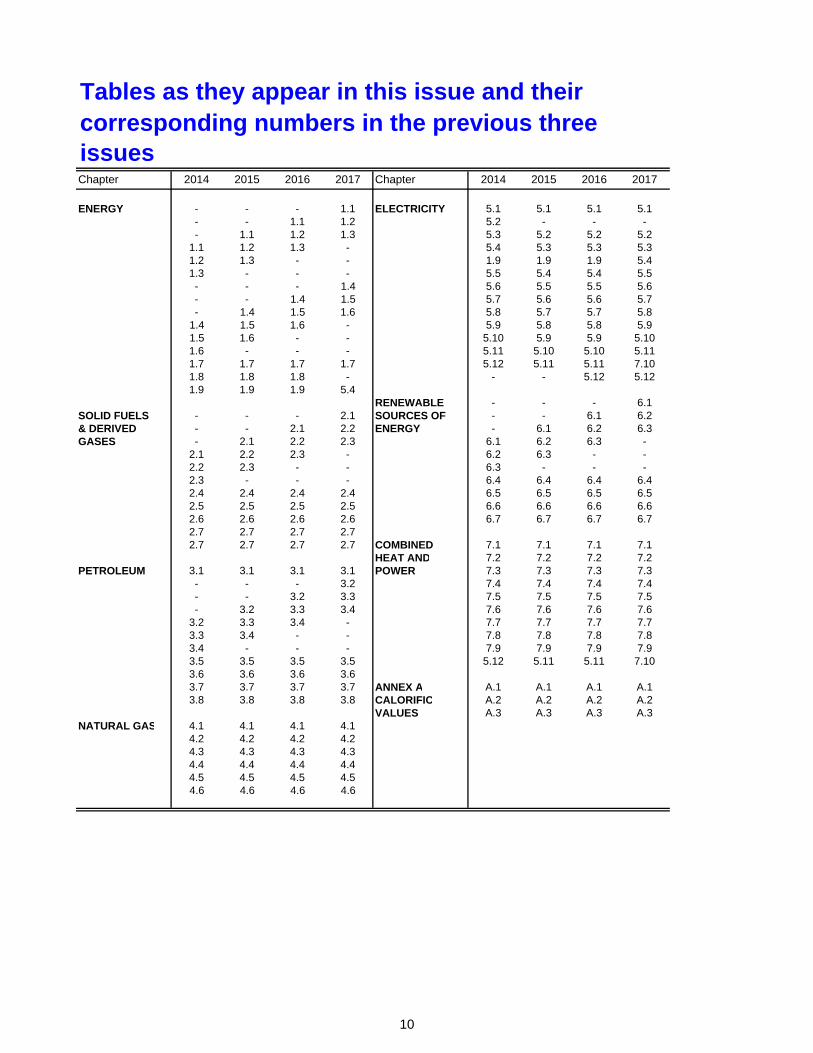
Tables as they appear in this issue and their corresponding numbers in the previous three issuesChapter 2014 2015 2016 2017 Chapter 2014 2015 2016 2017
ENERGY - - - 1.1 ELECTRICITY 5.1 5.1 5.1 5.1- - 1.1 1.2 5.2 - - -- 1.1 1.2 1.3 5.3 5.2 5.2 5.2
1.1 1.2 1.3 - 5.4 5.3 5.3 5.31.2 1.3 - - 1.9 1.9 1.9 5.41.3 - - - 5.5 5.4 5.4 5.5- - - 1.4 5.6 5.5 5.5 5.6- - 1.4 1.5 5.7 5.6 5.6 5.7- 1.4 1.5 1.6 5.8 5.7 5.7 5.8
1.4 1.5 1.6 - 5.9 5.8 5.8 5.91.5 1.6 - - 5.10 5.9 5.9 5.101.6 - - - 5.11 5.10 5.10 5.111.7 1.7 1.7 1.7 5.12 5.11 5.11 7.101.8 1.8 1.8 - - - 5.12 5.121.9 1.9 1.9 5.4
RENEWABLE - - - 6.1SOLID FUELS - - - 2.1 SOURCES OF - - 6.1 6.2& DERIVED - - 2.1 2.2 ENERGY - 6.1 6.2 6.3GASES - 2.1 2.2 2.3 6.1 6.2 6.3 -
2.1 2.2 2.3 - 6.2 6.3 - -2.2 2.3 - - 6.3 - - -2.3 - - - 6.4 6.4 6.4 6.42.4 2.4 2.4 2.4 6.5 6.5 6.5 6.52.5 2.5 2.5 2.5 6.6 6.6 6.6 6.62.6 2.6 2.6 2.6 6.7 6.7 6.7 6.72.7 2.7 2.7 2.72.7 2.7 2.7 2.7 COMBINED 7.1 7.1 7.1 7.1
HEAT AND 7.2 7.2 7.2 7.2PETROLEUM 3.1 3.1 3.1 3.1 POWER 7.3 7.3 7.3 7.3
- - - 3.2 7.4 7.4 7.4 7.4- - 3.2 3.3 7.5 7.5 7.5 7.5- 3.2 3.3 3.4 7.6 7.6 7.6 7.6
3.2 3.3 3.4 - 7.7 7.7 7.7 7.73.3 3.4 - - 7.8 7.8 7.8 7.83.4 - - - 7.9 7.9 7.9 7.93.5 3.5 3.5 3.5 5.12 5.11 5.11 7.103.6 3.6 3.6 3.63.7 3.7 3.7 3.7 ANNEX A A.1 A.1 A.1 A.13.8 3.8 3.8 3.8 CALORIFIC A.2 A.2 A.2 A.2
VALUES A.3 A.3 A.3 A.3NATURAL GAS 4.1 4.1 4.1 4.1
4.2 4.2 4.2 4.24.3 4.3 4.3 4.34.4 4.4 4.4 4.44.5 4.5 4.5 4.54.6 4.6 4.6 4.6
10
11
Chapter 1 Energy
Introduction 1.1 This chapter presents figures on overall energy production and consumption. Figures showing the flow of energy from production, transformation and energy industry use through to final consumption are presented in the format of an energy balance based on the individual commodity balances in Chapters 2 to 6.
1.2 The chapter begins with aggregate energy balances covering the last three years (Tables 1.1 to 1.3) starting with the latest year, 2016, compiled using Gross Calorific Values (see paragraph 1.29). Energy value balances then follow this for the same years (Tables 1.4 to 1.6) and Table 1.7 shows sales of electricity and gas by sector in value terms. The explanation of the principles behind the energy balance and commodity balance presentations, and how this links with the figures presented in other chapters, is set out in Annex A. Information on long term trends (Tables 1.1.1 to 1.1.9) are available on BEIS’s energy statistics web site at: www.gov.uk/government/collections/digest-of-uk-energy-statistics-dukes
Key points
In 2016, UK energy production was up 1.2 per cent on a year earlier. The rise was driven by growth in UK Continental Shelf output with both oil and gas output up. There was also growth in biofuels. However, coal output decreased to record low levels. (Tables 1.1 and 1.2).
Imports and exports in 2016 were both down; overall net imports decreased though they still accounted for 36 per cent of energy used in the UK.
Primary energy consumption was down 1.4 per cent; and on a temperature adjusted basis primary energy consumption was down 2.3 per cent continuing the downward trend of the last ten years. UK temperatures were above normal, but there was a small increase in heating degree days than in 2015. (Table 1.1.7).
Final energy consumption rose by 1.6 per cent as demand for heating increased with temperature adjusted final energy consumption up by 0.9 per cent on 2015 levels, mainly due to increased energy use in transport . (More details are available in Energy Consumption in the UK www.gov.uk/government/collections/energy-consumption-in-the-uk)
Fossil fuels remain the dominant source of energy supply, but now accounts for 81.5 per cent, a record low level. Supply from renewables increased, with their contribution accounting for 8.9 per cent of final consumption on the EU agreed basis (see Chapter 6).
In 2016, there was a switch in the main sources of electricity generation away from coal to gas generation. Generation from coal fell by 60 per cent, as a number of plants closed or switched to burning biomass; gas rose by 46 per cent. Renewables’ share of generation was stable at 25 per cent in 2016, the same as in 2015. Increased renewables generation capacity was balanced by less favourable weather conditions for solar and wind generation (see chapters 5 and 6).
Provisional BEIS estimates suggest that overall emissions fell by nearly 30 million tonnes of carbon dioxide (MtCO2) (7.4 per cent) to 374.1 MtCO2 between 2015 and 2016, driven by the changes in electricity generation.
12
Aggregate energy balance (Tables 1.1, 1.2 and 1.3) 1.3 These tables show the flows of energy in the United Kingdom from production to final consumption through conversion into secondary fuels such as coke, petroleum products, secondary electricity and heat sold. The figures are presented on an energy supplied basis, in tonnes of oil equivalent (toe), a unit of energy where 1 toe = 41.868 GJ, see also paragraph 1.28 for other energy units. The basic principles of energy balances and guidance on what is included in each row is detailed in Annex A of this publication.
Energy production and supply
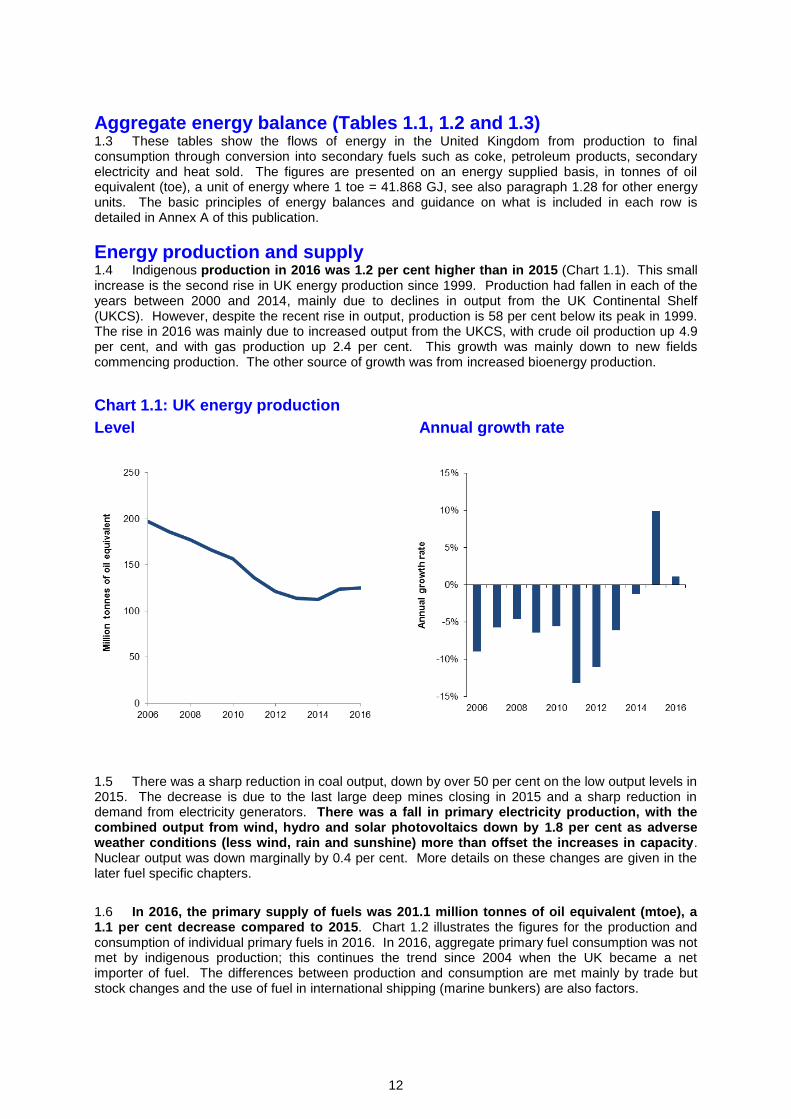
1.4 Indigenous production in 2016 was 1.2 per cent higher than in 2015 (Chart 1.1). This small increase is the second rise in UK energy production since 1999. Production had fallen in each of the years between 2000 and 2014, mainly due to declines in output from the UK Continental Shelf (UKCS). However, despite the recent rise in output, production is 58 per cent below its peak in 1999. The rise in 2016 was mainly due to increased output from the UKCS, with crude oil production up 4.9 per cent, and with gas production up 2.4 per cent. This growth was mainly down to new fields commencing production. The other source of growth was from increased bioenergy production.
Chart 1.1: UK energy production
Level Annual growth rate
1.5 There was a sharp reduction in coal output, down by over 50 per cent on the low output levels in 2015. The decrease is due to the last large deep mines closing in 2015 and a sharp reduction in demand from electricity generators. There was a fall in primary electricity production, with the combined output from wind, hydro and solar photovoltaics down by 1.8 per cent as adverse weather conditions (less wind, rain and sunshine) more than offset the increases in capacity. Nuclear output was down marginally by 0.4 per cent. More details on these changes are given in the later fuel specific chapters.
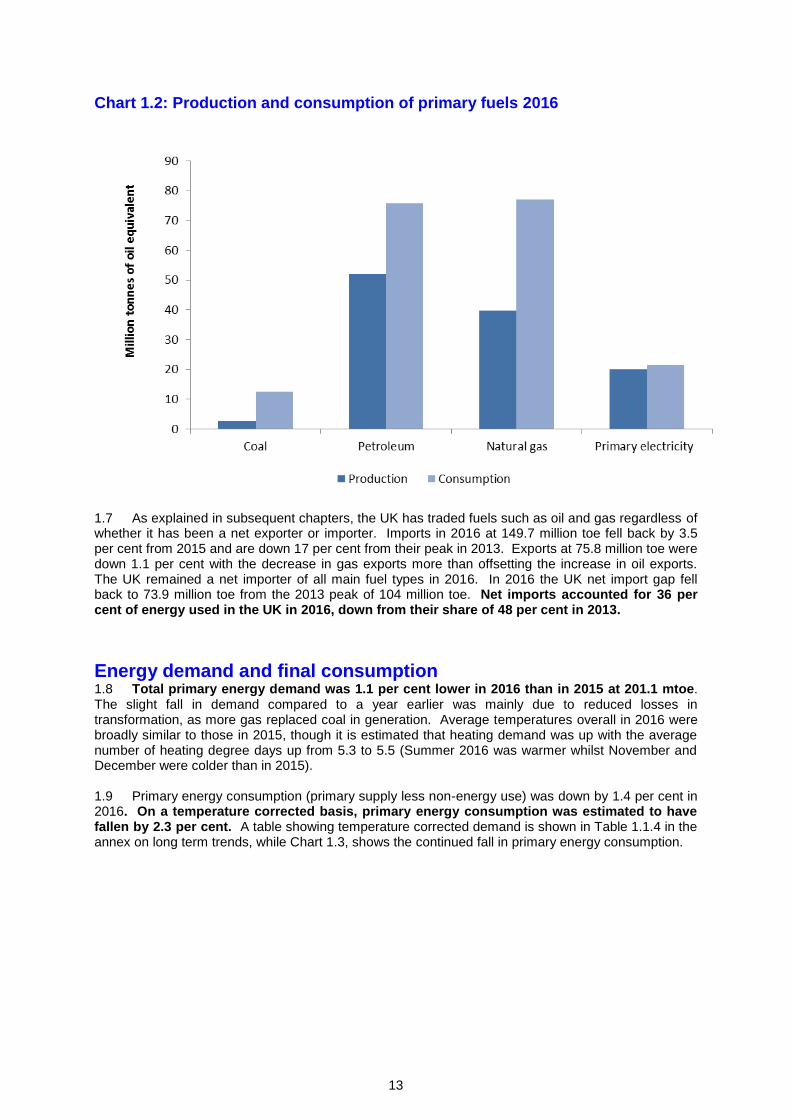
1.6 In 2016, the primary supply of fuels was 201.1 million tonnes of oil equivalent (mtoe), a 1.1 per cent decrease compared to 2015. Chart 1.2 illustrates the figures for the production and consumption of individual primary fuels in 2016. In 2016, aggregate primary fuel consumption was not met by indigenous production; this continues the trend since 2004 when the UK became a net importer of fuel. The differences between production and consumption are met mainly by trade but stock changes and the use of fuel in international shipping (marine bunkers) are also factors.
13
Chart 1.2: Production and consumption of primary fuels 2016
1.7 As explained in subsequent chapters, the UK has traded fuels such as oil and gas regardless of whether it has been a net exporter or importer. Imports in 2016 at 149.7 million toe fell back by 3.5 per cent from 2015 and are down 17 per cent from their peak in 2013. Exports at 75.8 million toe were down 1.1 per cent with the decrease in gas exports more than offsetting the increase in oil exports. The UK remained a net importer of all main fuel types in 2016. In 2016 the UK net import gap fell back to 73.9 million toe from the 2013 peak of 104 million toe. Net imports accounted for 36 per cent of energy used in the UK in 2016, down from their share of 48 per cent in 2013.
Energy demand and final consumption
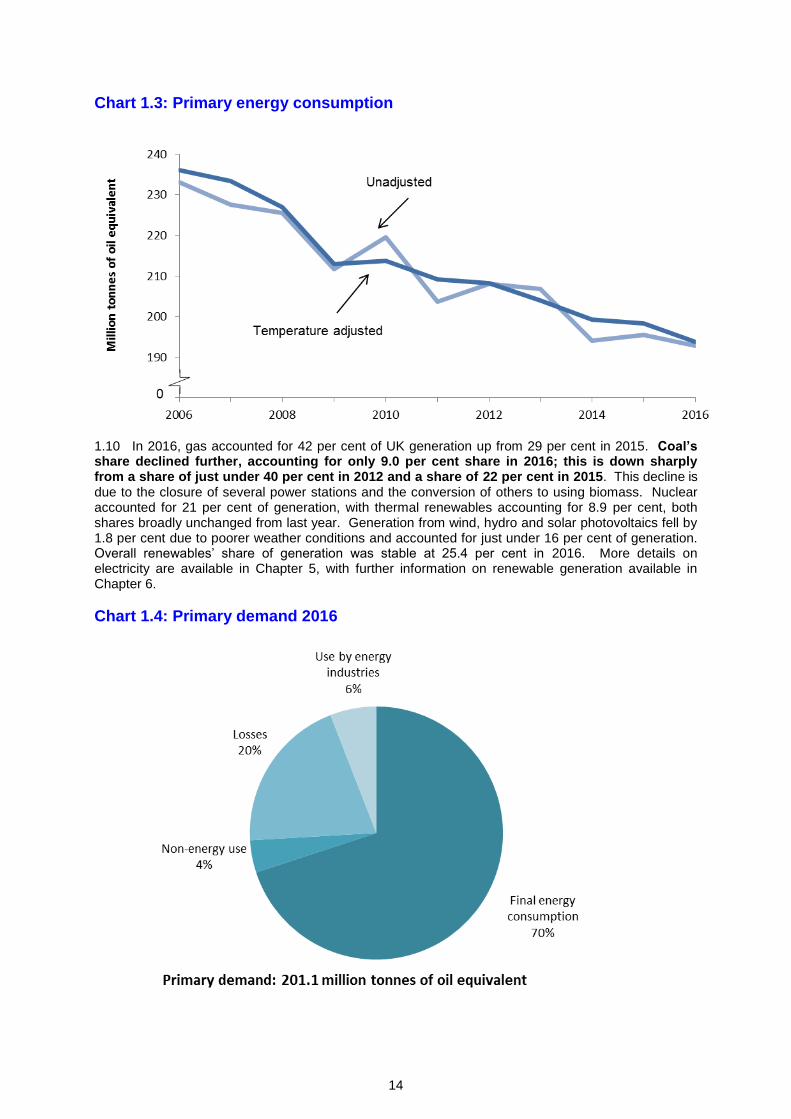
1.8 Total primary energy demand was 1.1 per cent lower in 2016 than in 2015 at 201.1 mtoe. The slight fall in demand compared to a year earlier was mainly due to reduced losses in transformation, as more gas replaced coal in generation. Average temperatures overall in 2016 were broadly similar to those in 2015, though it is estimated that heating demand was up with the average number of heating degree days up from 5.3 to 5.5 (Summer 2016 was warmer whilst November and December were colder than in 2015). 1.9 Primary energy consumption (primary supply less non-energy use) was down by 1.4 per cent in 2016. On a temperature corrected basis, primary energy consumption was estimated to have fallen by 2.3 per cent. A table showing temperature corrected demand is shown in Table 1.1.4 in the annex on long term trends, while Chart 1.3, shows the continued fall in primary energy consumption.
14
Chart 1.3: Primary energy consumption
1.10 In 2016, gas accounted for 42 per cent of UK generation up from 29 per cent in 2015. Coal’s share declined further, accounting for only 9.0 per cent share in 2016; this is down sharply from a share of just under 40 per cent in 2012 and a share of 22 per cent in 2015. This decline is due to the closure of several power stations and the conversion of others to using biomass. Nuclear accounted for 21 per cent of generation, with thermal renewables accounting for 8.9 per cent, both shares broadly unchanged from last year. Generation from wind, hydro and solar photovoltaics fell by 1.8 per cent due to poorer weather conditions and accounted for just under 16 per cent of generation. Overall renewables’ share of generation was stable at 25.4 per cent in 2016. More details on electricity are available in Chapter 5, with further information on renewable generation available in Chapter 6.
Chart 1.4: Primary demand 2016
15
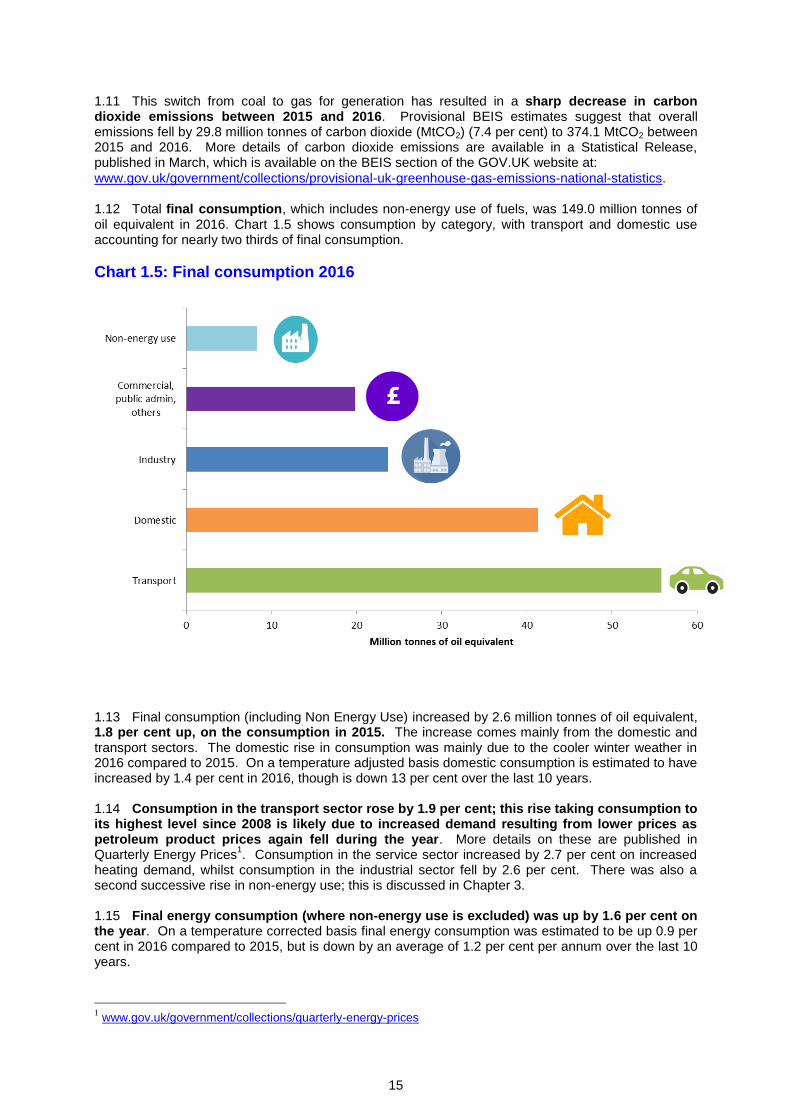
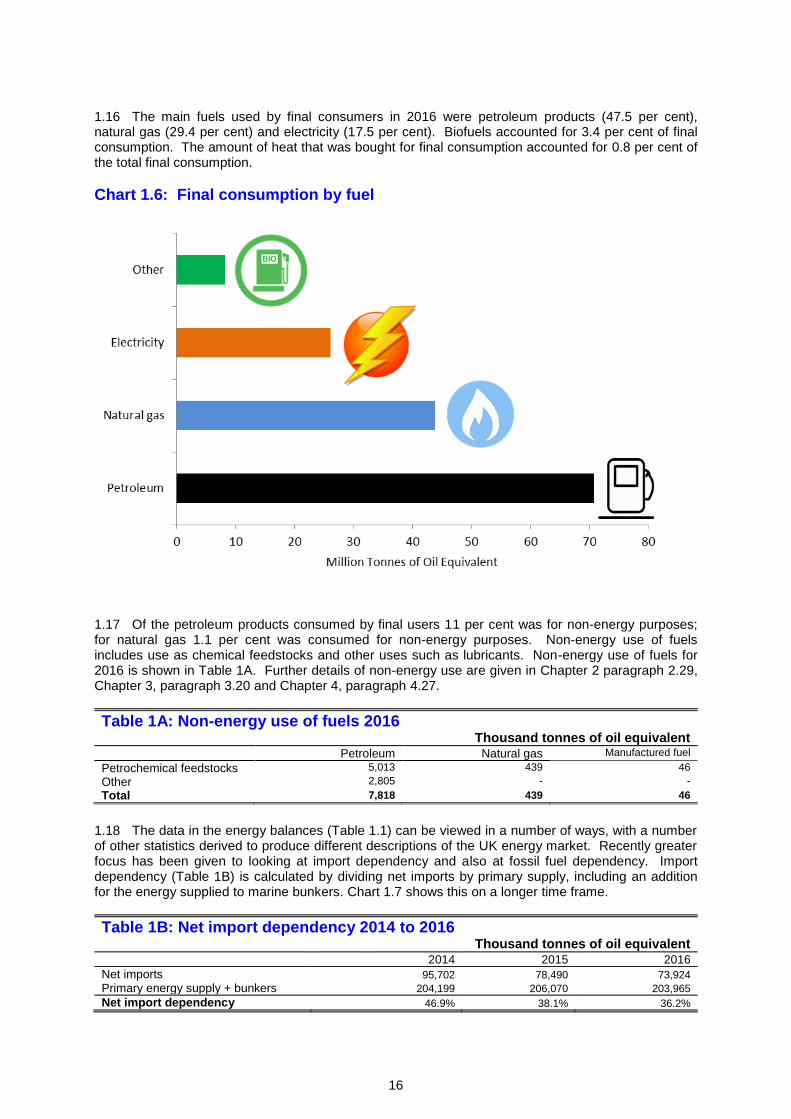
1.11 This switch from coal to gas for generation has resulted in a sharp decrease in carbon dioxide emissions between 2015 and 2016. Provisional BEIS estimates suggest that overall emissions fell by 29.8 million tonnes of carbon dioxide (MtCO2) (7.4 per cent) to 374.1 MtCO2 between 2015 and 2016. More details of carbon dioxide emissions are available in a Statistical Release, published in March, which is available on the BEIS section of the GOV.UK website at: www.gov.uk/government/collections/provisional-uk-greenhouse-gas-emissions-national-statistics. 1.12 Total final consumption, which includes non-energy use of fuels, was 149.0 million tonnes of oil equivalent in 2016. Chart 1.5 shows consumption by category, with transport and domestic use accounting for nearly two thirds of final consumption.
Chart 1.5: Final consumption 2016
1.13 Final consumption (including Non Energy Use) increased by 2.6 million tonnes of oil equivalent, 1.8 per cent up, on the consumption in 2015. The increase comes mainly from the domestic and transport sectors. The domestic rise in consumption was mainly due to the cooler winter weather in 2016 compared to 2015. On a temperature adjusted basis domestic consumption is estimated to have increased by 1.4 per cent in 2016, though is down 13 per cent over the last 10 years. 1.14 Consumption in the transport sector rose by 1.9 per cent; this rise taking consumption to its highest level since 2008 is likely due to increased demand resulting from lower prices as petroleum product prices again fell during the year. More details on these are published in Quarterly Energy Prices
1. Consumption in the service sector increased by 2.7 per cent on increased
heating demand, whilst consumption in the industrial sector fell by 2.6 per cent. There was also a second successive rise in non-energy use; this is discussed in Chapter 3. 1.15 Final energy consumption (where non-energy use is excluded) was up by 1.6 per cent on the year. On a temperature corrected basis final energy consumption was estimated to be up 0.9 per cent in 2016 compared to 2015, but is down by an average of 1.2 per cent per annum over the last 10 years.
1 www.gov.uk/government/collections/quarterly-energy-prices
16
1.16 The main fuels used by final consumers in 2016 were petroleum products (47.5 per cent), natural gas (29.4 per cent) and electricity (17.5 per cent). Biofuels accounted for 3.4 per cent of final consumption. The amount of heat that was bought for final consumption accounted for 0.8 per cent of the total final consumption.
Chart 1.6: Final consumption by fuel
1.17 Of the petroleum products consumed by final users 11 per cent was for non-energy purposes; for natural gas 1.1 per cent was consumed for non-energy purposes. Non-energy use of fuels includes use as chemical feedstocks and other uses such as lubricants. Non-energy use of fuels for 2016 is shown in Table 1A. Further details of non-energy use are given in Chapter 2 paragraph 2.29, Chapter 3, paragraph 3.20 and Chapter 4, paragraph 4.27.
Table 1A: Non-energy use of fuels 2016 Thousand tonnes of oil equivalent
Petroleum Natural gas Manufactured fuel
Petrochemical feedstocks 5,013 439 46
Other 2,805 - -
Total 7,818 439 46
1.18 The data in the energy balances (Table 1.1) can be viewed in a number of ways, with a number of other statistics derived to produce different descriptions of the UK energy market. Recently greater focus has been given to looking at import dependency and also at fossil fuel dependency. Import dependency (Table 1B) is calculated by dividing net imports by primary supply, including an addition for the energy supplied to marine bunkers. Chart 1.7 shows this on a longer time frame.
Table 1B: Net import dependency 2014 to 2016 Thousand tonnes of oil equivalent
2014 2015 2016
Net imports 95,702 78,490 73,924
Primary energy supply + bunkers 204,199 206,070 203,965
Net import dependency 46.9% 38.1% 36.2%
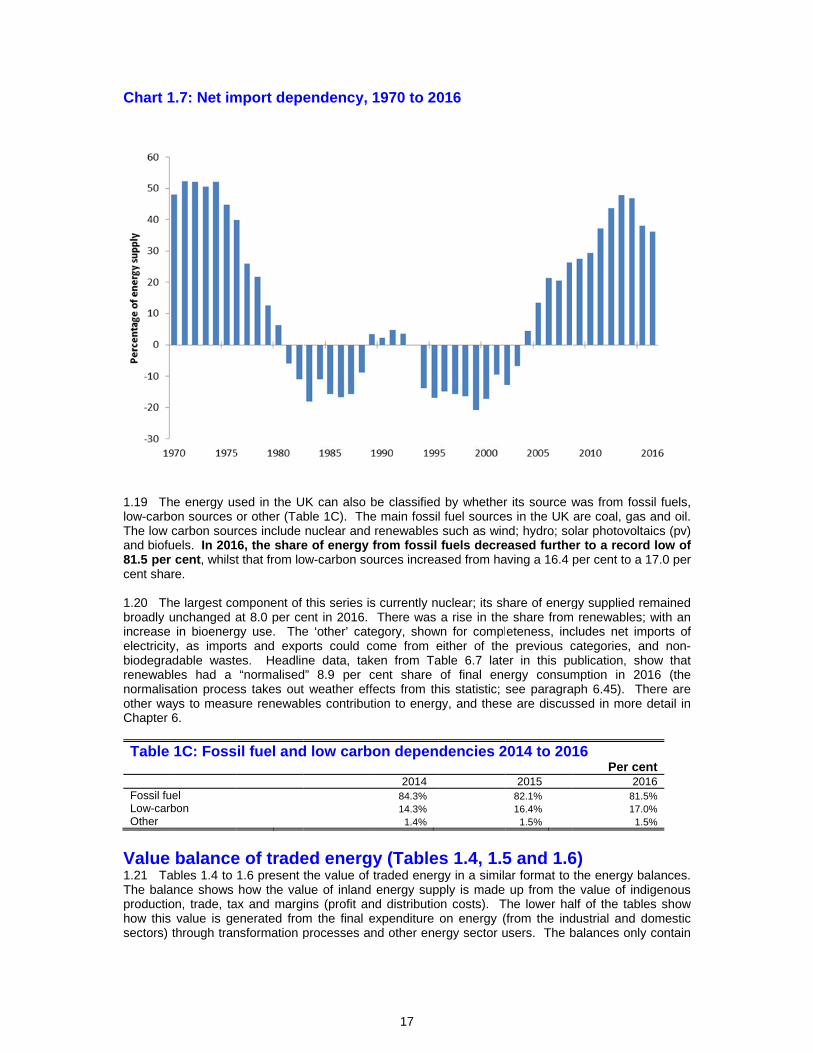
Chart 1
1.19 Thlow-carbThe low and biofu81.5 percent sha 1.20 Thbroadly increaseelectricitbiodegrarenewabnormalisother waChapter
Table
Fossil fuLow-carOther
Value1.21 TaThe balaproductiohow thissectors)
1.7: Net im
he energy usbon sources
carbon souruels. In 201r cent, whilstare.
he largest counchanged a
e in bioenergty, as imporadable wastebles had a sation procesays to measu6.
1C: Foss
uel rbon
e balanceables 1.4 to ance shows on, trade, tas value is ge
through tran
mport depe
sed in the Uor other (Tabrces include 6, the sharet that from lo
omponent of at 8.0 per cegy use. Therts and expoes. Headlin“normalised
ss takes outure renewab
il fuel and
e of trade1.6 present thow the val
ax and margenerated fromnsformation p
endency,
UK can also ble 1C). Thenuclear and
e of energy ow-carbon so
this series isent in 2016.e ‘other’ catorts could cne data, takd” 8.9 per ct weather effbles contribut
d low carb
ed energthe value of ue of inlandins (profit anm the final eprocesses a
17
1970 to 20
be classifiede main fossirenewablesfrom fossil
ources increa
s currently n There was egory, show
come from eken from Tacent share fects from thtion to energ
bon depen
2014 84.3% 14.3%
1.4%
gy (Tabletraded energ energy supnd distributioexpenditure nd other ene
016
d by whetherl fuel source such as winfuels decre
ased from ha
uclear; its sha rise in the
wn for compleither of theable 6.7 lateof final ene
his statistic;gy, and thes
dencies 2
s 1.4, 1.5gy in a simila
pply is made on costs). Ton energy (
ergy sector u
r its source wes in the UK nd; hydro; soeased furtheaving a 16.4
hare of energe share frometeness, inc
e previous cer in this puergy consumsee paragrae are discus
2014 to 201
2015 82.1% 16.4%
1.5%
5 and 1.6ar format to up from the
The lower ha(from the indusers. The b
was from fosare coal, gas
olar photovolter to a recorper cent to a
gy supplied rm renewablescludes net imcategories, aublication, smption in 2aph 6.45). Tssed in more
16 Per ce
2081171
6) the energy b
e value of inalf of the tabdustrial and balances onl
ssil fuels, s and oil. taics (pv) rd low of a 17.0 per
remained s; with an mports of and non-how that 016 (the
There are e detail in
ent016 .5% .0% .5%
balances. digenous
bles show domestic y contain
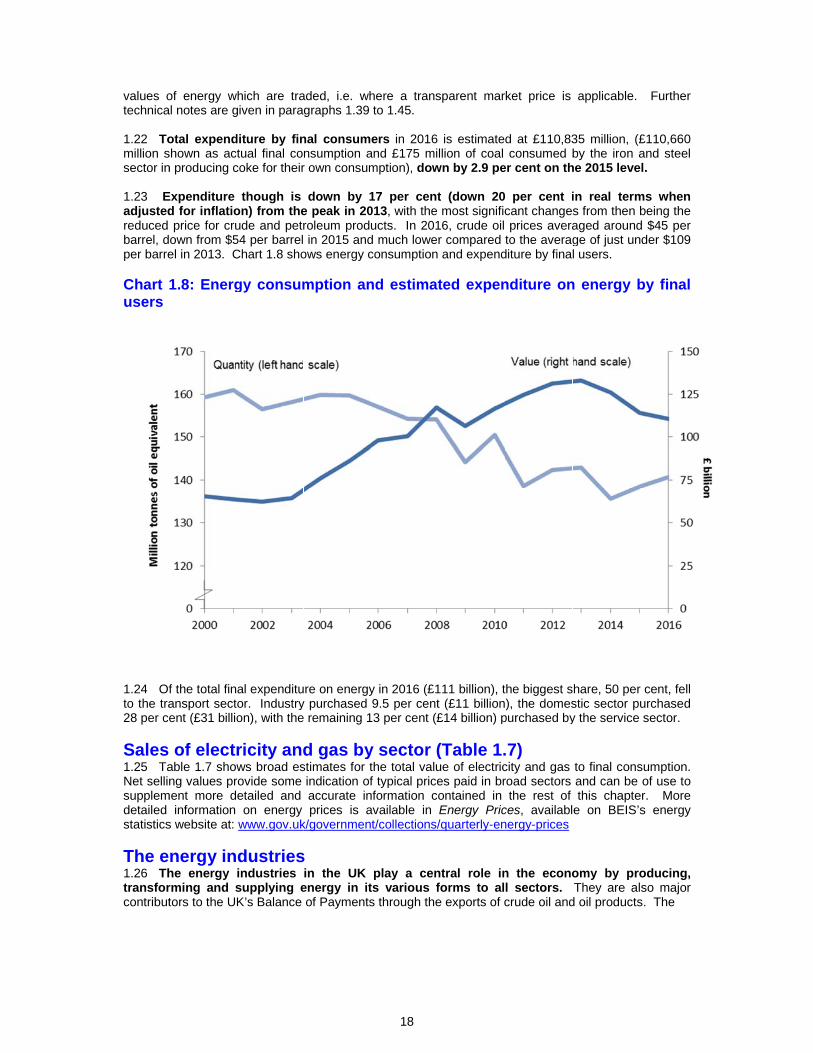
values otechnica 1.22 Tomillion ssector in 1.23 Eadjustedreduced barrel, dper barre Chart users
1.24 Ofto the tra28 per ce
Sales 1.25 TaNet sellisupplemdetailed statistics
The e1.26 Thtransforcontribut
of energy wal notes are g
otal expendshown as acn producing c
Expenditure d for inflatioprice for cru
own from $5el in 2013. C
1.8: Energ
f the total finansport sectent (£31 billi
of electable 1.7 shong values pr
ment more dinformation
s website at:
nergy inhe energy rming and stors to the U
which are tragiven in para
diture by finctual final cocoke for their
though is on) from theude and petr54 per barrelChart 1.8 sho
gy consum
al expenditutor. Industryon), with the
ricity andws broad esrovide some etailed and on energy
www.gov.uk
dustriesindustries supplying eK’s Balance
aded, i.e. whgraphs 1.39
nal consumnsumption ar own consum
down by 1e peak in 20roleum prod in 2015 and
ows energy c
mption an
re on energyy purchased e remaining 1
d gas bystimates for tindication ofaccurate inprices is a
k/governmen
s in the UK energy in itof Payments
18
here a transto 1.45.
ers in 2016and £175 mimption), dow
17 per cent013, with the ucts. In 201d much loweconsumption
nd estimat
y in 2016 (£19.5 per cent3 per cent (£
y sector (the total valuf typical price
nformation coavailable in t/collections/
play a cents various fs through the
sparent mar
is estimatedllion of coal
wn by 2.9 pe
t (down 20most signific
16, crude oil r compared t and expend
ted expen
111 billion), tt (£11 billion£14 billion) p
(Table 1.ue of electrices paid in brontained in Energy Pric/quarterly-en
ntral role informs to ale exports of c
ket price is
d at £110,83consumed b
er cent on th
per cent icant changeprices avera
to the averagditure by fina
nditure on
he biggest s), the domes
purchased by
.7) city and gas road sectors the rest of
ces, availablnergy-prices
n the econol sectors. crude oil and
applicable.
35 million, (£by the iron a
he 2015 leve
in real terms from then aged aroundge of just unl users.
n energy b
hare, 50 perstic sector py the service
to final consand can be this chapte
e on BEIS’s
omy by proThey are al
d oil products
Further
£110,660 and steel
el.
ms when being the d $45 per nder $109
by final
r cent, fell urchased sector.
sumption. of use to
er. More s energy
oducing, so major
s. The

19
box below summarises the energy industries’ contribution to the economy in 2016, based on the latest available data from the Office for National Statistics (ONS):
2.3 per cent of GDP;
10 per cent of total investment;
34 per cent of industrial investment;
178,000 people directly employed (6.3 per cent of industrial employment);
Many others indirectly employed (e.g. an estimated 152,000 in support of UK Continental Shelf activities).
1.27 The share of GDP at 2.3 per cent compares to a peak level of 10.4 per cent in 1982. The share fell to below 4 per cent in most years since 2000, with the latest fall taking energy’s share of the UK economy to its lowest level for over 40 years. The latest fall is largely due to the further decline in the price of oil; which fell by around 17 per cent in 2016
2. In 2016 investment in the energy
industries fell back from the recent high levels with reduced spending for oil and gas extraction. Employment has remained broadly unchanged in the last seven years, but up from 10 years ago.
2 www.bp.com/en/global/corporate/energy-economics/statistical-review-of-world-energy/oil/oil-prices.html
20
Technical notes and definitions
I Units and measurement of energy Units of measurement 1.28 The original units of measurement appropriate to each fuel are used in the individual fuel chapters. A common unit of measurement, the tonne of oil equivalent (toe), which enables different fuels to be compared and aggregated, is used in Chapter 1. In common with the International Energy Agency and with the Statistical Office of the European Communities, the tonne of oil equivalent is defined as follows:
1 tonne of oil equivalent = 107 kilocalories = 396.83 therms = 41.868 Gigajoules (GJ) = 11,630 Kilowatt hours (kWh)
This unit should be regarded as a measure of energy content rather than a physical quantity. One tonne of oil is not equal to one tonne of oil equivalent. Calorific values when producing energy statistics 1.29 In this publication Gross Calorific Values (GCVs) are used to convert fuel from their original units to tonnes of oil equivalent (toe). An alternative is to use Net Calorific Values (NCVs) as detailed in paragraph XVII of the introduction. The fuel specific GCVs and NCVs are shown at Annex A. However, as some EU targets are calculated on data converted using net calorific values, aggregate energy balances for the most recent years have been calculated using NCVs; these are used in Table 6.7, and are available on the internet version, Annex I, of this publication at: www.gov.uk/government/collections/digest-of-uk-energy-statistics-dukes. Thermal content - energy supplied basis of measurement 1.30 Tables 1.1 to 1.3 and 1.1.1 to 1.1.5 (available on the BEIS section of GOV.UK at: www.gov.uk/government/statistics/energy-chapter-1-digest-of-united-kingdom-energy-statistics-dukes are compiled on an energy-supplied basis. Detailed data for individual fuels are converted from original units to tonnes of oil equivalent using gross calorific values and conversion factors appropriate to each category of fuel. The results are then aggregated according to the categories used in the tables. Gross calorific values represent the total energy content of the fuel, including the energy needed to evaporate the water present in the fuel (see also paragraph 1.55). 1.31 Estimated gross and net calorific values for 2016 are given in Table A.1 in Annex A. Calorific values are reviewed each year in collaboration with the fuel industries, and figures for earlier years can be found in Table A.2 and A.3. To construct energy balances on an energy supplied basis calorific values are required for production, trade, and stocks, as follows: Coal The weighted average gross calorific value of all indigenous coal consumed is used to derive the thermal content of coal production and undistributed stocks. Thermal contents of imports and exports allow for the quality of coal. Thermal contents of changes in coal stocks at secondary fuel producers are the average calorific values of indigenous coal consumed. Petroleum Work carried out in 1997 to revise calorific values for petroleum products did not find any recent work on the subject. In the absence of such work, the gross calorific values, included in Annex A and used in the construction of these energy balances from 1990 onwards, have been calculated using a formula derived by the US Bureau of Standards. This formula estimates the gross calorific value of products according to their density as follows:
278.883.51 dGJ , where d is the density of the product in terms of kilograms per litre. For crude petroleum and refinery losses, the weighted average calorific value for all petroleum products from UK refineries is used. A notional figure of 42.9 GJ per tonne is used for non-energy petroleum products (industrial and white spirits, lubricants, bitumen, petroleum coke, waxes and miscellaneous products).
21
Gases Although the original unit for gases is the cubic metre, figures for gases are generally presented in the fuel sections of this Digest in gigawatt hours (GWh), having been converted from cubic metres using gross calorific values provided by the industries concerned. Conversion factors between units of energy are given on the flap inside the back cover and in Annex A. Electricity and heat Unlike other fuels, the original unit used to measure electricity and heat is a measure of energy. The figures for electricity and heat can therefore be converted directly to toe using the conversion factors on the flap inside the back cover and in Annex A. Primary electricity Hydro electricity and net imports of electricity are presented in terms of the energy content of the electricity produced (the energy supplied basis). This is consistent with international practice. Primary inputs for nuclear electricity assume the thermal efficiencies at nuclear stations given in Chapter 5, Table 5.10 (40.0 per cent in 2016). (See Chapter 5, paragraphs 5.71 and 5.79).
Non-energy uses of fuel 1.32 Energy use of fuel mainly comprises use for lighting, heating, motive power and power for appliances. Non-energy use includes use as chemical feedstocks, solvents, lubricants and road making material. It should be noted that the amounts of non-energy use of natural gas included in the Digest are approximate. Further discussion of non-energy uses of lubricating oils and petroleum coke appears in Chapter 3, paragraph 3.20.
Autogeneration of electricity 1.33 Autogeneration is defined as the generation of electricity by companies whose main business is not electricity generation, the electricity being produced mainly for that company’s own use. Estimated amounts of fuel used for thermal generation of electricity by such companies, the output of electricity and the thermal losses incurred in generation are included within the Transformation section in the energy balances shown in Tables 1.1 to 1.3. Electricity used in the power generation process by autogenerators is shown within the Energy Industry Use section. Electricity consumed by industry and commerce from its own generation is included as part of final consumption. This treatment is in line with the practice in international energy statistics.
1.34 Figures on total amount of fuel used and electricity generated by autogenerators, and the amount of electricity for own consumption is shown in Tables 5.1 to 5.6. Table 5.4 summarises the figures by broad industrial groups. Much of the power generated is from combined heat and power (CHP) plants and data from Chapter 7 are included within Table 5.4. Differences will occur where CHP plants are classified to major power producers, and this mainly affects the chemicals sector. The method of allocating fuel used in CHP plants between electricity production and heat production is described in Chapter 7 paragraphs 7.36 to 7.41. This method can give rise to high implied conversion efficiencies in some sectors, most notably in the iron and steel sector.
Final consumption, deliveries, stock changes 1.35 Figures for final consumption relate to deliveries, if fuels can be stored by users and data on actual consumption are not available. Final consumption of petroleum and solid fuels is on a deliveries basis throughout, except for the use of solid fuels by the iron and steel industry. Figures for domestic use of coal are based on deliveries to merchants. Figures for stock changes in Tables 1.1 to 1.3 cover stocks held by primary and secondary fuel producers, major distributors of petroleum products, and stocks of coke and breeze held by the iron and steel industry; for coal they also include an estimate of volumes in transit. Figures for stock changes in natural gas represent the net amount put into storage by gas companies operating pipelines.
1.36 Figures for final consumption of electricity include sales by the public distribution system and consumption of electricity produced by generators other than the major electricity producing companies. Thus electricity consumption includes that produced by industry and figures for deliveries of other fuels to industry exclude amounts used to generate electricity (except for years prior to 1987, shown in tables giving long term trends).
22
Heat sold 1.37 Heat sold is defined as heat that is produced and sold under the provision of a contract. The heat sold figures have been derived from two sources covering CHP plants and community heating schemes without CHP plants. Data for heat sold were supplied by CHP plants to the Combined Heat and Power Quality Assurance Programme and were processed by Ricardo-AEA. Data for heat consumption from community heating schemes were derived from the Building Research Establishment’s (BRE) ‘Nationwide Survey of Community Heating’ that was carried out in 1997, a database of community heating schemes in social housing in 2000, and Community Heating Sales Surveys undertaken between 2003 and 2005. The estimates from these sources have been used to derive heat sold figures since 1999. When information about where the heat was generated was not available from the BRE sources, it was assumed that domestic sector heat consumption was provided by the commercial sector, public sector heat consumption was provided by the public administration and industrial sectors (using proportions derived from CHP statistics) and that industrial sector heat consumption was provided by the industrial sector. The introduction of heat sold into the energy balances has not affected the individual fuel totals, since the energy used to generate the heat has been deducted from the final consumption section of the energy balance and transferred to the transformation section. The figures that are included in the balances should be treated as indicative of the amount of heat sold. Annex J of the Digest, at: www.gov.uk/government/collections/digest-of-uk-energy-statistics-dukes shows the quantity of fuel by consuming sector used to produce heat that is subsequently sold.
II Energy balances (Tables 1.1, 1.2 and 1.3) 1.38 Tables 1.1, 1.2 and 1.3 show the energy flows as the primary fuels are processed (or used) and as the consequent secondary fuels are used. The net inputs to transformation are shown in the transformation rows and hence outputs from transformation processes into which primary fuels are input (such as electricity generation, heat generation or petroleum refining) appear as positive figures under the secondary product’s heading in the tables. Similarly the net inputs are shown as negative figures under the primary fuel headings.
III Value balances (Tables 1.4, 1.5 and 1.6) Valuation of energy purchases 1.39 In common with the rest of the chapter, these tables covering energy expenditure follow a balance format. While a user may derive data on a similar basis as that previously published, the balance tables allow for more varied use and interpretation of traded energy value data. That said, the tables continue to only show values for energy that has to be purchased and therefore do not include estimated values of a sector’s internal consumption, such as coal used in the process of coal extraction.
The value balance 1.40 The tables balances around market value of inland consumption, with the lower half of the tables showing the total value of consumption by end users, sub divided into energy sector users and final users both for energy and non-energy use. The top half of the tables show the supply components that go to make up the final market value of inland consumption, namely upstream cost of production, imports, taxes and the margins and costs of delivering and packaging the fuel for the final consumer. The total final consumers’ value of energy consumption is represented by the lines ‘total non-energy sector use’ and iron and steel sectors’ purchases of coal for use in solid fuel manufacture. All figures are estimates and have been rounded to the nearest £5 million.
1.41 In keeping with the energy balances, the value balances, since 2000, have included data on heat generation and heat sold. Additionally, an estimate of the amount of Climate Change Levy (CCL) and the Carbon Price Support (CPS) paid is included in Tables 1.4, 1.5 and 1.6. The CCL was introduced in April 2001 and is payable by non-domestic final consumers of gas, electricity, coal, coke and LPG, with the Carbon Price Support (CPS), a tax on fossil fuel used to generate electricity, introduced in April 2013.
23
1.42 The value balance demonstrates how the value chain works in the production and consumption of energy. For example, in 2016, £12,790 million of crude oil was indigenously produced, of which £8,375 million was exported; and £11,675 million of crude oil was imported. Allowing for stock changes, this provides a total value of UK inland crude oil supply of £16,060 million. This fuel was then completely consumed within the petroleum industry in the process of producing £21,890 million of petroleum products. Again, some external trade and stock changes took place before arriving at a basic value of petroleum products of £24,340 million. In supplying the fuel to final consumers, distribution costs were incurred and some profit was made amounting to £2,045 million, whilst duty and tax meant a further £33,585 million was added to the basic price to arrive at the final market value of £60,075 million. This was the value of petroleum products purchased, of which industry purchased £1,545 million, domestic consumers for heating purposes purchased £910 million, with the vast majority £52,925 million, purchased by the transport sector.
Fuel definitions in value balances 1.43 Crude oil includes Natural Gas Liquids (NGLs) and refinery feedstocks. Natural gas does not include colliery methane. Electricity only includes electricity delivered via the public distribution system and therefore does not value electricity produced and consumed by autogenerators; however the fuels used by autogenerators are included under Transformation. Manufactured solid fuels include coke, breeze and other solid manufactured fuels, mainly products from patent fuel and carbonisation plants. Other fuels include all other fuels not separately listed, where they can be clearly considered as traded and some reasonable valuation can be made. Fuels mainly contributing to this year’s values are wood, coke oven and colliery methane gases sold on to other industrial users and some use of waste products such as poultry litter.
Energy end use 1.44 Values represent the cost to the final user including transportation of the fuel. They are derived, except where actual values are available, from the traded element of the volumes presented in aggregate energy balance and end user prices collected from information supplied by users or energy suppliers. The energy sector consists of those industries engaged in the production and sale of energy products, but values are not given for consumption of self-generated fuels e.g. coke oven gas used by coke producers. Many of the processes in the iron and steel industry are considered to be part of the energy sector in the energy balances, but for the purposes of this economic balance their genuine purchases are treated as those of final consumers, except for purchases of coal directly used in coke manufacture, which is shown separately as part of manufacture of solid fuel. Coal used directly in or to heat blast furnaces is shown as iron and steel final use. Transformation includes those fuels used directly in producing other fuels e.g. crude oil in petroleum products. Electricity generators keep and use significant stocks of coal, and the stocks used in consumption each year are shown separately. The value and margins for these being assumed to be the same as other coal purchased in the year. Road transport includes all motor spirit and DERV (diesel-engined road vehicle) use. Commercial and other users include public administration and miscellaneous uses not classified to the industrial sector.
Supply 1.45 The supply side money chain is derived using various methods. Indigenous production represents the estimated basic value of in-year sales by the upstream producers. This value is gross of any taxes or cost they must meet. The valuation problems in attributing network losses in gas and electricity between upstream and downstream within this value chain means any costs borne are included in the production value. Imports and exports are valued in accordance with data published by HM Revenue and Customs, contained in Annex G (which can be found on the Internet at: www.gov.uk/government/collections/digest-of-uk-energy-statistics-dukes). However, crude oil is treated differently, where the value is formed from price data taken from a census survey of refiners and volume data taken from Table 3.1. These values are considered to reflect the complete money chain more accurately than Tables G.1 to G.6. Stock changes are those for undistributed stocks except for coal where coke oven and generators’ stocks are included. A stock increase takes money out of the money chain and is therefore represented as a negative. Distribution costs are arrived at by removing an estimate of producers’ value along with any taxes from the end user values shown. For most fuels, the estimate of producer value is derived from the consumption used for end use and the producer price taken from survey of producers. No sector breakdown is given for gas and
24
electricity margins because it is not possible to accurately measure delivery costs for each sector. Taxes include VAT where not refundable and duties paid on downstream sales. Excluded are the gas and fossil fuel levies, petroleum revenue tax and production royalties and licence fees. The proceeds from the fossil fuel levy are redistributed across the electricity industry, whilst the rest are treated as part of the production costs.
Sales of electricity and gas by sector (Table 1.7) 1.46 This table provides data on the total value of gas and electricity sold to final consumers. The data are collected from the energy supply companies. The data are useful in indicating relative total expenditure between sectors, but the quality of data provided in terms of industrial classification has been worsening in recent years. Net selling values provide an indication of typical prices paid in broad sectors.
IV Measurement of energy consumption Primary fuel input basis 1.47 Energy consumption is usually measured in one of three different ways. The first, known as the primary fuel input basis, assesses the total input of primary fuels and their equivalents. This measure includes energy used or lost in the conversion of primary fuels to secondary fuels (for example in power stations and oil refineries), energy lost in the distribution of fuels (for example in transmission lines) and energy conversion losses by final users. Primary demands as in Table 1.1, 1.2 and 1.3 are on this basis.
Final consumption - energy supplied basis 1.48 The second method, known as the energy supplied basis, measures the energy content of the fuels, both primary and secondary, supplied to final users. Thus it is net of fuel industry own use and conversion, transmission and distribution losses, but it includes conversion losses by final users. Table 1D presents shares of final consumption on this basis. The final consumption figures are presented on this basis throughout Chapter 1. 1.49 Although this is the usual and most direct way to measure final energy consumption, it is also possible to present final consumption on a primary fuel input basis. This can be done by allocating the conversion losses, distribution losses and energy industry use to final users. This approach can be used to compare the total primary fuel use which each sector of the economy accounts for. Table 1E presents shares of final consumption on this basis.
Final consumption - useful energy basis 1.50 Thirdly, final consumption may be expressed in the form of useful energy available after deduction of the losses incurred when final users convert energy supplied into space or process heat, motive power or light. Such losses depend on the type and quality of fuel and the equipment used and on the purpose, conditions, duration and intensity of use. Statistics on useful energy are not sufficiently reliable to be given in this Digest; there is a lack of data on utilisation efficiencies and on the purposes for which fuels are used.
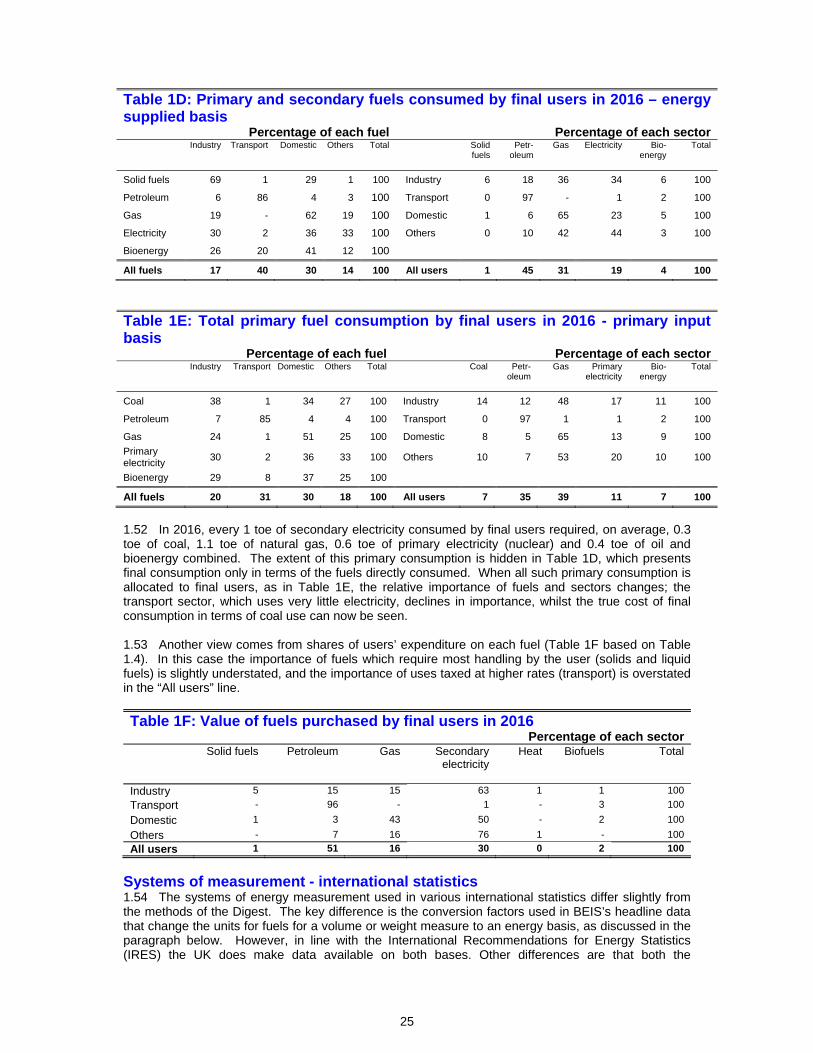
Shares of each fuel in energy supply and demand 1.51 The relative importance of the energy consumption of each sector of the economy depends on the method used to measure consumption. Shares of final consumption on an energy supplied basis (that is in terms of the primary and secondary fuels directly consumed) in 2016 are presented in Table 1D. For comparison, Table 1E presents shares of final consumption on a primary fuel input basis.
25
Table 1D: Primary and secondary fuels consumed by final users in 2016 – energy supplied basis
Percentage of each fuel Percentage of each sector Industry Transport Domestic Others Total Solid
fuels Petr-
oleum
Gas Electricity Bio-energy
Total
Solid fuels 69 1 29 1 100 Industry 6 18 36 34 6 100
Petroleum 6 86 4 3 100 Transport 0 97 - 1 2 100
Gas 19 - 62 19 100 Domestic 1 6 65 23 5 100
Electricity 30 2 36 33 100 Others 0 10 42 44 3 100
Bioenergy 26 20 41 12 100
All fuels 17 40 30 14 100 All users 1 45 31 19 4 100
Table 1E: Total primary fuel consumption by final users in 2016 - primary input basis
Percentage of each fuel Percentage of each sector Industry Transport Domestic Others Total Coal Petr-
oleum
Gas Primary electricity
Bio-energy
Total
Coal 38 1 34 27 100 Industry 14 12 48 17 11 100
Petroleum 7 85 4 4 100 Transport 0 97 1 1 2 100
Gas 24 1 51 25 100 Domestic 8 5 65 13 9 100
Primary electricity
30 2 36 33 100 Others 10 7 53 20 10 100
Bioenergy 29 8 37 25 100
All fuels 20 31 30 18 100 All users 7 35 39 11 7 100
1.52 In 2016, every 1 toe of secondary electricity consumed by final users required, on average, 0.3 toe of coal, 1.1 toe of natural gas, 0.6 toe of primary electricity (nuclear) and 0.4 toe of oil and bioenergy combined. The extent of this primary consumption is hidden in Table 1D, which presents final consumption only in terms of the fuels directly consumed. When all such primary consumption is allocated to final users, as in Table 1E, the relative importance of fuels and sectors changes; the transport sector, which uses very little electricity, declines in importance, whilst the true cost of final consumption in terms of coal use can now be seen. 1.53 Another view comes from shares of users’ expenditure on each fuel (Table 1F based on Table 1.4). In this case the importance of fuels which require most handling by the user (solids and liquid fuels) is slightly understated, and the importance of uses taxed at higher rates (transport) is overstated in the “All users” line.
Table 1F: Value of fuels purchased by final users in 2016 Percentage of each sector
Solid fuels Petroleum Gas Secondary electricity
Heat
Biofuels Total
Industry 5 15 15 63 1 1 100
Transport - 96 - 1 - 3 100
Domestic 1 3 43 50 - 2 100
Others - 7 16 76 1 - 100
All users 1 51 16 30 0 2 100
Systems of measurement - international statistics 1.54 The systems of energy measurement used in various international statistics differ slightly from the methods of the Digest. The key difference is the conversion factors used in BEIS’s headline data that change the units for fuels for a volume or weight measure to an energy basis, as discussed in the paragraph below. However, in line with the International Recommendations for Energy Statistics (IRES) the UK does make data available on both bases. Other differences are that both the
26
International Energy Agency (IEA) as well as the United Nations’ IRES have International Aviation Bunkers as well as International Marine Bunkers shown together and not included in the country’s energy supply. The UK in its energy balances continues to show fuel used for international marine bunkers in this manner but has maintained its practice of showing fuel for international aviation as part of final consumption - this practice is also followed by Eurostat.
Net calorific values 1.55 Calorific values (thermal contents) used internationally are net rather than gross. The difference between the net and gross thermal content is the amount of energy necessary to evaporate the water present in the fuel or formed during the combustion process. The differences between gross and net values are generally taken to be 5 per cent for liquid and solid fuels (except for coke and coke breeze where there is no difference), 10 per cent for gases (except for blast furnace gas, 1 per cent), 15 per cent for straw, and 16 per cent for poultry litter. The calorific value of wood is highly dependent on its moisture content. In Annex A, the gross calorific value is given as 16.3 GJ at 20 per cent moisture content and 20.3 GJ for dry wood. Both gross and net calorific values are shown in Annex A. Energy balances on a net calorific basis are published in an annex to DUKES available via the internet.
V Definitions of fuels 1.56 The following paragraphs explain what is covered under the terms “primary” and “secondary” fuels.
Primary fuels Coal - Production comprises all grades of coal, including slurry. Primary oils - This includes crude oil, natural gas liquids (NGLs) and feedstock. Natural gas liquids - Natural gas liquids (NGLs) consist of condensates (C5 or heavier) and
petroleum gases other than methane C1, that is ethane C2, propane C3 and butane C4, obtained from
the onshore processing of associated and non-associated gas. These are treated as primary fuels when looking at primary supply but in the consumption data presented in this chapter these fuels are treated as secondary fuels, being transferred from the primary oils column in Tables 1.1, 1.2 and 1.3. Natural gas - Production relates to associated or non-associated methane C1 from land and the
United Kingdom sector of the Continental Shelf. It includes that used for drilling production and pumping operations, but excludes gas flared or re-injected. It also includes colliery methane piped to the surface and consumed by collieries or others. Nuclear electricity - Electricity generated by nuclear power stations belonging to the major power producers. See Chapter 5, paragraphs 5.62 to 5.69. Natural flow hydro-electricity - Electricity generated by natural flow hydroelectric power stations, whether they belong to major power producers or other generators. Pumped storage stations are not included (see under secondary electricity below). Renewable energy sources - In this chapter figures are presented for renewables and waste in total. Further details, including a detailed breakdown of the commodities and technologies covered are in Chapter 6.
Secondary fuels Manufactured fuel - This heading includes manufactured solid fuels such as coke and breeze, other manufactured solid fuels, liquids such as benzole and tars and gases such as coke oven gas and blast furnace gas. Further details are given in Chapter 2, Tables 2.5 and 2.6. Coke and breeze – Coke, oven coke and hard coke breeze. Further details are given in Chapter 2, Table 2.5. Other manufactured solid fuels – Manufactured solid fuels produced at low temperature carbonisation plants and other manufactured fuel and briquetting plants. Further details are given in Chapter 2, Table 2.5. Coke oven gas - Gas produced at coke ovens, excluding low temperature carbonisation plants. Gas bled or burnt to waste is included in production and losses. Further details are given in Chapter 2, Table 2.6. Blast furnace gas - Blast furnace gas is mainly produced and consumed within the iron and steel industry. Further details are given in Chapter 2, Table 2.6. Petroleum products - Petroleum products produced mainly at refineries, together with inland deliveries of natural gas liquids.
27
Secondary electricity - Secondary electricity is that generated by the combustion of another fuel, usually coal, natural gas, biofuels or oil. The figure for outputs from transformation in the electricity column of Tables 1.1, 1.2 and 1.3 is the total of primary and secondary electricity, and the subsequent analysis of consumption is based on this total. Heat sold – Heat sold is heat that is produced and sold under the provision of a contract.
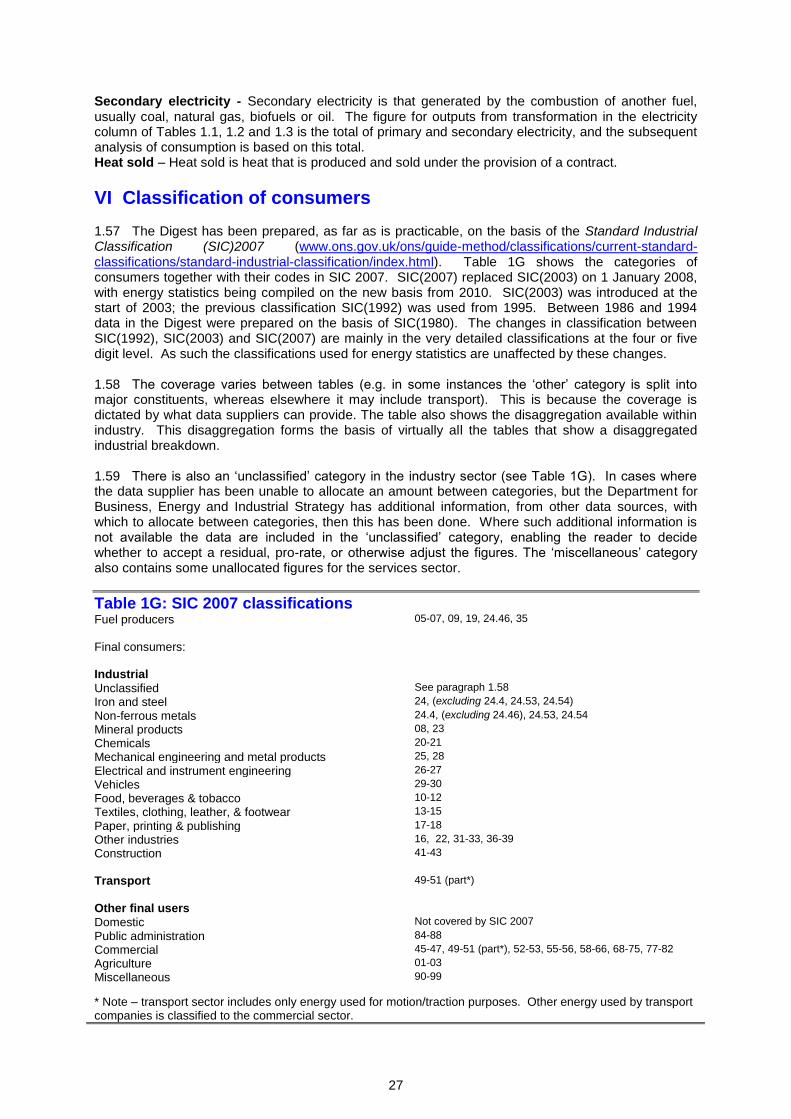
VI Classification of consumers 1.57 The Digest has been prepared, as far as is practicable, on the basis of the Standard Industrial Classification (SIC)2007 (www.ons.gov.uk/ons/guide-method/classifications/current-standard-classifications/standard-industrial-classification/index.html). Table 1G shows the categories of consumers together with their codes in SIC 2007. SIC(2007) replaced SIC(2003) on 1 January 2008, with energy statistics being compiled on the new basis from 2010. SIC(2003) was introduced at the start of 2003; the previous classification SIC(1992) was used from 1995. Between 1986 and 1994 data in the Digest were prepared on the basis of SIC(1980). The changes in classification between SIC(1992), SIC(2003) and SIC(2007) are mainly in the very detailed classifications at the four or five digit level. As such the classifications used for energy statistics are unaffected by these changes. 1.58 The coverage varies between tables (e.g. in some instances the ‘other’ category is split into major constituents, whereas elsewhere it may include transport). This is because the coverage is dictated by what data suppliers can provide. The table also shows the disaggregation available within industry. This disaggregation forms the basis of virtually all the tables that show a disaggregated industrial breakdown. 1.59 There is also an ‘unclassified’ category in the industry sector (see Table 1G). In cases where the data supplier has been unable to allocate an amount between categories, but the Department for Business, Energy and Industrial Strategy has additional information, from other data sources, with which to allocate between categories, then this has been done. Where such additional information is not available the data are included in the ‘unclassified’ category, enabling the reader to decide whether to accept a residual, pro-rate, or otherwise adjust the figures. The ‘miscellaneous’ category also contains some unallocated figures for the services sector.
Table 1G: SIC 2007 classifications Fuel producers 05-07, 09, 19, 24.46, 35
Final consumers: Industrial
Unclassified See paragraph 1.58
Iron and steel 24, (excluding 24.4, 24.53, 24.54)
Non-ferrous metals 24.4, (excluding 24.46), 24.53, 24.54
Mineral products 08, 23
Chemicals 20-21
Mechanical engineering and metal products 25, 28
Electrical and instrument engineering 26-27
Vehicles 29-30
Food, beverages & tobacco 10-12
Textiles, clothing, leather, & footwear 13-15
Paper, printing & publishing 17-18
Other industries 16, 22, 31-33, 36-39
Construction 41-43
Transport 49-51 (part*)
Other final users
Domestic Not covered by SIC 2007
Public administration 84-88
Commercial 45-47, 49-51 (part*), 52-53, 55-56, 58-66, 68-75, 77-82
Agriculture 01-03
Miscellaneous 90-99
* Note – transport sector includes only energy used for motion/traction purposes. Other energy used by transport companies is classified to the commercial sector.
28
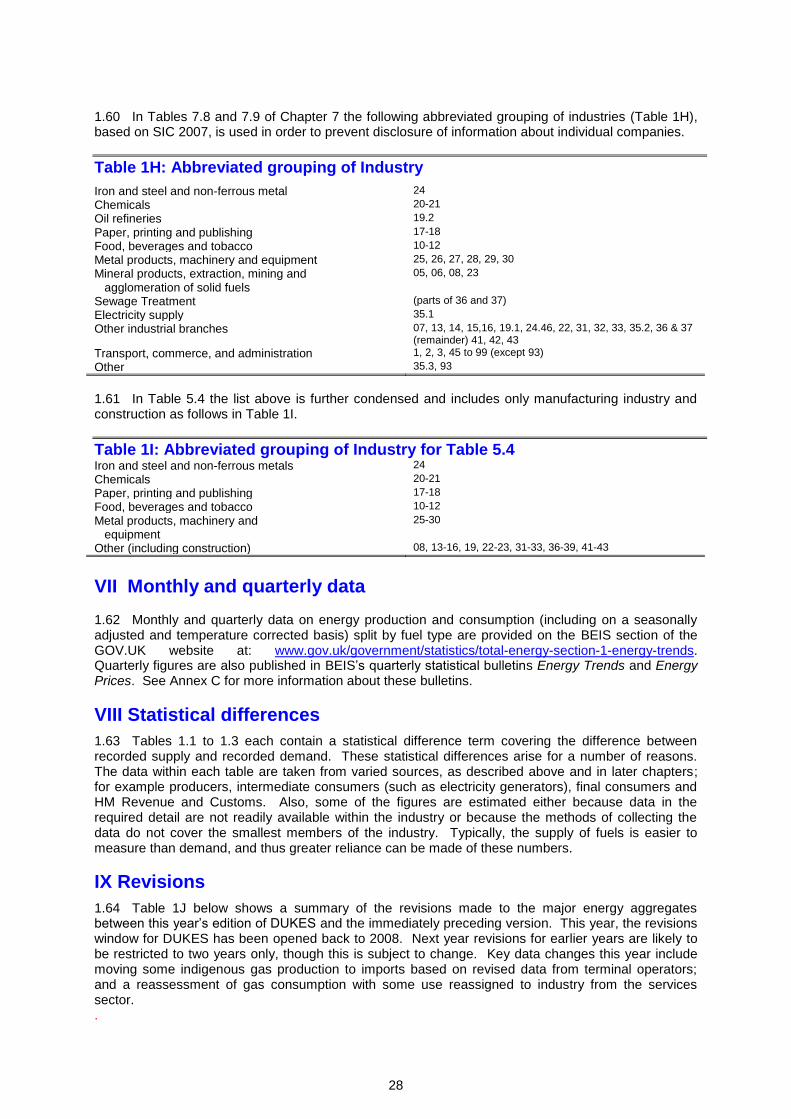
1.60 In Tables 7.8 and 7.9 of Chapter 7 the following abbreviated grouping of industries (Table 1H), based on SIC 2007, is used in order to prevent disclosure of information about individual companies.
Table 1H: Abbreviated grouping of Industry
Iron and steel and non-ferrous metal 24
Chemicals 20-21
Oil refineries 19.2
Paper, printing and publishing 17-18
Food, beverages and tobacco 10-12
Metal products, machinery and equipment 25, 26, 27, 28, 29, 30
Mineral products, extraction, mining and 05, 06, 08, 23
agglomeration of solid fuels
Sewage Treatment (parts of 36 and 37)
Electricity supply 35.1
Other industrial branches 07, 13, 14, 15,16, 19.1, 24.46, 22, 31, 32, 33, 35.2, 36 & 37 (remainder) 41, 42, 43
Transport, commerce, and administration 1, 2, 3, 45 to 99 (except 93)
Other 35.3, 93
1.61 In Table 5.4 the list above is further condensed and includes only manufacturing industry and construction as follows in Table 1I.
Table 1I: Abbreviated grouping of Industry for Table 5.4 Iron and steel and non-ferrous metals 24
Chemicals 20-21
Paper, printing and publishing 17-18
Food, beverages and tobacco 10-12
Metal products, machinery and 25-30
equipment
Other (including construction) 08, 13-16, 19, 22-23, 31-33, 36-39, 41-43
VII Monthly and quarterly data 1.62 Monthly and quarterly data on energy production and consumption (including on a seasonally adjusted and temperature corrected basis) split by fuel type are provided on the BEIS section of the GOV.UK website at: www.gov.uk/government/statistics/total-energy-section-1-energy-trends. Quarterly figures are also published in BEIS’s quarterly statistical bulletins Energy Trends and Energy Prices. See Annex C for more information about these bulletins.
VIII Statistical differences
1.63 Tables 1.1 to 1.3 each contain a statistical difference term covering the difference between recorded supply and recorded demand. These statistical differences arise for a number of reasons. The data within each table are taken from varied sources, as described above and in later chapters; for example producers, intermediate consumers (such as electricity generators), final consumers and HM Revenue and Customs. Also, some of the figures are estimated either because data in the required detail are not readily available within the industry or because the methods of collecting the data do not cover the smallest members of the industry. Typically, the supply of fuels is easier to measure than demand, and thus greater reliance can be made of these numbers.
IX Revisions
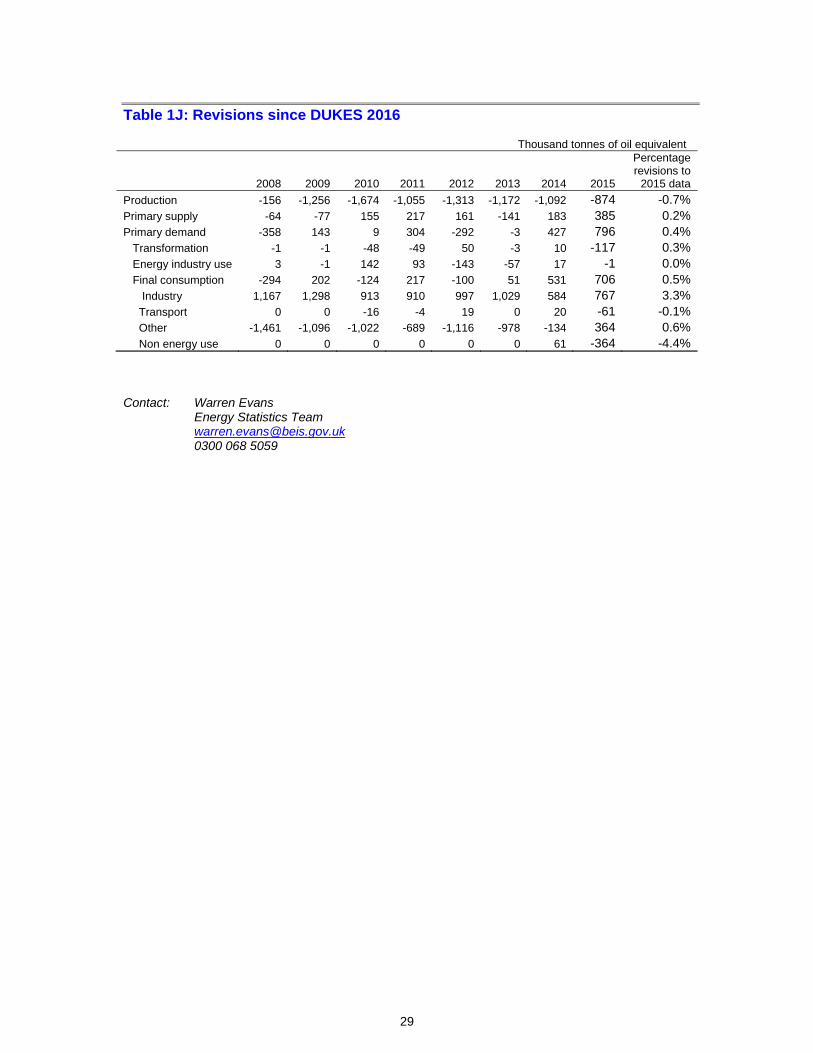
1.64 Table 1J below shows a summary of the revisions made to the major energy aggregates between this year’s edition of DUKES and the immediately preceding version. This year, the revisions window for DUKES has been opened back to 2008. Next year revisions for earlier years are likely to be restricted to two years only, though this is subject to change. Key data changes this year include moving some indigenous gas production to imports based on revised data from terminal operators; and a reassessment of gas consumption with some use reassigned to industry from the services sector. .
29
Table 1J: Revisions since DUKES 2016
Thousand tonnes of oil equivalent
2008 2009 2010 2011 2012 2013 2014 2015
Percentage revisions to
2015 data
Production -156 -1,256 -1,674 -1,055 -1,313 -1,172 -1,092 -874 -0.7%
Primary supply -64 -77 155 217 161 -141 183 385 0.2%
Primary demand -358 143 9 304 -292 -3 427 796 0.4%
Transformation -1 -1 -48 -49 50 -3 10 -117 0.3%
Energy industry use 3 -1 142 93 -143 -57 17 -1 0.0%
Final consumption -294 202 -124 217 -100 51 531 706 0.5%
Industry 1,167 1,298 913 910 997 1,029 584 767 3.3%
Transport 0 0 -16 -4 19 0 20 -61 -0.1%
Other -1,461 -1,096 -1,022 -689 -1,116 -978 -134 364 0.6%
Non energy use 0 0 0 0 0 0 61 -364 -4.4%
Contact: Warren Evans Energy Statistics Team
[email protected] 0300 068 5059
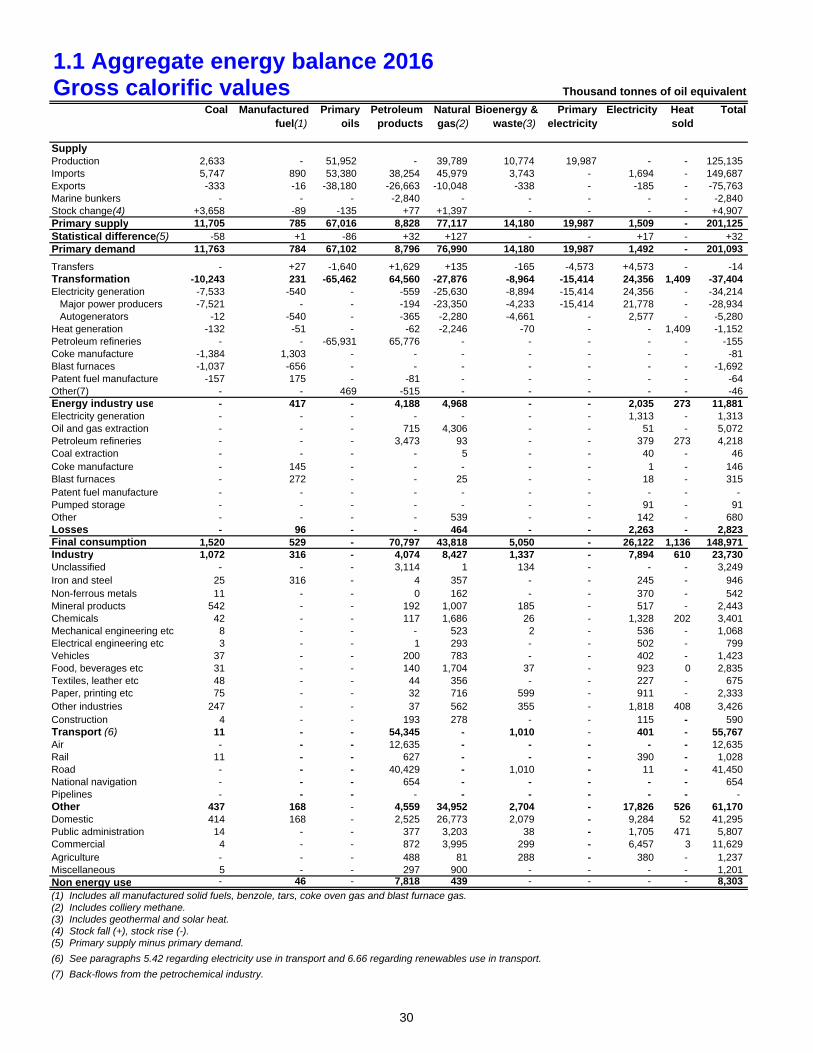
1.1 Aggregate energy balance 2016Gross calorific values Thousand tonnes of oil equivalent
Coal Manufactured fuel(1)
Primary oils
Petroleum products
Natural gas(2)
Bioenergy & waste(3)
Primary electricity
Electricity Heat sold
Total
Supply Production 2,633 - 51,952 - 39,789 10,774 19,987 - - 125,135 Imports 5,747 890 53,380 38,254 45,979 3,743 - 1,694 - 149,687 Exports -333 -16 -38,180 -26,663 -10,048 -338 - -185 - -75,763 Marine bunkers - - - -2,840 - - - - - -2,840 Stock change(4) +3,658 -89 -135 +77 +1,397 - - - - +4,907 Primary supply 11,705 785 67,016 8,828 77,117 14,180 19,987 1,509 - 201,125 Statistical difference(5) -58 +1 -86 +32 +127 - - +17 - +32 Primary demand 11,763 784 67,102 8,796 76,990 14,180 19,987 1,492 - 201,093 Transfers - +27 -1,640 +1,629 +135 -165 -4,573 +4,573 - -14 Transformation -10,243 231 -65,462 64,560 -27,876 -8,964 -15,414 24,356 1,409 -37,404 Electricity generation -7,533 -540 - -559 -25,630 -8,894 -15,414 24,356 - -34,214 Major power producers -7,521 - - -194 -23,350 -4,233 -15,414 21,778 - -28,934 Autogenerators -12 -540 - -365 -2,280 -4,661 - 2,577 - -5,280 Heat generation -132 -51 - -62 -2,246 -70 - - 1,409 -1,152 Petroleum refineries - - -65,931 65,776 - - - - - -155 Coke manufacture -1,384 1,303 - - - - - - - -81 Blast furnaces -1,037 -656 - - - - - - - -1,692 Patent fuel manufacture -157 175 - -81 - - - - - -64 Other(7) - - 469 -515 - - - - - -46 Energy industry use - 417 - 4,188 4,968 - - 2,035 273 11,881 Electricity generation - - - - - - - 1,313 - 1,313 Oil and gas extraction - - - 715 4,306 - - 51 - 5,072 Petroleum refineries - - - 3,473 93 - - 379 273 4,218 Coal extraction - - - - 5 - - 40 - 46 Coke manufacture - 145 - - - - - 1 - 146 Blast furnaces - 272 - - 25 - - 18 - 315 Patent fuel manufacture - - - - - - - - - - Pumped storage - - - - - - - 91 - 91 Other - - - - 539 - - 142 - 680 Losses - 96 - - 464 - - 2,263 - 2,823 Final consumption 1,520 529 - 70,797 43,818 5,050 - 26,122 1,136 148,971 Industry 1,072 316 - 4,074 8,427 1,337 - 7,894 610 23,730 Unclassified - - - 3,114 1 134 - - - 3,249 Iron and steel 25 316 - 4 357 - - 245 - 946 Non-ferrous metals 11 - - 0 162 - - 370 - 542 Mineral products 542 - - 192 1,007 185 - 517 - 2,443 Chemicals 42 - - 117 1,686 26 - 1,328 202 3,401 Mechanical engineering etc 8 - - - 523 2 - 536 - 1,068 Electrical engineering etc 3 - - 1 293 - - 502 - 799 Vehicles 37 - - 200 783 - - 402 - 1,423 Food, beverages etc 31 - - 140 1,704 37 - 923 0 2,835 Textiles, leather etc 48 - - 44 356 - - 227 - 675 Paper, printing etc 75 - - 32 716 599 - 911 - 2,333 Other industries 247 - - 37 562 355 - 1,818 408 3,426 Construction 4 - - 193 278 - - 115 - 590 Transport (6) 11 - - 54,345 - 1,010 - 401 - 55,767 Air - - - 12,635 - - - - - 12,635 Rail 11 - - 627 - - - 390 - 1,028 Road - - - 40,429 - 1,010 - 11 - 41,450 National navigation - - - 654 - - - - - 654 Pipelines - - - - - - - - - - Other 437 168 - 4,559 34,952 2,704 - 17,826 526 61,170 Domestic 414 168 - 2,525 26,773 2,079 - 9,284 52 41,295 Public administration 14 - - 377 3,203 38 - 1,705 471 5,807 Commercial 4 - - 872 3,995 299 - 6,457 3 11,629 Agriculture - - - 488 81 288 - 380 - 1,237 Miscellaneous 5 - - 297 900 - - - - 1,201 Non energy use - 46 - 7,818 439 - - - - 8,303
(1) Includes all manufactured solid fuels, benzole, tars, coke oven gas and blast furnace gas.(2) Includes colliery methane.(3) Includes geothermal and solar heat.(4) Stock fall (+), stock rise (-).(5) Primary supply minus primary demand.
(6) See paragraphs 5.42 regarding electricity use in transport and 6.66 regarding renewables use in transport.
(7) Back-flows from the petrochemical industry.
30
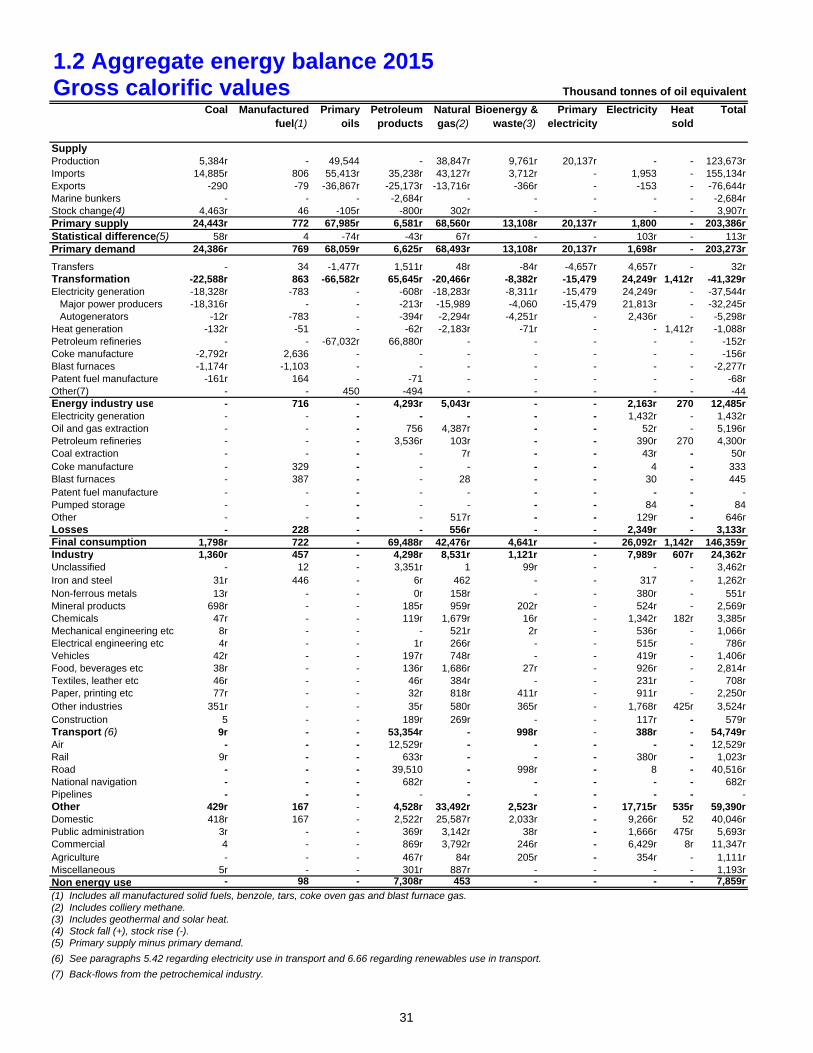
1.2 Aggregate energy balance 2015Gross calorific values Thousand tonnes of oil equivalent
Coal Manufactured fuel(1)
Primary oils
Petroleum products
Natural gas(2)
Bioenergy & waste(3)
Primary electricity
Electricity Heat sold
Total
Supply Production 5,384r - 49,544 - 38,847r 9,761r 20,137r - - 123,673rImports 14,885r 806 55,413r 35,238r 43,127r 3,712r - 1,953 - 155,134rExports -290 -79 -36,867r -25,173r -13,716r -366r - -153 - -76,644rMarine bunkers - - - -2,684r - - - - - -2,684rStock change(4) 4,463r 46 -105r -800r 302r - - - - 3,907rPrimary supply 24,443r 772 67,985r 6,581r 68,560r 13,108r 20,137r 1,800 - 203,386rStatistical difference(5) 58r 4 -74r -43r 67r - - 103r - 113rPrimary demand 24,386r 769 68,059r 6,625r 68,493r 13,108r 20,137r 1,698r - 203,273r
Transfers - 34 -1,477r 1,511r 48r -84r -4,657r 4,657r - 32rTransformation -22,588r 863 -66,582r 65,645r -20,466r -8,382r -15,479 24,249r 1,412r -41,329rElectricity generation -18,328r -783 - -608r -18,283r -8,311r -15,479 24,249r - -37,544r Major power producers -18,316r - - -213r -15,989 -4,060 -15,479 21,813r - -32,245r Autogenerators -12r -783 - -394r -2,294r -4,251r - 2,436r - -5,298rHeat generation -132r -51 - -62r -2,183r -71r - - 1,412r -1,088rPetroleum refineries - - -67,032r 66,880r - - - - - -152rCoke manufacture -2,792r 2,636 - - - - - - - -156rBlast furnaces -1,174r -1,103 - - - - - - - -2,277rPatent fuel manufacture -161r 164 - -71 - - - - - -68rOther(7) - - 450 -494 - - - - - -44Energy industry use - 716 - 4,293r 5,043r - - 2,163r 270 12,485rElectricity generation - - - - - - - 1,432r - 1,432rOil and gas extraction - - - 756 4,387r - - 52r - 5,196rPetroleum refineries - - - 3,536r 103r - - 390r 270 4,300rCoal extraction - - - - 7r - - 43r - 50rCoke manufacture - 329 - - - - - 4 - 333Blast furnaces - 387 - - 28 - - 30 - 445Patent fuel manufacture - - - - - - - - - -Pumped storage - - - - - - - 84 - 84Other - - - - 517r - - 129r - 646rLosses - 228 - - 556r - - 2,349r - 3,133rFinal consumption 1,798r 722 - 69,488r 42,476r 4,641r - 26,092r 1,142r 146,359rIndustry 1,360r 457 - 4,298r 8,531r 1,121r - 7,989r 607r 24,362rUnclassified - 12 - 3,351r 1 99r - - - 3,462rIron and steel 31r 446 - 6r 462 - - 317 - 1,262rNon-ferrous metals 13r - - 0r 158r - - 380r - 551rMineral products 698r - - 185r 959r 202r - 524r - 2,569rChemicals 47r - - 119r 1,679r 16r - 1,342r 182r 3,385rMechanical engineering etc 8r - - - 521r 2r - 536r - 1,066rElectrical engineering etc 4r - - 1r 266r - - 515r - 786rVehicles 42r - - 197r 748r - - 419r - 1,406rFood, beverages etc 38r - - 136r 1,686r 27r - 926r - 2,814rTextiles, leather etc 46r - - 46r 384r - - 231r - 708rPaper, printing etc 77r - - 32r 818r 411r - 911r - 2,250rOther industries 351r - - 35r 580r 365r - 1,768r 425r 3,524rConstruction 5 - - 189r 269r - - 117r - 579rTransport (6) 9r - - 53,354r - 998r - 388r - 54,749rAir - - - 12,529r - - - - - 12,529rRail 9r - - 633r - - - 380r - 1,023rRoad - - - 39,510 - 998r - 8 - 40,516rNational navigation - - - 682r - - - - - 682rPipelines - - - - - - - - - -Other 429r 167 - 4,528r 33,492r 2,523r - 17,715r 535r 59,390rDomestic 418r 167 - 2,522r 25,587r 2,033r - 9,266r 52 40,046rPublic administration 3r - - 369r 3,142r 38r - 1,666r 475r 5,693rCommercial 4 - - 869r 3,792r 246r - 6,429r 8r 11,347rAgriculture - - - 467r 84r 205r - 354r - 1,111rMiscellaneous 5r - - 301r 887r - - - - 1,193rNon energy use - 98 - 7,308r 453 - - - - 7,859r
(1) Includes all manufactured solid fuels, benzole, tars, coke oven gas and blast furnace gas.(2) Includes colliery methane.(3) Includes geothermal and solar heat.(4) Stock fall (+), stock rise (-).(5) Primary supply minus primary demand.
(6) See paragraphs 5.42 regarding electricity use in transport and 6.66 regarding renewables use in transport.
(7) Back-flows from the petrochemical industry.
31
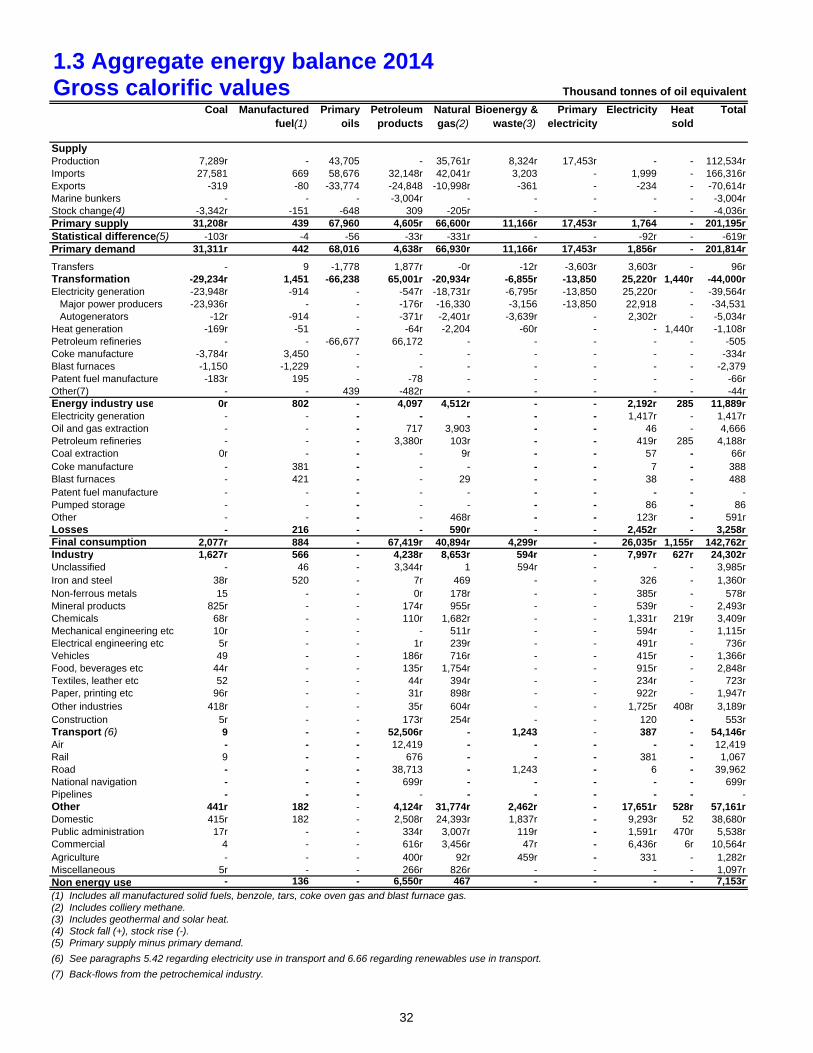
1.3 Aggregate energy balance 2014Gross calorific values Thousand tonnes of oil equivalent
Coal Manufactured fuel(1)
Primary oils
Petroleum products
Natural gas(2)
Bioenergy & waste(3)
Primary electricity
Electricity Heat sold
Total
Supply Production 7,289r - 43,705 - 35,761r 8,324r 17,453r - - 112,534rImports 27,581 669 58,676 32,148r 42,041r 3,203 - 1,999 - 166,316rExports -319 -80 -33,774 -24,848 -10,998r -361 - -234 - -70,614rMarine bunkers - - - -3,004r - - - - - -3,004rStock change(4) -3,342r -151 -648 309 -205r - - - - -4,036rPrimary supply 31,208r 439 67,960 4,605r 66,600r 11,166r 17,453r 1,764 - 201,195rStatistical difference(5) -103r -4 -56 -33r -331r - - -92r - -619rPrimary demand 31,311r 442 68,016 4,638r 66,930r 11,166r 17,453r 1,856r - 201,814r
Transfers - 9 -1,778 1,877r -0r -12r -3,603r 3,603r - 96rTransformation -29,234r 1,451 -66,238 65,001r -20,934r -6,855r -13,850 25,220r 1,440r -44,000rElectricity generation -23,948r -914 - -547r -18,731r -6,795r -13,850 25,220r - -39,564r Major power producers -23,936r - - -176r -16,330 -3,156 -13,850 22,918 - -34,531 Autogenerators -12r -914 - -371r -2,401r -3,639r - 2,302r - -5,034rHeat generation -169r -51 - -64r -2,204 -60r - - 1,440r -1,108rPetroleum refineries - - -66,677 66,172 - - - - - -505Coke manufacture -3,784r 3,450 - - - - - - - -334rBlast furnaces -1,150 -1,229 - - - - - - - -2,379Patent fuel manufacture -183r 195 - -78 - - - - - -66rOther(7) - - 439 -482r - - - - - -44rEnergy industry use 0r 802 - 4,097 4,512r - - 2,192r 285 11,889rElectricity generation - - - - - - - 1,417r - 1,417rOil and gas extraction - - - 717 3,903 - - 46 - 4,666Petroleum refineries - - - 3,380r 103r - - 419r 285 4,188rCoal extraction 0r - - - 9r - - 57 - 66rCoke manufacture - 381 - - - - - 7 - 388Blast furnaces - 421 - - 29 - - 38 - 488Patent fuel manufacture - - - - - - - - - -Pumped storage - - - - - - - 86 - 86Other - - - - 468r - - 123r - 591rLosses - 216 - - 590r - - 2,452r - 3,258rFinal consumption 2,077r 884 - 67,419r 40,894r 4,299r - 26,035r 1,155r 142,762rIndustry 1,627r 566 - 4,238r 8,653r 594r - 7,997r 627r 24,302rUnclassified - 46 - 3,344r 1 594r - - - 3,985rIron and steel 38r 520 - 7r 469 - - 326 - 1,360rNon-ferrous metals 15 - - 0r 178r - - 385r - 578rMineral products 825r - - 174r 955r - - 539r - 2,493rChemicals 68r - - 110r 1,682r - - 1,331r 219r 3,409rMechanical engineering etc 10r - - - 511r - - 594r - 1,115rElectrical engineering etc 5r - - 1r 239r - - 491r - 736rVehicles 49 - - 186r 716r - - 415r - 1,366rFood, beverages etc 44r - - 135r 1,754r - - 915r - 2,848rTextiles, leather etc 52 - - 44r 394r - - 234r - 723rPaper, printing etc 96r - - 31r 898r - - 922r - 1,947rOther industries 418r - - 35r 604r - - 1,725r 408r 3,189rConstruction 5r - - 173r 254r - - 120 - 553rTransport (6) 9 - - 52,506r - 1,243 - 387 - 54,146rAir - - - 12,419 - - - - - 12,419Rail 9 - - 676 - - - 381 - 1,067Road - - - 38,713 - 1,243 - 6 - 39,962National navigation - - - 699r - - - - - 699rPipelines - - - - - - - - - -Other 441r 182 - 4,124r 31,774r 2,462r - 17,651r 528r 57,161rDomestic 415r 182 - 2,508r 24,393r 1,837r - 9,293r 52 38,680rPublic administration 17r - - 334r 3,007r 119r - 1,591r 470r 5,538rCommercial 4 - - 616r 3,456r 47r - 6,436r 6r 10,564rAgriculture - - - 400r 92r 459r - 331 - 1,282rMiscellaneous 5r - - 266r 826r - - - - 1,097rNon energy use - 136 - 6,550r 467 - - - - 7,153r
(1) Includes all manufactured solid fuels, benzole, tars, coke oven gas and blast furnace gas.(2) Includes colliery methane.(3) Includes geothermal and solar heat.(4) Stock fall (+), stock rise (-).(5) Primary supply minus primary demand.
(6) See paragraphs 5.42 regarding electricity use in transport and 6.66 regarding renewables use in transport.
(7) Back-flows from the petrochemical industry.
32
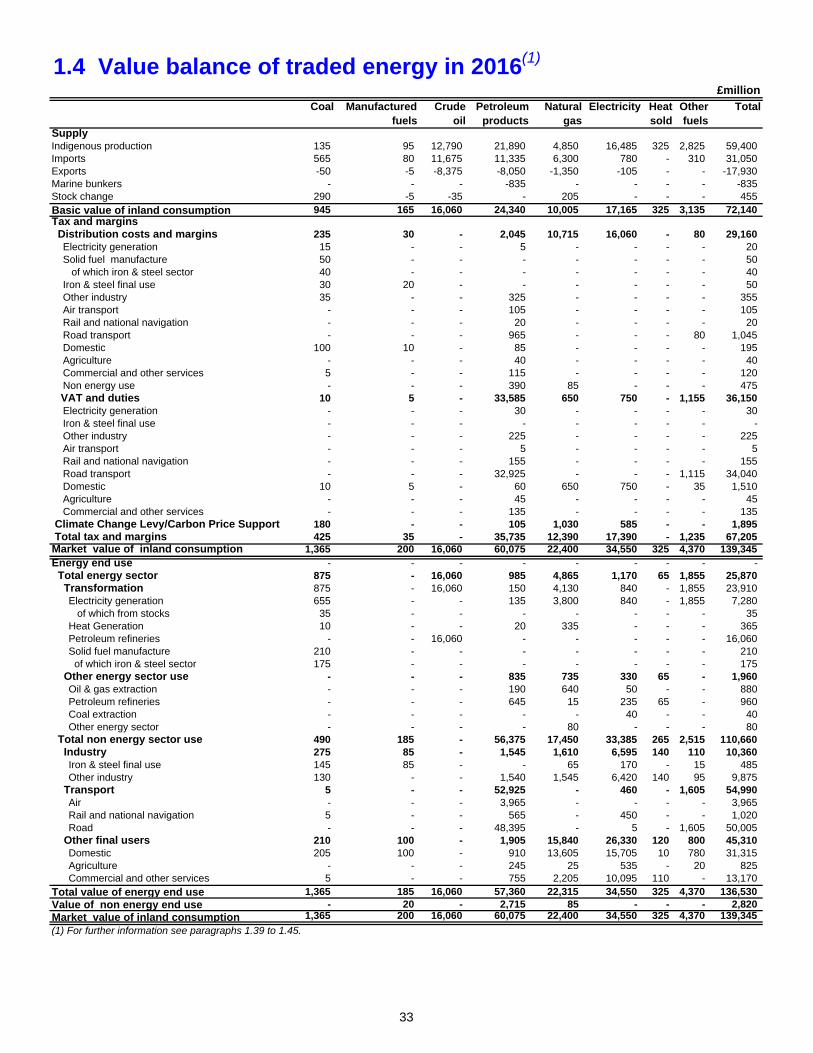
1.4 Value balance of traded energy in 2016(1)
Coal Manufactured fuels
Crude oil
Petroleum products
Natural gas
Electricity Heat sold
Other fuels
Total
SupplyIndigenous production 135 95 12,790 21,890 4,850 16,485 325 2,825 59,400 Imports 565 80 11,675 11,335 6,300 780 - 310 31,050 Exports -50 -5 -8,375 -8,050 -1,350 -105 - - -17,930 Marine bunkers - - - -835 - - - - -835 Stock change 290 -5 -35 - 205 - - - 455 Basic value of inland consumption 945 165 16,060 24,340 10,005 17,165 325 3,135 72,140 Tax and margins Distribution costs and margins 235 30 - 2,045 10,715 16,060 - 80 29,160 Electricity generation 15 - - 5 - - - - 20 Solid fuel manufacture 50 - - - - - - - 50 of which iron & steel sector 40 - - - - - - - 40 Iron & steel final use 30 20 - - - - - - 50 Other industry 35 - - 325 - - - - 355 Air transport - - - 105 - - - - 105 Rail and national navigation - - - 20 - - - - 20 Road transport - - - 965 - - - 80 1,045 Domestic 100 10 - 85 - - - - 195 Agriculture - - - 40 - - - - 40 Commercial and other services 5 - - 115 - - - - 120 Non energy use - - - 390 85 - - - 475 VAT and duties 10 5 - 33,585 650 750 - 1,155 36,150 Electricity generation - - - 30 - - - - 30 Iron & steel final use - - - - - - - - - Other industry - - - 225 - - - - 225 Air transport - - - 5 - - - - 5 Rail and national navigation - - - 155 - - - - 155 Road transport - - - 32,925 - - - 1,115 34,040 Domestic 10 5 - 60 650 750 - 35 1,510 Agriculture - - - 45 - - - - 45 Commercial and other services - - - 135 - - - - 135 Climate Change Levy/Carbon Price Support 180 - - 105 1,030 585 - - 1,895 Total tax and margins 425 35 - 35,735 12,390 17,390 - 1,235 67,205 Market value of inland consumption 1,365 200 16,060 60,075 22,400 34,550 325 4,370 139,345 Energy end use - - - - - - - - - Total energy sector 875 - 16,060 985 4,865 1,170 65 1,855 25,870 Transformation 875 - 16,060 150 4,130 840 - 1,855 23,910 Electricity generation 655 - - 135 3,800 840 - 1,855 7,280 of which from stocks 35 - - - - - - - 35 Heat Generation 10 - - 20 335 - - - 365 Petroleum refineries - - 16,060 - - - - - 16,060 Solid fuel manufacture 210 - - - - - - - 210 of which iron & steel sector 175 - - - - - - - 175 Other energy sector use - - - 835 735 330 65 - 1,960 Oil & gas extraction - - - 190 640 50 - - 880 Petroleum refineries - - - 645 15 235 65 - 960 Coal extraction - - - - - 40 - - 40 Other energy sector - - - - 80 - - - 80 Total non energy sector use 490 185 - 56,375 17,450 33,385 265 2,515 110,660 Industry 275 85 - 1,545 1,610 6,595 140 110 10,360 Iron & steel final use 145 85 - - 65 170 - 15 485 Other industry 130 - - 1,540 1,545 6,420 140 95 9,875 Transport 5 - - 52,925 - 460 - 1,605 54,990 Air - - - 3,965 - - - - 3,965 Rail and national navigation 5 - - 565 - 450 - - 1,020 Road - - - 48,395 - 5 - 1,605 50,005 Other final users 210 100 - 1,905 15,840 26,330 120 800 45,310 Domestic 205 100 - 910 13,605 15,705 10 780 31,315 Agriculture - - - 245 25 535 - 20 825 Commercial and other services 5 - - 755 2,205 10,095 110 - 13,170 Total value of energy end use 1,365 185 16,060 57,360 22,315 34,550 325 4,370 136,530 Value of non energy end use - 20 - 2,715 85 - - - 2,820 Market value of inland consumption 1,365 200 16,060 60,075 22,400 34,550 325 4,370 139,345
(1) For further information see paragraphs 1.39 to 1.45.
£million
33
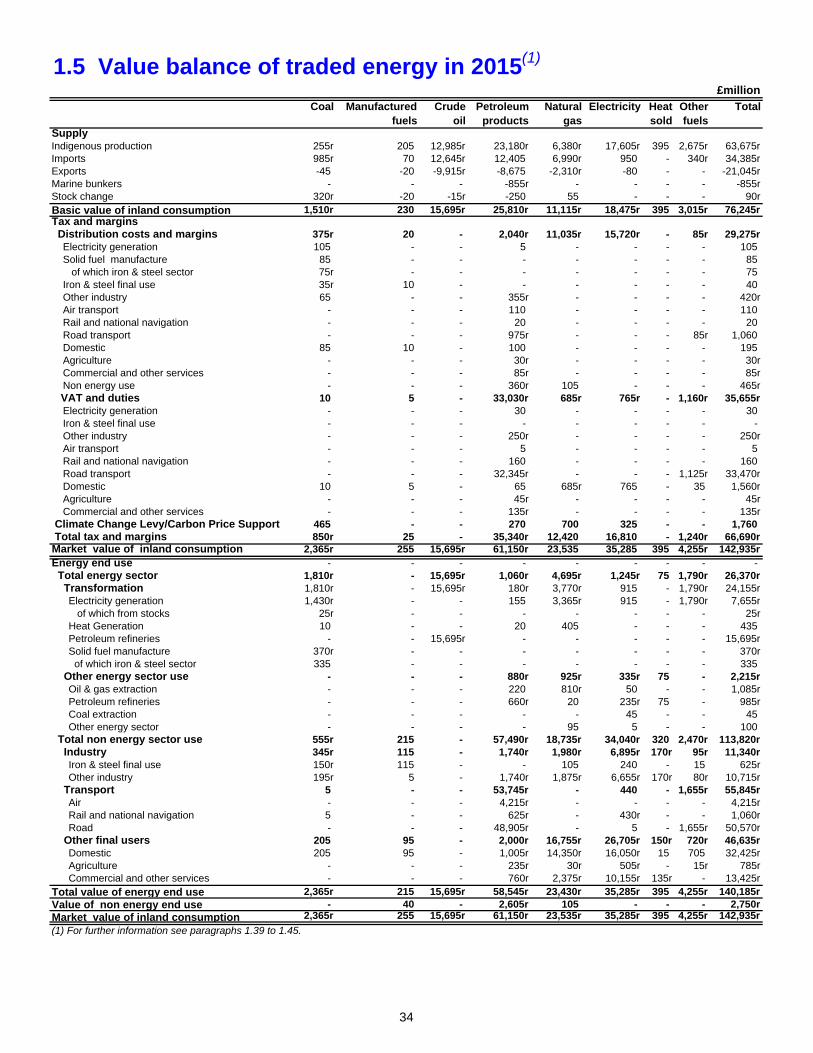
1.5 Value balance of traded energy in 2015(1)
Coal Manufactured fuels
Crude oil
Petroleum products
Natural gas
Electricity Heat sold
Other fuels
Total
SupplyIndigenous production 255r 205 12,985r 23,180r 6,380r 17,605r 395 2,675r 63,675rImports 985r 70 12,645r 12,405 6,990r 950 - 340r 34,385rExports -45 -20 -9,915r -8,675 -2,310r -80 - - -21,045rMarine bunkers - - - -855r - - - - -855rStock change 320r -20 -15r -250 55 - - - 90rBasic value of inland consumption 1,510r 230 15,695r 25,810r 11,115r 18,475r 395 3,015r 76,245rTax and margins Distribution costs and margins 375r 20 - 2,040r 11,035r 15,720r - 85r 29,275r Electricity generation 105 - - 5 - - - - 105 Solid fuel manufacture 85 - - - - - - - 85 of which iron & steel sector 75r - - - - - - - 75 Iron & steel final use 35r 10 - - - - - - 40 Other industry 65 - - 355r - - - - 420r Air transport - - - 110 - - - - 110 Rail and national navigation - - - 20 - - - - 20 Road transport - - - 975r - - - 85r 1,060 Domestic 85 10 - 100 - - - - 195 Agriculture - - - 30r - - - - 30r Commercial and other services - - - 85r - - - - 85r Non energy use - - - 360r 105 - - - 465r VAT and duties 10 5 - 33,030r 685r 765r - 1,160r 35,655r Electricity generation - - - 30 - - - - 30 Iron & steel final use - - - - - - - - - Other industry - - - 250r - - - - 250r Air transport - - - 5 - - - - 5 Rail and national navigation - - - 160 - - - - 160 Road transport - - - 32,345r - - - 1,125r 33,470r Domestic 10 5 - 65 685r 765 - 35 1,560r Agriculture - - - 45r - - - - 45r Commercial and other services - - - 135r - - - - 135r Climate Change Levy/Carbon Price Support 465 - - 270 700 325 - - 1,760 Total tax and margins 850r 25 - 35,340r 12,420 16,810 - 1,240r 66,690rMarket value of inland consumption 2,365r 255 15,695r 61,150r 23,535 35,285 395 4,255r 142,935rEnergy end use - - - - - - - - - Total energy sector 1,810r - 15,695r 1,060r 4,695r 1,245r 75 1,790r 26,370r Transformation 1,810r - 15,695r 180r 3,770r 915 - 1,790r 24,155r Electricity generation 1,430r - - 155 3,365r 915 - 1,790r 7,655r of which from stocks 25r - - - - - - - 25r Heat Generation 10 - - 20 405 - - - 435 Petroleum refineries - - 15,695r - - - - - 15,695r Solid fuel manufacture 370r - - - - - - - 370r of which iron & steel sector 335 - - - - - - - 335 Other energy sector use - - - 880r 925r 335r 75 - 2,215r Oil & gas extraction - - - 220 810r 50 - - 1,085r Petroleum refineries - - - 660r 20 235r 75 - 985r Coal extraction - - - - - 45 - - 45 Other energy sector - - - - 95 5 - - 100 Total non energy sector use 555r 215 - 57,490r 18,735r 34,040r 320 2,470r 113,820r Industry 345r 115 - 1,740r 1,980r 6,895r 170r 95r 11,340r Iron & steel final use 150r 115 - - 105 240 - 15 625r Other industry 195r 5 - 1,740r 1,875r 6,655r 170r 80r 10,715r Transport 5 - - 53,745r - 440 - 1,655r 55,845r Air - - - 4,215r - - - - 4,215r Rail and national navigation 5 - - 625r - 430r - - 1,060r Road - - - 48,905r - 5 - 1,655r 50,570r Other final users 205 95 - 2,000r 16,755r 26,705r 150r 720r 46,635r Domestic 205 95 - 1,005r 14,350r 16,050r 15 705 32,425r Agriculture - - - 235r 30r 505r - 15r 785r Commercial and other services - - - 760r 2,375r 10,155r 135r - 13,425rTotal value of energy end use 2,365r 215 15,695r 58,545r 23,430r 35,285r 395 4,255r 140,185rValue of non energy end use - 40 - 2,605r 105 - - - 2,750rMarket value of inland consumption 2,365r 255 15,695r 61,150r 23,535r 35,285r 395 4,255r 142,935r
(1) For further information see paragraphs 1.39 to 1.45.
£million
34

1.6 Value balance of traded energy in 2014(1)
Coal Manufactured fuels
Crude oil
Petroleum products
Natural gas
Electricity Heat sold
Other fuels
Total
SupplyIndigenous production 390r 265r 18,135r 34,455r 6,315r 17,715r 470 2,210r 79,950rImports 2,260 70r 24,335r 16,415r 7,635r 955r - 610 52,275rExports -55 -20 -14,625r -14,060r -2,000r -130r - - -30,895rMarine bunkers - - - -1,405 - - - - -1,405 Stock change -370r -30 -275 135 -40 - - - -580rBasic value of inland consumption 2,220r 285 27,565r 35,540r 11,905 18,540 470 2,815r 99,345rTax and margins Distribution costs and margins 640r 25 - 2,285r 11,965r 15,835r - 115 30,870r Electricity generation 225 - - 5 - - - - 230 Solid fuel manufacture 120 - - - - - - - 120 of which iron & steel sector 105 - - - - - - - 105 Iron & steel final use 35 10 - - - - - - 45 Other industry 150r - - 360r - - - - 515r Air transport - - - 175 - - - - 175 Rail and national navigation - - - 30 - - - - 30 Road transport - - - 1,105r - - - 115 1,220r Domestic 105r 10 - 130r - - - - 245r Agriculture - - - 35r - - - - 35r Commercial and other services 5 - - 100r - - - - 110r Non energy use - - - 345r 125 - - - 470r VAT and duties 10 5 - 33,410r 690r 785r - 1,440 36,340r Electricity generation - - - 30 - - - - 30 Iron & steel final use - - - - - - - - - Other industry - - - 225 - - - - 225 Air transport - - - 10 - - - - 10 Rail and national navigation - - - 165 - - - - 165 Road transport - - - 32,735r - - - 1,410 34,145r Domestic 10 5 - 85 690r 785r - 30 1,605 Agriculture - - - 35r - - - - 35r Commercial and other services - - - 120 - - - - 120 Climate Change Levy/Carbon Price Support 485 - - 280 475 260r - - 1,495 Total tax and margins 1,130r 30 - 35,975r 13,130r 16,880 - 1,555 68,705rMarket value of inland consumption 3,350 315 27,565r 71,515r 25,040r 35,420r 470 4,370r 168,050rEnergy end use Total energy sector 2,715 - 27,565r 1,210r 5,580r 1,225r 95 1,335r 39,720r Transformation 2,715 - 27,565r 225r 4,595r 905 - 1,335r 37,335r Electricity generation 2,170 - - 195r 4,110 905 - 1,335r 8,710r of which from stocks 45 - - - - - - - 45 Heat Generation 15 - - 30 485 - - - 530 Petroleum refineries - - 27,565r - - - - - 27,565r Solid fuel manufacture 530 - - - - - - - 530 of which iron & steel sector 460 - - - - - - - 460 Other energy sector use - - - 985 985r 320r 95 - 2,385r Oil & gas extraction - - - 345 860 45 - - 1,250 Petroleum refineries - - - 645 25r 210 95 - 970 Coal extraction - - - - - 55 - - 60 Other energy sector - - - - 105r 5 - - 110r Total non energy sector use 640r 260 - 67,625r 19,335r 34,195r 375 3,035r 125,465r Industry 425r 155 - 2,245r 2,330r 6,825r 205r 65r 12,250r Iron & steel final use 160 140 - 5 125 235 - 20 685 Other industry 265 15 - 2,240r 2,205r 6,585r 205r 50r 11,565r Transport 5 - - 62,905r - 430r - 2,310 65,650r Air - - - 6,580 - - - - 6,580 Rail and national navigation 5 - - 870r - 425r - - 1,295r Road - - - 55,460r - 5r - 2,310 57,775r Other final users 210 105 - 2,475r 17,005r 26,940r 170r 660r 47,565r Domestic 205 105 - 1,425r 14,525r 16,505r 15 610r 33,395r Agriculture - - - 255r 40r 455r - 40r 790r Commercial and other services 5 - - 790r 2,440r 9,980r 155r 10 13,385rTotal value of energy end use 3,350 260 27,565r 68,830r 24,915r 35,420r 470 4,370r 165,190rValue of non energy end use - 55 - 2,680r 125 - - - 2,865rMarket value of inland consumption 3,350 315 27,565r 71,515r 25,040r 35,420r 470 4,370r 168,050r
(1) For further information see paragraphs 1.39 to 1.45.
£million
35
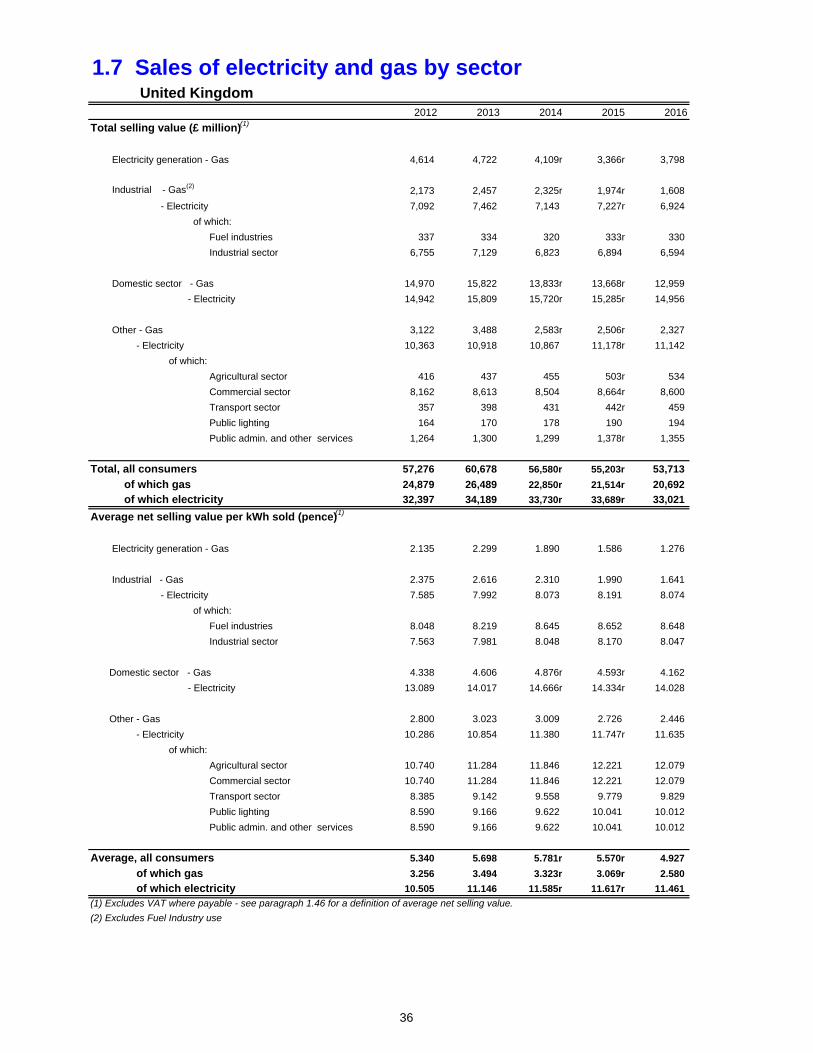
1.7 Sales of electricity and gas by sector United Kingdom
2012 2013 2014 2015 2016
Total selling value (£ million)(1)
Electricity generation - Gas 4,614 4,722 4,109r 3,366r 3,798
Industrial - Gas(2)2,173 2,457 2,325r 1,974r 1,608
- Electricity 7,092 7,462 7,143 7,227r 6,924
of which:
Fuel industries 337 334 320 333r 330
Industrial sector 6,755 7,129 6,823 6,894 6,594
Domestic sector - Gas 14,970 15,822 13,833r 13,668r 12,959
- Electricity 14,942 15,809 15,720r 15,285r 14,956
Other - Gas 3,122 3,488 2,583r 2,506r 2,327
- Electricity 10,363 10,918 10,867 11,178r 11,142
of which:
Agricultural sector 416 437 455 503r 534
Commercial sector 8,162 8,613 8,504 8,664r 8,600
Transport sector 357 398 431 442r 459
Public lighting 164 170 178 190 194
Public admin. and other services 1,264 1,300 1,299 1,378r 1,355
Total, all consumers 57,276 60,678 56,580r 55,203r 53,713
of which gas 24,879 26,489 22,850r 21,514r 20,692
of which electricity 32,397 34,189 33,730r 33,689r 33,021
Average net selling value per kWh sold (pence)(1)
Electricity generation - Gas 2.135 2.299 1.890 1.586 1.276
Industrial - Gas 2.375 2.616 2.310 1.990 1.641
- Electricity 7.585 7.992 8.073 8.191 8.074
of which:
Fuel industries 8.048 8.219 8.645 8.652 8.648
Industrial sector 7.563 7.981 8.048 8.170 8.047
Domestic sector - Gas 4.338 4.606 4.876r 4.593r 4.162
- Electricity 13.089 14.017 14.666r 14.334r 14.028
Other - Gas 2.800 3.023 3.009 2.726 2.446
- Electricity 10.286 10.854 11.380 11.747r 11.635
of which:
Agricultural sector 10.740 11.284 11.846 12.221 12.079
Commercial sector 10.740 11.284 11.846 12.221 12.079
Transport sector 8.385 9.142 9.558 9.779 9.829
Public lighting 8.590 9.166 9.622 10.041 10.012
Public admin. and other services 8.590 9.166 9.622 10.041 10.012
Average, all consumers 5.340 5.698 5.781r 5.570r 4.927
of which gas 3.256 3.494 3.323r 3.069r 2.580
of which electricity 10.505 11.146 11.585r 11.617r 11.461
(1) Excludes VAT where payable - see paragraph 1.46 for a definition of average net selling value.
(2) Excludes Fuel Industry use
36
37
Chapter 2 Solid fuels and derived gases
Introduction 2.1 This chapter presents statistics on supply and demand for coal (tables 2.1 - 2.4) and manufactured solid fuels, including coke oven coke, coke breeze, patent fuel, coke oven gas, blast furnace gas, benzole and tar (tables 2.5 and 2.6). A full list of tables is available at the end of the chapter. 2.2 In 2016, coal comprised 5.8 per cent of UK primary energy demand, half that of the previous year and under a third of its recent peak of 19 per cent in 2012. Most coal is used for electricity generation, coke manufacture, or in blast furnaces in the steel industry. 2.3 Overleaf, an energy flow chart for 2016 shows the flows of coal from production and imports through to consumption. It is a way of simplifying the figures that can be found in the commodity balance for coal in Table 2.4. The chart illustrates the flow of coal from the point of supply (on the left) to its eventual final use (on the right).
Key points
Coal production fell more than half compared to last year, down to an all-time low of 4 million tonnes (Table 2.4). This is the largest ever year-on-year reduction and is a marked step down from the 30 million tonnes produced at the start of the century. The decrease is due to the closure of the last large deep mines in 2015, combined with a steep reduction in demand) as government policy and market forces reduced the use of coal for electricity generation.
Similarly, demand for coal halved, falling from 38 million tonnes in 2015 to 18 million tonnes in 2016 (Table 2.4), with a 59 per cent decrease in the use of coal for electricity generation. Demand last year was around quarter of that seen at the start of the century.
In 2016 around 67 per cent of demand for coal was from major power producers for electricity generation with around a further 15 per cent used for the manufacture of coke (Table 2.4).
In 2016 UK imports were 8.5 million tonnes (the lowest value for 15 years), a decrease of 62 per cent on 2015 due to lower demand from generators (Table 2.4).
In 2016 Columbia was the UK’s largest supplier of coal imports with a share of 31 per cent. The other main suppliers were Russia with a 27 per cent share and USA with a 17 per cent share (Table 2B).
Total stock levels decreased in 2016 to 8 million tonnes, which was 5.7 million tonnes lower than in 2015, due to generators using more stocks for electricity generation. (Table 2.4).
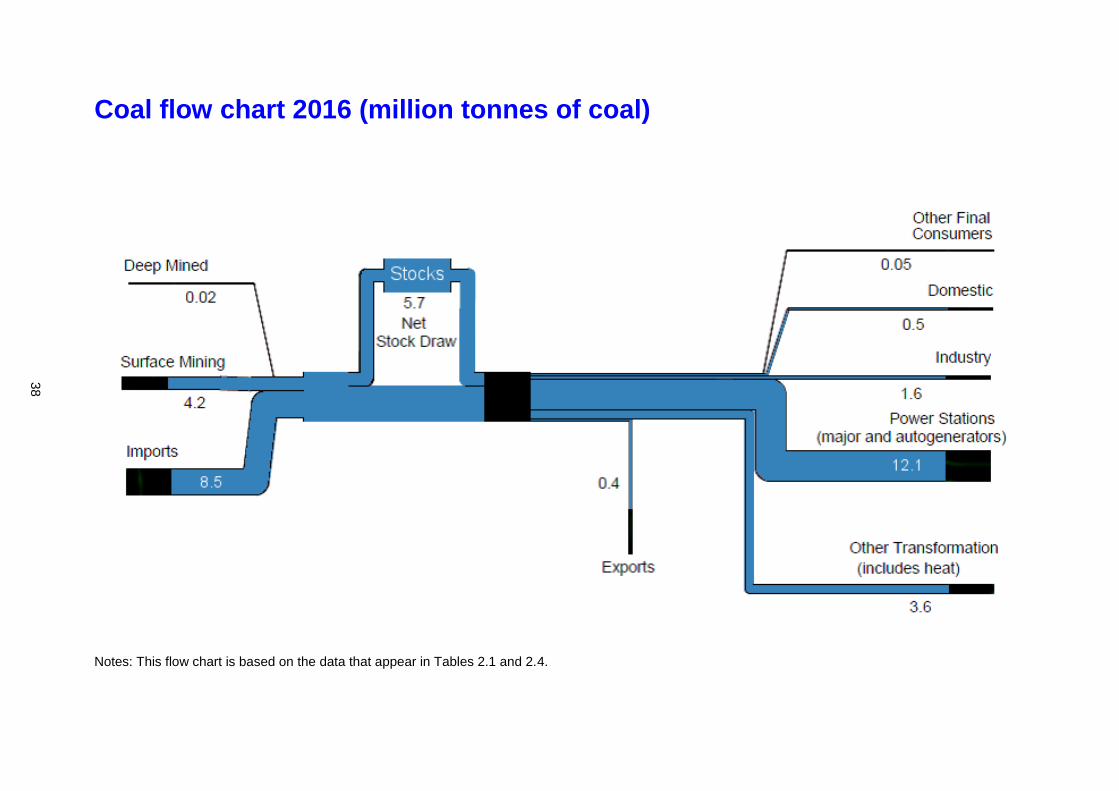
Coal flow chart 2016 (million tonnes of coal)
Notes: This flow chart is based on the data that appear in Tables 2.1 and 2.4.
38
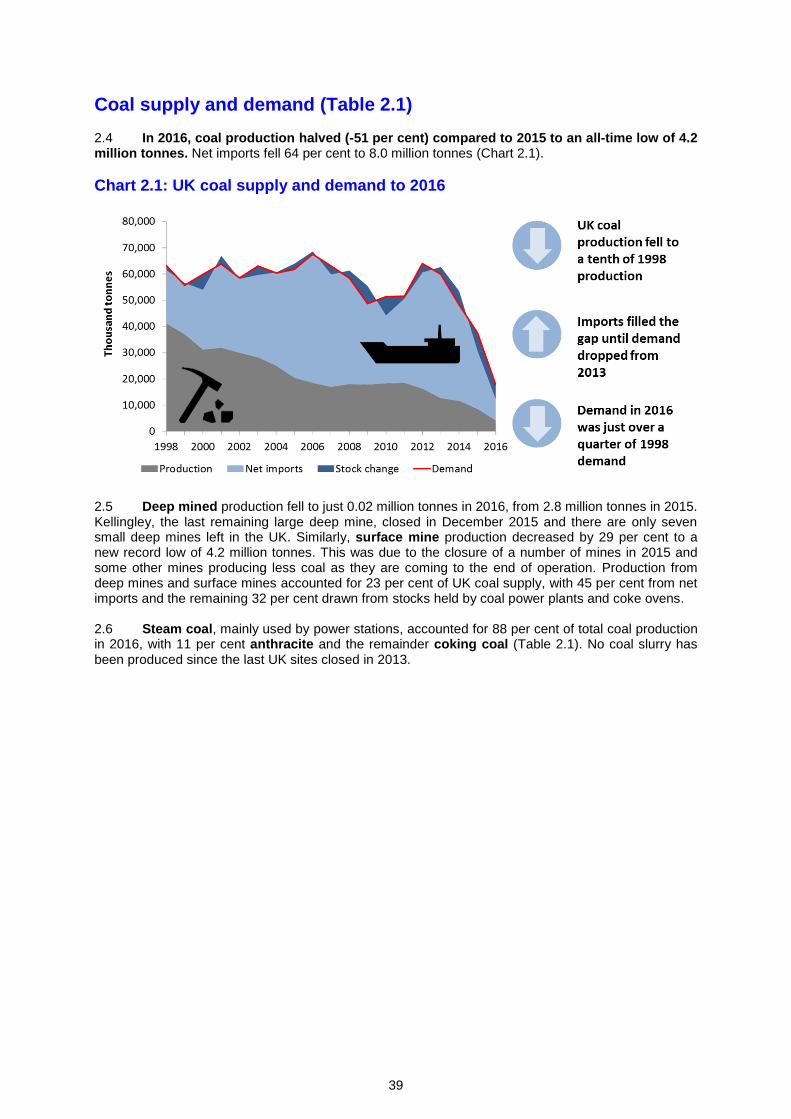
39
Coal supply and demand (Table 2.1) 2.4 In 2016, coal production halved (-51 per cent) compared to 2015 to an all-time low of 4.2 million tonnes. Net imports fell 64 per cent to 8.0 million tonnes (Chart 2.1).
Chart 2.1: UK coal supply and demand to 2016
2.5 Deep mined production fell to just 0.02 million tonnes in 2016, from 2.8 million tonnes in 2015. Kellingley, the last remaining large deep mine, closed in December 2015 and there are only seven small deep mines left in the UK. Similarly, surface mine production decreased by 29 per cent to a new record low of 4.2 million tonnes. This was due to the closure of a number of mines in 2015 and some other mines producing less coal as they are coming to the end of operation. Production from deep mines and surface mines accounted for 23 per cent of UK coal supply, with 45 per cent from net imports and the remaining 32 per cent drawn from stocks held by coal power plants and coke ovens. 2.6 Steam coal, mainly used by power stations, accounted for 88 per cent of total coal production in 2016, with 11 per cent anthracite and the remainder coking coal (Table 2.1). No coal slurry has been produced since the last UK sites closed in 2013.
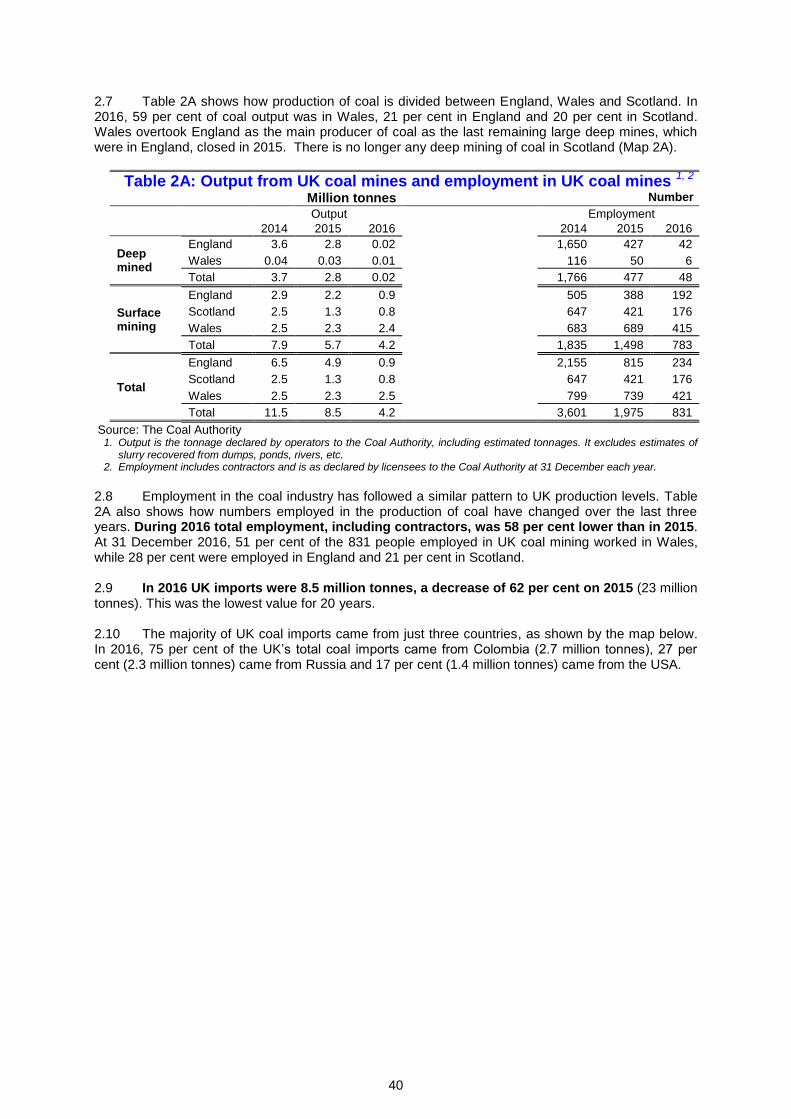
40
2.7 Table 2A shows how production of coal is divided between England, Wales and Scotland. In 2016, 59 per cent of coal output was in Wales, 21 per cent in England and 20 per cent in Scotland. Wales overtook England as the main producer of coal as the last remaining large deep mines, which were in England, closed in 2015. There is no longer any deep mining of coal in Scotland (Map 2A). Table 2A: Output from UK coal mines and employment in UK coal mines 1, 2
Million tonnes Number
Output Employment
2014 2015 2016 2014 2015 2016
Deep mined
England 3.6 2.8 0.02 1,650 427 42
Wales 0.04 0.03 0.01 116 50 6
Total 3.7 2.8 0.02 1,766 477 48
Surface mining
England 2.9 2.2 0.9 505 388 192
Scotland 2.5 1.3 0.8 647 421 176
Wales 2.5 2.3 2.4 683 689 415
Total 7.9 5.7 4.2 1,835 1,498 783
Total
England 6.5 4.9 0.9 2,155 815 234
Scotland 2.5 1.3 0.8 647 421 176
Wales 2.5 2.3 2.5 799 739 421
Total 11.5 8.5 4.2 3,601 1,975 831
Source: The Coal Authority 1. Output is the tonnage declared by operators to the Coal Authority, including estimated tonnages. It excludes estimates of
slurry recovered from dumps, ponds, rivers, etc. 2. Employment includes contractors and is as declared by licensees to the Coal Authority at 31 December each year.
2.8 Employment in the coal industry has followed a similar pattern to UK production levels. Table 2A also shows how numbers employed in the production of coal have changed over the last three years. During 2016 total employment, including contractors, was 58 per cent lower than in 2015. At 31 December 2016, 51 per cent of the 831 people employed in UK coal mining worked in Wales, while 28 per cent were employed in England and 21 per cent in Scotland. 2.9 In 2016 UK imports were 8.5 million tonnes, a decrease of 62 per cent on 2015 (23 million tonnes). This was the lowest value for 20 years.
2.10 The majority of UK coal imports came from just three countries, as shown by the map below. In 2016, 75 per cent of the UK’s total coal imports came from Colombia (2.7 million tonnes), 27 per cent (2.3 million tonnes) came from Russia and 17 per cent (1.4 million tonnes) came from the USA.
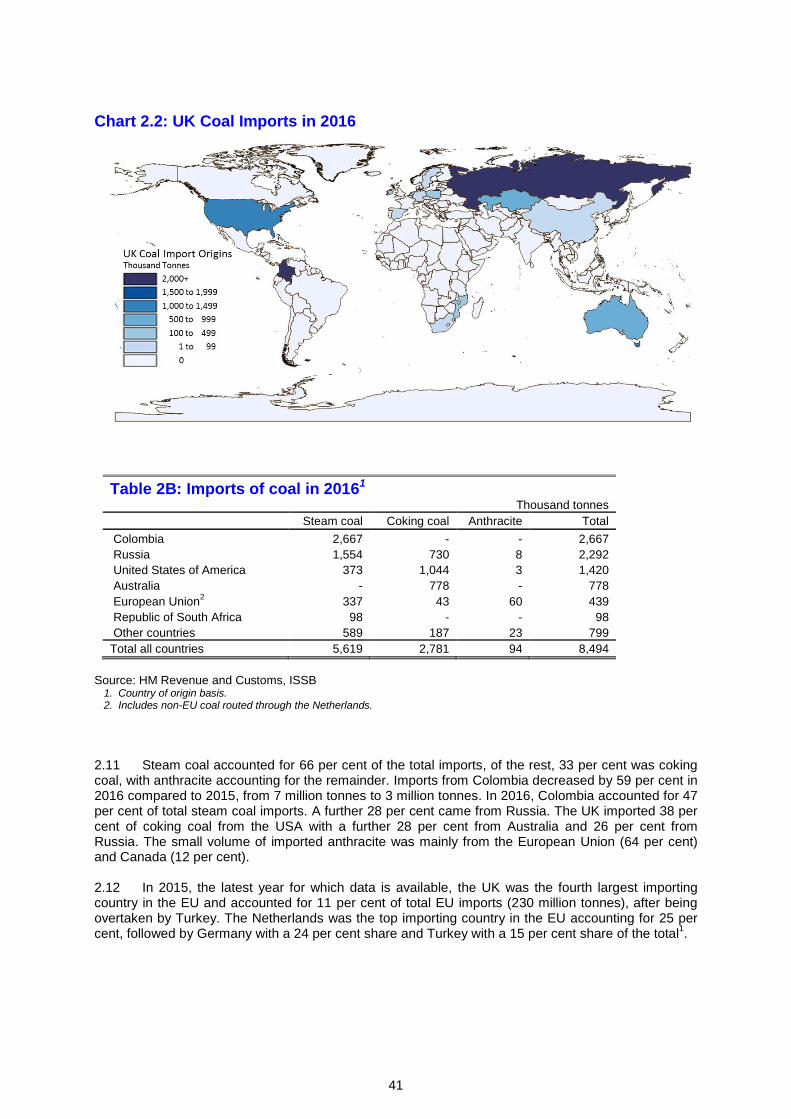
41
Chart 2.2: UK Coal Imports in 2016
Table 2B: Imports of coal in 20161 Thousand tonnes
Steam coal Coking coal Anthracite Total
Colombia 2,667 - - 2,667 Russia 1,554 730 8 2,292 United States of America 373 1,044 3 1,420 Australia - 778 - 778 European Union
2 337 43 60 439
Republic of South Africa 98 - - 98 Other countries 589 187 23 799
Total all countries 5,619 2,781 94 8,494
Source: HM Revenue and Customs, ISSB
1. Country of origin basis. 2. Includes non-EU coal routed through the Netherlands.
2.11 Steam coal accounted for 66 per cent of the total imports, of the rest, 33 per cent was coking coal, with anthracite accounting for the remainder. Imports from Colombia decreased by 59 per cent in 2016 compared to 2015, from 7 million tonnes to 3 million tonnes. In 2016, Colombia accounted for 47 per cent of total steam coal imports. A further 28 per cent came from Russia. The UK imported 38 per cent of coking coal from the USA with a further 28 per cent from Australia and 26 per cent from Russia. The small volume of imported anthracite was mainly from the European Union (64 per cent) and Canada (12 per cent). 2.12 In 2015, the latest year for which data is available, the UK was the fourth largest importing country in the EU and accounted for 11 per cent of total EU imports (230 million tonnes), after being overtaken by Turkey. The Netherlands was the top importing country in the EU accounting for 25 per cent, followed by Germany with a 24 per cent share and Turkey with a 15 per cent share of the total
1.
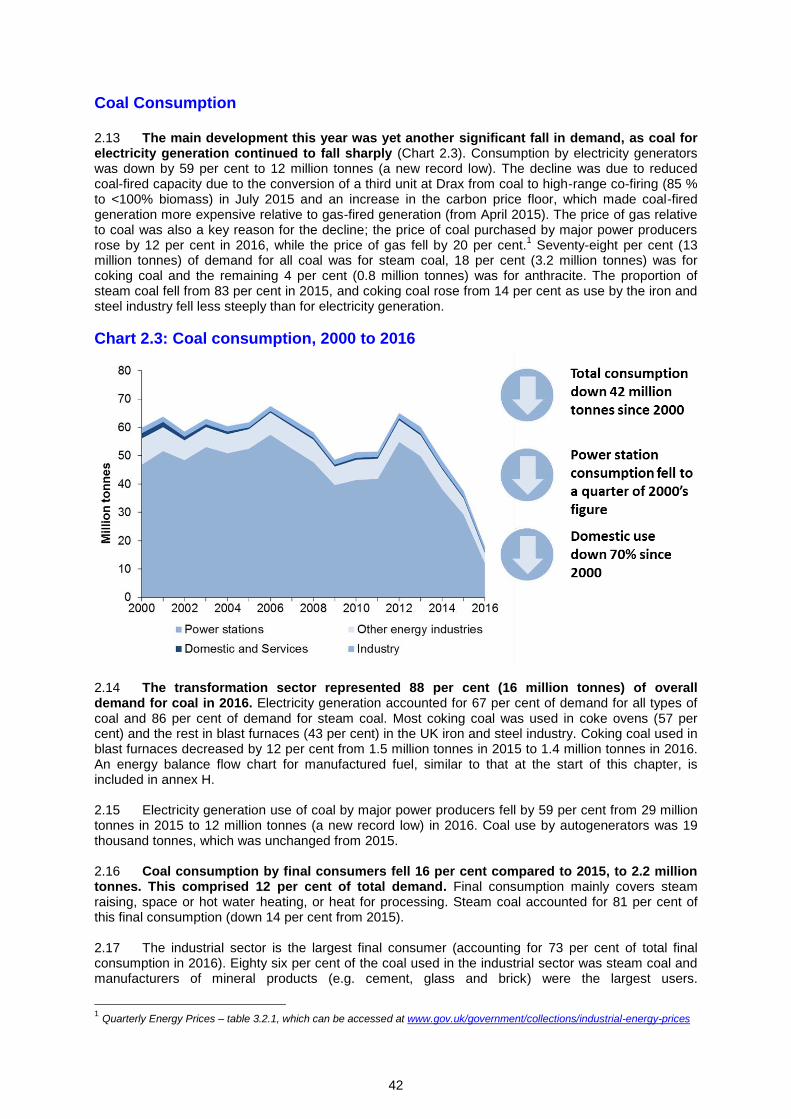
42
Coal Consumption 2.13 The main development this year was yet another significant fall in demand, as coal for electricity generation continued to fall sharply (Chart 2.3). Consumption by electricity generators was down by 59 per cent to 12 million tonnes (a new record low). The decline was due to reduced coal-fired capacity due to the conversion of a third unit at Drax from coal to high-range co-firing (85 % to <100% biomass) in July 2015 and an increase in the carbon price floor, which made coal-fired generation more expensive relative to gas-fired generation (from April 2015). The price of gas relative to coal was also a key reason for the decline; the price of coal purchased by major power producers rose by 12 per cent in 2016, while the price of gas fell by 20 per cent.
1 Seventy-eight per cent (13
million tonnes) of demand for all coal was for steam coal, 18 per cent (3.2 million tonnes) was for coking coal and the remaining 4 per cent (0.8 million tonnes) was for anthracite. The proportion of steam coal fell from 83 per cent in 2015, and coking coal rose from 14 per cent as use by the iron and steel industry fell less steeply than for electricity generation.
Chart 2.3: Coal consumption, 2000 to 2016
2.14 The transformation sector represented 88 per cent (16 million tonnes) of overall demand for coal in 2016. Electricity generation accounted for 67 per cent of demand for all types of coal and 86 per cent of demand for steam coal. Most coking coal was used in coke ovens (57 per cent) and the rest in blast furnaces (43 per cent) in the UK iron and steel industry. Coking coal used in blast furnaces decreased by 12 per cent from 1.5 million tonnes in 2015 to 1.4 million tonnes in 2016. An energy balance flow chart for manufactured fuel, similar to that at the start of this chapter, is included in annex H. 2.15 Electricity generation use of coal by major power producers fell by 59 per cent from 29 million tonnes in 2015 to 12 million tonnes (a new record low) in 2016. Coal use by autogenerators was 19 thousand tonnes, which was unchanged from 2015.
2.16 Coal consumption by final consumers fell 16 per cent compared to 2015, to 2.2 million tonnes. This comprised 12 per cent of total demand. Final consumption mainly covers steam raising, space or hot water heating, or heat for processing. Steam coal accounted for 81 per cent of this final consumption (down 14 per cent from 2015). 2.17 The industrial sector is the largest final consumer (accounting for 73 per cent of total final consumption in 2016). Eighty six per cent of the coal used in the industrial sector was steam coal and manufacturers of mineral products (e.g. cement, glass and brick) were the largest users.
1 Quarterly Energy Prices – table 3.2.1, which can be accessed at www.gov.uk/government/collections/industrial-energy-prices
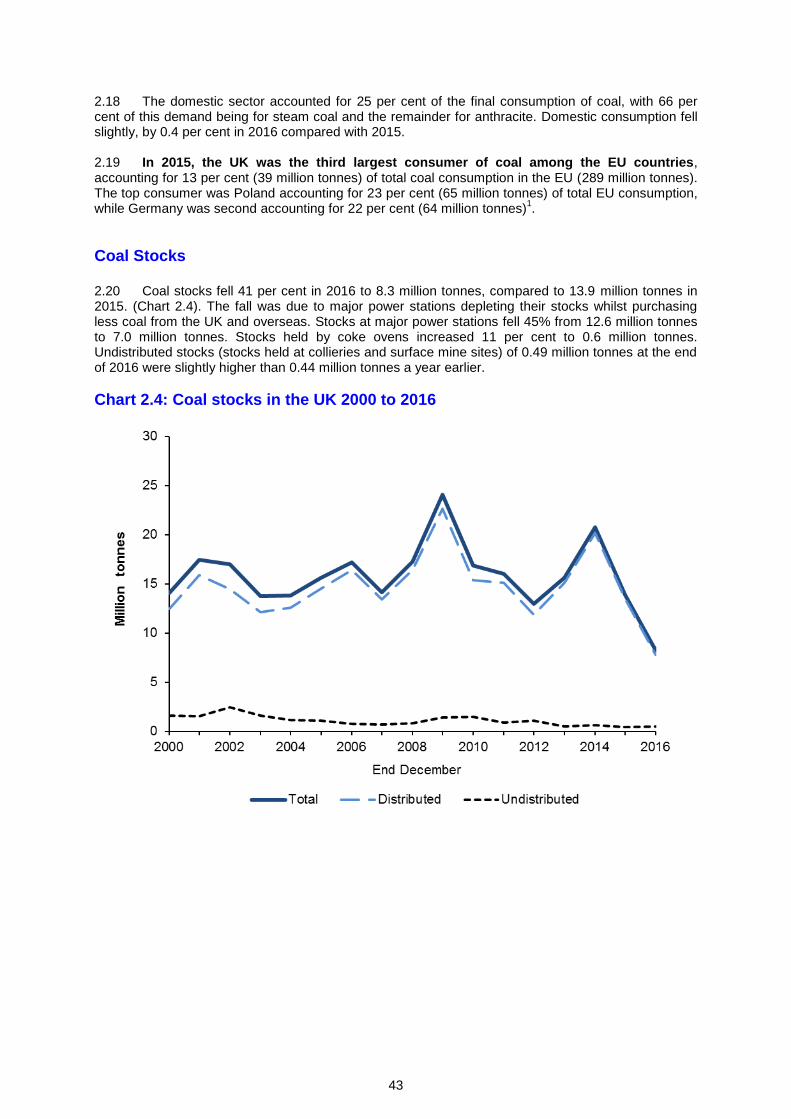
43
2.18 The domestic sector accounted for 25 per cent of the final consumption of coal, with 66 per cent of this demand being for steam coal and the remainder for anthracite. Domestic consumption fell slightly, by 0.4 per cent in 2016 compared with 2015. 2.19 In 2015, the UK was the third largest consumer of coal among the EU countries, accounting for 13 per cent (39 million tonnes) of total coal consumption in the EU (289 million tonnes). The top consumer was Poland accounting for 23 per cent (65 million tonnes) of total EU consumption, while Germany was second accounting for 22 per cent (64 million tonnes)
1.
Coal Stocks 2.20 Coal stocks fell 41 per cent in 2016 to 8.3 million tonnes, compared to 13.9 million tonnes in 2015. (Chart 2.4). The fall was due to major power stations depleting their stocks whilst purchasing less coal from the UK and overseas. Stocks at major power stations fell 45% from 12.6 million tonnes to 7.0 million tonnes. Stocks held by coke ovens increased 11 per cent to 0.6 million tonnes. Undistributed stocks (stocks held at collieries and surface mine sites) of 0.49 million tonnes at the end of 2016 were slightly higher than 0.44 million tonnes a year earlier.
Chart 2.4: Coal stocks in the UK 2000 to 2016
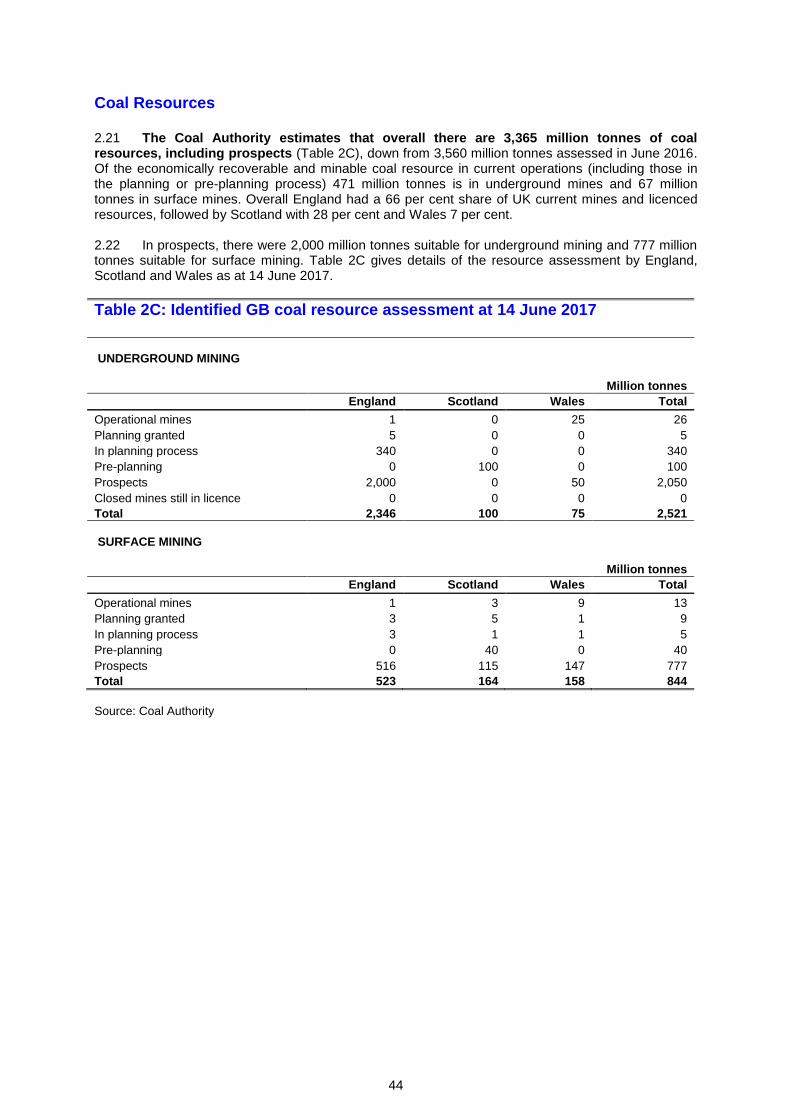
44
Coal Resources 2.21 The Coal Authority estimates that overall there are 3,365 million tonnes of coal resources, including prospects (Table 2C), down from 3,560 million tonnes assessed in June 2016. Of the economically recoverable and minable coal resource in current operations (including those in the planning or pre-planning process) 471 million tonnes is in underground mines and 67 million tonnes in surface mines. Overall England had a 66 per cent share of UK current mines and licenced resources, followed by Scotland with 28 per cent and Wales 7 per cent. 2.22 In prospects, there were 2,000 million tonnes suitable for underground mining and 777 million tonnes suitable for surface mining. Table 2C gives details of the resource assessment by England, Scotland and Wales as at 14 June 2017.
Table 2C: Identified GB coal resource assessment at 14 June 2017 UNDERGROUND MINING
Million tonnes
England Scotland Wales Total
Operational mines 1 0 25 26
Planning granted 5 0 0 5
In planning process 340 0 0 340
Pre-planning 0 100 0 100
Prospects 2,000 0 50 2,050
Closed mines still in licence 0 0 0 0
Total 2,346 100 75 2,521
SURFACE MINING
Million tonnes
England Scotland Wales Total
Operational mines 1 3 9 13
Planning granted 3 5 1 9
In planning process 3 1 1 5
Pre-planning 0 40 0 40
Prospects 516 115 147 777
Total 523 164 158 844
Source: Coal Authority
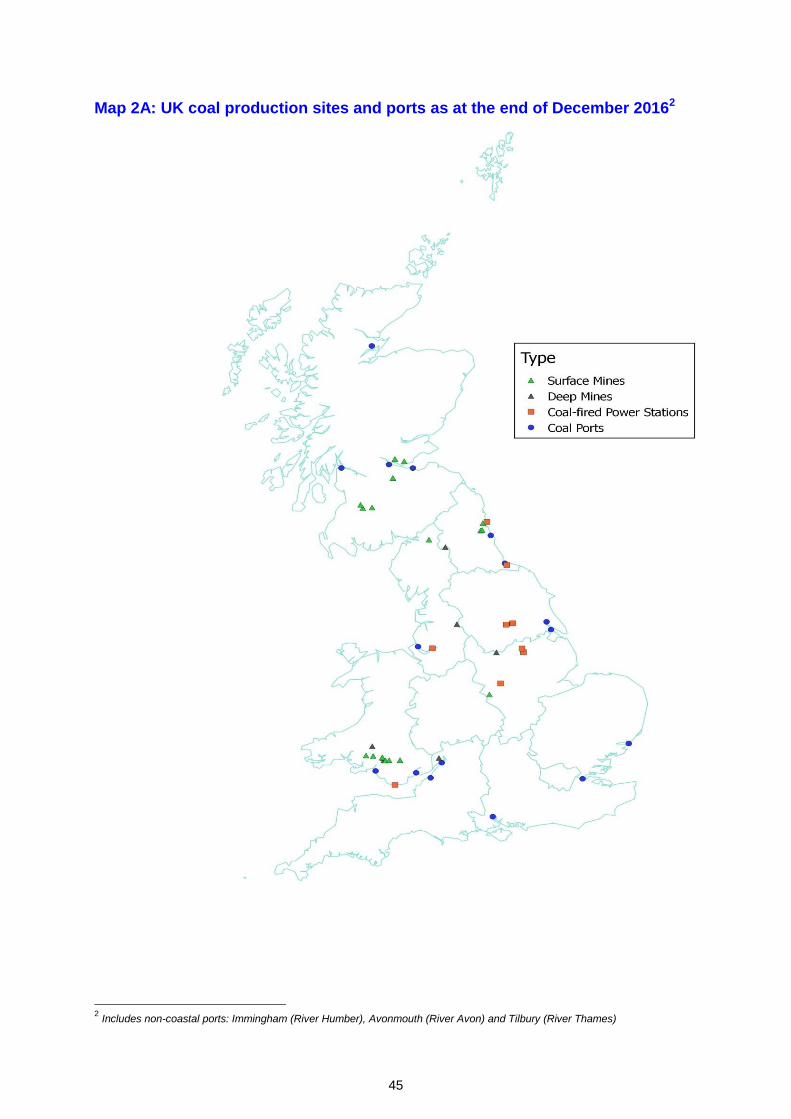
45
2 Includes non-coastal ports: Immingham (River Humber), Avonmouth (River Avon) and Tilbury (River Thames)
Map 2A: UK coal production sites and ports as at the end of December 20162
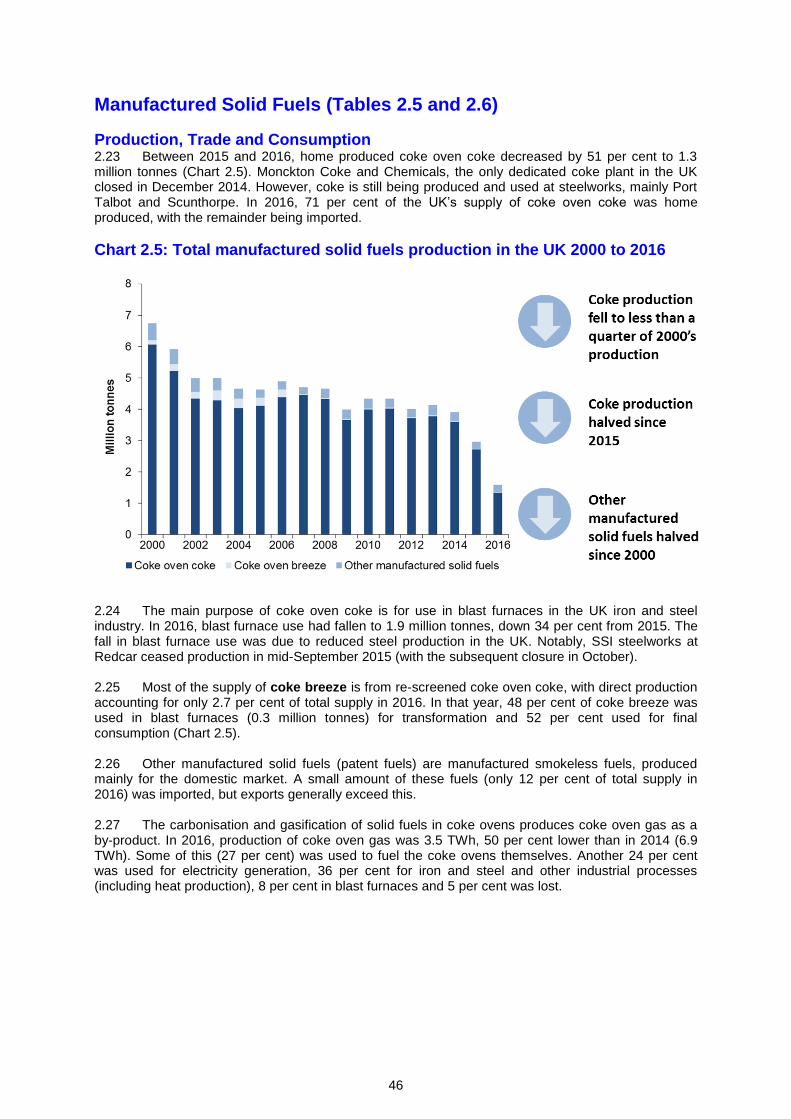
46
Manufactured Solid Fuels (Tables 2.5 and 2.6)
Production, Trade and Consumption 2.23 Between 2015 and 2016, home produced coke oven coke decreased by 51 per cent to 1.3 million tonnes (Chart 2.5). Monckton Coke and Chemicals, the only dedicated coke plant in the UK closed in December 2014. However, coke is still being produced and used at steelworks, mainly Port Talbot and Scunthorpe. In 2016, 71 per cent of the UK’s supply of coke oven coke was home produced, with the remainder being imported.
Chart 2.5: Total manufactured solid fuels production in the UK 2000 to 2016
2.24 The main purpose of coke oven coke is for use in blast furnaces in the UK iron and steel industry. In 2016, blast furnace use had fallen to 1.9 million tonnes, down 34 per cent from 2015. The fall in blast furnace use was due to reduced steel production in the UK. Notably, SSI steelworks at Redcar ceased production in mid-September 2015 (with the subsequent closure in October). 2.25 Most of the supply of coke breeze is from re-screened coke oven coke, with direct production accounting for only 2.7 per cent of total supply in 2016. In that year, 48 per cent of coke breeze was used in blast furnaces (0.3 million tonnes) for transformation and 52 per cent used for final consumption (Chart 2.5). 2.26 Other manufactured solid fuels (patent fuels) are manufactured smokeless fuels, produced mainly for the domestic market. A small amount of these fuels (only 12 per cent of total supply in 2016) was imported, but exports generally exceed this. 2.27 The carbonisation and gasification of solid fuels in coke ovens produces coke oven gas as a by-product. In 2016, production of coke oven gas was 3.5 TWh, 50 per cent lower than in 2014 (6.9 TWh). Some of this (27 per cent) was used to fuel the coke ovens themselves. Another 24 per cent was used for electricity generation, 36 per cent for iron and steel and other industrial processes (including heat production), 8 per cent in blast furnaces and 5 per cent was lost.
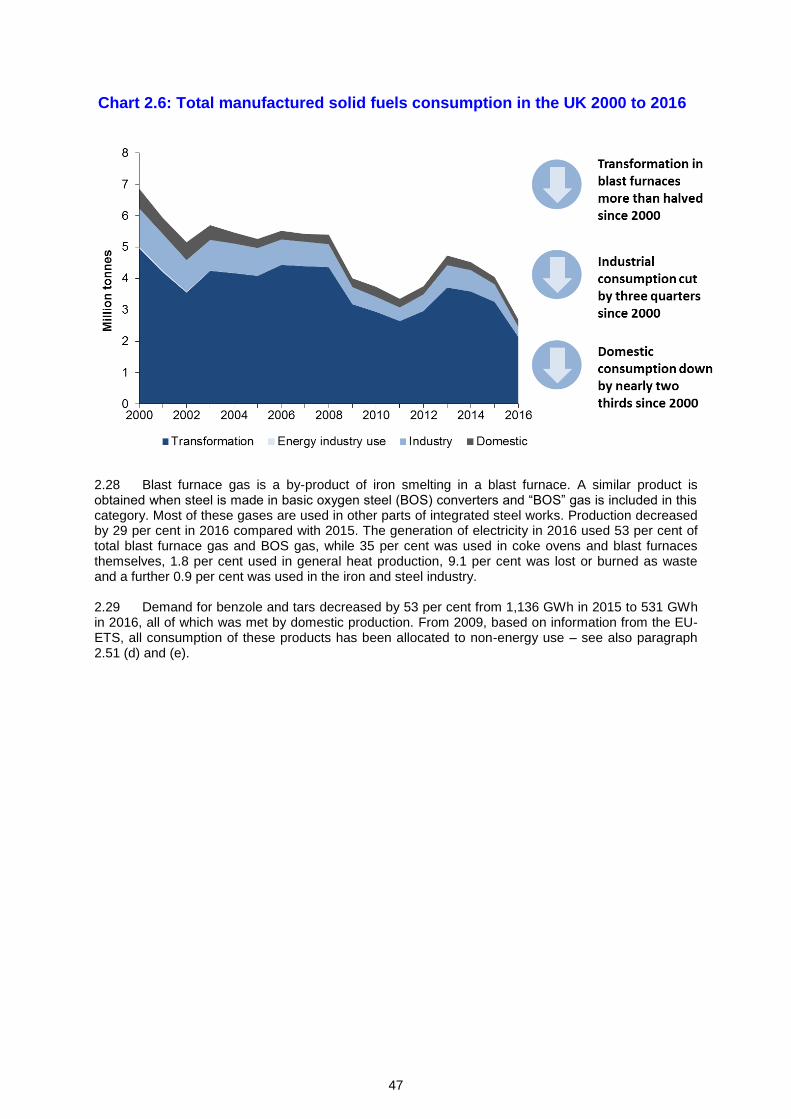
47
Chart 2.6: Total manufactured solid fuels consumption in the UK 2000 to 2016
2.28 Blast furnace gas is a by-product of iron smelting in a blast furnace. A similar product is obtained when steel is made in basic oxygen steel (BOS) converters and “BOS” gas is included in this category. Most of these gases are used in other parts of integrated steel works. Production decreased by 29 per cent in 2016 compared with 2015. The generation of electricity in 2016 used 53 per cent of total blast furnace gas and BOS gas, while 35 per cent was used in coke ovens and blast furnaces themselves, 1.8 per cent used in general heat production, 9.1 per cent was lost or burned as waste and a further 0.9 per cent was used in the iron and steel industry.
2.29 Demand for benzole and tars decreased by 53 per cent from 1,136 GWh in 2015 to 531 GWh in 2016, all of which was met by domestic production. From 2009, based on information from the EU-ETS, all consumption of these products has been allocated to non-energy use – see also paragraph 2.51 (d) and (e).
48
List of DUKES coal tables Table Description Period
2.1-2.3
Commodity balances for coal – supply, demand & final consumption 1998-2016
2.4 Supply and consumption of coal 2016
2.5 Supply and consumption of coke oven coke, coke breeze and other manufactured solid fuels
1996-2016
2.6 Supply and consumption of coke oven gas, blast furnace gas, benzole and tars
1996-2016
2.7 Deep mines and surface mines in production, December 2016. 2016
2.1.1 Coal production and stocks 1970-2016
2.1.2 Inland consumption of solid fuels 1970-2016
2A Output from UK coal mines and employment in UK coal mines 2014-2016
2B Imports of coal in 2016, by grade and origin 2016
2C Identified GB coal resource assessment at 6 June 2016 6th June 2016
Technical notes and definitions 2.30 These notes and definitions are in addition to the technical notes and definitions covering all fuels and energy as a whole in Chapter 1. Additional guidance on the compilation of the solid fuels and derived gases statistics can be found in the document ‘Data Sources and Methodologies’, available on the BEIS section of the GOV.UK website at: www.gov.uk/government/collections/coal-statistics. For notes on the commodity balances and definitions of the terms used in the row headings see Annex A. While the data in the printed and bound copy of this Digest cover only the most recent 5 years, these notes also cover data for earlier years that are available on the BEIS website.
Coal production 2.31 Deep mined: The statistics cover saleable output from deep mines including coal obtained from working on both revenue and capital accounts. All licensed collieries (and British Coal collieries prior to 1995) are included, even where coal is only a subsidiary product. 2.32 Surface mines: The figures cover saleable output and include the output of sites worked by operators under agency agreements and licences, as well as the output of sites licensed for the production of coal as a subsidiary to the production of other minerals. The term ‘surface mining’ has now replaced opencast production as defined in DUKES pre-2011. Opencast production is a particular type of surface mining technique. 2.33 Other sources/Slurry: Estimates of slurry etc recovered and disposed of from dumps, ponds, rivers, etc.
Steam coal, coking coal and anthracite 2.34 Steam coal is coal classified as such by UK coal producers and by importers of coal. It tends to have calorific values at the lower end of the range. 2.35 Coking coal is coal sold by producers for use in coke ovens and similar carbonising processes. The definition is not therefore determined by the calorific value or caking qualities of each batch of coal sold, although calorific values tend to be higher than for steam coal.
49
2.36 Anthracite is coal classified as such by UK coal producers and importers of coal. Typically it has a high heat content making it particularly suitable for certain industrial processes and for use as a domestic fuel. Some UK anthracite producers have found a market for their lower calorific value output at power stations.
Allocation of imported coal 2.37 Although data are available on consumption of home produced coal, and also on consumption of imported coal by secondary fuel producers, there is only very limited direct information on consumption of imported coal by final users. Guidance on how BEIS allocate imports to final users is outlined in paragraph 3.2.5 of the ‘Data Sources and Methodologies’ document. This guidance can be found on the BEIS section of the GOV.UK website at: www.gov.uk/government/collections/coal-statistics.
Coal consumption 2.38 Figures for actual consumption of coal are available for all fuels and power producers and for final use by the iron and steel industry. The remaining final users’ consumption figures are based on information on disposals to consumers by producers and on imports. 2.39 Annex A of this Digest outlines the principles of energy and commodity balances and defines the activities that fall within these parts of the balances. However, the following additional notes relevant to solid fuels are given below: Transformation: Blast furnaces: Coking coal injected into blast furnaces is shown separately within the balance tables. Transformation: Low temperature carbonisation plants and patent fuel plants: Coal used at these plants for the manufacture of domestic coke such as Coalite and of briquetted fuels such as Phurnacite and Homefire. Consumption: Industry: The statistics comprise sales of coal by the six main coal producers and a few small producers to the iron and steel industry (excluding those used at coke ovens and blast furnaces) and to other industrial sectors, estimated proportions of anthracite and steam coal imports, and submission made to the EU Emissions Trading Scheme. The figures exclude coal used for industries’ own generation of electricity, which appear separately under transformation. Consumption: Domestic: Some coal is supplied free of charge to retired miners and other retired eligible employees through the National Concessionary Fuel Scheme (NCFS). The concessionary fuel provided in 2015 is estimated at 34.9 thousand tonnes. This estimate is included in the domestic steam coal and domestic anthracite figures.
Stocks of coal 2.40 Undistributed stocks are those held at collieries and surface mine sites. It is not possible to distinguish these two locations in the stock figures. Distributed stocks are those held at power stations and stocking grounds of the major power producing companies (as defined in Chapter 5, paragraphs 5.62 and 5.63), coke ovens, low temperature carbonisation plants and patent fuel plants.
Coke oven coke (hard coke), hard coke breeze and other manufactured fuels 2.41 The statistics cover coke produced at coke ovens owned by Corus plc, Coal Products Ltd and other producers. Low temperature carbonisation plants are not included (see paragraph 2.39). Breeze (as defined in paragraph 2.42) is excluded from the figures for coke oven coke. 2.42 Breeze can generally be described as coke screened below 19 mm (¾ inch) with no fines removed, but the screen size may vary in different areas and to meet the requirements of particular markets. Coke that has been transported from one location to another is usually re-screened before use to remove smaller sizes, giving rise to further breeze. 2.43 The coke screened out by producers as breeze and fines appears as transfers in the coke breeze column of the balances. Transfers out of coke oven coke have not always been equal to transfers into coke oven breeze. This was due to differences arising from the timing, location of measurement and the practice adopted by the iron and steel works. Since 2000, however, the Iron
50
and Steel Statistics Bureau have been able to reconcile these data. Since 2007, most of the supply of coke breeze was reclassified to coke oven coke following better information received by the Iron and Steel Statistics Bureau. 2.44 Figures are derived from returns made to HM Revenue and Customs and are broken down in greater detail in Annex G on the BEIS section of the GOV.UK website at: www.gov.uk/government/collections/digest-of-uk-energy-statistics-dukes. 2.45 In Table 2.5, the export figures used for hard coke, coke breeze and other manufactured solid fuels for the years before 1998 (as reported on the BEIS web site) are quantities of fuel exported as reported to BEIS or its predecessor Departments by the companies concerned, rather than quantities recorded by HM Revenue and Customs in their Trade Statistics. A long-term trend commentary and tables on exports are on the BEIS section of the GOV.UK website at: www.gov.uk/government/collections/digest-of-uk-energy-statistics-dukes. 2.46 In 1998, an assessment using industry data showed that on average over the previous five years 91 per cent of imports had been coke and 9 per cent breeze and it is these proportions that have been used for 1998 and subsequent years in Table 2.5. 2.47 The calorific value for coke breeze has been set the same as for coke oven coke. This is following information from the iron and steel industry on the similarities between the two types of manufactured fuels. 2.48 Imports and exports of manufactured smokeless fuels can contain small quantities of non-smokeless fuels. 2.49 Other manufactured solid fuels are mainly solid smokeless fuels for the domestic market for use in both open fires and in boilers. A smaller quantity is exported (although exports are largely offset by similar quantities of imports in most years). Manufacture takes place in patented fuel plants and low-temperature carbonisation plants. The brand names used for these fuels include Homefire, Phurnacite, Ancit and Coalite. 2.50 Consumption of coke and other manufactured solid fuels: These are disposals from coke ovens to merchants. The figures also include estimated proportions of coke imports.
Blast furnace gas, coke oven gas, benzole and tars 2.51 The following definitions are used in the tables that include these fuels: (a) Blast furnace gas: includes Basic Oxygen Steel furnace (BOS) gas. Blast furnace gas is the gas produced during iron ore smelting when hot air passes over coke within the blast ovens. It contains carbon monoxide, carbon dioxide, hydrogen and nitrogen. In a BOS furnace the aim is not to introduce nitrogen or hydrogen into the steel making process, so pure oxygen gas and suitable fluxes are used to remove the carbon and phosphorous from the molten pig iron and steel scrap. A similar fuel gas is thus produced. (b) Coke oven gas: is a gas produced during the carbonisation of coal to form coke at coke ovens. In 2009, some coke oven gas was produced using a combination of gases other than natural gas and blast furnace gas. This total has been added to the production of coke oven gas rather than transfers because it is specifically defined as the mixture of natural gas, blast furnace gas and BOS gas. See the paragraph below on synthetic coke oven gas for a complete definition of this. (c) Synthetic coke oven gas: is mainly natural gas that is mixed with smaller amounts of blast furnace and BOS gas to produce a gas with almost the same qualities as coke oven gas. The transfers row of Table 2.6 shows the quantities of blast furnace gas used for this purpose and the total input of gases to the synthetic coke oven gas process. There is a corresponding outward transfer from natural gas in Chapter 4, Table 4.1. (d) Benzole: a colourless, liquid, flammable, aromatic hydrocarbon by-product of the iron and steel making process. It is used in the UK as a solvent in the manufacture of styrenes and phenols. All consumption of benzole has been allocated to non-energy use from 2009 onwards.

51
(e) Tars: viscous materials usually derived from the destructive distillation of coal, which are by-products of the coke and iron making processes. . All consumption of tars has been allocated to non-energy use from 2009 onwards. Contact: Chris Michaels
Energy Statistics Team [email protected] 0300 068 5050
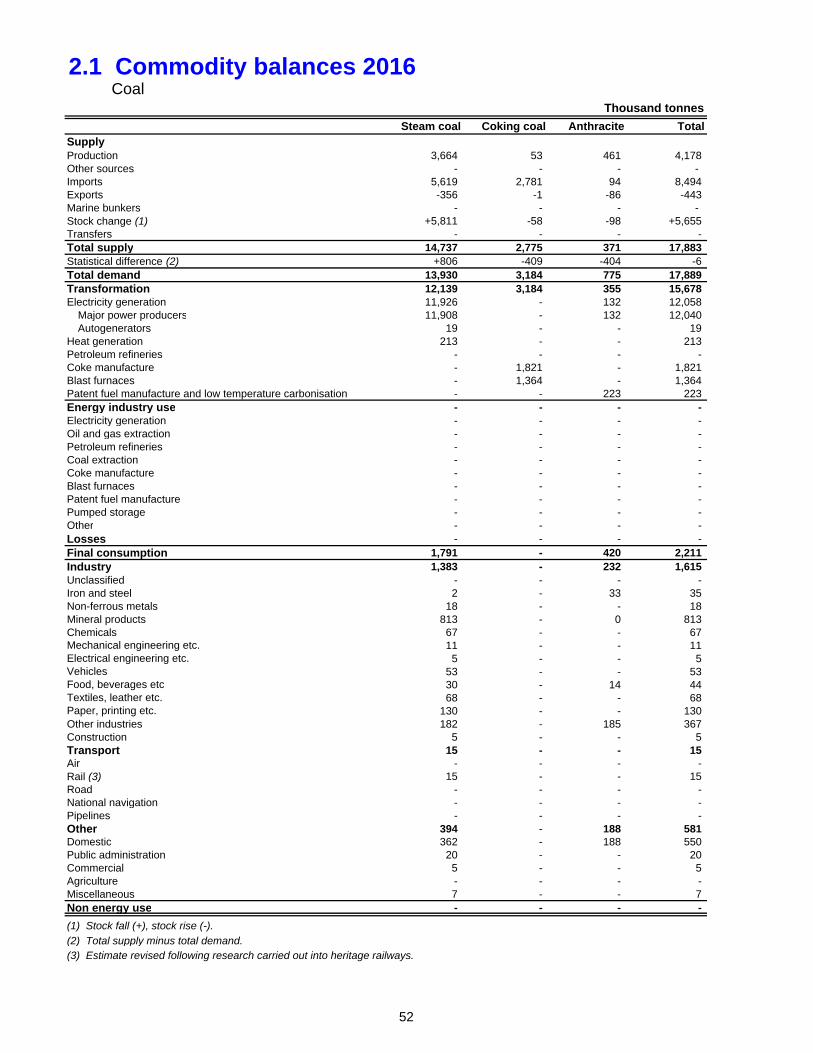
2.1 Commodity balances 2016Coal
Steam coal Coking coal Anthracite TotalSupplyProduction 3,664 53 461 4,178 Other sources - - - - Imports 5,619 2,781 94 8,494 Exports -356 -1 -86 -443 Marine bunkers - - - - Stock change (1) +5,811 -58 -98 +5,655 Transfers - - - - Total supply 14,737 2,775 371 17,883 Statistical difference (2) +806 -409 -404 -6 Total demand 13,930 3,184 775 17,889 Transformation 12,139 3,184 355 15,678 Electricity generation 11,926 - 132 12,058
Major power producers 11,908 - 132 12,040 Autogenerators 19 - - 19
Heat generation 213 - - 213 Petroleum refineries - - - - Coke manufacture - 1,821 - 1,821 Blast furnaces - 1,364 - 1,364 Patent fuel manufacture and low temperature carbonisation - - 223 223 Energy industry use - - - - Electricity generation - - - - Oil and gas extraction - - - - Petroleum refineries - - - - Coal extraction - - - - Coke manufacture - - - - Blast furnaces - - - - Patent fuel manufacture - - - - Pumped storage - - - - Other - - - - Losses - - - - Final consumption 1,791 - 420 2,211 Industry 1,383 - 232 1,615 Unclassified - - - - Iron and steel 2 - 33 35 Non-ferrous metals 18 - - 18 Mineral products 813 - 0 813 Chemicals 67 - - 67 Mechanical engineering etc. 11 - - 11 Electrical engineering etc. 5 - - 5 Vehicles 53 - - 53 Food, beverages etc 30 - 14 44 Textiles, leather etc. 68 - - 68 Paper, printing etc. 130 - - 130 Other industries 182 - 185 367 Construction 5 - - 5 Transport 15 - - 15 Air - - - - Rail (3) 15 - - 15 Road - - - - National navigation - - - - Pipelines - - - - Other 394 - 188 581 Domestic 362 - 188 550 Public administration 20 - - 20 Commercial 5 - - 5 Agriculture - - - - Miscellaneous 7 - - 7 Non energy use - - - -
(1) Stock fall (+), stock rise (-).
(2) Total supply minus total demand.(3) Estimate revised following research carried out into heritage railways.
Thousand tonnes
52
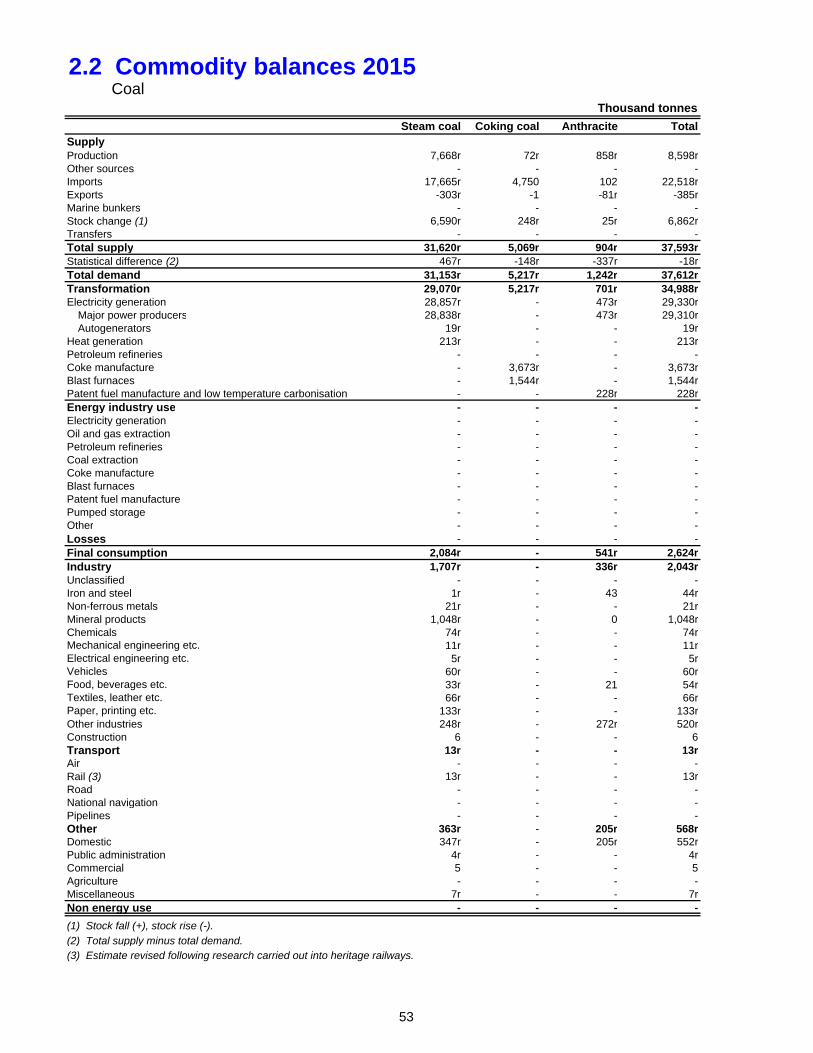
2.2 Commodity balances 2015Coal
Steam coal Coking coal Anthracite TotalSupplyProduction 7,668r 72r 858r 8,598rOther sources - - - -Imports 17,665r 4,750 102 22,518rExports -303r -1 -81r -385rMarine bunkers - - - -Stock change (1) 6,590r 248r 25r 6,862rTransfers - - - -Total supply 31,620r 5,069r 904r 37,593rStatistical difference (2) 467r -148r -337r -18rTotal demand 31,153r 5,217r 1,242r 37,612rTransformation 29,070r 5,217r 701r 34,988rElectricity generation 28,857r - 473r 29,330r
Major power producers 28,838r - 473r 29,310rAutogenerators 19r - - 19r
Heat generation 213r - - 213rPetroleum refineries - - - -Coke manufacture - 3,673r - 3,673rBlast furnaces - 1,544r - 1,544rPatent fuel manufacture and low temperature carbonisation - - 228r 228rEnergy industry use - - - -Electricity generation - - - -Oil and gas extraction - - - -Petroleum refineries - - - -Coal extraction - - - -Coke manufacture - - - -Blast furnaces - - - -Patent fuel manufacture - - - -Pumped storage - - - -Other - - - -Losses - - - -Final consumption 2,084r - 541r 2,624rIndustry 1,707r - 336r 2,043rUnclassified - - - -Iron and steel 1r - 43 44rNon-ferrous metals 21r - - 21rMineral products 1,048r - 0 1,048rChemicals 74r - - 74rMechanical engineering etc. 11r - - 11rElectrical engineering etc. 5r - - 5rVehicles 60r - - 60rFood, beverages etc. 33r - 21 54rTextiles, leather etc. 66r - - 66rPaper, printing etc. 133r - - 133rOther industries 248r - 272r 520rConstruction 6 - - 6Transport 13r - - 13rAir - - - -Rail (3) 13r - - 13rRoad - - - -National navigation - - - -Pipelines - - - -Other 363r - 205r 568rDomestic 347r - 205r 552rPublic administration 4r - - 4rCommercial 5 - - 5Agriculture - - - -Miscellaneous 7r - - 7rNon energy use - - - -
(1) Stock fall (+), stock rise (-).
(2) Total supply minus total demand.(3) Estimate revised following research carried out into heritage railways.
Thousand tonnes
53
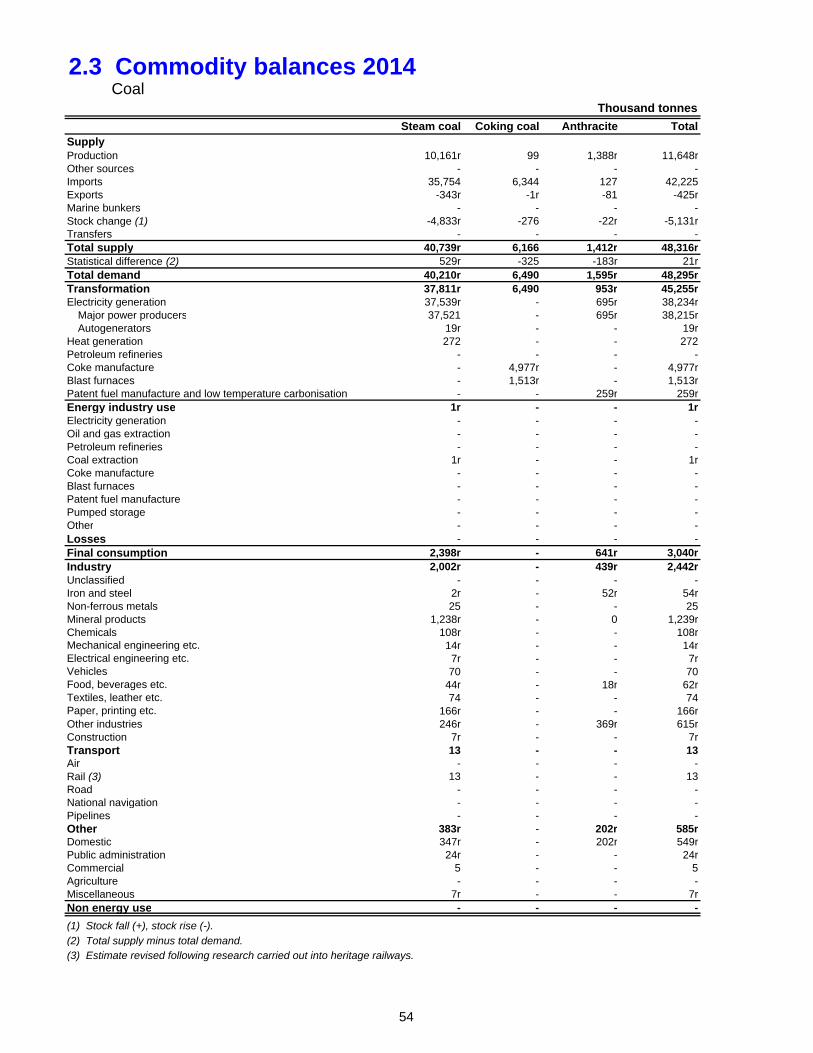
2.3 Commodity balances 2014Coal
Steam coal Coking coal Anthracite TotalSupplyProduction 10,161r 99 1,388r 11,648rOther sources - - - -Imports 35,754 6,344 127 42,225Exports -343r -1r -81 -425rMarine bunkers - - - -Stock change (1) -4,833r -276 -22r -5,131rTransfers - - - -Total supply 40,739r 6,166 1,412r 48,316rStatistical difference (2) 529r -325 -183r 21rTotal demand 40,210r 6,490 1,595r 48,295rTransformation 37,811r 6,490 953r 45,255rElectricity generation 37,539r - 695r 38,234r
Major power producers 37,521 - 695r 38,215rAutogenerators 19r - - 19r
Heat generation 272 - - 272Petroleum refineries - - - -Coke manufacture - 4,977r - 4,977rBlast furnaces - 1,513r - 1,513rPatent fuel manufacture and low temperature carbonisation - - 259r 259rEnergy industry use 1r - - 1rElectricity generation - - - -Oil and gas extraction - - - -Petroleum refineries - - - -Coal extraction 1r - - 1rCoke manufacture - - - -Blast furnaces - - - -Patent fuel manufacture - - - -Pumped storage - - - -Other - - - -Losses - - - -Final consumption 2,398r - 641r 3,040rIndustry 2,002r - 439r 2,442rUnclassified - - - -Iron and steel 2r - 52r 54rNon-ferrous metals 25 - - 25Mineral products 1,238r - 0 1,239rChemicals 108r - - 108rMechanical engineering etc. 14r - - 14rElectrical engineering etc. 7r - - 7rVehicles 70 - - 70Food, beverages etc. 44r - 18r 62rTextiles, leather etc. 74 - - 74Paper, printing etc. 166r - - 166rOther industries 246r - 369r 615rConstruction 7r - - 7rTransport 13 - - 13Air - - - -Rail (3) 13 - - 13Road - - - -National navigation - - - -Pipelines - - - -Other 383r - 202r 585rDomestic 347r - 202r 549rPublic administration 24r - - 24rCommercial 5 - - 5Agriculture - - - -Miscellaneous 7r - - 7rNon energy use - - - -
(1) Stock fall (+), stock rise (-).
(2) Total supply minus total demand.(3) Estimate revised following research carried out into heritage railways.
Thousand tonnes
54
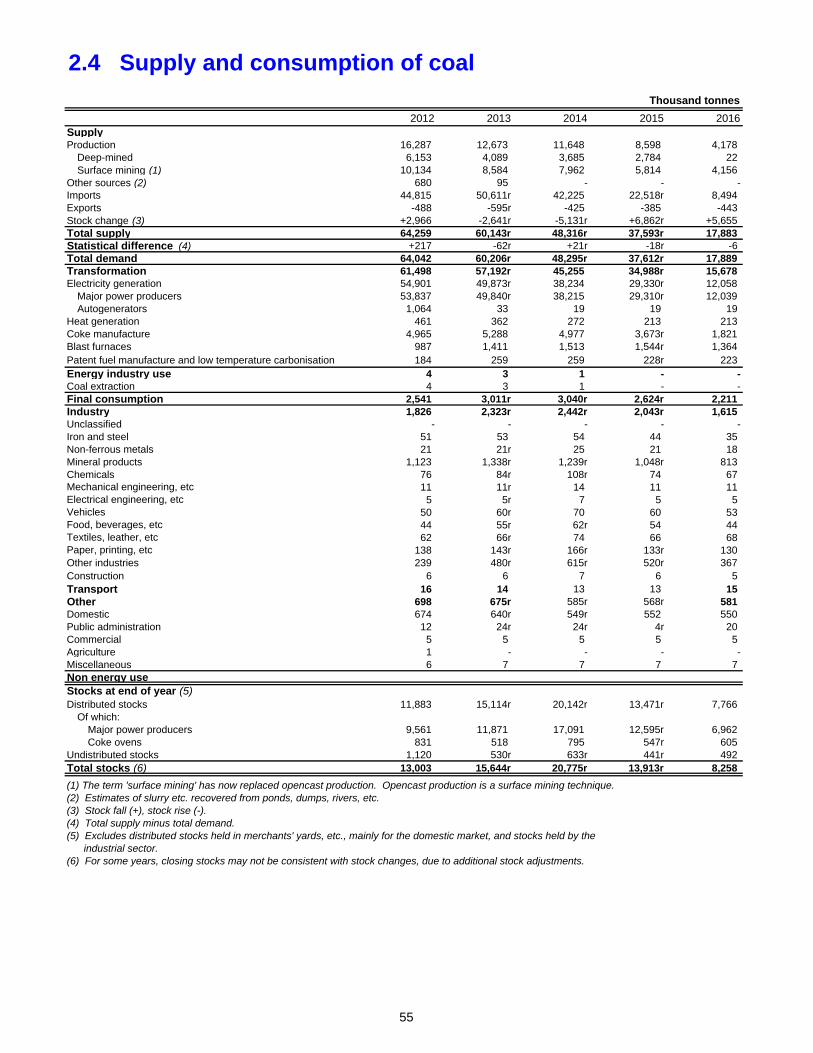
2.4 Supply and consumption of coal
Thousand tonnes
2012 2013 2014 2015 2016SupplyProduction 16,287 12,673 11,648 8,598 4,178
Deep-mined 6,153 4,089 3,685 2,784 22 Surface mining (1) 10,134 8,584 7,962 5,814 4,156
Other sources (2) 680 95 - - -Imports 44,815 50,611r 42,225 22,518r 8,494 Exports -488 -595r -425 -385 -443 Stock change (3) +2,966 -2,641r -5,131r +6,862r +5,655 Total supply 64,259 60,143r 48,316r 37,593r 17,883 Statistical difference (4) +217 -62r +21r -18r -6 Total demand 64,042 60,206r 48,295r 37,612r 17,889 Transformation 61,498 57,192r 45,255 34,988r 15,678 Electricity generation 54,901 49,873r 38,234 29,330r 12,058
Major power producers 53,837 49,840r 38,215 29,310r 12,039 Autogenerators 1,064 33 19 19 19
Heat generation 461 362 272 213 213 Coke manufacture 4,965 5,288 4,977 3,673r 1,821 Blast furnaces 987 1,411 1,513 1,544r 1,364 Patent fuel manufacture and low temperature carbonisation 184 259 259 228r 223 Energy industry use 4 3 1 - -Coal extraction 4 3 1 - -Final consumption 2,541 3,011r 3,040r 2,624r 2,211 Industry 1,826 2,323r 2,442r 2,043r 1,615 Unclassified - - - - -Iron and steel 51 53 54 44 35 Non-ferrous metals 21 21r 25 21 18 Mineral products 1,123 1,338r 1,239r 1,048r 813 Chemicals 76 84r 108r 74 67 Mechanical engineering, etc 11 11r 14 11 11 Electrical engineering, etc 5 5r 7 5 5 Vehicles 50 60r 70 60 53 Food, beverages, etc 44 55r 62r 54 44 Textiles, leather, etc 62 66r 74 66 68 Paper, printing, etc 138 143r 166r 133r 130 Other industries 239 480r 615r 520r 367 Construction 6 6 7 6 5 Transport 16 14 13 13 15 Other 698 675r 585r 568r 581 Domestic 674 640r 549r 552 550 Public administration 12 24r 24r 4r 20 Commercial 5 5 5 5 5 Agriculture 1 - - - -Miscellaneous 6 7 7 7 7 Non energy useStocks at end of year (5)Distributed stocks 11,883 15,114r 20,142r 13,471r 7,766
Of which:Major power producers 9,561 11,871 17,091 12,595r 6,962 Coke ovens 831 518 795 547r 605
Undistributed stocks 1,120 530r 633r 441r 492 Total stocks (6) 13,003 15,644r 20,775r 13,913r 8,258
(1) The term 'surface mining' has now replaced opencast production. Opencast production is a surface mining technique.(2) Estimates of slurry etc. recovered from ponds, dumps, rivers, etc.(3) Stock fall (+), stock rise (-).(4) Total supply minus total demand.(5) Excludes distributed stocks held in merchants' yards, etc., mainly for the domestic market, and stocks held by the industrial sector.(6) For some years, closing stocks may not be consistent with stock changes, due to additional stock adjustments.
55
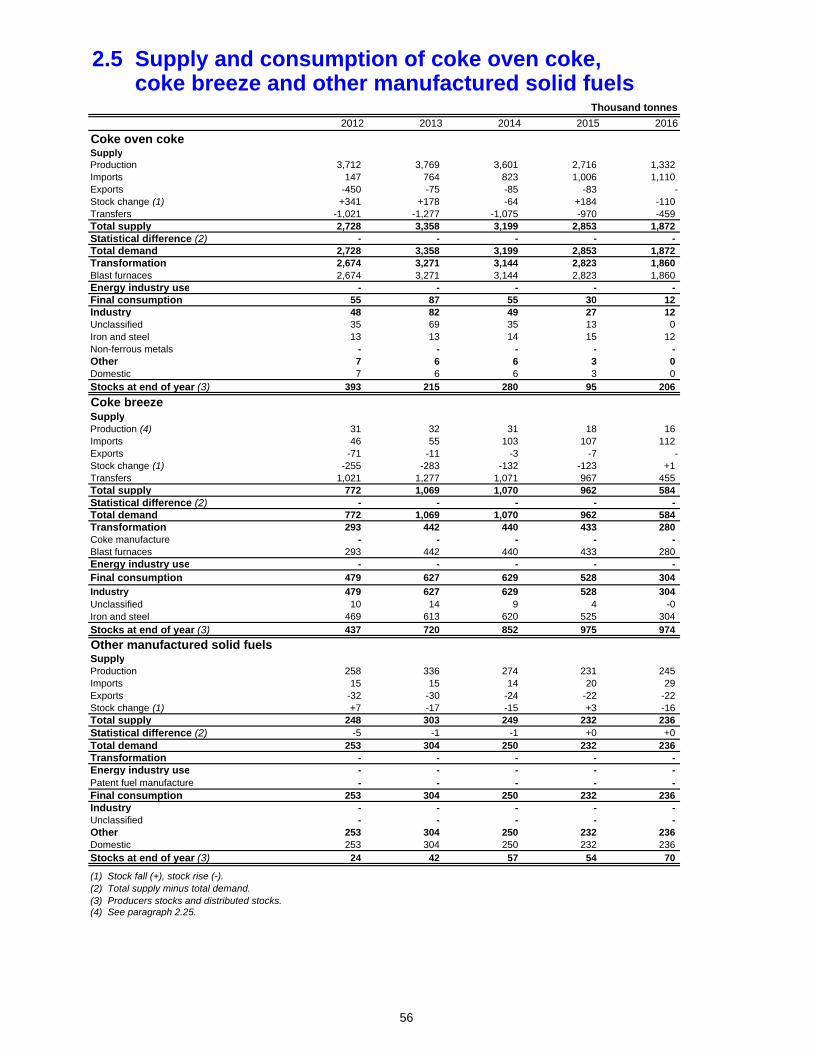
2.5 Supply and consumption of coke oven coke, coke breeze and other manufactured solid fuels
Thousand tonnes
2012 2013 2014 2015 2016
Coke oven cokeSupplyProduction 3,712 3,769 3,601 2,716 1,332 Imports 147 764 823 1,006 1,110 Exports -450 -75 -85 -83 -Stock change (1) +341 +178 -64 +184 -110 Transfers -1,021 -1,277 -1,075 -970 -459 Total supply 2,728 3,358 3,199 2,853 1,872 Statistical difference (2) - - - - - Total demand 2,728 3,358 3,199 2,853 1,872 Transformation 2,674 3,271 3,144 2,823 1,860 Blast furnaces 2,674 3,271 3,144 2,823 1,860 Energy industry use - - - - - Final consumption 55 87 55 30 12 Industry 48 82 49 27 12 Unclassified 35 69 35 13 0 Iron and steel 13 13 14 15 12 Non-ferrous metals - - - - - Other 7 6 6 3 0 Domestic 7 6 6 3 0 Stocks at end of year (3) 393 215 280 95 206
Coke breezeSupplyProduction (4) 31 32 31 18 16 Imports 46 55 103 107 112 Exports -71 -11 -3 -7 -Stock change (1) -255 -283 -132 -123 +1 Transfers 1,021 1,277 1,071 967 455 Total supply 772 1,069 1,070 962 584 Statistical difference (2) - - - - - Total demand 772 1,069 1,070 962 584 Transformation 293 442 440 433 280 Coke manufacture - - - - - Blast furnaces 293 442 440 433 280 Energy industry use - - - - -
Final consumption 479 627 629 528 304
Industry 479 627 629 528 304 Unclassified 10 14 9 4 -0 Iron and steel 469 613 620 525 304 Stocks at end of year (3) 437 720 852 975 974
Other manufactured solid fuelsSupplyProduction 258 336 274 231 245 Imports 15 15 14 20 29 Exports -32 -30 -24 -22 -22 Stock change (1) +7 -17 -15 +3 -16 Total supply 248 303 249 232 236 Statistical difference (2) -5 -1 -1 +0 +0 Total demand 253 304 250 232 236 Transformation - - - - - Energy industry use - - - - - Patent fuel manufacture - - - - - Final consumption 253 304 250 232 236 Industry - - - - - Unclassified - - - - - Other 253 304 250 232 236 Domestic 253 304 250 232 236 Stocks at end of year (3) 24 42 57 54 70
(1) Stock fall (+), stock rise (-).(2) Total supply minus total demand.(3) Producers stocks and distributed stocks.(4) See paragraph 2.25.
56
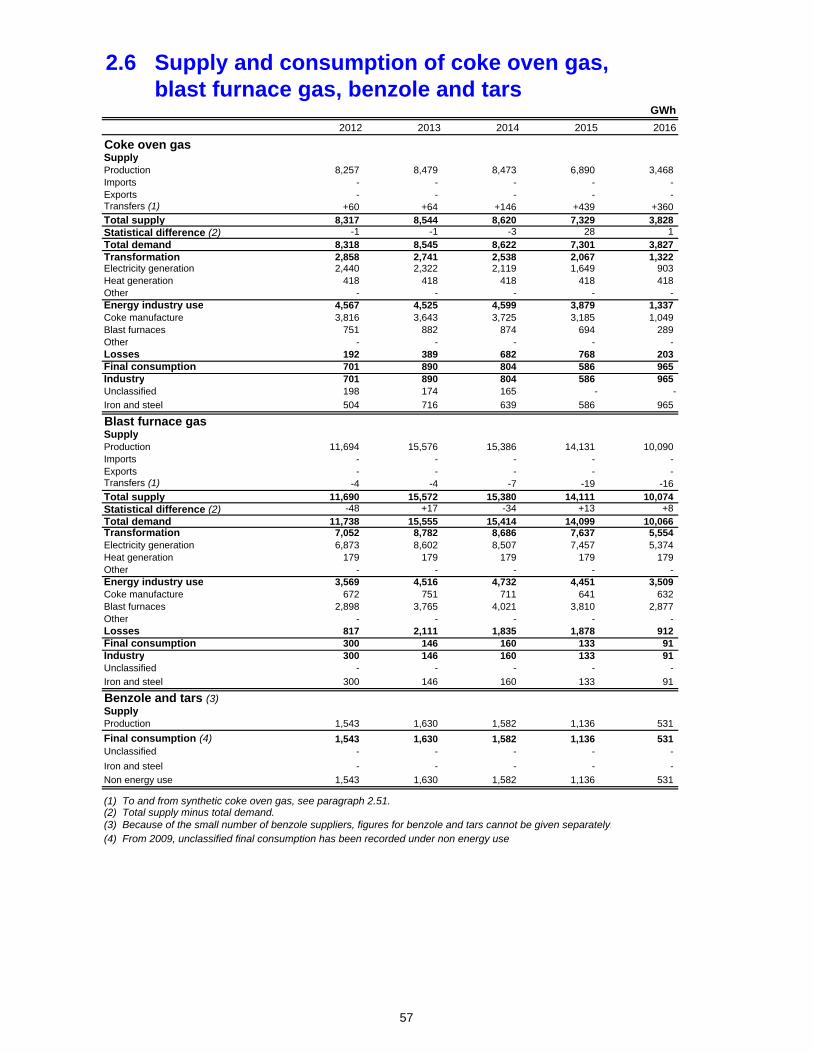
2.6 Supply and consumption of coke oven gas, blast furnace gas, benzole and tars
GWh
2012 2013 2014 2015 2016
Coke oven gasSupplyProduction 8,257 8,479 8,473 6,890 3,468 Imports - - - - - Exports - - - - - Transfers (1) +60 +64 +146 +439 +360 Total supply 8,317 8,544 8,620 7,329 3,828 Statistical difference (2) -1 -1 -3 28 1 Total demand 8,318 8,545 8,622 7,301 3,827 Transformation 2,858 2,741 2,538 2,067 1,322 Electricity generation 2,440 2,322 2,119 1,649 903 Heat generation 418 418 418 418 418 Other - - - - - Energy industry use 4,567 4,525 4,599 3,879 1,337 Coke manufacture 3,816 3,643 3,725 3,185 1,049 Blast furnaces 751 882 874 694 289 Other - - - - - Losses 192 389 682 768 203 Final consumption 701 890 804 586 965 Industry 701 890 804 586 965 Unclassified 198 174 165 - -
Iron and steel 504 716 639 586 965
Blast furnace gasSupplyProduction 11,694 15,576 15,386 14,131 10,090 Imports - - - - - Exports - - - - - Transfers (1) -4 -4 -7 -19 -16 Total supply 11,690 15,572 15,380 14,111 10,074 Statistical difference (2) -48 +17 -34 +13 +8 Total demand 11,738 15,555 15,414 14,099 10,066 Transformation 7,052 8,782 8,686 7,637 5,554 Electricity generation 6,873 8,602 8,507 7,457 5,374 Heat generation 179 179 179 179 179 Other - - - - - Energy industry use 3,569 4,516 4,732 4,451 3,509 Coke manufacture 672 751 711 641 632 Blast furnaces 2,898 3,765 4,021 3,810 2,877 Other - - - - - Losses 817 2,111 1,835 1,878 912 Final consumption 300 146 160 133 91 Industry 300 146 160 133 91 Unclassified - - - - -
Iron and steel 300 146 160 133 91
Benzole and tars (3)SupplyProduction 1,543 1,630 1,582 1,136 531
Final consumption (4) 1,543 1,630 1,582 1,136 531 Unclassified - - - - -
Iron and steel - - - - -
Non energy use 1,543 1,630 1,582 1,136 531
(1) To and from synthetic coke oven gas, see paragraph 2.51.(2) Total supply minus total demand.(3) Because of the small number of benzole suppliers, figures for benzole and tars cannot be given separately.(4) From 2009, unclassified final consumption has been recorded under non energy use
57
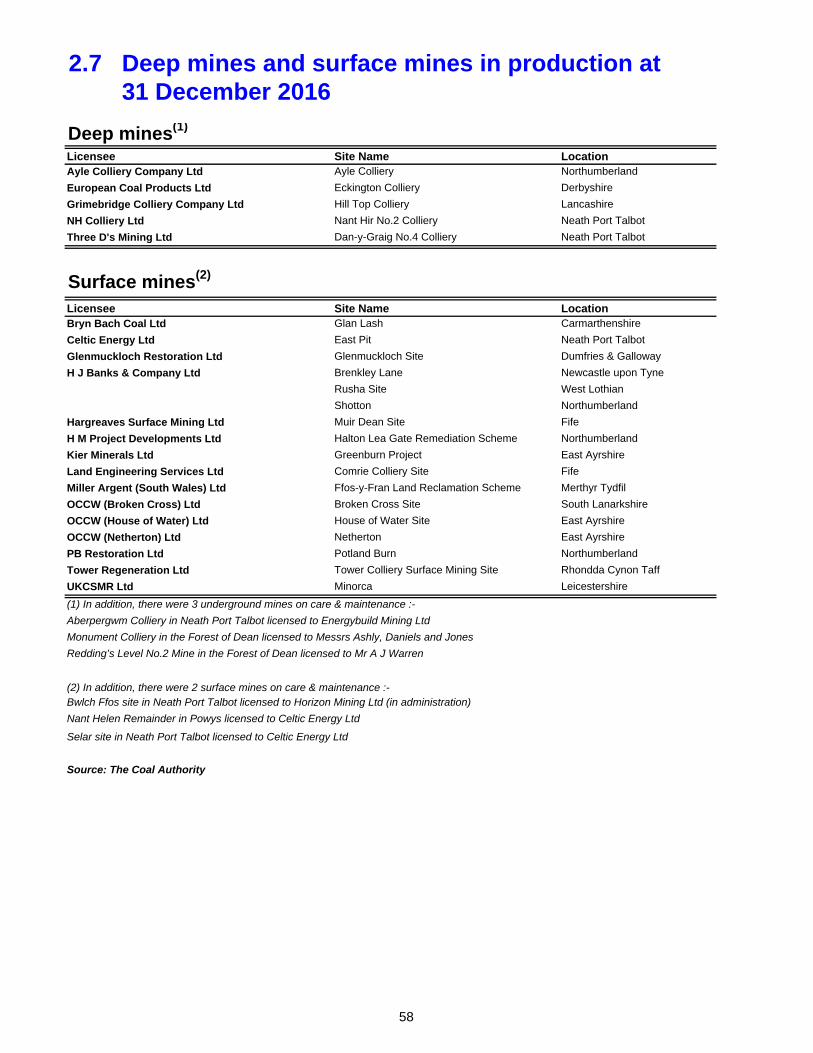
2.7 Deep mines and surface mines in production at 31 December 2016
Deep mines(1)
Licensee Site Name LocationAyle Colliery Company Ltd Ayle Colliery Northumberland
European Coal Products Ltd Eckington Colliery Derbyshire
Grimebridge Colliery Company Ltd Hill Top Colliery Lancashire
NH Colliery Ltd Nant Hir No.2 Colliery Neath Port Talbot
Three D's Mining Ltd Dan-y-Graig No.4 Colliery Neath Port Talbot
Surface mines(2)
Licensee Site Name LocationBryn Bach Coal Ltd Glan Lash Carmarthenshire
Celtic Energy Ltd East Pit Neath Port Talbot
Glenmuckloch Restoration Ltd Glenmuckloch Site Dumfries & Galloway
H J Banks & Company Ltd Brenkley Lane Newcastle upon Tyne
Rusha Site West Lothian
Shotton Northumberland
Hargreaves Surface Mining Ltd Muir Dean Site Fife
H M Project Developments Ltd Halton Lea Gate Remediation Scheme Northumberland
Kier Minerals Ltd Greenburn Project East Ayrshire
Land Engineering Services Ltd Comrie Colliery Site Fife
Miller Argent (South Wales) Ltd Ffos-y-Fran Land Reclamation Scheme Merthyr Tydfil
OCCW (Broken Cross) Ltd Broken Cross Site South Lanarkshire
OCCW (House of Water) Ltd House of Water Site East Ayrshire
OCCW (Netherton) Ltd Netherton East Ayrshire
PB Restoration Ltd Potland Burn Northumberland
Tower Regeneration Ltd Tower Colliery Surface Mining Site Rhondda Cynon Taff
UKCSMR Ltd Minorca Leicestershire
(2) In addition, there were 2 surface mines on care & maintenance :-Bwlch Ffos site in Neath Port Talbot licensed to Horizon Mining Ltd (in administration)
Nant Helen Remainder in Powys licensed to Celtic Energy Ltd
Selar site in Neath Port Talbot licensed to Celtic Energy Ltd
Source: The Coal Authority
(1) In addition, there were 3 underground mines on care & maintenance :-
Aberpergwm Colliery in Neath Port Talbot licensed to Energybuild Mining Ltd
Monument Colliery in the Forest of Dean licensed to Messrs Ashly, Daniels and Jones
Redding’s Level No.2 Mine in the Forest of Dean licensed to Mr A J Warren
58
59
Chapter 3 Petroleum
Introduction 3.1 Petroleum forms a key part of the UK’s energy mix. Around 40 percent of the UK’s total energy production is from crude oils extracted from the UK’s Continental Shelf, and UK refineries produce around 60 million tonnes of oil products - the 4th largest in Europe. Consumer demand for transport fuels, heating fuels and for feedstocks to produce plastics and other products is around 67 million tonnes, over a third of the UK’s energy consumption. 3.2 The flow chart on the following page shows the movement of primary oils and petroleum products, illustrating how crude oils are supplied, transformed in refineries, and then consumed in the various sectors of the UK’s economy. The widths of the bands are proportional to the size of the flow they represent.
Key points
Production of crude oil and Natural Gas Liquids from the UK’s North Sea increased by 4.8 per cent in 2016, in contrast with the long-term decline. Production is around a third of the UK’s peak of 1999 (Table 3.1, Chart 3.1).
Net imports of primary oils decreased in 2016 due to increased production and because refineries were processing more indigenous crude. Exports increased by 1.1 million tonnes on 2015 and imports were down by nearly 2 million tonnes. (Table 3.1, Chart 3.1).
UK refinery production decreased 1.7 per cent to 59.9 million tonnes in 2016. Production was strong in 2015, however many refineries have reduced their distillation capacity in recent years and UK production was still around one-third lower than the peak at the turn of the century (Table 3.2, Chart 3.2).
The UK was a net importer of petroleum products in 2016 by more than 10 million tonnes, the highest such figure since the 1984 miner’s strike. Product exports were up 6.0 per cent on 2015 and imports increased by 8.5 per cent in 2016 (Table 3.2, Chart 3.2).
Refinery production does not meet demand for every product. Around 55 per cent of the UK’s demand for diesel is produced in the UK and around 40 per cent of jet fuel, whereas refineries continue to produce more than sufficient petrol to meet UK demand (Table 3.2).
The increase in consumption in 2016 of 1.8 per cent was lower than the 2.9 per cent seen in 2015. In each year these increases were largely driven by the use of oil for transport, though demand of oil products for use in petrochemical plants also increased (Table 3.2 to 3.4, Chart 3.2).
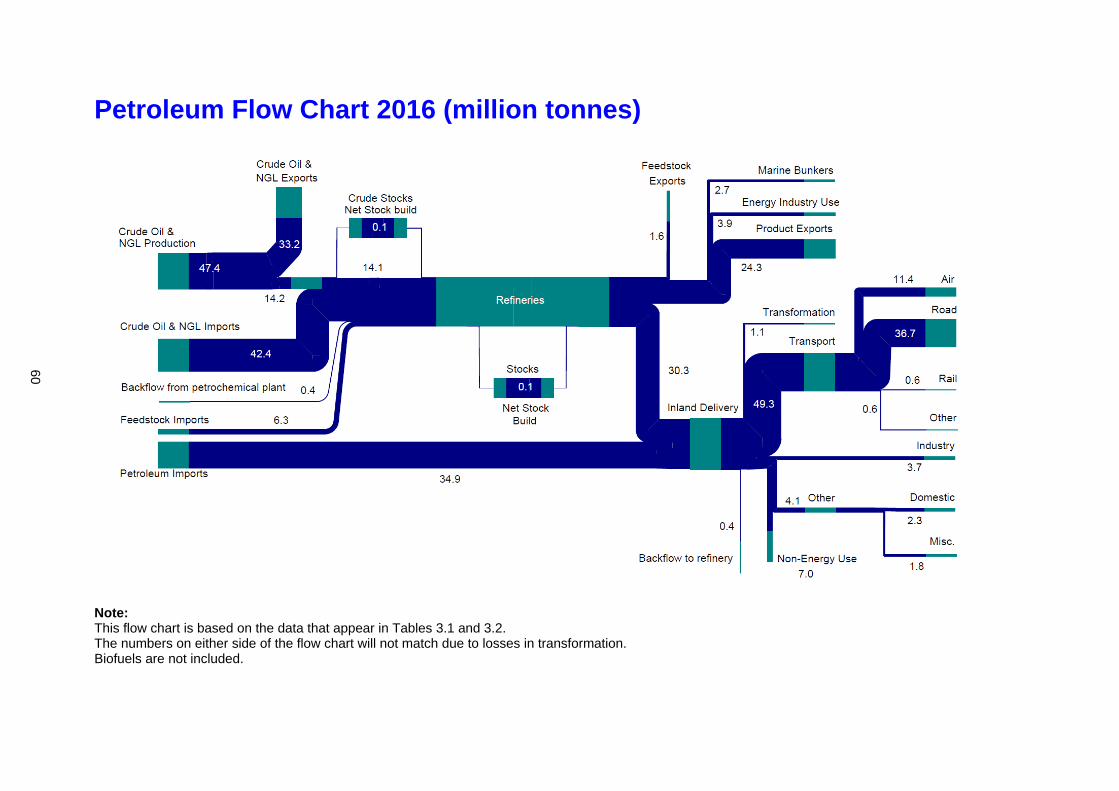
Petroleum Flow Chart 2016 (million tonnes)
Note: This flow chart is based on the data that appear in Tables 3.1 and 3.2. The numbers on either side of the flow chart will not match due to losses in transformation. Biofuels are not included.
60
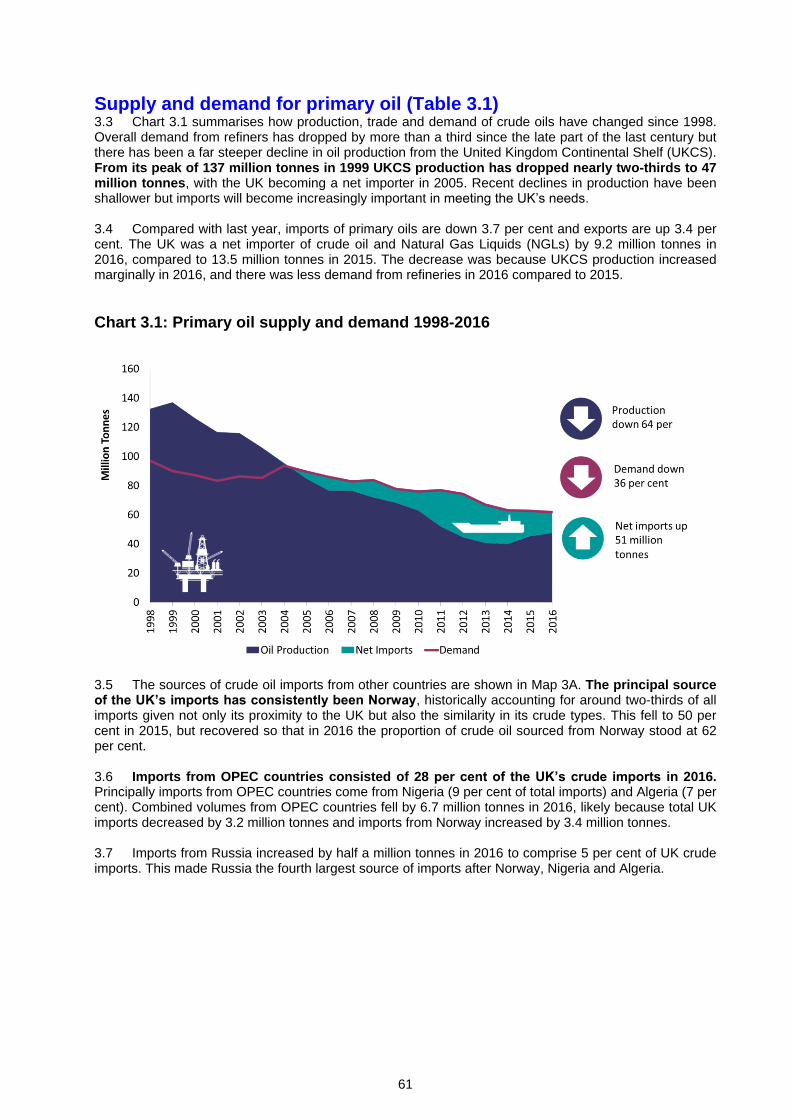
61
Supply and demand for primary oil (Table 3.1) 3.3 Chart 3.1 summarises how production, trade and demand of crude oils have changed since 1998. Overall demand from refiners has dropped by more than a third since the late part of the last century but there has been a far steeper decline in oil production from the United Kingdom Continental Shelf (UKCS). From its peak of 137 million tonnes in 1999 UKCS production has dropped nearly two-thirds to 47 million tonnes, with the UK becoming a net importer in 2005. Recent declines in production have been shallower but imports will become increasingly important in meeting the UK’s needs. 3.4 Compared with last year, imports of primary oils are down 3.7 per cent and exports are up 3.4 per cent. The UK was a net importer of crude oil and Natural Gas Liquids (NGLs) by 9.2 million tonnes in 2016, compared to 13.5 million tonnes in 2015. The decrease was because UKCS production increased marginally in 2016, and there was less demand from refineries in 2016 compared to 2015.
Chart 3.1: Primary oil supply and demand 1998-2016
3.5 The sources of crude oil imports from other countries are shown in Map 3A. The principal source of the UK’s imports has consistently been Norway, historically accounting for around two-thirds of all imports given not only its proximity to the UK but also the similarity in its crude types. This fell to 50 per cent in 2015, but recovered so that in 2016 the proportion of crude oil sourced from Norway stood at 62 per cent. 3.6 Imports from OPEC countries consisted of 28 per cent of the UK’s crude imports in 2016. Principally imports from OPEC countries come from Nigeria (9 per cent of total imports) and Algeria (7 per cent). Combined volumes from OPEC countries fell by 6.7 million tonnes in 2016, likely because total UK imports decreased by 3.2 million tonnes and imports from Norway increased by 3.4 million tonnes.
3.7 Imports from Russia increased by half a million tonnes in 2016 to comprise 5 per cent of UK crude imports. This made Russia the fourth largest source of imports after Norway, Nigeria and Algeria.
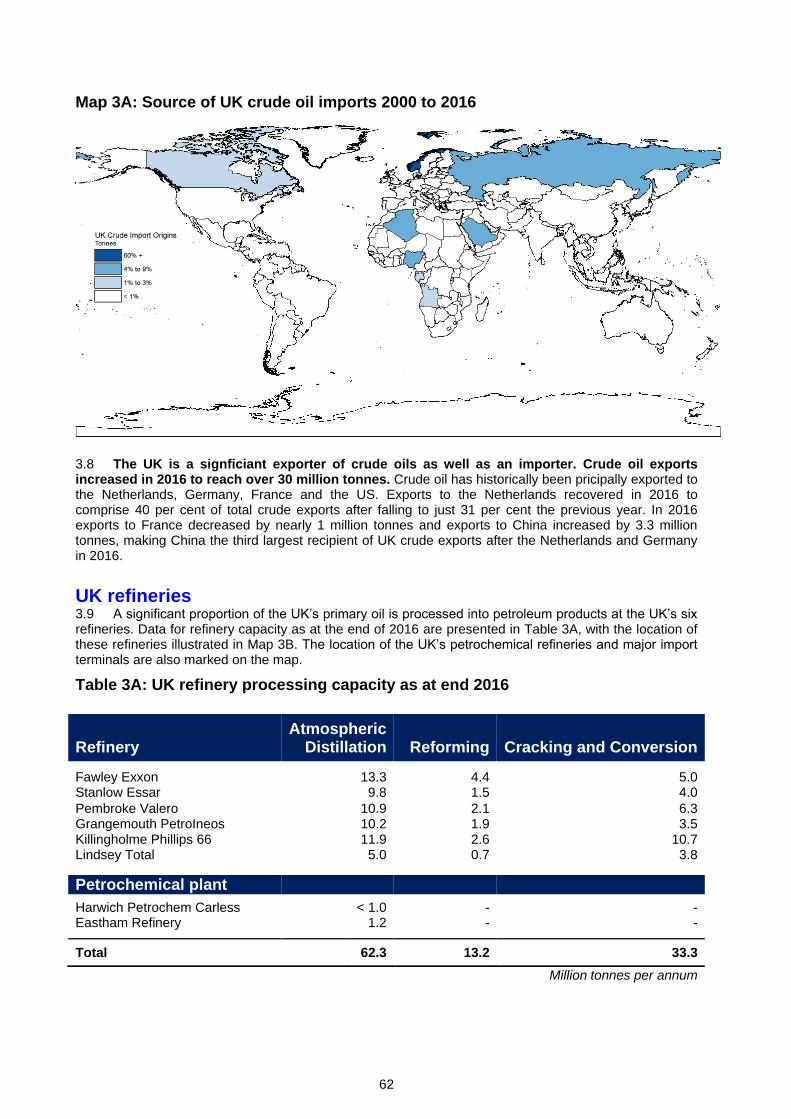
62
Map 3A: Source of UK crude oil imports 2000 to 2016
3.8 The UK is a signficiant exporter of crude oils as well as an importer. Crude oil exports increased in 2016 to reach over 30 million tonnes. Crude oil has historically been pricipally exported to the Netherlands, Germany, France and the US. Exports to the Netherlands recovered in 2016 to comprise 40 per cent of total crude exports after falling to just 31 per cent the previous year. In 2016 exports to France decreased by nearly 1 million tonnes and exports to China increased by 3.3 million tonnes, making China the third largest recipient of UK crude exports after the Netherlands and Germany in 2016.
UK refineries 3.9 A significant proportion of the UK’s primary oil is processed into petroleum products at the UK’s six refineries. Data for refinery capacity as at the end of 2016 are presented in Table 3A, with the location of these refineries illustrated in Map 3B. The location of the UK’s petrochemical refineries and major import terminals are also marked on the map.
Table 3A: UK refinery processing capacity as at end 2016
Million tonnes per annum
Refinery Atmospheric
Distillation Reforming Cracking and Conversion
Fawley Exxon 13.3 4.4 5.0 Stanlow Essar 9.8 1.5 4.0
Pembroke Valero 10.9 2.1 6.3 Grangemouth PetroIneos 10.2 1.9 3.5 Killingholme Phillips 66 11.9 2.6 10.7 Lindsey Total 5.0 0.7 3.8
Petrochemical plant
Harwich Petrochem Carless < 1.0 - - Eastham Refinery 1.2 - -
Total 62.3 13.2 33.3
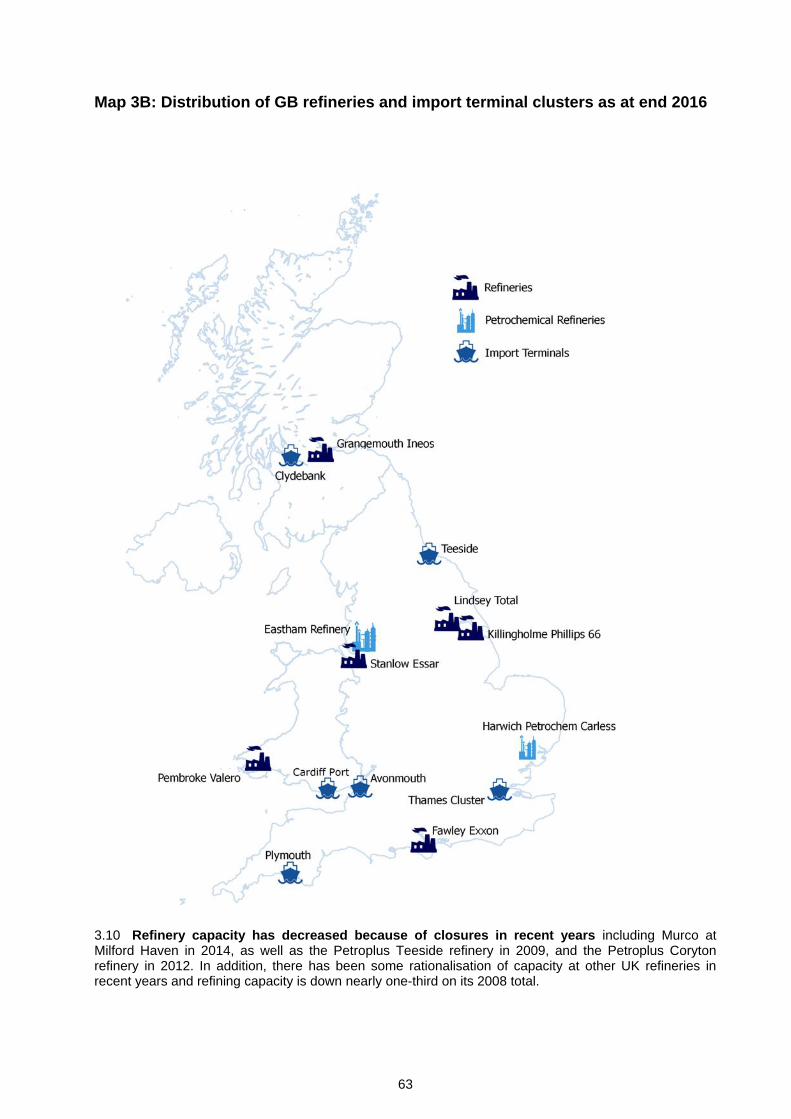
63
Map 3B: Distribution of GB refineries and import terminal clusters as at end 2016
3.10 Refinery capacity has decreased because of closures in recent years including Murco at Milford Haven in 2014, as well as the Petroplus Teeside refinery in 2009, and the Petroplus Coryton refinery in 2012. In addition, there has been some rationalisation of capacity at other UK refineries in recent years and refining capacity is down nearly one-third on its 2008 total.
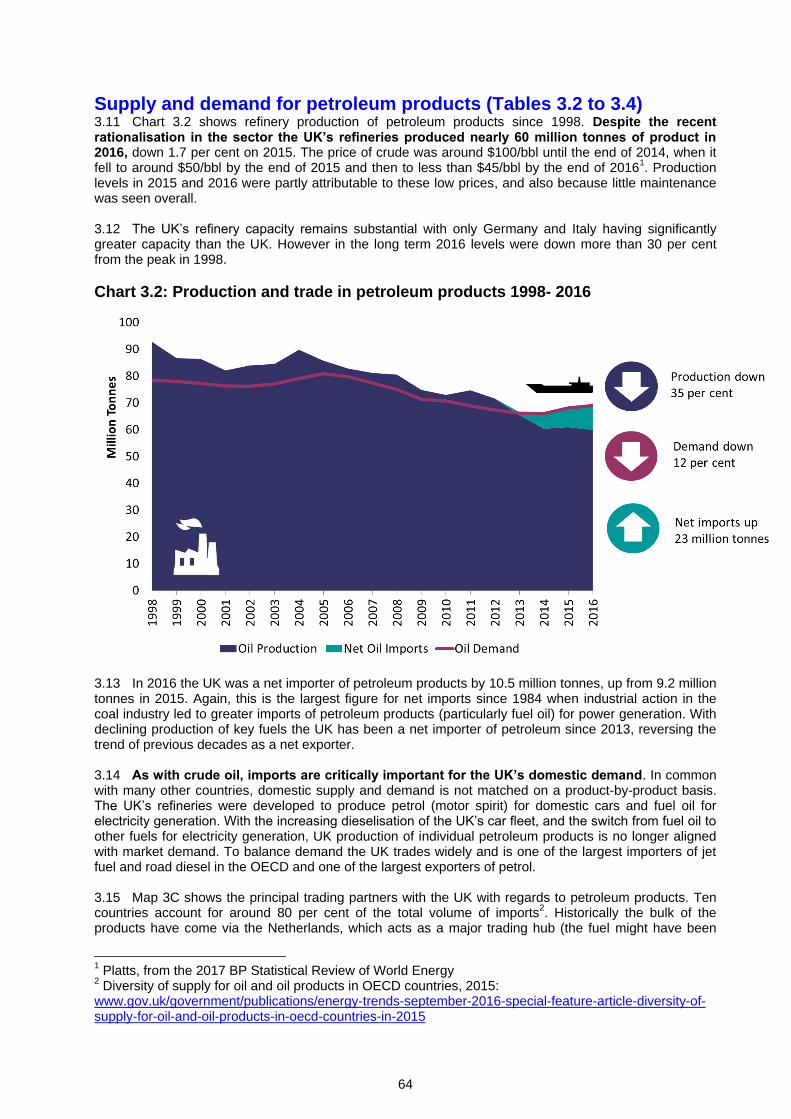
64
Supply and demand for petroleum products (Tables 3.2 to 3.4) 3.11 Chart 3.2 shows refinery production of petroleum products since 1998. Despite the recent rationalisation in the sector the UK’s refineries produced nearly 60 million tonnes of product in 2016, down 1.7 per cent on 2015. The price of crude was around $100/bbl until the end of 2014, when it fell to around $50/bbl by the end of 2015 and then to less than $45/bbl by the end of 2016
1. Production
levels in 2015 and 2016 were partly attributable to these low prices, and also because little maintenance was seen overall. 3.12 The UK’s refinery capacity remains substantial with only Germany and Italy having significantly greater capacity than the UK. However in the long term 2016 levels were down more than 30 per cent from the peak in 1998.
Chart 3.2: Production and trade in petroleum products 1998- 2016
3.13 In 2016 the UK was a net importer of petroleum products by 10.5 million tonnes, up from 9.2 million tonnes in 2015. Again, this is the largest figure for net imports since 1984 when industrial action in the coal industry led to greater imports of petroleum products (particularly fuel oil) for power generation. With declining production of key fuels the UK has been a net importer of petroleum since 2013, reversing the trend of previous decades as a net exporter. 3.14 As with crude oil, imports are critically important for the UK’s domestic demand. In common with many other countries, domestic supply and demand is not matched on a product-by-product basis. The UK’s refineries were developed to produce petrol (motor spirit) for domestic cars and fuel oil for electricity generation. With the increasing dieselisation of the UK’s car fleet, and the switch from fuel oil to other fuels for electricity generation, UK production of individual petroleum products is no longer aligned with market demand. To balance demand the UK trades widely and is one of the largest importers of jet fuel and road diesel in the OECD and one of the largest exporters of petrol.
3.15 Map 3C shows the principal trading partners with the UK with regards to petroleum products. Ten countries account for around 80 per cent of the total volume of imports
2. Historically the bulk of the
products have come via the Netherlands, which acts as a major trading hub (the fuel might have been
1 Platts, from the 2017 BP Statistical Review of World Energy
2 Diversity of supply for oil and oil products in OECD countries, 2015:
www.gov.uk/government/publications/energy-trends-september-2016-special-feature-article-diversity-of-supply-for-oil-and-oil-products-in-oecd-countries-in-2015
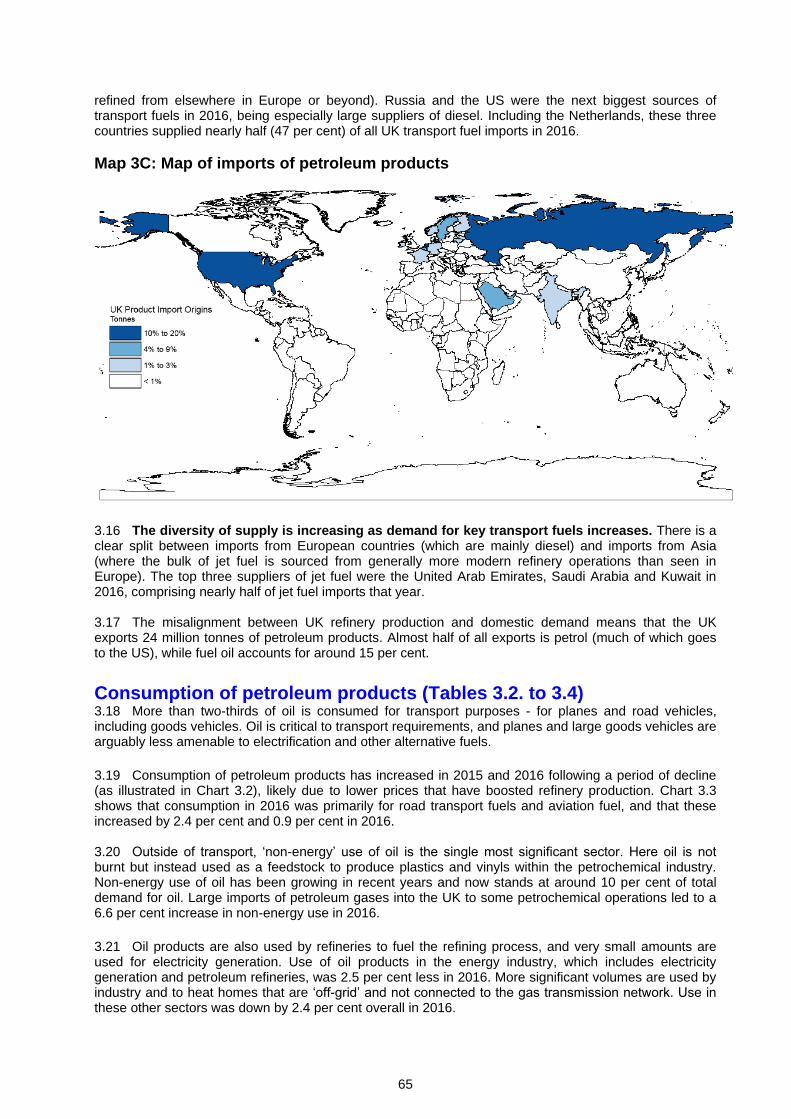
65
refined from elsewhere in Europe or beyond). Russia and the US were the next biggest sources of transport fuels in 2016, being especially large suppliers of diesel. Including the Netherlands, these three countries supplied nearly half (47 per cent) of all UK transport fuel imports in 2016.
Map 3C: Map of imports of petroleum products
3.16 The diversity of supply is increasing as demand for key transport fuels increases. There is a clear split between imports from European countries (which are mainly diesel) and imports from Asia (where the bulk of jet fuel is sourced from generally more modern refinery operations than seen in Europe). The top three suppliers of jet fuel were the United Arab Emirates, Saudi Arabia and Kuwait in 2016, comprising nearly half of jet fuel imports that year. 3.17 The misalignment between UK refinery production and domestic demand means that the UK exports 24 million tonnes of petroleum products. Almost half of all exports is petrol (much of which goes to the US), while fuel oil accounts for around 15 per cent.
Consumption of petroleum products (Tables 3.2. to 3.4) 3.18 More than two-thirds of oil is consumed for transport purposes - for planes and road vehicles, including goods vehicles. Oil is critical to transport requirements, and planes and large goods vehicles are arguably less amenable to electrification and other alternative fuels. 3.19 Consumption of petroleum products has increased in 2015 and 2016 following a period of decline (as illustrated in Chart 3.2), likely due to lower prices that have boosted refinery production. Chart 3.3 shows that consumption in 2016 was primarily for road transport fuels and aviation fuel, and that these increased by 2.4 per cent and 0.9 per cent in 2016.
3.20 Outside of transport, ‘non-energy’ use of oil is the single most significant sector. Here oil is not burnt but instead used as a feedstock to produce plastics and vinyls within the petrochemical industry. Non-energy use of oil has been growing in recent years and now stands at around 10 per cent of total demand for oil. Large imports of petroleum gases into the UK to some petrochemical operations led to a 6.6 per cent increase in non-energy use in 2016.
3.21 Oil products are also used by refineries to fuel the refining process, and very small amounts are used for electricity generation. Use of oil products in the energy industry, which includes electricity generation and petroleum refineries, was 2.5 per cent less in 2016. More significant volumes are used by industry and to heat homes that are ‘off-grid’ and not connected to the gas transmission network. Use in these other sectors was down by 2.4 per cent overall in 2016.
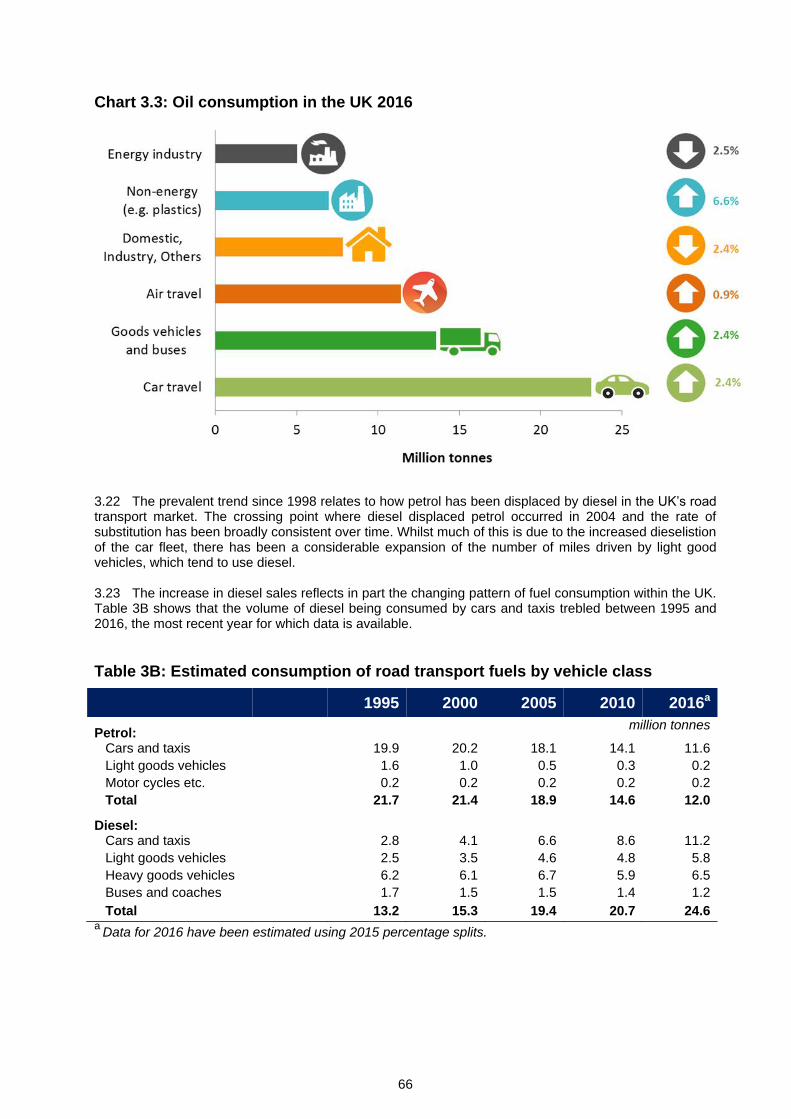
66
Chart 3.3: Oil consumption in the UK 2016
3.22 The prevalent trend since 1998 relates to how petrol has been displaced by diesel in the UK’s road transport market. The crossing point where diesel displaced petrol occurred in 2004 and the rate of substitution has been broadly consistent over time. Whilst much of this is due to the increased dieselistion of the car fleet, there has been a considerable expansion of the number of miles driven by light good vehicles, which tend to use diesel. 3.23 The increase in diesel sales reflects in part the changing pattern of fuel consumption within the UK. Table 3B shows that the volume of diesel being consumed by cars and taxis trebled between 1995 and 2016, the most recent year for which data is available.
Table 3B: Estimated consumption of road transport fuels by vehicle class
1995 2000 2005 2010 2016a
Petrol: million tonnes
Cars and taxis 19.9 20.2 18.1 14.1 11.6
Light goods vehicles 1.6 1.0 0.5 0.3 0.2
Motor cycles etc. 0.2 0.2 0.2 0.2 0.2
Total 21.7 21.4 18.9 14.6 12.0
Diesel: Cars and taxis 2.8 4.1 6.6 8.6 11.2
Light goods vehicles 2.5 3.5 4.6 4.8 5.8
Heavy goods vehicles 6.2 6.1 6.7 5.9 6.5
Buses and coaches 1.7 1.5 1.5 1.4 1.2
Total 13.2 15.3 19.4 20.7 24.6 a
Data for 2016 have been estimated using 2015 percentage splits.
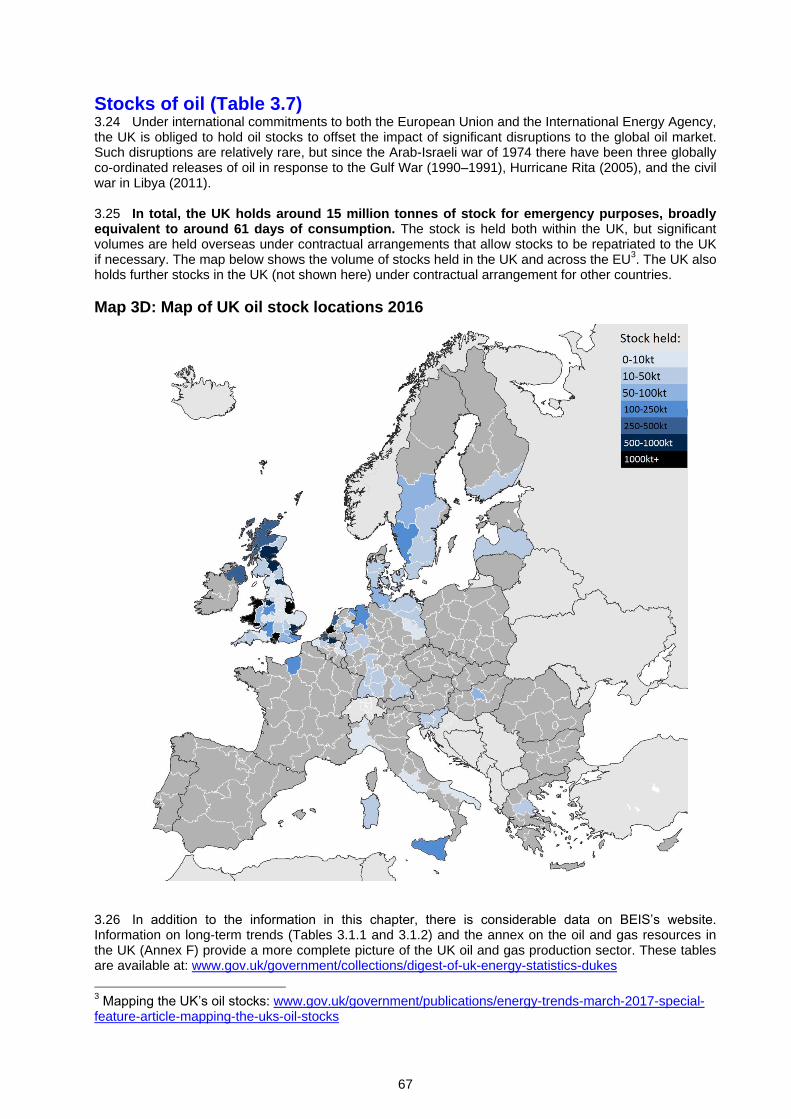
67
Stocks of oil (Table 3.7) 3.24 Under international commitments to both the European Union and the International Energy Agency, the UK is obliged to hold oil stocks to offset the impact of significant disruptions to the global oil market. Such disruptions are relatively rare, but since the Arab-Israeli war of 1974 there have been three globally co-ordinated releases of oil in response to the Gulf War (1990–1991), Hurricane Rita (2005), and the civil war in Libya (2011). 3.25 In total, the UK holds around 15 million tonnes of stock for emergency purposes, broadly equivalent to around 61 days of consumption. The stock is held both within the UK, but significant volumes are held overseas under contractual arrangements that allow stocks to be repatriated to the UK if necessary. The map below shows the volume of stocks held in the UK and across the EU
3. The UK also
holds further stocks in the UK (not shown here) under contractual arrangement for other countries.
Map 3D: Map of UK oil stock locations 2016
3.26 In addition to the information in this chapter, there is considerable data on BEIS’s website. Information on long-term trends (Tables 3.1.1 and 3.1.2) and the annex on the oil and gas resources in the UK (Annex F) provide a more complete picture of the UK oil and gas production sector. These tables are available at: www.gov.uk/government/collections/digest-of-uk-energy-statistics-dukes
3 Mapping the UK’s oil stocks: www.gov.uk/government/publications/energy-trends-march-2017-special-
feature-article-mapping-the-uks-oil-stocks
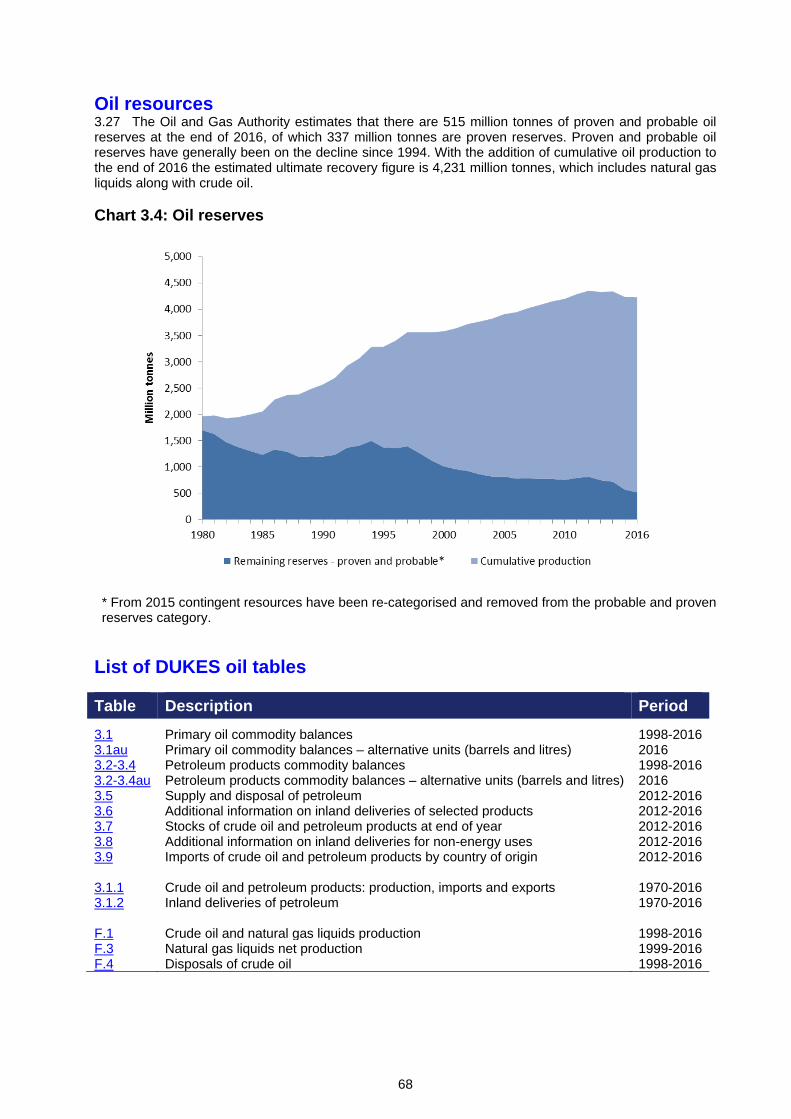
68
Oil resources 3.27 The Oil and Gas Authority estimates that there are 515 million tonnes of proven and probable oil reserves at the end of 2016, of which 337 million tonnes are proven reserves. Proven and probable oil reserves have generally been on the decline since 1994. With the addition of cumulative oil production to the end of 2016 the estimated ultimate recovery figure is 4,231 million tonnes, which includes natural gas liquids along with crude oil.
Chart 3.4: Oil reserves
* From 2015 contingent resources have been re-categorised and removed from the probable and proven reserves category.
List of DUKES oil tables
Table Description Period
3.1 Primary oil commodity balances 1998-2016 3.1au Primary oil commodity balances – alternative units (barrels and litres) 2016 3.2-3.4 Petroleum products commodity balances 1998-2016 3.2-3.4au Petroleum products commodity balances – alternative units (barrels and litres) 2016 3.5 Supply and disposal of petroleum 2012-2016 3.6 Additional information on inland deliveries of selected products 2012-2016 3.7 Stocks of crude oil and petroleum products at end of year 2012-2016 3.8 Additional information on inland deliveries for non-energy uses 2012-2016 3.9 Imports of crude oil and petroleum products by country of origin 2012-2016 3.1.1 Crude oil and petroleum products: production, imports and exports 1970-2016 3.1.2 Inland deliveries of petroleum 1970-2016 F.1 Crude oil and natural gas liquids production 1998-2016 F.3 Natural gas liquids net production 1999-2016 F.4 Disposals of crude oil 1998-2016
69
Technical notes and definitions 3.28 These notes and definitions are in addition to the technical notes and definitions covering all fuels and energy as a whole in Chapter 1.
Sources of data 3.29 The majority of the data included in the text and tables of this chapter are derived from BEIS’s Downstream Oil Reporting System (DORS), which replaced the UK Petroleum Industry Association (UKPIA) reporting system in 2005. Data relating to the inland operations of the UK oil industry (i.e. information on the supply, refining and distribution of oil in the UK) are collected from companies. The data format and coverage have been designed to meet most of the needs of both Government and the industry itself. Each member of UKPIA and a number of other contributing companies provides returns on its refining activities and deliveries of various products to the internal UK market. This information is supplemented whenever necessary to allow for complete coverage within the statistics, with separate exercises carried out on special topics (for example, supermarket shares) or with the use of additional data (such as trade data from HM Revenue and Customs (HMRC) to cover import activity by non-reporting companies). In addition to these data sources, BEIS make use of the Emissions data from the EU’s Emissions Trading Scheme provided on major energy users. In particular ensuring the consistency of data published on fuel used within the refineries (refinery gases and petroleum coke) and the sectoral usage of Gas oil and Fuel oil. 3.30 In 2014 BEIS introduced a new reporting form to major oil importers. The new form indicated the need for more detailed surveys of large importers within the UK and from January 2015 all major importers were obliged to complete the more detailed DORS form used by refiners. The DORS survey now offers substantially greater insight (particularly with respect to trade and blending activities).
Statistical differences 3.31 The upper half of the balance tables represents the supply side and calculates overall availability of the various products in the UK by combining production at refineries with trade (imports and exports), stock changes, product transfers and deliveries to international marine bunkers (fuel used by ships travelling to a foreign destination).
3.32 The lower half of the table reports the demand side and covers the uses made of the different products, including the use made within the refining process, and details of the amounts reported by oil companies within the UK as delivered for final consumption. 3.33 In Tables 3.1 to 3.5, there are headings titled “statistical differences”. These are differences between the separately observed figures for production and delivery of crude oil and products during the path of their movement from the point of production to the point of consumption. 3.34 The statistical differences headings listed in the primary oil commodity balances (Table 3.1) are differences between the separately observed and reported figures for production from onshore or offshore fields and supply to the UK market that cannot be accounted for by any specific factors. Primarily they result from inaccuracies in the meters at various points along offshore pipelines. These meters vary slightly in their accuracy within accepted tolerances, giving rise to both losses and gains when the volumes of oil flowing are measured. Errors may also occur when non-standard conditions are used to meter the oil flow. 3.35 The statistical difference for primary oils in the table includes own use in onshore terminals and gas separation plants, losses, platform and other field stock changes. Another factor is the time lag that can exist between production and loading onto tankers being reported at an offshore field and the arrival of these tankers at onshore refineries and oil terminals. This gap is usually minimal and works such that any effect of this at the start of a month is balanced by a similar counterpart effect at the end of a month. However, there can be instances where the length of this interval is considerable and, if it happens at the end of a year, there can be significant effects on the statistical differences seen for the years involved. 3.36 Another technical factor that can contribute to the statistical differences relates to the recording of quantities at the producing field (which is the input for the production data) and at oil terminals and refineries, since they are in effect measuring different types of oil. Terminals and refineries are able to measure a standardised, stabilised crude oil, that is, with its water content and content of Natural Gas
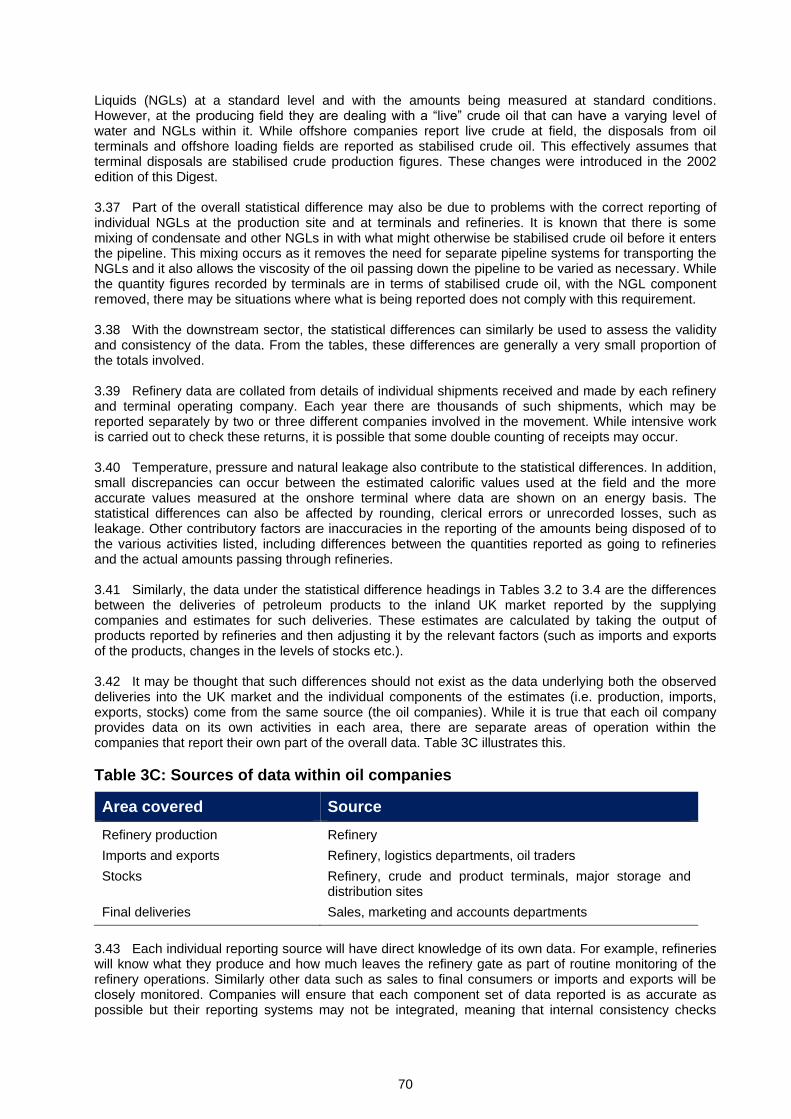
70
Liquids (NGLs) at a standard level and with the amounts being measured at standard conditions. However, at the producing field they are dealing with a “live” crude oil that can have a varying level of water and NGLs within it. While offshore companies report live crude at field, the disposals from oil terminals and offshore loading fields are reported as stabilised crude oil. This effectively assumes that terminal disposals are stabilised crude production figures. These changes were introduced in the 2002 edition of this Digest. 3.37 Part of the overall statistical difference may also be due to problems with the correct reporting of individual NGLs at the production site and at terminals and refineries. It is known that there is some mixing of condensate and other NGLs in with what might otherwise be stabilised crude oil before it enters the pipeline. This mixing occurs as it removes the need for separate pipeline systems for transporting the NGLs and it also allows the viscosity of the oil passing down the pipeline to be varied as necessary. While the quantity figures recorded by terminals are in terms of stabilised crude oil, with the NGL component removed, there may be situations where what is being reported does not comply with this requirement. 3.38 With the downstream sector, the statistical differences can similarly be used to assess the validity and consistency of the data. From the tables, these differences are generally a very small proportion of the totals involved. 3.39 Refinery data are collated from details of individual shipments received and made by each refinery and terminal operating company. Each year there are thousands of such shipments, which may be reported separately by two or three different companies involved in the movement. While intensive work is carried out to check these returns, it is possible that some double counting of receipts may occur. 3.40 Temperature, pressure and natural leakage also contribute to the statistical differences. In addition, small discrepancies can occur between the estimated calorific values used at the field and the more accurate values measured at the onshore terminal where data are shown on an energy basis. The statistical differences can also be affected by rounding, clerical errors or unrecorded losses, such as leakage. Other contributory factors are inaccuracies in the reporting of the amounts being disposed of to the various activities listed, including differences between the quantities reported as going to refineries and the actual amounts passing through refineries. 3.41 Similarly, the data under the statistical difference headings in Tables 3.2 to 3.4 are the differences between the deliveries of petroleum products to the inland UK market reported by the supplying companies and estimates for such deliveries. These estimates are calculated by taking the output of products reported by refineries and then adjusting it by the relevant factors (such as imports and exports of the products, changes in the levels of stocks etc.). 3.42 It may be thought that such differences should not exist as the data underlying both the observed deliveries into the UK market and the individual components of the estimates (i.e. production, imports, exports, stocks) come from the same source (the oil companies). While it is true that each oil company provides data on its own activities in each area, there are separate areas of operation within the companies that report their own part of the overall data. Table 3C illustrates this.
Table 3C: Sources of data within oil companies
Area covered Source
Refinery production Refinery
Imports and exports Refinery, logistics departments, oil traders
Stocks Refinery, crude and product terminals, major storage and distribution sites
Final deliveries Sales, marketing and accounts departments
3.43 Each individual reporting source will have direct knowledge of its own data. For example, refineries will know what they produce and how much leaves the refinery gate as part of routine monitoring of the refinery operations. Similarly other data such as sales to final consumers or imports and exports will be closely monitored. Companies will ensure that each component set of data reported is as accurate as possible but their reporting systems may not be integrated, meaning that internal consistency checks
71
across all reported data cannot be made. Each part of a company may also work to different timings as well, which may further add to the degree of differences seen. 3.44 The main area where there is known to be a problem is with the “Transfers” heading in the commodity balances. The data reported under this heading have two components. Firstly, there is an allowance for reclassification of products within the refining process. For example, butane can be added to motor spirit to improve the octane rating, aviation turbine fuel could be reclassified as domestic kerosene if its quality deteriorates, and much of the fuel oil imported into the UK is further refined into other petroleum products. Issues can arise with product flows between different reporting companies, for example when company A delivers fuel oil to company B who report a receipt of a feedstock. Secondly, and in addition to these inter-product transfers, the data also include an allowance to cover the receipt of backflows of products from petrochemical plants that are often very closely integrated with refineries. A deduction for these backflows thus needs to be included under the "Transfers" heading so that calculated estimates reflect net output and are thus more comparable with the basis of the observed deliveries data. 3.45 There is scope for error in the recording of these two components of transfers. With inter-product transfers, the data are recorded within the refinery during the refining and blending processes where the usual units used to record the changes are volumes rather than masses. Different factors apply for each product when converting from a volume to mass basis, as shown by the conversion factors given in Annex A of this Digest. Thus, a balanced transfer in volume terms may not be equivalent when converted to a mass basis. This is thought to be the main source of error within the individual product balances.
Revisions to published data 3.46 Following a review of trade data, exports of propane and butane (LPG) and fuel oil have been revised using HMRC data to capture exports by companies that do not report data to BEIS to provide a more complete picture of UK oil trade. 3.47 Minor revisions have been made following the re-introduction of checks on trade between reporting companies, which affects import and consumption data. Other revisions have been made following updates received from data suppliers.
Indigenous production 3.48 The term indigenous is used throughout this chapter and includes oil from the UK Continental Shelf, both offshore and onshore. Production of feedstocks at petrochemical plants that are delivered to refineries as backflows have not been included in production figures in the text or charts in this chapter.
Deliveries 3.49 These are deliveries into consumption, as opposed to being estimates of actual consumption or use. They are split between inland deliveries and deliveries to marine bunkers. Inland deliveries will not necessarily be consumed in the UK (e.g. aviation fuels).
Imports and exports 3.50 The information given under the headings "imports" and "exports" in this chapter are the figures recorded by importers and exporters of oil. They can differ in some cases from the import and export figures provided by HMRC that are given in Annex G on BEIS’s energy statistics website. Such differences arise from timing differences between actual and declared movements but also result from the Customs figures including re-exports. These are products that may have originally entered the UK as imports from another country and been stored in the UK prior to being exported back out of the UK, as opposed to having been actually produced in the UK.
Marine bunkers 3.51 This covers deliveries to be used by ocean going and coastal vessels under international bunker contracts. Other deliveries to fishing, coastal and inland vessels are excluded. As part of BEIS’s audit programme, UK refinery contacts reviewed the provision of fuel to marine bunkers in 2009. Whilst a number of companies have reviewed their methodology there are still issues with determining the final destination of fuel when these are supplied to third parties that are not part of BEIS’s monitoring programme. This issue impacts on both the volumes delivered directly to marine vessels, and whether those vessels are engaged in domestic or international navigation.
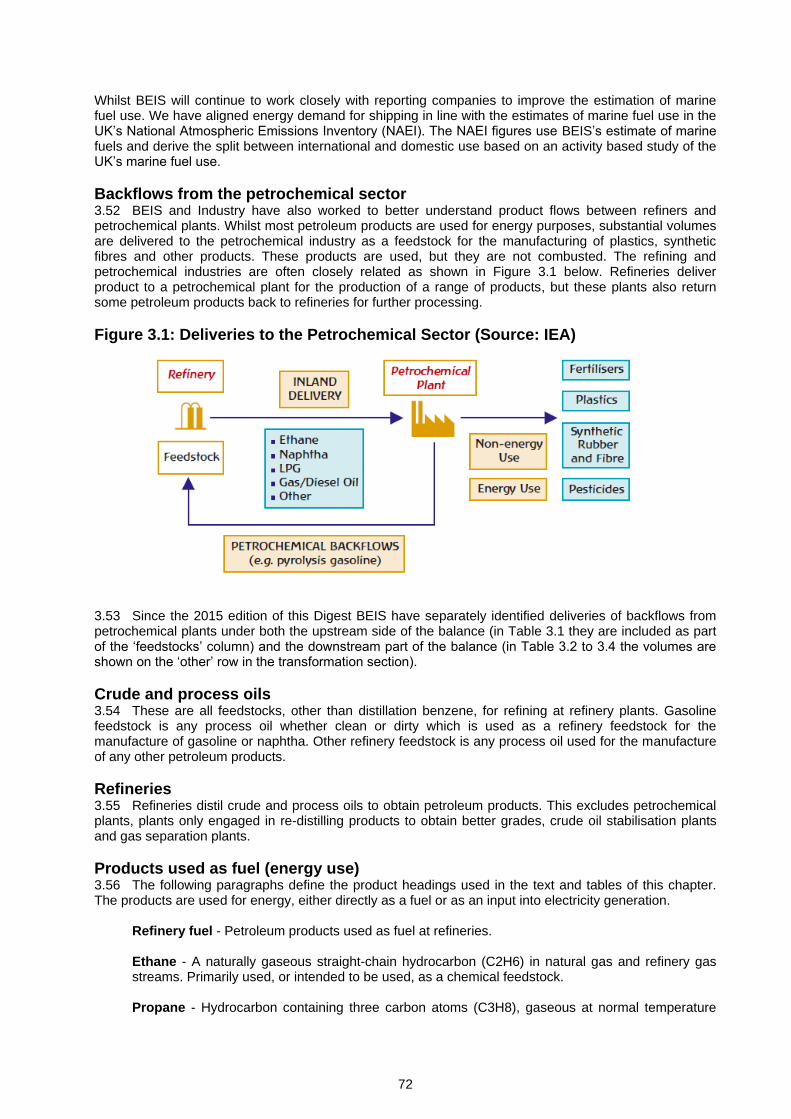
72
Whilst BEIS will continue to work closely with reporting companies to improve the estimation of marine fuel use. We have aligned energy demand for shipping in line with the estimates of marine fuel use in the UK’s National Atmospheric Emissions Inventory (NAEI). The NAEI figures use BEIS’s estimate of marine fuels and derive the split between international and domestic use based on an activity based study of the UK’s marine fuel use.
Backflows from the petrochemical sector
3.52 BEIS and Industry have also worked to better understand product flows between refiners and petrochemical plants. Whilst most petroleum products are used for energy purposes, substantial volumes are delivered to the petrochemical industry as a feedstock for the manufacturing of plastics, synthetic fibres and other products. These products are used, but they are not combusted. The refining and petrochemical industries are often closely related as shown in Figure 3.1 below. Refineries deliver product to a petrochemical plant for the production of a range of products, but these plants also return some petroleum products back to refineries for further processing.
Figure 3.1: Deliveries to the Petrochemical Sector (Source: IEA)
3.53 Since the 2015 edition of this Digest BEIS have separately identified deliveries of backflows from petrochemical plants under both the upstream side of the balance (in Table 3.1 they are included as part of the ‘feedstocks’ column) and the downstream part of the balance (in Table 3.2 to 3.4 the volumes are shown on the ‘other’ row in the transformation section).
Crude and process oils 3.54 These are all feedstocks, other than distillation benzene, for refining at refinery plants. Gasoline feedstock is any process oil whether clean or dirty which is used as a refinery feedstock for the manufacture of gasoline or naphtha. Other refinery feedstock is any process oil used for the manufacture of any other petroleum products.
Refineries 3.55 Refineries distil crude and process oils to obtain petroleum products. This excludes petrochemical plants, plants only engaged in re-distilling products to obtain better grades, crude oil stabilisation plants and gas separation plants.
Products used as fuel (energy use) 3.56 The following paragraphs define the product headings used in the text and tables of this chapter. The products are used for energy, either directly as a fuel or as an input into electricity generation.
Refinery fuel - Petroleum products used as fuel at refineries. Ethane - A naturally gaseous straight-chain hydrocarbon (C2H6) in natural gas and refinery gas streams. Primarily used, or intended to be used, as a chemical feedstock. Propane - Hydrocarbon containing three carbon atoms (C3H8), gaseous at normal temperature
73
but generally stored and transported under pressure as a liquid. Used mainly for industrial purposes, but also as transport, Liquid Petroleum Gas (LPG), and some domestic heating and cooking. Butane - Hydrocarbon containing four carbon atoms (C4H10), otherwise as for propane. Additionally used as a constituent of motor spirit to increase vapour pressure and as a chemical feedstock.
Naphtha (Light distillate feedstock) - Petroleum distillate boiling predominantly below 200ºC. Aviation spirit - All light hydrocarbon oils intended for use in aviation piston-engine power units, including bench testing of aircraft engines. Motor spirit - Blended light petroleum components used as fuel for spark-ignition internal-combustion engines other than aircraft engines:
(i) Premium unleaded grade - all finished motor spirit, with an octane number (research method) not less than 95.
(ii) Lead Replacement petrol / Super premium unleaded grade - finished motor spirit, with an octane number (research method) not less than 97.
Aviation turbine fuel (ATF) - All other turbine fuel intended for use in aviation gas-turbine power units and including bench testing of aircraft engines. Burning oil (kerosene or “paraffin”) - Refined petroleum fuel, intermediate in volatility between motor spirit and gas oil, used primarily for heating. White spirit and kerosene used for lubricant blends are excluded. Gas/diesel oil - Petroleum fuel having a distillation range immediately between kerosene and light-lubricating oil:
(i) DERV (Diesel Engined Road Vehicle) fuel - automotive diesel fuel for use in high speed, compression ignition engines in vehicles subject to Vehicle Excise Duty.
(ii) Gas oil - used as a burner fuel in heating installations, for industrial gas turbines and as for DERV (but in vehicles not subject to Vehicle Excise Duty e.g. agricultural vehicles, fishing vessels, construction equipment used off road and usually coloured with a red marker dye). Gas oil used for oil and gas extraction is included from 2005 onwards.
(iii) Marine diesel oil - heavier type of gas oil suitable for heavy industrial and marine compression-ignition engines.
Fuel oil - Heavy petroleum residue blends used in atomising burners and for heavy-duty marine engines (marine bunkers, etc.) with heavier grades requiring pre-heating before combustion. Excludes fuel oil for grease making or lubricating oil and fuel oil sold as such for road making.
Products not used as fuel (non-energy use) 3.57 The following paragraphs define the product headings used in the text and tables of this chapter, which are used for non-energy purposes.
Feedstock for petroleum chemical plants - All petroleum products intended for use in the manufacture of petroleum chemicals. This includes middle distillate feedstock of which there are
several grades depending on viscosity. The boiling point ranges between 200ºC and 400ºC. (A
deduction has been made from these figures equal to the quantity of feedstock used in making the conventional petroleum products that are produced during the processing of the feedstock. The output and deliveries of these conventional petroleum products are included elsewhere as appropriate.)
74
White spirit and specific boiling point (SBP) spirits - These are refined distillate intermediates
with a distillation in the naphtha / kerosene range. White spirit has a boiling range of about 150ºC
to 200ºC and is used as a paint or commercial solvent. SBP spirit is also known as Industrial
spirit and has a wider boiling range that varies up to 200ºC dependent upon its eventual use. It has a variety of uses that vary from use in seed extraction, rubber solvents and perfume. Lubricating oils (and grease) - Refined heavy distillates obtained from the vacuum distillation of petroleum residues. Includes liquid and solid hydrocarbons sold by the lubricating oil trade, either alone or blended with fixed oils, metallic soaps and other organic and/or inorganic bodies. A certain percentage of inland deliveries are re-used as a fuel, but all inland deliveries of lubricating oils have been classified as non-energy use only. Some deliveries are used for energy purposes, but it is difficult to estimate energy use figures with any degree of accuracy, hence no such estimates appear in the commodity balance tables. DUKES Table 3.8 (prior to 2010, table 3D, within the main text) provides limited information on the use of lubricants and grease. The information which was published under the heading of “Motors” has been amended to now include “Gear Oils and Transmission” to give a full picture of the lubricants used by vehicles. Bitumen - The residue left after the production of lubricating oil distillates and vacuum gas oil for upgrading plant feedstock. Used mainly for road making and building construction purposes. Includes other petroleum products such as creosote and tar mixed with bitumen for these purposes and fuel oil sold specifically for road making. Petroleum wax - Includes paraffin wax, which is a white crystalline hydrocarbon material of low oil content normally obtained during the refining of lubricating oil distillate, paraffin scale, slack wax, microcrystalline wax and wax emulsions. Used for candle manufacture, polishes, food containers, wrappings etc. Petroleum cokes - Carbonaceous material derived from hydrocarbon oils, uses for which include metallurgical electrode manufacture. Quantities of imports of this product are used as a fuel as it has a higher energy content than coal, though a lower energy content than fuel oils. Miscellaneous products - Includes aromatic extracts, defoament solvents and other minor miscellaneous products.
Main classes of consumer 3.58 The following are definitions of the main groupings of users of petroleum products used in the text and tables of this chapter.
Electricity generators - Petroleum products delivered for use by major power producers and other companies for electricity generation including those deliveries to the other industries listed below which are used for autogeneration of electricity (Tables 3.2 to 3.4). This includes petroleum products used to generate electricity at oil refineries and is recorded in the Transformation section, as opposed to other uses of refinery fuels that are recorded in the Energy Industry Use section. From the 2009 chapter of the Digest, data in Chapter 3 (Table 3.2 to 3.4) has been aligned with Chapter 5 (Table 5.4). The data on oil used for electricity generation collected from major power producers and autogenerators is judged to be at least as accurate as the data from refiners on deliveries, and has the advantage of consistency. Agriculture - Deliveries of fuel oil and gas oil/diesel for use in agricultural power units, dryers and heaters. Burning oil for farm use. Iron and steel - Deliveries of petroleum products to steel works and iron foundries. This is now based on information from the Iron and Steel Statistics Bureau. Other industries - The industries covered correspond to the industrial groups shown in Table 1G of Chapter 1, excluding Iron and Steel. National navigation - Fuel oil and gas/diesel oil delivered, other than under international bunker contracts, for fishing vessels, UK oil and gas exploration and production, coastal and inland shipping and for use in ports and harbours.
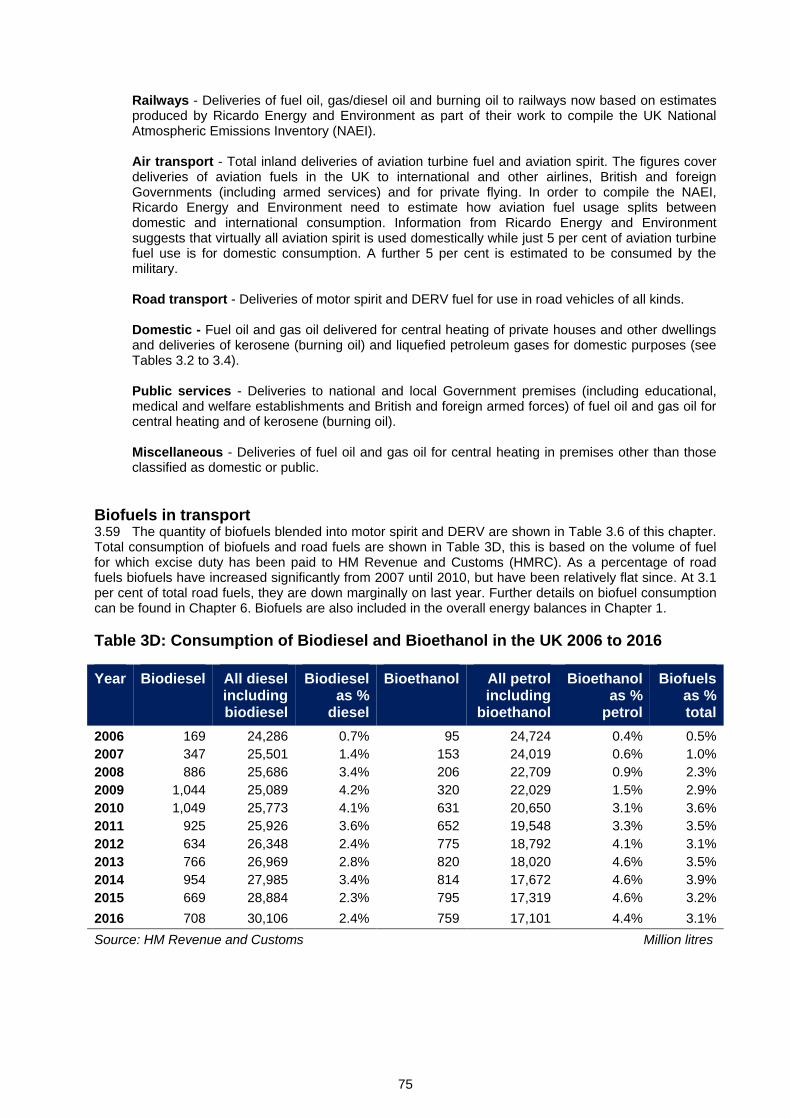
75
Railways - Deliveries of fuel oil, gas/diesel oil and burning oil to railways now based on estimates produced by Ricardo Energy and Environment as part of their work to compile the UK National Atmospheric Emissions Inventory (NAEI). Air transport - Total inland deliveries of aviation turbine fuel and aviation spirit. The figures cover deliveries of aviation fuels in the UK to international and other airlines, British and foreign Governments (including armed services) and for private flying. In order to compile the NAEI, Ricardo Energy and Environment need to estimate how aviation fuel usage splits between domestic and international consumption. Information from Ricardo Energy and Environment suggests that virtually all aviation spirit is used domestically while just 5 per cent of aviation turbine fuel use is for domestic consumption. A further 5 per cent is estimated to be consumed by the military. Road transport - Deliveries of motor spirit and DERV fuel for use in road vehicles of all kinds. Domestic - Fuel oil and gas oil delivered for central heating of private houses and other dwellings and deliveries of kerosene (burning oil) and liquefied petroleum gases for domestic purposes (see Tables 3.2 to 3.4). Public services - Deliveries to national and local Government premises (including educational, medical and welfare establishments and British and foreign armed forces) of fuel oil and gas oil for central heating and of kerosene (burning oil). Miscellaneous - Deliveries of fuel oil and gas oil for central heating in premises other than those classified as domestic or public.
Biofuels in transport 3.59 The quantity of biofuels blended into motor spirit and DERV are shown in Table 3.6 of this chapter. Total consumption of biofuels and road fuels are shown in Table 3D, this is based on the volume of fuel for which excise duty has been paid to HM Revenue and Customs (HMRC). As a percentage of road fuels biofuels have increased significantly from 2007 until 2010, but have been relatively flat since. At 3.1 per cent of total road fuels, they are down marginally on last year. Further details on biofuel consumption can be found in Chapter 6. Biofuels are also included in the overall energy balances in Chapter 1.
Table 3D: Consumption of Biodiesel and Bioethanol in the UK 2006 to 2016
Year Biodiesel All diesel including biodiesel
Biodiesel as %
diesel
Bioethanol All petrol including
bioethanol
Bioethanol as %
petrol
Biofuels as % total
2006 169 24,286 0.7% 95 24,724 0.4% 0.5%
2007 347 25,501 1.4% 153 24,019 0.6% 1.0%
2008 886 25,686 3.4% 206 22,709 0.9% 2.3%
2009 1,044 25,089 4.2% 320 22,029 1.5% 2.9%
2010 1,049 25,773 4.1% 631 20,650 3.1% 3.6%
2011 925 25,926 3.6% 652 19,548 3.3% 3.5%
2012 634 26,348 2.4% 775 18,792 4.1% 3.1%
2013 766 26,969 2.8% 820 18,020 4.6% 3.5%
2014 954 27,985 3.4% 814 17,672 4.6% 3.9%
2015 669 28,884 2.3% 795 17,319 4.6% 3.2%
2016 708 30,106 2.4% 759 17,101 4.4% 3.1%
Source: HM Revenue and Customs Million litres

76
Monthly and quarterly data 3.60 Monthly or quarterly aggregate data for certain series presented in this chapter are available. This information can be obtained free of charge by following the links given in the Energy Statistics section of the BEIS website on GOV.UK at: www.gov.uk/government/organisations/department-for-business-energy-and-industrial-strategy. Contacts: Warren Evans Energy Statistics Team [email protected]
0300 068 5059 Matthew Curds
Upstream Oil Statistics (primary oils) [email protected]
0300 068 8414
Natalie Cartwright Downstream Oil Statistics (petroleum products) [email protected]
0300 068 5260
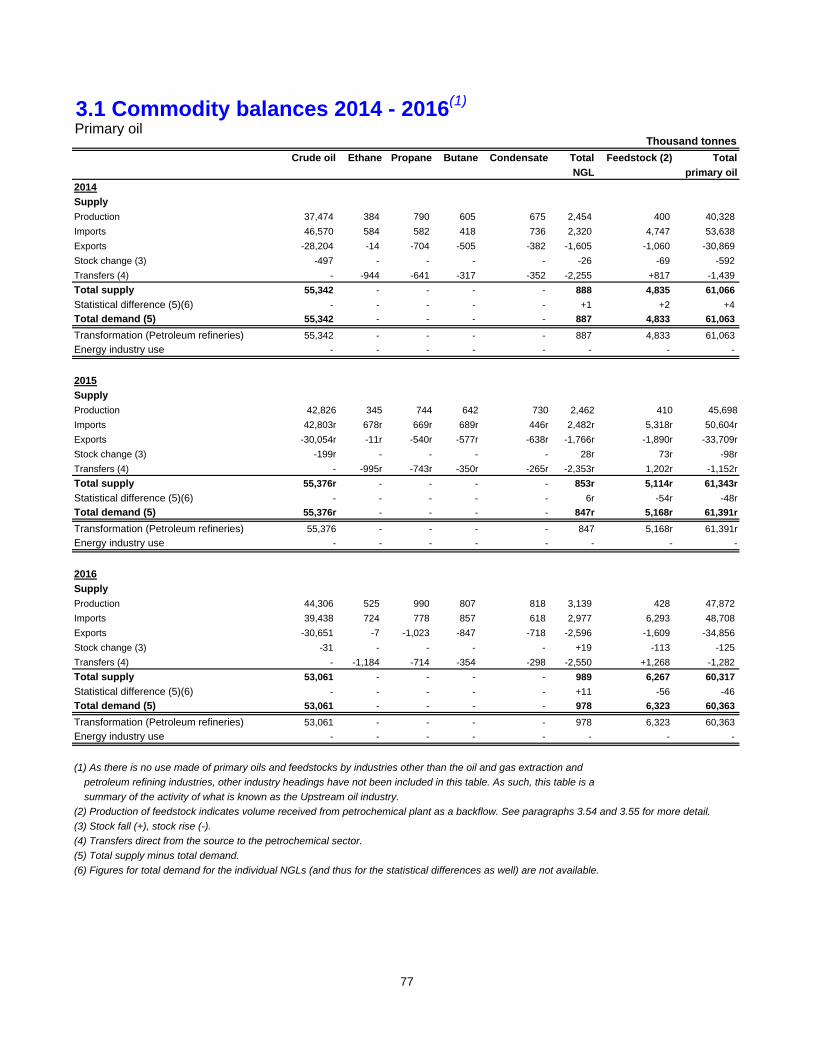
3.1 Commodity balances 2014 - 2016(1)
Primary oil
Crude oil Ethane Propane Butane Condensate Total Feedstock (2) Total
NGL primary oil
2014
Supply
Production 37,474 384 790 605 675 2,454 400 40,328
Imports 46,570 584 582 418 736 2,320 4,747 53,638
Exports -28,204 -14 -704 -505 -382 -1,605 -1,060 -30,869
Stock change (3) -497 - - - - -26 -69 -592
Transfers (4) - -944 -641 -317 -352 -2,255 +817 -1,439
Total supply 55,342 - - - - 888 4,835 61,066
Statistical difference (5)(6) - - - - - +1 +2 +4
Total demand (5) 55,342 - - - - 887 4,833 61,063
Transformation (Petroleum refineries) 55,342 - - - - 887 4,833 61,063
Energy industry use - - - - - - - -
2015
Supply
Production 42,826 345 744 642 730 2,462 410 45,698
Imports 42,803r 678r 669r 689r 446r 2,482r 5,318r 50,604r
Exports -30,054r -11r -540r -577r -638r -1,766r -1,890r -33,709r
Stock change (3) -199r - - - - 28r 73r -98r
Transfers (4) - -995r -743r -350r -265r -2,353r 1,202r -1,152r
Total supply 55,376r - - - - 853r 5,114r 61,343r
Statistical difference (5)(6) - - - - - 6r -54r -48r
Total demand (5) 55,376r - - - - 847r 5,168r 61,391r
Transformation (Petroleum refineries) 55,376 - - - - 847 5,168r 61,391r
Energy industry use - - - - - - - -
2016
Supply
Production 44,306 525 990 807 818 3,139 428 47,872
Imports 39,438 724 778 857 618 2,977 6,293 48,708
Exports -30,651 -7 -1,023 -847 -718 -2,596 -1,609 -34,856
Stock change (3) -31 - - - - +19 -113 -125
Transfers (4) - -1,184 -714 -354 -298 -2,550 +1,268 -1,282
Total supply 53,061 - - - - 989 6,267 60,317
Statistical difference (5)(6) - - - - - +11 -56 -46
Total demand (5) 53,061 - - - - 978 6,323 60,363
Transformation (Petroleum refineries) 53,061 - - - - 978 6,323 60,363
Energy industry use - - - - - - - -
(1) As there is no use made of primary oils and feedstocks by industries other than the oil and gas extraction and
petroleum refining industries, other industry headings have not been included in this table. As such, this table is a
summary of the activity of what is known as the Upstream oil industry.
(2) Production of feedstock indicates volume received from petrochemical plant as a backflow. See paragraphs 3.54 and 3.55 for more detail.
(3) Stock fall (+), stock rise (-).
(4) Transfers direct from the source to the petrochemical sector.
(5) Total supply minus total demand.
(6) Figures for total demand for the individual NGLs (and thus for the statistical differences as well) are not available.
Thousand tonnes
77
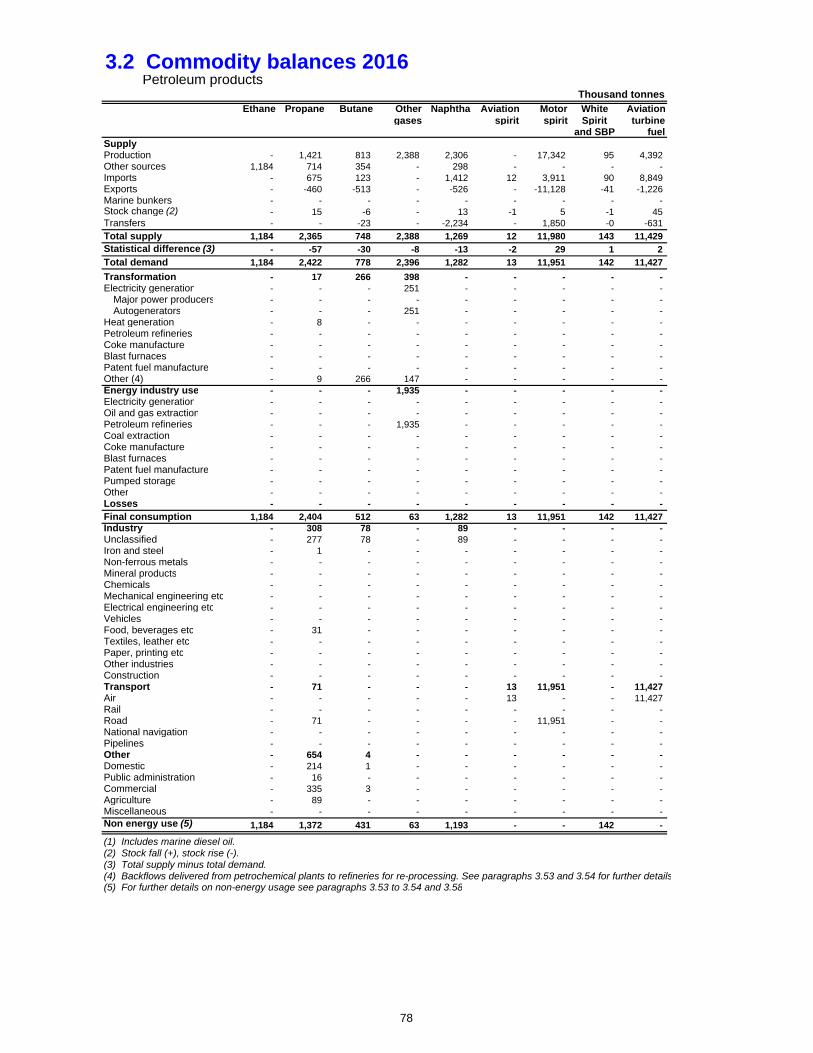
3.2 Commodity balances 2016Petroleum products
Ethane Propane Butane Other Naphtha Aviation Motor White Aviationgases spirit spirit Spirit turbine
and SBP fuelSupplyProduction - 1,421 813 2,388 2,306 - 17,342 95 4,392 Other sources 1,184 714 354 - 298 - - - - Imports - 675 123 - 1,412 12 3,911 90 8,849 Exports - -460 -513 - -526 - -11,128 -41 -1,226 Marine bunkers - - - - - - - - - Stock change (2) - 15 -6 - 13 -1 5 -1 45 Transfers - - -23 - -2,234 - 1,850 -0 -631
Total supply 1,184 2,365 748 2,388 1,269 12 11,980 143 11,429 Statistical difference (3) - -57 -30 -8 -13 -2 29 1 2
Total demand 1,184 2,422 778 2,396 1,282 13 11,951 142 11,427
Transformation - 17 266 398 - - - - - Electricity generation - - - 251 - - - - -
Major power producers - - - - - - - - - Autogenerators - - - 251 - - - - -
Heat generation - 8 - - - - - - - Petroleum refineries - - - - - - - - - Coke manufacture - - - - - - - - - Blast furnaces - - - - - - - - - Patent fuel manufacture - - - - - - - - - Other (4) - 9 266 147 - - - - - Energy industry use - - - 1,935 - - - - - Electricity generation - - - - - - - - - Oil and gas extraction - - - - - - - - - Petroleum refineries - - - 1,935 - - - - - Coal extraction - - - - - - - - - Coke manufacture - - - - - - - - - Blast furnaces - - - - - - - - - Patent fuel manufacture - - - - - - - - - Pumped storage - - - - - - - - - Other - - - - - - - - - Losses - - - - - - - - -
Final consumption 1,184 2,404 512 63 1,282 13 11,951 142 11,427 Industry - 308 78 - 89 - - - - Unclassified - 277 78 - 89 - - - - Iron and steel - 1 - - - - - - - Non-ferrous metals - - - - - - - - - Mineral products - - - - - - - - - Chemicals - - - - - - - - - Mechanical engineering etc - - - - - - - - - Electrical engineering etc - - - - - - - - - Vehicles - - - - - - - - - Food, beverages etc - 31 - - - - - - - Textiles, leather etc - - - - - - - - - Paper, printing etc - - - - - - - - - Other industries - - - - - - - - - Construction - - - - - - - - - Transport - 71 - - - 13 11,951 - 11,427 Air - - - - - 13 - - 11,427 Rail - - - - - - - - - Road - 71 - - - - 11,951 - - National navigation - - - - - - - - - Pipelines - - - - - - - - - Other - 654 4 - - - - - - Domestic - 214 1 - - - - - - Public administration - 16 - - - - - - - Commercial - 335 3 - - - - - - Agriculture - 89 - - - - - - - Miscellaneous - - - - - - - - - Non energy use (5) 1,184 1,372 431 63 1,193 - - 142 -
(1) Includes marine diesel oil.(2) Stock fall (+), stock rise (-).(3) Total supply minus total demand.(4) Backflows delivered from petrochemical plants to refineries for re-processing. See paragraphs 3.53 and 3.54 for further details(5) For further details on non-energy usage see paragraphs 3.53 to 3.54 and 3.58
Thousand tonnes
78
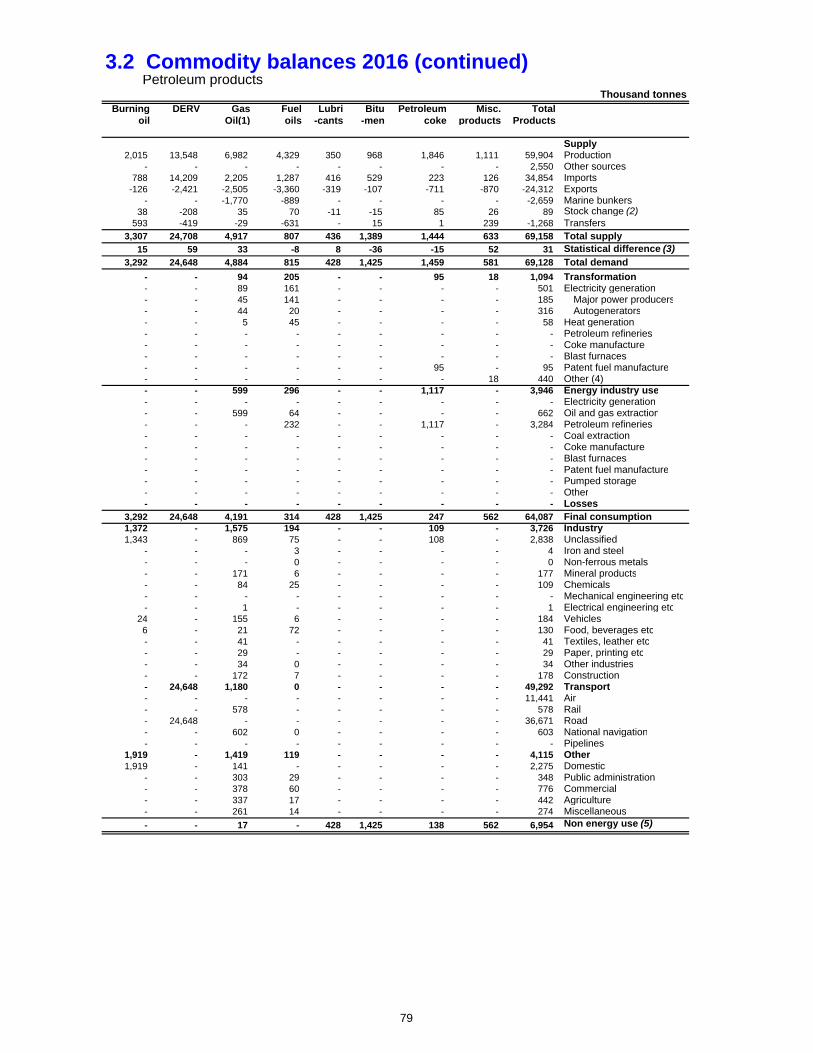
3.2 Commodity balances 2016 (continued)Petroleum products
Burning DERV Gas Fuel Lubri Bitu Petroleum Misc. Totaloil Oil(1) oils -cants -men coke products Products
Supply2,015 13,548 6,982 4,329 350 968 1,846 1,111 59,904 Production
- - - - - - - - 2,550 Other sources788 14,209 2,205 1,287 416 529 223 126 34,854 Imports
-126 -2,421 -2,505 -3,360 -319 -107 -711 -870 -24,312 Exports- - -1,770 -889 - - - - -2,659 Marine bunkers
38 -208 35 70 -11 -15 85 26 89 Stock change (2)593 -419 -29 -631 - 15 1 239 -1,268 Transfers
3,307 24,708 4,917 807 436 1,389 1,444 633 69,158 Total supply15 59 33 -8 8 -36 -15 52 31 Statistical difference (3)
3,292 24,648 4,884 815 428 1,425 1,459 581 69,128 Total demand
- - 94 205 - - 95 18 1,094 Transformation- - 89 161 - - - - 501 Electricity generation- - 45 141 - - - - 185 Major power producers- - 44 20 - - - - 316 Autogenerators- - 5 45 - - - - 58 Heat generation- - - - - - - - - Petroleum refineries- - - - - - - - - Coke manufacture- - - - - - - - - Blast furnaces- - - - - - 95 - 95 Patent fuel manufacture- - - - - - - 18 440 Other (4)- - 599 296 - - 1,117 - 3,946 Energy industry use- - - - - - - - - Electricity generation- - 599 64 - - - - 662 Oil and gas extraction- - - 232 - - 1,117 - 3,284 Petroleum refineries- - - - - - - - - Coal extraction- - - - - - - - - Coke manufacture- - - - - - - - - Blast furnaces- - - - - - - - - Patent fuel manufacture- - - - - - - - - Pumped storage- - - - - - - - - Other- - - - - - - - - Losses
3,292 24,648 4,191 314 428 1,425 247 562 64,087 Final consumption1,372 - 1,575 194 - - 109 - 3,726 Industry1,343 - 869 75 - - 108 - 2,838 Unclassified
- - - 3 - - - - 4 Iron and steel- - - 0 - - - - 0 Non-ferrous metals- - 171 6 - - - - 177 Mineral products- - 84 25 - - - - 109 Chemicals- - - - - - - - - Mechanical engineering etc- - 1 - - - - - 1 Electrical engineering etc
24 - 155 6 - - - - 184 Vehicles6 - 21 72 - - - - 130 Food, beverages etc- - 41 - - - - - 41 Textiles, leather etc- - 29 - - - - - 29 Paper, printing etc- - 34 0 - - - - 34 Other industries- - 172 7 - - - - 178 Construction- 24,648 1,180 0 - - - - 49,292 Transport- - - - - - - - 11,441 Air- - 578 - - - - - 578 Rail- 24,648 - - - - - - 36,671 Road- - 602 0 - - - - 603 National navigation- - - - - - - - - Pipelines
1,919 - 1,419 119 - - - - 4,115 Other1,919 - 141 - - - - - 2,275 Domestic
- - 303 29 - - - - 348 Public administration- - 378 60 - - - - 776 Commercial- - 337 17 - - - - 442 Agriculture- - 261 14 - - - - 274 Miscellaneous- - 17 - 428 1,425 138 562 6,954 Non energy use (5)
Thousand tonnes
79

3.3 Commodity balances 2015Petroleum products
Ethane Propane Butane Other Naphtha Aviation Motor White Aviationgases spirit spirit Spirit turbine
and SBP fuelSupplyProduction - 1,357 850 2,343r 2,368 - 16,894r 151 4,973Other sources 995 743 350 - 265 - - - -Imports - 580r 103r - 983r 13 3,904r 98 8,236rExports - -293 -559r - -436 - -10,340 -76 -1,201Marine bunkers - - - - - - - - -Stock change (2) - 4 10 - -8 -0 -137 -7 -201Transfers - - - - -1,986 - 1,754r -6 -483r
Total supply 995 2,392r 755r 2,343r 1,185r 13 12,074r 160 11,324rStatistical difference (3) - 4r 30r -12r -9r 1 -8r -0 -8r
Total demand 995 2,388r 725r 2,356 1,195r 11 12,082 160 11,332r
Transformation - 12 282 379 - - - - -Electricity generation - - - 253 - - - - -
Major power producers - - - - - - - - -Autogenerators - - - 253 - - - - -
Heat generation - 9 - - - - - - -Petroleum refineries - - - - - - - - -Coke manufacture - - - - - - - - -Blast furnaces - - - - - - - - -Patent fuel manufacture - - - - - - - - -Other (4) - 3 282 126 - - - - -Energy industry use - - - 1,942 - - - - -Electricity generation - - - - - - - - -Oil and gas extraction - - - - - - - - -Petroleum refineries - - - 1,942 - - - - -Coal extraction - - - - - - - - -Coke manufacture - - - - - - - - -Blast furnaces - - - - - - - - -Patent fuel manufacture - - - - - - - - -Pumped storage - - - - - - - - -Other - - - - - - - - -Losses - - - - - - - - -
Final consumption 995 2,376r 443r 35 1,195r 11 12,082 160 11,332rIndustry - 297r 72 - 122r - - - -Unclassified - 282r 72 - 122r - - - -Iron and steel - 2 - - - - - - -Non-ferrous metals - - - - - - - - -Mineral products - - - - - - - - -Chemicals - - - - - - - - -Mechanical engineering etc - - - - - - - - -Electrical engineering etc - - - - - - - - -Vehicles - - - - - - - - -Food, beverages etc - 13r - - - - - - -Textiles, leather etc - - - - - - - - -Paper, printing etc - - - - - - - - -Other industries - - - - - - - - -Construction - - - - - - - - -Transport - 82 - - - 11 12,082 - 11,332rAir - - - - - 11 - - 11,332rRail - - - - - - - - -Road - 82 - - - - 12,082 - -National navigation - - - - - - - - -Pipelines - - - - - - - - -Other - 637r 5r - - - - - -Domestic - 204 1 - - - - - -Public administration - 16r - - - - - - -Commercial - 327r 4r - - - - - -Agriculture - 90 0 - - - - - -Miscellaneous - - - - - - - - -Non energy use (5) 995 1,361r 366r 35 1,072 - - 160 -
(1) Includes marine diesel oil.(2) Stock fall (+), stock rise (-).(3) Total supply minus total demand.(4) Backflows delivered from petrochemical plants to refineries for re-processing. See paragraphs 3.53 and 3.54 for further details(5) For further details on non-energy usage see paragraphs 3.53 to 3.54 and 3.58
Thousand tonnes
80
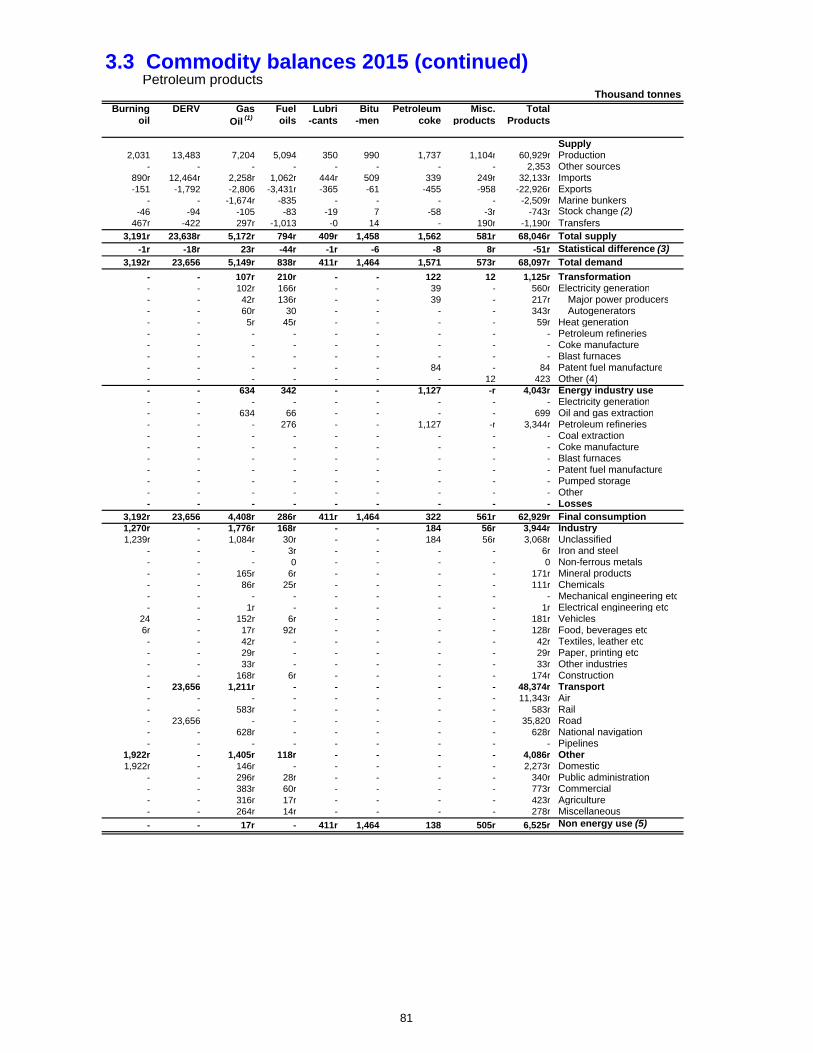
3.3 Commodity balances 2015 (continued)Petroleum products
Burning DERV Gas Fuel Lubri Bitu Petroleum Misc. Totaloil Oil (1) oils -cants -men coke products Products
Supply2,031 13,483 7,204 5,094 350 990 1,737 1,104r 60,929r Production
- - - - - - - - 2,353 Other sources890r 12,464r 2,258r 1,062r 444r 509 339 249r 32,133r Imports-151 -1,792 -2,806 -3,431r -365 -61 -455 -958 -22,926r Exports
- - -1,674r -835 - - - - -2,509r Marine bunkers-46 -94 -105 -83 -19 7 -58 -3r -743r Stock change (2)
467r -422 297r -1,013 -0 14 - 190r -1,190r Transfers3,191r 23,638r 5,172r 794r 409r 1,458 1,562 581r 68,046r Total supply
-1r -18r 23r -44r -1r -6 -8 8r -51r Statistical difference (3)3,192r 23,656 5,149r 838r 411r 1,464 1,571 573r 68,097r Total demand
- - 107r 210r - - 122 12 1,125r Transformation- - 102r 166r - - 39 - 560r Electricity generation- - 42r 136r - - 39 - 217r Major power producers- - 60r 30 - - - - 343r Autogenerators- - 5r 45r - - - - 59r Heat generation- - - - - - - - - Petroleum refineries- - - - - - - - - Coke manufacture- - - - - - - - - Blast furnaces- - - - - - 84 - 84 Patent fuel manufacture- - - - - - - 12 423 Other (4)- - 634 342 - - 1,127 -r 4,043r Energy industry use- - - - - - - - - Electricity generation- - 634 66 - - - - 699 Oil and gas extraction- - - 276 - - 1,127 -r 3,344r Petroleum refineries- - - - - - - - - Coal extraction- - - - - - - - - Coke manufacture- - - - - - - - - Blast furnaces- - - - - - - - - Patent fuel manufacture- - - - - - - - - Pumped storage- - - - - - - - - Other- - - - - - - - - Losses
3,192r 23,656 4,408r 286r 411r 1,464 322 561r 62,929r Final consumption1,270r - 1,776r 168r - - 184 56r 3,944r Industry1,239r - 1,084r 30r - - 184 56r 3,068r Unclassified
- - - 3r - - - - 6r Iron and steel- - - 0 - - - - 0 Non-ferrous metals- - 165r 6r - - - - 171r Mineral products- - 86r 25r - - - - 111r Chemicals- - - - - - - - - Mechanical engineering etc- - 1r - - - - - 1r Electrical engineering etc
24 - 152r 6r - - - - 181r Vehicles6r - 17r 92r - - - - 128r Food, beverages etc- - 42r - - - - - 42r Textiles, leather etc- - 29r - - - - - 29r Paper, printing etc- - 33r - - - - - 33r Other industries- - 168r 6r - - - - 174r Construction- 23,656 1,211r - - - - - 48,374r Transport- - - - - - - - 11,343r Air- - 583r - - - - - 583r Rail- 23,656 - - - - - - 35,820 Road- - 628r - - - - - 628r National navigation- - - - - - - - - Pipelines
1,922r - 1,405r 118r - - - - 4,086r Other1,922r - 146r - - - - - 2,273r Domestic
- - 296r 28r - - - - 340r Public administration- - 383r 60r - - - - 773r Commercial- - 316r 17r - - - - 423r Agriculture- - 264r 14r - - - - 278r Miscellaneous- - 17r - 411r 1,464 138 505r 6,525r Non energy use (5)
Thousand tonnes
81
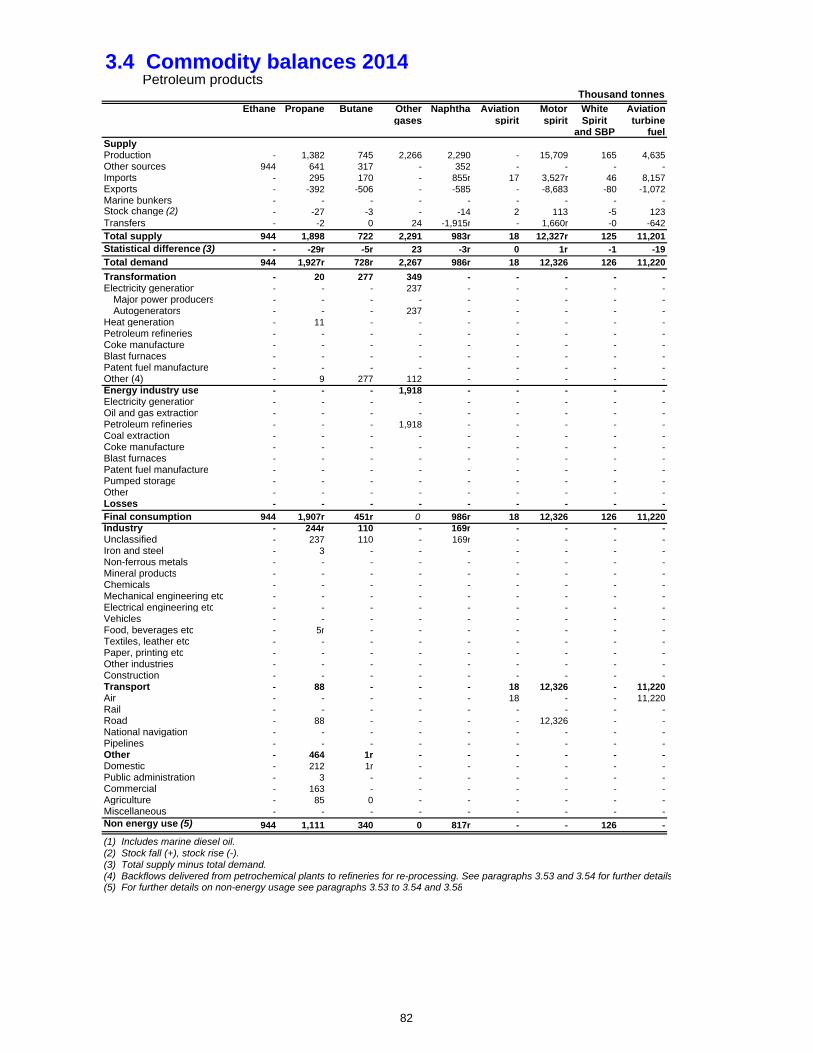
3.4 Commodity balances 2014Petroleum products
Ethane Propane Butane Other Naphtha Aviation Motor White Aviationgases spirit spirit Spirit turbine
and SBP fuelSupplyProduction - 1,382 745 2,266 2,290 - 15,709 165 4,635Other sources 944 641 317 - 352 - - - -Imports - 295 170 - 855r 17 3,527r 46 8,157Exports - -392 -506 - -585 - -8,683 -80 -1,072Marine bunkers - - - - - - - - -Stock change (2) - -27 -3 - -14 2 113 -5 123Transfers - -2 0 24 -1,915r - 1,660r -0 -642
Total supply 944 1,898 722 2,291 983r 18 12,327r 125 11,201Statistical difference (3) - -29r -5r 23 -3r 0 1r -1 -19
Total demand 944 1,927r 728r 2,267 986r 18 12,326 126 11,220
Transformation - 20 277 349 - - - - -Electricity generation - - - 237 - - - - -
Major power producers - - - - - - - - -Autogenerators - - - 237 - - - - -
Heat generation - 11 - - - - - - -Petroleum refineries - - - - - - - - -Coke manufacture - - - - - - - - -Blast furnaces - - - - - - - - -Patent fuel manufacture - - - - - - - - -Other (4) - 9 277 112 - - - - -Energy industry use - - - 1,918 - - - - -Electricity generation - - - - - - - - -Oil and gas extraction - - - - - - - - -Petroleum refineries - - - 1,918 - - - - -Coal extraction - - - - - - - - -Coke manufacture - - - - - - - - -Blast furnaces - - - - - - - - -Patent fuel manufacture - - - - - - - - -Pumped storage - - - - - - - - -Other - - - - - - - - -Losses - - - - - - - - -
Final consumption 944 1,907r 451r 0 986r 18 12,326 126 11,220Industry - 244r 110 - 169r - - - -Unclassified - 237 110 - 169r - - - -Iron and steel - 3 - - - - - - -Non-ferrous metals - - - - - - - - -Mineral products - - - - - - - - -Chemicals - - - - - - - - -Mechanical engineering etc - - - - - - - - -Electrical engineering etc - - - - - - - - -Vehicles - - - - - - - - -Food, beverages etc - 5r - - - - - - -Textiles, leather etc - - - - - - - - -Paper, printing etc - - - - - - - - -Other industries - - - - - - - - -Construction - - - - - - - - -Transport - 88 - - - 18 12,326 - 11,220Air - - - - - 18 - - 11,220Rail - - - - - - - - -Road - 88 - - - - 12,326 - -National navigation - - - - - - - - -Pipelines - - - - - - - - -Other - 464 1r - - - - - -Domestic - 212 1r - - - - - -Public administration - 3 - - - - - - -Commercial - 163 - - - - - - -Agriculture - 85 0 - - - - - -Miscellaneous - - - - - - - - -Non energy use (5) 944 1,111 340 0 817r - - 126 -
(1) Includes marine diesel oil.(2) Stock fall (+), stock rise (-).(3) Total supply minus total demand.(4) Backflows delivered from petrochemical plants to refineries for re-processing. See paragraphs 3.53 and 3.54 for further details(5) For further details on non-energy usage see paragraphs 3.53 to 3.54 and 3.58
Thousand tonnes
82

3.4 Commodity balances 2014 (continued)Petroleum products
Burning DERV Gas Fuel Lubri Bitu Petroleum Misc. Totaloil Oil (1) oils -cants -men coke products Products
Supply2,093 13,726 8,049 5,409 373 1,006 1,745 798 60,392 Production
- - - - - - - - 2,255 Other sources639r 11,470r 1,424r 1,092r 386 465 537 306 29,384r Imports-164 -1,942 -3,463 -4,148 -337 -62 -567 -746 -22,748 Exports
- - -1,676 -1,148 - - - - -2,824 Marine bunkers-15 -61 24 107 29 18 16 -13 292 Stock change (2)621 -509 489 -617 -20 -18 - 199 -730r Transfers
3,174r 22,683r 4,848r 695r 430 1,409 1,730 543 66,022r Total supply-13r 8r 11r 1r -6 -1 - 2 -29r Statistical difference (3)
3,187r 22,675 4,837r 695r 436 1,410 1,730 541 66,051r Total demand
- - 117r 186r - - 91 15 1,054r Transformation- - 112 141 - - - - 490 Electricity generation- - 46 122 - - - - 168 Major power producers- - 66 19 - - - - 322 Autogenerators- - 5r 45r - - - - 61r Heat generation- - - - - - - - - Petroleum refineries- - - - - - - - - Coke manufacture- - - - - - - - - Blast furnaces- - - - - - 91 - 91 Patent fuel manufacture- - - - - - - 15 413 Other (4)- - 647 156 - - 1,140 - 3,861 Energy industry use- - - - - - - - - Electricity generation- - 647 16 - - - - 663 Oil and gas extraction- - - 140 - - 1,140 - 3,198 Petroleum refineries- - - - - - - - - Coal extraction- - - - - - - - - Coke manufacture- - - - - - - - - Blast furnaces- - - - - - - - - Patent fuel manufacture- - - - - - - - - Pumped storage- - - - - - - - - Other- - - - - - - - - Losses
3,187r 22,675 4,072r 353r 436 1,410 499 526 61,135r Final consumption1,278r - 1,542r 241r - - 350 - 3,933r Industry1,246 - 892r 99r - - 350 - 3,102r Unclassified
- - - 3r - - - - 6r Iron and steel- - - 0 - - - - 0 Non-ferrous metals- - 155r 6r - - - - 161r Mineral products- - 80r 23r - - - - 103r Chemicals- - - - - - - - - Mechanical engineering etc- - 1 - - - - - 1 Electrical engineering etc
24 - 142r 5r - - - - 171r Vehicles7r - 17r 99r - - - - 129r Food, beverages etc- - 40r - - - - - 40r Textiles, leather etc- - 28r - - - - - 28r Paper, printing etc- - 32r - - - - - 32r Other industries- - 155r 6r - - - - 160r Construction- 22,675 1,269r - - - - - 47,596r Transport- - - - - - - - 11,238 Air- - 624 - - - - - 624 Rail- 22,675 - - - - - - 35,089 Road- - 645r - - - - - 645r National navigation- - - - - - - - - Pipelines
1,909 - 1,247r 112r - - - - 3,733r Other1,909 - 138r - - - - - 2,260r Domestic
- - 280r 26 - - - - 309r Public administration- - 336r 57 - - - - 556r Commercial- - 261r 16r - - - - 362r Agriculture- - 232r 14r - - - - 246r Miscellaneous- - 15 1 436 1,410 149 526 5,873r Non energy use (5)
Thousand tonnes
83
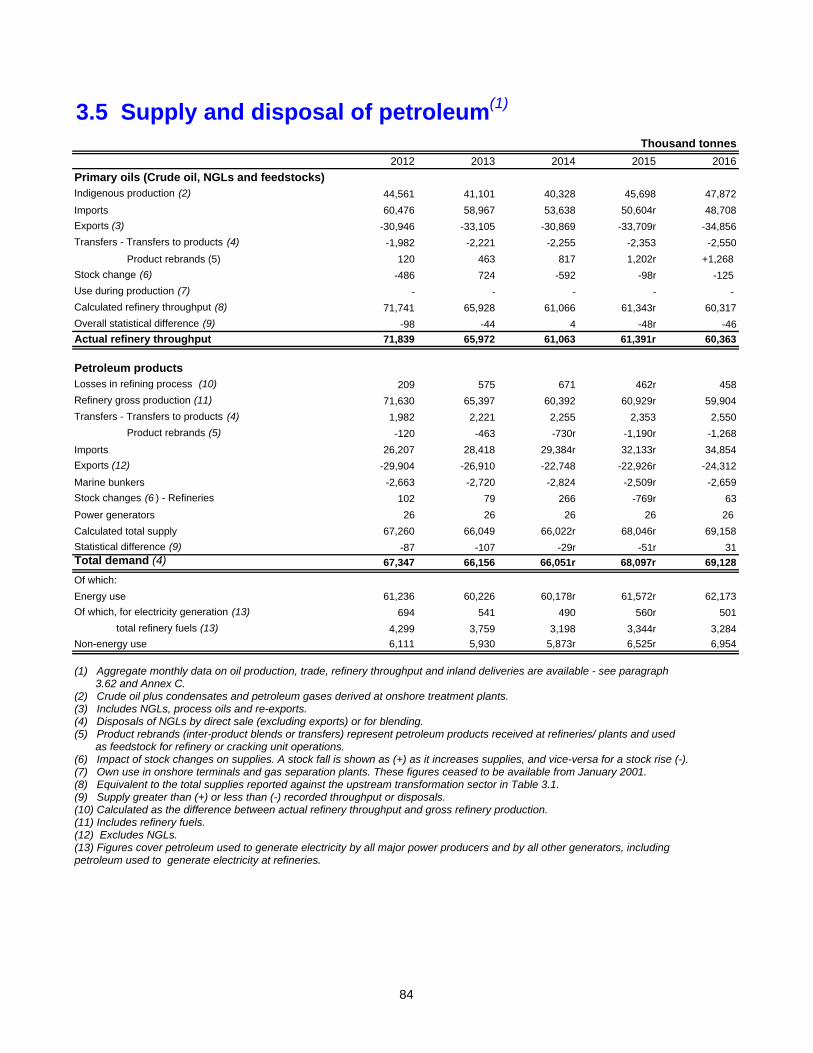
3.5 Supply and disposal of petroleum(1)
Thousand tonnes
2012 2013 2014 2015 2016
Primary oils (Crude oil, NGLs and feedstocks)Indigenous production (2) 44,561 41,101 40,328 45,698 47,872
Imports 60,476 58,967 53,638 50,604r 48,708
Exports (3) -30,946 -33,105 -30,869 -33,709r -34,856
Transfers - Transfers to products (4) -1,982 -2,221 -2,255 -2,353 -2,550
Product rebrands (5) 120 463 817 1,202r +1,268
Stock change (6) -486 724 -592 -98r -125
Use during production (7) - - - - -
Calculated refinery throughput (8) 71,741 65,928 61,066 61,343r 60,317
Overall statistical difference (9) -98 -44 4 -48r -46
Actual refinery throughput 71,839 65,972 61,063 61,391r 60,363
Petroleum productsLosses in refining process (10) 209 575 671 462r 458
Refinery gross production (11) 71,630 65,397 60,392 60,929r 59,904
Transfers - Transfers to products (4) 1,982 2,221 2,255 2,353 2,550
Product rebrands (5) -120 -463 -730r -1,190r -1,268
Imports 26,207 28,418 29,384r 32,133r 34,854
Exports (12) -29,904 -26,910 -22,748 -22,926r -24,312
Marine bunkers -2,663 -2,720 -2,824 -2,509r -2,659
Stock changes (6 ) - Refineries 102 79 266 -769r 63
Power generators 26 26 26 26 26
Calculated total supply 67,260 66,049 66,022r 68,046r 69,158
Statistical difference (9) -87 -107 -29r -51r 31Total demand (4) 67,347 66,156 66,051r 68,097r 69,128
Of which:
Energy use 61,236 60,226 60,178r 61,572r 62,173
Of which, for electricity generation (13) 694 541 490 560r 501
total refinery fuels (13) 4,299 3,759 3,198 3,344r 3,284
Non-energy use 6,111 5,930 5,873r 6,525r 6,954
(1) Aggregate monthly data on oil production, trade, refinery throughput and inland deliveries are available - see paragraph 3.62 and Annex C.
(2) Crude oil plus condensates and petroleum gases derived at onshore treatment plants.(3) Includes NGLs, process oils and re-exports.(4) Disposals of NGLs by direct sale (excluding exports) or for blending.(5) Product rebrands (inter-product blends or transfers) represent petroleum products received at refineries/ plants and used
as feedstock for refinery or cracking unit operations.(6) Impact of stock changes on supplies. A stock fall is shown as (+) as it increases supplies, and vice-versa for a stock rise (-).(7) Own use in onshore terminals and gas separation plants. These figures ceased to be available from January 2001. (8) Equivalent to the total supplies reported against the upstream transformation sector in Table 3.1.(9) Supply greater than (+) or less than (-) recorded throughput or disposals. (10) Calculated as the difference between actual refinery throughput and gross refinery production.(11) Includes refinery fuels.(12) Excludes NGLs.(13) Figures cover petroleum used to generate electricity by all major power producers and by all other generators, including petroleum used to generate electricity at refineries.
84
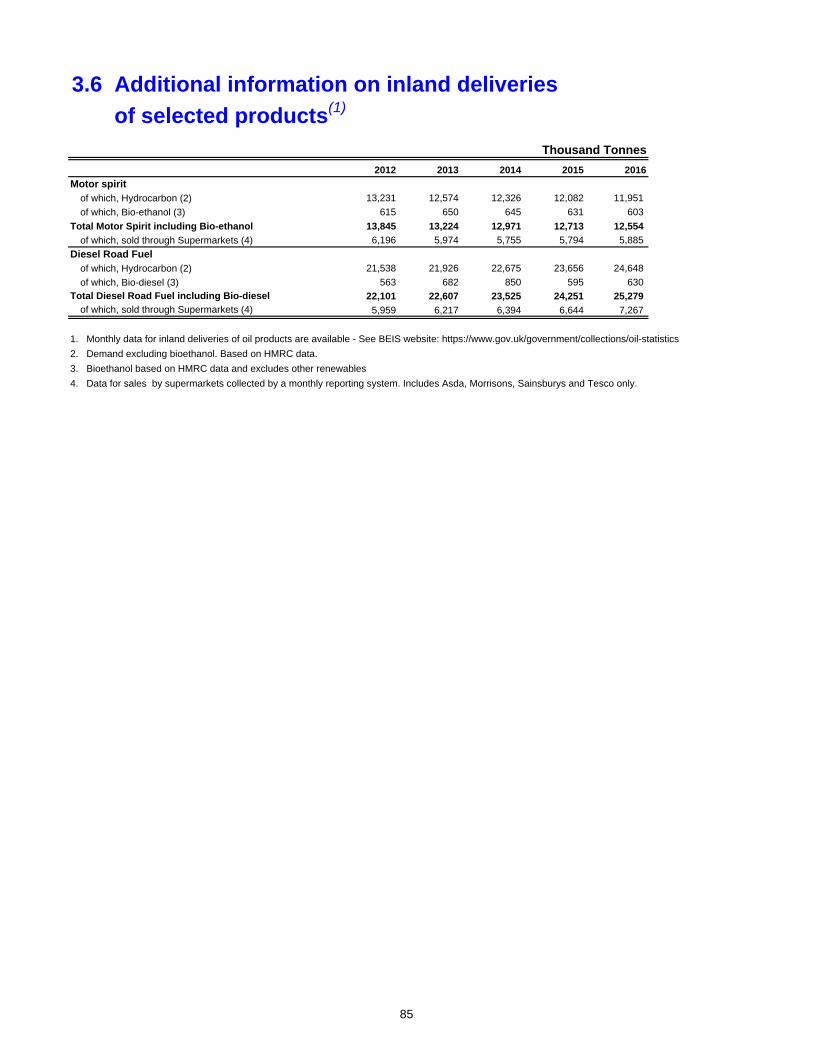
3.6 Additional information on inland deliveries
of selected products(1)
Thousand Tonnes
2012 2013 2014 2015 2016
Motor spiritof which, Hydrocarbon (2) 13,231 12,574 12,326 12,082 11,951
of which, Bio-ethanol (3) 615 650 645 631 603
Total Motor Spirit including Bio-ethanol 13,845 13,224 12,971 12,713 12,554
of which, sold through Supermarkets (4) 6,196 5,974 5,755 5,794 5,885
Diesel Road Fuelof which, Hydrocarbon (2) 21,538 21,926 22,675 23,656 24,648
of which, Bio-diesel (3) 563 682 850 595 630 Total Diesel Road Fuel including Bio-diesel 22,101 22,607 23,525 24,251 25,279
of which, sold through Supermarkets (4) 5,959 6,217 6,394 6,644 7,267
1. Monthly data for inland deliveries of oil products are available - See BEIS website: https://www.gov.uk/government/collections/oil-statistics
2. Demand excluding bioethanol. Based on HMRC data.
3. Bioethanol based on HMRC data and excludes other renewables
4. Data for sales by supermarkets collected by a monthly reporting system. Includes Asda, Morrisons, Sainsburys and Tesco only.
85
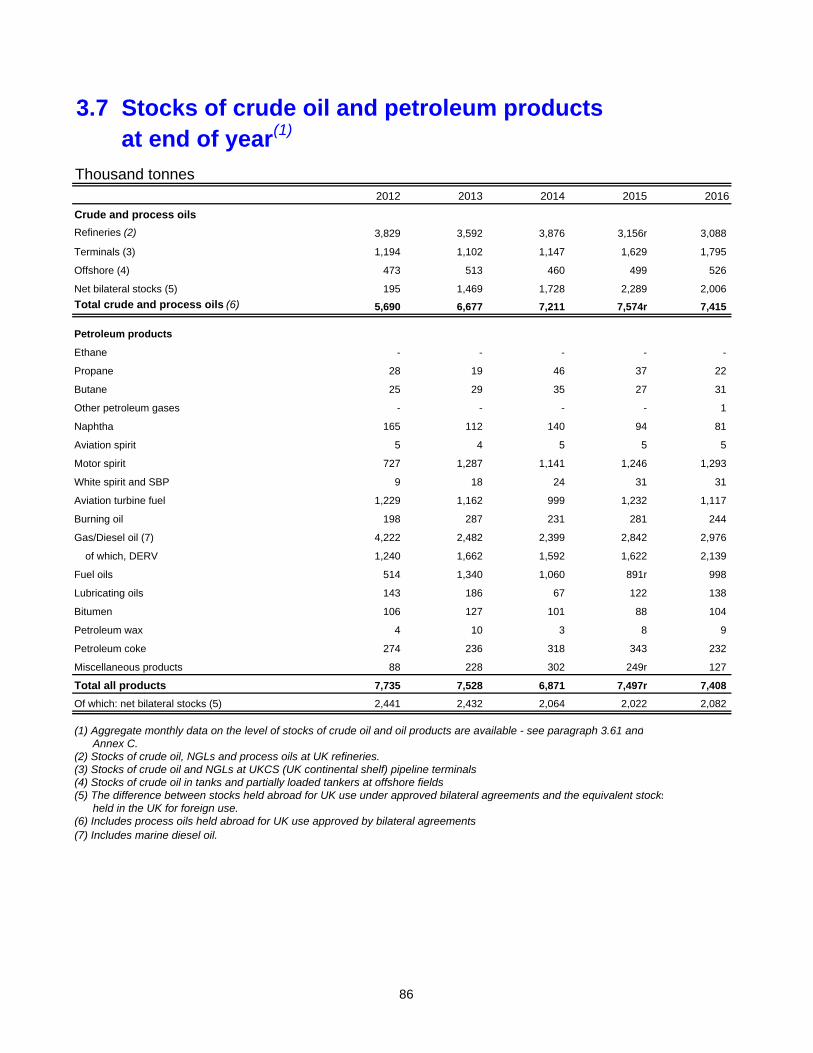
3.7 Stocks of crude oil and petroleum products at end of year(1)
Thousand tonnes2012 2013 2014 2015 2016
Crude and process oils
Refineries (2) 3,829 3,592 3,876 3,156r 3,088
Terminals (3) 1,194 1,102 1,147 1,629 1,795
Offshore (4) 473 513 460 499 526
Net bilateral stocks (5) 195 1,469 1,728 2,289 2,006
Total crude and process oils (6) 5,690 6,677 7,211 7,574r 7,415
Petroleum products
Ethane - - - - -
Propane 28 19 46 37 22
Butane 25 29 35 27 31
Other petroleum gases - - - - 1
Naphtha 165 112 140 94 81
Aviation spirit 5 4 5 5 5
Motor spirit 727 1,287 1,141 1,246 1,293
White spirit and SBP 9 18 24 31 31
Aviation turbine fuel 1,229 1,162 999 1,232 1,117
Burning oil 198 287 231 281 244
Gas/Diesel oil (7) 4,222 2,482 2,399 2,842 2,976
of which, DERV 1,240 1,662 1,592 1,622 2,139
Fuel oils 514 1,340 1,060 891r 998
Lubricating oils 143 186 67 122 138
Bitumen 106 127 101 88 104
Petroleum wax 4 10 3 8 9
Petroleum coke 274 236 318 343 232
Miscellaneous products 88 228 302 249r 127
Total all products 7,735 7,528 6,871 7,497r 7,408
Of which: net bilateral stocks (5) 2,441 2,432 2,064 2,022 2,082
(1) Aggregate monthly data on the level of stocks of crude oil and oil products are available - see paragraph 3.61 and Annex C.(2) Stocks of crude oil, NGLs and process oils at UK refineries.(3) Stocks of crude oil and NGLs at UKCS (UK continental shelf) pipeline terminals.(4) Stocks of crude oil in tanks and partially loaded tankers at offshore fields.(5) The difference between stocks held abroad for UK use under approved bilateral agreements and the equivalent stocks held in the UK for foreign use.(6) Includes process oils held abroad for UK use approved by bilateral agreements.(7) Includes marine diesel oil.
86
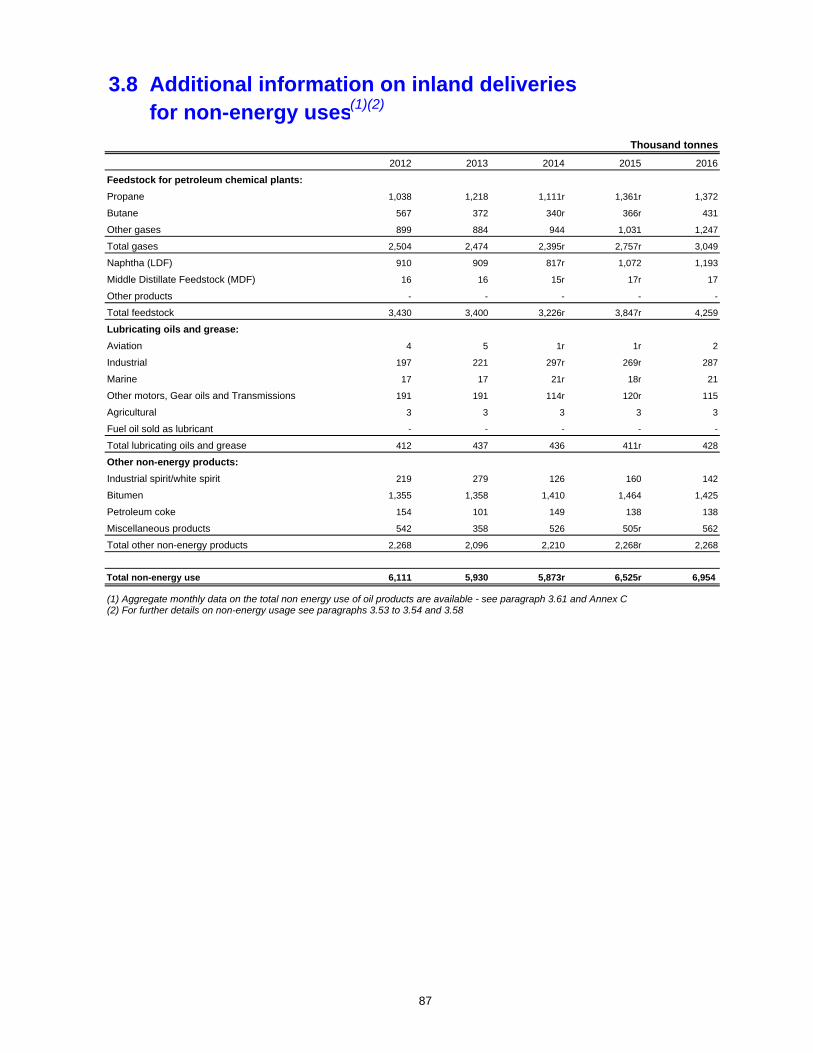
3.8 Additional information on inland deliveries for non-energy uses(1)(2)
Thousand tonnes
2012 2013 2014 2015 2016
Feedstock for petroleum chemical plants:
Propane 1,038 1,218 1,111r 1,361r 1,372
Butane 567 372 340r 366r 431
Other gases 899 884 944 1,031 1,247
Total gases 2,504 2,474 2,395r 2,757r 3,049
Naphtha (LDF) 910 909 817r 1,072 1,193
Middle Distillate Feedstock (MDF) 16 16 15r 17r 17
Other products - - - - -
Total feedstock 3,430 3,400 3,226r 3,847r 4,259
Lubricating oils and grease:
Aviation 4 5 1r 1r 2
Industrial 197 221 297r 269r 287
Marine 17 17 21r 18r 21
Other motors, Gear oils and Transmissions 191 191 114r 120r 115
Agricultural 3 3 3 3 3
Fuel oil sold as lubricant - - - - -
Total lubricating oils and grease 412 437 436 411r 428
Other non-energy products:
Industrial spirit/white spirit 219 279 126 160 142
Bitumen 1,355 1,358 1,410 1,464 1,425
Petroleum coke 154 101 149 138 138
Miscellaneous products 542 358 526 505r 562
Total other non-energy products 2,268 2,096 2,210 2,268r 2,268
Total non-energy use 6,111 5,930 5,873r 6,525r 6,954
(1) Aggregate monthly data on the total non energy use of oil products are available - see paragraph 3.61 and Annex C(2) For further details on non-energy usage see paragraphs 3.53 to 3.54 and 3.58.
87

88
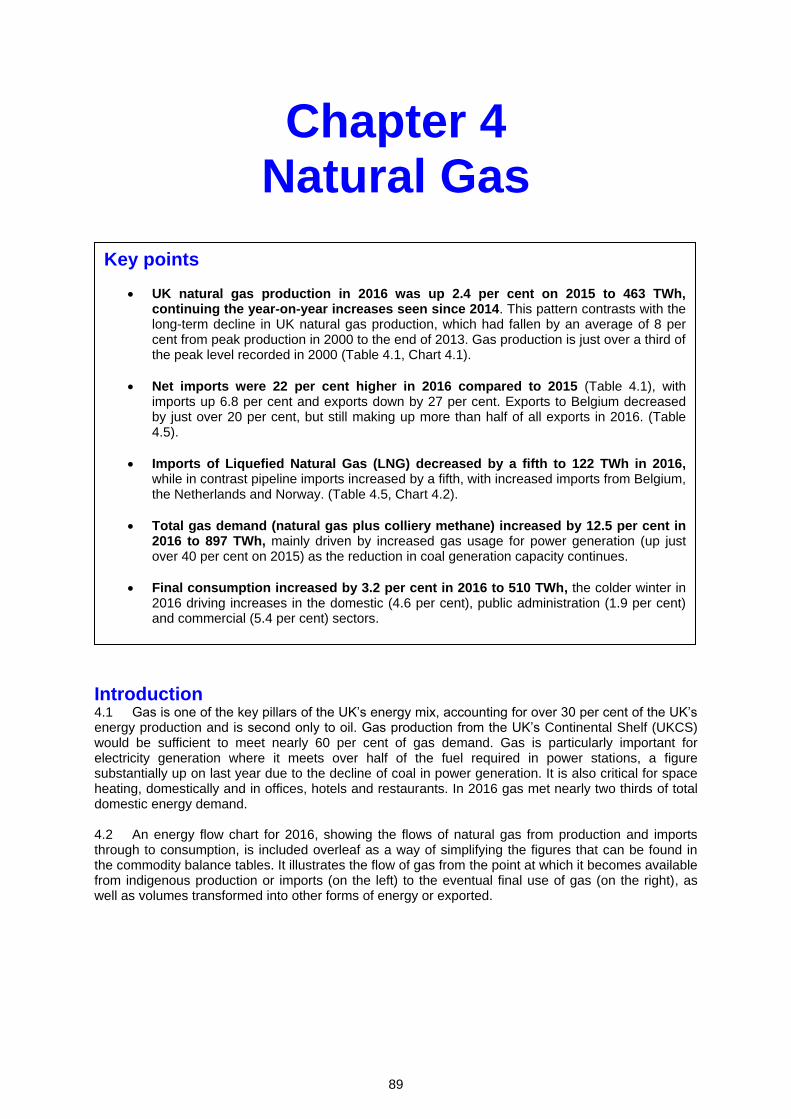
89
Chapter 4 Natural Gas
Introduction 4.1 Gas is one of the key pillars of the UK’s energy mix, accounting for over 30 per cent of the UK’s energy production and is second only to oil. Gas production from the UK’s Continental Shelf (UKCS) would be sufficient to meet nearly 60 per cent of gas demand. Gas is particularly important for electricity generation where it meets over half of the fuel required in power stations, a figure substantially up on last year due to the decline of coal in power generation. It is also critical for space heating, domestically and in offices, hotels and restaurants. In 2016 gas met nearly two thirds of total domestic energy demand. 4.2 An energy flow chart for 2016, showing the flows of natural gas from production and imports through to consumption, is included overleaf as a way of simplifying the figures that can be found in the commodity balance tables. It illustrates the flow of gas from the point at which it becomes available from indigenous production or imports (on the left) to the eventual final use of gas (on the right), as well as volumes transformed into other forms of energy or exported.
Key points
UK natural gas production in 2016 was up 2.4 per cent on 2015 to 463 TWh, continuing the year-on-year increases seen since 2014. This pattern contrasts with the long-term decline in UK natural gas production, which had fallen by an average of 8 per cent from peak production in 2000 to the end of 2013. Gas production is just over a third of the peak level recorded in 2000 (Table 4.1, Chart 4.1).
Net imports were 22 per cent higher in 2016 compared to 2015 (Table 4.1), with imports up 6.8 per cent and exports down by 27 per cent. Exports to Belgium decreased by just over 20 per cent, but still making up more than half of all exports in 2016. (Table 4.5).
Imports of Liquefied Natural Gas (LNG) decreased by a fifth to 122 TWh in 2016, while in contrast pipeline imports increased by a fifth, with increased imports from Belgium, the Netherlands and Norway. (Table 4.5, Chart 4.2).
Total gas demand (natural gas plus colliery methane) increased by 12.5 per cent in 2016 to 897 TWh, mainly driven by increased gas usage for power generation (up just over 40 per cent on 2015) as the reduction in coal generation capacity continues.
Final consumption increased by 3.2 per cent in 2016 to 510 TWh, the colder winter in 2016 driving increases in the domestic (4.6 per cent), public administration (1.9 per cent) and commercial (5.4 per cent) sectors.
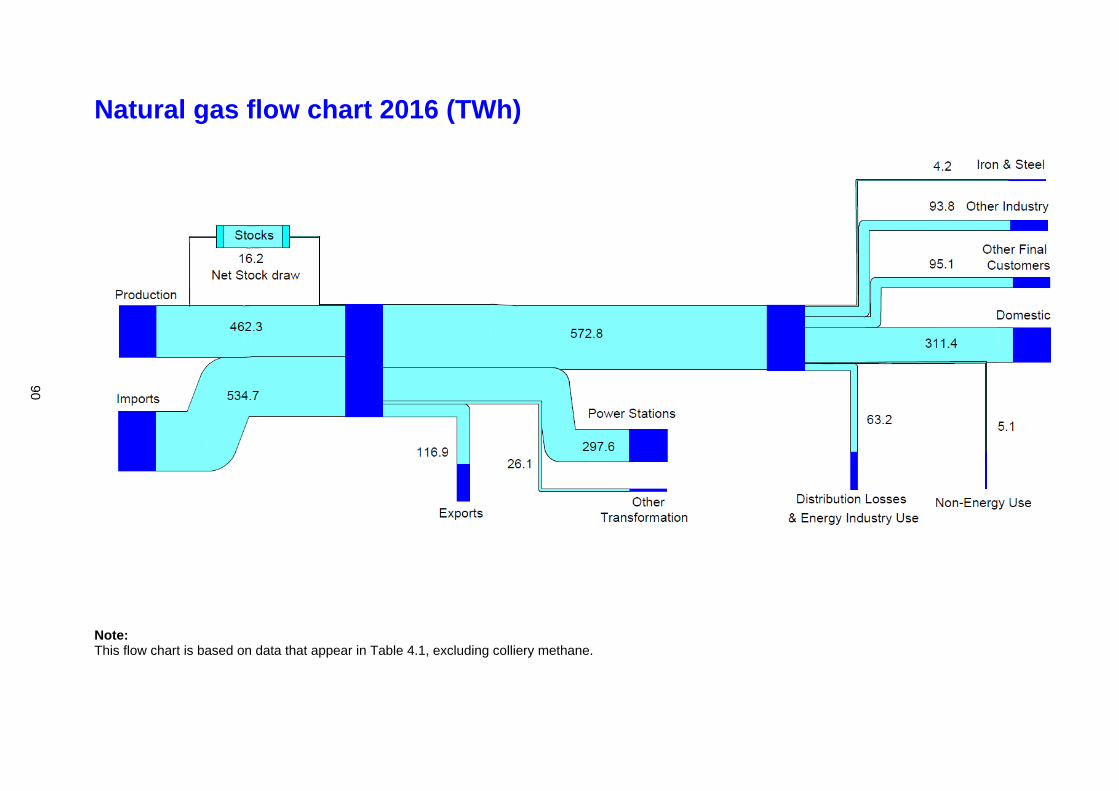
Natural gas flow chart 2016 (TWh)
Note: This flow chart is based on data that appear in Table 4.1, excluding colliery methane.
90
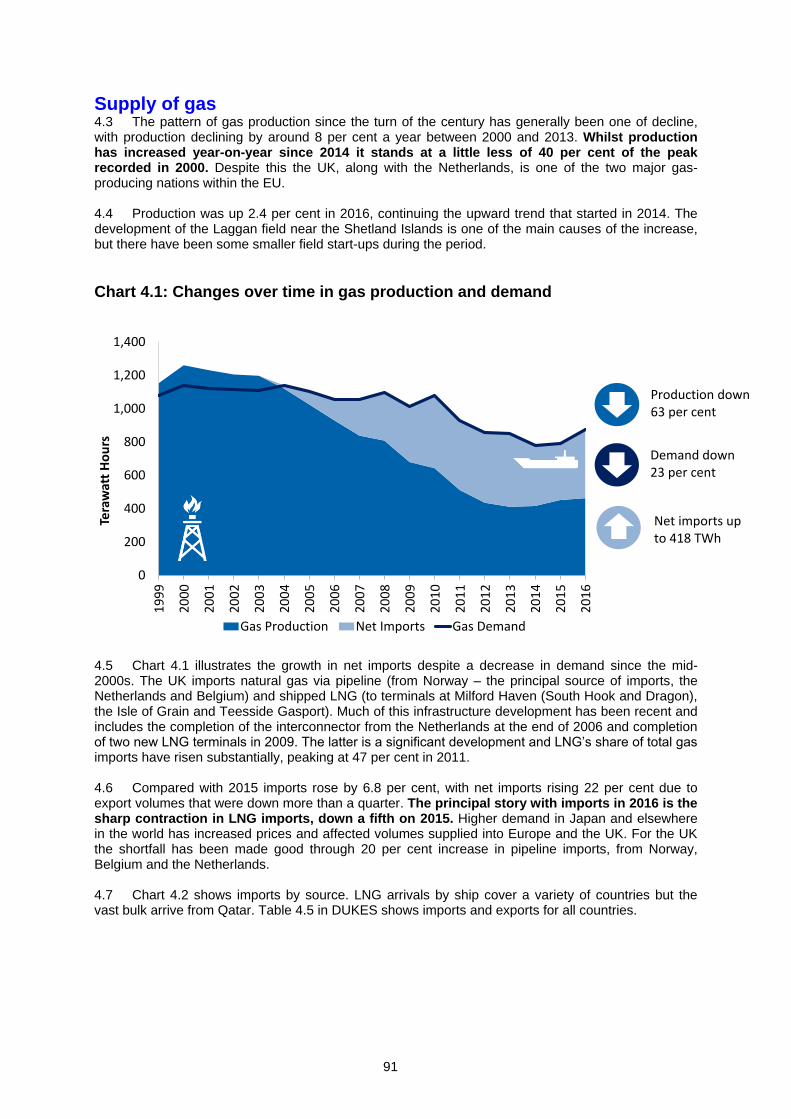
91
Supply of gas 4.3 The pattern of gas production since the turn of the century has generally been one of decline, with production declining by around 8 per cent a year between 2000 and 2013. Whilst production has increased year-on-year since 2014 it stands at a little less of 40 per cent of the peak recorded in 2000. Despite this the UK, along with the Netherlands, is one of the two major gas-producing nations within the EU. 4.4 Production was up 2.4 per cent in 2016, continuing the upward trend that started in 2014. The development of the Laggan field near the Shetland Islands is one of the main causes of the increase, but there have been some smaller field start-ups during the period.
Chart 4.1: Changes over time in gas production and demand
4.5 Chart 4.1 illustrates the growth in net imports despite a decrease in demand since the mid-2000s. The UK imports natural gas via pipeline (from Norway – the principal source of imports, the Netherlands and Belgium) and shipped LNG (to terminals at Milford Haven (South Hook and Dragon), the Isle of Grain and Teesside Gasport). Much of this infrastructure development has been recent and includes the completion of the interconnector from the Netherlands at the end of 2006 and completion of two new LNG terminals in 2009. The latter is a significant development and LNG’s share of total gas imports have risen substantially, peaking at 47 per cent in 2011. 4.6 Compared with 2015 imports rose by 6.8 per cent, with net imports rising 22 per cent due to export volumes that were down more than a quarter. The principal story with imports in 2016 is the sharp contraction in LNG imports, down a fifth on 2015. Higher demand in Japan and elsewhere in the world has increased prices and affected volumes supplied into Europe and the UK. For the UK the shortfall has been made good through 20 per cent increase in pipeline imports, from Norway, Belgium and the Netherlands.
4.7 Chart 4.2 shows imports by source. LNG arrivals by ship cover a variety of countries but the vast bulk arrive from Qatar. Table 4.5 in DUKES shows imports and exports for all countries.
0
200
400
600
800
1,000
1,200
1,400
19
99
20
00
20
01
20
02
20
03
20
04
20
05
20
06
20
07
20
08
20
09
20
10
20
11
20
12
20
13
20
14
20
15
20
16
Tera
wat
t H
ou
rs
Gas Production Net Imports Gas Demand
Production down 63 per cent
Demand down 23 per cent
Net imports up to 418 TWh
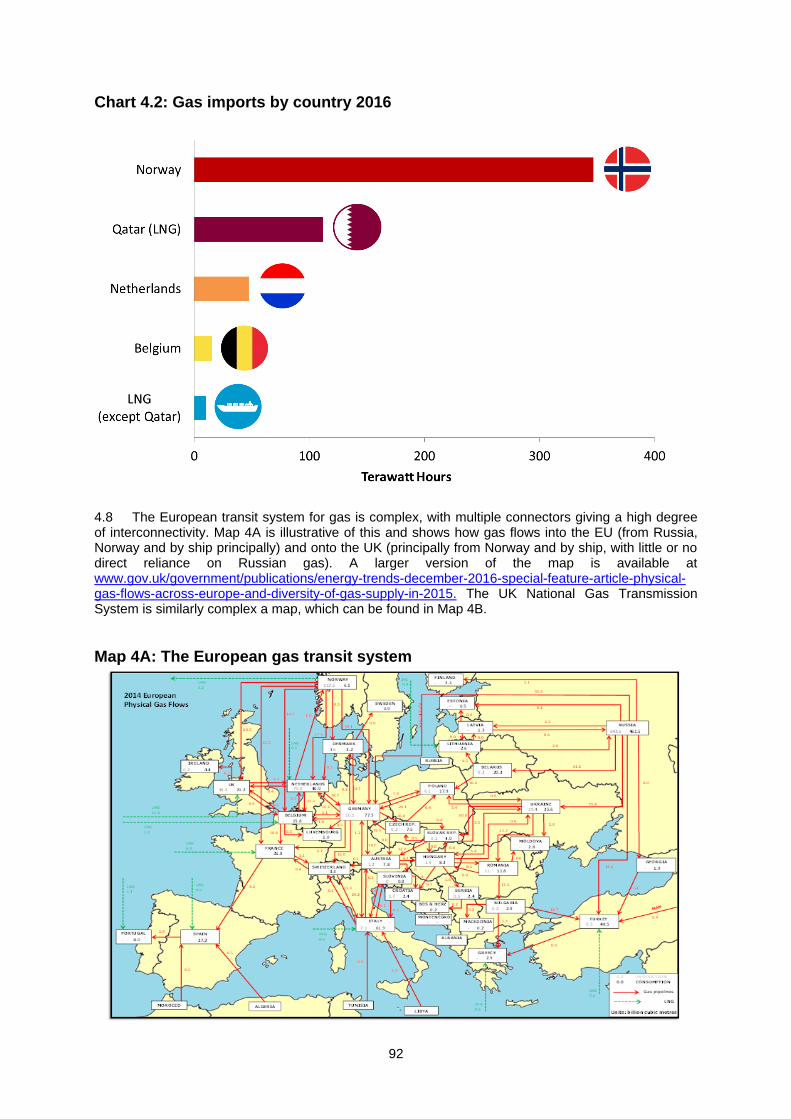
92
Chart 4.2: Gas imports by country 2016
4.8 The European transit system for gas is complex, with multiple connectors giving a high degree of interconnectivity. Map 4A is illustrative of this and shows how gas flows into the EU (from Russia, Norway and by ship principally) and onto the UK (principally from Norway and by ship, with little or no direct reliance on Russian gas). A larger version of the map is available at www.gov.uk/government/publications/energy-trends-december-2016-special-feature-article-physical-gas-flows-across-europe-and-diversity-of-gas-supply-in-2015. The UK National Gas Transmission System is similarly complex a map, which can be found in Map 4B.
Map 4A: The European gas transit system
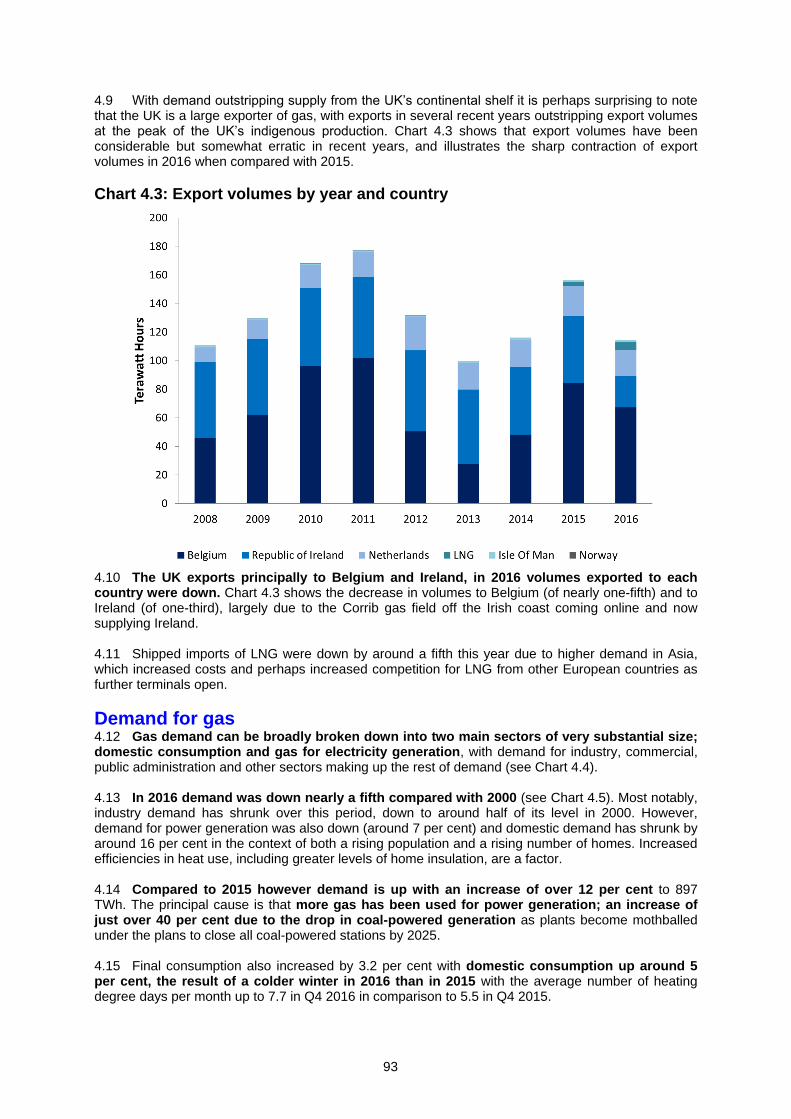
93
4.9 With demand outstripping supply from the UK’s continental shelf it is perhaps surprising to note that the UK is a large exporter of gas, with exports in several recent years outstripping export volumes at the peak of the UK’s indigenous production. Chart 4.3 shows that export volumes have been considerable but somewhat erratic in recent years, and illustrates the sharp contraction of export volumes in 2016 when compared with 2015.
Chart 4.3: Export volumes by year and country
4.10 The UK exports principally to Belgium and Ireland, in 2016 volumes exported to each country were down. Chart 4.3 shows the decrease in volumes to Belgium (of nearly one-fifth) and to Ireland (of one-third), largely due to the Corrib gas field off the Irish coast coming online and now supplying Ireland. 4.11 Shipped imports of LNG were down by around a fifth this year due to higher demand in Asia, which increased costs and perhaps increased competition for LNG from other European countries as further terminals open.
Demand for gas 4.12 Gas demand can be broadly broken down into two main sectors of very substantial size; domestic consumption and gas for electricity generation, with demand for industry, commercial, public administration and other sectors making up the rest of demand (see Chart 4.4). 4.13 In 2016 demand was down nearly a fifth compared with 2000 (see Chart 4.5). Most notably, industry demand has shrunk over this period, down to around half of its level in 2000. However, demand for power generation was also down (around 7 per cent) and domestic demand has shrunk by around 16 per cent in the context of both a rising population and a rising number of homes. Increased efficiencies in heat use, including greater levels of home insulation, are a factor. 4.14 Compared to 2015 however demand is up with an increase of over 12 per cent to 897 TWh. The principal cause is that more gas has been used for power generation; an increase of just over 40 per cent due to the drop in coal-powered generation as plants become mothballed under the plans to close all coal-powered stations by 2025.
4.15 Final consumption also increased by 3.2 per cent with domestic consumption up around 5 per cent, the result of a colder winter in 2016 than in 2015 with the average number of heating degree days per month up to 7.7 in Q4 2016 in comparison to 5.5 in Q4 2015.
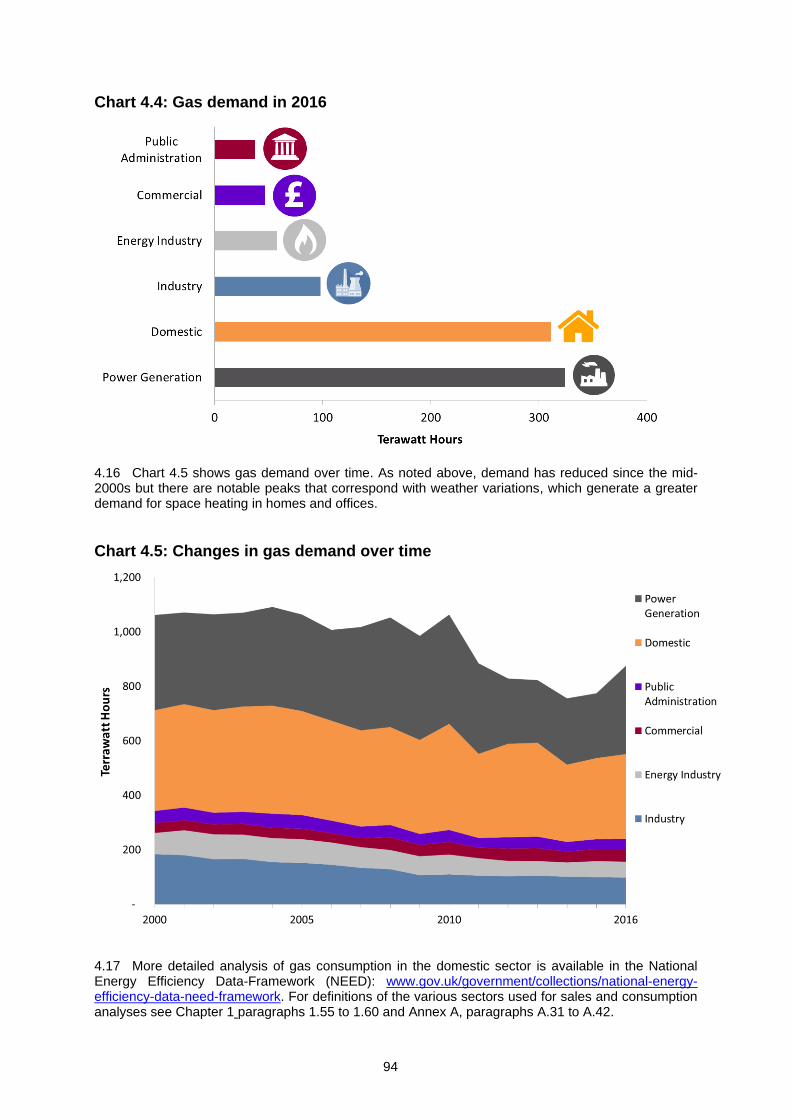
94
Chart 4.4: Gas demand in 2016
4.16 Chart 4.5 shows gas demand over time. As noted above, demand has reduced since the mid-2000s but there are notable peaks that correspond with weather variations, which generate a greater demand for space heating in homes and offices.
Chart 4.5: Changes in gas demand over time
4.17 More detailed analysis of gas consumption in the domestic sector is available in the National Energy Efficiency Data-Framework (NEED): www.gov.uk/government/collections/national-energy-efficiency-data-need-framework. For definitions of the various sectors used for sales and consumption analyses see Chapter 1 paragraphs 1.55 to 1.60 and Annex A, paragraphs A.31 to A.42.
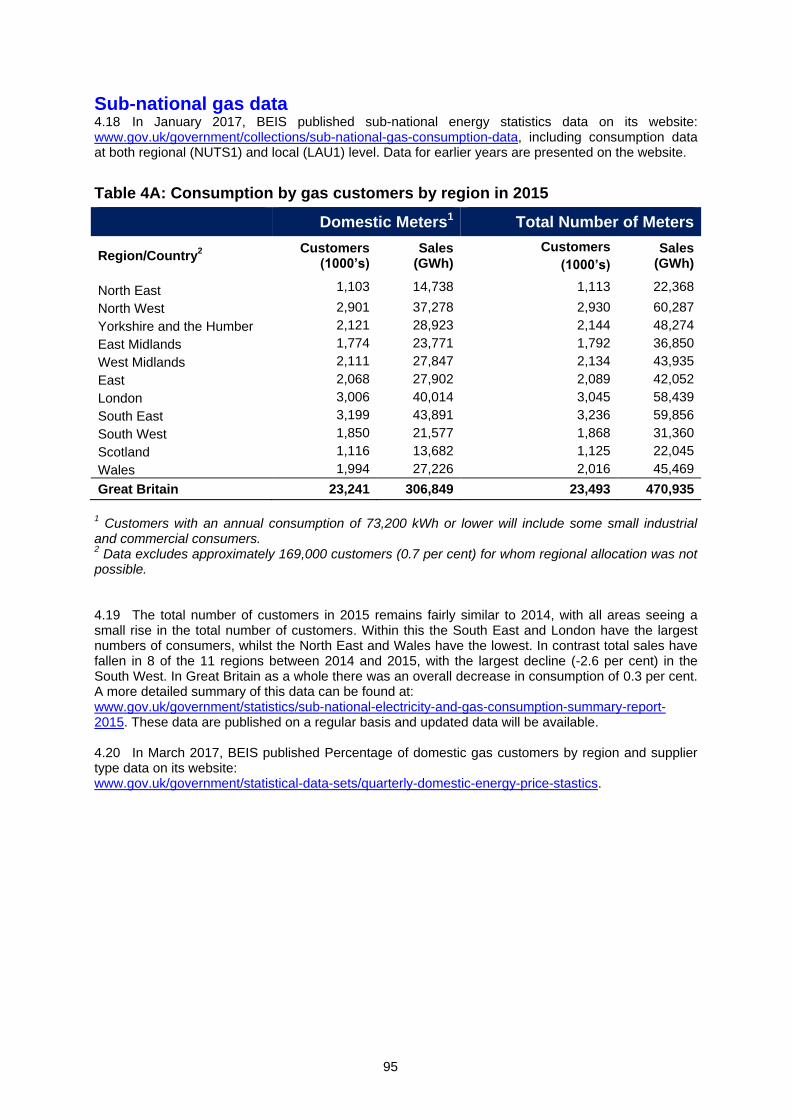
95
Sub-national gas data 4.18 In January 2017, BEIS published sub-national energy statistics data on its website: www.gov.uk/government/collections/sub-national-gas-consumption-data, including consumption data at both regional (NUTS1) and local (LAU1) level. Data for earlier years are presented on the website.
Table 4A: Consumption by gas customers by region in 2015 meters (1)
Domestic Meters1 Total Number of Meters
Region/Country2
Customers (1000’s)
Sales (GWh)
Customers
(1000’s)
Sales (GWh)
North East 1,103 14,738 1,113 22,368
North West 2,901 37,278 2,930 60,287
Yorkshire and the Humber 2,121 28,923 2,144 48,274
East Midlands 1,774 23,771 1,792 36,850
West Midlands 2,111 27,847 2,134 43,935
East 2,068 27,902 2,089 42,052
London 3,006 40,014 3,045 58,439
South East 3,199 43,891 3,236 59,856
South West 1,850 21,577 1,868 31,360
Scotland 1,116 13,682 1,125 22,045
Wales 1,994 27,226 2,016 45,469
Great Britain 23,241 306,849 23,493 470,935
1 Customers with an annual consumption of 73,200 kWh or lower will include some small industrial
and commercial consumers. 2 Data excludes approximately 169,000 customers (0.7 per cent) for whom regional allocation was not
possible.
4.19 The total number of customers in 2015 remains fairly similar to 2014, with all areas seeing a small rise in the total number of customers. Within this the South East and London have the largest numbers of consumers, whilst the North East and Wales have the lowest. In contrast total sales have fallen in 8 of the 11 regions between 2014 and 2015, with the largest decline (-2.6 per cent) in the South West. In Great Britain as a whole there was an overall decrease in consumption of 0.3 per cent. A more detailed summary of this data can be found at: www.gov.uk/government/statistics/sub-national-electricity-and-gas-consumption-summary-report-2015. These data are published on a regular basis and updated data will be available.
4.20 In March 2017, BEIS published Percentage of domestic gas customers by region and supplier type data on its website: www.gov.uk/government/statistical-data-sets/quarterly-domestic-energy-price-stastics.
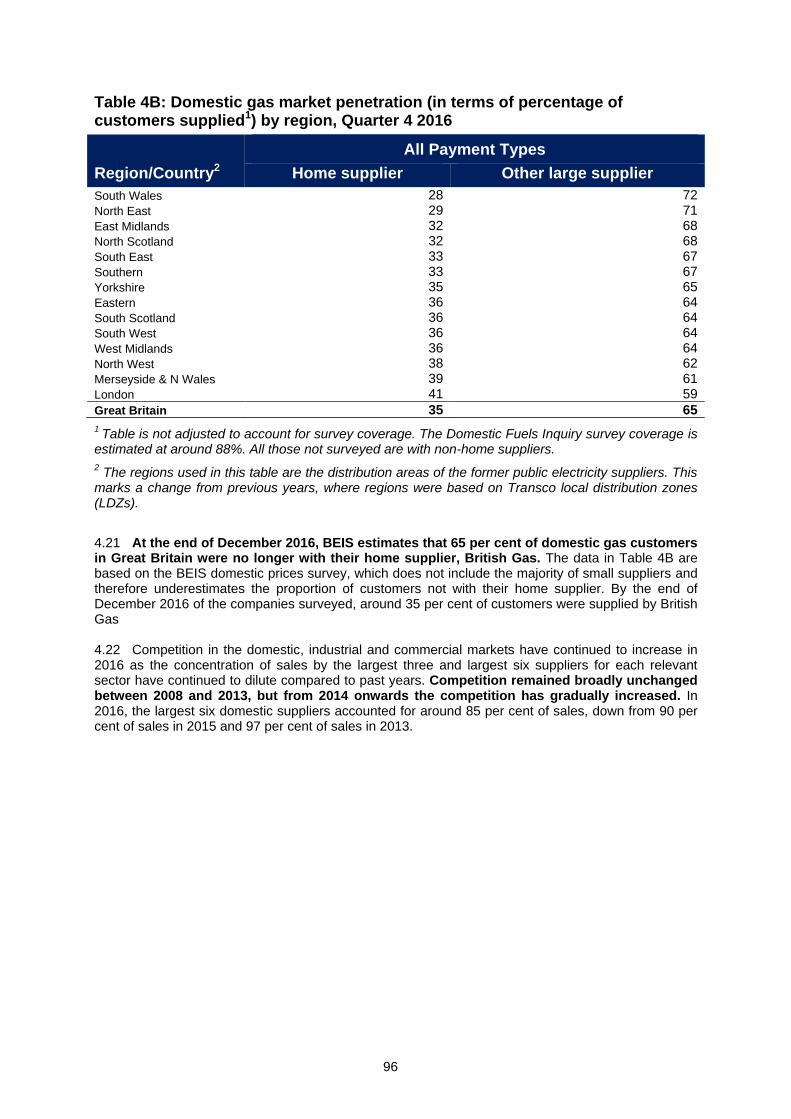
96
Table 4B: Domestic gas market penetration (in terms of percentage of customers supplied1) by region, Quarter 4 2016
Region/Country2
All Payment Types
Home supplier Other large supplier
South Wales 28 72
North East 29 71
East Midlands 32 68 North Scotland 32 68
South East 33 67
Southern 33 67 Yorkshire 35 65
Eastern 36 64
South Scotland 36 64
South West 36 64
West Midlands 36 64
North West 38 62
Merseyside & N Wales 39 61
London 41 59
Great Britain 35 65
1 Table is not adjusted to account for survey coverage. The Domestic Fuels Inquiry survey coverage is
estimated at around 88%. All those not surveyed are with non-home suppliers.
2 The regions used in this table are the distribution areas of the former public electricity suppliers. This
marks a change from previous years, where regions were based on Transco local distribution zones (LDZs).
4.21 At the end of December 2016, BEIS estimates that 65 per cent of domestic gas customers in Great Britain were no longer with their home supplier, British Gas. The data in Table 4B are based on the BEIS domestic prices survey, which does not include the majority of small suppliers and therefore underestimates the proportion of customers not with their home supplier. By the end of December 2016 of the companies surveyed, around 35 per cent of customers were supplied by British Gas 4.22 Competition in the domestic, industrial and commercial markets have continued to increase in 2016 as the concentration of sales by the largest three and largest six suppliers for each relevant sector have continued to dilute compared to past years. Competition remained broadly unchanged between 2008 and 2013, but from 2014 onwards the competition has gradually increased. In 2016, the largest six domestic suppliers accounted for around 85 per cent of sales, down from 90 per cent of sales in 2015 and 97 per cent of sales in 2013.
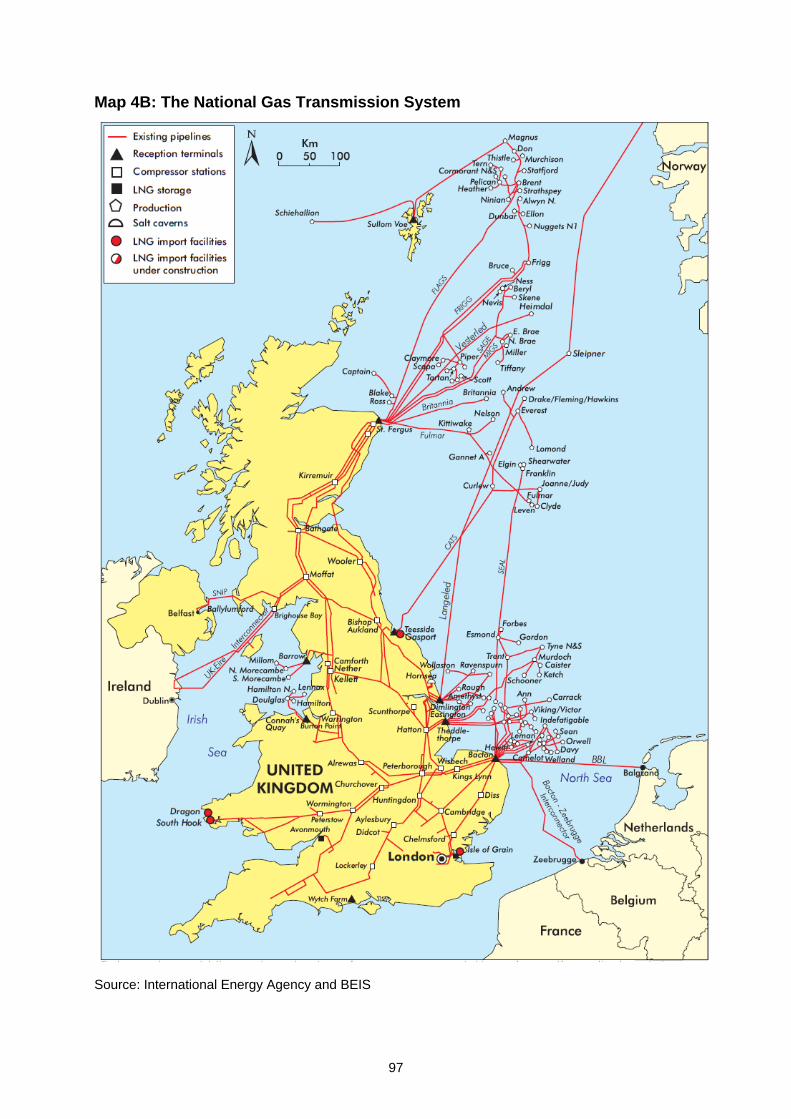
97
Map 4B: The National Gas Transmission System
Source: International Energy Agency and BEIS
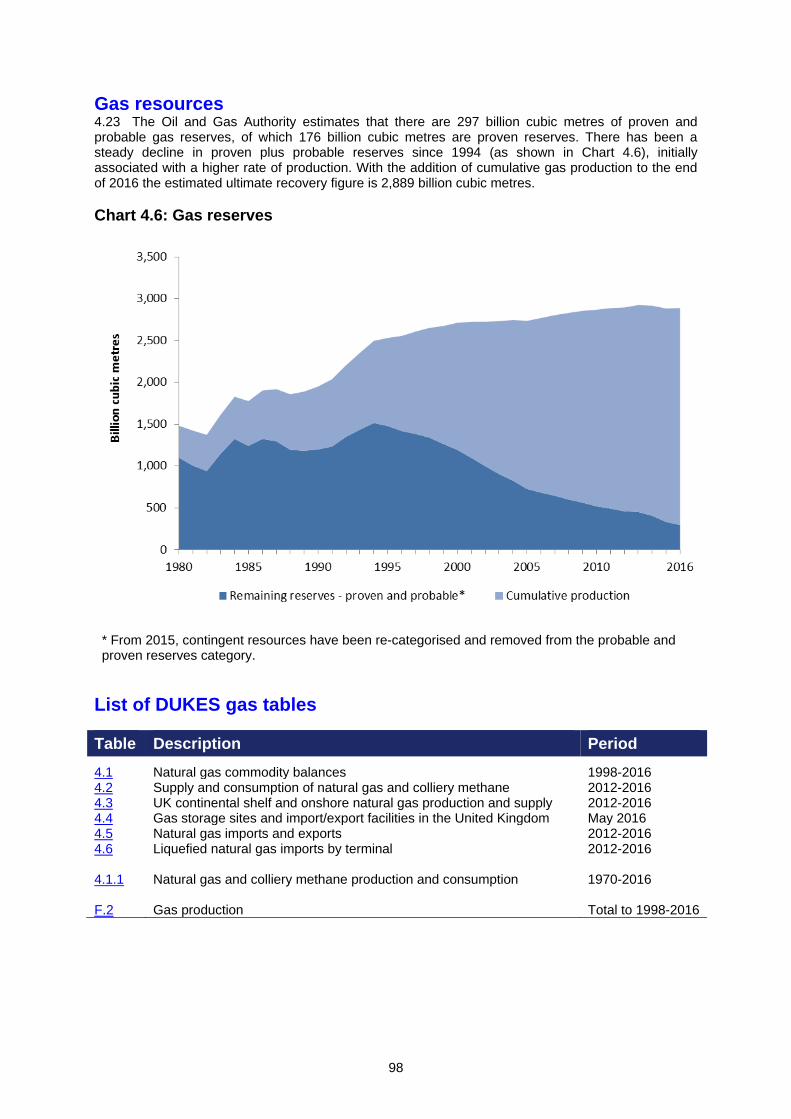
98
Gas resources 4.23 The Oil and Gas Authority estimates that there are 297 billion cubic metres of proven and probable gas reserves, of which 176 billion cubic metres are proven reserves. There has been a steady decline in proven plus probable reserves since 1994 (as shown in Chart 4.6), initially associated with a higher rate of production. With the addition of cumulative gas production to the end of 2016 the estimated ultimate recovery figure is 2,889 billion cubic metres.
Chart 4.6: Gas reserves
* From 2015, contingent resources have been re-categorised and removed from the probable and proven reserves category.
List of DUKES gas tables
Table Description Period
4.1 Natural gas commodity balances 1998-2016 4.2 Supply and consumption of natural gas and colliery methane 2012-2016 4.3 UK continental shelf and onshore natural gas production and supply 2012-2016 4.4 Gas storage sites and import/export facilities in the United Kingdom May 2016 4.5 Natural gas imports and exports 2012-2016 4.6 Liquefied natural gas imports by terminal 2012-2016 4.1.1 Natural gas and colliery methane production and consumption 1970-2016 F.2 Gas production Total to 1998-2016
99
Technical notes and definitions These notes and definitions are in addition to the technical notes and definitions covering all fuels and energy as a whole in Chapter 1, paragraphs 1.29 to 1.63. For notes on the commodity balances and definitions of the terms used in the row headings see Annex A, paragraphs A.7 to A.42. While the data in the pdf copy of this Digest cover only the most recent five years, these notes also cover data for earlier years that are available on the BEIS energy statistics web site.
Definitions used for production and consumption 4.24 Natural gas production in Tables 4.1 and 4.2 relates to the output of indigenous methane at land terminals and gas separation plants (includes producers’ and processors’ own use). For further explanation, see Annex F on BEIS’s energy statistics web site under ‘Production of gas’ - www.gov.uk/government/collections/digest-of-uk-energy-statistics-dukes. Output of the Norwegian share of the Frigg and Murchison fields is included under imports. A small quantity of onshore produced methane (other than colliery methane) is also included.
4.25 Colliery methane production is colliery methane piped to the surface and consumed at collieries or transmitted by pipeline to consumers. As the output of deep-mined coal declines so does the production of colliery methane, unless a use can be found for gas that was previously vented. The supply of methane from coal measures that are no longer being worked or from drilling into coal measures is licensed under the same legislation as used for offshore gas production.
4.26 Transfers of natural gas include natural gas use within the iron and steel industry for mixing with blast furnace gas to form a synthetic coke oven gas. For further details see paragraph 2.54 in Chapter 2.
4.27 Non-energy gas: Non-energy use is gas used as feedstock for petrochemical plants in the chemical industry as raw material for the production of ammonia (an essential intermediate chemical in the production of nitrogen fertilisers) and methanol. The contribution of liquefied petroleum gases (propane and butane) and other petroleum gases is shown in Tables 3.2 to 3.4 of Chapter 3. Firm data for natural gas are not available, but estimates for 2011 to 2015 are shown in Table 4.2 and estimates for 2013 to 2015 in Table 4.1. The estimates for the years up to 2011 have been obtained from AEA’s work for the National Atmospheric Emissions Inventory; 2012-13 data are BEIS extrapolations. For DUKES 2016, we will be exploring non-energy use in more detail to improve the accuracy of these data.
Sectors used for sales/consumption 4.28 For definitions of the various sectors used for sales and consumption analyses see Chapter 1 paragraphs 1.55 to 1.60 and Annex A, paragraphs A.31 to A.42.
Data collection 4.29 Production figures are generally obtained from returns made under OGA’s Petroleum Production Reporting System (PPRS). BEIS also obtain data on the transmission of natural gas from National Grid (who operate the National Transmission System) and from other pipeline operators. Data on consumption are based on returns from gas suppliers and UK Continental Shelf (UKCS) producers who supply gas directly to customers, (see paragraph 4.31). 4.30 The production data are for the UK (including natural gas from the UKCS - offshore and onshore). The restoration of a public gas supply to parts of Northern Ireland in 1997 means that all tables in this chapter, except Tables 4A and 4B, cover the UK.
4.31 BEIS carry out an annual survey of gas suppliers to obtain details of gas sales to the various categories of consumer. The larger gas suppliers (defined as those with more than about a 0.5 per cent share of the UK market up to 1997 and those known to supply more than 1,750 GWh per year for 1998 onwards) provide a detailed breakdown of sales for final consumption to BEIS on an annual basis. This provides the main data source for the UK’s gas demand. Prior to 2013 data, companies supplying less than 1,750 GWh provided gas sales as a single sum which was then apportioned across sectors using the same proportional split as seen in the data from the large suppliers. From 2013 onwards, data from smaller suppliers were provided broken down by broad sector (e.g. domestic, other industry etc.) to allow more accurate apportioning of these data.

100
4.32 Data on sectoral gas use are primarily derived from surveys of large and small gas suppliers. Beyond this, data for electricity generation by major power producers are adjusted, such that the data agree with a separate data set collected via the Major Power Producers’ (MPP) survey. Data for autogenerators are similarly adjusted to match CHP data (see Chapter 7) provided to BEIS, with the appropriate amount of gas used for autogeneration being subtracted from each sector and added to the autogeneration figure. The same methodology is applied for heat sold, which makes up the heat generation figure. For 2000 and subsequent years, gas consumption for the iron and steel sector is based on data provided by the Iron and Steel Statistics Bureau (ISSB) rather than gas suppliers since gas suppliers were over estimating their sales to this sector. The difference between the ISSB and gas suppliers’’ figures has been re-allocated to other sectors.
Methodology updates 4.33 Biomethane has been injected into the National Grid from certified Renewable Heat Incentive (RHI) installations since 2014. These volumes have been small, but increasing, with biomethane accounting for 0.2 per cent of supply in 2016. This gas is included in the transfers row in Tables 4.1, 4.2 and 4.3 in this chapter and separately identified in the monthly Energy Trends tables (see Energy Trends June 2017 special feature for details: www.gov.uk/government/uploads/system/uploads/attachment_data/file/622863/Enhancements_to_Energy_Trends_gas_tables.pdf). 4.34 In 2016 BEIS updated the methodology to calculate gas exports to the Republic of Ireland to remove virtual reverse flows, which ensures that only physical flows are reported in line with international reporting standards (see Energy Trends June 2017 special feature for details: www.gov.uk/government/uploads/system/uploads/attachment_data/file/622863/Enhancements_to_Energy_Trends_gas_tables.pdf). Along with this we have used two new data sources, one to identify gas sent to Northern Ireland to improve data capture and another to separately identify gas exports to the Isle of Man. The methodology to calculate exports to the Republic of Ireland is outlined below and illustrated in Figure 4.1:
1. National Grid provide BEIS with data for gas input into the transmission system, stock
changes, operator’s own use, exports through all interconnectors and gas output from the transmission system in the form of a GM10 report. The exports through all interconnectors are calculated by removing offtakes from Local Distribution Networks (LDZ) from gas transported through companies’ pipelines.
2. The export data provided by National Grid is the combined amount of gas sent through the Bacton and Moffat interconnectors along with the Scotland-Northern Ireland Pipeline (SNIP) and therefore is the gas sent out from Great Britain.
3. BEIS then remove gas exports to Belgium through the Bacton interconnector to leave a figure for the amount of gas sent through the Moffat Interconnector to the Republic of Ireland and the Isle of Man along with gas sent to Northern Ireland through the SNIP.
4. BEIS then remove the amount of gas sent to Northern Ireland from Moffat via the SNIP from shipping allocation data from Gas Networks Ireland (GNI).
5. This figure for the Moffat Interconnector from National Grid is currently the nominated flow to Ireland. Therefore, BEIS remove the Virtual Reverse Flow (VRF) from Ireland to the UK to gain a physical flow to ensure that reporting is consistent with methodology from the International Energy Agency (IEA) and Eurostat.
6. The gas taken off on the interconnector to the Isle of Man (data provided by Manx Utilities) is then removed to obtain a figure for the amount of gas exported to the Republic of Ireland.
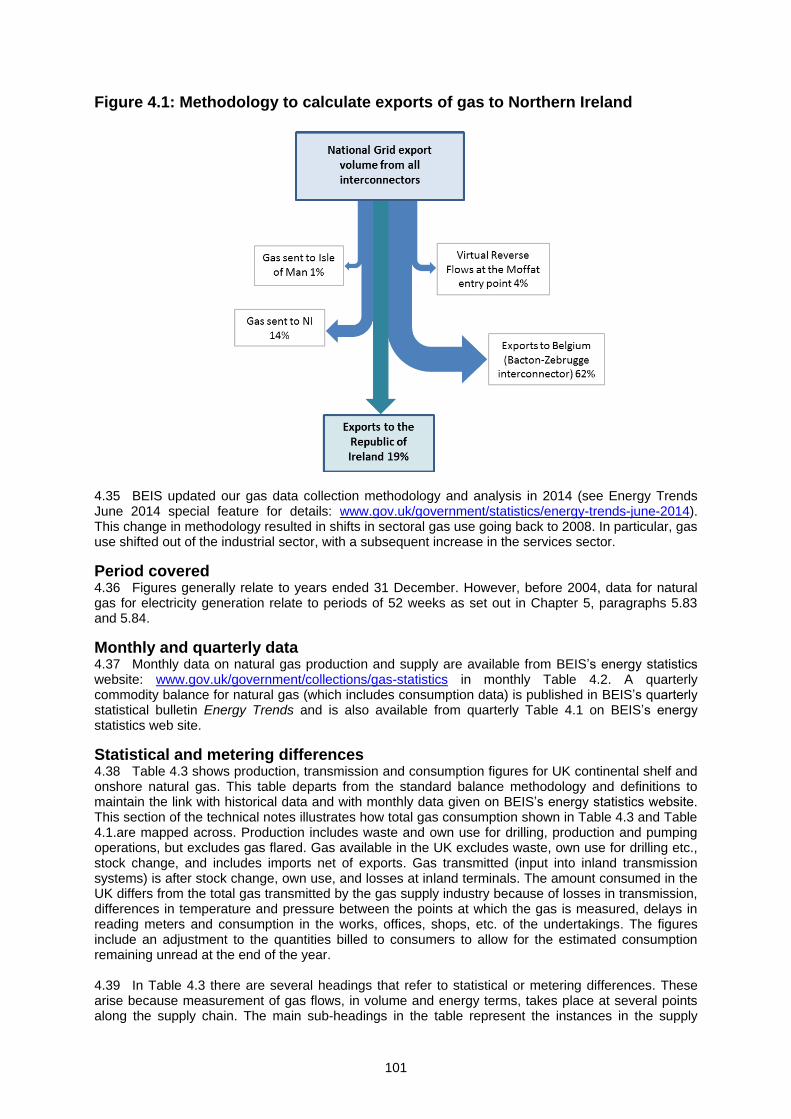
101
Figure 4.1: Methodology to calculate exports of gas to Northern Ireland
4.35 BEIS updated our gas data collection methodology and analysis in 2014 (see Energy Trends June 2014 special feature for details: www.gov.uk/government/statistics/energy-trends-june-2014). This change in methodology resulted in shifts in sectoral gas use going back to 2008. In particular, gas use shifted out of the industrial sector, with a subsequent increase in the services sector.
Period covered 4.36 Figures generally relate to years ended 31 December. However, before 2004, data for natural gas for electricity generation relate to periods of 52 weeks as set out in Chapter 5, paragraphs 5.83 and 5.84.
Monthly and quarterly data 4.37 Monthly data on natural gas production and supply are available from BEIS’s energy statistics website: www.gov.uk/government/collections/gas-statistics in monthly Table 4.2. A quarterly commodity balance for natural gas (which includes consumption data) is published in BEIS’s quarterly statistical bulletin Energy Trends and is also available from quarterly Table 4.1 on BEIS’s energy statistics web site.
Statistical and metering differences 4.38 Table 4.3 shows production, transmission and consumption figures for UK continental shelf and onshore natural gas. This table departs from the standard balance methodology and definitions to maintain the link with historical data and with monthly data given on BEIS’s energy statistics website. This section of the technical notes illustrates how total gas consumption shown in Table 4.3 and Table 4.1.are mapped across. Production includes waste and own use for drilling, production and pumping operations, but excludes gas flared. Gas available in the UK excludes waste, own use for drilling etc., stock change, and includes imports net of exports. Gas transmitted (input into inland transmission systems) is after stock change, own use, and losses at inland terminals. The amount consumed in the UK differs from the total gas transmitted by the gas supply industry because of losses in transmission, differences in temperature and pressure between the points at which the gas is measured, delays in reading meters and consumption in the works, offices, shops, etc. of the undertakings. The figures include an adjustment to the quantities billed to consumers to allow for the estimated consumption remaining unread at the end of the year.
4.39 In Table 4.3 there are several headings that refer to statistical or metering differences. These arise because measurement of gas flows, in volume and energy terms, takes place at several points along the supply chain. The main sub-headings in the table represent the instances in the supply
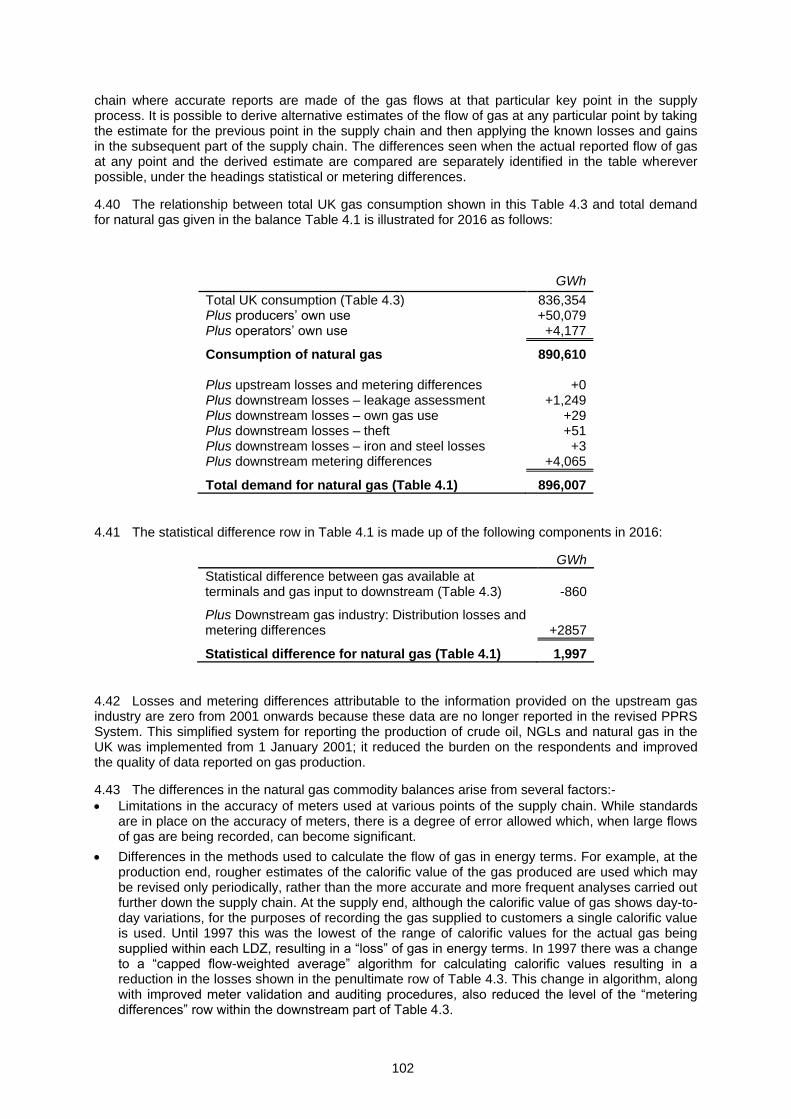
102
chain where accurate reports are made of the gas flows at that particular key point in the supply process. It is possible to derive alternative estimates of the flow of gas at any particular point by taking the estimate for the previous point in the supply chain and then applying the known losses and gains in the subsequent part of the supply chain. The differences seen when the actual reported flow of gas at any point and the derived estimate are compared are separately identified in the table wherever possible, under the headings statistical or metering differences.
4.40 The relationship between total UK gas consumption shown in this Table 4.3 and total demand for natural gas given in the balance Table 4.1 is illustrated for 2016 as follows:
GWh
Total UK consumption (Table 4.3) 836,354 Plus producers’ own use +50,079 Plus operators’ own use +4,177
Consumption of natural gas 890,610 Plus upstream losses and metering differences +0 Plus downstream losses – leakage assessment +1,249 Plus downstream losses – own gas use +29 Plus downstream losses – theft +51 Plus downstream losses – iron and steel losses +3 Plus downstream metering differences +4,065
Total demand for natural gas (Table 4.1) 896,007
4.41 The statistical difference row in Table 4.1 is made up of the following components in 2016:
GWh
Statistical difference between gas available at terminals and gas input to downstream (Table 4.3) -860
Plus Downstream gas industry: Distribution losses and metering differences
+2857
Statistical difference for natural gas (Table 4.1) 1,997
4.42 Losses and metering differences attributable to the information provided on the upstream gas industry are zero from 2001 onwards because these data are no longer reported in the revised PPRS System. This simplified system for reporting the production of crude oil, NGLs and natural gas in the UK was implemented from 1 January 2001; it reduced the burden on the respondents and improved the quality of data reported on gas production.
4.43 The differences in the natural gas commodity balances arise from several factors:-
Limitations in the accuracy of meters used at various points of the supply chain. While standards are in place on the accuracy of meters, there is a degree of error allowed which, when large flows of gas are being recorded, can become significant.
Differences in the methods used to calculate the flow of gas in energy terms. For example, at the production end, rougher estimates of the calorific value of the gas produced are used which may be revised only periodically, rather than the more accurate and more frequent analyses carried out further down the supply chain. At the supply end, although the calorific value of gas shows day-to-day variations, for the purposes of recording the gas supplied to customers a single calorific value is used. Until 1997 this was the lowest of the range of calorific values for the actual gas being supplied within each LDZ, resulting in a “loss” of gas in energy terms. In 1997 there was a change to a “capped flow-weighted average” algorithm for calculating calorific values resulting in a reduction in the losses shown in the penultimate row of Table 4.3. This change in algorithm, along with improved meter validation and auditing procedures, also reduced the level of the “metering differences” row within the downstream part of Table 4.3.

103
Differences in temperature and pressure between the various points at which gas is measured. Until February 1997 British Gas used “uncorrected therms” on their billing system for tariff customers when converting from a volume measure of the gas used to an energy measure. This made their supply figure too small by a factor of 2.2 per cent, equivalent to about 1 per cent of the wholesale market.
Differences in the timing of reading meters. While National Transmission System meters are read daily, customers’ meters are read less frequently (perhaps only annually for some domestic customers) and profiling is used to estimate consumption. Profiling will tend to underestimate consumption in a strongly rising market.
Other losses from the system, for example theft through meter tampering by consumers. 4.44 The headings in Table 4.3 show where, in the various stages of the supply process, it has been possible to identify these metering differences as having an effect. Usually they are aggregated with other net losses as the two factors cannot be separated. Whilst the factors listed above can give rise to either losses or gains, losses are more common. However, the negative downstream gas metering difference within the transmission system in 2003 was an anomaly that was investigated by National Grid during 2004. They concluded that this unaccounted for element of National Transmission System shrinkage was due to an exceptional run of monthly negative figures between February and June 2003 within what is usually a variable but mainly positive series. However, after a comprehensive investigation of this exceptional period no causal factors were identified. It is probable that the meter error or errors that caused this issue were corrected during the validation of metering.
4.45 Care should be exercised in interpreting the figures for individual industries in these commodity balance tables. As companies switch contracts between gas suppliers, it has not been possible to ensure consistent classification between and within industry sectors and across years. The breakdown of final consumption includes a substantial amount of estimated data prior to 2013.
Contacts:
Warren Evans Energy Statistics Team [email protected] 0300 068 5059 Matthew Curds (upstream gas) Energy Statistics Team [email protected] 0300 068 8414 James Halliwell (downstream gas) Energy Statistics Team [email protected] 0300 068 8121

104
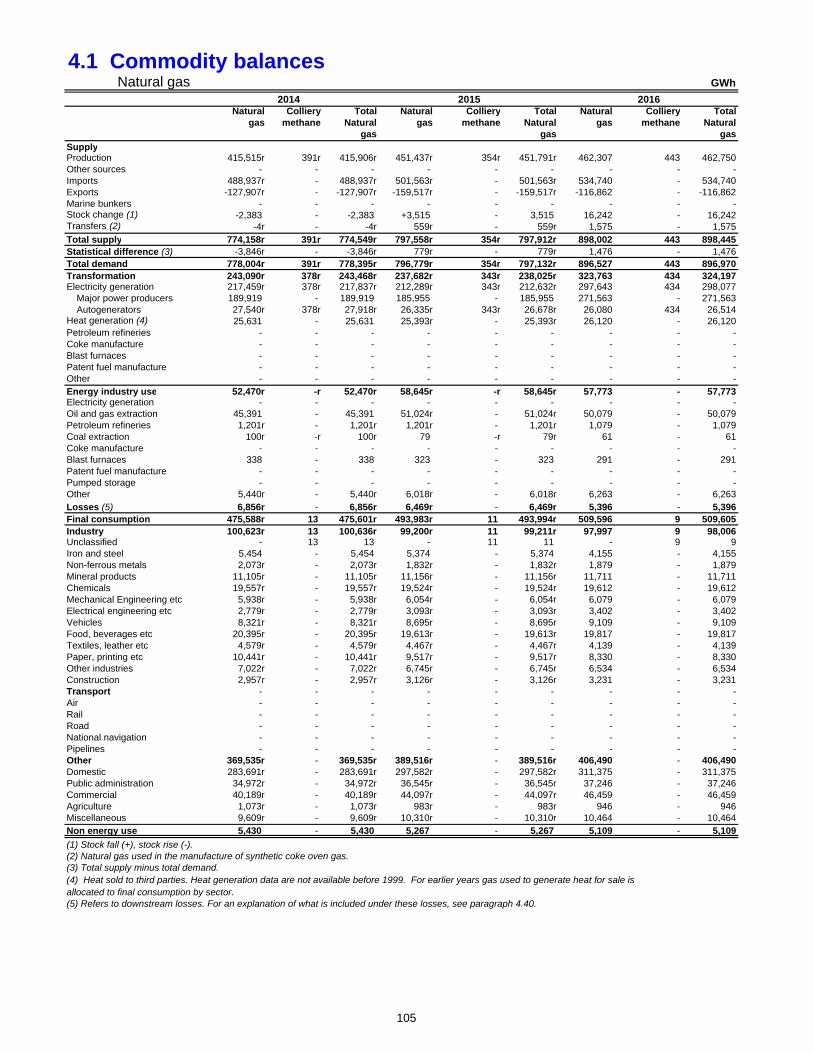
4.1 Commodity balances Natural gas GWh
Natural Colliery Total Natural Colliery Total Natural Colliery Totalgas methane Natural gas methane Natural gas methane Natural
gas gas gasSupplyProduction 415,515r 391r 415,906r 451,437r 354r 451,791r 462,307 443 462,750Other sources - - - - - - - - -Imports 488,937r - 488,937r 501,563r - 501,563r 534,740 - 534,740Exports -127,907r - -127,907r -159,517r - -159,517r -116,862 - -116,862Marine bunkers - - - - - - - - -Stock change (1) -2,383 - -2,383 +3,515 - 3,515 16,242 - 16,242Transfers (2) -4r - -4r 559r - 559r 1,575 - 1,575Total supply 774,158r 391r 774,549r 797,558r 354r 797,912r 898,002 443 898,445Statistical difference (3) -3,846r - -3,846r 779r - 779r 1,476 - 1,476Total demand 778,004r 391r 778,395r 796,779r 354r 797,132r 896,527 443 896,970Transformation 243,090r 378r 243,468r 237,682r 343r 238,025r 323,763 434 324,197Electricity generation 217,459r 378r 217,837r 212,289r 343r 212,632r 297,643 434 298,077
Major power producers 189,919 - 189,919 185,955 - 185,955 271,563 - 271,563Autogenerators 27,540r 378r 27,918r 26,335r 343r 26,678r 26,080 434 26,514
Heat generation (4) 25,631 - 25,631 25,393r - 25,393r 26,120 - 26,120Petroleum refineries - - - - - - - - -Coke manufacture - - - - - - - - -Blast furnaces - - - - - - - - -Patent fuel manufacture - - - - - - - - -Other - - - - - - - - -Energy industry use 52,470r -r 52,470r 58,645r -r 58,645r 57,773 - 57,773Electricity generation - - - - - - - - -Oil and gas extraction 45,391 - 45,391 51,024r - 51,024r 50,079 - 50,079Petroleum refineries 1,201r - 1,201r 1,201r - 1,201r 1,079 - 1,079Coal extraction 100r -r 100r 79 -r 79r 61 - 61Coke manufacture - - - - - - - - -Blast furnaces 338 - 338 323 - 323 291 - 291Patent fuel manufacture - - - - - - - - -Pumped storage - - - - - - - - -Other 5,440r - 5,440r 6,018r - 6,018r 6,263 - 6,263Losses (5) 6,856r - 6,856r 6,469r - 6,469r 5,396 - 5,396Final consumption 475,588r 13 475,601r 493,983r 11 493,994r 509,596 9 509,605Industry 100,623r 13 100,636r 99,200r 11 99,211r 97,997 9 98,006Unclassified - 13 13 - 11 11 - 9 9Iron and steel 5,454 - 5,454 5,374 - 5,374 4,155 - 4,155Non-ferrous metals 2,073r - 2,073r 1,832r - 1,832r 1,879 - 1,879Mineral products 11,105r - 11,105r 11,156r - 11,156r 11,711 - 11,711Chemicals 19,557r - 19,557r 19,524r - 19,524r 19,612 - 19,612Mechanical Engineering etc 5,938r - 5,938r 6,054r - 6,054r 6,079 - 6,079Electrical engineering etc 2,779r - 2,779r 3,093r - 3,093r 3,402 - 3,402Vehicles 8,321r - 8,321r 8,695r - 8,695r 9,109 - 9,109Food, beverages etc 20,395r - 20,395r 19,613r - 19,613r 19,817 - 19,817Textiles, leather etc 4,579r - 4,579r 4,467r - 4,467r 4,139 - 4,139Paper, printing etc 10,441r - 10,441r 9,517r - 9,517r 8,330 - 8,330Other industries 7,022r - 7,022r 6,745r - 6,745r 6,534 - 6,534Construction 2,957r - 2,957r 3,126r - 3,126r 3,231 - 3,231Transport - - - - - - - - -Air - - - - - - - - -Rail - - - - - - - - -Road - - - - - - - - -National navigation - - - - - - - - -Pipelines - - - - - - - - -Other 369,535r - 369,535r 389,516r - 389,516r 406,490 - 406,490Domestic 283,691r - 283,691r 297,582r - 297,582r 311,375 - 311,375Public administration 34,972r - 34,972r 36,545r - 36,545r 37,246 - 37,246Commercial 40,189r - 40,189r 44,097r - 44,097r 46,459 - 46,459Agriculture 1,073r - 1,073r 983r - 983r 946 - 946Miscellaneous 9,609r - 9,609r 10,310r - 10,310r 10,464 - 10,464Non energy use 5,430 - 5,430 5,267 - 5,267 5,109 - 5,109
(1) Stock fall (+), stock rise (-).(2) Natural gas used in the manufacture of synthetic coke oven gas.(3) Total supply minus total demand.(4) Heat sold to third parties. Heat generation data are not available before 1999. For earlier years gas used to generate heat for sale is allocated to final consumption by sector.(5) Refers to downstream losses. For an explanation of what is included under these losses, see paragraph 4.40.
2014 2015 2016
105
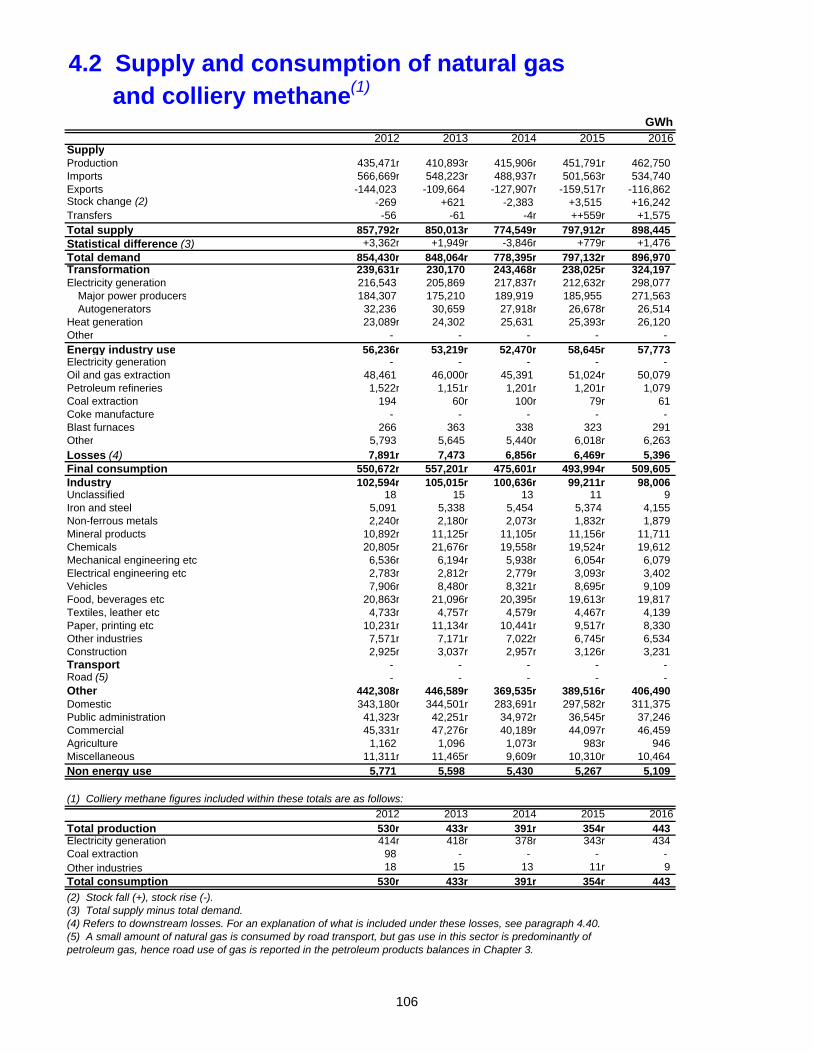
4.2 Supply and consumption of natural gas and colliery methane(1)
GWh 2012 2013 2014 2015 2016SupplyProduction 435,471r 410,893r 415,906r 451,791r 462,750 Imports 566,669r 548,223r 488,937r 501,563r 534,740 Exports -144,023 -109,664 -127,907r -159,517r -116,862 Stock change (2) -269 +621 -2,383 +3,515 +16,242 Transfers -56 -61 -4r ++559r +1,575 Total supply 857,792r 850,013r 774,549r 797,912r 898,445 Statistical difference (3) +3,362r +1,949r -3,846r +779r +1,476 Total demand 854,430r 848,064r 778,395r 797,132r 896,970 Transformation 239,631r 230,170 243,468r 238,025r 324,197 Electricity generation 216,543 205,869 217,837r 212,632r 298,077
Major power producers 184,307 175,210 189,919 185,955 271,563 Autogenerators 32,236 30,659 27,918r 26,678r 26,514
Heat generation 23,089r 24,302 25,631 25,393r 26,120 Other - - - - - Energy industry use 56,236r 53,219r 52,470r 58,645r 57,773 Electricity generation - - - - - Oil and gas extraction 48,461 46,000r 45,391 51,024r 50,079 Petroleum refineries 1,522r 1,151r 1,201r 1,201r 1,079 Coal extraction 194 60r 100r 79r 61 Coke manufacture - - - - - Blast furnaces 266 363 338 323 291 Other 5,793 5,645 5,440r 6,018r 6,263
Losses (4) 7,891r 7,473 6,856r 6,469r 5,396 Final consumption 550,672r 557,201r 475,601r 493,994r 509,605 Industry 102,594r 105,015r 100,636r 99,211r 98,006 Unclassified 18 15 13 11 9 Iron and steel 5,091 5,338 5,454 5,374 4,155 Non-ferrous metals 2,240r 2,180r 2,073r 1,832r 1,879 Mineral products 10,892r 11,125r 11,105r 11,156r 11,711 Chemicals 20,805r 21,676r 19,558r 19,524r 19,612 Mechanical engineering etc 6,536r 6,194r 5,938r 6,054r 6,079 Electrical engineering etc 2,783r 2,812r 2,779r 3,093r 3,402 Vehicles 7,906r 8,480r 8,321r 8,695r 9,109 Food, beverages etc 20,863r 21,096r 20,395r 19,613r 19,817 Textiles, leather etc 4,733r 4,757r 4,579r 4,467r 4,139 Paper, printing etc 10,231r 11,134r 10,441r 9,517r 8,330 Other industries 7,571r 7,171r 7,022r 6,745r 6,534 Construction 2,925r 3,037r 2,957r 3,126r 3,231 Transport - - - - - Road (5) - - - - - Other 442,308r 446,589r 369,535r 389,516r 406,490 Domestic 343,180r 344,501r 283,691r 297,582r 311,375 Public administration 41,323r 42,251r 34,972r 36,545r 37,246 Commercial 45,331r 47,276r 40,189r 44,097r 46,459 Agriculture 1,162 1,096 1,073r 983r 946 Miscellaneous 11,311r 11,465r 9,609r 10,310r 10,464 Non energy use 5,771 5,598 5,430 5,267 5,109
(1) Colliery methane figures included within these totals are as follows:
2012 2013 2014 2015 2016Total production 530r 433r 391r 354r 443 Electricity generation 414r 418r 378r 343r 434 Coal extraction 98 - - - - Other industries 18 15 13 11r 9 Total consumption 530r 433r 391r 354r 443
(2) Stock fall (+), stock rise (-).(3) Total supply minus total demand.(4) Refers to downstream losses. For an explanation of what is included under these losses, see paragraph 4.40.(5) A small amount of natural gas is consumed by road transport, but gas use in this sector is predominantly of petroleum gas, hence road use of gas is reported in the petroleum products balances in Chapter 3.
106
4.3 UK continental shelf and onshore natural gas production and supply(1)
GWh
2012 2013 2014 2015 2016
Upstream gas industry:Gross production (2) 434,941r 410,460r 415,515r 451,437r 462307
Minus Producers' own use (3) 48,461 46,000r 45,391 51,024r 50079
Exports 144,023 109,664 127,907r 159,517r 116862
Plus Imports of gas 566,669r 548,223r 488,937r 501,563r 534740
Gas available at terminals (4) 809,127r 803,019r 731,153r 742,459r 830106
Minus Statistical difference (5) -333r -459r -984r 921r -860
Downstream gas industry:Gas input into the national transmission system (6) 809,460 803,478 732,137r 741,539r 830966
Minus Operators' own use (7) 3,900 3,534 3,331r 4,009r 4177
Stock change (storage sites) (8) 269 -621 2,383 -3,515 -16242
Metering differences (5) 6,099 5,697 5,302 5,219r 4065
Gas output from the national transmission system (9) 799,191 794,869 721,121 735,826r 838966
Minus Leakage assessment (10) 1,537 1,537 1,370 1,070 1249
Own use gas (11) 34 34 30 30 29
Theft (12) 218r 203 153r 148r 51
Transfers (13) 56 61 4r -559r -1575
Losses (14) 3 2 1 2 3
Statistical difference and metering differences (5) 3,695r 2,407r -2,862r -141r 2335Total UK consumption (15) 793,649r 790,624r 722,425r 735,277r 836875
Stocks of gas (at end year) (16) 46,422r 45,801r 48,184r 44,669r 28427Storage capacity (17) 47,861r 51,059r 50,728r 50,949r 52294
(1) For details of where to find monthly updates of natural gas production and supply see paragraph 4.37.(2) Includes waste and producers' own use, but excludes gas flared.(3) Gas used for drilling, production and pumping operations.(4) The volume of gas available at terminals for consumption in the UK as recorded by the terminal operators.(5) Measurement of gas flows, in volume and energy terms, occurs at several points along the supply chain. As such, differences are seen between the actual recorded flow through any one point and estimates calculated for the flow of gas at that point. More detail on the reasons for these differences is given in the technical notes and definitions section of this chapter, paragraphs 4.38 to 4.43.(6) Gas received as reported by the pipeline operators. The pipeline operators include National Grid, who run the national pipeline network, and other pipelines that take North Sea gas supplies direct to consumers.(7) Gas consumed by pipeline operators in pumping operations and on their own sites. (8) Stocks of gas held in specific storage sites, either as liquefied natural gas, pumped into salt cavities or stored by pumping the gas back into an offshore field. Stock rise (+), stock fall (-).(9) Including public gas supply, direct supplies by North Sea producers, third party supplies and stock changes.(10) This is a National Grid assessment of leakage through the local distribution system based on the National Leakage Reduction Monitoring Model. (11) Currently quivalent to about 0.0113 per cent of LDZ throughput, this is an assessment of the energy used to counter the effects of gas cooling on pressure reduction.(12) Calculated by National Grid as 0.02 per cent of LDZ throughput, this is theft before the gas reaches customer meters.(13) Transfers are the use within the iron and steel industry for the manufacture of synthetic coke oven gas.(14) Data for losses from the Iron and Steel Statistics Bureau Survey, converted from gigajoules to GWh assuming 0.2778 terajoules per GWh(15) See paragraph 4.40 for an explanation of the relationship between these "Total UK consumption" figures and "Total demand" shown within the balance tables.(16) Due to storage reconciliations, own use and metering differences, over a long period of years the stock levels based on gas put into storage and gas taken out of storage no longer reconciled with storage levels reported by National Grid. For 2011 action was taken to rectify this.(17) Data compiled by BEIS from individual storage site information. Converted from billion cubic metres to GWh assuming 11.02 kWh per cubic metre.
107
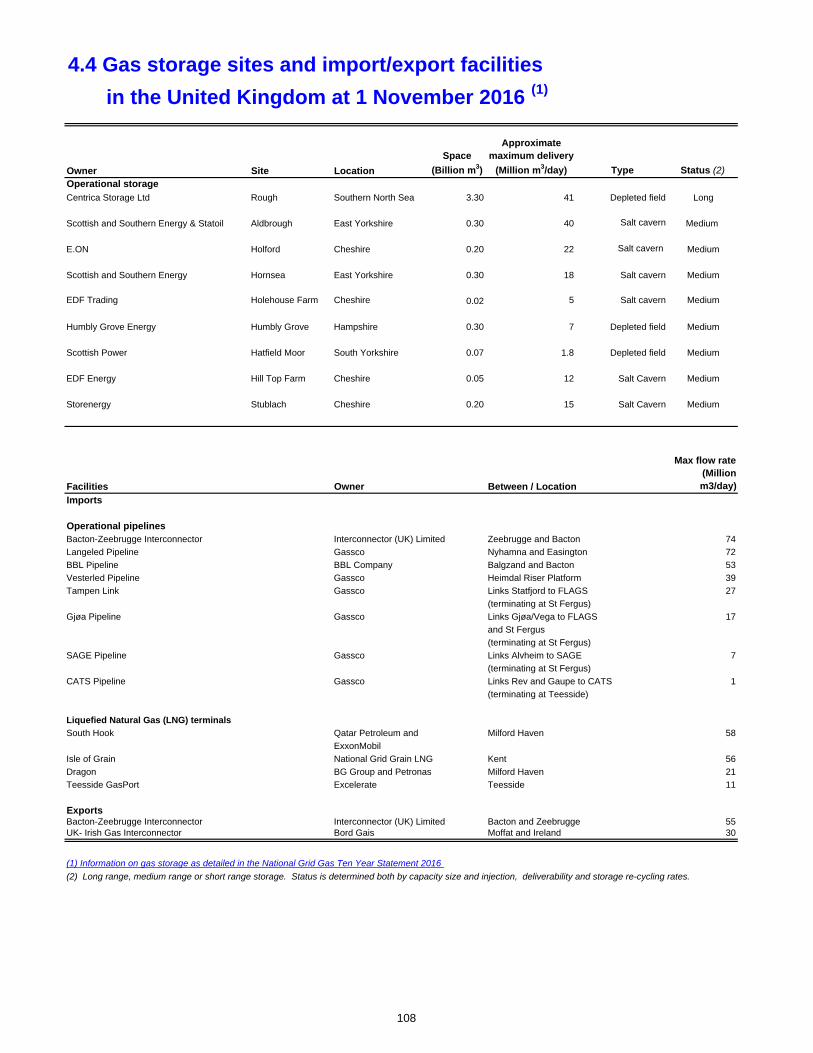
4.4 Gas storage sites and import/export facilities
Owner Site Location
Space
(Billion m3)
Approximate maximum delivery
(Million m3/day) Type Status (2)Operational storageCentrica Storage Ltd Rough Southern North Sea 3.30 41 Depleted field Long
Scottish and Southern Energy & Statoil Aldbrough East Yorkshire 0.30 40 Salt cavern Medium
E.ON Holford Cheshire 0.20 22 Salt cavern Medium
Scottish and Southern Energy Hornsea East Yorkshire 0.30 18 Salt cavern Medium
EDF Trading Holehouse Farm Cheshire 0.02 5 Salt cavern Medium
Humbly Grove Energy Humbly Grove Hampshire 0.30 7 Depleted field Medium
Scottish Power Hatfield Moor South Yorkshire 0.07 1.8 Depleted field Medium
EDF Energy Hill Top Farm Cheshire 0.05 12 Salt Cavern Medium
Storenergy Stublach Cheshire 0.20 15 Salt Cavern Medium
Facilities Owner Between / Location
Max flow rate (Million m3/day)
Imports
Operational pipelinesBacton-Zeebrugge Interconnector Interconnector (UK) Limited Zeebrugge and Bacton 74
Langeled Pipeline Gassco Nyhamna and Easington 72
BBL Pipeline BBL Company Balgzand and Bacton 53
Vesterled Pipeline Gassco Heimdal Riser Platform 39
Tampen Link Gassco Links Statfjord to FLAGS 27
(terminating at St Fergus)
Gjøa Pipeline Gassco Links Gjøa/Vega to FLAGS 17
and St Fergus
(terminating at St Fergus)
SAGE Pipeline Gassco Links Alvheim to SAGE 7
(terminating at St Fergus)
CATS Pipeline Gassco Links Rev and Gaupe to CATS 1
(terminating at Teesside)
Liquefied Natural Gas (LNG) terminals
South Hook Qatar Petroleum and Milford Haven 58
ExxonMobil
Isle of Grain National Grid Grain LNG Kent 56
Dragon BG Group and Petronas Milford Haven 21
Teesside GasPort Excelerate Teesside 11
ExportsBacton-Zeebrugge Interconnector Interconnector (UK) Limited Bacton and Zeebrugge 55UK- Irish Gas Interconnector Bord Gais Moffat and Ireland 30
(1) Information on gas storage as detailed in the National Grid Gas Ten Year Statement 2016
in the United Kingdom at 1 November 2016 (1)
(2) Long range, medium range or short range storage. Status is determined both by capacity size and injection, deliverability and storage re-cycling rates.
108
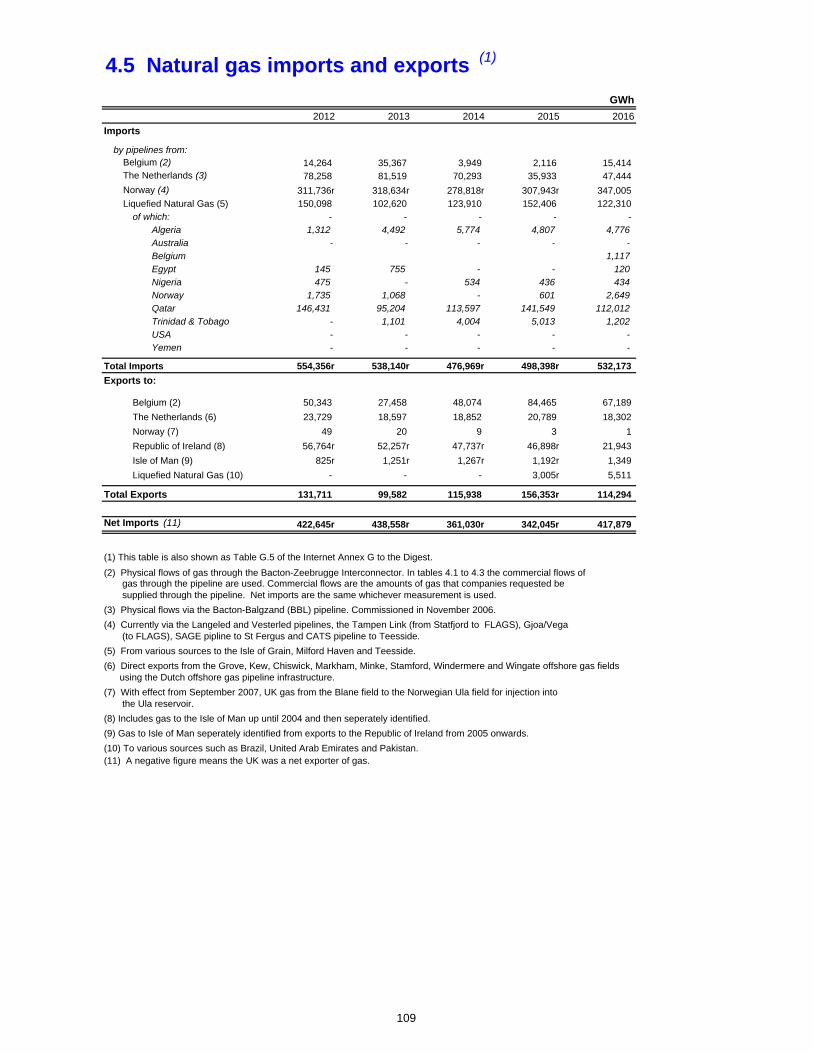
4.5 Natural gas imports and exports (1)
GWh
2012 2013 2014 2015 2016
Imports
by pipelines from:Belgium (2) 14,264 35,367 3,949 2,116 15,414 The Netherlands (3) 78,258 81,519 70,293 35,933 47,444
Norway (4) 311,736r 318,634r 278,818r 307,943r 347,005 Liquefied Natural Gas (5) 150,098 102,620 123,910 152,406 122,310
of which: - - - - - Algeria 1,312 4,492 5,774 4,807 4,776 Australia - - - - - Belgium 1,117 Egypt 145 755 - - 120 Nigeria 475 - 534 436 434 Norway 1,735 1,068 - 601 2,649 Qatar 146,431 95,204 113,597 141,549 112,012 Trinidad & Tobago - 1,101 4,004 5,013 1,202 USA - - - - - Yemen - - - - -
Total Imports 554,356r 538,140r 476,969r 498,398r 532,173
Exports to:
Belgium (2) 50,343 27,458 48,074 84,465 67,189
The Netherlands (6) 23,729 18,597 18,852 20,789 18,302
Norway (7) 49 20 9 3 1
Republic of Ireland (8) 56,764r 52,257r 47,737r 46,898r 21,943
Isle of Man (9) 825r 1,251r 1,267r 1,192r 1,349
Liquefied Natural Gas (10) - - - 3,005r 5,511
Total Exports 131,711 99,582 115,938 156,353r 114,294
Net Imports (11) 422,645r 438,558r 361,030r 342,045r 417,879
(1) This table is also shown as Table G.5 of the Internet Annex G to the Digest.
(2) Physical flows of gas through the Bacton-Zeebrugge Interconnector. In tables 4.1 to 4.3 the commercial flows of gas through the pipeline are used. Commercial flows are the amounts of gas that companies requested be supplied through the pipeline. Net imports are the same whichever measurement is used.
(3) Physical flows via the Bacton-Balgzand (BBL) pipeline. Commissioned in November 2006.
(4) Currently via the Langeled and Vesterled pipelines, the Tampen Link (from Statfjord to FLAGS), Gjoa/Vega (to FLAGS), SAGE pipline to St Fergus and CATS pipeline to Teesside.
(5) From various sources to the Isle of Grain, Milford Haven and Teesside.
(6) Direct exports from the Grove, Kew, Chiswick, Markham, Minke, Stamford, Windermere and Wingate offshore gas fields using the Dutch offshore gas pipeline infrastructure.
(7) With effect from September 2007, UK gas from the Blane field to the Norwegian Ula field for injection into the Ula reservoir.
(8) Includes gas to the Isle of Man up until 2004 and then seperately identified.
(9) Gas to Isle of Man seperately identified from exports to the Republic of Ireland from 2005 onwards.
(10) To various sources such as Brazil, United Arab Emirates and Pakistan.(11) A negative figure means the UK was a net exporter of gas.
109
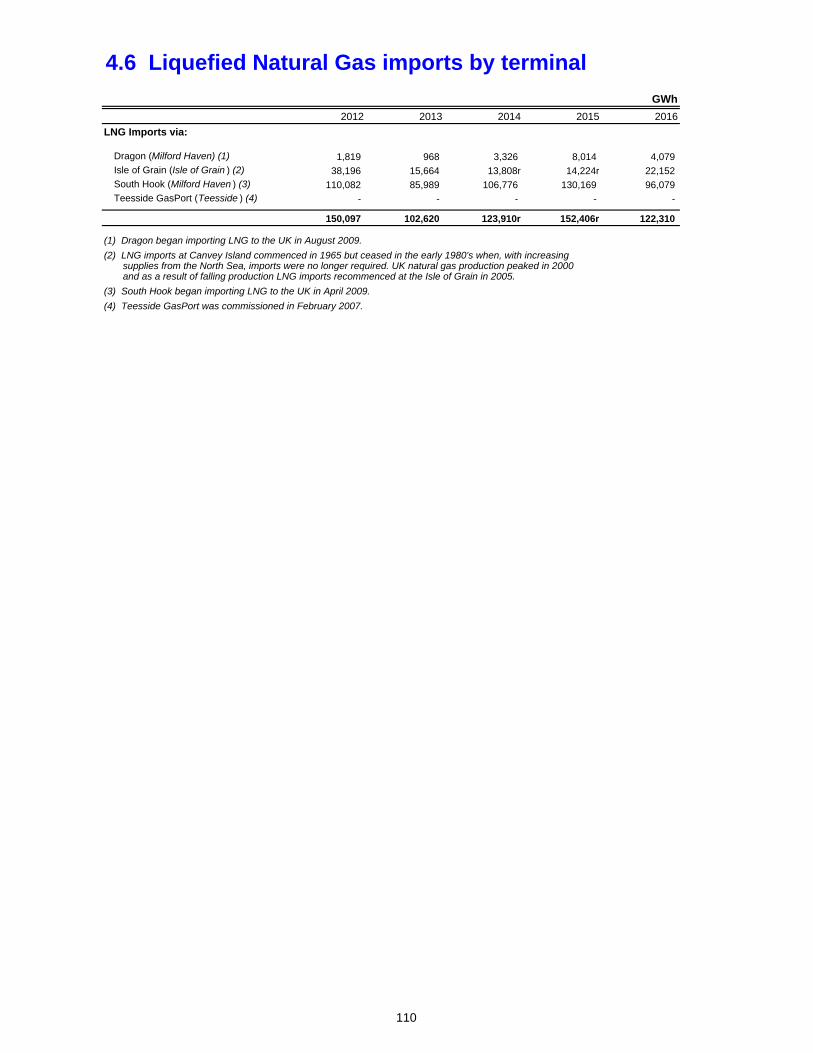
4.6 Liquefied Natural Gas imports by terminal
GWh
2012 2013 2014 2015 2016
LNG Imports via:
Dragon (Milford Haven) (1) 1,819 968 3,326 8,014 4,079 Isle of Grain (Isle of Grain ) (2) 38,196 15,664 13,808r 14,224r 22,152 South Hook (Milford Haven ) (3) 110,082 85,989 106,776 130,169 96,079 Teesside GasPort (Teesside ) (4) - - - - -
150,097 102,620 123,910r 152,406r 122,310
(1) Dragon began importing LNG to the UK in August 2009.
(2) LNG imports at Canvey Island commenced in 1965 but ceased in the early 1980's when, with increasing supplies from the North Sea, imports were no longer required. UK natural gas production peaked in 2000 and as a result of falling production LNG imports recommenced at the Isle of Grain in 2005.
(3) South Hook began importing LNG to the UK in April 2009.
(4) Teesside GasPort was commissioned in February 2007.
110
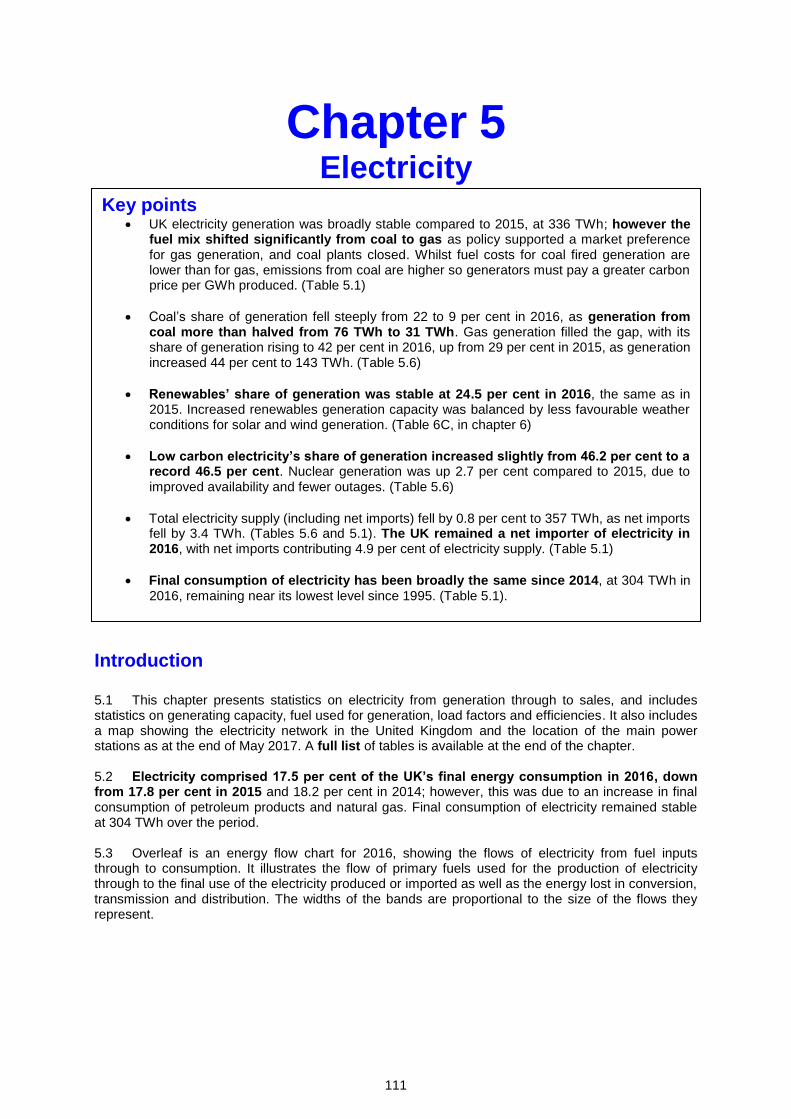
111
Chapter 5 Electricity
Introduction 5.1 This chapter presents statistics on electricity from generation through to sales, and includes statistics on generating capacity, fuel used for generation, load factors and efficiencies. It also includes a map showing the electricity network in the United Kingdom and the location of the main power stations as at the end of May 2017. A full list of tables is available at the end of the chapter. 5.2 Electricity comprised 17.5 per cent of the UK’s final energy consumption in 2016, down from 17.8 per cent in 2015 and 18.2 per cent in 2014; however, this was due to an increase in final consumption of petroleum products and natural gas. Final consumption of electricity remained stable at 304 TWh over the period. 5.3 Overleaf is an energy flow chart for 2016, showing the flows of electricity from fuel inputs through to consumption. It illustrates the flow of primary fuels used for the production of electricity through to the final use of the electricity produced or imported as well as the energy lost in conversion, transmission and distribution. The widths of the bands are proportional to the size of the flows they represent.
Key points UK electricity generation was broadly stable compared to 2015, at 336 TWh; however the
fuel mix shifted significantly from coal to gas as policy supported a market preference for gas generation, and coal plants closed. Whilst fuel costs for coal fired generation are lower than for gas, emissions from coal are higher so generators must pay a greater carbon price per GWh produced. (Table 5.1)
Coal’s share of generation fell steeply from 22 to 9 per cent in 2016, as generation from coal more than halved from 76 TWh to 31 TWh. Gas generation filled the gap, with its share of generation rising to 42 per cent in 2016, up from 29 per cent in 2015, as generation increased 44 per cent to 143 TWh. (Table 5.6)
Renewables’ share of generation was stable at 24.5 per cent in 2016, the same as in 2015. Increased renewables generation capacity was balanced by less favourable weather conditions for solar and wind generation. (Table 6C, in chapter 6)
Low carbon electricity’s share of generation increased slightly from 46.2 per cent to a record 46.5 per cent. Nuclear generation was up 2.7 per cent compared to 2015, due to improved availability and fewer outages. (Table 5.6)
Total electricity supply (including net imports) fell by 0.8 per cent to 357 TWh, as net imports fell by 3.4 TWh. (Tables 5.6 and 5.1). The UK remained a net importer of electricity in 2016, with net imports contributing 4.9 per cent of electricity supply. (Table 5.1)
Final consumption of electricity has been broadly the same since 2014, at 304 TWh in 2016, remaining near its lowest level since 1995. (Table 5.1).
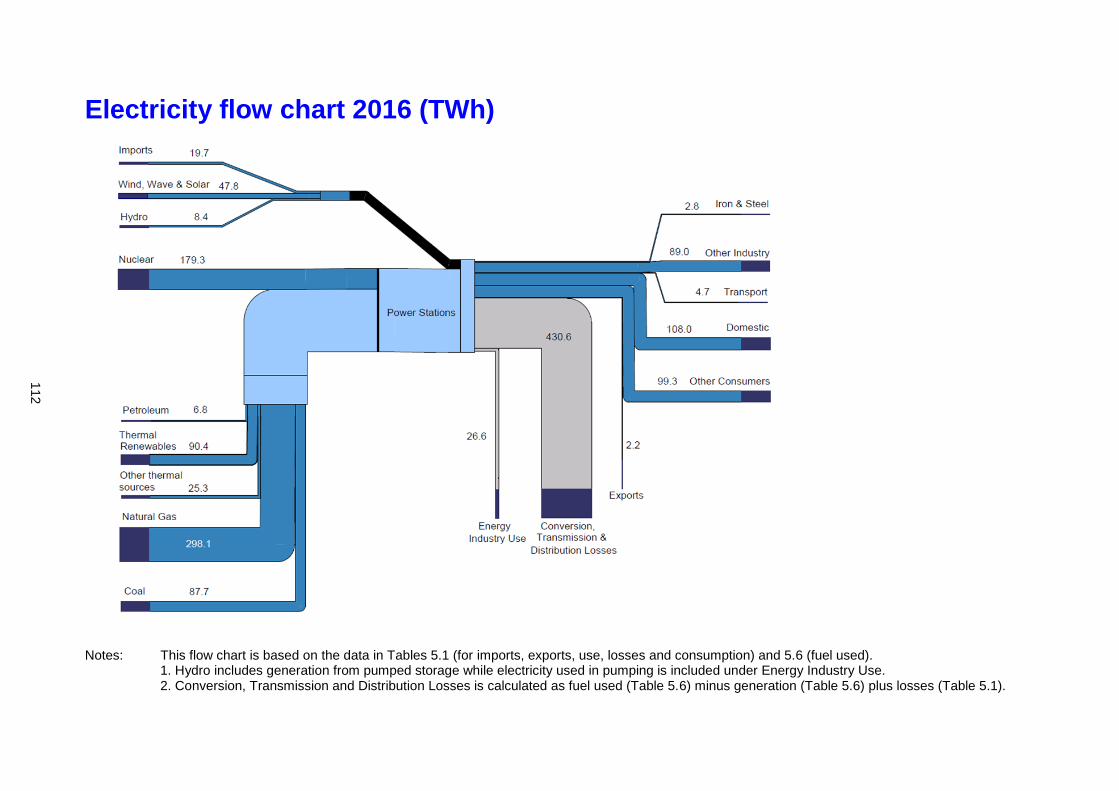
Electricity flow chart 2016 (TWh)
Notes: This flow chart is based on the data in Tables 5.1 (for imports, exports, use, losses and consumption) and 5.6 (fuel used). 1. Hydro includes generation from pumped storage while electricity used in pumping is included under Energy Industry Use. 2. Conversion, Transmission and Distribution Losses is calculated as fuel used (Table 5.6) minus generation (Table 5.6) plus losses (Table 5.1).
112
016
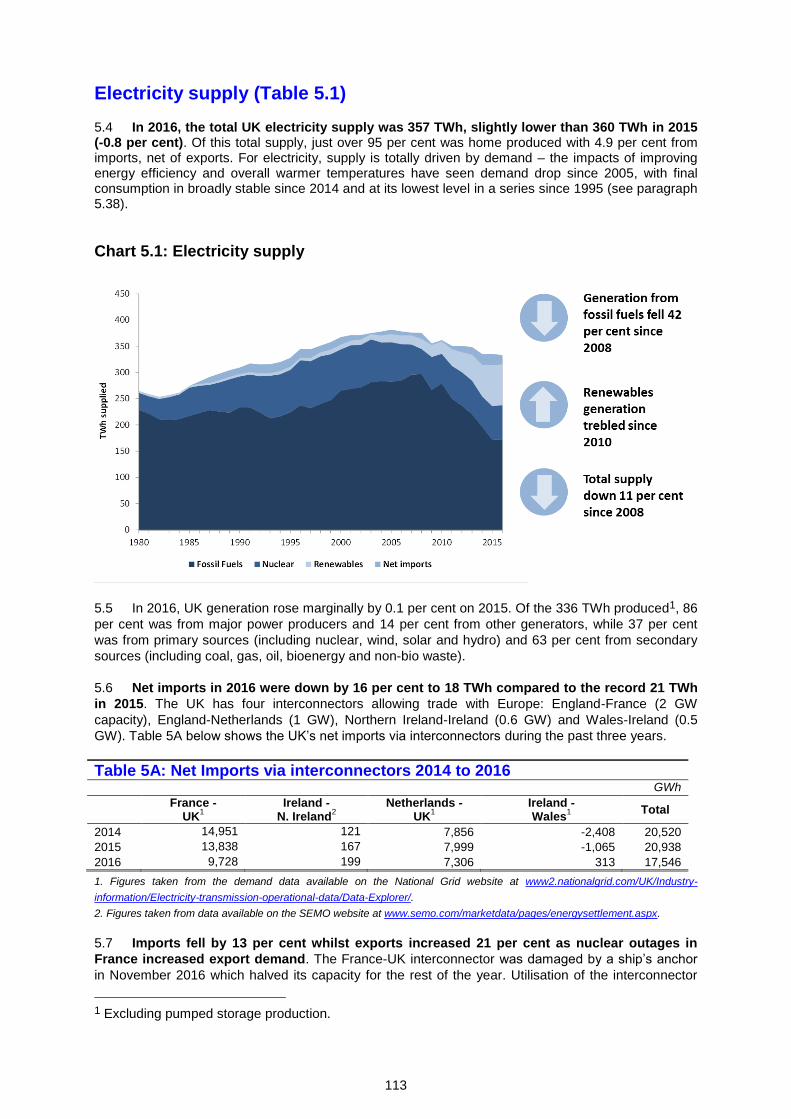
113
Electricity supply (Table 5.1) 5.4 In 2016, the total UK electricity supply was 357 TWh, slightly lower than 360 TWh in 2015 (-0.8 per cent). Of this total supply, just over 95 per cent was home produced with 4.9 per cent from imports, net of exports. For electricity, supply is totally driven by demand – the impacts of improving energy efficiency and overall warmer temperatures have seen demand drop since 2005, with final consumption in broadly stable since 2014 and at its lowest level in a series since 1995 (see paragraph 5.38).
Chart 5.1: Electricity supply
5.5 In 2016, UK generation rose marginally by 0.1 per cent on 2015. Of the 336 TWh produced1, 86
per cent was from major power producers and 14 per cent from other generators, while 37 per cent
was from primary sources (including nuclear, wind, solar and hydro) and 63 per cent from secondary
sources (including coal, gas, oil, bioenergy and non-bio waste).
5.6 Net imports in 2016 were down by 16 per cent to 18 TWh compared to the record 21 TWh
in 2015. The UK has four interconnectors allowing trade with Europe: England-France (2 GW
capacity), England-Netherlands (1 GW), Northern Ireland-Ireland (0.6 GW) and Wales-Ireland (0.5
GW). Table 5A below shows the UK’s net imports via interconnectors during the past three years.
Table 5A: Net Imports via interconnectors 2014 to 2016 GWh
France -
UK1
Ireland - N. Ireland
2
Netherlands - UK
1
Ireland - Wales
1
Total
2014 14,951 121 7,856 -2,408 20,520
2015 13,838 167 7,999 -1,065 20,938
2016 9,728 199 7,306 313 17,546
1. Figures taken from the demand data available on the National Grid website at www2.nationalgrid.com/UK/Industry-
information/Electricity-transmission-operational-data/Data-Explorer/.
2. Figures taken from data available on the SEMO website at www.semo.com/marketdata/pages/energysettlement.aspx.
5.7 Imports fell by 13 per cent whilst exports increased 21 per cent as nuclear outages in
France increased export demand. The France-UK interconnector was damaged by a ship’s anchor
in November 2016 which halved its capacity for the rest of the year. Utilisation of the interconnector
1 Excluding pumped storage production.
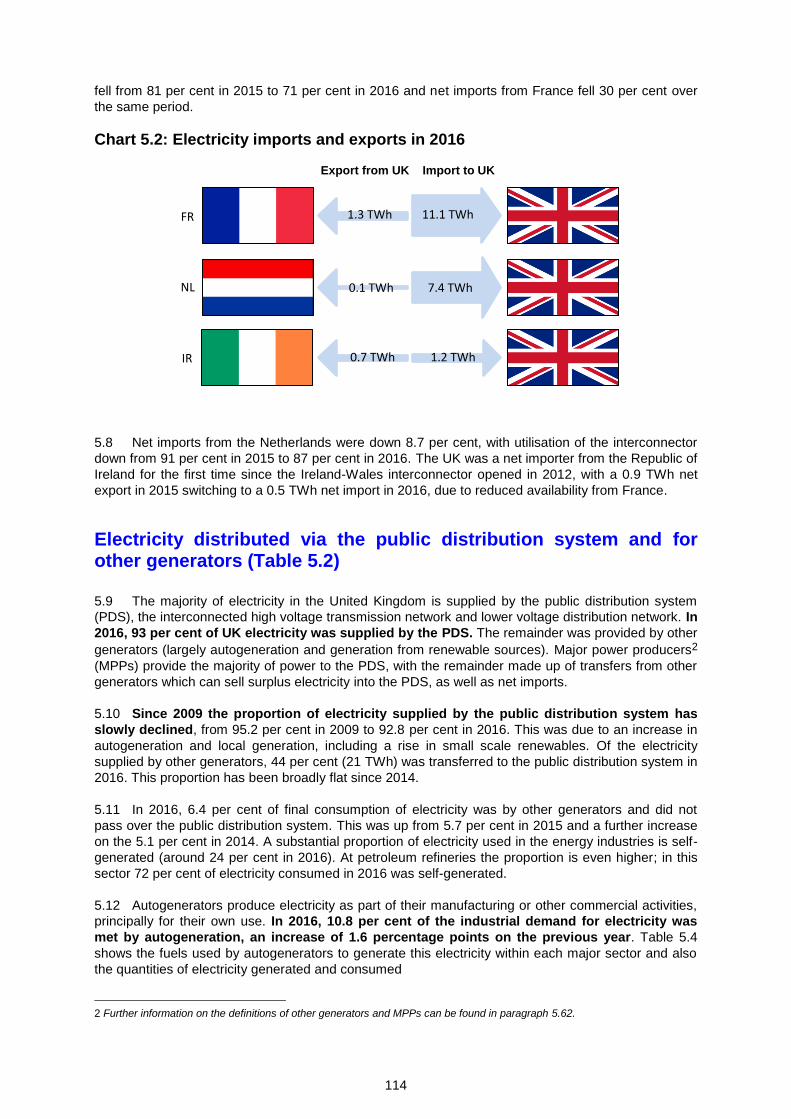
114
fell from 81 per cent in 2015 to 71 per cent in 2016 and net imports from France fell 30 per cent over
the same period.
Chart 5.2: Electricity imports and exports in 2016
Export from UK Import to UK
5.8 Net imports from the Netherlands were down 8.7 per cent, with utilisation of the interconnector
down from 91 per cent in 2015 to 87 per cent in 2016. The UK was a net importer from the Republic of
Ireland for the first time since the Ireland-Wales interconnector opened in 2012, with a 0.9 TWh net
export in 2015 switching to a 0.5 TWh net import in 2016, due to reduced availability from France.
Electricity distributed via the public distribution system and for other generators (Table 5.2) 5.9 The majority of electricity in the United Kingdom is supplied by the public distribution system
(PDS), the interconnected high voltage transmission network and lower voltage distribution network. In
2016, 93 per cent of UK electricity was supplied by the PDS. The remainder was provided by other
generators (largely autogeneration and generation from renewable sources). Major power producers2
(MPPs) provide the majority of power to the PDS, with the remainder made up of transfers from other
generators which can sell surplus electricity into the PDS, as well as net imports.
5.10 Since 2009 the proportion of electricity supplied by the public distribution system has
slowly declined, from 95.2 per cent in 2009 to 92.8 per cent in 2016. This was due to an increase in
autogeneration and local generation, including a rise in small scale renewables. Of the electricity
supplied by other generators, 44 per cent (21 TWh) was transferred to the public distribution system in
2016. This proportion has been broadly flat since 2014.
5.11 In 2016, 6.4 per cent of final consumption of electricity was by other generators and did not
pass over the public distribution system. This was up from 5.7 per cent in 2015 and a further increase
on the 5.1 per cent in 2014. A substantial proportion of electricity used in the energy industries is self-
generated (around 24 per cent in 2016). At petroleum refineries the proportion is even higher; in this
sector 72 per cent of electricity consumed in 2016 was self-generated.
5.12 Autogenerators produce electricity as part of their manufacturing or other commercial activities,
principally for their own use. In 2016, 10.8 per cent of the industrial demand for electricity was
met by autogeneration, an increase of 1.6 percentage points on the previous year. Table 5.4
shows the fuels used by autogenerators to generate this electricity within each major sector and also
the quantities of electricity generated and consumed
2 Further information on the definitions of other generators and MPPs can be found in paragraph 5.62.
FR 1.3 TWh 11.1 TWh
0.1 TWh 7.4 TWh
0.7 TWh 1.2 TWh
NL
IR
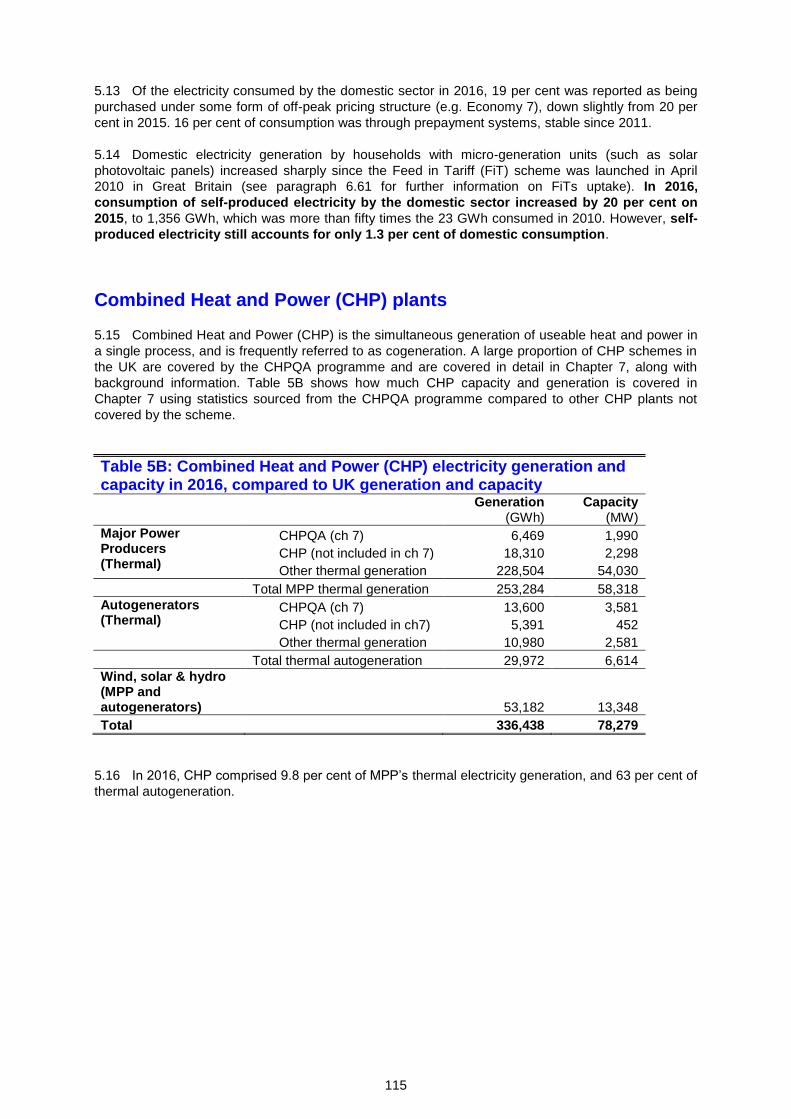
115
5.13 Of the electricity consumed by the domestic sector in 2016, 19 per cent was reported as being
purchased under some form of off-peak pricing structure (e.g. Economy 7), down slightly from 20 per
cent in 2015. 16 per cent of consumption was through prepayment systems, stable since 2011.
5.14 Domestic electricity generation by households with micro-generation units (such as solar
photovoltaic panels) increased sharply since the Feed in Tariff (FiT) scheme was launched in April
2010 in Great Britain (see paragraph 6.61 for further information on FiTs uptake). In 2016,
consumption of self-produced electricity by the domestic sector increased by 20 per cent on
2015, to 1,356 GWh, which was more than fifty times the 23 GWh consumed in 2010. However, self-
produced electricity still accounts for only 1.3 per cent of domestic consumption.
Combined Heat and Power (CHP) plants
5.15 Combined Heat and Power (CHP) is the simultaneous generation of useable heat and power in
a single process, and is frequently referred to as cogeneration. A large proportion of CHP schemes in
the UK are covered by the CHPQA programme and are covered in detail in Chapter 7, along with
background information. Table 5B shows how much CHP capacity and generation is covered in
Chapter 7 using statistics sourced from the CHPQA programme compared to other CHP plants not
covered by the scheme.
Table 5B: Combined Heat and Power (CHP) electricity generation and capacity in 2016, compared to UK generation and capacity
Generation
(GWh) Capacity
(MW)
Major Power Producers (Thermal)
CHPQA (ch 7) 6,469 1,990
CHP (not included in ch 7) 18,310 2,298
Other thermal generation 228,504 54,030
Total MPP thermal generation 253,284 58,318
Autogenerators (Thermal)
CHPQA (ch 7) 13,600 3,581
CHP (not included in ch7) 5,391 452
Other thermal generation 10,980 2,581
Total thermal autogeneration 29,972 6,614
Wind, solar & hydro (MPP and autogenerators)
53,182 13,348
Total 336,438 78,279
5.16 In 2016, CHP comprised 9.8 per cent of MPP’s thermal electricity generation, and 63 per cent of
thermal autogeneration.
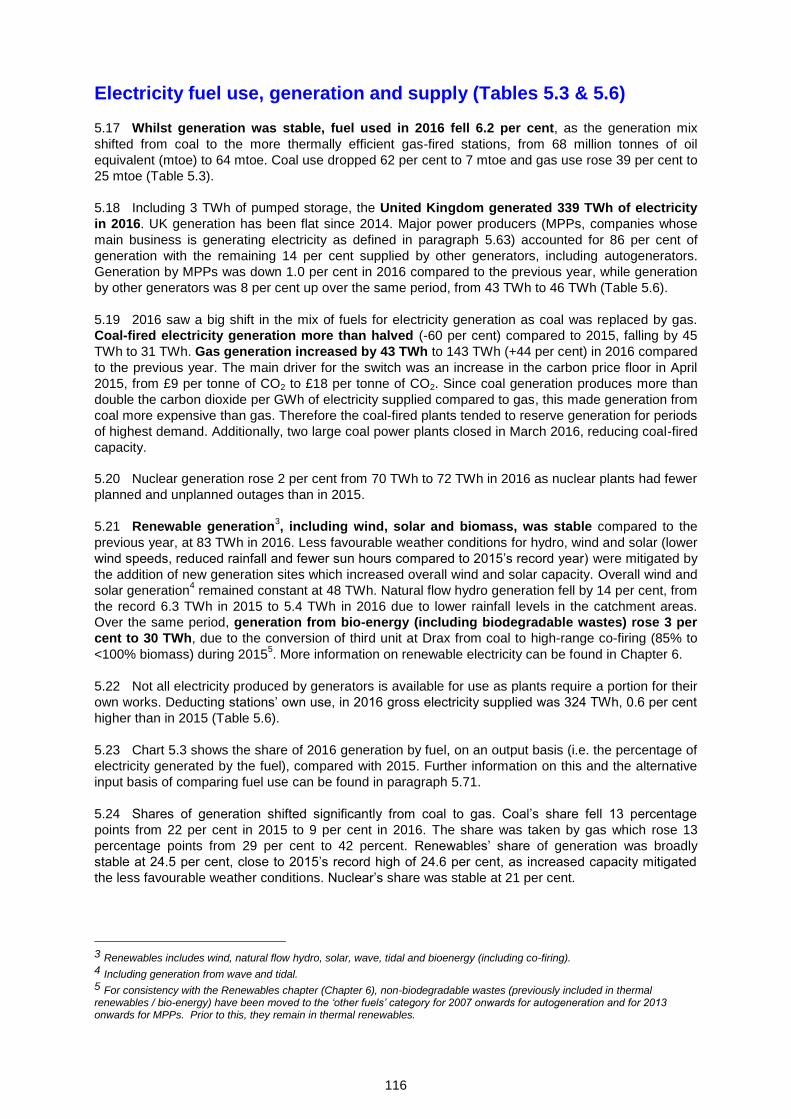
116
Electricity fuel use, generation and supply (Tables 5.3 & 5.6)
5.17 Whilst generation was stable, fuel used in 2016 fell 6.2 per cent, as the generation mix
shifted from coal to the more thermally efficient gas-fired stations, from 68 million tonnes of oil
equivalent (mtoe) to 64 mtoe. Coal use dropped 62 per cent to 7 mtoe and gas use rose 39 per cent to
25 mtoe (Table 5.3).
5.18 Including 3 TWh of pumped storage, the United Kingdom generated 339 TWh of electricity
in 2016. UK generation has been flat since 2014. Major power producers (MPPs, companies whose
main business is generating electricity as defined in paragraph 5.63) accounted for 86 per cent of
generation with the remaining 14 per cent supplied by other generators, including autogenerators.
Generation by MPPs was down 1.0 per cent in 2016 compared to the previous year, while generation
by other generators was 8 per cent up over the same period, from 43 TWh to 46 TWh (Table 5.6).
5.19 2016 saw a big shift in the mix of fuels for electricity generation as coal was replaced by gas.
Coal-fired electricity generation more than halved (-60 per cent) compared to 2015, falling by 45
TWh to 31 TWh. Gas generation increased by 43 TWh to 143 TWh (+44 per cent) in 2016 compared
to the previous year. The main driver for the switch was an increase in the carbon price floor in April
2015, from £9 per tonne of CO2 to £18 per tonne of CO2. Since coal generation produces more than
double the carbon dioxide per GWh of electricity supplied compared to gas, this made generation from
coal more expensive than gas. Therefore the coal-fired plants tended to reserve generation for periods
of highest demand. Additionally, two large coal power plants closed in March 2016, reducing coal-fired
capacity.
5.20 Nuclear generation rose 2 per cent from 70 TWh to 72 TWh in 2016 as nuclear plants had fewer
planned and unplanned outages than in 2015.
5.21 Renewable generation3, including wind, solar and biomass, was stable compared to the
previous year, at 83 TWh in 2016. Less favourable weather conditions for hydro, wind and solar (lower
wind speeds, reduced rainfall and fewer sun hours compared to 2015’s record year) were mitigated by
the addition of new generation sites which increased overall wind and solar capacity. Overall wind and
solar generation4 remained constant at 48 TWh. Natural flow hydro generation fell by 14 per cent, from
the record 6.3 TWh in 2015 to 5.4 TWh in 2016 due to lower rainfall levels in the catchment areas.
Over the same period, generation from bio-energy (including biodegradable wastes) rose 3 per
cent to 30 TWh, due to the conversion of third unit at Drax from coal to high-range co-firing (85% to
<100% biomass) during 20155. More information on renewable electricity can be found in Chapter 6.
5.22 Not all electricity produced by generators is available for use as plants require a portion for their
own works. Deducting stations’ own use, in 2016 gross electricity supplied was 324 TWh, 0.6 per cent
higher than in 2015 (Table 5.6). 5.23 Chart 5.3 shows the share of 2016 generation by fuel, on an output basis (i.e. the percentage of
electricity generated by the fuel), compared with 2015. Further information on this and the alternative
input basis of comparing fuel use can be found in paragraph 5.71.
5.24 Shares of generation shifted significantly from coal to gas. Coal’s share fell 13 percentage
points from 22 per cent in 2015 to 9 per cent in 2016. The share was taken by gas which rose 13
percentage points from 29 per cent to 42 percent. Renewables’ share of generation was broadly
stable at 24.5 per cent, close to 2015’s record high of 24.6 per cent, as increased capacity mitigated
the less favourable weather conditions. Nuclear’s share was stable at 21 per cent.
3 Renewables includes wind, natural flow hydro, solar, wave, tidal and bioenergy (including co-firing). 4 Including generation from wave and tidal. 5 For consistency with the Renewables chapter (Chapter 6), non-biodegradable wastes (previously included in thermal renewables / bio-energy) have been moved to the ‘other fuels’ category for 2007 onwards for autogeneration and for 2013 onwards for MPPs. Prior to this, they remain in thermal renewables.
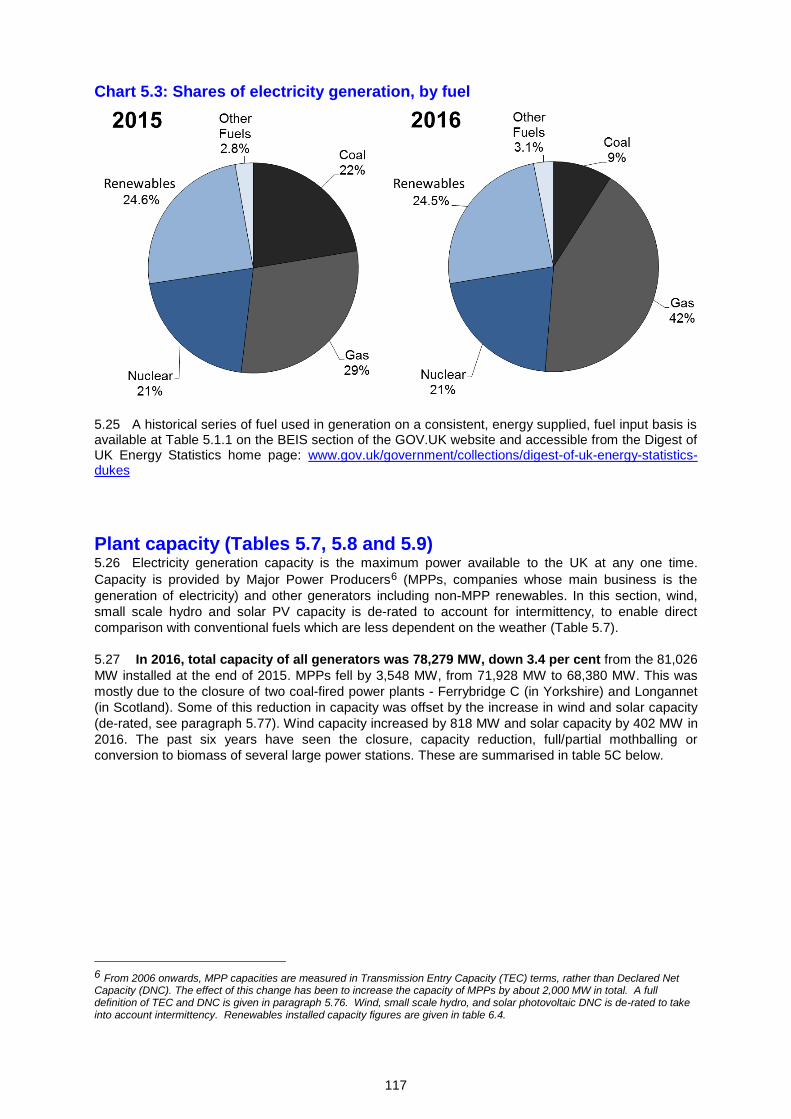
117
Chart 5.3: Shares of electricity generation, by fuel
5.25 A historical series of fuel used in generation on a consistent, energy supplied, fuel input basis is available at Table 5.1.1 on the BEIS section of the GOV.UK website and accessible from the Digest of UK Energy Statistics home page: www.gov.uk/government/collections/digest-of-uk-energy-statistics-dukes
Plant capacity (Tables 5.7, 5.8 and 5.9) 5.26 Electricity generation capacity is the maximum power available to the UK at any one time.
Capacity is provided by Major Power Producers6 (MPPs, companies whose main business is the
generation of electricity) and other generators including non-MPP renewables. In this section, wind,
small scale hydro and solar PV capacity is de-rated to account for intermittency, to enable direct
comparison with conventional fuels which are less dependent on the weather (Table 5.7).
5.27 In 2016, total capacity of all generators was 78,279 MW, down 3.4 per cent from the 81,026
MW installed at the end of 2015. MPPs fell by 3,548 MW, from 71,928 MW to 68,380 MW. This was
mostly due to the closure of two coal-fired power plants - Ferrybridge C (in Yorkshire) and Longannet
(in Scotland). Some of this reduction in capacity was offset by the increase in wind and solar capacity
(de-rated, see paragraph 5.77). Wind capacity increased by 818 MW and solar capacity by 402 MW in
2016. The past six years have seen the closure, capacity reduction, full/partial mothballing or
conversion to biomass of several large power stations. These are summarised in table 5C below.
6 From 2006 onwards, MPP capacities are measured in Transmission Entry Capacity (TEC) terms, rather than Declared Net Capacity (DNC). The effect of this change has been to increase the capacity of MPPs by about 2,000 MW in total. A full definition of TEC and DNC is given in paragraph 5.76. Wind, small scale hydro, and solar photovoltaic DNC is de-rated to take into account intermittency. Renewables installed capacity figures are given in table 6.4.
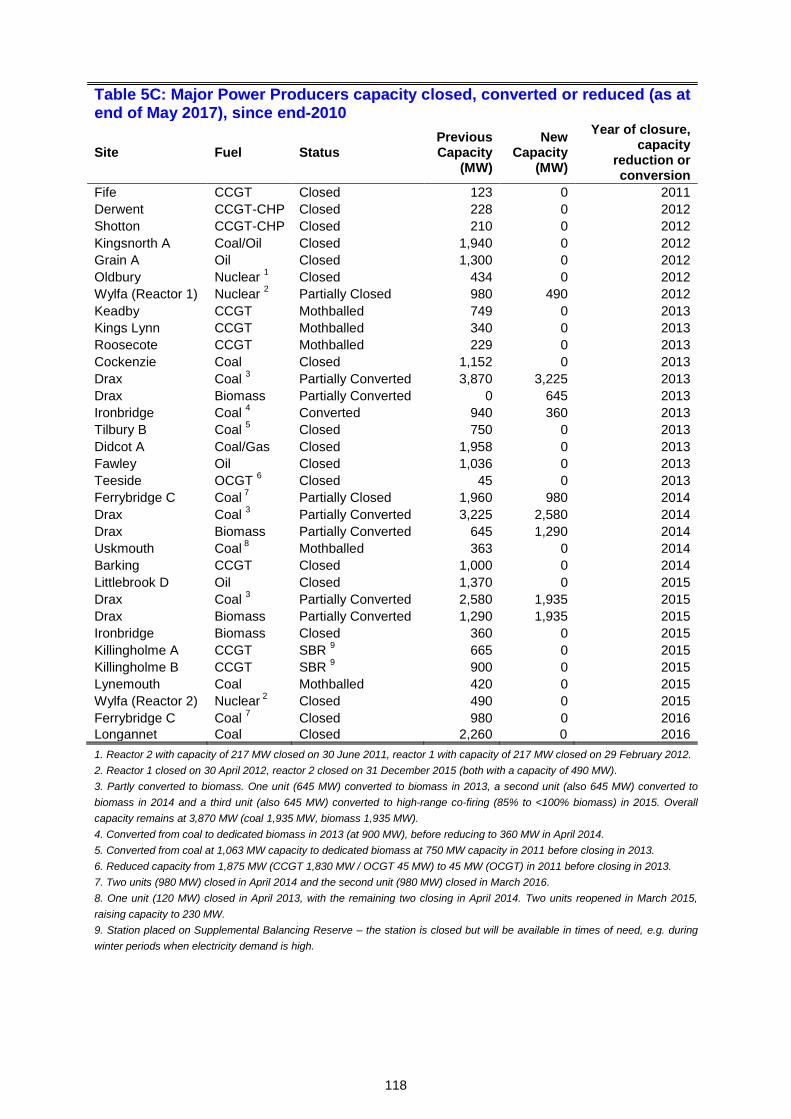
118
Table 5C: Major Power Producers capacity closed, converted or reduced (as at end of May 2017), since end-2010
Site Fuel Status Previous Capacity
(MW)
New Capacity
(MW)
Year of closure, capacity
reduction or conversion
Fife CCGT Closed 123 0 2011
Derwent CCGT-CHP Closed 228 0 2012
Shotton CCGT-CHP Closed 210 0 2012
Kingsnorth A Coal/Oil Closed 1,940 0 2012
Grain A Oil Closed 1,300 0 2012
Oldbury Nuclear 1 Closed 434 0 2012
Wylfa (Reactor 1) Nuclear 2 Partially Closed 980 490 2012
Keadby CCGT Mothballed 749 0 2013
Kings Lynn CCGT Mothballed 340 0 2013
Roosecote CCGT Mothballed 229 0 2013
Cockenzie Coal Closed 1,152 0 2013
Drax Coal 3 Partially Converted 3,870 3,225 2013
Drax Biomass Partially Converted 0 645 2013
Ironbridge Coal 4 Converted 940 360 2013
Tilbury B Coal 5 Closed 750 0 2013
Didcot A Coal/Gas Closed 1,958 0 2013
Fawley Oil Closed 1,036 0 2013
Teeside OCGT 6 Closed 45 0 2013
Ferrybridge C Coal 7
Partially Closed 1,960 980 2014
Drax Coal 3 Partially Converted 3,225 2,580 2014
Drax Biomass Partially Converted 645 1,290 2014
Uskmouth Coal 8
Mothballed 363 0 2014
Barking CCGT Closed 1,000 0 2014
Littlebrook D Oil Closed 1,370 0 2015
Drax Coal 3 Partially Converted 2,580 1,935 2015
Drax Biomass Partially Converted 1,290 1,935 2015
Ironbridge Biomass Closed 360 0 2015
Killingholme A CCGT SBR 9 665 0 2015
Killingholme B CCGT SBR 9 900 0 2015
Lynemouth Coal Mothballed 420 0 2015
Wylfa (Reactor 2) Nuclear 2
Closed 490 0 2015
Ferrybridge C Coal 7 Closed 980 0 2016
Longannet Coal Closed 2,260 0 2016
1. Reactor 2 with capacity of 217 MW closed on 30 June 2011, reactor 1 with capacity of 217 MW closed on 29 February 2012.
2. Reactor 1 closed on 30 April 2012, reactor 2 closed on 31 December 2015 (both with a capacity of 490 MW).
3. Partly converted to biomass. One unit (645 MW) converted to biomass in 2013, a second unit (also 645 MW) converted to
biomass in 2014 and a third unit (also 645 MW) converted to high-range co-firing (85% to <100% biomass) in 2015. Overall
capacity remains at 3,870 MW (coal 1,935 MW, biomass 1,935 MW).
4. Converted from coal to dedicated biomass in 2013 (at 900 MW), before reducing to 360 MW in April 2014.
5. Converted from coal at 1,063 MW capacity to dedicated biomass at 750 MW capacity in 2011 before closing in 2013.
6. Reduced capacity from 1,875 MW (CCGT 1,830 MW / OCGT 45 MW) to 45 MW (OCGT) in 2011 before closing in 2013.
7. Two units (980 MW) closed in April 2014 and the second unit (980 MW) closed in March 2016.
8. One unit (120 MW) closed in April 2013, with the remaining two closing in April 2014. Two units reopened in March 2015,
raising capacity to 230 MW.
9. Station placed on Supplemental Balancing Reserve – the station is closed but will be available in times of need, e.g. during
winter periods when electricity demand is high.
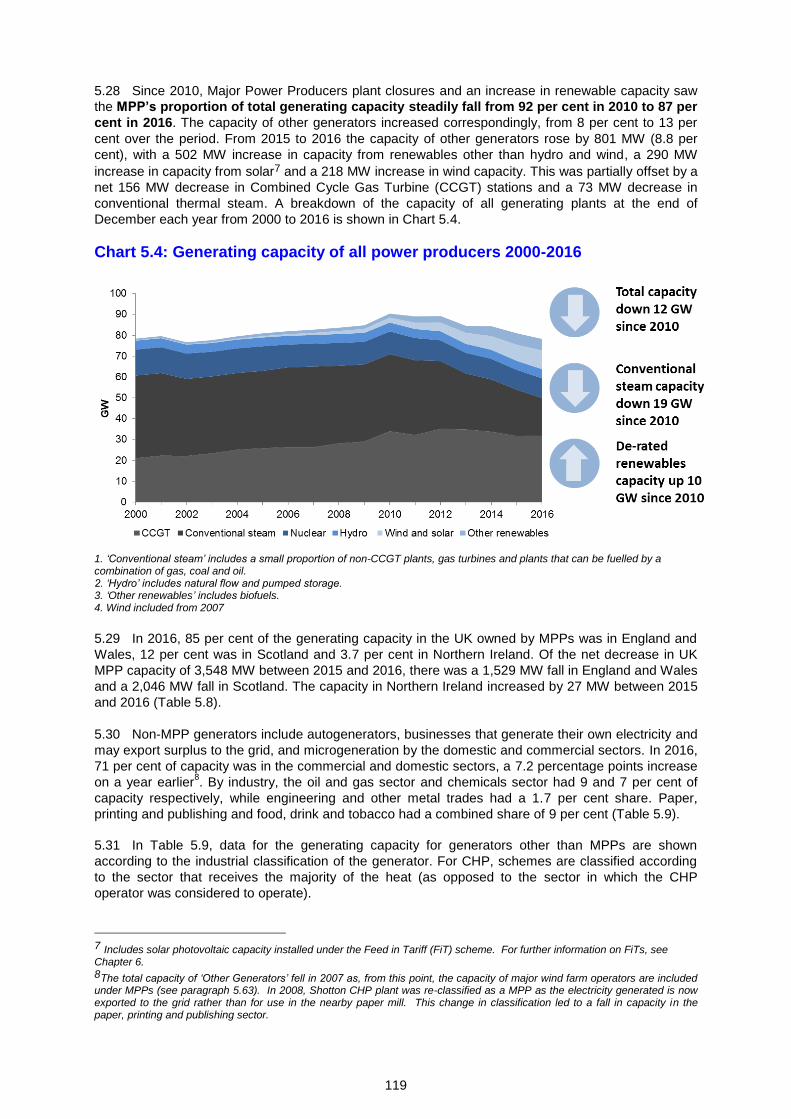
119
5.28 Since 2010, Major Power Producers plant closures and an increase in renewable capacity saw
the MPP’s proportion of total generating capacity steadily fall from 92 per cent in 2010 to 87 per
cent in 2016. The capacity of other generators increased correspondingly, from 8 per cent to 13 per
cent over the period. From 2015 to 2016 the capacity of other generators rose by 801 MW (8.8 per
cent), with a 502 MW increase in capacity from renewables other than hydro and wind, a 290 MW
increase in capacity from solar7 and a 218 MW increase in wind capacity. This was partially offset by a
net 156 MW decrease in Combined Cycle Gas Turbine (CCGT) stations and a 73 MW decrease in
conventional thermal steam. A breakdown of the capacity of all generating plants at the end of
December each year from 2000 to 2016 is shown in Chart 5.4.
Chart 5.4: Generating capacity of all power producers 2000-2016
1. ‘Conventional steam’ includes a small proportion of non-CCGT plants, gas turbines and plants that can be fuelled by a combination of gas, coal and oil. 2. ‘Hydro’ includes natural flow and pumped storage. 3. ‘Other renewables’ includes biofuels. 4. Wind included from 2007
5.29 In 2016, 85 per cent of the generating capacity in the UK owned by MPPs was in England and
Wales, 12 per cent was in Scotland and 3.7 per cent in Northern Ireland. Of the net decrease in UK
MPP capacity of 3,548 MW between 2015 and 2016, there was a 1,529 MW fall in England and Wales
and a 2,046 MW fall in Scotland. The capacity in Northern Ireland increased by 27 MW between 2015
and 2016 (Table 5.8).
5.30 Non-MPP generators include autogenerators, businesses that generate their own electricity and
may export surplus to the grid, and microgeneration by the domestic and commercial sectors. In 2016,
71 per cent of capacity was in the commercial and domestic sectors, a 7.2 percentage points increase
on a year earlier8. By industry, the oil and gas sector and chemicals sector had 9 and 7 per cent of
capacity respectively, while engineering and other metal trades had a 1.7 per cent share. Paper,
printing and publishing and food, drink and tobacco had a combined share of 9 per cent (Table 5.9).
5.31 In Table 5.9, data for the generating capacity for generators other than MPPs are shown
according to the industrial classification of the generator. For CHP, schemes are classified according
to the sector that receives the majority of the heat (as opposed to the sector in which the CHP
operator was considered to operate).
7 Includes solar photovoltaic capacity installed under the Feed in Tariff (FiT) scheme. For further information on FiTs, see Chapter 6. 8The total capacity of ‘Other Generators’ fell in 2007 as, from this point, the capacity of major wind farm operators are included under MPPs (see paragraph 5.63). In 2008, Shotton CHP plant was re-classified as a MPP as the electricity generated is now exported to the grid rather than for use in the nearby paper mill. This change in classification led to a fall in capacity in the paper, printing and publishing sector.
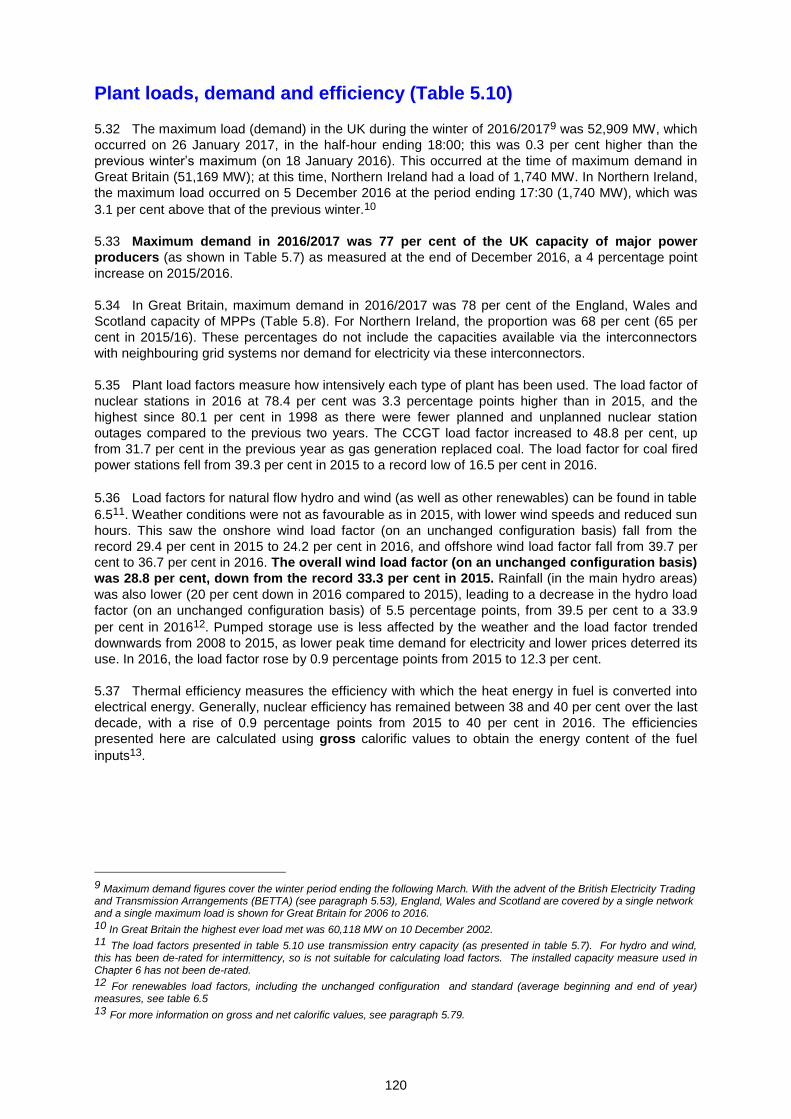
120
Plant loads, demand and efficiency (Table 5.10)
5.32 The maximum load (demand) in the UK during the winter of 2016/20179 was 52,909 MW, which
occurred on 26 January 2017, in the half-hour ending 18:00; this was 0.3 per cent higher than the
previous winter’s maximum (on 18 January 2016). This occurred at the time of maximum demand in
Great Britain (51,169 MW); at this time, Northern Ireland had a load of 1,740 MW. In Northern Ireland,
the maximum load occurred on 5 December 2016 at the period ending 17:30 (1,740 MW), which was
3.1 per cent above that of the previous winter.10
5.33 Maximum demand in 2016/2017 was 77 per cent of the UK capacity of major power
producers (as shown in Table 5.7) as measured at the end of December 2016, a 4 percentage point
increase on 2015/2016.
5.34 In Great Britain, maximum demand in 2016/2017 was 78 per cent of the England, Wales and
Scotland capacity of MPPs (Table 5.8). For Northern Ireland, the proportion was 68 per cent (65 per
cent in 2015/16). These percentages do not include the capacities available via the interconnectors
with neighbouring grid systems nor demand for electricity via these interconnectors.
5.35 Plant load factors measure how intensively each type of plant has been used. The load factor of
nuclear stations in 2016 at 78.4 per cent was 3.3 percentage points higher than in 2015, and the
highest since 80.1 per cent in 1998 as there were fewer planned and unplanned nuclear station
outages compared to the previous two years. The CCGT load factor increased to 48.8 per cent, up
from 31.7 per cent in the previous year as gas generation replaced coal. The load factor for coal fired
power stations fell from 39.3 per cent in 2015 to a record low of 16.5 per cent in 2016.
5.36 Load factors for natural flow hydro and wind (as well as other renewables) can be found in table
6.511. Weather conditions were not as favourable as in 2015, with lower wind speeds and reduced sun
hours. This saw the onshore wind load factor (on an unchanged configuration basis) fall from the
record 29.4 per cent in 2015 to 24.2 per cent in 2016, and offshore wind load factor fall from 39.7 per
cent to 36.7 per cent in 2016. The overall wind load factor (on an unchanged configuration basis)
was 28.8 per cent, down from the record 33.3 per cent in 2015. Rainfall (in the main hydro areas)
was also lower (20 per cent down in 2016 compared to 2015), leading to a decrease in the hydro load
factor (on an unchanged configuration basis) of 5.5 percentage points, from 39.5 per cent to a 33.9
per cent in 201612. Pumped storage use is less affected by the weather and the load factor trended
downwards from 2008 to 2015, as lower peak time demand for electricity and lower prices deterred its
use. In 2016, the load factor rose by 0.9 percentage points from 2015 to 12.3 per cent.
5.37 Thermal efficiency measures the efficiency with which the heat energy in fuel is converted into
electrical energy. Generally, nuclear efficiency has remained between 38 and 40 per cent over the last
decade, with a rise of 0.9 percentage points from 2015 to 40 per cent in 2016. The efficiencies
presented here are calculated using gross calorific values to obtain the energy content of the fuel
inputs13.
9 Maximum demand figures cover the winter period ending the following March. With the advent of the British Electricity Trading and Transmission Arrangements (BETTA) (see paragraph 5.53), England, Wales and Scotland are covered by a single network and a single maximum load is shown for Great Britain for 2006 to 2016. 10 In Great Britain the highest ever load met was 60,118 MW on 10 December 2002. 11 The load factors presented in table 5.10 use transmission entry capacity (as presented in table 5.7). For hydro and wind, this has been de-rated for intermittency, so is not suitable for calculating load factors. The installed capacity measure used in Chapter 6 has not been de-rated. 12 For renewables load factors, including the unchanged configuration and standard (average beginning and end of year) measures, see table 6.5 13 For more information on gross and net calorific values, see paragraph 5.79.
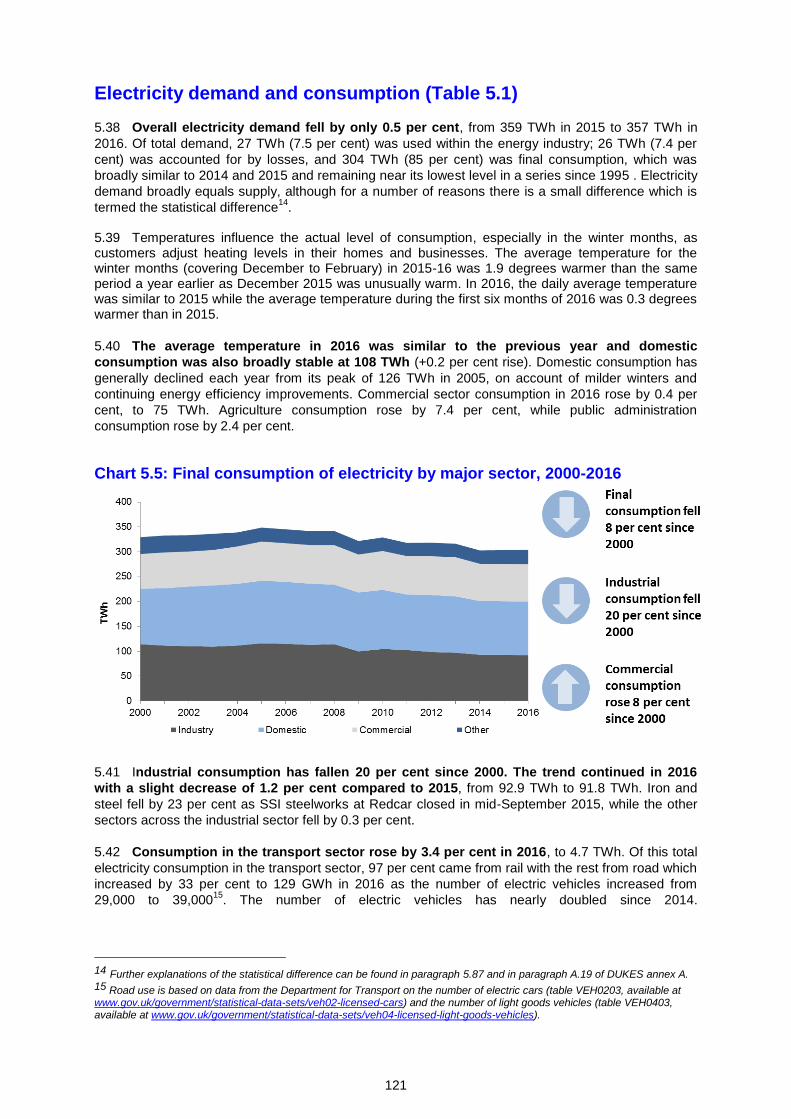
121
Electricity demand and consumption (Table 5.1)
5.38 Overall electricity demand fell by only 0.5 per cent, from 359 TWh in 2015 to 357 TWh in
2016. Of total demand, 27 TWh (7.5 per cent) was used within the energy industry; 26 TWh (7.4 per
cent) was accounted for by losses, and 304 TWh (85 per cent) was final consumption, which was
broadly similar to 2014 and 2015 and remaining near its lowest level in a series since 1995 . Electricity
demand broadly equals supply, although for a number of reasons there is a small difference which is
termed the statistical difference14
. 5.39 Temperatures influence the actual level of consumption, especially in the winter months, as customers adjust heating levels in their homes and businesses. The average temperature for the winter months (covering December to February) in 2015-16 was 1.9 degrees warmer than the same period a year earlier as December 2015 was unusually warm. In 2016, the daily average temperature was similar to 2015 while the average temperature during the first six months of 2016 was 0.3 degrees warmer than in 2015.
5.40 The average temperature in 2016 was similar to the previous year and domestic
consumption was also broadly stable at 108 TWh (+0.2 per cent rise). Domestic consumption has
generally declined each year from its peak of 126 TWh in 2005, on account of milder winters and
continuing energy efficiency improvements. Commercial sector consumption in 2016 rose by 0.4 per
cent, to 75 TWh. Agriculture consumption rose by 7.4 per cent, while public administration
consumption rose by 2.4 per cent.
Chart 5.5: Final consumption of electricity by major sector, 2000-2016
5.41 Industrial consumption has fallen 20 per cent since 2000. The trend continued in 2016
with a slight decrease of 1.2 per cent compared to 2015, from 92.9 TWh to 91.8 TWh. Iron and
steel fell by 23 per cent as SSI steelworks at Redcar closed in mid-September 2015, while the other
sectors across the industrial sector fell by 0.3 per cent.
5.42 Consumption in the transport sector rose by 3.4 per cent in 2016, to 4.7 TWh. Of this total
electricity consumption in the transport sector, 97 per cent came from rail with the rest from road which
increased by 33 per cent to 129 GWh in 2016 as the number of electric vehicles increased from
29,000 to 39,00015
. The number of electric vehicles has nearly doubled since 2014.
14 Further explanations of the statistical difference can be found in paragraph 5.87 and in paragraph A.19 of DUKES annex A. 15 Road use is based on data from the Department for Transport on the number of electric cars (table VEH0203, available at www.gov.uk/government/statistical-data-sets/veh02-licensed-cars) and the number of light goods vehicles (table VEH0403, available at www.gov.uk/government/statistical-data-sets/veh04-licensed-light-goods-vehicles).
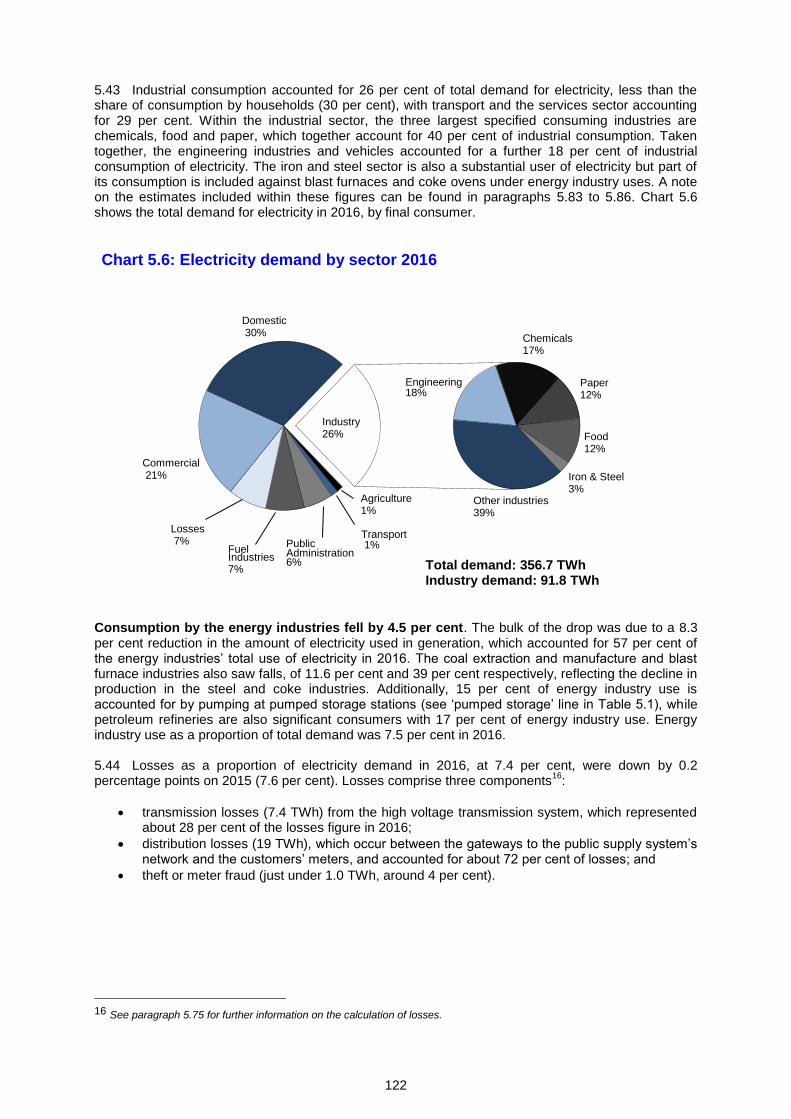
122
5.43 Industrial consumption accounted for 26 per cent of total demand for electricity, less than the share of consumption by households (30 per cent), with transport and the services sector accounting for 29 per cent. Within the industrial sector, the three largest specified consuming industries are chemicals, food and paper, which together account for 40 per cent of industrial consumption. Taken together, the engineering industries and vehicles accounted for a further 18 per cent of industrial consumption of electricity. The iron and steel sector is also a substantial user of electricity but part of its consumption is included against blast furnaces and coke ovens under energy industry uses. A note on the estimates included within these figures can be found in paragraphs 5.83 to 5.86. Chart 5.6 shows the total demand for electricity in 2016, by final consumer.
Chart 5.6: Electricity demand by sector 2016
Consumption by the energy industries fell by 4.5 per cent. The bulk of the drop was due to a 8.3 per cent reduction in the amount of electricity used in generation, which accounted for 57 per cent of the energy industries’ total use of electricity in 2016. The coal extraction and manufacture and blast furnace industries also saw falls, of 11.6 per cent and 39 per cent respectively, reflecting the decline in production in the steel and coke industries. Additionally, 15 per cent of energy industry use is accounted for by pumping at pumped storage stations (see ‘pumped storage’ line in Table 5.1), while petroleum refineries are also significant consumers with 17 per cent of energy industry use. Energy industry use as a proportion of total demand was 7.5 per cent in 2016. 5.44 Losses as a proportion of electricity demand in 2016, at 7.4 per cent, were down by 0.2 percentage points on 2015 (7.6 per cent). Losses comprise three components
16:
transmission losses (7.4 TWh) from the high voltage transmission system, which represented about 28 per cent of the losses figure in 2016;
distribution losses (19 TWh), which occur between the gateways to the public supply system’s network and the customers’ meters, and accounted for about 72 per cent of losses; and
theft or meter fraud (just under 1.0 TWh, around 4 per cent).
16 See paragraph 5.75 for further information on the calculation of losses.
Domestic 30%
Commercial 21%
Losses 7%
Fuel Industries 7%
Public Administration 6%
Transport 1%
Agriculture 1%
Industry 26%
Engineering 18%
Other industries 39%
Chemicals 17%
Food 12%
Paper 12%
Iron & Steel 3%
Total demand: 356.7 TWh Industry demand: 91.8 TWh
123
Power stations in the United Kingdom (Tables 5.11 and 5.12) 5.45 The total installed capacity of major UK power stations was 79,815 MW
17 at the end of May
2017. Table 5.11 is a database of UK capacity with details of these Major Power Producers (MPPs) as
well as the four interconnectors allowing trade with Europe, and an aggregate of other generating
stations using renewable sources and smaller (<1 MW) Combined Heat and Power (CHP) plants.
5.46 Table 7.10 shows CHP schemes of 1 MW and over for which the information is publicly
available. Total power output of these stations is given (electricity plus heat), not just that which is
classed as good quality CHP under the CHP Quality Assurance programme (CHPQA, see Chapter 7),
since CHPQA information for individual sites is not publicly available.
5.47 Table 5.12 shows capacity of the transmission and distribution networks for Great Britain,
Northern Ireland and the United Kingdom as a whole. Transmission network connected capacity for
the UK as a whole has reduced each year since 2012 due to closures and conversions of coal, oil and
gas plants. These closures have been slightly offset by the increase in renewables capacity, in
particular onshore wind which increased by 10 per cent in 2016.
5.48 The capacity of the distribution network has increased each year since 2011 for Great
Britain and Northern Ireland, with capacity in 2016 in each around double that of 2011, driven by
increasing quantities of embedded solar and wind. In 2016, distribution-connected capacity in Great
Britain increased by 13 per cent (3.1 GW) on 2015, with 2.3 GW of this increase attributable to solar
and 1.0 GW to wind. In 2016, total installed capacity across all networks in the UK was 98.5 GW,
up 2.1 per cent on 2015. Of all capacity in Great Britain, 71 per cent was estimated to have been
connected to the transmission network in 2016, and 68 per cent in Northern Ireland. This was down
from 74 per cent and 72 per cent respectively, in 2015.
Carbon dioxide emissions from power stations 5.49 It is estimated that carbon dioxide emissions from power stations accounted for 21 per
cent of the UK’s total carbon dioxide emissions in 2016. Emissions vary by type of fuel used to
generate the electricity and emissions estimates for all electricity generation for 2014 to 2016 are
shown in Table 5D below.
Table 5D: Estimated carbon dioxide emissions from electricity supplied 2014 to 2016 1,2
Fuel
Emissions (tonnes of carbon dioxide per GWh electricity supplied)
2014 2015 20163
Coal 903 905 925
Gas 386 382 359
All fossil fuels 651 623 477
All fuels (including nuclear and renewables) 399 334 254
1. The carbon intensity figures presented in Table 5D are different to those produced for the Greenhouse Gas Inventory (GHGI).
The differences arise due to slightly differing methodologies, including geographical coverage and treatment of autogenerators
but principally because the GHGI presents figures based on a 5-year rolling average whereas those in Table 5D are presented
as single year figures.
2. The numerator includes emissions from power stations, with an estimate added for auto-generation. The denominator
(electricity supplied by all generators) used in these calculations can be found in table 5.6, with the figure for All fuels in 2016
being 320,110 GWh.
3. The 2016 emissions figures are provisional.
5.50 The emissions per GWh electricity supplied from coal increased in 2016 due to the drop in coal
generation. Shorter cyles of operation can reduce emissions efficiency for coal plants.
17 The total installed capacity for stations listed in table 5.11 differs from the total in table 5.7, as the latter is on a Transmission
Entry Capacity basis, and taken as at the end of 2016. See paragraph 5.76 for more information on the measures of capacity.

124
Sub-national electricity data 5.51 The collection of data relating to regional and local consumption of electricity began in 2004. For
details of the availability of local level electricity (and gas) data see Chapter 4, paragraph 4.17 and the
sub-national electricity statistics pages on the BEIS section of the GOV.UK website at:
www.gov.uk/government/collections/sub-national-electricity-consumption-data. Data repeated here in
previous editions of this publication as Table 5E are available via that link. The regional data will not
sum exactly to the figures given in table 5.4 as the regional data are not based exactly on a calendar
year and are obtained via different data sources.
Electricity price and market penetration
5.52 Electricity price and market penetration data are published by BEIS in the Quarterly Energy
Prices publication, available at www.gov.uk/government/statistical-data-sets/quarterly-domestic-
energy-price-statistics. Data on Domestic electricity market penetration, repeated here in previous
editions of this publication as Table 5F, are available in table 2.4.1 of Quarterly Energy Prices.
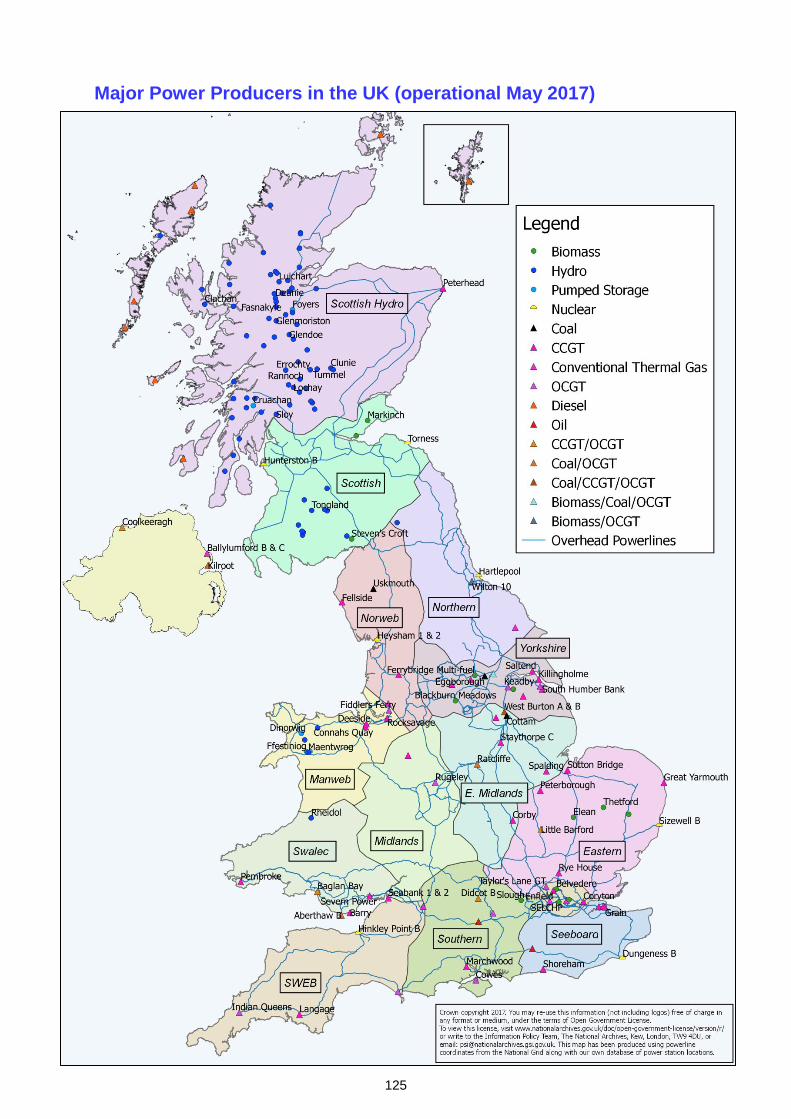
125
Major Power Producers in the UK (operational May 2017)
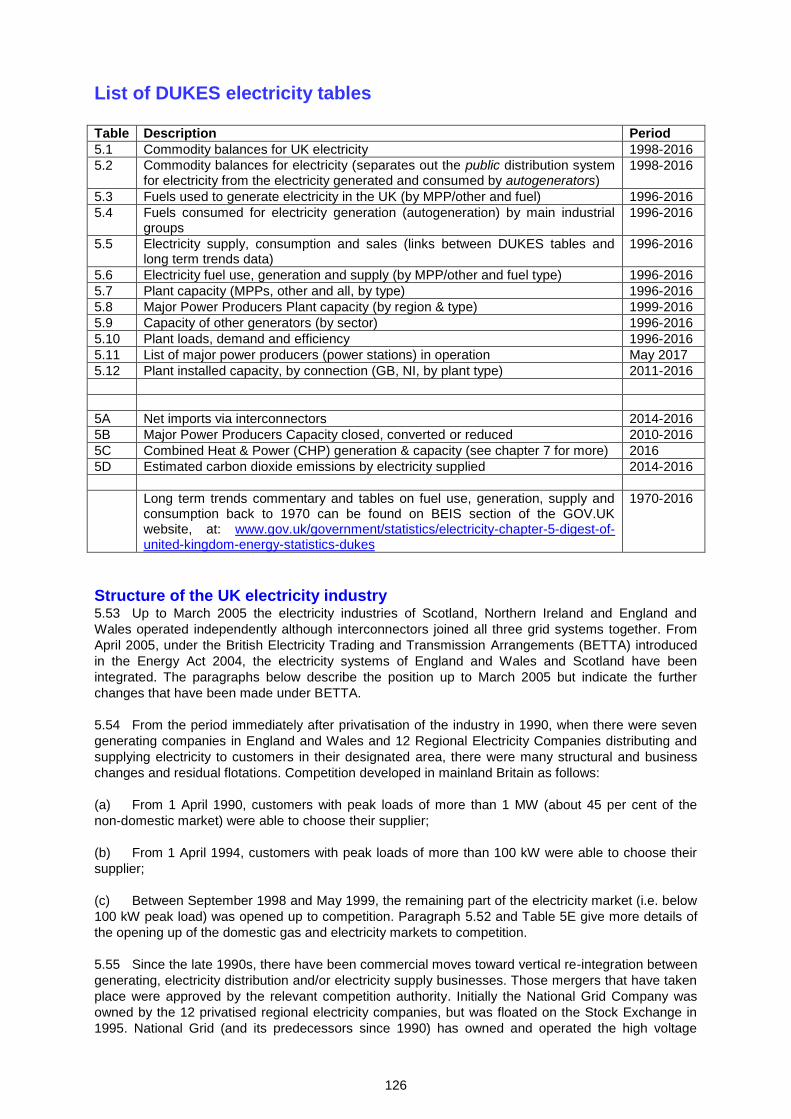
126
List of DUKES electricity tables
Table Description Period
5.1 Commodity balances for UK electricity 1998-2016
5.2 Commodity balances for electricity (separates out the public distribution system for electricity from the electricity generated and consumed by autogenerators)
1998-2016
5.3 Fuels used to generate electricity in the UK (by MPP/other and fuel) 1996-2016
5.4 Fuels consumed for electricity generation (autogeneration) by main industrial groups
1996-2016
5.5 Electricity supply, consumption and sales (links between DUKES tables and long term trends data)
1996-2016
5.6 Electricity fuel use, generation and supply (by MPP/other and fuel type) 1996-2016
5.7 Plant capacity (MPPs, other and all, by type) 1996-2016
5.8 Major Power Producers Plant capacity (by region & type) 1999-2016
5.9 Capacity of other generators (by sector) 1996-2016
5.10 Plant loads, demand and efficiency 1996-2016
5.11 List of major power producers (power stations) in operation May 2017
5.12 Plant installed capacity, by connection (GB, NI, by plant type) 2011-2016
5A Net imports via interconnectors 2014-2016
5B Major Power Producers Capacity closed, converted or reduced 2010-2016
5C Combined Heat & Power (CHP) generation & capacity (see chapter 7 for more) 2016
5D Estimated carbon dioxide emissions by electricity supplied 2014-2016
Long term trends commentary and tables on fuel use, generation, supply and consumption back to 1970 can be found on BEIS section of the GOV.UK website, at: www.gov.uk/government/statistics/electricity-chapter-5-digest-of-united-kingdom-energy-statistics-dukes
1970-2016
Structure of the UK electricity industry 5.53 Up to March 2005 the electricity industries of Scotland, Northern Ireland and England and
Wales operated independently although interconnectors joined all three grid systems together. From
April 2005, under the British Electricity Trading and Transmission Arrangements (BETTA) introduced
in the Energy Act 2004, the electricity systems of England and Wales and Scotland have been
integrated. The paragraphs below describe the position up to March 2005 but indicate the further
changes that have been made under BETTA.
5.54 From the period immediately after privatisation of the industry in 1990, when there were seven
generating companies in England and Wales and 12 Regional Electricity Companies distributing and
supplying electricity to customers in their designated area, there were many structural and business
changes and residual flotations. Competition developed in mainland Britain as follows:
(a) From 1 April 1990, customers with peak loads of more than 1 MW (about 45 per cent of the
non-domestic market) were able to choose their supplier;
(b) From 1 April 1994, customers with peak loads of more than 100 kW were able to choose their
supplier;
(c) Between September 1998 and May 1999, the remaining part of the electricity market (i.e. below
100 kW peak load) was opened up to competition. Paragraph 5.52 and Table 5E give more details of
the opening up of the domestic gas and electricity markets to competition.
5.55 Since the late 1990s, there have been commercial moves toward vertical re-integration between
generating, electricity distribution and/or electricity supply businesses. Those mergers that have taken
place were approved by the relevant competition authority. Initially the National Grid Company was
owned by the 12 privatised regional electricity companies, but was floated on the Stock Exchange in
1995. National Grid (and its predecessors since 1990) has owned and operated the high voltage
127
transmission system in England and Wales linking generators to distributors and some large
customers. The transmission system is linked to continental Europe via an interconnector to France
under the English Channel, and since 1 April 2011, to the Netherlands under the North Sea (see Table
5.10). Up to March 2005, the Scottish transmission system was regarded as being linked to that in
England and Wales by two interconnectors but under BETTA National Grid also took on responsibility
for operating the system in Scotland, to form a single Great Britain transmission network.
5.56 In Scotland, until the end of March 2005, the two main companies, Scottish Power and Scottish
and Southern Energy, covered the full range of electricity provision. They operated generation,
transmission, distribution and supply businesses. In addition, there were a number of small
independent hydro stations and some independent generators operating fossil-fuelled stations, which
sold their output to Scottish Power and Scottish and Southern Energy.
5.57 The electricity supply industry in Northern Ireland has been in private ownership since 1993 with
Northern Ireland Electricity plc (NIE) (part of the Viridian Group) responsible for power procurement,
transmission, distribution and supply in the Province. Generation is provided by three private sector
companies who own the four major power stations. In December 2001, the link between Northern
Ireland’s grid and that of Scotland was inaugurated. A link between the Northern Ireland grid and that
of the Irish Republic was re-established in 1996, along which electricity is both imported and exported.
However, on 1 November 2007 the two grids were fully integrated and a joint body SEMO (Single
Electricity Market Operator) was set up by SONI (System Operator for Northern Ireland) and Eirgrid
from the Republic to oversee the new single market. In July 2012, an interconnector between the Irish
Republic and Wales began operations.
5.58 In March 2001, the means of trading electricity changed with the introduction in England and
Wales of the New Electricity Trading Arrangements (NETA). This replaced the Electricity Pool of
England and Wales. These arrangements were based on bi-lateral trading between generators,
suppliers, traders and customers. They were designed to be more efficient and provide greater choice
for market participants, whilst maintaining the operation of a secure and reliable electricity system. The
system included forwards and futures markets, a balancing mechanism to enable National Grid, as
system operator, to balance the system, and a settlement process. In April 2005 this system was
extended to Scotland under BETTA.
Technical notes and definitions
5.59 These notes and definitions are in addition to the technical notes and definitions covering all
fuels and energy as a whole in Chapter 1. For notes on the commodity balances and definitions of the
terms used in the row headings see Annex A, paragraphs A.7 to A.42. While the data in the PDF copy
of this Digest cover only the most recent five years, these notes also cover data for earlier years that
are available on the BEIS energy statistics web site.
Electricity generation from renewable sources 5.60 Figures on electricity generation from renewable energy sources are included in the tables in
this section. Further detailed information on renewable energy sources is included in Chapter 6.
Combined heat and power 5.61 Electricity generated from combined heat and power (CHP) schemes, CHP generating
capacities and fuel used for electricity generation are included in the tables in this chapter. However,
more detailed analyses of CHP schemes are set out in Chapter 7.
Generating companies 5.62 Following the restructuring of the electricity supply industry in 1990, the term "Major generating
companies" was introduced into the electricity tables to describe the activities of the former
nationalised industries and distinguish them from those of autogenerators and new independent
companies set up to generate electricity. The activities of the autogenerators and the independent
companies were classified under the heading "Other generating companies". In the 1994 Digest, a
new terminology was adopted to encompass the new independent producers, who were then
128
beginning to make a significant contribution to electricity supply. Under this terminology, all companies
whose prime purpose is the generation of electricity are included under the heading "Major power
producers" (or MPPs). The term "Other generators" (“Autogenerators” in the balance tables) is
restricted to companies who produce electricity as part of their manufacturing or other commercial
activities, but whose main business is not electricity generation. “Other generators” also covers
generation by energy services companies at power stations on an industrial or commercial site where
the main purpose is the supply of electricity to that site, even if the energy service company is a
subsidiary of a MPP. Additionally (and particularly since 2010), this category includes generation from
the domestic sector.
5.63 The definition of MPPs was amended in 2008 to include major wind farm companies, but this
change only applies to data for 2007 onwards. Most generators of electricity from renewable sources
(apart from large scale hydro, large scale wind, large scale solar and some biofuels) are also included
as “Other generators” because of their comparatively small size, even though their main activity is
electricity generation.
5.64 Major wind farm operators have been included under MPPs, for 2007 onwards, in the monthly,
quarterly, and annual tables of electricity statistics produced by BEIS. Until then, all generation using
wind turbines was excluded from the MPP classification. This was because originally such generation
was by small independent companies and collecting data on a monthly basis was prohibitively costly
and unnecessarily burdensome on such companies. Similarly, major solar site operators have been
included under MPPs for the first time in 2015.
5.65 Generation from wind has now become more concentrated in the hands of larger companies
and BEIS has extended its system of monthly data collection to cover the largest wind power
companies and, from 2015, solar. The intention is that, in future, any company whose wind generation
capacity increases to above 50 MW will be asked to provide monthly data for generation from wind
and thus be included in the list of MPPs.
5.66 The inclusion of major wind farm and solar site operators under MPPs affects the majority of the
electricity tables in DUKES, with figures for MPPs and the public distribution system increased, and
other generators reduced for 2007 onwards due to wind and from 2015 onwards due to solar.
5.67 Major power producers at the end of 2016 were: AES Electric Ltd, British Energy plc, Carrington Power, Centrica, Coolkeeragh ESB Ltd, Corby Power Ltd, Drax Power Ltd, E.On UK, EDF Energy, Eggborough Power Ltd, ENGIE, Energy Power Resources, Ferrybridge Multifuel Energy Limited, Innogy Renewables UK Ltd, Intergen, LondonWaste Ltd, Magnox Ltd, Marchwood Power Ltd, MPF Operations Ltd, Px Ltd, Riverside Resources Recovery Ltd, RWE Npower Plc, Scottish and Southern Energy, Scottish Power, Seabank Power Ltd, Semcorp Utilities (UK) Ltd, SIMEC, SELCHP Ltd, Statkraft Energy Ltd, Third Energy Trading Ltd, Uniper UK Ltd, Viridor Waste Management, VPI Immingham LLP.
5.68 Additionally, the following major wind farm companies are included, beginning with data
for 2007: Beaufort Wind Ltd, CEP Wind 2 Ltd, Cumbria Wind, Dong Energy, E.On UK, Ecotricity, Eneco Wind UK Limited, Engie, Falck Renewables Wind Ltd, Fred Olsen, Greencoat UK Wind, Infinis, Peel Energy Ltd, REG Windpower Ltd, Renewable Energy Systems Ltd, RWE Innogy UK Ltd, Scottish and Southern Energy, Scottish Power, Statkraft Wind UK Ltd, Wind Prospect, Vattenfall Wind Power, XceCo Ltd.
5.69 Additionally, the following major solar companies are included, beginning with data for
2016: Anesco, Beaufort Wind Ltd, British Solar Renewables, Cubico Sustainable Investments Limited, Ecotricity, Foresight Group, Greencoat Solar, Lark Energy, Lightsource, REG Blackrock, Rockfire Capital, Vattenfall Wind Power.
129
Types of station 5.70 The various types of station identified in the tables of this chapter are as follows:
Conventional steam stations are stations that generate electricity by burning fossil fuels to convert
water into steam, which then powers steam turbines.
Nuclear stations are also steam stations but the heat needed to produce the steam comes from
nuclear fission.
Gas turbines use pressurised combustion gases from fuel burned in one or more combustion
chambers to turn a series of bladed fan wheels and rotate the shaft on which they are mounted. This
then drives the generator. The fuel burnt is usually natural gas or gas oil.
Combined cycle gas turbine (CCGT) stations combine in the same plant gas turbines and steam
turbines connected to one or more electrical generators. This enables electricity to be produced at
higher efficiencies than is otherwise possible when either gas or steam turbines are used in isolation.
The gas turbine (usually fuelled by natural gas or oil) produces mechanical power (to drive the
generator) and waste heat. The hot exhaust gases (waste heat) are fed to a boiler, where steam is
raised at pressure to drive a conventional steam turbine that is also connected to an electrical
generator.
Natural flow hydro-electric stations use natural water flows to turn turbines.
Pumped storage hydro-electric stations use electricity to pump water into a high level reservoir.
This water is then released to generate electricity at peak times. Where the reservoir is open, the
stations also generate some natural flow electricity; this is included with natural flow generation. As
electricity is used in the pumping process, pumped storage stations are net consumers of electricity. Wind farms use wind flows to turn turbines.
Other stations include stations burning fuels such as landfill gas, sewage sludge, biomass and waste.
Electricity supplied – input and output basis
5.71 The energy supplied basis defines the primary input (in million tonnes of oil equivalent, Mtoe)
needed to produce 1 TWh of hydro, wind, or imported electricity as:
Electricity generated (TWh) 0.085985
The primary input (in Mtoe) needed to produce 1 TWh of nuclear electricity is similarly
Electricity generated (TWh) 0.085985
Thermal efficiency of nuclear stations
5.72 Figures on fuel use for electricity generation can be compared in two ways. Table 5.3 illustrates
one way by using the volumes of fuel input to power stations (after conversion of inputs to an oil
equivalent basis), but this takes no account of how efficiently that fuel is converted into electricity. The
fuel input basis is the most appropriate to use for analysis of the quantities of particular fuels used in
electricity generation (e.g. to determine the additional amount of gas or other fuels required as coal
use declines under tighter emissions restrictions). A second way uses the amount of electricity
generated and supplied by each fuel. This output basis is appropriate for comparing how much, and
what percentage, of electricity generation comes from a particular fuel. It is the most appropriate
method to use to examine the dominance of any fuel and for diversity issues. Percentage shares
based on fuel outputs reduce the contribution of coal and nuclear, and increase the contribution of gas
(by three percentage points in 2016) compared with the fuel input basis. This is because of the higher
conversion efficiency of gas.
Public distribution system 5.73 This comprises the grid systems in England and Wales, Scotland and Northern Ireland. In April
2005 the Scotland and England and Wales systems were combined into a single grid.
130
Sectors used for sales/consumption 5.74 The various sectors used for sales and consumption analyses are standardised across all
chapters of the 2016 Digest. For definitions of the sectors see Chapter 1 paragraphs 1.57 to 1.61 and
Annex A paragraphs A.31 to A.42.
Losses 5.75 The losses component of electricity demand are calculated as follows:
Transmission losses: electricity lost as a percentage of electricity entering the GB transmission
system (as reported by National Grid); this is applied to the electricity available figure in DUKES 5.5
(337,656 GWh in 2016).
Distribution losses: electricity lost in distribution as a percentage of electricity entering the
distribution system (as reported by the distribution network operators); this is applied to electricity
available less transmission losses.
Theft: a fixed percentage of 0.3 per cent is assumed to be stolen from the distribution network. This is
applied to electricity available less transmission losses.
Transmission Entry Capacity, Declared Net Capacity and Installed Capacity 5.76 Transmission Entry Capacity (TEC) is a Connection and Use of System Code term that defines
a generator's maximum allowed export capacity onto the transmission system. In the generating
capacity statistics of the 2007 Digest, it replaced Declared Net Capacity (DNC) as the basis of
measurement of the capacity of Major Power Producers from 2006. DNC is the maximum power
available for export from a power station on a continuous basis minus any power generated or
imported by the station from the network to run its own plant. It represents the nominal maximum
capability of a generating set to supply electricity to consumers. The maximum rated output of a
generator (usually under specific conditions designated by the manufacturer) is referred to as its
Installed Capacity. For the nuclear industry, the World Association of Nuclear Operators (WANO)
recommends that capacity of its reactors is measured in terms of Reference Unit Power (RUP) and it
is the RUP figure that is given as the installed capacity of nuclear stations.
5.77 DNC is used to measure the maximum power available from generating stations that use
renewable resources. For wind and wave and small scale hydro a factor is applied to declared net
capability to take account of the intermittent nature of the energy source (e.g. 0.43 for wind, 0.365 for
small scale hydro and 0.17 for solar photovoltaics). Further information on this can be found in
paragraph 6.119, and at: www.legislation.gov.uk/uksi/1990/264/made?view=plain
Load factors 5.78 The following definitions are used in Table 5.10:
Maximum load – This is twice the largest number of units supplied in any consecutive thirty minutes
commencing or terminating at the hour.
Simultaneous maximum load met – The maximum load on the transmission network at any one
time, net of demand met by generation connected to the distribution network. From 2005 (following the
introduction of BETTA – see paragraph 5.53) it is measured by the sum of the maximum load met in
Great Britain and the load met at the same time in Northern Ireland. Prior to 2005 it was measured by
the sum of the maximum load met in England and Wales and the loads met at the same time by
companies in other parts of the United Kingdom.
Plant load factor – The average hourly quantity of electricity supplied during the year, expressed as a
percentage of the average output capability at the beginning and the end of year.
System load factor – The average hourly quantity of electricity available during the year expressed
as a percentage of the maximum demand nearest the end of the year or early the following year.
131
Thermal efficiency 5.79 Thermal efficiency is the efficiency with which heat energy contained in fuel is converted into
electrical energy. It is calculated for fossil fuel burning stations by expressing electricity generated as a
percentage of the total energy content of the fuel consumed (based on average gross calorific values).
For nuclear stations it is calculated using the quantity of heat released as a result of fission of the
nuclear fuel inside the reactor. The efficiency of CHP systems is illustrated in Chapter 7, Table 7D.
Efficiencies based on gross calorific value of the fuel (sometimes referred to as higher heating values
or HHV) are lower than the efficiencies based on net calorific value (or lower heating value LHV). The
difference between HHV and LHV is due to the energy associated with the latent heat of the
evaporation of water products from the steam cycle which cannot be recovered and put to economic
use.
Period covered 5.80 Until 2004, figures for the MPPs relate to periods of 52 weeks as listed below (although some
data provided by electricity supply companies related to calendar months and were adjusted to the
statistical calendar). In 2004, a change was made to a calendar year basis. This change was made in
the middle of the year and the data are largely based on information collected monthly. The January to
May 2004 data are therefore based on the 21 weeks ended 29 May 2004 and the calendar months
June to December 2004, making a total of 361 days. In terms of days, 2004 is therefore 1.1 per cent
shorter than 2005:
Year 52 weeks ended
2003 28 December 2003
2004 21 weeks ended 29 May 2004 and 7 months ended 31 December 2004
2005 – 2016: 12 months ended 31 December
5.81 Figures for industrial, commercial and transport undertakings relate to calendar years ending on
31 December, except for the iron and steel industry where figures relate to the following 52 or 53 week
periods:
Year 53 weeks ended
2003 3 January 2004
52 weeks ended
2004 1 January 2005
2005 31 December 2005
2006 30 December 2006
2007 29 December 2007
2008 27 December 2008
53 weeks ended
2009 2 January 2010
52 weeks ended
2010 1 January 2011
2011 31 December 2011
2012 29 December 2012
2013 28 December 2013
2014 27 December 2014
53 weeks ended
2015 2 January 2016
52 weeks ended
2016 31 December 2016
Monthly and quarterly data 5.82 Monthly and quarterly data on fuel use, electricity generation and supply and electricity
availability and consumption are available on the BEIS section of the GOV.UK website at:
www.gov.uk/government/collections/electricity-statistics. Monthly data on fuel used in electricity
generation by MPPs are given in Monthly Table 5.3 and monthly data on supplies by type of plant and
132
type of fuel are given in Monthly Table 5.4. Monthly data on availability and consumption of electricity
by the main sectors of the economy are given in Monthly Table 5.5. A quarterly commodity balance for
electricity is published in BEIS’s quarterly statistical bulletin Energy Trends (Quarterly Table 5.2) along
with a quarterly table of fuel use for generation, electricity generated, and electricity supplied by all
generators (Quarterly Table 5.1). Both these quarterly tables are also available from BEIS’s energy
statistics web site. See Annex C for more information about Energy Trends.
Data collection 5.83 For MPPs, as defined in paragraphs 5.62 to 5.68, the data for the tables in this Digest are
obtained from the results of an annual BEIS inquiry, sent to each company, covering generating
capacity, fuel use, generation and sales of electricity (where a generator also supplies electricity).
5.84 Similarly, an annual inquiry is sent to licensed suppliers of electricity to establish electricity sales
by these companies. Electricity consumption for the iron and steel sector is based on data provided by
the Iron and Steel Statistics Bureau (ISSB) rather than electricity suppliers since electricity suppliers
tend to over-estimate their sales to this sector by including some companies that use steel rather than
manufacture it. The difference between the ISSB and electricity suppliers’ figures has been re-
allocated to other sectors. A further means of checking electricity consumption data is now being
employed on data for 2006 and subsequent years. A monthly inquiry is sent to electricity distributors,
as well as the National Grid, to establish electricity distribution and transmission losses. Copies of the
survey questionnaires are available in electricity statistics: data sources and methodologies, at:
www.gov.uk/government/collections/electricity-statistics.
5.85 A sample of companies that generate electricity mainly for their own use (known as
autogenerators or autoproducers – see paragraph 5.62, above) is covered by a quarterly inquiry
commissioned by BEIS but carried out by the Office for National Statistics (ONS). Where
autogenerators operate a combined heat and power (CHP) plant, this survey is supplemented (on an
annual basis) by information from the CHP Quality Assessment scheme (for autogenerators who have
registered under the scheme – see Chapter 7 on CHP). There are two areas of autogeneration that
are covered by direct data collection by BEIS, mainly because the return contains additional energy
information needed by the Department. These are the Iron and Steel industry, and generation on
behalf of London Underground.
5.86 In addition to the above sources, some administrative data is used for renewable generation
and capacity in the hands of non-major power producers - this includes data from the Renewables
Obligation and Feed in Tariff schemes.
Statistical differences 5.87 Statistical differences are included in Tables 5.1 and 5.2. These arise because data collected on
production and supply do not match exactly with data collected on sales or consumption. One of the
reasons for this is that some of the data are based on different calendars as described in paragraphs
5.80 and 5.81, above. Sales data based on calendar years will always have included more electricity
consumption than the slightly shorter statistical year of exactly 52 weeks.
5.88 Care should be exercised in interpreting the figures for individual industries in the commodity
balance tables. Where companies have moved between suppliers, it has not been possible to ensure
consistent classification between and within industry sectors and across years. The breakdown of final
consumption includes some estimated data. In 2014, for about five per cent of consumption of
electricity supplied by the public distribution system, the sector figures are partially estimated.
Contact: Stephen Ashcroft
Energy Statistics Team
0300 068 2928
Contact: Nick Jesson
Energy Statistics Team
0300 068 5346

133
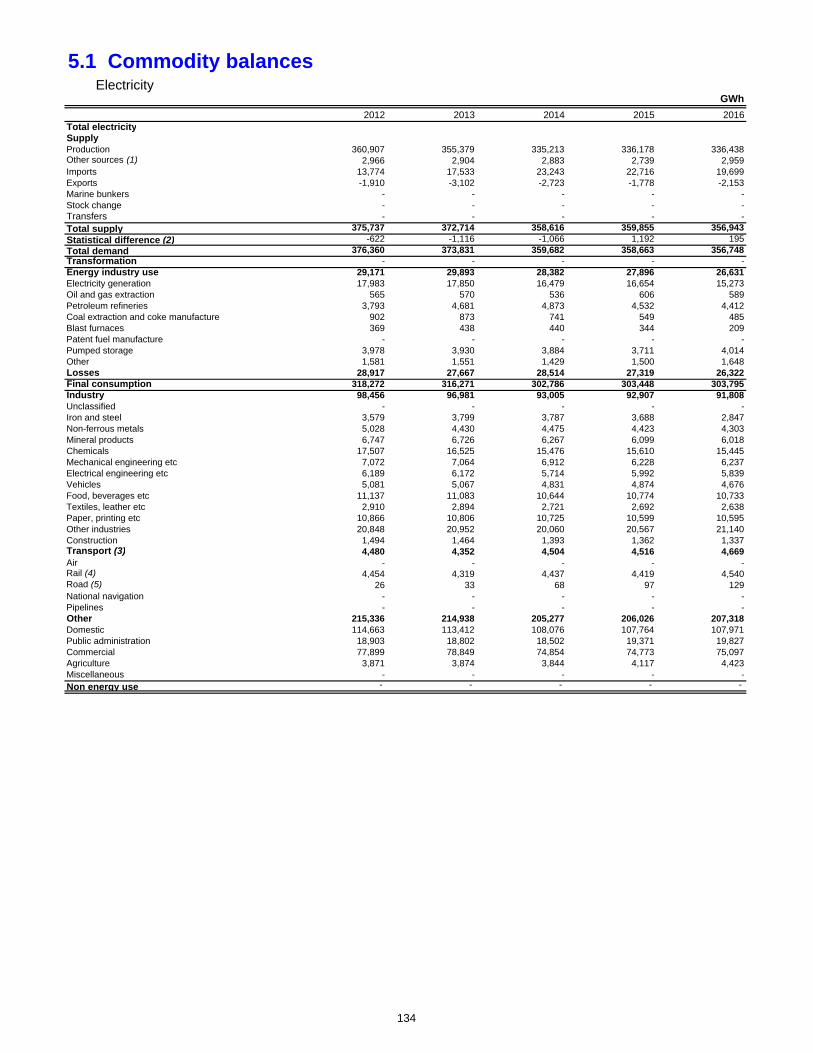
5.1 Commodity balances Electricity
GWh
2012 2013 2014 2015 2016Total electricitySupplyProduction 360,907 355,379 335,213 336,178 336,438Other sources (1) 2,966 2,904 2,883 2,739 2,959Imports 13,774 17,533 23,243 22,716 19,699Exports -1,910 -3,102 -2,723 -1,778 -2,153Marine bunkers - - - - -Stock change - - - - -Transfers - - - - -Total supply 375,737 372,714 358,616 359,855 356,943Statistical difference (2) -622 -1,116 -1,066 1,192 195Total demand 376,360 373,831 359,682 358,663 356,748Transformation - - - - -Energy industry use 29,171 29,893 28,382 27,896 26,631Electricity generation 17,983 17,850 16,479 16,654 15,273Oil and gas extraction 565 570 536 606 589Petroleum refineries 3,793 4,681 4,873 4,532 4,412Coal extraction and coke manufacture 902 873 741 549 485Blast furnaces 369 438 440 344 209Patent fuel manufacture - - - - -Pumped storage 3,978 3,930 3,884 3,711 4,014Other 1,581 1,551 1,429 1,500 1,648Losses 28,917 27,667 28,514 27,319 26,322Final consumption 318,272 316,271 302,786 303,448 303,795Industry 98,456 96,981 93,005 92,907 91,808Unclassified - - - - -Iron and steel 3,579 3,799 3,787 3,688 2,847Non-ferrous metals 5,028 4,430 4,475 4,423 4,303Mineral products 6,747 6,726 6,267 6,099 6,018Chemicals 17,507 16,525 15,476 15,610 15,445Mechanical engineering etc 7,072 7,064 6,912 6,228 6,237Electrical engineering etc 6,189 6,172 5,714 5,992 5,839Vehicles 5,081 5,067 4,831 4,874 4,676Food, beverages etc 11,137 11,083 10,644 10,774 10,733Textiles, leather etc 2,910 2,894 2,721 2,692 2,638Paper, printing etc 10,866 10,806 10,725 10,599 10,595Other industries 20,848 20,952 20,060 20,567 21,140Construction 1,494 1,464 1,393 1,362 1,337Transport (3) 4,480 4,352 4,504 4,516 4,669Air - - - - -Rail (4) 4,454 4,319 4,437 4,419 4,540Road (5) 26 33 68 97 129National navigation - - - - -Pipelines - - - - -Other 215,336 214,938 205,277 206,026 207,318Domestic 114,663 113,412 108,076 107,764 107,971Public administration 18,903 18,802 18,502 19,371 19,827Commercial 77,899 78,849 74,854 74,773 75,097Agriculture 3,871 3,874 3,844 4,117 4,423Miscellaneous - - - - -Non energy use - - - - -
134
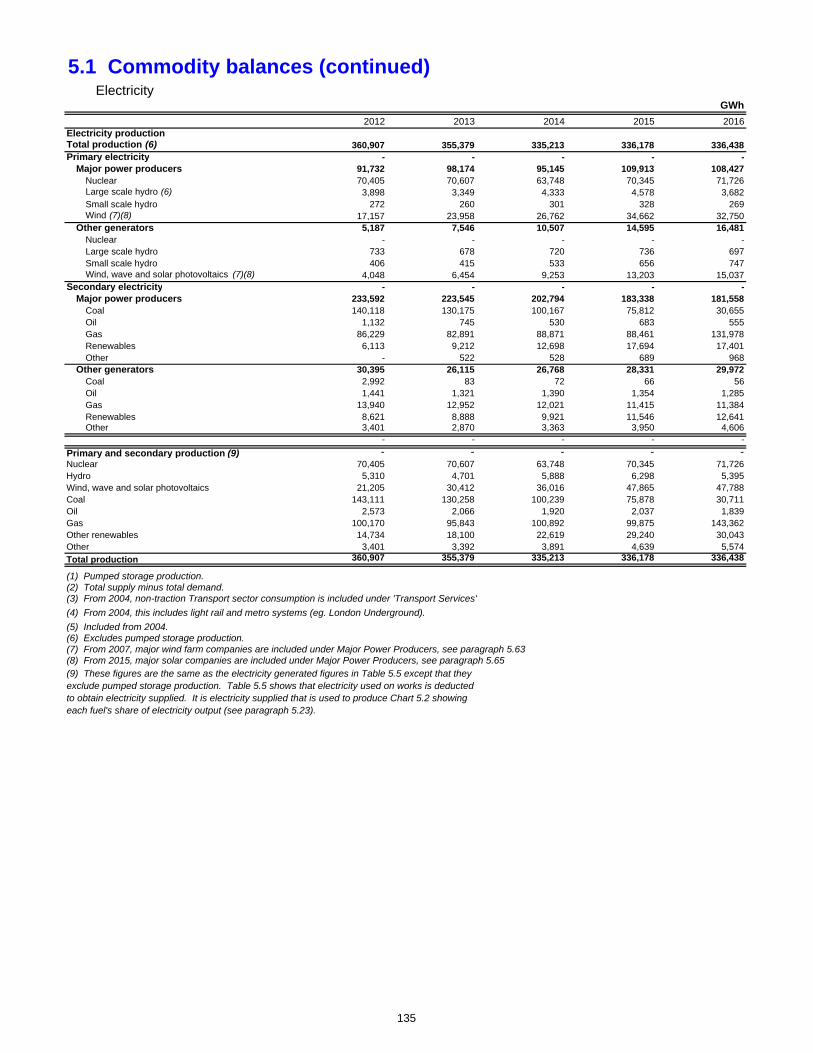
5.1 Commodity balances (continued)Electricity
GWh
2012 2013 2014 2015 2016Electricity productionTotal production (6) 360,907 355,379 335,213 336,178 336,438Primary electricity - - - - -
Major power producers 91,732 98,174 95,145 109,913 108,427Nuclear 70,405 70,607 63,748 70,345 71,726Large scale hydro (6) 3,898 3,349 4,333 4,578 3,682Small scale hydro 272 260 301 328 269Wind (7)(8) 17,157 23,958 26,762 34,662 32,750
Other generators 5,187 7,546 10,507 14,595 16,481Nuclear - - - - -Large scale hydro 733 678 720 736 697Small scale hydro 406 415 533 656 747Wind, wave and solar photovoltaics (7)(8) 4,048 6,454 9,253 13,203 15,037
Secondary electricity - - - - -Major power producers 233,592 223,545 202,794 183,338 181,558
Coal 140,118 130,175 100,167 75,812 30,655Oil 1,132 745 530 683 555Gas 86,229 82,891 88,871 88,461 131,978Renewables 6,113 9,212 12,698 17,694 17,401Other - 522 528 689 968
Other generators 30,395 26,115 26,768 28,331 29,972Coal 2,992 83 72 66 56Oil 1,441 1,321 1,390 1,354 1,285Gas 13,940 12,952 12,021 11,415 11,384Renewables 8,621 8,888 9,921 11,546 12,641Other 3,401 2,870 3,363 3,950 4,606
- - - - -
Primary and secondary production (9) - - - - -Nuclear 70,405 70,607 63,748 70,345 71,726Hydro 5,310 4,701 5,888 6,298 5,395Wind, wave and solar photovoltaics 21,205 30,412 36,016 47,865 47,788Coal 143,111 130,258 100,239 75,878 30,711Oil 2,573 2,066 1,920 2,037 1,839Gas 100,170 95,843 100,892 99,875 143,362Other renewables 14,734 18,100 22,619 29,240 30,043Other 3,401 3,392 3,891 4,639 5,574
Total production 360,907 355,379 335,213 336,178 336,438
(1) Pumped storage production.(2) Total supply minus total demand.(3) From 2004, non-traction Transport sector consumption is included under 'Transport Services'.
(4) From 2004, this includes light rail and metro systems (eg. London Underground).
(5) Included from 2004.(6) Excludes pumped storage production.(7) From 2007, major wind farm companies are included under Major Power Producers, see paragraph 5.63(8) From 2015, major solar companies are included under Major Power Producers, see paragraph 5.65(9) These figures are the same as the electricity generated figures in Table 5.5 except that they exclude pumped storage production. Table 5.5 shows that electricity used on works is deducted to obtain electricity supplied. It is electricity supplied that is used to produce Chart 5.2 showing each fuel's share of electricity output (see paragraph 5.23).
135
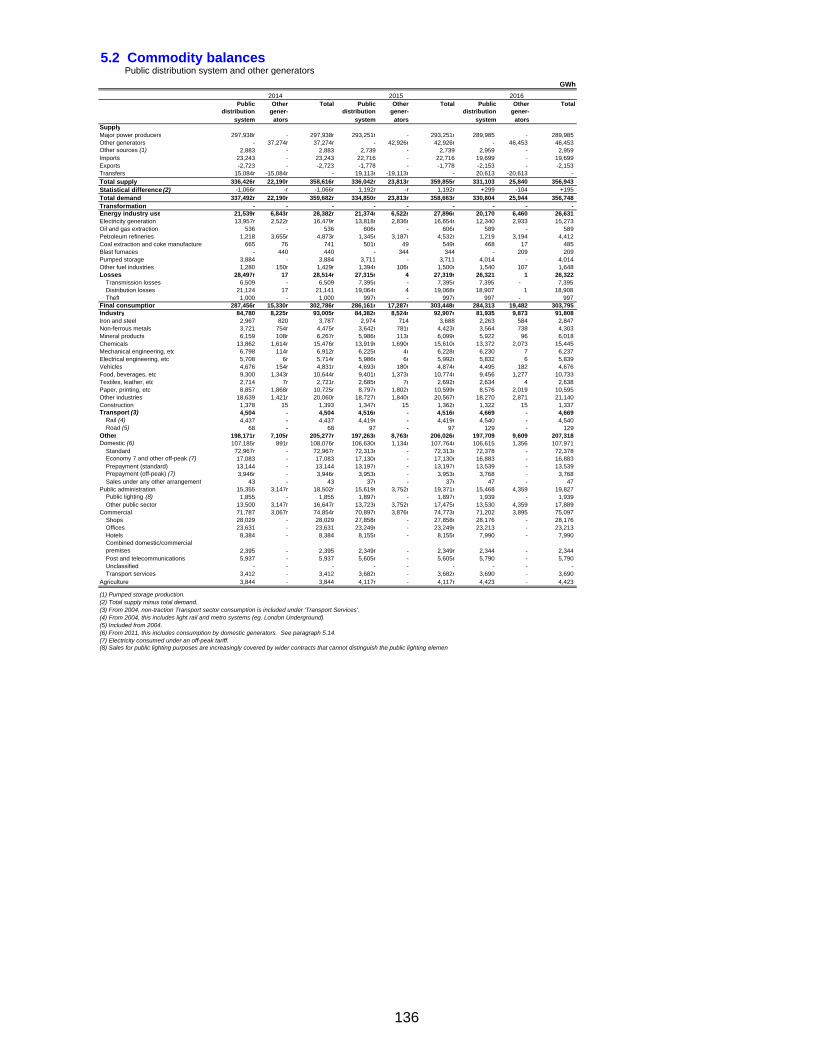
5.2 Commodity balances Public distribution system and other generators
GWh
Public Other Total Public Other Total Public Other Totaldistribution gener- distribution gener- distribution gener-
system ators system ators system atorsSupplyMajor power producers 297,938r - 297,938r 293,251r - 293,251r 289,985 - 289,985 Other generators - 37,274r 37,274r - 42,926r 42,926r - 46,453 46,453 Other sources (1) 2,883 - 2,883 2,739 - 2,739 2,959 - 2,959 Imports 23,243 - 23,243 22,716 - 22,716 19,699 - 19,699 Exports -2,723 - -2,723 -1,778 - -1,778 -2,153 - -2,153 Transfers 15,084r -15,084r - 19,113r -19,113r - 20,613 -20,613 - Total supply 336,426r 22,190r 358,616r 336,042r 23,813r 359,855r 331,103 25,840 356,943 Statistical difference (2) -1,066r -r -1,066r 1,192r -r 1,192r +299 -104 +195 Total demand 337,492r 22,190r 359,682r 334,850r 23,813r 358,663r 330,804 25,944 356,748 Transformation - - - - - - - - - Energy industry use 21,539r 6,843r 28,382r 21,374r 6,522r 27,896r 20,170 6,460 26,631 Electricity generation 13,957r 2,522r 16,479r 13,818r 2,836r 16,654r 12,340 2,933 15,273 Oil and gas extraction 536 - 536 606r - 606r 589 - 589 Petroleum refineries 1,218 3,655r 4,873r 1,345r 3,187r 4,532r 1,219 3,194 4,412 Coal extraction and coke manufacture 665 76 741 501r 49 549r 468 17 485 Blast furnaces - 440 440 - 344 344 - 209 209 Pumped storage 3,884 - 3,884 3,711 - 3,711 4,014 - 4,014 Other fuel industries 1,280 150r 1,429r 1,394r 106r 1,500r 1,540 107 1,648 Losses 28,497r 17 28,514r 27,315r 4 27,319r 26,321 1 26,322
Transmission losses 6,509 - 6,509 7,395r - 7,395r 7,395 - 7,395 Distribution losses 21,124 17 21,141 19,064r 4 19,068r 18,907 1 18,908 Theft 1,000 - 1,000 997r - 997r 997 - 997
Final consumption 287,456r 15,330r 302,786r 286,161r 17,287r 303,448r 284,313 19,482 303,795 Industry 84,780 8,225r 93,005r 84,382r 8,524r 92,907r 81,935 9,873 91,808 Iron and steel 2,967 820 3,787 2,974 714 3,688 2,263 584 2,847 Non-ferrous metals 3,721 754r 4,475r 3,642r 781r 4,423r 3,564 738 4,303 Mineral products 6,159 108r 6,267r 5,986r 113r 6,099r 5,922 96 6,018 Chemicals 13,862 1,614r 15,476r 13,919r 1,690r 15,610r 13,372 2,073 15,445 Mechanical engineering, etc 6,798 114r 6,912r 6,225r 4r 6,228r 6,230 7 6,237 Electrical engineering, etc 5,708 6r 5,714r 5,986r 6r 5,992r 5,832 6 5,839 Vehicles 4,676 154r 4,831r 4,693r 180r 4,874r 4,495 182 4,676 Food, beverages, etc 9,300 1,343r 10,644r 9,401r 1,373r 10,774r 9,456 1,277 10,733 Textiles, leather, etc 2,714 7r 2,721r 2,685r 7r 2,692r 2,634 4 2,638 Paper, printing, etc 8,857 1,868r 10,725r 8,797r 1,802r 10,599r 8,576 2,019 10,595 Other industries 18,639 1,421r 20,060r 18,727r 1,840r 20,567r 18,270 2,871 21,140 Construction 1,378 15 1,393 1,347r 15 1,362r 1,322 15 1,337 Transport (3) 4,504 - 4,504 4,516r - 4,516r 4,669 - 4,669
Rail (4) 4,437 - 4,437 4,419r - 4,419r 4,540 - 4,540 Road (5) 68 - 68 97 - 97 129 - 129
Other 198,171r 7,105r 205,277r 197,263r 8,763r 206,026r 197,709 9,609 207,318 Domestic (6) 107,185r 891r 108,076r 106,630r 1,134r 107,764r 106,615 1,356 107,971
Standard 72,967r - 72,967r 72,313r - 72,313r 72,378 - 72,378 Economy 7 and other off-peak (7) 17,083 - 17,083 17,130r - 17,130r 16,883 - 16,883 Prepayment (standard) 13,144 - 13,144 13,197r - 13,197r 13,539 - 13,539 Prepayment (off-peak) (7) 3,946r - 3,946r 3,953r - 3,953r 3,768 - 3,768 Sales under any other arrangement 43 - 43 37r - 37r 47 - 47
Public administration 15,355 3,147r 18,502r 15,619r 3,752r 19,371r 15,468 4,359 19,827 Public lighting (8) 1,855 - 1,855 1,897r - 1,897r 1,939 - 1,939 Other public sector 13,500 3,147r 16,647r 13,723r 3,752r 17,475r 13,530 4,359 17,889
Commercial 71,787 3,067r 74,854r 70,897r 3,876r 74,773r 71,202 3,895 75,097 Shops 28,029 - 28,029 27,858r - 27,858r 28,176 - 28,176 Offices 23,631 - 23,631 23,249r - 23,249r 23,213 - 23,213 Hotels 8,384 - 8,384 8,155r - 8,155r 7,990 - 7,990 Combined domestic/commercial premises 2,395 - 2,395 2,349r - 2,349r 2,344 - 2,344 Post and telecommunications 5,937 - 5,937 5,605r - 5,605r 5,790 - 5,790 Unclassified - - - - - - - - - Transport services 3,412 - 3,412 3,682r - 3,682r 3,690 - 3,690
Agriculture 3,844 - 3,844 4,117r - 4,117r 4,423 - 4,423
(1) Pumped storage production.(2) Total supply minus total demand.(3) From 2004, non-traction Transport sector consumption is included under 'Transport Services'.(4) From 2004, this includes light rail and metro systems (eg. London Underground).(5) Included from 2004.(6) From 2011, this includes consumption by domestic generators. See paragraph 5.14.(7) Electricity consumed under an off-peak tariff.(8) Sales for public lighting purposes are increasingly covered by wider contracts that cannot distinguish the public lighting elemen
2014 2015 2016
136
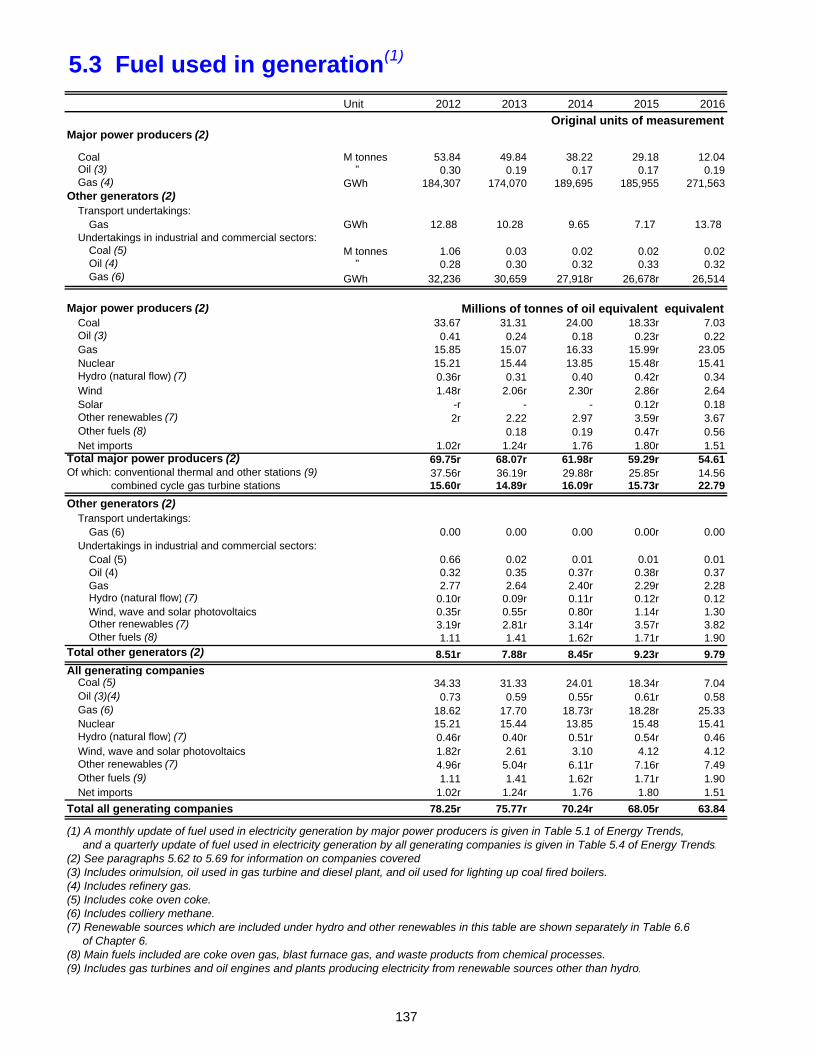
5.3 Fuel used in generation(1)
Unit 2012 2013 2014 2015 2016
Original units of measurementMajor power producers (2)
Coal M tonnes 53.84 49.84 38.22 29.18 12.04Oil (3) " 0.30 0.19 0.17 0.17 0.19Gas (4) GWh 184,307 174,070 189,695 185,955 271,563
Other generators (2)Transport undertakings:
Gas GWh 12.88 10.28 9.65 7.17 13.78 Undertakings in industrial and commercial sectors:
Coal (5) M tonnes 1.06 0.03 0.02 0.02 0.02Oil (4) " 0.28 0.30 0.32 0.33 0.32Gas (6) GWh 32,236 30,659 27,918r 26,678r 26,514
Major power producers (2) Millions of tonnes of oil equivalent equivalentCoal 33.67 31.31 24.00 18.33r 7.03Oil (3) 0.41 0.24 0.18 0.23r 0.22Gas 15.85 15.07 16.33 15.99r 23.05Nuclear 15.21 15.44 13.85 15.48r 15.41Hydro (natural flow) (7) 0.36r 0.31 0.40 0.42r 0.34Wind 1.48r 2.06r 2.30r 2.86r 2.64Solar -r - - 0.12r 0.18Other renewables (7) 2r 2.22 2.97 3.59r 3.67Other fuels (8) 0.18 0.19 0.47r 0.56Net imports 1.02r 1.24r 1.76 1.80r 1.51
Total major power producers (2) 69.75r 68.07r 61.98r 59.29r 54.61Of which: conventional thermal and other stations (9) 37.56r 36.19r 29.88r 25.85r 14.56
combined cycle gas turbine stations 15.60r 14.89r 16.09r 15.73r 22.79
Other generators (2)Transport undertakings:
Gas (6) 0.00 0.00 0.00 0.00r 0.00Undertakings in industrial and commercial sectors:
Coal (5) 0.66 0.02 0.01 0.01 0.01Oil (4) 0.32 0.35 0.37r 0.38r 0.37Gas 2.77 2.64 2.40r 2.29r 2.28Hydro (natural flow) (7) 0.10r 0.09r 0.11r 0.12r 0.12Wind, wave and solar photovoltaics 0.35r 0.55r 0.80r 1.14r 1.30Other renewables (7) 3.19r 2.81r 3.14r 3.57r 3.82Other fuels (8) 1.11 1.41 1.62r 1.71r 1.90
Total other generators (2) 8.51r 7.88r 8.45r 9.23r 9.79
All generating companiesCoal (5) 34.33 31.33 24.01 18.34r 7.04Oil (3)(4) 0.73 0.59 0.55r 0.61r 0.58Gas (6) 18.62 17.70 18.73r 18.28r 25.33Nuclear 15.21 15.44 13.85 15.48 15.41Hydro (natural flow) (7) 0.46r 0.40r 0.51r 0.54r 0.46Wind, wave and solar photovoltaics 1.82r 2.61 3.10 4.12 4.12Other renewables (7) 4.96r 5.04r 6.11r 7.16r 7.49Other fuels (9) 1.11 1.41 1.62r 1.71r 1.90Net imports 1.02r 1.24r 1.76 1.80 1.51
Total all generating companies 78.25r 75.77r 70.24r 68.05r 63.84
(1) A monthly update of fuel used in electricity generation by major power producers is given in Table 5.1 of Energy Trends, and a quarterly update of fuel used in electricity generation by all generating companies is given in Table 5.4 of Energy Trends.(2) See paragraphs 5.62 to 5.69 for information on companies covered.(3) Includes orimulsion, oil used in gas turbine and diesel plant, and oil used for lighting up coal fired boilers.(4) Includes refinery gas.(5) Includes coke oven coke.(6) Includes colliery methane.(7) Renewable sources which are included under hydro and other renewables in this table are shown separately in Table 6.6 of Chapter 6.(8) Main fuels included are coke oven gas, blast furnace gas, and waste products from chemical processes.(9) Includes gas turbines and oil engines and plants producing electricity from renewable sources other than hydro.
137
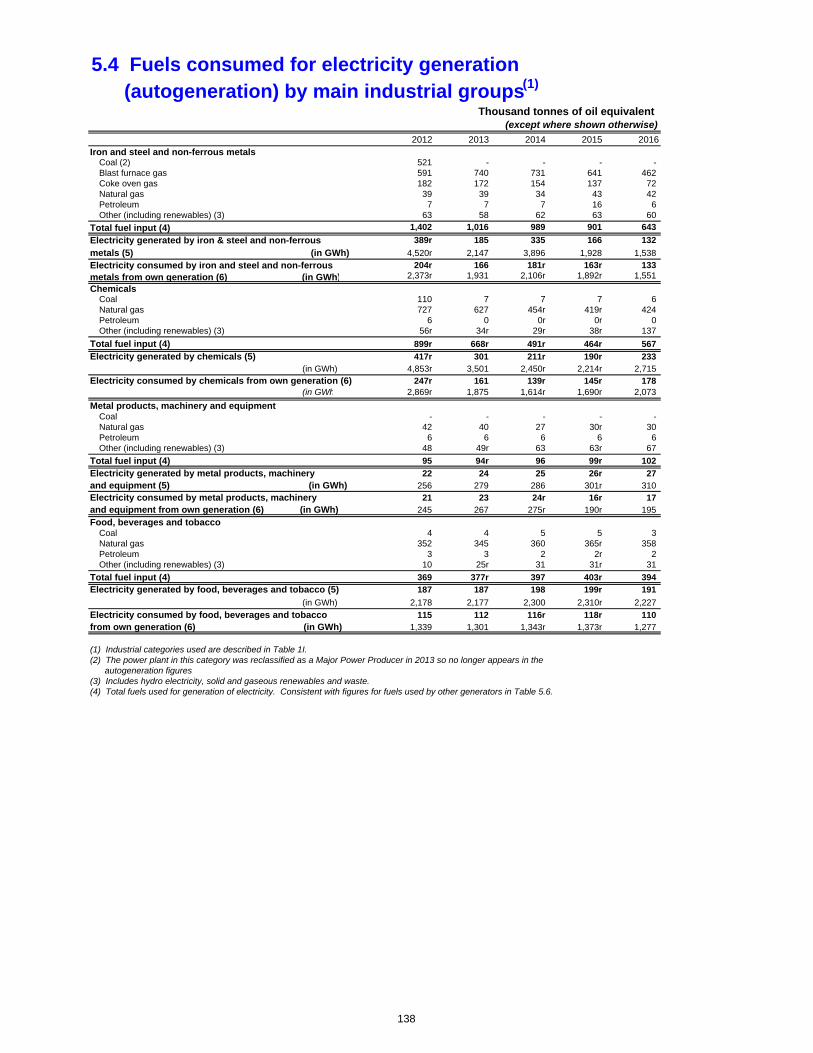
5.4 Fuels consumed for electricity generation (autogeneration) by main industrial groups(1)
Thousand tonnes of oil equivalent (except where shown otherwise)
2012 2013 2014 2015 2016Iron and steel and non-ferrous metals
Coal (2) 521 - - - - Blast furnace gas 591 740 731 641 462 Coke oven gas 182 172 154 137 72 Natural gas 39 39 34 43 42 Petroleum 7 7 7 16 6 Other (including renewables) (3) 63 58 62 63 60
Total fuel input (4) 1,402 1,016 989 901 643
Electricity generated by iron & steel and non-ferrous 389r 185 335 166 132
metals (5) (in GWh) 4,520r 2,147 3,896 1,928 1,538
Electricity consumed by iron and steel and non-ferrous 204r 166 181r 163r 133 metals from own generation (6) (in GWh) 2,373r 1,931 2,106r 1,892r 1,551
ChemicalsCoal 110 7 7 7 6 Natural gas 727 627 454r 419r 424 Petroleum 6 0 0r 0r 0 Other (including renewables) (3) 56r 34r 29r 38r 137
Total fuel input (4) 899r 668r 491r 464r 567
Electricity generated by chemicals (5) 417r 301 211r 190r 233 (in GWh) 4,853r 3,501 2,450r 2,214r 2,715 Electricity consumed by chemicals from own generation (6) 247r 161 139r 145r 178 (in GWh 2,869r 1,875 1,614r 1,690r 2,073
Metal products, machinery and equipmentCoal - - - - - Natural gas 42 40 27 30r 30 Petroleum 6 6 6 6 6 Other (including renewables) (3) 48 49r 63 63r 67
Total fuel input (4) 95 94r 96 99r 102
Electricity generated by metal products, machinery 22 24 25 26r 27 and equipment (5) (in GWh) 256 279 286 301r 310 Electricity consumed by metal products, machinery 21 23 24r 16r 17 and equipment from own generation (6) (in GWh) 245 267 275r 190r 195
Food, beverages and tobaccoCoal 4 4 5 5 3 Natural gas 352 345 360 365r 358 Petroleum 3 3 2 2r 2 Other (including renewables) (3) 10 25r 31 31r 31
Total fuel input (4) 369 377r 397 403r 394
Electricity generated by food, beverages and tobacco (5) 187 187 198 199r 191
(in GWh) 2,178 2,177 2,300 2,310r 2,227
Electricity consumed by food, beverages and tobacco 115 112 116r 118r 110 from own generation (6) (in GWh) 1,339 1,301 1,343r 1,373r 1,277
(1) Industrial categories used are described in Table 1I.(2) The power plant in this category was reclassified as a Major Power Producer in 2013 so no longer appears in the autogeneration figures(3) Includes hydro electricity, solid and gaseous renewables and waste.(4) Total fuels used for generation of electricity. Consistent with figures for fuels used by other generators in Table 5.6.
138
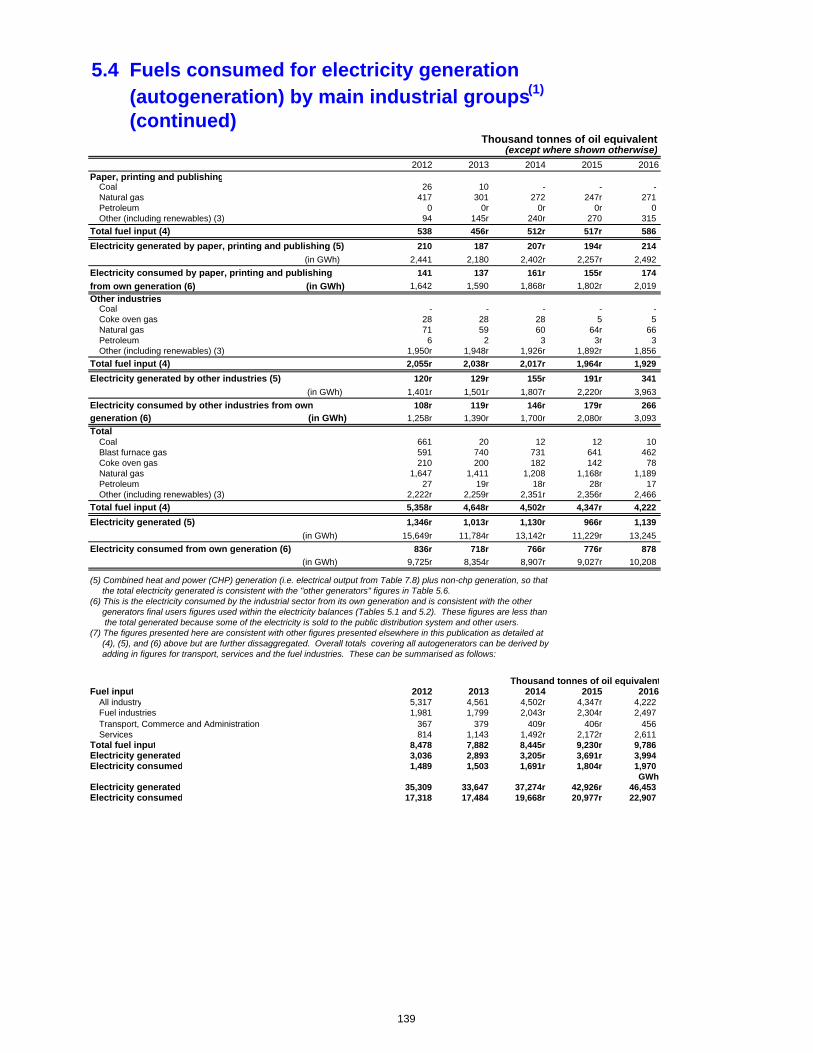
5.4 Fuels consumed for electricity generation (autogeneration) by main industrial groups(1)
(continued)Thousand tonnes of oil equivalent
(except where shown otherwise)
2012 2013 2014 2015 2016Paper, printing and publishing
Coal 26 10 - - - Natural gas 417 301 272 247r 271 Petroleum 0 0r 0r 0r 0 Other (including renewables) (3) 94 145r 240r 270 315
Total fuel input (4) 538 456r 512r 517r 586
Electricity generated by paper, printing and publishing (5) 210 187 207r 194r 214
(in GWh) 2,441 2,180 2,402r 2,257r 2,492
Electricity consumed by paper, printing and publishing 141 137 161r 155r 174
from own generation (6) (in GWh) 1,642 1,590 1,868r 1,802r 2,019
Other industriesCoal - - - - - Coke oven gas 28 28 28 5 5 Natural gas 71 59 60 64r 66 Petroleum 6 2 3 3r 3 Other (including renewables) (3) 1,950r 1,948r 1,926r 1,892r 1,856
Total fuel input (4) 2,055r 2,038r 2,017r 1,964r 1,929
Electricity generated by other industries (5) 120r 129r 155r 191r 341
(in GWh) 1,401r 1,501r 1,807r 2,220r 3,963
Electricity consumed by other industries from own 108r 119r 146r 179r 266
generation (6) (in GWh) 1,258r 1,390r 1,700r 2,080r 3,093
TotalCoal 661 20 12 12 10 Blast furnace gas 591 740 731 641 462 Coke oven gas 210 200 182 142 78 Natural gas 1,647 1,411 1,208 1,168r 1,189 Petroleum 27 19r 18r 28r 17 Other (including renewables) (3) 2,222r 2,259r 2,351r 2,356r 2,466
Total fuel input (4) 5,358r 4,648r 4,502r 4,347r 4,222
Electricity generated (5) 1,346r 1,013r 1,130r 966r 1,139
(in GWh) 15,649r 11,784r 13,142r 11,229r 13,245
Electricity consumed from own generation (6) 836r 718r 766r 776r 878
(in GWh) 9,725r 8,354r 8,907r 9,027r 10,208
(5) Combined heat and power (CHP) generation (i.e. electrical output from Table 7.8) plus non-chp generation, so that the total electricity generated is consistent with the "other generators" figures in Table 5.6. (6) This is the electricity consumed by the industrial sector from its own generation and is consistent with the other generators final users figures used within the electricity balances (Tables 5.1 and 5.2). These figures are less than the total generated because some of the electricity is sold to the public distribution system and other users.(7) The figures presented here are consistent with other figures presented elsewhere in this publication as detailed at (4), (5), and (6) above but are further dissaggregated. Overall totals covering all autogenerators can be derived by adding in figures for transport, services and the fuel industries. These can be summarised as follows:
Thousand tonnes of oil equivalentFuel input 2012 2013 2014 2015 2016
All industry 5,317 4,561 4,502r 4,347r 4,222 Fuel industries 1,981 1,799 2,043r 2,304r 2,497 Transport, Commerce and Administration 367 379 409r 406r 456 Services 814 1,143 1,492r 2,172r 2,611
Total fuel input 8,478 7,882 8,445r 9,230r 9,786 Electricity generated 3,036 2,893 3,205r 3,691r 3,994 Electricity consumed 1,489 1,503 1,691r 1,804r 1,970
GWhElectricity generated 35,309 33,647 37,274r 42,926r 46,453 Electricity consumed 17,318 17,484 19,668r 20,977r 22,907
139
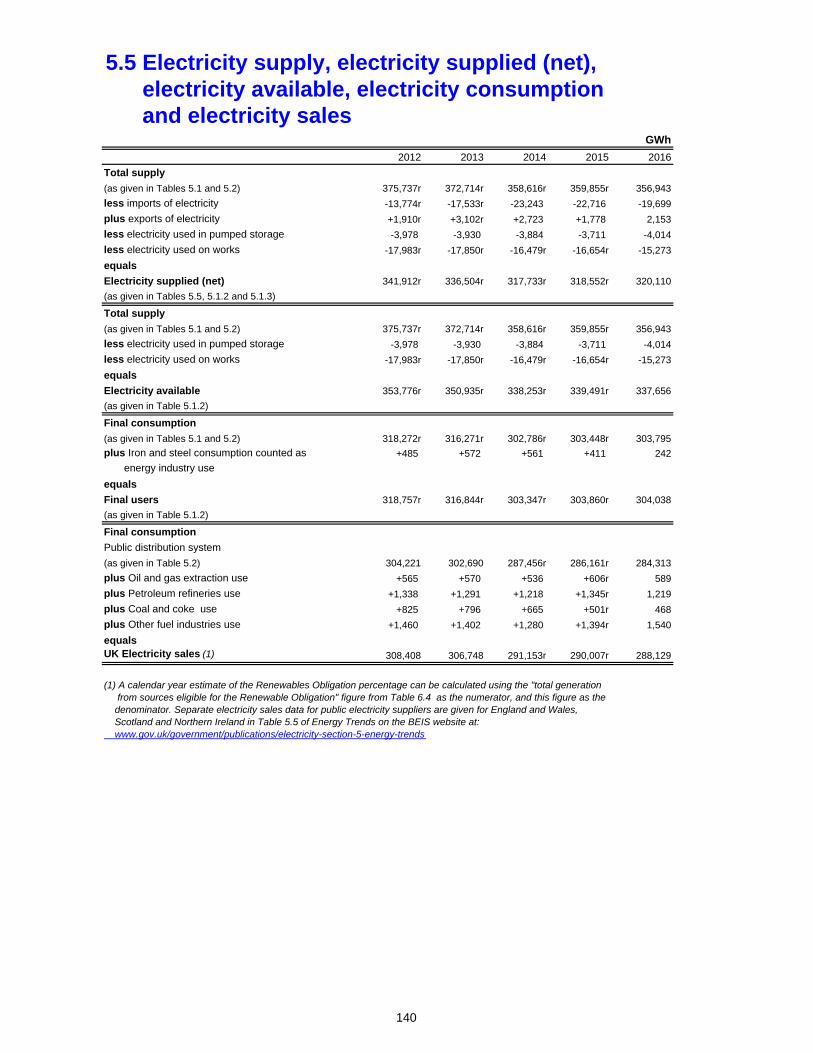
5.5 Electricity supply, electricity supplied (net), electricity available, electricity consumption and electricity sales
GWh
2012 2013 2014 2015 2016
Total supply
(as given in Tables 5.1 and 5.2) 375,737r 372,714r 358,616r 359,855r 356,943
less imports of electricity -13,774r -17,533r -23,243 -22,716 -19,699
plus exports of electricity +1,910r +3,102r +2,723 +1,778 2,153
less electricity used in pumped storage -3,978 -3,930 -3,884 -3,711 -4,014
less electricity used on works -17,983r -17,850r -16,479r -16,654r -15,273
equals
Electricity supplied (net) 341,912r 336,504r 317,733r 318,552r 320,110
(as given in Tables 5.5, 5.1.2 and 5.1.3)
Total supply
(as given in Tables 5.1 and 5.2) 375,737r 372,714r 358,616r 359,855r 356,943
less electricity used in pumped storage -3,978 -3,930 -3,884 -3,711 -4,014
less electricity used on works -17,983r -17,850r -16,479r -16,654r -15,273
equals
Electricity available 353,776r 350,935r 338,253r 339,491r 337,656
(as given in Table 5.1.2)
Final consumption
(as given in Tables 5.1 and 5.2) 318,272r 316,271r 302,786r 303,448r 303,795
plus Iron and steel consumption counted as +485 +572 +561 +411 242
energy industry use
equals
Final users 318,757r 316,844r 303,347r 303,860r 304,038
(as given in Table 5.1.2)
Final consumption
Public distribution system
(as given in Table 5.2) 304,221 302,690 287,456r 286,161r 284,313
plus Oil and gas extraction use +565 +570 +536 +606r 589
plus Petroleum refineries use +1,338 +1,291 +1,218 +1,345r 1,219
plus Coal and coke use +825 +796 +665 +501r 468
plus Other fuel industries use +1,460 +1,402 +1,280 +1,394r 1,540
equalsUK Electricity sales (1) 308,408 306,748 291,153r 290,007r 288,129
(1) A calendar year estimate of the Renewables Obligation percentage can be calculated using the "total generation from sources eligible for the Renewable Obligation" figure from Table 6.4 as the numerator, and this figure as the denominator. Separate electricity sales data for public electricity suppliers are given for England and Wales, Scotland and Northern Ireland in Table 5.5 of Energy Trends on the BEIS website at: www.gov.uk/government/publications/electricity-section-5-energy-trends
140
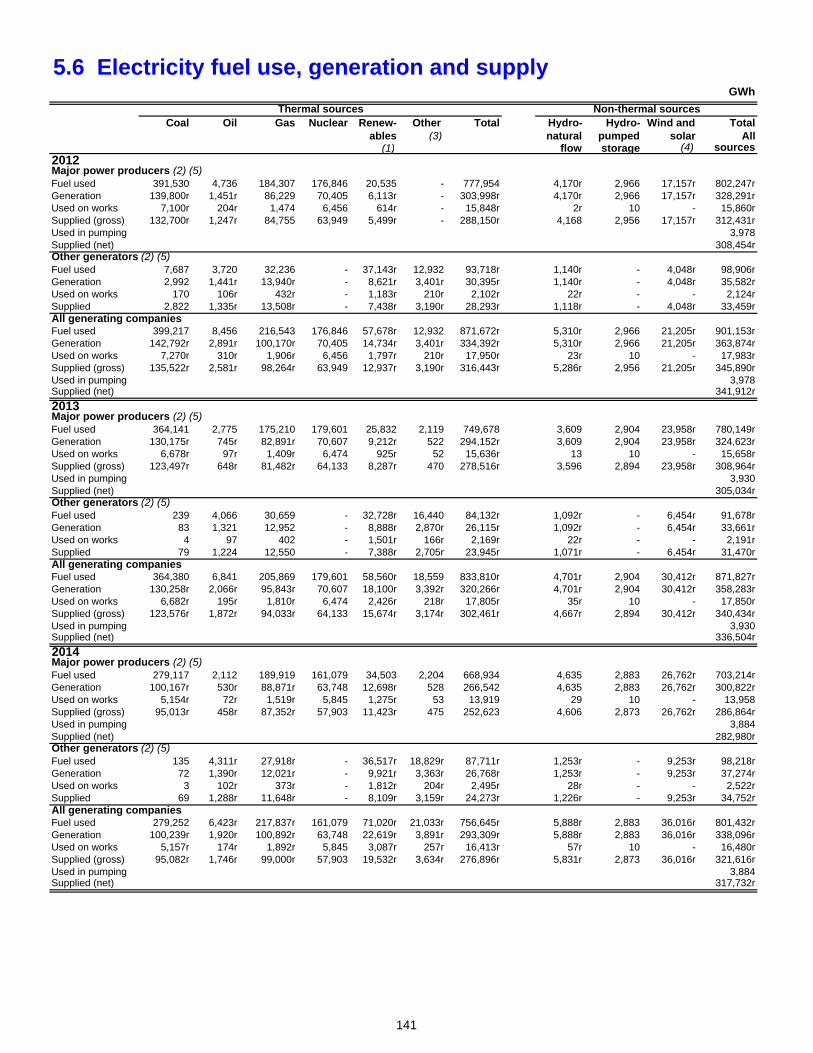
5.6 Electricity fuel use, generation and supplyGWh
Coal Oil Gas Nuclear Renew- Other Total Hydro- Hydro- Wind and Totalables (3) natural pumped solar All
(1) flow storage (4) sources2012Major power producers (2) (5)Fuel used 391,530 4,736 184,307 176,846 20,535 - 777,954 4,170r 2,966 17,157r 802,247rGeneration 139,800r 1,451r 86,229 70,405 6,113r - 303,998r 4,170r 2,966 17,157r 328,291rUsed on works 7,100r 204r 1,474 6,456 614r - 15,848r 2r 10 - 15,860rSupplied (gross) 132,700r 1,247r 84,755 63,949 5,499r - 288,150r 4,168 2,956 17,157r 312,431rUsed in pumping 3,978Supplied (net) 308,454rOther generators (2) (5)Fuel used 7,687 3,720 32,236 - 37,143r 12,932 93,718r 1,140r - 4,048r 98,906rGeneration 2,992 1,441r 13,940r - 8,621r 3,401r 30,395r 1,140r - 4,048r 35,582rUsed on works 170 106r 432r - 1,183r 210r 2,102r 22r - - 2,124rSupplied 2,822 1,335r 13,508r - 7,438r 3,190r 28,293r 1,118r - 4,048r 33,459rAll generating companiesFuel used 399,217 8,456 216,543 176,846 57,678r 12,932 871,672r 5,310r 2,966 21,205r 901,153rGeneration 142,792r 2,891r 100,170r 70,405 14,734r 3,401r 334,392r 5,310r 2,966 21,205r 363,874rUsed on works 7,270r 310r 1,906r 6,456 1,797r 210r 17,950r 23r 10 - 17,983rSupplied (gross) 135,522r 2,581r 98,264r 63,949 12,937r 3,190r 316,443r 5,286r 2,956 21,205r 345,890rUsed in pumping 3,978Supplied (net) 341,912r
2013Major power producers (2) (5)Fuel used 364,141 2,775 175,210 179,601 25,832 2,119 749,678 3,609 2,904 23,958r 780,149rGeneration 130,175r 745r 82,891r 70,607 9,212r 522 294,152r 3,609 2,904 23,958r 324,623rUsed on works 6,678r 97r 1,409r 6,474 925r 52 15,636r 13 10 - 15,658rSupplied (gross) 123,497r 648r 81,482r 64,133 8,287r 470 278,516r 3,596 2,894 23,958r 308,964rUsed in pumping 3,930Supplied (net) 305,034rOther generators (2) (5)Fuel used 239 4,066 30,659 - 32,728r 16,440 84,132r 1,092r - 6,454r 91,678rGeneration 83 1,321 12,952 - 8,888r 2,870r 26,115r 1,092r - 6,454r 33,661rUsed on works 4 97 402 - 1,501r 166r 2,169r 22r - - 2,191rSupplied 79 1,224 12,550 - 7,388r 2,705r 23,945r 1,071r - 6,454r 31,470rAll generating companiesFuel used 364,380 6,841 205,869 179,601 58,560r 18,559 833,810r 4,701r 2,904 30,412r 871,827rGeneration 130,258r 2,066r 95,843r 70,607 18,100r 3,392r 320,266r 4,701r 2,904 30,412r 358,283rUsed on works 6,682r 195r 1,810r 6,474 2,426r 218r 17,805r 35r 10 - 17,850rSupplied (gross) 123,576r 1,872r 94,033r 64,133 15,674r 3,174r 302,461r 4,667r 2,894 30,412r 340,434rUsed in pumping 3,930Supplied (net) 336,504r
2014Major power producers (2) (5)Fuel used 279,117 2,112 189,919 161,079 34,503 2,204 668,934 4,635 2,883 26,762r 703,214rGeneration 100,167r 530r 88,871r 63,748 12,698r 528 266,542 4,635 2,883 26,762r 300,822rUsed on works 5,154r 72r 1,519r 5,845 1,275r 53 13,919 29 10 - 13,958Supplied (gross) 95,013r 458r 87,352r 57,903 11,423r 475 252,623 4,606 2,873 26,762r 286,864rUsed in pumping 3,884Supplied (net) 282,980rOther generators (2) (5)Fuel used 135 4,311r 27,918r - 36,517r 18,829r 87,711r 1,253r - 9,253r 98,218rGeneration 72 1,390r 12,021r - 9,921r 3,363r 26,768r 1,253r - 9,253r 37,274rUsed on works 3 102r 373r - 1,812r 204r 2,495r 28r - - 2,522rSupplied 69 1,288r 11,648r - 8,109r 3,159r 24,273r 1,226r - 9,253r 34,752rAll generating companiesFuel used 279,252 6,423r 217,837r 161,079 71,020r 21,033r 756,645r 5,888r 2,883 36,016r 801,432rGeneration 100,239r 1,920r 100,892r 63,748 22,619r 3,891r 293,309r 5,888r 2,883 36,016r 338,096rUsed on works 5,157r 174r 1,892r 5,845 3,087r 257r 16,413r 57r 10 - 16,480rSupplied (gross) 95,082r 1,746r 99,000r 57,903 19,532r 3,634r 276,896r 5,831r 2,873 36,016r 321,616rUsed in pumping 3,884Supplied (net) 317,732r
Thermal sources Non-thermal sources
141
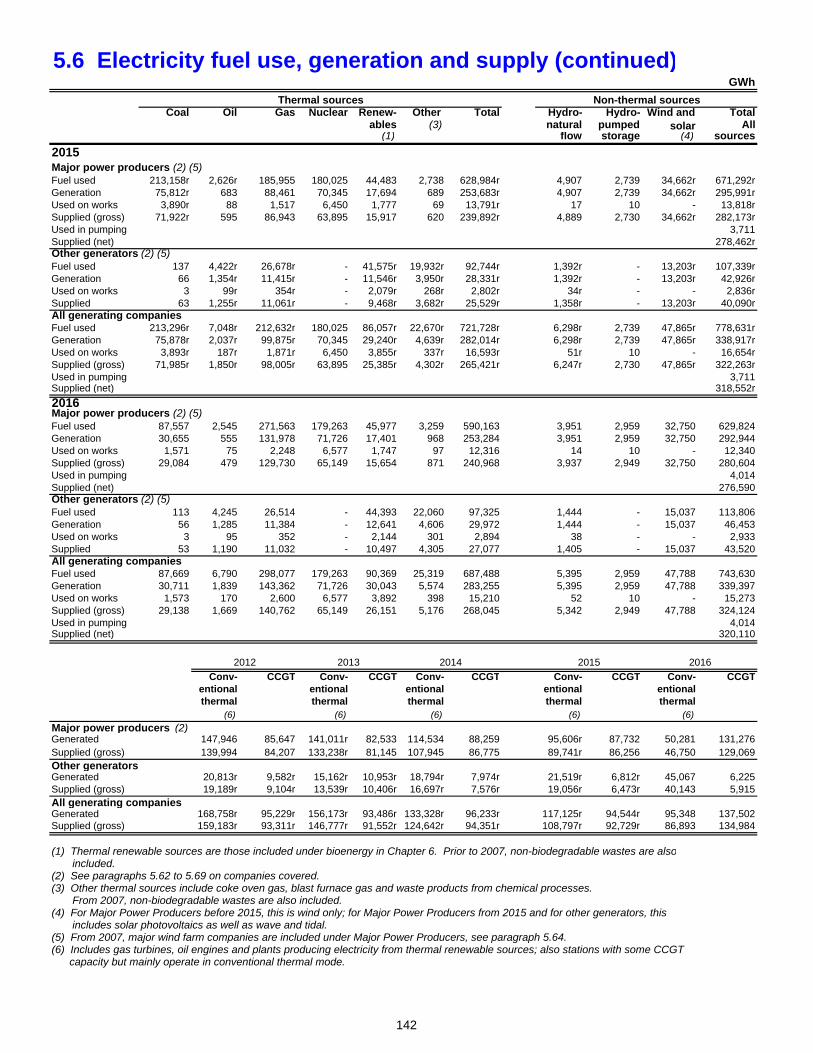
5.6 Electricity fuel use, generation and supply (continued)
Coal Oil Gas Nuclear Renew- Other Total Hydro- Hydro- Wind and Totalables (3) natural pumped solar All
(1) flow storage (4) sources
2015Major power producers (2) (5)Fuel used 213,158r 2,626r 185,955 180,025 44,483 2,738 628,984r 4,907 2,739 34,662r 671,292rGeneration 75,812r 683 88,461 70,345 17,694 689 253,683r 4,907 2,739 34,662r 295,991rUsed on works 3,890r 88 1,517 6,450 1,777 69 13,791r 17 10 - 13,818rSupplied (gross) 71,922r 595 86,943 63,895 15,917 620 239,892r 4,889 2,730 34,662r 282,173rUsed in pumping 3,711Supplied (net) 278,462rOther generators (2) (5)Fuel used 137 4,422r 26,678r - 41,575r 19,932r 92,744r 1,392r - 13,203r 107,339rGeneration 66 1,354r 11,415r - 11,546r 3,950r 28,331r 1,392r - 13,203r 42,926rUsed on works 3 99r 354r - 2,079r 268r 2,802r 34r - - 2,836rSupplied 63 1,255r 11,061r - 9,468r 3,682r 25,529r 1,358r - 13,203r 40,090rAll generating companiesFuel used 213,296r 7,048r 212,632r 180,025 86,057r 22,670r 721,728r 6,298r 2,739 47,865r 778,631rGeneration 75,878r 2,037r 99,875r 70,345 29,240r 4,639r 282,014r 6,298r 2,739 47,865r 338,917rUsed on works 3,893r 187r 1,871r 6,450 3,855r 337r 16,593r 51r 10 - 16,654rSupplied (gross) 71,985r 1,850r 98,005r 63,895 25,385r 4,302r 265,421r 6,247r 2,730 47,865r 322,263rUsed in pumping 3,711Supplied (net) 318,552r
2016Major power producers (2) (5)Fuel used 87,557 2,545 271,563 179,263 45,977 3,259 590,163 3,951 2,959 32,750 629,824Generation 30,655 555 131,978 71,726 17,401 968 253,284 3,951 2,959 32,750 292,944Used on works 1,571 75 2,248 6,577 1,747 97 12,316 14 10 - 12,340Supplied (gross) 29,084 479 129,730 65,149 15,654 871 240,968 3,937 2,949 32,750 280,604Used in pumping 4,014Supplied (net) 276,590Other generators (2) (5)Fuel used 113 4,245 26,514 - 44,393 22,060 97,325 1,444 - 15,037 113,806Generation 56 1,285 11,384 - 12,641 4,606 29,972 1,444 - 15,037 46,453Used on works 3 95 352 - 2,144 301 2,894 38 - - 2,933Supplied 53 1,190 11,032 - 10,497 4,305 27,077 1,405 - 15,037 43,520All generating companiesFuel used 87,669 6,790 298,077 179,263 90,369 25,319 687,488 5,395 2,959 47,788 743,630Generation 30,711 1,839 143,362 71,726 30,043 5,574 283,255 5,395 2,959 47,788 339,397Used on works 1,573 170 2,600 6,577 3,892 398 15,210 52 10 - 15,273Supplied (gross) 29,138 1,669 140,762 65,149 26,151 5,176 268,045 5,342 2,949 47,788 324,124Used in pumping 4,014Supplied (net) 320,110
Conv- CCGT Conv- CCGT Conv- CCGT Conv- CCGT Conv- CCGT
entional entional entional entional entionalthermal thermal thermal thermal thermal
(6) (6) (6) (6) (6)
Major power producers (2)Generated 147,946 85,647 141,011r 82,533 114,534 88,259 95,606r 87,732 50,281 131,276Supplied (gross) 139,994 84,207 133,238r 81,145 107,945 86,775 89,741r 86,256 46,750 129,069Other generatorsGenerated 20,813r 9,582r 15,162r 10,953r 18,794r 7,974r 21,519r 6,812r 45,067 6,225Supplied (gross) 19,189r 9,104r 13,539r 10,406r 16,697r 7,576r 19,056r 6,473r 40,143 5,915All generating companiesGenerated 168,758r 95,229r 156,173r 93,486r 133,328r 96,233r 117,125r 94,544r 95,348 137,502Supplied (gross) 159,183r 93,311r 146,777r 91,552r 124,642r 94,351r 108,797r 92,729r 86,893 134,984
(1) Thermal renewable sources are those included under bioenergy in Chapter 6. Prior to 2007, non-biodegradable wastes are also included.(2) See paragraphs 5.62 to 5.69 on companies covered.(3) Other thermal sources include coke oven gas, blast furnace gas and waste products from chemical processes. From 2007, non-biodegradable wastes are also included.(4) For Major Power Producers before 2015, this is wind only; for Major Power Producers from 2015 and for other generators, this includes solar photovoltaics as well as wave and tidal.(5) From 2007, major wind farm companies are included under Major Power Producers, see paragraph 5.64.(6) Includes gas turbines, oil engines and plants producing electricity from thermal renewable sources; also stations with some CCGT capacity but mainly operate in conventional thermal mode.
2014
GWh
Thermal sources Non-thermal sources
2012 20152013 2016
142
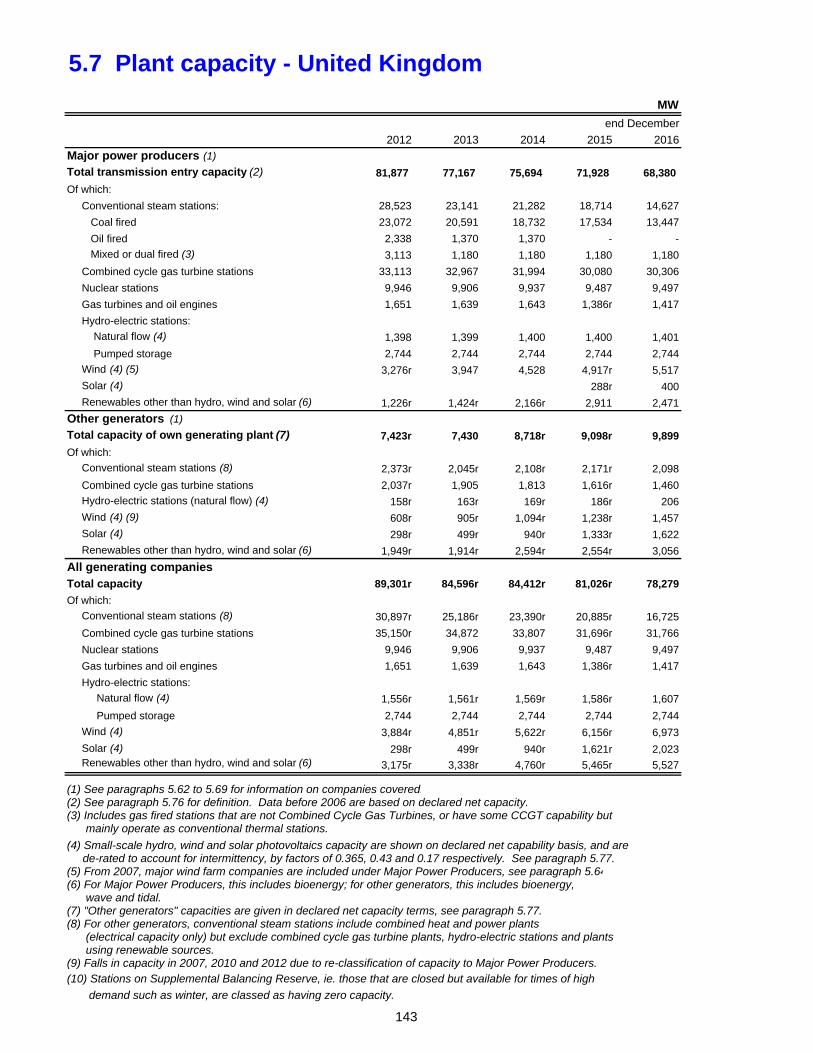
5.7 Plant capacity - United Kingdom
MW
end December
2012 2013 2014 2015 2016
Major power producers (1)
Total transmission entry capacity (2) 81,877 77,167 75,694 71,928 68,380
Of which:
Conventional steam stations: 28,523 23,141 21,282 18,714 14,627
Coal fired 23,072 20,591 18,732 17,534 13,447
Oil fired 2,338 1,370 1,370 - -
Mixed or dual fired (3) 3,113 1,180 1,180 1,180 1,180
Combined cycle gas turbine stations 33,113 32,967 31,994 30,080 30,306
Nuclear stations 9,946 9,906 9,937 9,487 9,497
Gas turbines and oil engines 1,651 1,639 1,643 1,386r 1,417
Hydro-electric stations:
Natural flow (4) 1,398 1,399 1,400 1,400 1,401
Pumped storage 2,744 2,744 2,744 2,744 2,744
Wind (4) (5) 3,276r 3,947 4,528 4,917r 5,517
Solar (4) 288r 400
Renewables other than hydro, wind and solar (6) 1,226r 1,424r 2,166r 2,911 2,471
Other generators (1)
Total capacity of own generating plant (7) 7,423r 7,430 8,718r 9,098r 9,899
Of which:
Conventional steam stations (8) 2,373r 2,045r 2,108r 2,171r 2,098
Combined cycle gas turbine stations 2,037r 1,905 1,813 1,616r 1,460
Hydro-electric stations (natural flow) (4) 158r 163r 169r 186r 206
Wind (4) (9) 608r 905r 1,094r 1,238r 1,457
Solar (4) 298r 499r 940r 1,333r 1,622
Renewables other than hydro, wind and solar (6) 1,949r 1,914r 2,594r 2,554r 3,056
All generating companiesTotal capacity 89,301r 84,596r 84,412r 81,026r 78,279
Of which:
Conventional steam stations (8) 30,897r 25,186r 23,390r 20,885r 16,725
Combined cycle gas turbine stations 35,150r 34,872 33,807 31,696r 31,766
Nuclear stations 9,946 9,906 9,937 9,487 9,497
Gas turbines and oil engines 1,651 1,639 1,643 1,386r 1,417
Hydro-electric stations:
Natural flow (4) 1,556r 1,561r 1,569r 1,586r 1,607
Pumped storage 2,744 2,744 2,744 2,744 2,744
Wind (4) 3,884r 4,851r 5,622r 6,156r 6,973
Solar (4) 298r 499r 940r 1,621r 2,023 Renewables other than hydro, wind and solar (6) 3,175r 3,338r 4,760r 5,465r 5,527
(1) See paragraphs 5.62 to 5.69 for information on companies covered.(2) See paragraph 5.76 for definition. Data before 2006 are based on declared net capacity.(3) Includes gas fired stations that are not Combined Cycle Gas Turbines, or have some CCGT capability but mainly operate as conventional thermal stations.
(4) Small-scale hydro, wind and solar photovoltaics capacity are shown on declared net capability basis, and are de-rated to account for intermittency, by factors of 0.365, 0.43 and 0.17 respectively. See paragraph 5.77.(5) From 2007, major wind farm companies are included under Major Power Producers, see paragraph 5.64(6) For Major Power Producers, this includes bioenergy; for other generators, this includes bioenergy, wave and tidal.(7) "Other generators" capacities are given in declared net capacity terms, see paragraph 5.77.(8) For other generators, conventional steam stations include combined heat and power plants (electrical capacity only) but exclude combined cycle gas turbine plants, hydro-electric stations and plants using renewable sources.(9) Falls in capacity in 2007, 2010 and 2012 due to re-classification of capacity to Major Power Producers.(10) Stations on Supplemental Balancing Reserve, ie. those that are closed but available for times of high
demand such as winter, are classed as having zero capacity.
143
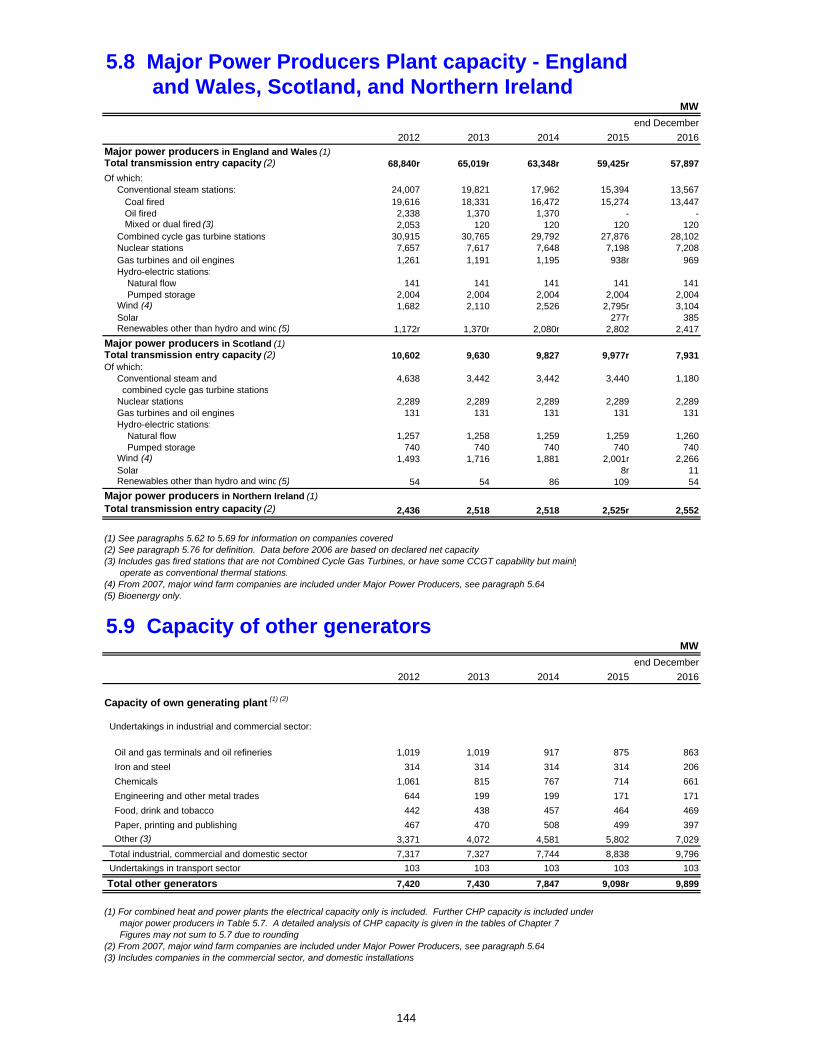
5.8 Major Power Producers Plant capacity - England and Wales, Scotland, and Northern Ireland
MW
end December
2012 2013 2014 2015 2016
Major power producers in England and Wales (1)Total transmission entry capacity (2) 68,840r 65,019r 63,348r 59,425r 57,897
Of which: Conventional steam stations: 24,007 19,821 17,962 15,394 13,567 Coal fired 19,616 18,331 16,472 15,274 13,447 Oil fired 2,338 1,370 1,370 - - Mixed or dual fired (3) 2,053 120 120 120 120 Combined cycle gas turbine stations 30,915 30,765 29,792 27,876 28,102 Nuclear stations 7,657 7,617 7,648 7,198 7,208 Gas turbines and oil engines 1,261 1,191 1,195 938r 969 Hydro-electric stations: Natural flow 141 141 141 141 141 Pumped storage 2,004 2,004 2,004 2,004 2,004 Wind (4) 1,682 2,110 2,526 2,795r 3,104 Solar 277r 385 Renewables other than hydro and wind (5) 1,172r 1,370r 2,080r 2,802 2,417
Major power producers in Scotland (1)Total transmission entry capacity (2) 10,602 9,630 9,827 9,977r 7,931Of which: Conventional steam and 4,638 3,442 3,442 3,440 1,180 combined cycle gas turbine stations Nuclear stations 2,289 2,289 2,289 2,289 2,289 Gas turbines and oil engines 131 131 131 131 131 Hydro-electric stations: Natural flow 1,257 1,258 1,259 1,259 1,260 Pumped storage 740 740 740 740 740 Wind (4) 1,493 1,716 1,881 2,001r 2,266 Solar 8r 11 Renewables other than hydro and wind (5) 54 54 86 109 54
Major power producers in Northern Ireland (1)Total transmission entry capacity (2) 2,436 2,518 2,518 2,525r 2,552
(1) See paragraphs 5.62 to 5.69 for information on companies covered(2) See paragraph 5.76 for definition. Data before 2006 are based on declared net capacity(3) Includes gas fired stations that are not Combined Cycle Gas Turbines, or have some CCGT capability but mainly operate as conventional thermal stations.(4) From 2007, major wind farm companies are included under Major Power Producers, see paragraph 5.64(5) Bioenergy only.
5.9 Capacity of other generatorsMW
end December
2012 2013 2014 2015 2016
Capacity of own generating plant (1) (2)
Undertakings in industrial and commercial sector:
Oil and gas terminals and oil refineries 1,019 1,019 917 875 863
Iron and steel 314 314 314 314 206
Chemicals 1,061 815 767 714 661
Engineering and other metal trades 644 199 199 171 171
Food, drink and tobacco 442 438 457 464 469
Paper, printing and publishing 467 470 508 499 397
Other (3) 3,371 4,072 4,581 5,802 7,029
Total industrial, commercial and domestic sector 7,317 7,327 7,744 8,838 9,796
Undertakings in transport sector 103 103 103 103 103
Total other generators 7,420 7,430 7,847 9,098r 9,899
(1) For combined heat and power plants the electrical capacity only is included. Further CHP capacity is included under major power producers in Table 5.7. A detailed analysis of CHP capacity is given in the tables of Chapter 7 Figures may not sum to 5.7 due to rounding.(2) From 2007, major wind farm companies are included under Major Power Producers, see paragraph 5.64(3) Includes companies in the commercial sector, and domestic installations
144
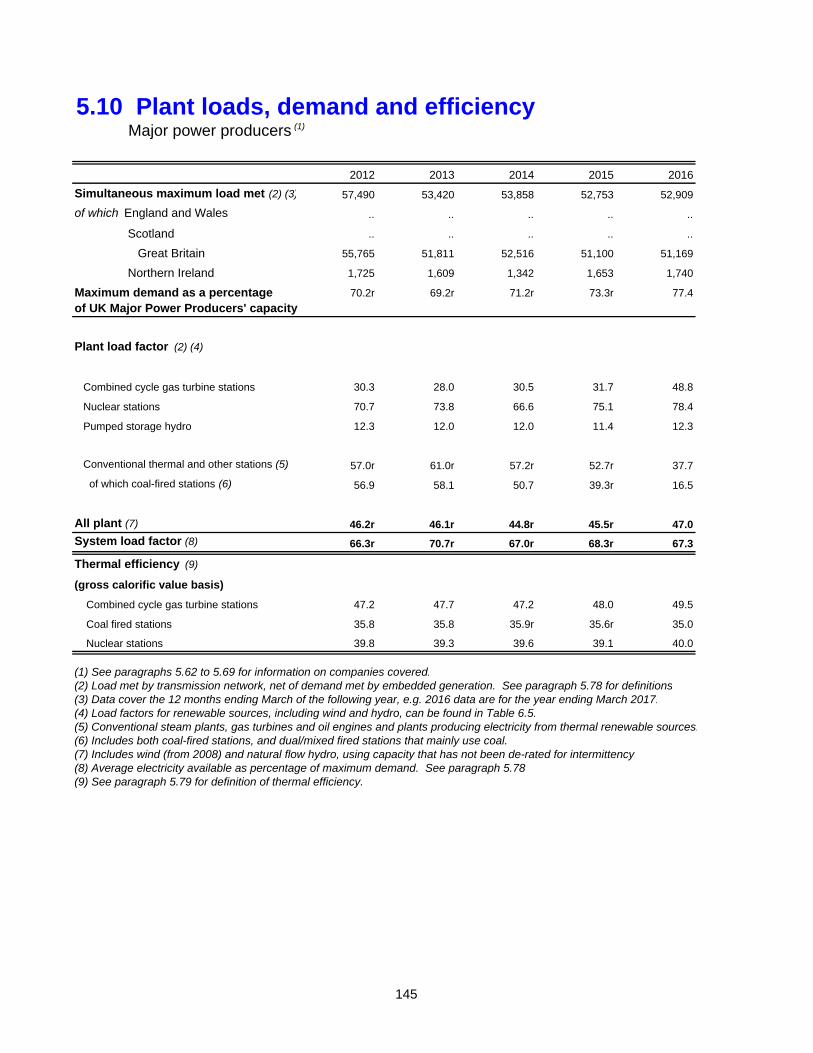
5.10 Plant loads, demand and efficiency Major power producers
(1)
2012 2013 2014 2015 2016
Simultaneous maximum load met (2) (3) 57,490 53,420 53,858 52,753 52,909
of which England and Wales .. .. .. .. ..
Scotland .. .. .. .. ..
Great Britain 55,765 51,811 52,516 51,100 51,169
Northern Ireland 1,725 1,609 1,342 1,653 1,740
Maximum demand as a percentage 70.2r 69.2r 71.2r 73.3r 77.4
of UK Major Power Producers' capacity
Plant load factor (2) (4)
Combined cycle gas turbine stations 30.3 28.0 30.5 31.7 48.8
Nuclear stations 70.7 73.8 66.6 75.1 78.4
Pumped storage hydro 12.3 12.0 12.0 11.4 12.3
Conventional thermal and other stations (5) 57.0r 61.0r 57.2r 52.7r 37.7
of which coal-fired stations (6) 56.9 58.1 50.7 39.3r 16.5
All plant (7) 46.2r 46.1r 44.8r 45.5r 47.0
System load factor (8) 66.3r 70.7r 67.0r 68.3r 67.3
Thermal efficiency (9)
(gross calorific value basis)
Combined cycle gas turbine stations 47.2 47.7 47.2 48.0 49.5
Coal fired stations 35.8 35.8 35.9r 35.6r 35.0
Nuclear stations 39.8 39.3 39.6 39.1 40.0
(1) See paragraphs 5.62 to 5.69 for information on companies covered.(2) Load met by transmission network, net of demand met by embedded generation. See paragraph 5.78 for definitions(3) Data cover the 12 months ending March of the following year, e.g. 2016 data are for the year ending March 2017.(4) Load factors for renewable sources, including wind and hydro, can be found in Table 6.5.(5) Conventional steam plants, gas turbines and oil engines and plants producing electricity from thermal renewable sources.(6) Includes both coal-fired stations, and dual/mixed fired stations that mainly use coal.(7) Includes wind (from 2008) and natural flow hydro, using capacity that has not been de-rated for intermittency.(8) Average electricity available as percentage of maximum demand. See paragraph 5.78.(9) See paragraph 5.79 for definition of thermal efficiency.
145
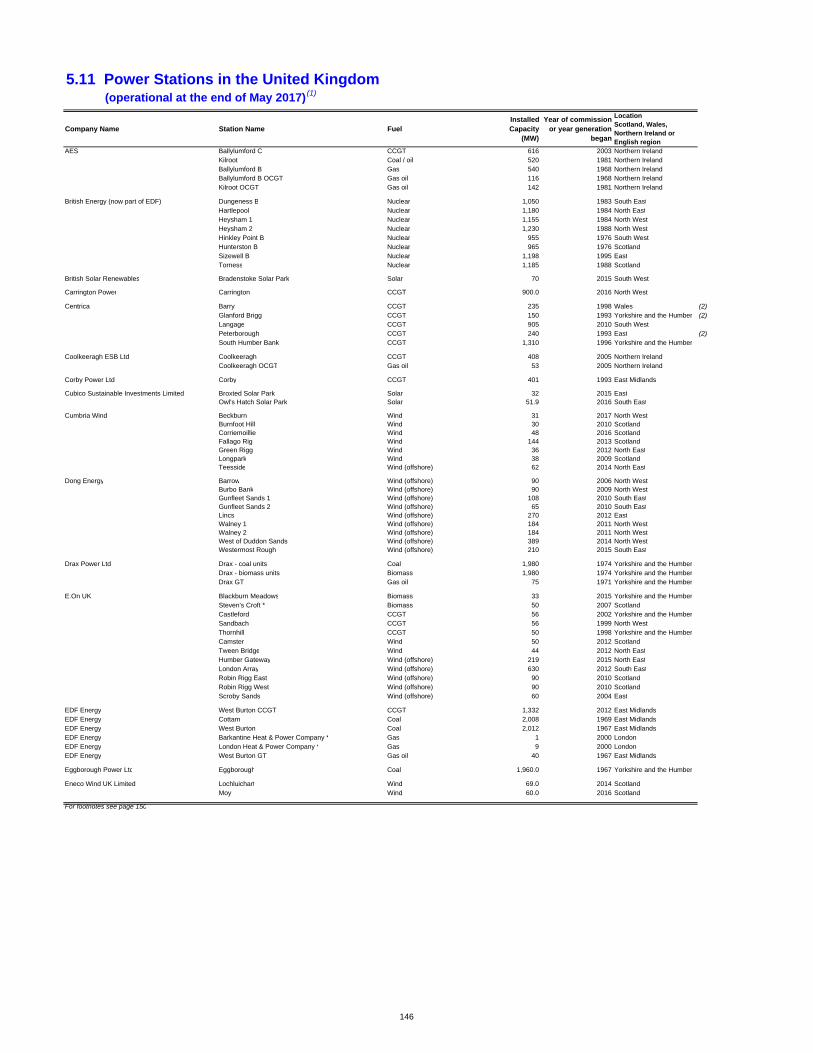
5.11 Power Stations in the United Kingdom (operational at the end of May 2017) (1)
Company Name Station Name FuelInstalled Capacity
(MW)
Year of commission or year generation
began
LocationScotland, Wales, Northern Ireland or English region
AES Ballylumford C CCGT 616 2003 Northern IrelandKilroot Coal / oil 520 1981 Northern IrelandBallylumford B Gas 540 1968 Northern IrelandBallylumford B OCGT Gas oil 116 1968 Northern IrelandKilroot OCGT Gas oil 142 1981 Northern Ireland
British Energy (now part of EDF) Dungeness B Nuclear 1,050 1983 South EastHartlepool Nuclear 1,180 1984 North EastHeysham 1 Nuclear 1,155 1984 North WestHeysham 2 Nuclear 1,230 1988 North WestHinkley Point B Nuclear 955 1976 South WestHunterston B Nuclear 965 1976 ScotlandSizewell B Nuclear 1,198 1995 EastTorness Nuclear 1,185 1988 Scotland
British Solar Renewables Bradenstoke Solar Park Solar 70 2015 South West
Carrington Power Carrington CCGT 900.0 2016 North West
Centrica Barry CCGT 235 1998 Wales (2)Glanford Brigg CCGT 150 1993 Yorkshire and the Humber (2)Langage CCGT 905 2010 South WestPeterborough CCGT 240 1993 East (2)South Humber Bank CCGT 1,310 1996 Yorkshire and the Humber
Coolkeeragh ESB Ltd Coolkeeragh CCGT 408 2005 Northern IrelandCoolkeeragh OCGT Gas oil 53 2005 Northern Ireland
Corby Power Ltd Corby CCGT 401 1993 East Midlands
Cubico Sustainable Investments Limited Broxted Solar Park Solar 32 2015 EastOwl's Hatch Solar Park Solar 51.9 2016 South East
Cumbria Wind Beckburn Wind 31 2017 North WestBurnfoot Hill Wind 30 2010 ScotlandCorriemoillie Wind 48 2016 ScotlandFallago Rig Wind 144 2013 ScotlandGreen Rigg Wind 36 2012 North EastLongpark Wind 38 2009 ScotlandTeesside Wind (offshore) 62 2014 North East
Dong Energy Barrow Wind (offshore) 90 2006 North WestBurbo Bank Wind (offshore) 90 2009 North WestGunfleet Sands 1 Wind (offshore) 108 2010 South EastGunfleet Sands 2 Wind (offshore) 65 2010 South EastLincs Wind (offshore) 270 2012 EastWalney 1 Wind (offshore) 184 2011 North WestWalney 2 Wind (offshore) 184 2011 North WestWest of Duddon Sands Wind (offshore) 389 2014 North WestWestermost Rough Wind (offshore) 210 2015 South East
Drax Power Ltd Drax - coal units Coal 1,980 1974 Yorkshire and the HumberDrax - biomass units Biomass 1,980 1974 Yorkshire and the HumberDrax GT Gas oil 75 1971 Yorkshire and the Humber
E.On UK Blackburn Meadows Biomass 33 2015 Yorkshire and the HumberSteven's Croft * Biomass 50 2007 ScotlandCastleford CCGT 56 2002 Yorkshire and the HumberSandbach CCGT 56 1999 North WestThornhill CCGT 50 1998 Yorkshire and the HumberCamster Wind 50 2012 ScotlandTween Bridge Wind 44 2012 North EastHumber Gateway Wind (offshore) 219 2015 North EastLondon Array Wind (offshore) 630 2012 South EastRobin Rigg East Wind (offshore) 90 2010 ScotlandRobin Rigg West Wind (offshore) 90 2010 ScotlandScroby Sands Wind (offshore) 60 2004 East
EDF Energy West Burton CCGT CCGT 1,332 2012 East MidlandsEDF Energy Cottam Coal 2,008 1969 East MidlandsEDF Energy West Burton Coal 2,012 1967 East MidlandsEDF Energy Barkantine Heat & Power Company * Gas 1 2000 LondonEDF Energy London Heat & Power Company * Gas 9 2000 LondonEDF Energy West Burton GT Gas oil 40 1967 East Midlands
Eggborough Power Ltd Eggborough Coal 1,960.0 1967 Yorkshire and the Humber
Eneco Wind UK Limited Lochluichart Wind 69.0 2014 ScotlandMoy Wind 60.0 2016 Scotland
For footnotes see page 150
146
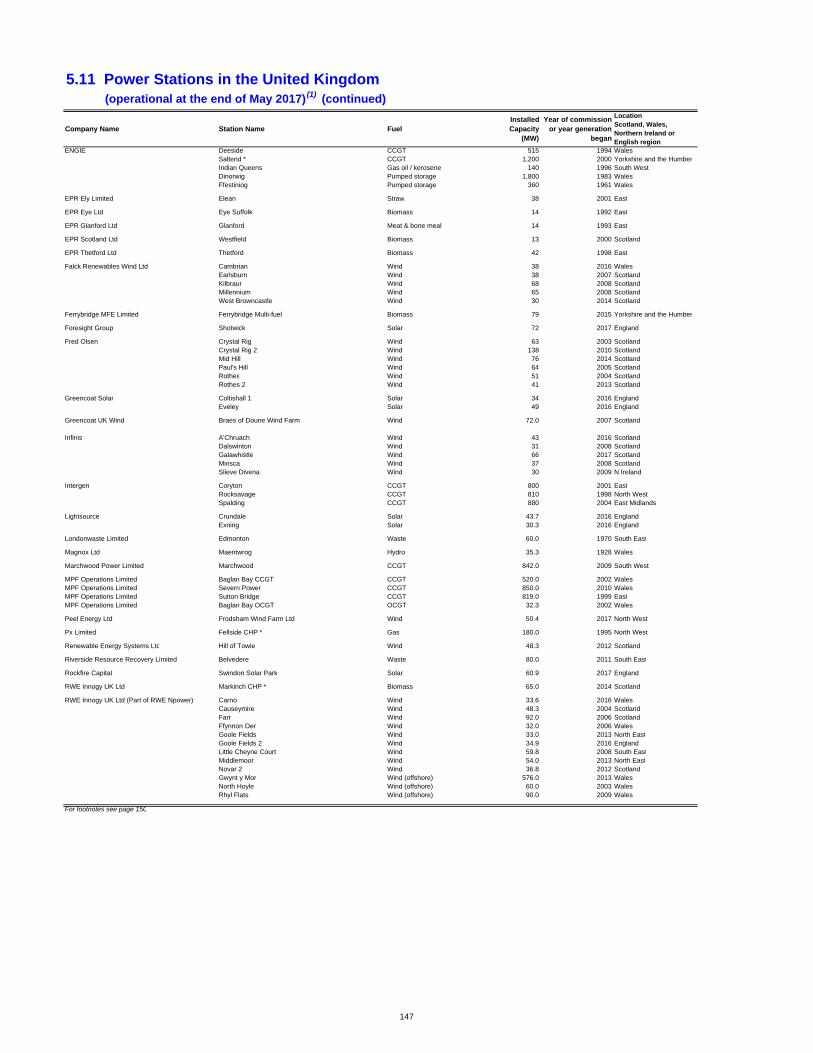
5.11 Power Stations in the United Kingdom (operational at the end of May 2017) (1) (continued)
Company Name Station Name FuelInstalled Capacity
(MW)
Year of commission or year generation
began
LocationScotland, Wales, Northern Ireland or English region
ENGIE Deeside CCGT 515 1994 WalesSaltend * CCGT 1,200 2000 Yorkshire and the HumberIndian Queens Gas oil / kerosene 140 1996 South WestDinorwig Pumped storage 1,800 1983 WalesFfestiniog Pumped storage 360 1961 Wales
EPR Ely Limited Elean Straw 38 2001 East
EPR Eye Ltd Eye Suffolk Biomass 14 1992 East
EPR Glanford Ltd Glanford Meat & bone meal 14 1993 East
EPR Scotland Ltd Westfield Biomass 13 2000 Scotland
EPR Thetford Ltd Thetford Biomass 42 1998 East
Falck Renewables Wind Ltd Cambrian Wind 38 2016 WalesEarlsburn Wind 38 2007 ScotlandKilbraur Wind 68 2008 ScotlandMillennium Wind 65 2008 ScotlandWest Browncastle Wind 30 2014 Scotland
Ferrybridge MFE Limited Ferrybridge Multi-fuel Biomass 79 2015 Yorkshire and the Humber
Foresight Group Shotwick Solar 72 2017 England
Fred Olsen Crystal Rig Wind 63 2003 ScotlandCrystal Rig 2 Wind 138 2010 ScotlandMid Hill Wind 76 2014 ScotlandPaul's Hill Wind 64 2005 ScotlandRothes Wind 51 2004 ScotlandRothes 2 Wind 41 2013 Scotland
Greencoat Solar Coltishall 1 Solar 34 2016 EnglandEveley Solar 49 2016 England
Greencoat UK Wind Braes of Doune Wind Farm Wind 72.0 2007 Scotland
Infinis A'Chruach Wind 43 2016 ScotlandDalswinton Wind 31 2008 ScotlandGalawhistle Wind 66 2017 ScotlandMinsca Wind 37 2008 ScotlandSlieve Divena Wind 30 2009 N Ireland
Intergen Coryton CCGT 800 2001 EastRocksavage CCGT 810 1998 North WestSpalding CCGT 880 2004 East Midlands
Lightsource Crundale Solar 43.7 2016 EnglandExning Solar 30.3 2016 England
Londonwaste Limited Edmonton Waste 60.0 1970 South East
Magnox Ltd Maentwrog Hydro 35.3 1928 Wales
Marchwood Power Limited Marchwood CCGT 842.0 2009 South West
MPF Operations Limited Baglan Bay CCGT CCGT 520.0 2002 WalesMPF Operations Limited Severn Power CCGT 850.0 2010 WalesMPF Operations Limited Sutton Bridge CCGT 819.0 1999 EastMPF Operations Limited Baglan Bay OCGT OCGT 32.3 2002 Wales
Peel Energy Ltd Frodsham Wind Farm Ltd Wind 50.4 2017 North West
Px Limited Fellside CHP * Gas 180.0 1995 North West
Renewable Energy Systems Ltd Hill of Towie Wind 48.3 2012 Scotland
Riverside Resource Recovery Limited Belvedere Waste 80.0 2011 South East
Rockfire Capital Swindon Solar Park Solar 60.9 2017 England
RWE Innogy UK Ltd Markinch CHP * Biomass 65.0 2014 Scotland
RWE Innogy UK Ltd (Part of RWE Npower) Carno Wind 33.6 2016 WalesCauseymire Wind 48.3 2004 ScotlandFarr Wind 92.0 2006 ScotlandFfynnon Oer Wind 32.0 2006 WalesGoole Fields Wind 33.0 2013 North EastGoole Fields 2 Wind 34.9 2016 EnglandLittle Cheyne Court Wind 59.8 2008 South EastMiddlemoor Wind 54.0 2013 North EastNovar 2 Wind 36.8 2012 ScotlandGwynt y Mor Wind (offshore) 576.0 2013 WalesNorth Hoyle Wind (offshore) 60.0 2003 WalesRhyl Flats Wind (offshore) 90.0 2009 Wales
For footnotes see page 150
147
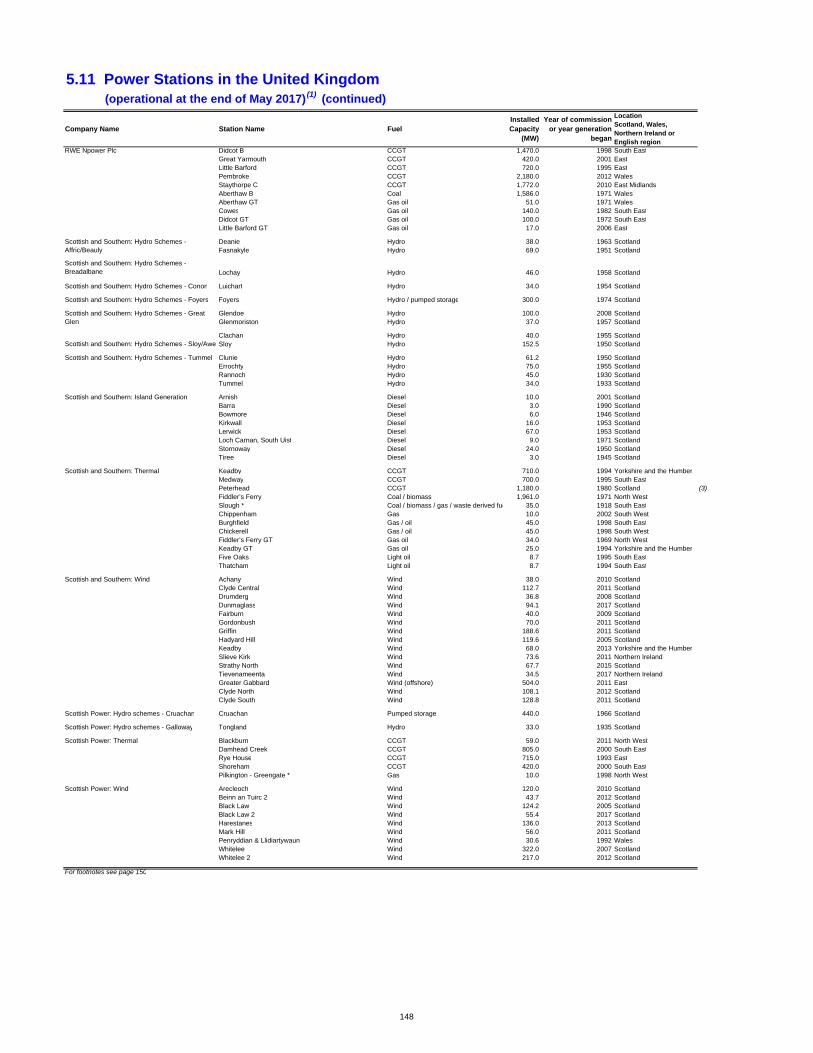
5.11 Power Stations in the United Kingdom (operational at the end of May 2017) (1) (continued)
Company Name Station Name FuelInstalled Capacity
(MW)
Year of commission or year generation
began
LocationScotland, Wales, Northern Ireland or English region
RWE Npower Plc Didcot B CCGT 1,470.0 1998 South EastGreat Yarmouth CCGT 420.0 2001 EastLittle Barford CCGT 720.0 1995 EastPembroke CCGT 2,180.0 2012 WalesStaythorpe C CCGT 1,772.0 2010 East MidlandsAberthaw B Coal 1,586.0 1971 WalesAberthaw GT Gas oil 51.0 1971 WalesCowes Gas oil 140.0 1982 South EastDidcot GT Gas oil 100.0 1972 South EastLittle Barford GT Gas oil 17.0 2006 East
Deanie Hydro 38.0 1963 ScotlandFasnakyle Hydro 69.0 1951 Scotland
Scottish and Southern: Hydro Schemes - Breadalbane Lochay Hydro 46.0 1958 Scotland
Scottish and Southern: Hydro Schemes - Conon Luichart Hydro 34.0 1954 Scotland
Scottish and Southern: Hydro Schemes - Foyers Foyers Hydro / pumped storage 300.0 1974 Scotland
Glendoe Hydro 100.0 2008 ScotlandGlenmoriston Hydro 37.0 1957 Scotland
Clachan Hydro 40.0 1955 ScotlandSloy Hydro 152.5 1950 Scotland
Scottish and Southern: Hydro Schemes - Tummel Clunie Hydro 61.2 1950 ScotlandErrochty Hydro 75.0 1955 ScotlandRannoch Hydro 45.0 1930 ScotlandTummel Hydro 34.0 1933 Scotland
Scottish and Southern: Island Generation Arnish Diesel 10.0 2001 ScotlandBarra Diesel 3.0 1990 ScotlandBowmore Diesel 6.0 1946 ScotlandKirkwall Diesel 16.0 1953 ScotlandLerwick Diesel 67.0 1953 ScotlandLoch Carnan, South Uist Diesel 9.0 1971 ScotlandStornoway Diesel 24.0 1950 ScotlandTiree Diesel 3.0 1945 Scotland
Scottish and Southern: Thermal Keadby CCGT 710.0 1994 Yorkshire and the HumberMedway CCGT 700.0 1995 South EastPeterhead CCGT 1,180.0 1980 Scotland (3)Fiddler’s Ferry Coal / biomass 1,961.0 1971 North WestSlough * Coal / biomass / gas / waste derived fue 35.0 1918 South EastChippenham Gas 10.0 2002 South WestBurghfield Gas / oil 45.0 1998 South EastChickerell Gas / oil 45.0 1998 South WestFiddler’s Ferry GT Gas oil 34.0 1969 North WestKeadby GT Gas oil 25.0 1994 Yorkshire and the HumberFive Oaks Light oil 8.7 1995 South EastThatcham Light oil 8.7 1994 South East
Scottish and Southern: Wind Achany Wind 38.0 2010 ScotlandClyde Central Wind 112.7 2011 ScotlandDrumderg Wind 36.8 2008 ScotlandDunmaglass Wind 94.1 2017 ScotlandFairburn Wind 40.0 2009 ScotlandGordonbush Wind 70.0 2011 ScotlandGriffin Wind 188.6 2011 ScotlandHadyard Hill Wind 119.6 2005 ScotlandKeadby Wind 68.0 2013 Yorkshire and the HumberSlieve Kirk Wind 73.6 2011 Northern IrelandStrathy North Wind 67.7 2015 ScotlandTievenameenta Wind 34.5 2017 Northern IrelandGreater Gabbard Wind (offshore) 504.0 2011 EastClyde North Wind 108.1 2012 ScotlandClyde South Wind 128.8 2011 Scotland
Scottish Power: Hydro schemes - Cruachan Cruachan Pumped storage 440.0 1966 Scotland
Scottish Power: Hydro schemes - Galloway Tongland Hydro 33.0 1935 Scotland
Scottish Power: Thermal Blackburn CCGT 59.0 2011 North WestDamhead Creek CCGT 805.0 2000 South EastRye House CCGT 715.0 1993 EastShoreham CCGT 420.0 2000 South EastPilkington - Greengate * Gas 10.0 1998 North West
Scottish Power: Wind Arecleoch Wind 120.0 2010 ScotlandBeinn an Tuirc 2 Wind 43.7 2012 ScotlandBlack Law Wind 124.2 2005 ScotlandBlack Law 2 Wind 55.4 2017 ScotlandHarestanes Wind 136.0 2013 ScotlandMark Hill Wind 56.0 2011 ScotlandPenryddian & Llidiartywaun Wind 30.6 1992 WalesWhitelee Wind 322.0 2007 ScotlandWhitelee 2 Wind 217.0 2012 Scotland
For footnotes see page 150
Scottish and Southern: Hydro Schemes - Affric/Beauly
Scottish and Southern: Hydro Schemes - Great Glen
Scottish and Southern: Hydro Schemes - Sloy/Awe
148
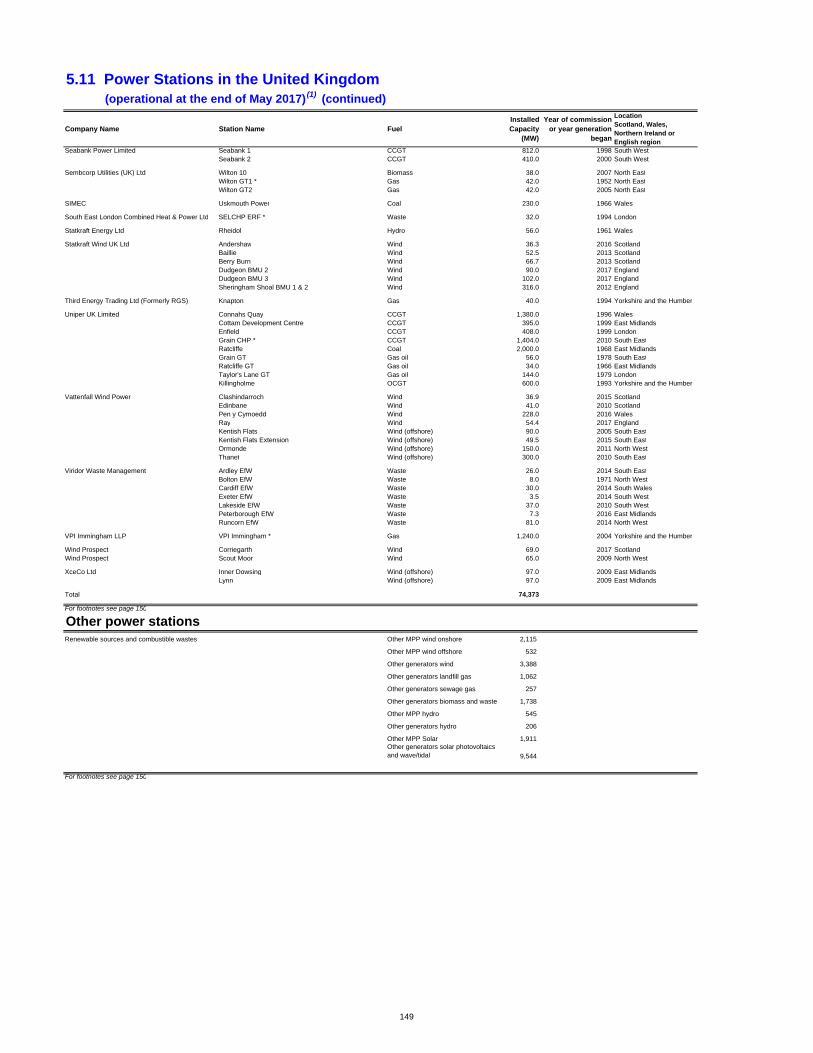
5.11 Power Stations in the United Kingdom (operational at the end of May 2017) (1) (continued)
Company Name Station Name FuelInstalled Capacity
(MW)
Year of commission or year generation
began
LocationScotland, Wales, Northern Ireland or English region
Seabank Power Limited Seabank 1 CCGT 812.0 1998 South WestSeabank 2 CCGT 410.0 2000 South West
Sembcorp Utilities (UK) Ltd Wilton 10 Biomass 38.0 2007 North EastWilton GT1 * Gas 42.0 1952 North EastWilton GT2 Gas 42.0 2005 North East
SIMEC Uskmouth Power Coal 230.0 1966 Wales
South East London Combined Heat & Power Ltd SELCHP ERF * Waste 32.0 1994 London
Statkraft Energy Ltd Rheidol Hydro 56.0 1961 Wales
Statkraft Wind UK Ltd Andershaw Wind 36.3 2016 ScotlandBaillie Wind 52.5 2013 ScotlandBerry Burn Wind 66.7 2013 ScotlandDudgeon BMU 2 Wind 90.0 2017 EnglandDudgeon BMU 3 Wind 102.0 2017 EnglandSheringham Shoal BMU 1 & 2 Wind 316.0 2012 England
Third Energy Trading Ltd (Formerly RGS) Knapton Gas 40.0 1994 Yorkshire and the Humber
Uniper UK Limited Connahs Quay CCGT 1,380.0 1996 WalesCottam Development Centre CCGT 395.0 1999 East MidlandsEnfield CCGT 408.0 1999 LondonGrain CHP * CCGT 1,404.0 2010 South EastRatcliffe Coal 2,000.0 1968 East MidlandsGrain GT Gas oil 56.0 1978 South EastRatcliffe GT Gas oil 34.0 1966 East MidlandsTaylor's Lane GT Gas oil 144.0 1979 LondonKillingholme OCGT 600.0 1993 Yorkshire and the Humber
Vattenfall Wind Power Clashindarroch Wind 36.9 2015 ScotlandEdinbane Wind 41.0 2010 ScotlandPen y Cymoedd Wind 228.0 2016 WalesRay Wind 54.4 2017 EnglandKentish Flats Wind (offshore) 90.0 2005 South EastKentish Flats Extension Wind (offshore) 49.5 2015 South EastOrmonde Wind (offshore) 150.0 2011 North WestThanet Wind (offshore) 300.0 2010 South East
Viridor Waste Management Ardley EfW Waste 26.0 2014 South EastBolton EfW Waste 8.0 1971 North WestCardiff EfW Waste 30.0 2014 South WalesExeter EfW Waste 3.5 2014 South WestLakeside EfW Waste 37.0 2010 South WestPeterborough EfW Waste 7.3 2016 East MidlandsRuncorn EfW Waste 81.0 2014 North West
VPI Immingham LLP VPI Immingham * Gas 1,240.0 2004 Yorkshire and the Humber
Wind Prospect Corriegarth Wind 69.0 2017 ScotlandWind Prospect Scout Moor Wind 65.0 2009 North West
XceCo Ltd Inner Dowsing Wind (offshore) 97.0 2009 East MidlandsLynn Wind (offshore) 97.0 2009 East Midlands
Total 74,373
For footnotes see page 150
Other power stationsRenewable sources and combustible wastes Other MPP wind onshore 2,115
Other MPP wind offshore 532
Other generators wind 3,388
Other generators landfill gas 1,062
Other generators sewage gas 257
Other generators biomass and waste 1,738
Other MPP hydro 545
Other generators hydro 206
Other MPP Solar 1,911 Other generators solar photovoltaics and wave/tidal 9,544
For footnotes see page 150
149

5.11 Power Stations in the United Kingdom (operational at the end of May 2017) (1) (continued)
InterconnectorsCapacity
(MW)
England - France 2,000
England - Netherlands 1,000
Scotland - Northern Ireland 500
Wales - Irish Republic 500
Northern Ireland - Irish Republic 600
Footnotes
* indicates CHP plant
(3) Total capacity is 1,840 MW but because of transmission constraints only 1,180 MW can be used at any one time.
(2) Capacity reduced in 2013, with these stations typically now operating as Open Cycle Gas Turbines.
(1) This list covers stations owned or operated by Major Power Producers, apart from non-thermal renewable sites under 30MW capacity (which are included in the database tab); other power stations (including many renewable sites and auto-generators) are included in the sub table on page 149.
150
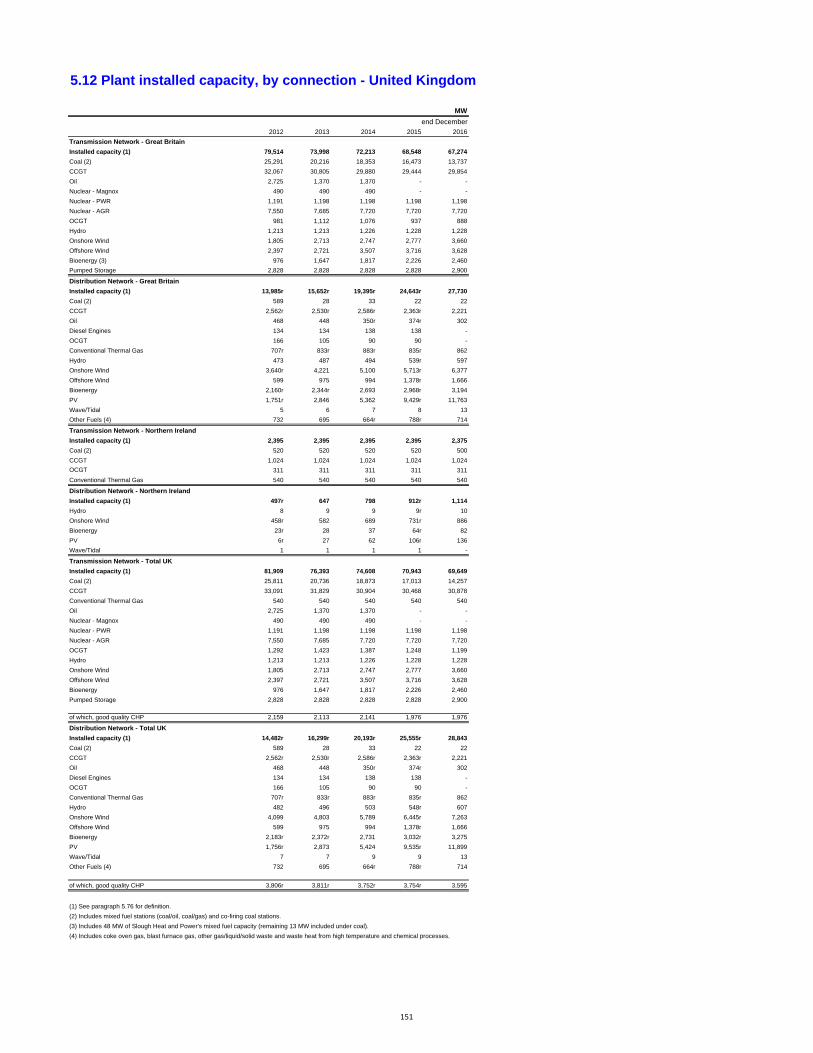
5.12 Plant installed capacity, by connection - United Kingdom
MW
end December
2012 2013 2014 2015 2016
Transmission Network - Great Britain
Installed capacity (1) 79,514 73,998 72,213 68,548 67,274
Coal (2) 25,291 20,216 18,353 16,473 13,737
CCGT 32,067 30,805 29,880 29,444 29,854
Oil 2,725 1,370 1,370 - -
Nuclear - Magnox 490 490 490 - -
Nuclear - PWR 1,191 1,198 1,198 1,198 1,198
Nuclear - AGR 7,550 7,685 7,720 7,720 7,720
OCGT 981 1,112 1,076 937 888
Hydro 1,213 1,213 1,226 1,228 1,228
Onshore Wind 1,805 2,713 2,747 2,777 3,660
Offshore Wind 2,397 2,721 3,507 3,716 3,628
Bioenergy (3) 976 1,647 1,817 2,226 2,460
Pumped Storage 2,828 2,828 2,828 2,828 2,900
Distribution Network - Great Britain
Installed capacity (1) 13,985r 15,652r 19,395r 24,643r 27,730
Coal (2) 589 28 33 22 22
CCGT 2,562r 2,530r 2,586r 2,363r 2,221
Oil 468 448 350r 374r 302
Diesel Engines 134 134 138 138 -
OCGT 166 105 90 90 -
Conventional Thermal Gas 707r 833r 883r 835r 862
Hydro 473 487 494 539r 597
Onshore Wind 3,640r 4,221 5,100 5,713r 6,377
Offshore Wind 599 975 994 1,378r 1,666
Bioenergy 2,160r 2,344r 2,693 2,968r 3,194
PV 1,751r 2,846 5,362 9,429r 11,763
Wave/Tidal 5 6 7 8 13
Other Fuels (4) 732 695 664r 788r 714
Transmission Network - Northern Ireland
Installed capacity (1) 2,395 2,395 2,395 2,395 2,375
Coal (2) 520 520 520 520 500
CCGT 1,024 1,024 1,024 1,024 1,024
OCGT 311 311 311 311 311
Conventional Thermal Gas 540 540 540 540 540
Distribution Network - Northern Ireland
Installed capacity (1) 497r 647 798 912r 1,114
Hydro 8 9 9 9r 10
Onshore Wind 458r 582 689 731r 886
Bioenergy 23r 28 37 64r 82
PV 6r 27 62 106r 136
Wave/Tidal 1 1 1 1 -
Transmission Network - Total UK
Installed capacity (1) 81,909 76,393 74,608 70,943 69,649
Coal (2) 25,811 20,736 18,873 17,013 14,257
CCGT 33,091 31,829 30,904 30,468 30,878
Conventional Thermal Gas 540 540 540 540 540
Oil 2,725 1,370 1,370 - -
Nuclear - Magnox 490 490 490 - -
Nuclear - PWR 1,191 1,198 1,198 1,198 1,198
Nuclear - AGR 7,550 7,685 7,720 7,720 7,720
OCGT 1,292 1,423 1,387 1,248 1,199
Hydro 1,213 1,213 1,226 1,228 1,228
Onshore Wind 1,805 2,713 2,747 2,777 3,660
Offshore Wind 2,397 2,721 3,507 3,716 3,628
Bioenergy 976 1,647 1,817 2,226 2,460
Pumped Storage 2,828 2,828 2,828 2,828 2,900
of which, good quality CHP 2,159 2,113 2,141 1,976 1,976
Distribution Network - Total UK
Installed capacity (1) 14,482r 16,299r 20,193r 25,555r 28,843
Coal (2) 589 28 33 22 22
CCGT 2,562r 2,530r 2,586r 2,363r 2,221
Oil 468 448 350r 374r 302
Diesel Engines 134 134 138 138 -
OCGT 166 105 90 90 -
Conventional Thermal Gas 707r 833r 883r 835r 862
Hydro 482 496 503 548r 607
Onshore Wind 4,099 4,803 5,789 6,445r 7,263
Offshore Wind 599 975 994 1,378r 1,666
Bioenergy 2,183r 2,372r 2,731 3,032r 3,275
PV 1,756r 2,873 5,424 9,535r 11,899
Wave/Tidal 7 7 9 9 13
Other Fuels (4) 732 695 664r 788r 714
of which, good quality CHP 3,806r 3,811r 3,752r 3,754r 3,595
(1) See paragraph 5.76 for definition.
(2) Includes mixed fuel stations (coal/oil, coal/gas) and co-firing coal stations.
(3) Includes 48 MW of Slough Heat and Power's mixed fuel capacity (remaining 13 MW included under coal).
(4) Includes coke oven gas, blast furnace gas, other gas/liquid/solid waste and waste heat from high temperature and chemical processes.
151

152
153
Chapter 6 Renewable sources of energy
Introduction 6.1 Energy from renewable sources has been steadily increasing since 2000 as a result of national and international incentives including the EU Renewable Energy Directive which requires the EU as a whole to achieve 20 per cent of its energy from renewable sources by 2020 (the UK’s target is set at 15 per cent) (see the technical annex for a description of the policy context). The UK has a varied mix of renewable technologies including biomass which is a key fuel source in both electricity generation and heat. Wind, solar photovoltaics, hydro and shoreline wave and tidal also contribute to electricity generation and active solar, heat pumps and deep geothermal are used in heat generation (see the technical annex for descriptions of the sources of renewable energy). Liquid biofuels in transport also contribute to the separate RED transport target (for the UK, this is set at 10 per cent). Although solar photovoltaics was the leading technology in 2016 (a third of total capacity), in generation terms, bioenergy accounted for the largest proportion (36 per cent) followed by onshore wind (25 per cent) and offshore wind (20 per cent). 6.2 The renewable energy flow chart on page 154 summarises the flows of renewables from fuel inputs through to consumption for 2016 and includes energy lost in conversion; the data are sourced from the commodity balance table 6.1 and table 6.4 for electricity outputs.
Key points Progress against the Renewable Energy Directive (RED) target In 2016, 8.9 per cent of total energy consumption came from renewable sources; up
from 8.2 per cent in 2015. Renewable electricity represented 24.6 per cent of total generation; renewable heat 6.2 per cent of overall heat; and renewables in transport, 4.5 per cent.
The UK has now exceeded its third interim target; averaged over 2015 and 2016, renewables achieved 8.5 per cent against its target of 7.5 per cent
Trends in generation Electricity generation (table 6.4) in the UK from renewable sources fell marginally
by 0.2 per cent between 2015 and 2016, to 83.2 TWh. Lower rainfall and wind speeds resulted in lower hydro and wind generation, more than offsetting a 16 per cent increase in total capacity, to 35.7 GW in 2016 (table 6.4).
For the second year running, solar photovoltaics were the leading technology in capacity terms at 11.9 GW, representing a third of total electricity capacity. This resulted in a 38 per cent increase in generation (table 6.4).
Onshore wind generation fell by 8.4 per cent to 21.0 TWh and offshore fell by 5.8 per cent to 16.4 GWh. Wind speeds were lower than in 2015 which had been the highest in fifteen years, more than offsetting additional capacity for both onshore and offshore winds (table 6.4).
Generation from hydro sources fell by 14 per cent to 5.4 TWh in 2016, although 2015 had seen the second highest rainfall during the preceding 15 years (table 6.4).
Renewable Heat Renewable heat increased by 12 per cent due to increases in plant biomass and
anaerobic digestion schemes supported by the Renewable Heat Incentive (RHI)
The RHI supported 15 per cent of renewable heat in 2016, an increase of 4.0 percentage points on 2015
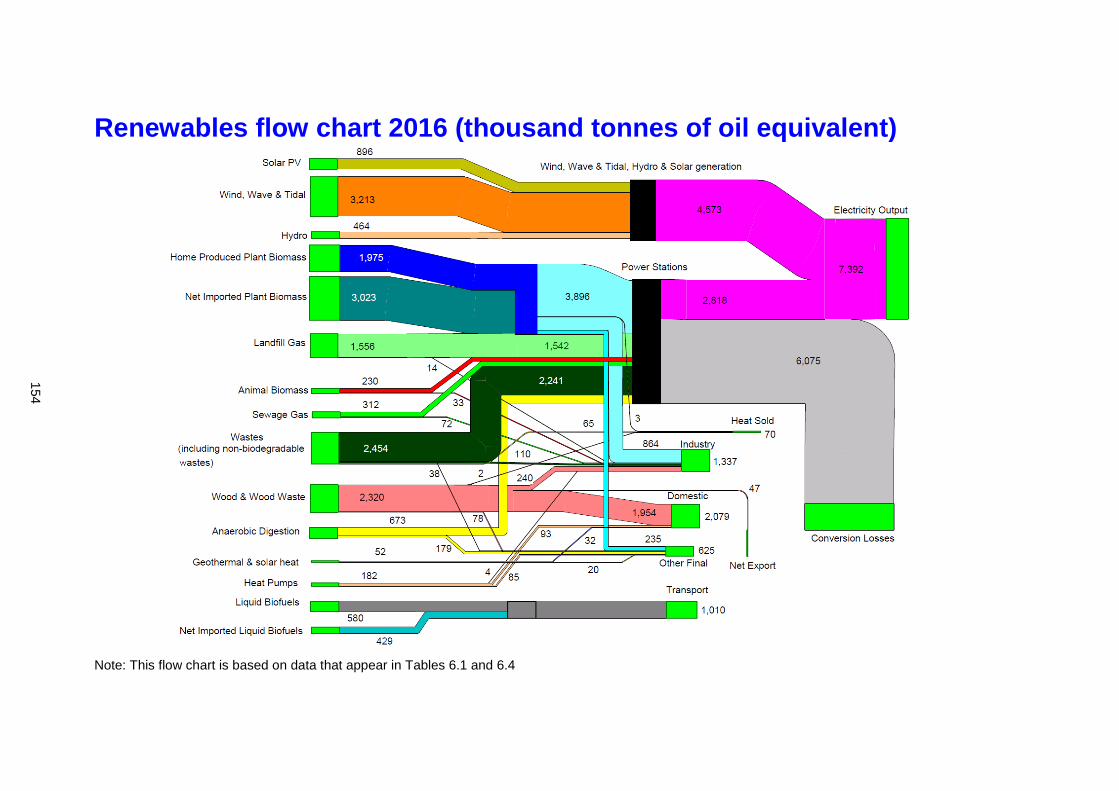
Renewables flow chart 2016 (thousand tonnes of oil equivalent)
Note: This flow chart is based on data that appear in Tables 6.1 and 6.4
154
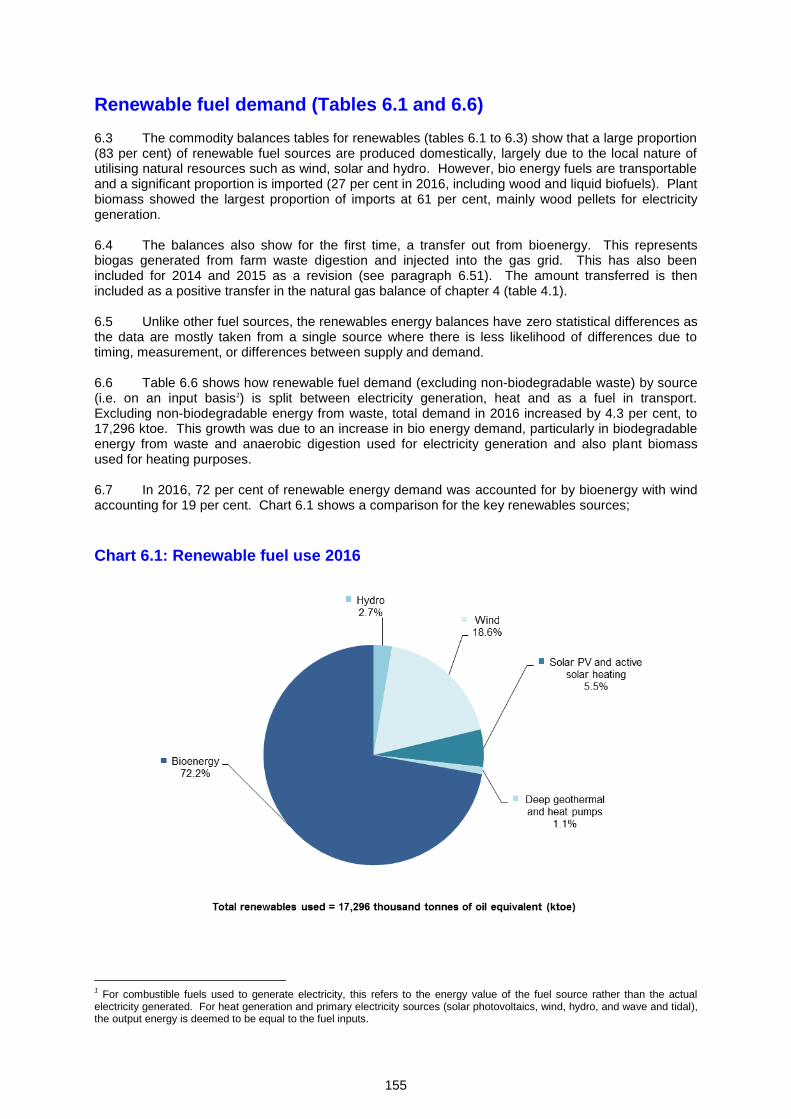
155
Renewable fuel demand (Tables 6.1 and 6.6) 6.3 The commodity balances tables for renewables (tables 6.1 to 6.3) show that a large proportion (83 per cent) of renewable fuel sources are produced domestically, largely due to the local nature of utilising natural resources such as wind, solar and hydro. However, bio energy fuels are transportable and a significant proportion is imported (27 per cent in 2016, including wood and liquid biofuels). Plant biomass showed the largest proportion of imports at 61 per cent, mainly wood pellets for electricity generation. 6.4 The balances also show for the first time, a transfer out from bioenergy. This represents biogas generated from farm waste digestion and injected into the gas grid. This has also been included for 2014 and 2015 as a revision (see paragraph 6.51). The amount transferred is then included as a positive transfer in the natural gas balance of chapter 4 (table 4.1). 6.5 Unlike other fuel sources, the renewables energy balances have zero statistical differences as the data are mostly taken from a single source where there is less likelihood of differences due to timing, measurement, or differences between supply and demand. 6.6 Table 6.6 shows how renewable fuel demand (excluding non-biodegradable waste) by source (i.e. on an input basis1) is split between electricity generation, heat and as a fuel in transport. Excluding non-biodegradable energy from waste, total demand in 2016 increased by 4.3 per cent, to 17,296 ktoe. This growth was due to an increase in bio energy demand, particularly in biodegradable energy from waste and anaerobic digestion used for electricity generation and also plant biomass used for heating purposes. 6.7 In 2016, 72 per cent of renewable energy demand was accounted for by bioenergy with wind accounting for 19 per cent. Chart 6.1 shows a comparison for the key renewables sources;
Chart 6.1: Renewable fuel use 2016
1 For combustible fuels used to generate electricity, this refers to the energy value of the fuel source rather than the actual
electricity generated. For heat generation and primary electricity sources (solar photovoltaics, wind, hydro, and wave and tidal), the output energy is deemed to be equal to the fuel inputs.
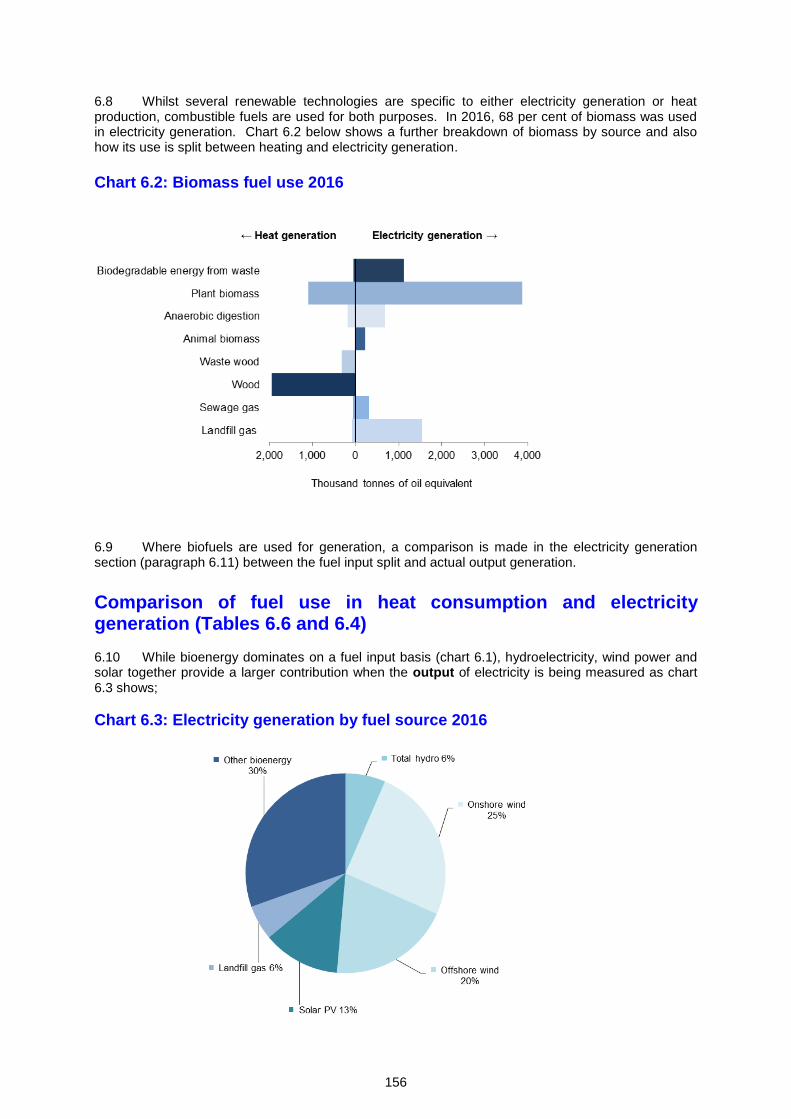
156
6.8 Whilst several renewable technologies are specific to either electricity generation or heat production, combustible fuels are used for both purposes. In 2016, 68 per cent of biomass was used in electricity generation. Chart 6.2 below shows a further breakdown of biomass by source and also how its use is split between heating and electricity generation.
Chart 6.2: Biomass fuel use 2016
6.9 Where biofuels are used for generation, a comparison is made in the electricity generation section (paragraph 6.11) between the fuel input split and actual output generation.
Comparison of fuel use in heat consumption and electricity generation (Tables 6.6 and 6.4) 6.10 While bioenergy dominates on a fuel input basis (chart 6.1), hydroelectricity, wind power and solar together provide a larger contribution when the output of electricity is being measured as chart 6.3 shows;
Chart 6.3: Electricity generation by fuel source 2016
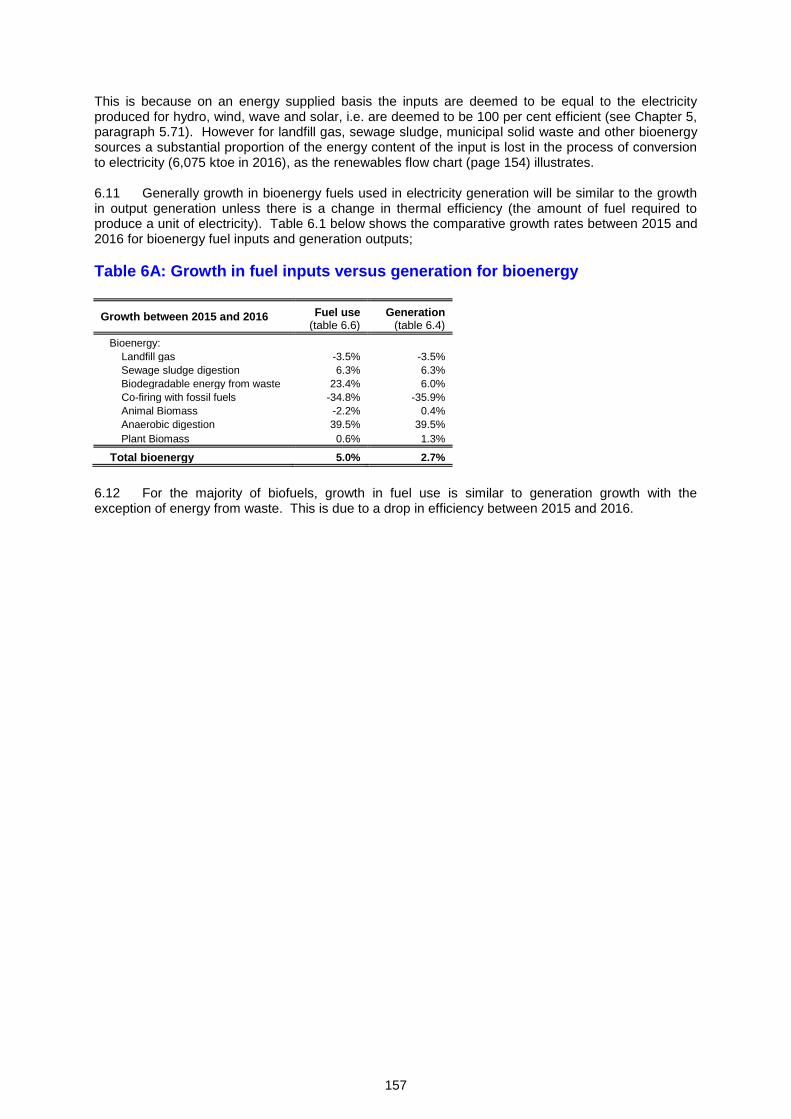
157
This is because on an energy supplied basis the inputs are deemed to be equal to the electricity produced for hydro, wind, wave and solar, i.e. are deemed to be 100 per cent efficient (see Chapter 5, paragraph 5.71). However for landfill gas, sewage sludge, municipal solid waste and other bioenergy sources a substantial proportion of the energy content of the input is lost in the process of conversion to electricity (6,075 ktoe in 2016), as the renewables flow chart (page 154) illustrates. 6.11 Generally growth in bioenergy fuels used in electricity generation will be similar to the growth in output generation unless there is a change in thermal efficiency (the amount of fuel required to produce a unit of electricity). Table 6.1 below shows the comparative growth rates between 2015 and 2016 for bioenergy fuel inputs and generation outputs;
Table 6A: Growth in fuel inputs versus generation for bioenergy
Growth between 2015 and 2016 Fuel use (table 6.6)
Generation (table 6.4)
Bioenergy: Landfill gas -3.5% -3.5%
Sewage sludge digestion 6.3% 6.3%
Biodegradable energy from waste 23.4% 6.0%
Co-firing with fossil fuels -34.8% -35.9%
Animal Biomass -2.2% 0.4%
Anaerobic digestion 39.5% 39.5%
Plant Biomass 0.6% 1.3%
Total bioenergy 5.0% 2.7%
6.12 For the majority of biofuels, growth in fuel use is similar to generation growth with the exception of energy from waste. This is due to a drop in efficiency between 2015 and 2016.
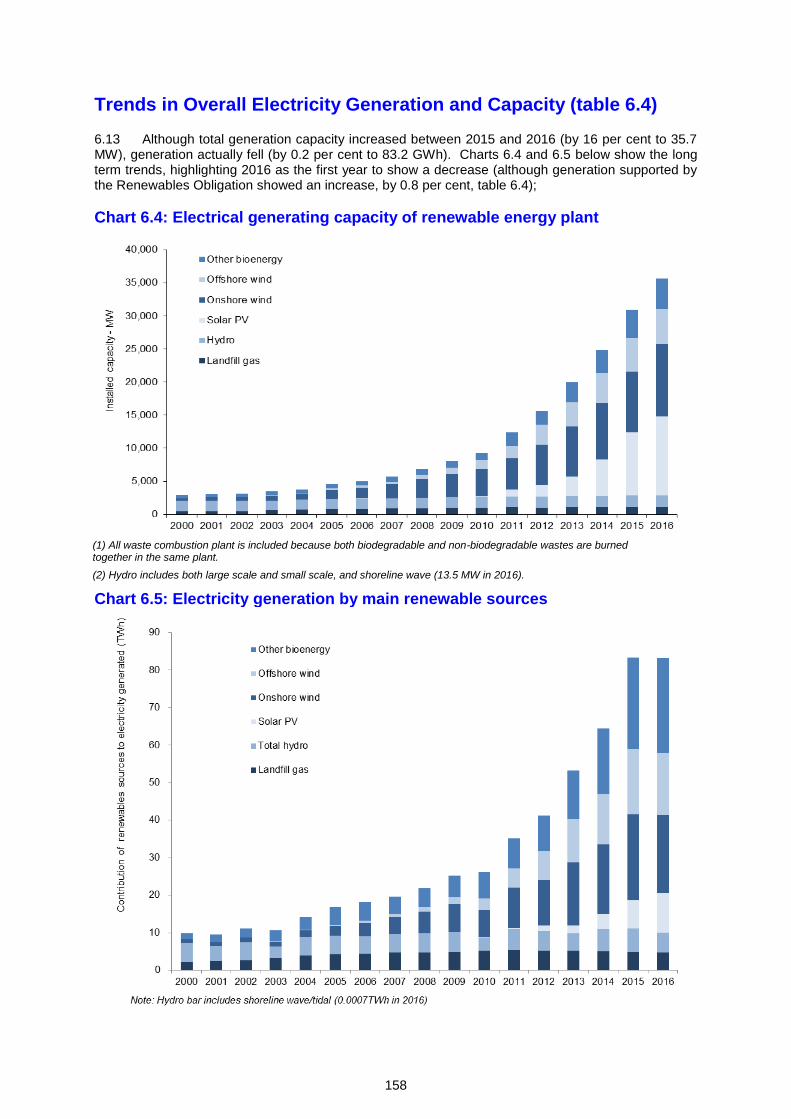
158
Trends in Overall Electricity Generation and Capacity (table 6.4)
6.13 Although total generation capacity increased between 2015 and 2016 (by 16 per cent to 35.7 MW), generation actually fell (by 0.2 per cent to 83.2 GWh). Charts 6.4 and 6.5 below show the long term trends, highlighting 2016 as the first year to show a decrease (although generation supported by the Renewables Obligation showed an increase, by 0.8 per cent, table 6.4);
Chart 6.4: Electrical generating capacity of renewable energy plant
Chart 6.5: Electricity generation by main renewable sources
(1) All waste combustion plant is included because both biodegradable and non-biodegradable wastes are burned together in the same plant.
(2) Hydro includes both large scale and small scale, and shoreline wave (13.5 MW in 2016).
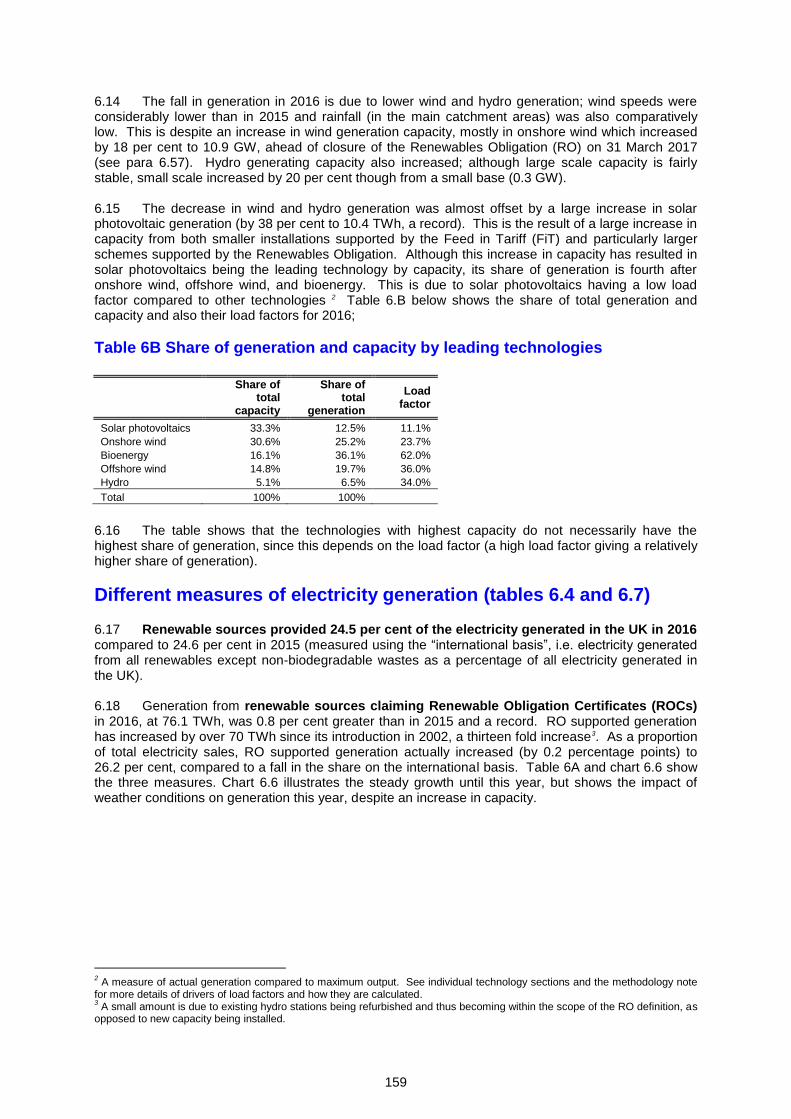
159
6.14 The fall in generation in 2016 is due to lower wind and hydro generation; wind speeds were considerably lower than in 2015 and rainfall (in the main catchment areas) was also comparatively low. This is despite an increase in wind generation capacity, mostly in onshore wind which increased by 18 per cent to 10.9 GW, ahead of closure of the Renewables Obligation (RO) on 31 March 2017 (see para 6.57). Hydro generating capacity also increased; although large scale capacity is fairly stable, small scale increased by 20 per cent though from a small base (0.3 GW). 6.15 The decrease in wind and hydro generation was almost offset by a large increase in solar photovoltaic generation (by 38 per cent to 10.4 TWh, a record). This is the result of a large increase in capacity from both smaller installations supported by the Feed in Tariff (FiT) and particularly larger schemes supported by the Renewables Obligation. Although this increase in capacity has resulted in solar photovoltaics being the leading technology by capacity, its share of generation is fourth after onshore wind, offshore wind, and bioenergy. This is due to solar photovoltaics having a low load factor compared to other technologies 2 Table 6.B below shows the share of total generation and capacity and also their load factors for 2016;
Table 6B Share of generation and capacity by leading technologies
Share of total
capacity
Share of total
generation
Load factor
Solar photovoltaics 33.3% 12.5% 11.1%
Onshore wind 30.6% 25.2% 23.7%
Bioenergy 16.1% 36.1% 62.0%
Offshore wind 14.8% 19.7% 36.0%
Hydro 5.1% 6.5% 34.0%
Total 100% 100%
6.16 The table shows that the technologies with highest capacity do not necessarily have the highest share of generation, since this depends on the load factor (a high load factor giving a relatively higher share of generation).
Different measures of electricity generation (tables 6.4 and 6.7)
6.17 Renewable sources provided 24.5 per cent of the electricity generated in the UK in 2016 compared to 24.6 per cent in 2015 (measured using the “international basis”, i.e. electricity generated from all renewables except non-biodegradable wastes as a percentage of all electricity generated in the UK). 6.18 Generation from renewable sources claiming Renewable Obligation Certificates (ROCs) in 2016, at 76.1 TWh, was 0.8 per cent greater than in 2015 and a record. RO supported generation has increased by over 70 TWh since its introduction in 2002, a thirteen fold increase3. As a proportion of total electricity sales, RO supported generation actually increased (by 0.2 percentage points) to 26.2 per cent, compared to a fall in the share on the international basis. Table 6A and chart 6.6 show the three measures. Chart 6.6 illustrates the steady growth until this year, but shows the impact of weather conditions on generation this year, despite an increase in capacity.
2 A measure of actual generation compared to maximum output. See individual technology sections and the methodology note
for more details of drivers of load factors and how they are calculated. 3 A small amount is due to existing hydro stations being refurbished and thus becoming within the scope of the RO definition, as
opposed to new capacity being installed.
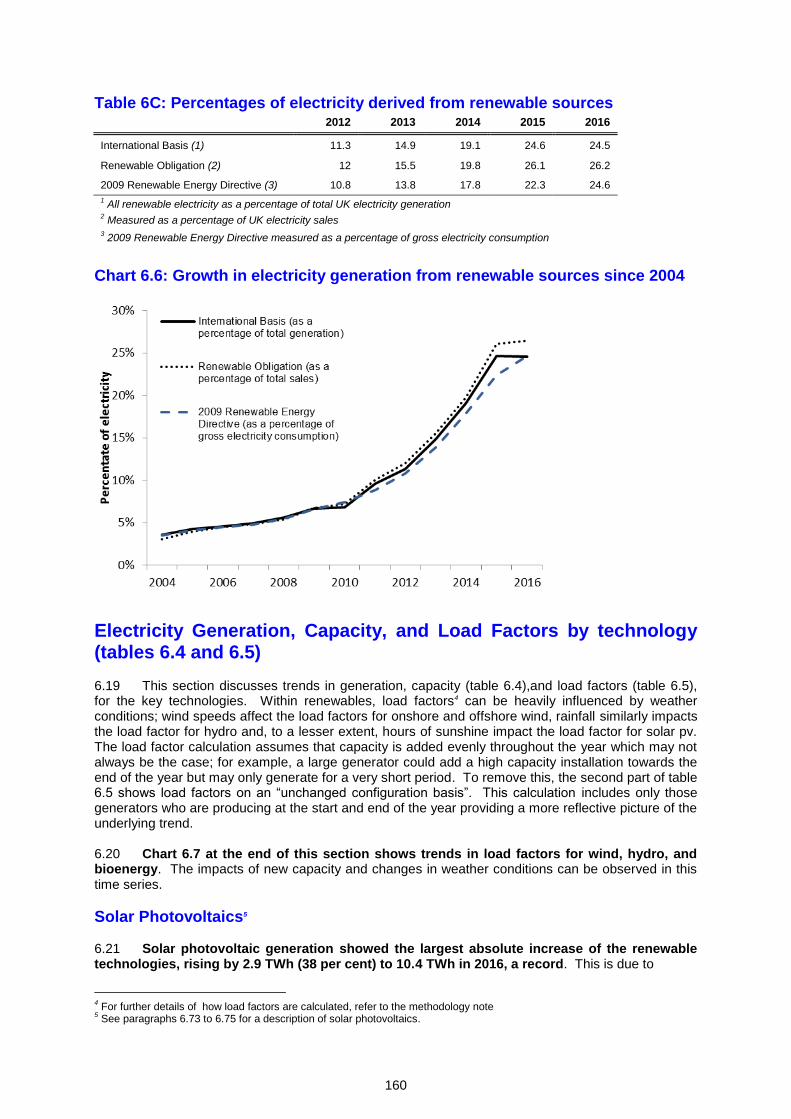
160
Table 6C: Percentages of electricity derived from renewable sources 2012 2013 2014 2015 2016
International Basis (1) 11.3 14.9 19.1 24.6 24.5
Renewable Obligation (2) 12 15.5 19.8 26.1 26.2
2009 Renewable Energy Directive (3) 10.8 13.8 17.8 22.3 24.6
1 All renewable electricity as a percentage of total UK electricity generation
2 Measured as a percentage of UK electricity sales
3 2009 Renewable Energy Directive measured as a percentage of gross electricity consumption
Chart 6.6: Growth in electricity generation from renewable sources since 2004
Electricity Generation, Capacity, and Load Factors by technology (tables 6.4 and 6.5) 6.19 This section discusses trends in generation, capacity (table 6.4),and load factors (table 6.5), for the key technologies. Within renewables, load factors4 can be heavily influenced by weather conditions; wind speeds affect the load factors for onshore and offshore wind, rainfall similarly impacts the load factor for hydro and, to a lesser extent, hours of sunshine impact the load factor for solar pv. The load factor calculation assumes that capacity is added evenly throughout the year which may not always be the case; for example, a large generator could add a high capacity installation towards the end of the year but may only generate for a very short period. To remove this, the second part of table 6.5 shows load factors on an “unchanged configuration basis”. This calculation includes only those generators who are producing at the start and end of the year providing a more reflective picture of the underlying trend. 6.20 Chart 6.7 at the end of this section shows trends in load factors for wind, hydro, and bioenergy. The impacts of new capacity and changes in weather conditions can be observed in this time series.
Solar Photovoltaics5 6.21 Solar photovoltaic generation showed the largest absolute increase of the renewable technologies, rising by 2.9 TWh (38 per cent) to 10.4 TWh in 2016, a record. This is due to
4 For further details of how load factors are calculated, refer to the methodology note
5 See paragraphs 6.73 to 6.75 for a description of solar photovoltaics.
161
increases in capacity in both larger schemes supported by the RO and smaller schemes under the FiT programme; capacity increased by 25 per cent to 11.9 GW in 2016. For the second year, solar PV is the leading technology in capacity terms, representing a third of total capacity, though in generation terms, it accounts for just 13 per cent. 6.22 The load factor for solar pv decreased slightly in 2016, by 0.4 percentage points to 11.1. On an unchanged configuration, it fell by 0.5 percentage points to 10.8. The slightly lower load factor on the unchanged configuration basis is mainly due to the large amount of capacity that came online earlier in the year, largely in March (ahead of the closure of the RO to grace period large-solar and non-grace period small solar – see para 6.57). 6.23 The decrease in load factors (on both bases) could be explained by shorter average hours of sunshine in 2016; average hours in 2015 were in line with the ten year mean of 4.4 hours per day compared to 4.2 in 2016. June in particular showed particularly short hours of sun hours at 4.4 hours compared with the ten year mean of 6.8 hours per day and 7.5 for the month in 2015.
Wind6 6.24 Total wind generation fell by 7.3 per cent to 37.4 TWh, despite an increase in capacity of 1.9 GW (13 per cent), mostly in onshore wind. The reduction in generation is due to lower wind speeds in 2016 compared to 2015, though wind speeds for that year had been the highest for the preceding 15 years. In 2016, average wind speeds were 8.3 Knots, compared with 9.4 for 2015 and a ten year mean of 8.4 Knots. Wind speeds were particularly low for the months of November and December when compared to 2015, with November’s wind speeds 3.4 knots lower and December’s 4.6 knots lower. 6.25 Onshore wind saw the largest fall in generation, by 8.4 per cent to 21.0 GWh in 2016, despite a record 1.7 GW (18 per cent) increase in capacity, including Dunmaglass (94 MW) and Dersalloch (69 MW) in Scotland, and the first 156 MW of Wales’s largest onshore wind farm, Pen y Cymoedd (256 MW on completion). The standard load factor fell by 5.7 percentage points to 23.7. On an unchanged configuration basis, the load factor was slightly higher (24.2 per cent), reflecting the higher levels of deployment towards the end of the year (76 per cent in the second half of the year) on this basis, the fall was 5.2 percentage points, as a result of the low wind speeds for the year. 6.26 Offshore wind generation fell by 1.0 GWh (5.8 per cent), less than for onshore wind but with a much smaller increase in capacity. Capacity is now at 5.3 GW, an increase of 3.9 per cent (200 MW) on 2015, due to the installation of the first 200 MW (25 turbines) at the extension to Burbo Bank offshore wind farm in late 2016. This late installation resulted in the standard load factor being 0.5 percentage points lower than the unchanged configuration measure. The load factor fell on both bases, by 5.5 percentage points (standard) and by 3.1 percentage points (unchanged configuration) to 36.0 and 36.7 respectively.
Table 6C: Number of operational wind turbines split by FiTs and non FiTs accredited sites, as at end of December 2016
FiTs
confirmed Other sites
Total
Onshore Wind 7,414 5,686 13,100
Offshore Wind - 1,465 1,465
Total 7,414 7,151 14,565
The map on the following page shows the location of wind farms operational at the end of 2016 along with an indication of capacity;
6 See paragraphs 6.76 to 6.6.82 for a description of onshore and offshore wind capacity and generation.
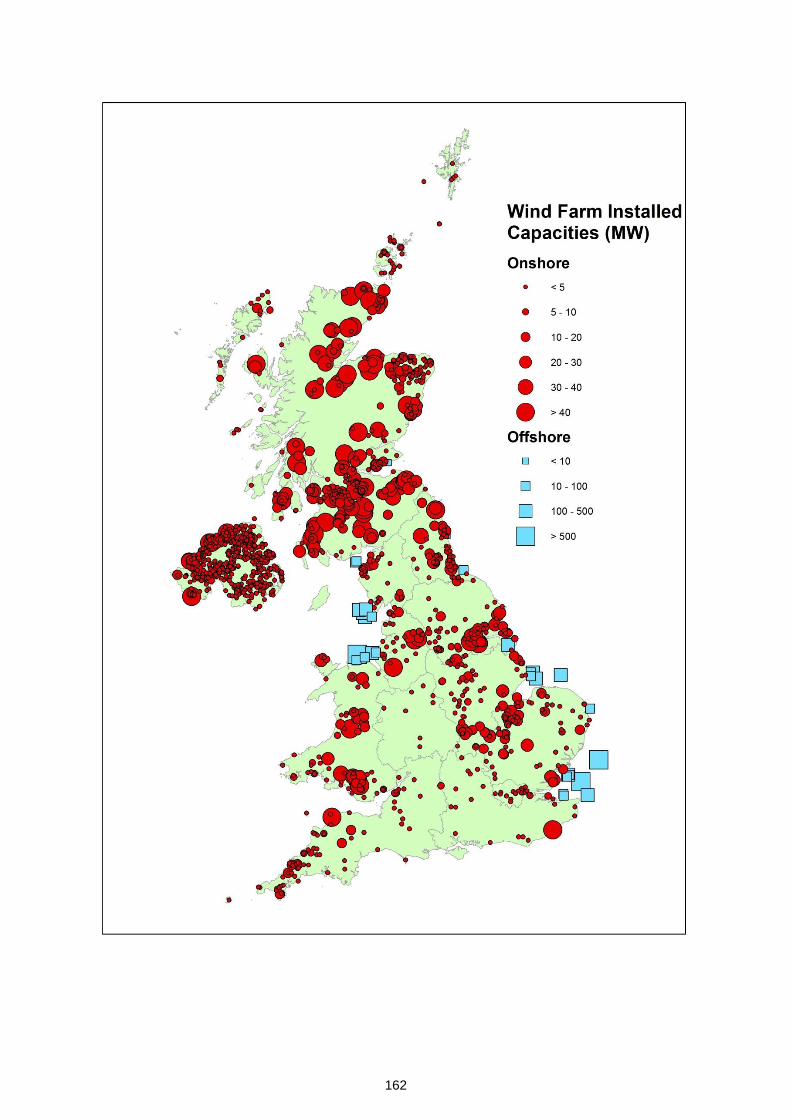
162
163
Hydro generation7
6.27 Generation from hydro fell, by 14 per cent to 5.4 TWh in 2016, partly due to 2015 being a record year, the result of high rainfall (in the main hydro catchment areas). Average rainfall in 2016 was 1,386 mm compared to 1,723 mm in 2015, the wettest year in the preceding fifteen years. Rainfall in 2015 was particularly high in December and was twice the ten year mean for that month. In comparison, rainfall in December 2016 was less than the ten year mean. Whilst large-scale hydro capacity remained unchanged, an increase in schemes supported by FiTs increased small-scale hydro by a record 59 MW (20 per cent). On a standard basis, the load factor fell, also the result of lower rainfall; by 5.5 percentage points for small scale hydro to 35.2 (34.6 per cent on an unchanged configuration basis), and by 7.3 percentage points for large scale, to 33.8.
Bioenergy8 6.28 Generation from bioenergy increased by 2.7 per cent to 30.0 TWh, whilst capacity increased by 9.1 per cent to 5.7 GW. The majority of the increase in generation was from anaerobic digestion with plant biomass accounting for most of the increase in capacity. Changes in load factors between 2015 and 2016 account for the differences in these trends; the load factor for anaerobic digestion increased in contrast to a decrease for plant biomass. 6.29 Anaerobic digestion generation increased by 40 per cent to 2.1 TWh, a record. Largely driven by installations supported by FiTs, capacity increased by 30 per cent to 0.4 GW. The differences in trends can be explained by the load factors; on an actual basis, the load factor increased by 3.5 percentage points to 62.8 per cent. On an unchanged configuration basis, the load factor increased by just 1.9 percentage points to 59.49. 6.30 Generation from plant biomass increased by 1.3 per cent to 18.8 TWh compared to 9.3 per cent growth in capacity (to 2.9 GW in 2016), the second highest absolute growth in capacity (after solar PV). Of the 244 MW of new plant biomass capacity, the Brigg and Snetterton straw–fired plants accounted for around 100 MW, with the remainder smaller plants. The actual load factor for plant biomass was 78.6 per cent for 2016, 8.7 percentage points less than for 2015, in part reflecting outages at Drax in the second half of the year (though the 2015 figure had been inflated due to the conversion of a third unit at Drax early in the first half of the year). On an unchanged configuration basis, the load factor actually increased in 2016 from 74.3 per cent to 78.9 per cent 6.31 There were several new sites in 2016, generating using energy from waste, including the 50 MW scheme at the Wilton complex at Redcar. This new capacity resulted in growth of 10 per cent to 1.0 GW in 2016, and prompted growth in generation from non-biodegradable waste of 6 per cent, to 2.7 TWh. The standard load factor fell from 36.8 in 2015 to 32.1 in 2016; on an unchanged configuration basis, the load factor fell by 1.7 percentage points to 34.6, with over 90 per cent of capacity being installed in the second half of the year. 6.32 Generation from landfill gas fell for the fifth year in a row, as sites continue to become exhausted, and increasing quantities of waste are being recycled. Generation peaked in 2011 at 5.3 TWh and was 4.7 TWh in 2016, a decrease of 12 per cent. Generation fell by 3.5 per cent between 2015 and 2016. Over the same period, generation capacity for landfill gas (2011 to 2016) increased by 8.4 GW (0.8 per cent). On an unchanged configuration basis, the load factor for landfill gas has been falling since 2011; from 59.8 to 49.9 in 2016. 6.33 Animal biomass generation increased by 0.4 per cent to 0.7 TWh with an increase in capacity of 17 per cent to 0.1 GW. The load factor fell by 5.2 percentage points to 61.7 per cent in 2016 and by 9.7 percentage points to 57.2 per cent on an unchanged configuration basis). Growth in sewage gas generation was 6.3 per cent, achieving 1.0 TWh in 2016, due to an 11 per cent growth in capacity (to 0.3 GW). Although the load factor remained stable between 2015 (44.2) and 2016 (44.3), on an unchanged configuration basis, it fell by 5.1 percentage points to 43.1.
7 See paragraphs 6.87 to 6.88 for a description of large and small scale hydro capacity and generation.
8 See paragraphs 6.95 to 6.113 for a description of the various bio energy technologies.
9 Generation from the majority of FiT schemes is estimated at an aggregate level; therefore, these schemes are not included in
the unchanged configuration measure, which will largely be sites accredited on the RO.
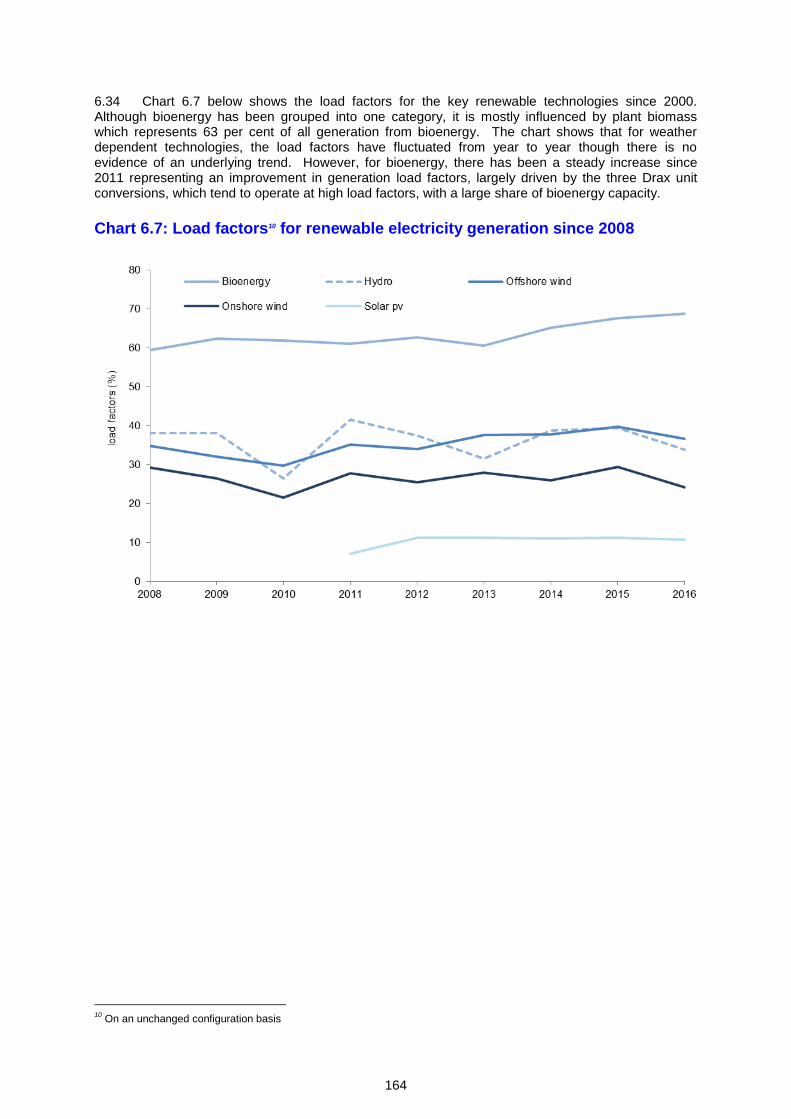
164
6.34 Chart 6.7 below shows the load factors for the key renewable technologies since 2000. Although bioenergy has been grouped into one category, it is mostly influenced by plant biomass which represents 63 per cent of all generation from bioenergy. The chart shows that for weather dependent technologies, the load factors have fluctuated from year to year though there is no evidence of an underlying trend. However, for bioenergy, there has been a steady increase since 2011 representing an improvement in generation load factors, largely driven by the three Drax unit conversions, which tend to operate at high load factors, with a large share of bioenergy capacity.
Chart 6.7: Load factors10 for renewable electricity generation since 2008
10
On an unchanged configuration basis
165
Renewable heat (table 6.6) 6.35 Renewable heat generation increased by 12 per cent in 2016 to 3,943 ktoe. Of this increase (413 ktoe) 68 per cent was plant biomass. The largest increase in percentage terms was anaerobic digestion which increased 88 per cent. Renewable energy from heat pumps increased by 17 per cent in 2016, from 156 ktoe to 182 ktoe, due to an increase in capacity. Apart from a very small decrease in heat from sewage gas (by 1.4 per cent), heat from animal biomass was the only fuel source to see a decline in 2016; from 31 ktoe to 23 ktoe (25 per cent). 6.36 Around 15 per cent of renewable heat was supported by the Renewable Heat Incentive (RHI) or Renewable Heat Premium Payment (RHPP) in 2016, compared to 11 per cent in 2015. This increase is largely due to growth in RHI supported heat; from 379 ktoe (4,412 GWh) in 2015 to 589 ktoe, (6,583 GWh) in 201611. The majority of the increase can be accounted for by bio methane injected into the gas grid, and also demand for biomass driven by the increase in small and medium biomass boilers in the non-domestic sector. Further information on the RHI and RHPP schemes can be found in paragraphs 6.70 to 6.72. 6.37 Around 23 per cent of renewable sources were used to generate heat in 2016, 2.0 percentage points higher than in 2015. 6.38 Domestic wood combustion retained the largest share of renewable heat at 50 per cent, followed by 28 per cent for plant biomass. Non-bioenergy renewable heat sources include solar thermal, deep geothermal and heat pumps, and combined these accounted for 5.9 per cent of total renewable heat, the same level as in 2015.
Liquid biofuels for transport (tables 6.1 and 6.6)12 6.39 Biofuels are made from recently-living biological material13 and can be waste products, non-agricultural residue, or sourced from crops. The petrol substitutes are biomethanol and MTBE (methyl tern-butyl ether), and the diesel substitutes are FAME (fatty acid methyl ester), HVO (hydrogenated vegetable oil), pure plant oil. 6.40 In 2016, 708 million litres of biodiesel
14 were consumed, 5.8 per cent higher than in
2015. Biodiesel is considered the ‘marginal fuel’ supplied under the RTFO and therefore the supply of biodiesel fluctuates in response to changing market conditions. It is estimated that 385 million litres of biodiesel were produced in the UK in 2016, more than double the volume produced in 2015. Of this, about 96 million litres are known to have been used for non-transport applications or exported. Therefore, at least 420 million litres of biodiesel were imported in 2016. The total annual capacity for biodiesel production in the UK in 2016 is estimated to be around 541 million litres. 6.41 Consumption of bioethanol fell in 2016, by 4.5 per cent to 759 million litres. The UK capacity for bioethanol production at the end of 2016 was estimated to be around 910 million litres, although actual production was estimated to be 468 million litres, around half actual capacity. Of UK production, 219 million litres was known to be used for non-transport applications, or exported, so at least 509 million litres was imported. 6.42 During 2016, biodiesel accounted for 2.4 per cent of diesel, and bioethanol 4.4 per cent of motor spirit. The combined contribution of liquid biofuels for transport was 3.1 per cent, a decrease of 0.1 percentage points on 2015. 6.43 Volume data have been converted from litres to tonnes of oil equivalent and are shown in both the commodity balances (Tables 6.1 to 6.3) and in Table 6.6. In addition these data are also included in the aggregate energy balances (Tables 1.1 to 1.3). The tables show the contribution that liquid biofuels are making towards total renewable sourced energy. Renewable biofuels used for transport
11
Note RHI and RHPP data is by date of payment as opposed to when the heat was generated Source; www.gov.uk/government/collections/renewable-heat-incentive-statistics. 12
See paragraphs 6.114 to 6.115 for a description of liquid biofuels. 13
Department for Transport Renewable Transport Fuel Obligation statistics, notes and definitions; www.gov.uk/government/uploads/system/uploads/attachment_data/file/519910/notes-and-definitions.pdf 14
The most usual way for biodiesel to be sold is for it to be blended with ultra-low sulphur diesel fuel.
166
increased by 1.2 per cent (to 1,010 ktoe) between 2015 and 2016 with the majority of the increase being due to biodiesel (bioethanol consumption actually fell in 2016). In 2016, liquid biofuels for transport comprised 5.8 per cent of total renewable sources, 0.2 percentage points less than 2015. 6.44 When measuring the contribution of transport biofuels for the Renewable Energy Directive, only those meeting sustainability criteria count. The data referred to above do not contain sustainability information, including which fuels carry a higher reward (mostly sourced from waste), and the table which does, is not yet a complete data set for 2016. This is due to the RTFO allowing suppliers to make claims for RTFCs up to August after the obligation period (in order to allow suppliers to optimise their supply chain verification processes), as well as, allowing sufficient time for the Department for Transport to make necessary compliance checks before applications are processed. Table 6.7 records progress against the directive and includes an estimate of the proportion of bio liquids being compliant and also the proportion meeting the double credited criteria (mostly those from waste sources). Further information on the RTFO is given in paragraphs 6.66 to 6.69.
Renewable sources data used to indicate progress under the 2009 EU Renewable Energy Directive (RED) (Table 6.7) 6.45 The 2009 Renewable Energy Directive (RED) has a target for the UK to obtain 15 per cent of its energy from renewable sources by 2020. The target uses a slightly different definition of renewable and total energy than is used in the rest of the Digest, including the use of ‘normalised’ wind and hydro generated electricity. Further details on the RED methodology can be found in the methodology document. 6.46 Table 6.7 brings together the relevant renewable energy and final energy consumption data to show progress towards the target of 15 per cent of UK energy consumption to be sourced from renewables by 202015, and also shows the proportions of electricity, heat and transport energy coming from renewable sources. It is an update of the provisional figure published in the June 2017 edition of Energy Trends. During 2016, 8.9 per cent of final energy consumption was from renewable sources. The third interim target, averaged across 2015 and 2016, was set at 7.5 per cent, and was exceeded at 8.5 per cent. The fourth interim target is 10.2 per cent averaged across 2017 and 2018. 6.47 Overall renewable sources, excluding non-biodegradable wastes, provided 9.2 per cent of the UK’s total primary energy requirements in 2016 (excluding energy products used for non-energy purposes). This is a different measure to that reported in the RED. The primary energy demand basis typically produces higher percentages because thermal renewables are measured including the energy that is lost in transformation. The thermal renewables used in the UK are less efficient in transformation than fossil fuels, so as non-thermal renewables such as wind (which by convention are 100 per cent efficient in transformation) grow as a proportion of UK renewables use, then the gross final energy consumption percentage will overtake the primary energy demand percentage. Both of these percentage measures are directly influenced by overall energy use: for instance, whilst the renewable energy component (the numerator in the RED calculation) increased by 9.4 per cent, the final consumption denominator increased by just 0.8 per cent. Table 6D shows both measures.
15
This is an update of the first estimate of the UK progress published in the June 2017 edition of Energy Trends. It includes a member state comparison for 2015 and progress for the EU as a whole www.gov.uk/government/statistics/energy-trends-june-2017-special-feature-article-renewable-energy-in-2016
167
Table 6D: Percentages of energy derived from renewable sources since 2012
2012 2013 2014 2015 2016
Eligible renewable energy sources as a percentage of capped gross final energy consumption (i.e. the basis for the Renewable Energy Directive)
4.7% 5.7% 7.0% 8.2% 8.9%
Renewable energy as a percentage of primary energy demand
4.9% 5.9% 7.3% 8.8% 9.2%
Revisions to published data and new reporting 6.48 Renewables data have been revised back to 2010, with the most recent years seeing the largest revisions; mostly the result of more up to date information. There were also some reclassifications and also new reporting. Where revisions have been made, the values in the excel versions of the tables have been suffixed with an “r” to indicate the value has been changed since last published. 6.49 Some revisions have also been made to installed generating capacities (table 6.4) following an exercise to replace previously estimated data points with actual data, for 2010 to 2014, and including a reconciliation of different sources of survey and administrative data sources. 6.50 New data have enabled consumption in the industrial sector to be allocated to the relevant subgroup whereas previously it was all reported under “unclassified”. This has also been included for 2015 data (tables 6.1 and 6.2). 6.51 For the first time biomethane injected into the gas grid has been reported for 2014, 2015, and 2016; previously there were so few sites, including it would have disclosed individual sites. This is shown in the energy balances tables (6.1 to 6.3) as a transfer out, and a corresponding transfer in is included in the natural gas commodity balance table. 6.52 RHI supported biomass has been reclassified (table 6.6, heat generation); this was included in industrial wood but is now reported under plant biomass with the negative revision for industrial wood combustion offsetting the positive revision for biomass. 6.53 Updated assumptions used in the calculation of heat generated by heat pumps have resulted in revisions (tables 6.1 and 6.6); previous research undertaken by University College London (UCL) in to the performance of heat pumps in situ has been updated and republished16.
16
www.gov.uk/government/publications/detailed-analysis-of-data-from-heat-pumps-installed-via-the-renewable-heat-premium-payment-scheme-rhpp
168
Technical Notes European and UK Renewable Energy Policy Context
EU Renewable Energy Directive 6.54 In March 2007, the European Council agreed to a common strategy for energy security and tackling climate change. An element of this was establishing a target of 20 per cent of EU's energy to come from renewable sources. In 2009, a new Renewable Energy Directive (Directive 2009/29/EC) (‘RED’) was implemented on this basis and resulted in agreement of country “shares” of this target. For the UK, its share is that 15 per cent of final energy consumption - calculated on a net calorific value basis, and with a cap on fuel used for air transport - should be accounted for by energy from renewable sources by 2020. The RED included interim targets, and required each Member State to produce a National Renewable Energy Action Plan (which contains a progress trajectory and identifies measures which will enable countries to meet their targets). The Directive also requires each Member State to submit a report to the Commission on progress in the promotion and use of energy sources every two years. The UK’s action plan and the first three progress reports (covering performance during 2009-2010, 2011-12, and 2013-14) are available at: www.gov.uk/government/uploads/system/uploads/attachment_data/file/47871/25-nat-ren-energy-
action-plan.pdf, www.gov.uk/government/publications/first-progress-report-on-the-promotion-and-use-of-energy-from-renewable-sources-for-the-uk, www.gov.uk/government/publications/second-progress-report-on-the-promotion-and-use-of-energy-from-renewable-sources-for-the-united-kingdom, www.gov.uk/government/publications/third-progress-report-on-the-promotion-and-use-of-energy-from-renewable-sources-for-the-united-kingdom The fourth progress report will cover 2015-16 and will be published in January 2018.
UK Renewables Policy 6.55 The UK’s low carbon policies have seen renewable electricity capacity increase by more than three times since 2010. In 2016, renewables provided nearly one quarter of the UK’s electricity generation, and we are on track to comfortably exceed our ambition of delivering 30% of the UK’s electricity from renewables in 2020-21.
Renewables Obligation (RO) 6.56 The Renewables Obligation (RO) came into effect in April 2002
17. It is an obligation on
electricity suppliers to source a specific proportion of electricity from eligible renewable sources or pay a penalty. The proportion is measured against total electricity sales (as shown in Table 5.5 contained in the electricity chapter of this Digest). The Obligation is intended to incentivise an increase in the level of renewable generating capacity and so contribute to our climate change targets. Examples of RO eligible sources include wind energy, bioenergy (including landfill gas, sewage gas, biomass, anaerobic digestion and energy from waste), hydro, photovoltaics, wave and tidal energy and deep geothermal. Ofgem (which administers the RO) issues Renewables Obligation Certificates (ROCs) to qualifying renewable generators. These certificates may be sold by generators directly to licensed electricity suppliers or to traders. Suppliers present ROCs to Ofgem to demonstrate their compliance with the obligation.
17
Parliamentary approval of the Renewables Obligation Orders under The Utilities Act 2000 was given in March 2002. The Renewables Obligation covering England and Wales and the analogous Renewables (Scotland) Obligation came into effect in April 2002. Northern Ireland introduced a similar Renewables Obligation in April 2005. Strictly speaking until 2005, the RO covers only Great Britain, but in these UK based statistics Northern Ireland renewable sources have been treated as if they were also part of the RO.
169
6.57 When the Obligation was first introduced, 1 ROC was awarded for each MWh of renewable electricity generated. In 2009, ‘banding’ was introduced into the RO, meaning different technologies now receive different numbers of ROCs depending on their costs and potential for large scale deployment; for example new offshore wind in Great Britain receives 1.8 ROCs/MWh while onshore wind receives 0.9 ROCs/MWh. The more established renewable technologies such as sewage gas receive 0.5 ROCs/MWh. A review of the bands across the UK concluded in 2012 and set the level of support under the RO from 1 April 2013 – 31 March 2017. Banding reviews ensure that, as market conditions and innovation within sectors change and evolve, renewables developers continue to receive the appropriate level of support necessary to maintain investments within available resources. In Great Britain, the RO closed to large-scale solar PV (over 5MW) on 31 March 2015 and to small-scale solar (up to 5MW) on 31 March 2016. It closed to all capacities of onshore wind in Great Britain on 12 May 2016. In Northern Ireland, it closed to large-scale onshore wind (over 5MW) on 31 March 2016 and to small-scale onshore wind (up to 5MW) on 30 June 2016. The scheme closed to all other technologies on 31 March 2017, although existing generating stations will continue to receive support for 20 years, up to 2037. Various grace periods are available which extend the closure date in certain specified situations. Details of the grace periods are available on Ofgem’s website at: www.ofgem.gov.uk/environmental-programmes/renewables-obligation-ro/information-generators/closure-renewables-obligation-ro . A list of technologies eligible for the RO, details of the RO banding review, and the level of ROCs received, is available at: www.gov.uk/guidance/calculating-renewable-obligation-certificates-rocs 6.58 Table 6.4 contains a row showing the total electricity eligible for the RO. Prior to 2002 the main instruments for pursuing the development of renewables capacity were the Non Fossil Fuel Obligation (NFFO) Orders. Electricity Market Reform (EMR) 6.59 Contracts for Difference has replaced the RO for new renewable energy stations. Contracts for Difference tackle the risks and uncertainties of the underlying economics of different forms of electricity generation by offering long term contracts for low carbon energy. 6.60 In effect, companies will get a fixed and secure price at which they can sell their electricity to consumers. This will allow investors to be confident about the returns of their capital in advance of investing billions into new infrastructure schemes. It will also encourage banks to lend at cheaper rates because the projects are less risky. Further details are available at: www.gov.uk/government/publications/contracts-for-difference/contract-for-difference
Feed-in Tariffs (FiTs) 6.61 The Feed-in Tariff (FiT) scheme is a policy mechanism designed to support investment in small-scale renewable and low carbon electricity generation projects up to 5MW capacity. It offers long term support to projects and provides tariffs based on the costs of generation for each technology. The technologies supported are: solar PV, onshore wind power, hydropower, anaerobic digestion (AD), and micro (<2kW) combined heat and power (micro-CHP). Under the scheme, generators receive three sources of income/savings:
- A Generation tariff - a payment for every kWh generated, dependent on the technology and capacity of the installation, and date installed;
- An Export tariff - an additional payment for every kWh exported to the local electricity network; and
- Bill savings - additional benefit from usage of electricity “onsite” as opposed to paying the retail price for importing that energy from the grid.
Provisionally, overall Feed-in Tariff (FIT)-scale deployment at the end of May 2017 was 6,091 MW (902,560 installations). This represented an 8% increase in total FIT installed capacity and a 4% increase in the number of installations compared to the same period in 2016. Around 99% are solar PV installations (82% of capacity). Statistical reports are available at: www.gov.uk/government/statistics/monthly-small-scale-renewable-deployment
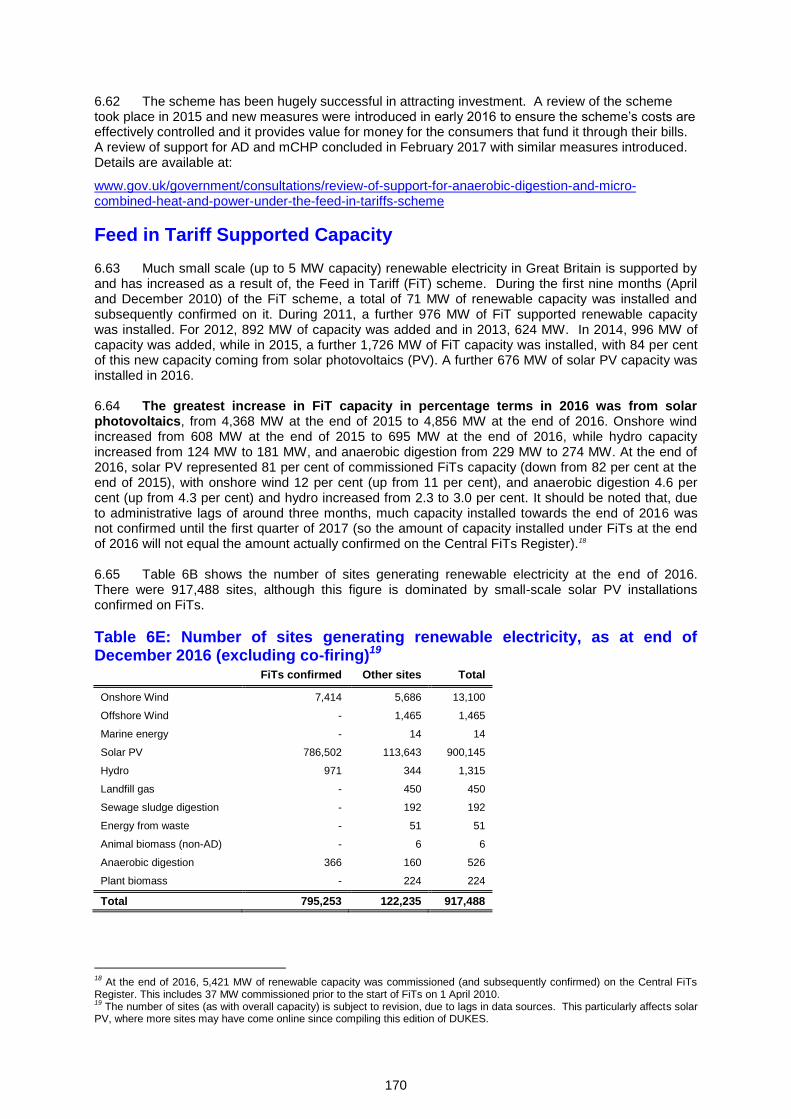
170
6.62 The scheme has been hugely successful in attracting investment. A review of the scheme took place in 2015 and new measures were introduced in early 2016 to ensure the scheme’s costs are effectively controlled and it provides value for money for the consumers that fund it through their bills. A review of support for AD and mCHP concluded in February 2017 with similar measures introduced. Details are available at:
www.gov.uk/government/consultations/review-of-support-for-anaerobic-digestion-and-micro-combined-heat-and-power-under-the-feed-in-tariffs-scheme
Feed in Tariff Supported Capacity 6.63 Much small scale (up to 5 MW capacity) renewable electricity in Great Britain is supported by and has increased as a result of, the Feed in Tariff (FiT) scheme. During the first nine months (April and December 2010) of the FiT scheme, a total of 71 MW of renewable capacity was installed and subsequently confirmed on it. During 2011, a further 976 MW of FiT supported renewable capacity was installed. For 2012, 892 MW of capacity was added and in 2013, 624 MW. In 2014, 996 MW of capacity was added, while in 2015, a further 1,726 MW of FiT capacity was installed, with 84 per cent of this new capacity coming from solar photovoltaics (PV). A further 676 MW of solar PV capacity was installed in 2016. 6.64 The greatest increase in FiT capacity in percentage terms in 2016 was from solar photovoltaics, from 4,368 MW at the end of 2015 to 4,856 MW at the end of 2016. Onshore wind increased from 608 MW at the end of 2015 to 695 MW at the end of 2016, while hydro capacity increased from 124 MW to 181 MW, and anaerobic digestion from 229 MW to 274 MW. At the end of 2016, solar PV represented 81 per cent of commissioned FiTs capacity (down from 82 per cent at the end of 2015), with onshore wind 12 per cent (up from 11 per cent), and anaerobic digestion 4.6 per cent (up from 4.3 per cent) and hydro increased from 2.3 to 3.0 per cent. It should be noted that, due to administrative lags of around three months, much capacity installed towards the end of 2016 was not confirmed until the first quarter of 2017 (so the amount of capacity installed under FiTs at the end of 2016 will not equal the amount actually confirmed on the Central FiTs Register).18 6.65 Table 6B shows the number of sites generating renewable electricity at the end of 2016. There were 917,488 sites, although this figure is dominated by small-scale solar PV installations confirmed on FiTs.
Table 6E: Number of sites generating renewable electricity, as at end of December 2016 (excluding co-firing)19
FiTs confirmed Other sites Total
Onshore Wind 7,414 5,686 13,100
Offshore Wind - 1,465 1,465
Marine energy - 14 14
Solar PV 786,502 113,643 900,145
Hydro 971 344 1,315
Landfill gas - 450 450
Sewage sludge digestion - 192 192
Energy from waste - 51 51
Animal biomass (non-AD) - 6 6
Anaerobic digestion 366 160 526
Plant biomass - 224 224
Total 795,253 122,235 917,488
18
At the end of 2016, 5,421 MW of renewable capacity was commissioned (and subsequently confirmed) on the Central FiTs Register. This includes 37 MW commissioned prior to the start of FiTs on 1 April 2010. 19
The number of sites (as with overall capacity) is subject to revision, due to lags in data sources. This particularly affects solar PV, where more sites may have come online since compiling this edition of DUKES.
171
Renewable Transport Fuel Obligation (RTFO) 6.66 The Renewable Transport Fuel Obligation, introduced in April 2008, placed a legal requirement on road transport fuel suppliers (who supply more than 450,000 litres of fossil petrol, diesel or renewable fuel per annum to the UK market) to ensure that 4.75 per cent (by volume) of their overall fuel sales were from a renewable source by 2013/14 and all subsequent years, with incremental levels of 2.5 per cent (by volume) for 2008/09, 3.25 per cent (by volume) in 2009/10, 3.5 per cent (by volume) in 2010/11, 4.0 per cent (by volume) in 2011/12, and 4.5 per cent (by volume) in 2012/13. Under the RTFO all obligated companies are required to submit data to the RTFO administrator on volumes of fossil and renewable fuels they supply. Renewable Transport Fuel certificates are issued in proportion to the quantity of biofuels registered. 6.67 The RTFO (amendment) Order, made in 2011, introduced mandatory carbon and sustainability criteria for all renewable fuels and double rewards for some fuel types, including those made from waste and residue materials. From April 2013 the end uses covered by the RTFO were amended to include non-road mobile machinery, agriculture and forestry tractors and recreational craft when not at sea. Further information on the RTFO policy can be found at: www.gov.uk/government/collections/renewable-transport-fuels-obligation-rtfo-orders#guidance 6.68 The verified RTFO biofuels statistics, including information on origin and sustainability from 2008 onwards can be found at: www.gov.uk/government/collections/biofuels-statistics. 6.69 The Department for Transport consulted in 2016 on a range of proposals to increase the supply and sustainability of renewable transport fuels, including proposals to increase the obligation from 2017 and to set a trajectory to 2020 and beyond. Other proposals included increasing the supply of waste derived fuels, encouraging the production of advanced, or 'development', fuels, and renewable fuels of non-biological origin and setting a maximum level for the supply of fuels made from crops. The consultation closed in January 2017 and the department aims to publish its response in due course.
Renewable Heat Incentive and Premium Payment 6.70 The Renewable Heat Incentive (RHI) scheme is a government financial incentive scheme introduced to encourage a switch to renewable heating systems in place of fossil fuels. The tariff based scheme is split into two parts:
The non-domestic RHI scheme which has been open to commercial, industrial, public sector,
not for profit and community generators of renewable heat since November 2011.
The domestic RHI scheme which opened on 9 April 2014 and is available to homeowners, private and social landlords and people who build their own homes.
Further information on this scheme, including details of the technologies, can be found at: www.gov.uk/government/policies/increasing-the-use-of-low-carbon-technologies/supporting-pages/renewable-heat-incentive-rhi. 6.71 The Renewable Heat Premium Payment (RHPP) voucher scheme, launched in August 2011, made one-off payments to householders to help them buy renewable heating technologies. This scheme closed on 31 March 2014 prior to the introduction of the domestic RHI scheme. Further information on the RHPP can be found at www.gov.uk/renewable-heat-premium-payment-scheme with further data available at www.gov.uk/government/collections/renewable-heat-incentive-renewable-heat-premium-payment-statistics. 6.72 Table 6E below shows the breakdown of technologies accredited to the domestic scheme, over the period 9 April 2014 (launch date) to 31 December 2016, with average installed capacity and heat paid out for under the scheme. In total there were 52,971 accreditations, with 1,408,656 MWh of heat generated and paid for. Further data and information relating to the RHI can be found at: www.gov.uk/government/collections/renewable-heat-incentive-statistics.
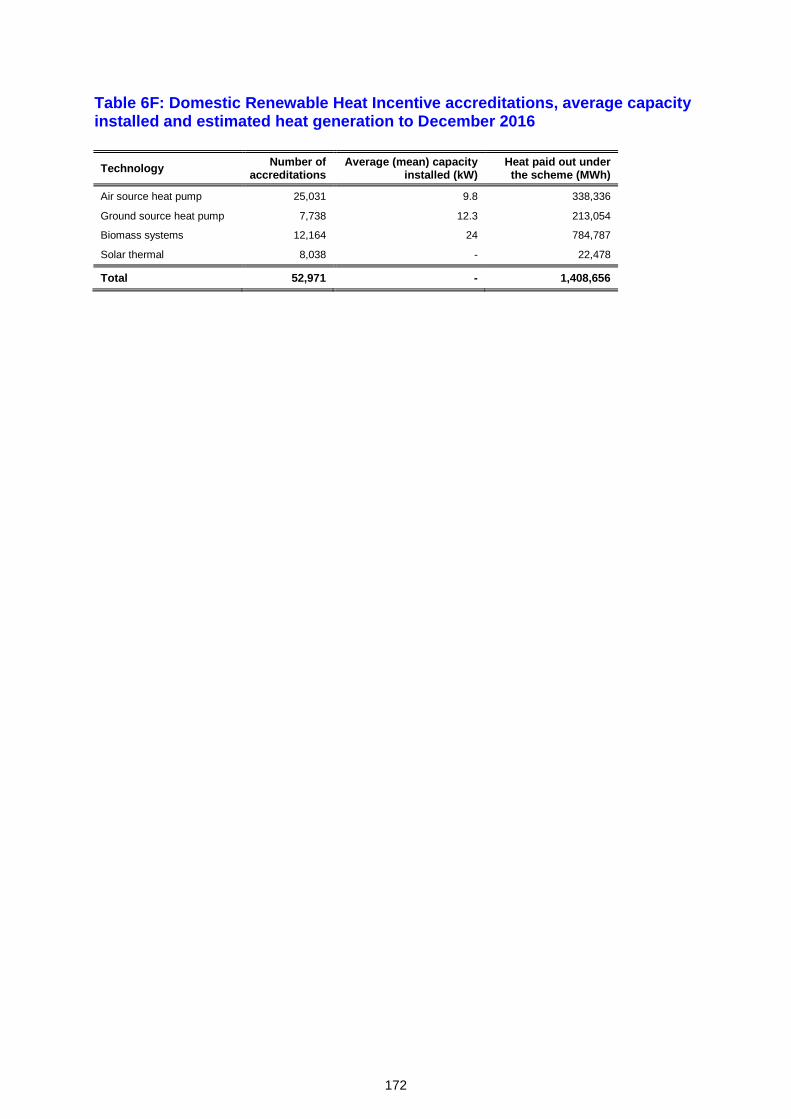
172
Table 6F: Domestic Renewable Heat Incentive accreditations, average capacity installed and estimated heat generation to December 2016
Technology Number of
accreditations Average (mean) capacity
installed (kW) Heat paid out under the scheme (MWh)
Air source heat pump 25,031 9.8 338,336
Ground source heat pump 7,738 12.3 213,054
Biomass systems 12,164 24 784,787
Solar thermal 8,038 - 22,478
Total 52,971 - 1,408,656
173
Sources of Renewable Energy
Active solar heating 6.73 Active solar heating employs solar collectors to heat water mainly for domestic hot water systems but also for swimming pools and other applications. There are primarily two key designs: flat-plate, comprising a dark absorbing material with a cover to reduce heat loss and a liquid – usually water with antifreeze – to extract the heat from the absorber, and evacuated-tube collectors that use heat pipes for their core to extract the energy instead of passing liquid directly through them. Planning permission is required for free-standing domestic solar panels of more than 9m
2, but the more
common form of installation is the roof mounted scheme which does not require planning permission.
Solar photovoltaics (PV) 6.74 Photovoltaics (PV) is the direct conversion of solar radiation into direct current electricity by the interaction of light with the electrons in a semiconductor device or cell. Within the UK, PV installations are primarily either ground-mounted solar farms, usually built on low-grade farmland and disused facilities (e.g., airfields) or rooftop devices mostly retrofitted to existing buildings. The installation costs associated with these has fallen dramatically in recent years. Since April 2010 support for small scale (less than 5 MW) solar PV and other micro-generation technologies in Great Britain had been provided by FiTs (see paragraph 6.62), resulting in a rapid expansion in solar PV capacity. Larger-scale (> 50 kW) solar PV and all installations in Northern Ireland were supported by the Renewables Obligation (RO) (see paragraph 6.57)[1]. As of 31 March 2017, the Renewables Obligation is now closed to all new generating capacity which was replaced by the FiT Contracts for Difference (CFD) scheme but only for the first round. 6.75 The small Scale Feed In Tariff Scheme has seen significant cuts in support through both revisions to the scheme, and uptake-based degression, and will in any case end in 2019. There are indications the market is seeking to develop schemes without subsidy, though these are likely to seek other ways of ensuring cost effectiveness, e.g., through private wire, or combining with storage to sell at other times of day, or simply being very large (several tens of MW). 6.76 On Saturday 25 March 2017, demand on the National Transmission System was, for the first time ever, lower during the afternoon, than it was overnight. This was due to very high levels of PV generation, even in March. This will become common place in future summer days with implications for management of the grid and for operation of fossil fuelled plant.
Onshore wind power 6.77 Onshore wind is one of the most mature renewable energy technologies. The UK has a good onshore wind resource, with wind speeds particularly good in Scotland, Northern Ireland and Wales but less suitable in England, particularly in the South East. A wind turbine extracts energy from the wind by means of a rotor (usually a three-bladed horizontal-axis rotor) that can be pitched to control the rotational speed of a shaft linked via a gearbox to a generator. 6.78 For larger scale installations, turbine size has increased steadily over the years. The average new turbine size for operational schemes over the last 5 years was around 2.5 MW. For those schemes under construction, however, this is moving towards 3 MW. A small number of the early projects which were installed around 20 years ago have re-powered. This involves replacing ageing turbines with larger, more efficient ones and increasing tower height to take advantage of the higher wind speeds found at increased height above ground level. Multiple turbines are often sited together in ‘wind farms’ and the electricity generated is supplied to the electricity grid. In England and Wales, planning applications for large-scale (>50MW) wind farms are now handled by local authorities. In addition, the Renewables Obligation is now closed to all new generating capacity which is replaced by the Contracts for Difference (CFD) scheme administered by National Grid.
[1]
Eligible GB schemes between 50 kW and 5 MW capacity can currently choose between the RO and FiTs.
174
6.79 In the small-medium wind market (1.5–100 kW), generated energy is often used to satisfy on-site demand. Small-scale wind system technology can be subdivided into three categories: micro wind turbines (0–1.5 kW), small wind turbines (1.5–15 kW) and small–medium wind turbines (15–100 kW). The two main designs are the horizontal axis wind turbines (HAWT) and vertical axis wind turbines (VAWT). 6.80 In terms of operational characteristics, siting considerations and the value and nature of the market, small-scale wind systems vary markedly from large-scale units. Small-scale wind systems can be off-grid or on-grid; mobile or fixed; free-standing or building-mounted; or they can form part of combined installations, most commonly with photovoltaic systems. As a result, they have a greater range of applications, compared to large-scale wind turbines and can be used in commercial, public or domestic settings and as single or multiple installations providing power to communities.
Offshore wind power 6.81 The UK has some of the best offshore wind resource in Europe, with relatively shallow waters and strong winds. The Renewable Energy Roadmap20 highlights offshore wind as a key technology that will help the UK meet the 2020 RED target, with a potential deployment by 2020 of up to 18 GW subject to cost reduction. This would correspond to around 17 per cent of the UK’s net electricity production. 6.82 Offshore winds tend to blow at higher speeds and are more consistent than on land, thus allowing turbines to produce more electricity (because the potential energy produced from the wind is directly proportional to the cube of the wind speed, increased wind speeds of only a few miles per hour can produce a significantly larger amount of electricity) but it is more-costly to implement than onshore wind. However, onshore constraints such as planning, noise effects, visual impact and the effects of transportation of large components are reduced offshore. As a result, offshore turbines are generally larger than their onshore counterparts, with the current commercially available turbines having a rated capacity of between 3 and 6 MW. A number of larger, offshore specific, turbines, however, are currently being developed. Floating concepts are also being developed as they are considered by many to be more viable (both economically and environmentally) in deeper waters. 6.83 In the development of the UK’s offshore wind capacity, the Crown Estate have run a number of leasing rounds under which areas of the seabed have been made available for the development of offshore wind farms. Round 1 started in December 2000, Round 2 in July 2003 and Round 3 in January 2010. Construction of some Round 3 capacity (Rampion) has already begun. The Crown estate published a detailed account of progress with operational offshore wind in 201621.
Marine energy (wave and tidal stream power) 6.84 Ocean waves are created by the interaction of winds with the surface of the sea. Because of the UK’s position on the north eastern rim of the Atlantic it has some of the highest wave power levels in the world. Tidal currents are created by the movement of the tides, often magnified by local topographical features such as headlands and channels. Tidal current energy is the extraction of energy from this flow, analogous to the extraction of energy from moving air by wind turbines. Tidal range power can be extracted from tidal barrage and tidal lagoon systems. With a tidal barrage across an estuary, water is collected during the flood tide, creating a head of water. During the ebb tide the water flows out of the pool through low-head hydro turbines thus generating electricity. Some technologies also allow generation on ebb and flood. A tidal lagoon works in a similar manner, but an artificial pool is used to collect the water. The UK is still seen as the world leader in wave and tidal stream technology; however a number of other countries are rapidly developing sites for wave and tidal installations with the associated supply chain such as Canada, France, South Korea and Australia. 6.85 In 2015, The Crown Estate announced a new programme of leasing for small scale wave and tidal current test and demonstration projects under 3MW. This allows developers to apply for leases when their technology is ready and they have raised sufficient finance rather than being restricted to
20
www.gov.uk/government/collections/uk-renewable-energy-roadmap 21
www.thecrownestate.co.uk/media/1050888/operationalwindreport2017_final.pdf
175
leasing calls. This provides greater opportunities for tidal turbines of 100kW or less to be deployed, with a large number of developers successfully commissioning small scale prototype turbines. 6.86 Atlantis and Andritz both commissioned turbines in 2017 and are currently completing operational trials. Scotrenewables report having generating 18MWh over a 24-hour period with their 2MW device, subject to losses, this equates to an offshore wind competitive 37.5% capacity factor. Conversely Sustainable Marine Energy moved their prototype testing overseas reducing the potential for installed capacity in UK waters this year, whilst Delta Stream went into administration. 6.87 Wave Energy Scotland continue to provide research and development funding to a number of wave developers to look at ways of improving the performance and reliability of wave device subsystems and components. Innovate UK have also opened a call to support wave and tidal projects. Wave energy deployment in the UK is still limited to early prototypes. The UK Government review of tidal lagoons was published at the end of 2016. This concluded that tidal lagoons can play a cost effective role in the UK’s energy mix. The review recommends a less than 500MW pathfinder project is identified to take forward as tidal lagoons would help deliver security of supply; they would assist in delivering our decarbonisation commitments; and they would bring real and substantial opportunities for the UK supply chain.
Large scale hydro 6.88 In hydro schemes the turbines that drive the electricity generators are powered by the direct action of water either from a reservoir or from the run of the river. Large-scale hydro cover plants with a capacity of 5 MW and over and most of these are located in Scotland and Wales where they mainly draw their water from high-level reservoirs with their own natural catchment areas. The data in this Chapter excludes pumped storage stations. The UK has one mixed pump storage and natural flow hydro station, at Foyers in Scotland. Whilst it is primarily a pumped storage site, the generation attributed to the natural flow component of this station can be calculated, and is included in the large-scale hydro generation figures in this Chapter. However, the natural flow share of the capacity cannot be separated, and is therefore not included.
Small scale hydro
6.89 Hydro electricity generation schemes with a capacity below 5 MW are classified as small scale, with those less than 50kW referred to as micro-scale. These are schemes for either domestic/farm purposes or for local sale to electricity supply companies. The majority of new development will fall into this category and will remain eligible for FITs support following the closure of the RO on 31
st March 2017.
Deep geothermal energy 6.90 There are two broad types of deep geothermal technology; for direct heat use (where temperatures are above 60
oC) and for power generation (though normally for combined heat and
power) usually where the resource temperature is above 120oC. The UK’s deep geothermal
resources include hot aquifers (i.e. subterranean bodies of water) in the North East, Wessex and Cheshire and the ‘hot dry rocks’ in Cornwall which are likely to have the greatest potential (at 5km depth) for power generation. There are two simple models for deep geothermal projects. Where a hot aquifer has been identified, it is possible to simply pump the hot water to the surface and use it directly, for example in a heat network. The water then needs to be either disposed of or re-injected into the ground via a second borehole. An alternative model is to pump cold water from the surface down into a volume of hot rock, exploiting existing fractures in the rock or creating these through Enhanced Geothermal System techniques, and then recovering it to the surface once it has been heated. 6.91 The Government has provided grant support for this sector. Deep geothermal electricity generation was also supported under the RO and is now eligible for support under the Contracts for Difference. Deep geothermal energy for direct heat use, defined as coming from a drilling depth of at least 500m, is eligible for support under the Renewable Heat Incentive. The tariff is currently set at 5.22p/kWh (commissioned on or after 4 December 2013) from 1 April 2015.
176
6.92 At present there are no deep geothermal power plants in the UK. The UK’s only existing geothermal heat generating station is at Southampton, where an 1800m borehole taps into the edge of the aquifer under Wessex and provides heat to the Southampton district heat network.
Heat pumps 6.93 Heat pumps extract heat from the local surroundings, either from the air (ASHP), the ground (GSHP) or water (WSHP). Only heat extracted from ambient surroundings is eligible as renewable heat, i.e. exhaust heat from other processes is not included. Heat pumps can be dedicated to heat production or reversible, such that they can be operated in either a heating or cooling mode. Currently only heat from dedicated heat pumps is included in the statistics. Dedicated ASHP and GSHP are eligible technologies in both the domestic and non-domestic RHI. 6.94 Heat pumps require an energy source to operate. The majority use electricity to operate a compression cycle. The seasonal performance factor (SPF) estimates the ratio of the heating output of the heat pump to the electricity input over the whole heating season and so reflects the efficiency a heat pump achieves when installed. The Renewable Energy Directive (Annex VII) sets out the equation for calculating how much of the energy generated by heat pumps should be considered renewable and a minimum SPF is part of that equation. Heat pumps which do not meet the minimum SPF are not counted as renewable under the Directive. The latest available guidance from the European Commission gives a minimum SPF of 2.5, based on an average pan-European electricity efficiency. Recent analysis of performance of a sample of the domestic heat pumps installed in the UK under the Renewable Heat Premium Payment Scheme (RHPP)22 showed that about 62% of ASHP and 80% of GSHP achieved the minimum SPF.
6.95 Eurostat now requires that renewable heat statistics should include renewable heat from all heat pumps, including those with an SPF lower than the minimum required under RED. This edition of DUKES follows the Eurostat methodology.
Bioenergy and wastes (a) Landfill gas 6.96 Landfill gas is a methane-rich gas formed from the natural decomposition of organic material in landfill sites. The gas can be used to fuel reciprocating engines or turbines to generate electricity or used directly in kilns and boilers. In other countries, the gas is cleaned to pipeline quality or used as a vehicle fuel. Landfill gas exploitation benefited considerably from NFFO and this resulted in a large rise in electricity generation from 1992. The load factor continues to steadily decrease, as the gas producing resource becomes depleted. Landfill operators respond to reducing gas yields by removing modular generating sets when it is no longer economic to run. (b) Sewage sludge digestion 6.97 Sewage sludge digestion is the break down of the solid part of sewage by natural bacteria in a sealed tank in the absence of oxygen to produce a methane rich sewage gas. Some plants only use the sewage gas to generate heat but many use combined heat and power (CHP) systems, with the electricity generated being used on site or sold. Some sites also co-digest other feedstocks (e.g., food waste) with sewage sludge. (c) Domestic wood combustion 6.98 Wood has been used for home heating, cooking and hot water for many years. Traditionally, wood has been used in the form of logs in multi-fuel stoves and open fires. It is difficult to obtain information on domestic wood fuel use as wood is sourced from a wide range of sources, many of them informal. 6.99 Domestic wood consumption represents a sizeable contribution to UK renewable heat production. In 2015, BEIS commissioned a large scale survey of households in the UK to provide an updated baseline estimate. The results suggested that wood fuel use had previously been
22
Final report on analysis of heat pump data from the RHPP scheme. UCL energy institute, March 2017.
177
underestimated by a factor of three23. The survey confirmed that closed stoves and open fires remain the most common wood fuel appliances installed. These appliances are usually used to supply some of the home heating, although about 12% of wood fuel users use wood as their main fuel. Logs remain the most common form of wood fuel (90% of wood fuel users). The survey indicated a substantial contribution to domestic wood fuel supply from the informal sector including from farmers, garden contractors, self-supply, foraging, and use of discarded wood. 6.100 Wood fired boilers and wood pellet stoves are eligible for the domestic RHI. These appliances utilise mainly wood pellets and wood chips. Currently the proportion of wood pellets and wood chips fuelling these appliances remains a small proportion (about 4%) of the total domestic wood fuel use. (d) Non-domestic wood combustion 6.101 Use of sawmill residues, furniture manufacturing offcuts etc.as wood fuel (Industrial wood fuel use) has been included as a separate category since 1997. This wood is either used for heat or CHP in house, or is sold as wood fuel. Surveys in 2000 and 2006 showed that the in-house use of wood residues had declined due to the imposition of more stringent emissions controls. Since the introduction of the Renewable Heat Incentive (RHI) in 2011, there has been increased interest in the use of wood fuel. The wood fuel is sourced both from forestry and woodland management (Plant Biomass), and from in-house and recycled by-products (Industrial wood fuel). Typically wood fuel is used for space heating and hot water in commercial and public sector properties such as hotels, schools, hospitals, nursing homes, poultry farms, horticulture, and government buildings. The non-domestic RHI has supported some 9,365 GWh of heat from biomass, mostly wood, to December 2016 since its inception in November 2011. This is equivalent to some 1.5 million oven dried tonnes of commercial wood pellets. (e) Energy crops and forestry residues 6.102 Miscanthus and Short Rotation Coppice (SRC) are grown in the UK as energy crops intended for the heat and electricity energy markets. To date they have been burnt in power stations, CHP units and heating systems. Official area estimates of Miscanthus and SRC grown in England are available from 2008 in the Defra June survey of Agricultural statistics, and have been summarised by Defra24. These show that only small areas of these crops are currently planted in England, with estimates of about 6,900ha of Miscanthus and 2,900ha of SRC in 2015. Based on Renewables Obligation sustainability reporting data, Defra estimate that about 33,000 tonnes of UK Miscanthus and 15,000 tonnes of UK SRC was used in UK power stations in 2014/15. Data for 2016 are not yet available but are unlikely to be too dissimilar. (f) Straw combustion 6.103 Straw can be burnt in high temperature boilers, designed for the efficient and controlled combustion of solid fuels and biomass to supply heat, hot water and hot air systems; there are large numbers of these small-scale batch-fed whole-bale boilers. 6.104 There has also been a rapid growth in the number of straw-fired power stations, with schemes in the high straw production areas of the eastern parts of England at Ely, Cambridgeshire (40MW), Sleaford (45MW), Brigg (54.6MW) and Snetterton (45MW). (g) Waste combustion 6.105 Domestic, industrial and commercial wastes represent a significant resource for materials and energy recovery. Unprocessed wastes may be combusted in purpose built incinerators or the waste can be processed into a range of refuse derived fuels (RDF) for both on-site and off-site use. RDF can be partially processed to produce coarse RDF that can then be burnt in a variety of ways. By further processing the refuse, including separating off the fuel fraction, compacting, drying and densifying, it is possible to produce an RDF pellet. This pellet has around 60 per cent of the gross calorific value of British coal. Only the biodegradable portion of waste is counted in renewables statistics although non-biodegradable wastes are included in this chapter as “below the line” items. The paragraphs below describe various categories of waste combustion in greater detail.
23
Summary Results of the Domestic Wood Fuel survey. BEIS. Published in Energy Trends March 2016. www.gov.uk/government/publications/summary-results-of-the-domestic-wood-use-survey 24
www.gov.uk/government/statistics/area-of-crops-grown-for-bioenergy-in-england-and-the-uk-2008-2015
178
6.106 Municipal solid waste (MSW) combustion: MSW comprises domestic waste plus other feedstocks, such as, general industrial waste, building demolition waste and tree clippings from civil amenities. Sample areas for the analysis of household collected waste are selected using ACORN socio-economic profiles (ACORN stands for A Classification Of Residential Neighbourhoods). This is based on the premise that households of similar socio-economic characteristics are likely to have similar behavioural, purchasing and lifestyle characteristics; this will be reflected in the quantity and composition of waste that those households produce. Since 2014, approximately 50% of these feedstocks is considered to be biodegradable and therefore only this is taken into account when calculating the renewable statistics from this resource. These wastes are primarily burnt in purpose-built combustion facilities fitted with enhanced flue gas treatment. There is considerable interest in the use of Advanced Conversion Technologies (ACT) as an alternative treatment technology but there are known to be technical issues with several of the facilities. 6.107 General industrial waste (GIW) combustion: Certain wastes produced by industry and commerce can be used as a source of energy for industrial processes or space heating. These wastes include general waste from factories such as paper, cardboard, wood and plastics. A survey conducted in 2001 noted that GIW was now burnt in MSW waste-to-energy facilities. As no sites are solely burning GIW for heat or electricity generation, this feedstock is being handled under the MSW category. 6.108 Specialised waste combustion: Specialised wastes arise as a result of a particular activity or process. Materials in this category include scrap tyres, hospital wastes, poultry litter, meal and bone and farm waste digestion. 6.109 Specialist non-biodegradable waste. Although a dedicated tyre incineration plant with energy recovery has not generated since 2000, the cement industry has burned some waste tyres in its cement and lime kilns. Although part of waste tyre combustion is of biodegradable waste, this small biodegradable content has currently been included under non-biodegradable wastes in this chapter. 6.110 Hospital waste. The combustion of clinical waste has been used to produce both heat and electricity. The results of the survey showed an ongoing process of centralisation and consolidation, in response to changes in pollution emissions and clinical waste regulations. Generation has now focused on larger plants with many smaller facilities closing as the cost of compliance with regulations made them no longer viable. 6.111 Animal biomass. The first small-scale CHP poultry litter combustion project began generating towards the end of 1990 but was subsequently closed due to new emissions regulations. It provided useful data which resulted in the World’s first poultry litter-fired power station in 1992 closely followed by a second in 1993. Further schemes started generating in 1998, 2000 and 2001. One of the earlier poultry litter projects was modified to be fuelled mainly by meat and bone; two additional schemes fuelled primarily by meat and bone have also been built. (h) Anaerobic digestion (AD) 6.112 Anaerobic Digestion uses natural bacteria to break down biomass in a sealed tank in the absence of oxygen to produce a methane rich biogas. The biomass fuel includes wet wastes such as animal manures and slurries, crop residues and food waste and/ or purpose grown crops such as maize. The biogas can be used for process heat, or for heat and electricity generation using a combined heat and power unit. Alternatively, the biogas can be upgraded to biomethane by removal of the carbon dioxide and cleaning/ conditioning the gas for use in transport applications or injection into the gas grid. Increasingly the energy requirements for the biomethane production are provided by an on-site CHP powered by biogas. The CHP unit may also export excess electricity to the grid. 6.113 The indigestible material left after the AD process is called digestate. This is rich in nutrients and can be used as a fertilizer. Digestate can be used whole and spread on land. Alternatively, it can be separated into liquor and fibres. Separated fibre can be used fresh as a soil conditioner or, after further aerobic composting to stabilise it, used as a compost product.
179
(i) Co-firing of biomass with fossil fuels 6.114 Compared with dedicated renewable facilities, co-firing has a relatively low capital cost and is quick to implement. Biomass fuel is usually fed into a conventional power station boiler by means of the existing firing mechanism as a partial substitute for fossil fuel. The pulverised fuel preparation, transport and combustion system of a modern power plant may cope with approximately 5 - 10 per cent substitution without any major mechanical changes. The boiler design and airflows however may permit much higher percentages if the burner systems are modified. Specially designed burners have been introduced on some installations in the UK. Interest in co-firing has now waned as this will no longer be supported under the RO and has encouraged some stations to undergo conversion to dedicated biomass firing. (j) Biodiesel and bioethanol (Liquid Biofuels for Transport) 6.115 Biodiesel is a liquid fuel produced from biological sources of oils and fats by trans-esterification. The ester content of biodiesel is not less than 96.5 per cent by weight and the sulphur content must not exceed 0.005 per cent by weight25 Biodiesel can be blended in low proportions with fossil diesel for use in diesel engines. Diesel fuel currently sold at retail outlets in the UK can contain up to 7 per cent biodiesel. Biodiesel can be produced from oil crops, such as rapeseed and soy or from waste fats and oils. In 2015/16 the feedstock for biodiesel consumed in the UK for transport was almost entirely waste fats and oils26. 6.116 Bioethanol a liquid fuel consisting of ethanol produced from biomass. Bioethanol can be blended with petrol at low proportions for use in petrol engines. Petrol currently sold in at retail outlets in the UK can contain up to 5% bioethanol. Since March 2013 a revised petrol standard (EN228) allows retailers to sell petrol containing up to 10% ethanol by volume (E10), if appropriately labelled27. Bioethanol can be produced from sugar or starch from purpose grown crops such as corn (maize), wheat and sugar beet. It can also be produced from waste feedstocks such as sugar/ starch residues. In 2015/16 about 20% of bioethanol consumed in the UK was supplied from waste feedstocks.
Combined Heat and Power (CHP) 6.117 A CHP plant is an installation where useful heat and power (usually electricity) are supplied from a single generation process. Some CHP installations are fuelled either wholly or partially by renewable fuels. The main renewable fuel currently used in CHP is sewage gas, closely followed by other biomass. 6.118 Chapter 7 of this Digest summarises information on the contribution made by CHP to the UK’s energy requirements in 2010 to 2016 using the results of annual studies undertaken to identify all CHP schemes (CHPSTATS). Included in Tables 7.1 to 7.9 of that chapter is information on the contribution of renewable sources to CHP generation in each year from 2010 to 2016. Corresponding data for 1996 to 2008 are available on the BEIS section of the gov.uk website. The information contained in those tables is therefore a subset of the data contained within the tables presented in this chapter. There are occasionally differences in the numbers reported by CHPSTATS compared with RESTATS that are primarily attributed to whether the electricity is considered to come from ‘good quality’ CHP (further details on ‘good quality’ CHP are provided in Chapter 7). In addition, there are oddities with some CHP facilities where both biomass and fossil fuels are burnt (though not always as co-firing). The total installed capacity recorded for the site under CHPSTATS can cover multiple generators, some of which only handle fossil fuels (e.g. gas turbines). As it would be misleading to record the entire capacity reported in RESTATS as being potentially available for renewables generation, only the appropriate capacity figures are recorded.
Generating capacity and load factor 6.119 The electrical capacities are given in Table 6.4 as installed capacities i.e. the maximum continuous rating of the generating sets in the stations. In Chapter 5 Declared Net Capacity (DNC) is used, i.e. the maximum continuous rating of the generating sets in the stations, less the power
25
www.gov.uk/government/publications/excise-notice-179e-biofuels-and-other-fuel-substitutes/excise-notice-179e-biofuels-and-other-fuel-substitutes 26
RTFO year 8 report. www.gov.uk/government/statistics/biofuel-statistics-year-8-2015-to-2016-report-6 27
www.gov.uk/government/uploads/system/uploads/attachment_data/file/232126/petrol-protection-extention-ia.pdf

180
consumed by the plant itself, and reduced by a specified factor to take into account the intermittent nature of the energy source e.g. 0.43 for wind, 0.365 for small hydro, 0.33 for shoreline wave, and 0.17 for solar photovoltaics. DNC represents the nominal maximum capability of a generating set to supply electricity to consumers. For electrical capacities of generation using renewables in DNC terms see Table 6.1.1 on the BEIS section of the gov.uk website. 6.120 Plant load factors shown in Table 6.5 have been calculated in terms of installed capacity (i.e. the maximum continuous rating of the generating sets in the stations) and express the average hourly quantity of electricity generated as a percentage of the average of the capacities at the beginning and end of the year. Additionally, the unchanged configuration load factor has now been used for a number of years, which calculates the amount of electricity generated from wind farms compared with the amount that such turbines would have generated had they been available for the whole of the calendar year and running continually and at maximum output throughout the calendar year. 6.121 It is recognised that one of the shortcomings of the data contained in the Digest (end of calendar year) is that finalised ROCs data are often not available for several months following the compilation process for the Digest. In particular this can have an impact on the schemes included in the unchanged configuration definition as new data could include or remove particular schemes. This should be kept in mind if users wish to reanalyse these results.
Contacts: Liz Waters James Hemingway BEIS Energy Statistics Team BEIS Energy Statistics Team [email protected] [email protected] 0300 068 5735 0300 068 5042

181
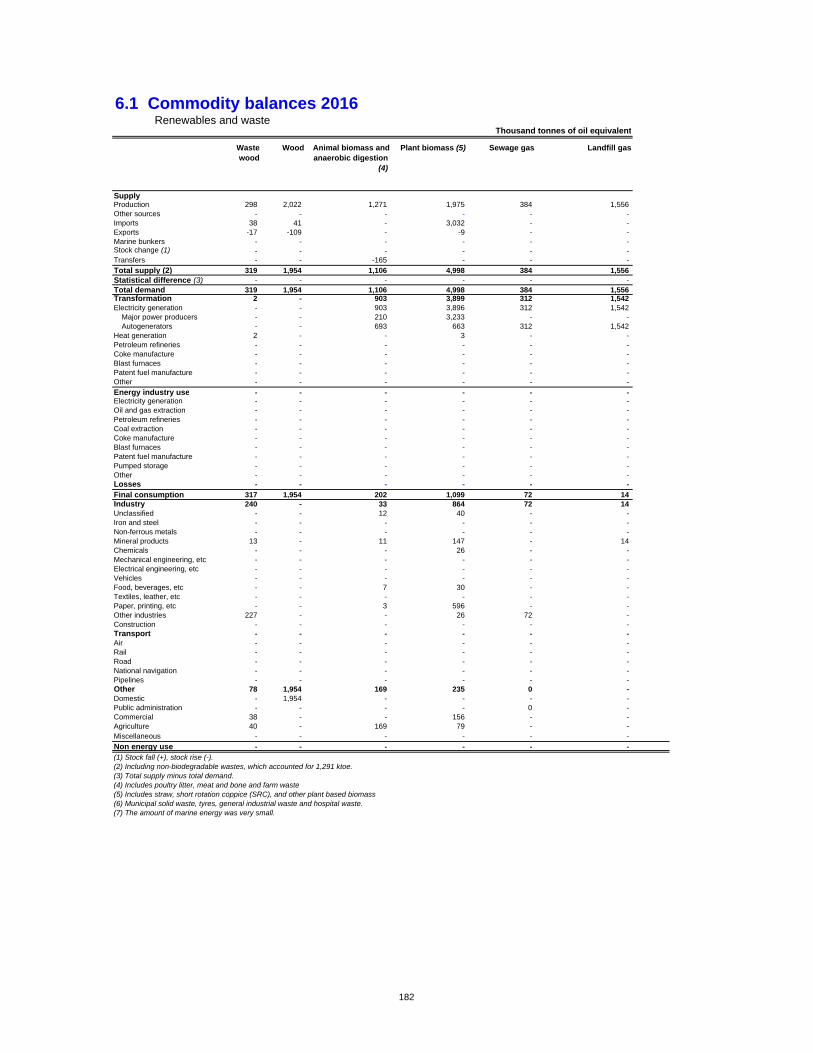
6.1 Commodity balances 2016 Renewables and waste
Waste wood
Wood Animal biomass and anaerobic digestion
(4)
Plant biomass (5) Sewage gas Landfill gas
SupplyProduction 298 2,022 1,271 1,975 384 1,556 Other sources - - - - - - Imports 38 41 - 3,032 - - Exports -17 -109 - -9 - - Marine bunkers - - - - - - Stock change (1) - - - - - - Transfers - - -165 - - -
Total supply (2) 319 1,954 1,106 4,998 384 1,556 Statistical difference (3) - - - - - - Total demand 319 1,954 1,106 4,998 384 1,556 Transformation 2 - 903 3,899 312 1,542 Electricity generation - - 903 3,896 312 1,542
Major power producers - - 210 3,233 - - Autogenerators - - 693 663 312 1,542
Heat generation 2 - - 3 - - Petroleum refineries - - - - - - Coke manufacture - - - - - - Blast furnaces - - - - - - Patent fuel manufacture - - - - - - Other - - - - - -
Energy industry use - - - - - - Electricity generation - - - - - - Oil and gas extraction - - - - - - Petroleum refineries - - - - - - Coal extraction - - - - - - Coke manufacture - - - - - - Blast furnaces - - - - - - Patent fuel manufacture - - - - - - Pumped storage - - - - - - Other - - - - - - Losses - - - - - -
Final consumption 317 1,954 202 1,099 72 14 Industry 240 - 33 864 72 14 Unclassified - - 12 40 - - Iron and steel - - - - - - Non-ferrous metals - - - - - - Mineral products 13 - 11 147 - 14 Chemicals - - - 26 - - Mechanical engineering, etc - - - - - - Electrical engineering, etc - - - - - - Vehicles - - - - - - Food, beverages, etc - - 7 30 - - Textiles, leather, etc - - - - - - Paper, printing, etc - - 3 596 - - Other industries 227 - - 26 72 - Construction - - - - - - Transport - - - - - - Air - - - - - - Rail - - - - - - Road - - - - - - National navigation - - - - - - Pipelines - - - - - - Other 78 1,954 169 235 0 - Domestic - 1,954 - - - - Public administration - - - - 0 - Commercial 38 - - 156 - - Agriculture 40 - 169 79 - - Miscellaneous - - - - - -
Non energy use - - - - - -
(1) Stock fall (+), stock rise (-).(2) Including non-biodegradable wastes, which accounted for 1,291 ktoe.(3) Total supply minus total demand.(4) Includes poultry litter, meat and bone and farm waste(5) Includes straw, short rotation coppice (SRC), and other plant based biomass(6) Municipal solid waste, tyres, general industrial waste and hospital waste.(7) The amount of marine energy was very small.
Thousand tonnes of oil equivalent
182
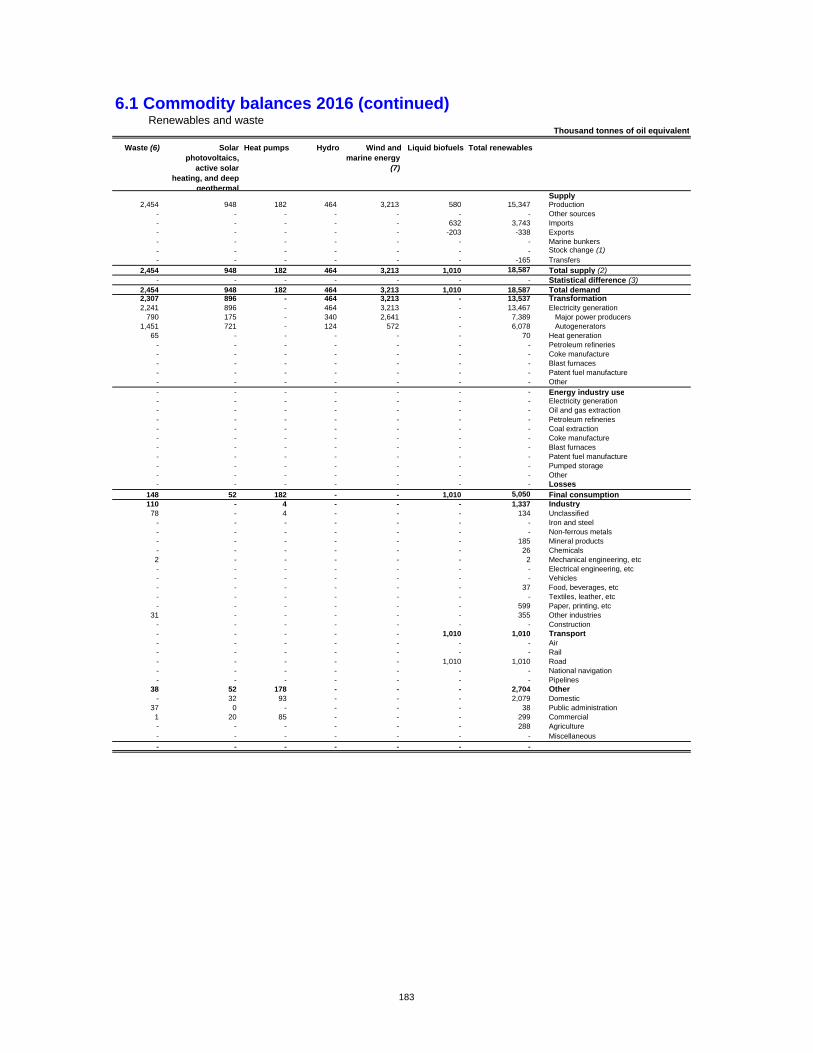
6.1 Commodity balances 2016 (continued) Renewables and waste
Waste (6) Solar photovoltaics,
active solar heating, and deep
geothermal
Heat pumps Hydro Wind and marine energy
(7)
Liquid biofuels Total renewables
Supply2,454 948 182 464 3,213 580 15,347 Production
- - - - - - - Other sources- - - - - 632 3,743 Imports- - - - - -203 -338 Exports- - - - - - - Marine bunkers- - - - - - - Stock change (1)- - - - - - -165 Transfers
2,454 948 182 464 3,213 1,010 18,587 Total supply (2)- - - - - - - Statistical difference (3)
2,454 948 182 464 3,213 1,010 18,587 Total demand2,307 896 - 464 3,213 - 13,537 Transformation2,241 896 - 464 3,213 - 13,467 Electricity generation
790 175 - 340 2,641 - 7,389 Major power producers1,451 721 - 124 572 - 6,078 Autogenerators
65 - - - - - 70 Heat generation- - - - - - - Petroleum refineries- - - - - - - Coke manufacture- - - - - - - Blast furnaces- - - - - - - Patent fuel manufacture- - - - - - - Other
- - - - - - - Energy industry use- - - - - - - Electricity generation- - - - - - - Oil and gas extraction- - - - - - - Petroleum refineries- - - - - - - Coal extraction- - - - - - - Coke manufacture- - - - - - - Blast furnaces- - - - - - - Patent fuel manufacture- - - - - - - Pumped storage- - - - - - - Other- - - - - - - Losses
148 52 182 - - 1,010 5,050 Final consumption110 - 4 - - - 1,337 Industry
78 - 4 - - - 134 Unclassified- - - - - - - Iron and steel- - - - - - - Non-ferrous metals- - - - - - 185 Mineral products- - - - - - 26 Chemicals2 - - - - - 2 Mechanical engineering, etc- - - - - - - Electrical engineering, etc- - - - - - - Vehicles- - - - - - 37 Food, beverages, etc- - - - - - - Textiles, leather, etc- - - - - - 599 Paper, printing, etc
31 - - - - - 355 Other industries- - - - - - - Construction- - - - - 1,010 1,010 Transport- - - - - - - Air- - - - - - - Rail- - - - - 1,010 1,010 Road- - - - - - - National navigation- - - - - - - Pipelines
38 52 178 - - - 2,704 Other- 32 93 - - - 2,079 Domestic
37 0 - - - - 38 Public administration1 20 85 - - - 299 Commercial- - - - - - 288 Agriculture- - - - - - - Miscellaneous
- - - - - - -
Thousand tonnes of oil equivalent
183
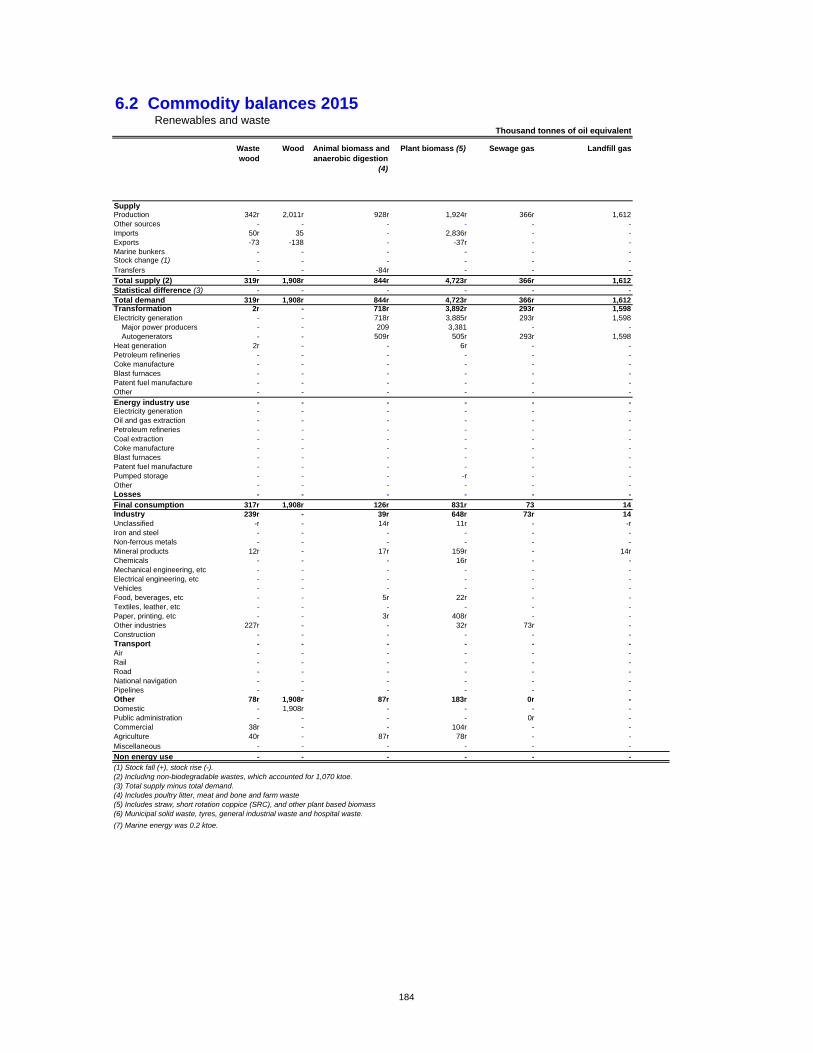
6.2 Commodity balances 2015 Renewables and waste
Waste wood
Wood Animal biomass and anaerobic digestion
(4)
Plant biomass (5) Sewage gas Landfill gas
SupplyProduction 342r 2,011r 928r 1,924r 366r 1,612Other sources - - - - - -Imports 50r 35 - 2,836r - -Exports -73 -138 - -37r - -Marine bunkers - - - - - -Stock change (1) - - - - - -Transfers - - -84r - - -
Total supply (2) 319r 1,908r 844r 4,723r 366r 1,612Statistical difference (3) - - - - - -Total demand 319r 1,908r 844r 4,723r 366r 1,612Transformation 2r - 718r 3,892r 293r 1,598Electricity generation - - 718r 3,885r 293r 1,598
Major power producers - - 209 3,381 - -Autogenerators - - 509r 505r 293r 1,598
Heat generation 2r - - 6r - -Petroleum refineries - - - - - -Coke manufacture - - - - - -Blast furnaces - - - - - -Patent fuel manufacture - - - - - -Other - - - - - -
Energy industry use - - - - - -Electricity generation - - - - - -Oil and gas extraction - - - - - -Petroleum refineries - - - - - -Coal extraction - - - - - -Coke manufacture - - - - - -Blast furnaces - - - - - -Patent fuel manufacture - - - - - -Pumped storage - - - -r - -Other - - - - - -Losses - - - - - -
Final consumption 317r 1,908r 126r 831r 73 14Industry 239r - 39r 648r 73r 14Unclassified -r - 14r 11r - -rIron and steel - - - - - -Non-ferrous metals - - - - - -Mineral products 12r - 17r 159r - 14rChemicals - - - 16r - -Mechanical engineering, etc - - - - - -Electrical engineering, etc - - - - - -Vehicles - - - - - -Food, beverages, etc - - 5r 22r - -Textiles, leather, etc - - - - - -Paper, printing, etc - - 3r 408r - -Other industries 227r - - 32r 73r -Construction - - - - - -Transport - - - - - -Air - - - - - -Rail - - - - - -Road - - - - - -National navigation - - - - - -Pipelines - - - - - -Other 78r 1,908r 87r 183r 0r -Domestic - 1,908r - - - -Public administration - - - - 0r -Commercial 38r - - 104r - -Agriculture 40r - 87r 78r - -Miscellaneous - - - - - -
Non energy use - - - - - -
(1) Stock fall (+), stock rise (-).(2) Including non-biodegradable wastes, which accounted for 1,070 ktoe.(3) Total supply minus total demand.(4) Includes poultry litter, meat and bone and farm waste(5) Includes straw, short rotation coppice (SRC), and other plant based biomass(6) Municipal solid waste, tyres, general industrial waste and hospital waste.
(7) Marine energy was 0.2 ktoe.
Thousand tonnes of oil equivalent
184
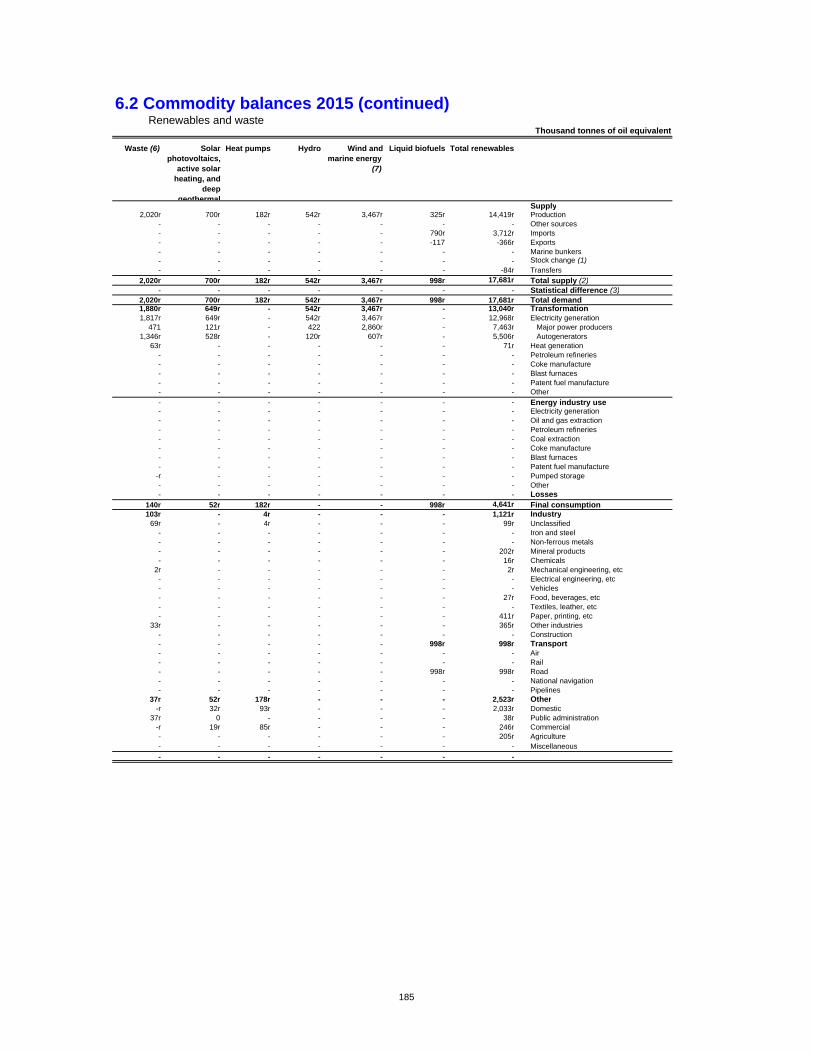
6.2 Commodity balances 2015 (continued) Renewables and waste
Waste (6) Solar photovoltaics,
active solar heating, and
deep geothermal
Heat pumps Hydro Wind and marine energy
(7)
Liquid biofuels Total renewables
Supply2,020r 700r 182r 542r 3,467r 325r 14,419r Production
- - - - - - - Other sources- - - - - 790r 3,712r Imports- - - - - -117 -366r Exports- - - - - - - Marine bunkers- - - - - - - Stock change (1)- - - - - - -84r Transfers
2,020r 700r 182r 542r 3,467r 998r 17,681r Total supply (2)- - - - - - - Statistical difference (3)
2,020r 700r 182r 542r 3,467r 998r 17,681r Total demand1,880r 649r - 542r 3,467r - 13,040r Transformation1,817r 649r - 542r 3,467r - 12,968r Electricity generation
471 121r - 422 2,860r - 7,463r Major power producers1,346r 528r - 120r 607r - 5,506r Autogenerators
63r - - - - - 71r Heat generation- - - - - - - Petroleum refineries- - - - - - - Coke manufacture- - - - - - - Blast furnaces- - - - - - - Patent fuel manufacture- - - - - - - Other
- - - - - - - Energy industry use- - - - - - - Electricity generation- - - - - - - Oil and gas extraction- - - - - - - Petroleum refineries- - - - - - - Coal extraction- - - - - - - Coke manufacture- - - - - - - Blast furnaces- - - - - - - Patent fuel manufacture
-r - - - - - - Pumped storage- - - - - - - Other- - - - - - - Losses
140r 52r 182r - - 998r 4,641r Final consumption103r - 4r - - - 1,121r Industry
69r - 4r - - - 99r Unclassified- - - - - - - Iron and steel- - - - - - - Non-ferrous metals- - - - - - 202r Mineral products- - - - - - 16r Chemicals
2r - - - - - 2r Mechanical engineering, etc- - - - - - - Electrical engineering, etc- - - - - - - Vehicles- - - - - - 27r Food, beverages, etc- - - - - - - Textiles, leather, etc- - - - - - 411r Paper, printing, etc
33r - - - - - 365r Other industries- - - - - - - Construction- - - - - 998r 998r Transport- - - - - - - Air- - - - - - - Rail- - - - - 998r 998r Road- - - - - - - National navigation- - - - - - - Pipelines
37r 52r 178r - - - 2,523r Other-r 32r 93r - - - 2,033r Domestic
37r 0 - - - - 38r Public administration-r 19r 85r - - - 246r Commercial- - - - - - 205r Agriculture- - - - - - - Miscellaneous
- - - - - - -
Thousand tonnes of oil equivalent
185
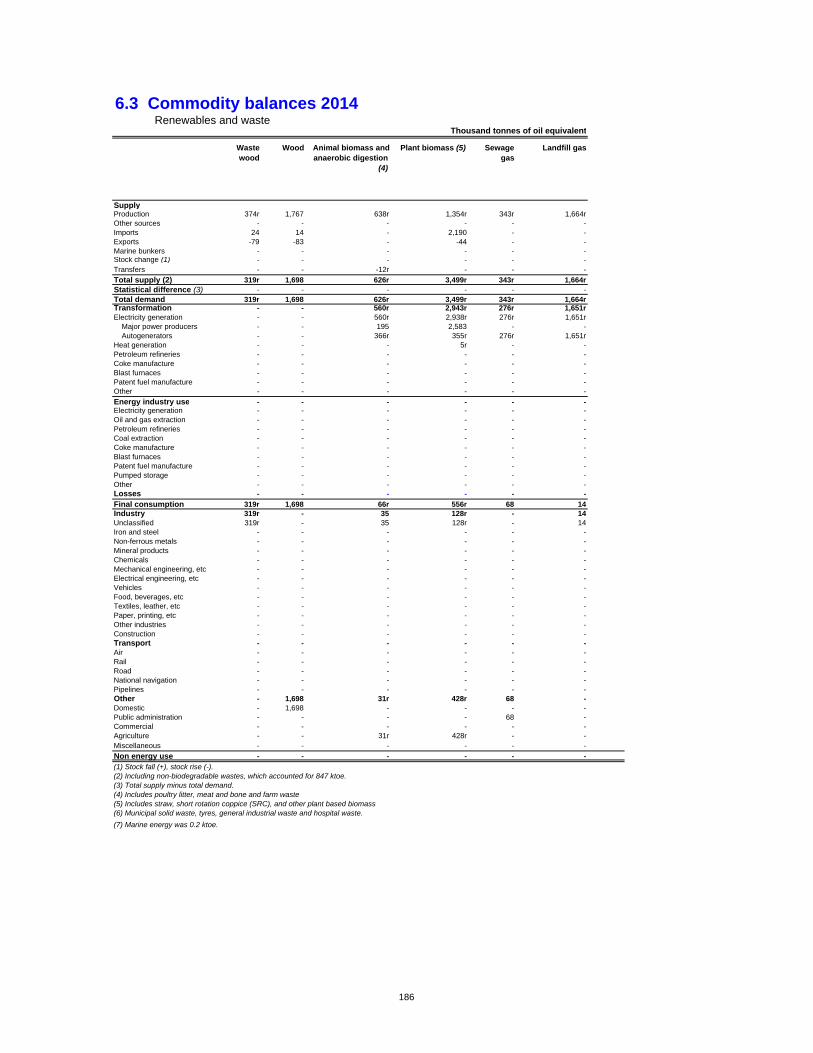
6.3 Commodity balances 2014 Renewables and waste
Waste wood
Wood Animal biomass and anaerobic digestion
(4)
Plant biomass (5) Sewage gas
Landfill gas
SupplyProduction 374r 1,767 638r 1,354r 343r 1,664rOther sources - - - - - -Imports 24 14 - 2,190 - -Exports -79 -83 - -44 - -Marine bunkers - - - - - -Stock change (1) - - - - - -Transfers - - -12r - - -
Total supply (2) 319r 1,698 626r 3,499r 343r 1,664rStatistical difference (3) - - - - - -Total demand 319r 1,698 626r 3,499r 343r 1,664rTransformation - - 560r 2,943r 276r 1,651rElectricity generation - - 560r 2,938r 276r 1,651r
Major power producers - - 195 2,583 - -Autogenerators - - 366r 355r 276r 1,651r
Heat generation - - - 5r - -Petroleum refineries - - - - - -Coke manufacture - - - - - -Blast furnaces - - - - - -Patent fuel manufacture - - - - - -Other - - - - - -
Energy industry use - - - - - -Electricity generation - - - - - -Oil and gas extraction - - - - - -Petroleum refineries - - - - - -Coal extraction - - - - - -Coke manufacture - - - - - -Blast furnaces - - - - - -Patent fuel manufacture - - - - - -Pumped storage - - - - - -Other - - - - - -Losses - - - - - -
Final consumption 319r 1,698 66r 556r 68 14Industry 319r - 35 128r - 14Unclassified 319r - 35 128r - 14Iron and steel - - - - - -Non-ferrous metals - - - - - -Mineral products - - - - - -Chemicals - - - - - -Mechanical engineering, etc - - - - - -Electrical engineering, etc - - - - - -Vehicles - - - - - -Food, beverages, etc - - - - - -Textiles, leather, etc - - - - - -Paper, printing, etc - - - - - -Other industries - - - - - -Construction - - - - - -Transport - - - - - -Air - - - - - -Rail - - - - - -Road - - - - - -National navigation - - - - - -Pipelines - - - - - -Other - 1,698 31r 428r 68 -Domestic - 1,698 - - - -Public administration - - - - 68 -Commercial - - - - - -Agriculture - - 31r 428r - -Miscellaneous - - - - - -
Non energy use - - - - - -
(1) Stock fall (+), stock rise (-).(2) Including non-biodegradable wastes, which accounted for 847 ktoe.(3) Total supply minus total demand.(4) Includes poultry litter, meat and bone and farm waste(5) Includes straw, short rotation coppice (SRC), and other plant based biomass(6) Municipal solid waste, tyres, general industrial waste and hospital waste.
(7) Marine energy was 0.2 ktoe.
Thousand tonnes of oil equivalent
186
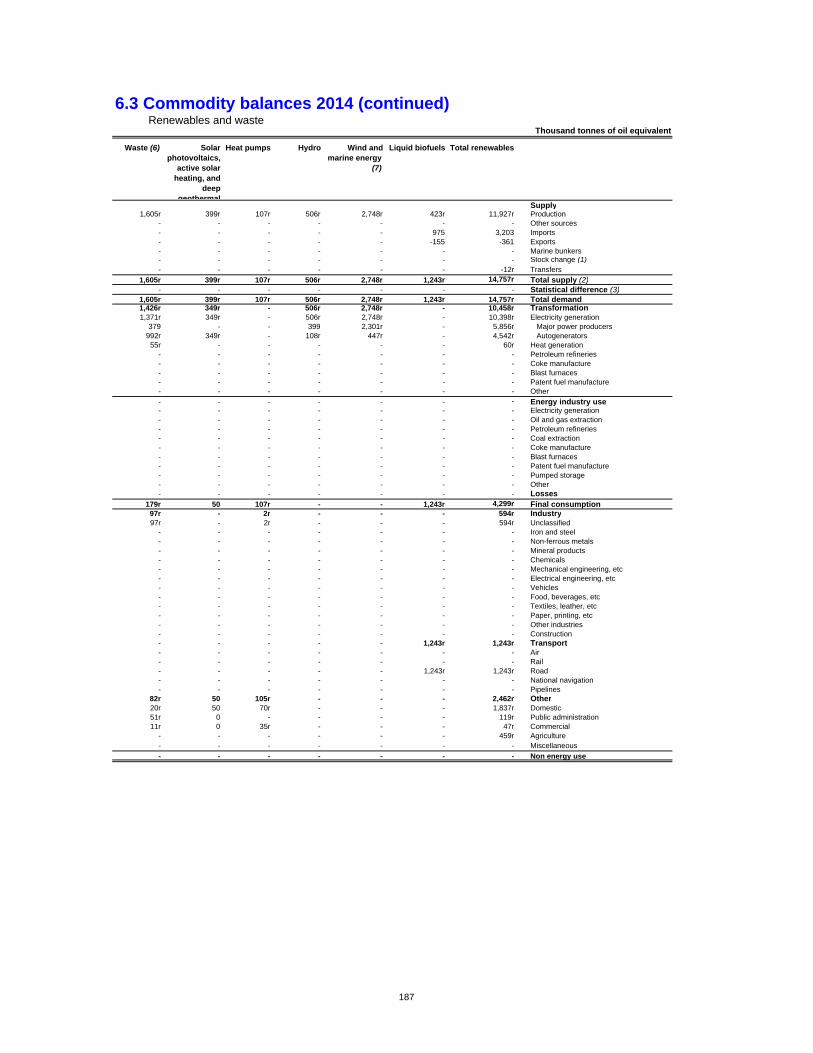
6.3 Commodity balances 2014 (continued) Renewables and waste
Waste (6) Solar photovoltaics,
active solar heating, and
deep geothermal
Heat pumps Hydro Wind and marine energy
(7)
Liquid biofuels Total renewables
Supply1,605r 399r 107r 506r 2,748r 423r 11,927r Production
- - - - - - - Other sources- - - - - 975 3,203 Imports- - - - - -155 -361 Exports- - - - - - - Marine bunkers- - - - - - - Stock change (1)- - - - - - -12r Transfers
1,605r 399r 107r 506r 2,748r 1,243r 14,757r Total supply (2)- - - - - - - Statistical difference (3)
1,605r 399r 107r 506r 2,748r 1,243r 14,757r Total demand1,426r 349r - 506r 2,748r - 10,458r Transformation1,371r 349r - 506r 2,748r - 10,398r Electricity generation
379 - - 399 2,301r - 5,856r Major power producers992r 349r - 108r 447r - 4,542r Autogenerators
55r - - - - - 60r Heat generation- - - - - - - Petroleum refineries- - - - - - - Coke manufacture- - - - - - - Blast furnaces- - - - - - - Patent fuel manufacture- - - - - - - Other
- - - - - - - Energy industry use- - - - - - - Electricity generation- - - - - - - Oil and gas extraction- - - - - - - Petroleum refineries- - - - - - - Coal extraction- - - - - - - Coke manufacture- - - - - - - Blast furnaces- - - - - - - Patent fuel manufacture- - - - - - - Pumped storage- - - - - - - Other- - - - - - - Losses
179r 50 107r - - 1,243r 4,299r Final consumption97r - 2r - - - 594r Industry97r - 2r - - - 594r Unclassified
- - - - - - - Iron and steel- - - - - - - Non-ferrous metals- - - - - - - Mineral products- - - - - - - Chemicals- - - - - - - Mechanical engineering, etc- - - - - - - Electrical engineering, etc- - - - - - - Vehicles- - - - - - - Food, beverages, etc- - - - - - - Textiles, leather, etc- - - - - - - Paper, printing, etc- - - - - - - Other industries- - - - - - - Construction- - - - - 1,243r 1,243r Transport- - - - - - - Air- - - - - - - Rail- - - - - 1,243r 1,243r Road- - - - - - - National navigation- - - - - - - Pipelines
82r 50 105r - - - 2,462r Other20r 50 70r - - - 1,837r Domestic51r 0 - - - - 119r Public administration11r 0 35r - - - 47r Commercial
- - - - - - 459r Agriculture- - - - - - - Miscellaneous
- - - - - - - Non energy use
Thousand tonnes of oil equivalent
187
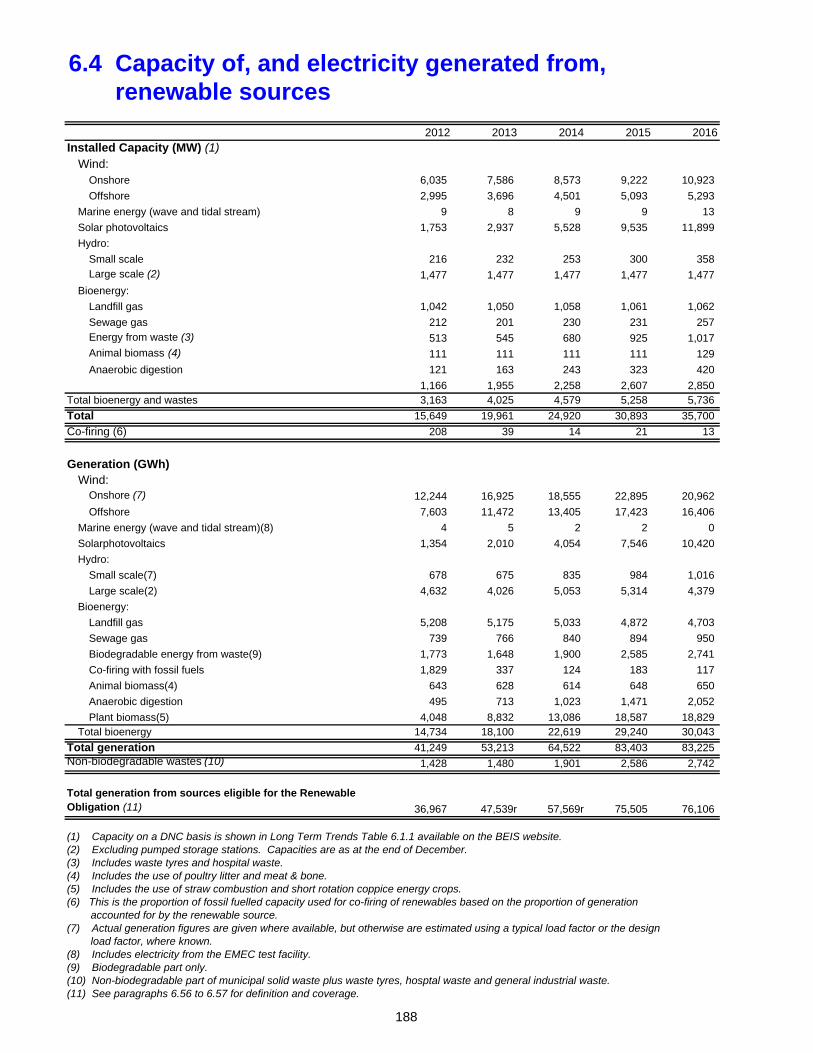
6.4 Capacity of, and electricity generated from, renewable sources
2012 2013 2014 2015 2016Installed Capacity (MW) (1)
Wind:Onshore 6,035 7,586 8,573 9,222 10,923
Offshore 2,995 3,696 4,501 5,093 5,293
Marine energy (wave and tidal stream) 9 8 9 9 13
Solar photovoltaics 1,753 2,937 5,528 9,535 11,899
Hydro:
Small scale 216 232 253 300 358 Large scale (2) 1,477 1,477 1,477 1,477 1,477
Bioenergy:
Landfill gas 1,042 1,050 1,058 1,061 1,062
Sewage gas 212 201 230 231 257 Energy from waste (3) 513 545 680 925 1,017 Animal biomass (4) 111 111 111 111 129
Anaerobic digestion 121 163 243 323 420
1,166 1,955 2,258 2,607 2,850 Total bioenergy and wastes 3,163 4,025 4,579 5,258 5,736
Total 15,649 19,961 24,920 30,893 35,700
Co-firing (6) 208 39 14 21 13
Generation (GWh)Wind:
Onshore (7) 12,244 16,925 18,555 22,895 20,962
Offshore 7,603 11,472 13,405 17,423 16,406
Marine energy (wave and tidal stream)(8) 4 5 2 2 0
Solarphotovoltaics 1,354 2,010 4,054 7,546 10,420
Hydro:
Small scale(7) 678 675 835 984 1,016
Large scale(2) 4,632 4,026 5,053 5,314 4,379
Bioenergy:
Landfill gas 5,208 5,175 5,033 4,872 4,703
Sewage gas 739 766 840 894 950
Biodegradable energy from waste(9) 1,773 1,648 1,900 2,585 2,741
Co-firing with fossil fuels 1,829 337 124 183 117
Animal biomass(4) 643 628 614 648 650
Anaerobic digestion 495 713 1,023 1,471 2,052
Plant biomass(5) 4,048 8,832 13,086 18,587 18,829 Total bioenergy 14,734 18,100 22,619 29,240 30,043
Total generation 41,249 53,213 64,522 83,403 83,225 Non-biodegradable wastes (10) 1,428 1,480 1,901 2,586 2,742
Total generation from sources eligible for the Renewable Obligation (11) 36,967 47,539r 57,569r 75,505 76,106
(1) Capacity on a DNC basis is shown in Long Term Trends Table 6.1.1 available on the BEIS website.(2) Excluding pumped storage stations. Capacities are as at the end of December. (3) Includes waste tyres and hospital waste. (4) Includes the use of poultry litter and meat & bone. (5) Includes the use of straw combustion and short rotation coppice energy crops.(6) This is the proportion of fossil fuelled capacity used for co-firing of renewables based on the proportion of generation accounted for by the renewable source.(7) Actual generation figures are given where available, but otherwise are estimated using a typical load factor or the design load factor, where known.(8) Includes electricity from the EMEC test facility.(9) Biodegradable part only.(10) Non-biodegradable part of municipal solid waste plus waste tyres, hosptal waste and general industrial waste.(11) See paragraphs 6.56 to 6.57 for definition and coverage.
188
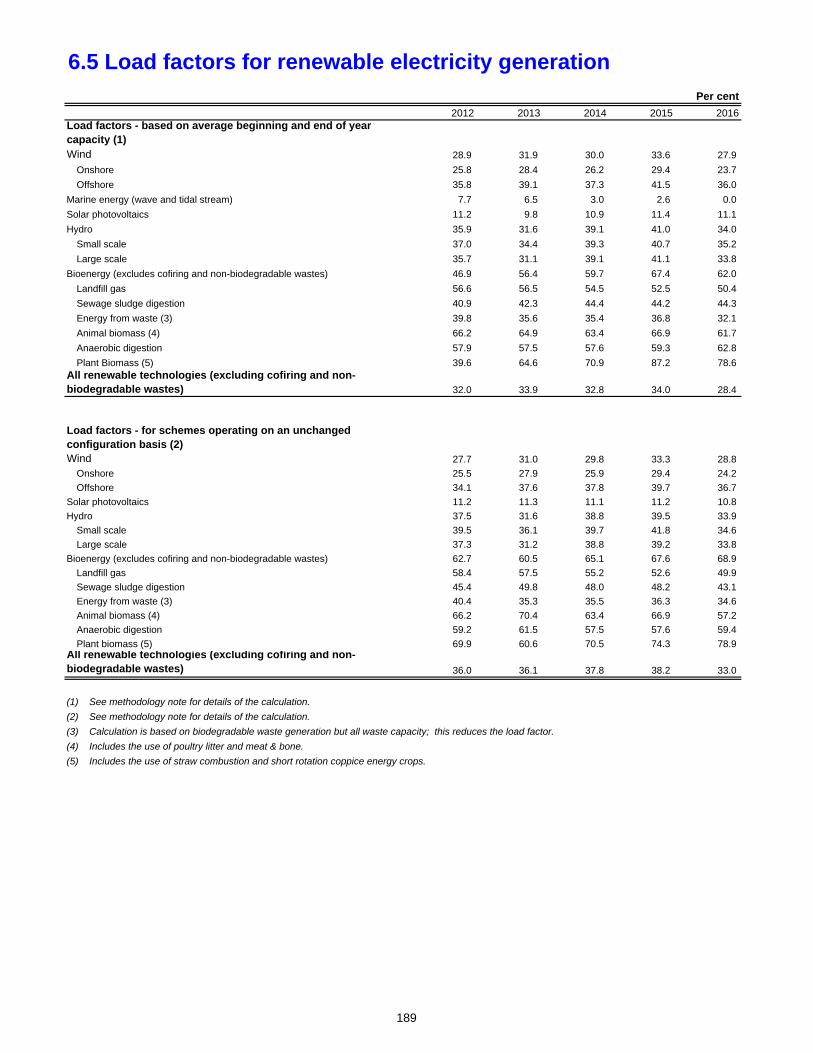
6.5 Load factors for renewable electricity generation
Per cent
2012 2013 2014 2015 2016Load factors - based on average beginning and end of year capacity (1)Wind 28.9 31.9 30.0 33.6 27.9
Onshore 25.8 28.4 26.2 29.4 23.7
Offshore 35.8 39.1 37.3 41.5 36.0
Marine energy (wave and tidal stream) 7.7 6.5 3.0 2.6 0.0
Solar photovoltaics 11.2 9.8 10.9 11.4 11.1
Hydro 35.9 31.6 39.1 41.0 34.0
Small scale 37.0 34.4 39.3 40.7 35.2
Large scale 35.7 31.1 39.1 41.1 33.8
Bioenergy (excludes cofiring and non-biodegradable wastes) 46.9 56.4 59.7 67.4 62.0
Landfill gas 56.6 56.5 54.5 52.5 50.4
Sewage sludge digestion 40.9 42.3 44.4 44.2 44.3
Energy from waste (3) 39.8 35.6 35.4 36.8 32.1
Animal biomass (4) 66.2 64.9 63.4 66.9 61.7
Anaerobic digestion 57.9 57.5 57.6 59.3 62.8
Plant Biomass (5) 39.6 64.6 70.9 87.2 78.6 All renewable technologies (excluding cofiring and non-biodegradable wastes) 32.0 33.9 32.8 34.0 28.4
Load factors - for schemes operating on an unchanged configuration basis (2)Wind 27.7 31.0 29.8 33.3 28.8
Onshore 25.5 27.9 25.9 29.4 24.2
Offshore 34.1 37.6 37.8 39.7 36.7
Solar photovoltaics 11.2 11.3 11.1 11.2 10.8
Hydro 37.5 31.6 38.8 39.5 33.9
Small scale 39.5 36.1 39.7 41.8 34.6
Large scale 37.3 31.2 38.8 39.2 33.8
Bioenergy (excludes cofiring and non-biodegradable wastes) 62.7 60.5 65.1 67.6 68.9
Landfill gas 58.4 57.5 55.2 52.6 49.9
Sewage sludge digestion 45.4 49.8 48.0 48.2 43.1
Energy from waste (3) 40.4 35.3 35.5 36.3 34.6
Animal biomass (4) 66.2 70.4 63.4 66.9 57.2
Anaerobic digestion 59.2 61.5 57.5 57.6 59.4
Plant biomass (5) 69.9 60.6 70.5 74.3 78.9 All renewable technologies (excluding cofiring and non-biodegradable wastes) 36.0 36.1 37.8 38.2 33.0
(1) See methodology note for details of the calculation.
(2) See methodology note for details of the calculation.
(3) Calculation is based on biodegradable waste generation but all waste capacity; this reduces the load factor.
(4) Includes the use of poultry litter and meat & bone.
(5) Includes the use of straw combustion and short rotation coppice energy crops.
189
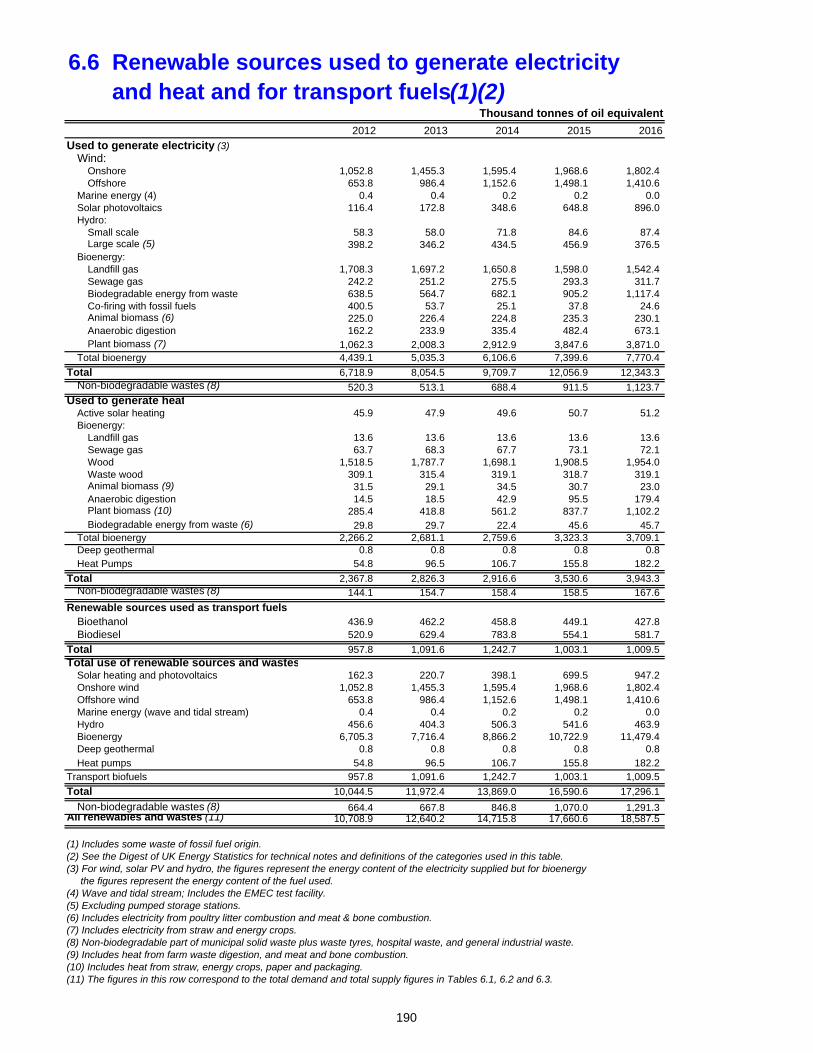
6.6 Renewable sources used to generate electricity and heat and for transport fuels(1)(2)
Thousand tonnes of oil equivalent
2012 2013 2014 2015 2016
Used to generate electricity (3)Wind:
Onshore 1,052.8 1,455.3 1,595.4 1,968.6 1,802.4 Offshore 653.8 986.4 1,152.6 1,498.1 1,410.6
Marine energy (4) 0.4 0.4 0.2 0.2 0.0 Solar photovoltaics 116.4 172.8 348.6 648.8 896.0 Hydro:
Small scale 58.3 58.0 71.8 84.6 87.4 Large scale (5) 398.2 346.2 434.5 456.9 376.5
Bioenergy:Landfill gas 1,708.3 1,697.2 1,650.8 1,598.0 1,542.4 Sewage gas 242.2 251.2 275.5 293.3 311.7 Biodegradable energy from waste 638.5 564.7 682.1 905.2 1,117.4 Co-firing with fossil fuels 400.5 53.7 25.1 37.8 24.6 Animal biomass (6) 225.0 226.4 224.8 235.3 230.1 Anaerobic digestion 162.2 233.9 335.4 482.4 673.1 Plant biomass (7) 1,062.3 2,008.3 2,912.9 3,847.6 3,871.0
Total bioenergy 4,439.1 5,035.3 6,106.6 7,399.6 7,770.4
Total 6,718.9 8,054.5 9,709.7 12,056.9 12,343.3 Non-biodegradable wastes (8) 520.3 513.1 688.4 911.5 1,123.7
Used to generate heatActive solar heating 45.9 47.9 49.6 50.7 51.2 Bioenergy:
Landfill gas 13.6 13.6 13.6 13.6 13.6 Sewage gas 63.7 68.3 67.7 73.1 72.1 Wood 1,518.5 1,787.7 1,698.1 1,908.5 1,954.0 Waste wood 309.1 315.4 319.1 318.7 319.1 Animal biomass (9) 31.5 29.1 34.5 30.7 23.0 Anaerobic digestion 14.5 18.5 42.9 95.5 179.4 Plant biomass (10) 285.4 418.8 561.2 837.7 1,102.2 Biodegradable energy from waste (6) 29.8 29.7 22.4 45.6 45.7
Total bioenergy 2,266.2 2,681.1 2,759.6 3,323.3 3,709.1 Deep geothermal 0.8 0.8 0.8 0.8 0.8 Heat Pumps 54.8 96.5 106.7 155.8 182.2
Total 2,367.8 2,826.3 2,916.6 3,530.6 3,943.3 Non-biodegradable wastes (8) 144.1 154.7 158.4 158.5 167.6
Renewable sources used as transport fuelsBioethanol 436.9 462.2 458.8 449.1 427.8 Biodiesel 520.9 629.4 783.8 554.1 581.7
Total 957.8 1,091.6 1,242.7 1,003.1 1,009.5 Total use of renewable sources and wastes
Solar heating and photovoltaics 162.3 220.7 398.1 699.5 947.2 Onshore wind 1,052.8 1,455.3 1,595.4 1,968.6 1,802.4 Offshore wind 653.8 986.4 1,152.6 1,498.1 1,410.6 Marine energy (wave and tidal stream) 0.4 0.4 0.2 0.2 0.0 Hydro 456.6 404.3 506.3 541.6 463.9 Bioenergy 6,705.3 7,716.4 8,866.2 10,722.9 11,479.4 Deep geothermal 0.8 0.8 0.8 0.8 0.8
Heat pumps 54.8 96.5 106.7 155.8 182.2 Transport biofuels 957.8 1,091.6 1,242.7 1,003.1 1,009.5
Total 10,044.5 11,972.4 13,869.0 16,590.6 17,296.1
Non-biodegradable wastes (8) 664.4 667.8 846.8 1,070.0 1,291.3 All renewables and wastes (11) 10,708.9 12,640.2 14,715.8 17,660.6 18,587.5
(1) Includes some waste of fossil fuel origin.(2) See the Digest of UK Energy Statistics for technical notes and definitions of the categories used in this table.(3) For wind, solar PV and hydro, the figures represent the energy content of the electricity supplied but for bioenergy the figures represent the energy content of the fuel used.(4) Wave and tidal stream; Includes the EMEC test facility.(5) Excluding pumped storage stations.(6) Includes electricity from poultry litter combustion and meat & bone combustion.(7) Includes electricity from straw and energy crops.(8) Non-biodegradable part of municipal solid waste plus waste tyres, hospital waste, and general industrial waste.(9) Includes heat from farm waste digestion, and meat and bone combustion.(10) Includes heat from straw, energy crops, paper and packaging.(11) The figures in this row correspond to the total demand and total supply figures in Tables 6.1, 6.2 and 6.3.
190
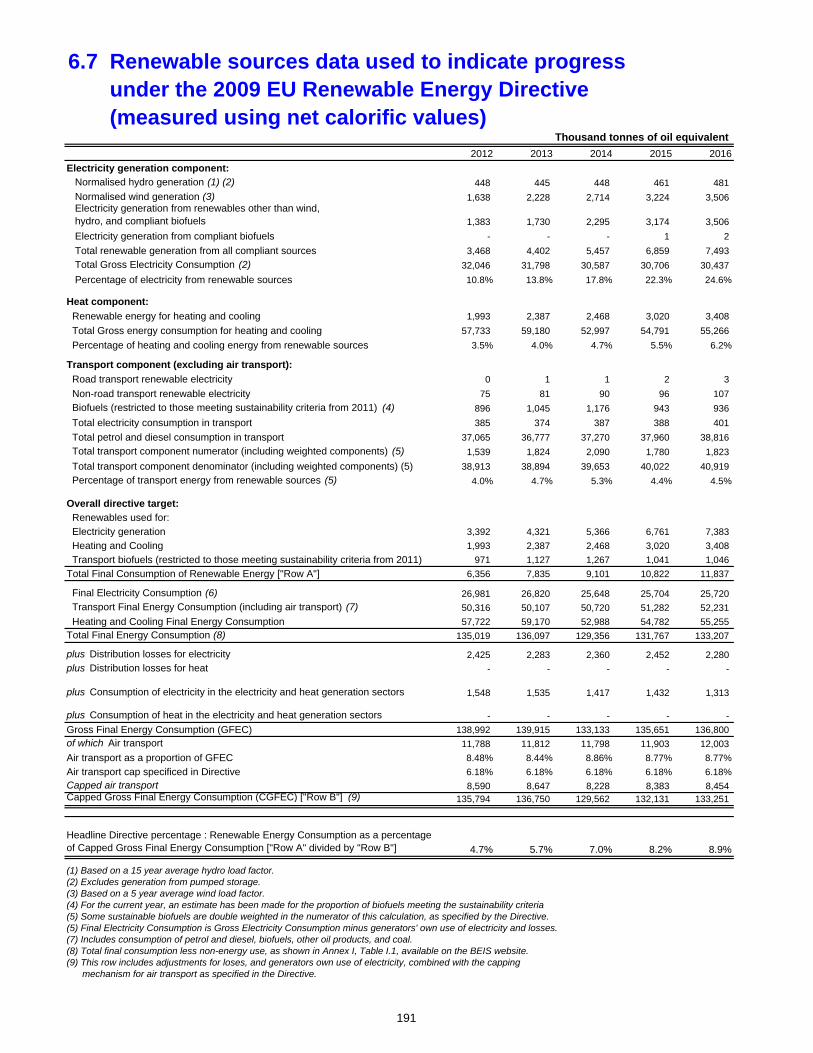
6.7 Renewable sources data used to indicate progress under the 2009 EU Renewable Energy Directive (measured using net calorific values)
Thousand tonnes of oil equivalent
2012 2013 2014 2015 2016
Electricity generation component: Normalised hydro generation (1) (2) 448 445 448 461 481
Normalised wind generation (3) 1,638 2,228 2,714 3,224 3,506 Electricity generation from renewables other than wind, hydro, and compliant biofuels 1,383 1,730 2,295 3,174 3,506
Electricity generation from compliant biofuels - - - 1 2
Total renewable generation from all compliant sources 3,468 4,402 5,457 6,859 7,493
Total Gross Electricity Consumption (2) 32,046 31,798 30,587 30,706 30,437
Percentage of electricity from renewable sources 10.8% 13.8% 17.8% 22.3% 24.6%
Heat component:
Renewable energy for heating and cooling 1,993 2,387 2,468 3,020 3,408
Total Gross energy consumption for heating and cooling 57,733 59,180 52,997 54,791 55,266
Percentage of heating and cooling energy from renewable sources 3.5% 4.0% 4.7% 5.5% 6.2%
Transport component (excluding air transport):
Road transport renewable electricity 0 1 1 2 3
Non-road transport renewable electricity 75 81 90 96 107
Biofuels (restricted to those meeting sustainability criteria from 2011) (4) 896 1,045 1,176 943 936
Total electricity consumption in transport 385 374 387 388 401
Total petrol and diesel consumption in transport 37,065 36,777 37,270 37,960 38,816
Total transport component numerator (including weighted components) (5) 1,539 1,824 2,090 1,780 1,823
Total transport component denominator (including weighted components) (5) 38,913 38,894 39,653 40,022 40,919
Percentage of transport energy from renewable sources (5) 4.0% 4.7% 5.3% 4.4% 4.5%
Overall directive target:
Renewables used for:
Electricity generation 3,392 4,321 5,366 6,761 7,383
Heating and Cooling 1,993 2,387 2,468 3,020 3,408
Transport biofuels (restricted to those meeting sustainability criteria from 2011) 971 1,127 1,267 1,041 1,046
Total Final Consumption of Renewable Energy ["Row A"] 6,356 7,835 9,101 10,822 11,837
Final Electricity Consumption (6) 26,981 26,820 25,648 25,704 25,720
Transport Final Energy Consumption (including air transport) (7) 50,316 50,107 50,720 51,282 52,231
Heating and Cooling Final Energy Consumption 57,722 59,170 52,988 54,782 55,255
Total Final Energy Consumption (8) 135,019 136,097 129,356 131,767 133,207
plus Distribution losses for electricity 2,425 2,283 2,360 2,452 2,280
plus Distribution losses for heat - - - - -
plus Consumption of electricity in the electricity and heat generation sectors 1,548 1,535 1,417 1,432 1,313
plus Consumption of heat in the electricity and heat generation sectors - - - - -
Gross Final Energy Consumption (GFEC) 138,992 139,915 133,133 135,651 136,800
of which Air transport 11,788 11,812 11,798 11,903 12,003
Air transport as a proportion of GFEC 8.48% 8.44% 8.86% 8.77% 8.77%
Air transport cap specificed in Directive 6.18% 6.18% 6.18% 6.18% 6.18%
Capped air transport 8,590 8,647 8,228 8,383 8,454 Capped Gross Final Energy Consumption (CGFEC) ["Row B"] (9) 135,794 136,750 129,562 132,131 133,251
Headline Directive percentage : Renewable Energy Consumption as a percentage of Capped Gross Final Energy Consumption ["Row A" divided by "Row B"] 4.7% 5.7% 7.0% 8.2% 8.9%
(1) Based on a 15 year average hydro load factor.(2) Excludes generation from pumped storage.(3) Based on a 5 year average wind load factor.(4) For the current year, an estimate has been made for the proportion of biofuels meeting the sustainability criteria(5) Some sustainable biofuels are double weighted in the numerator of this calculation, as specified by the Directive.(5) Final Electricity Consumption is Gross Electricity Consumption minus generators' own use of electricity and losses.(7) Includes consumption of petrol and diesel, biofuels, other oil products, and coal.(8) Total final consumption less non-energy use, as shown in Annex I, Table I.1, available on the BEIS website.(9) This row includes adjustments for loses, and generators own use of electricity, combined with the capping mechanism for air transport as specified in the Directive.
191

192
193
Chapter 7 Combined heat and power
Introduction 7.1 This chapter sets out the contribution made by Combined Heat and Power (CHP) to the United Kingdom’s energy requirements. The data presented in this chapter have been derived from information submitted to the CHP Quality Assurance programme (CHPQA) or by following the CHPQA methodology in respect of data obtained from other sources. The CHPQA programme was introduced by the Government to provide the methods and procedures to assess and certify the quality of the full range of CHP schemes. It is a rigorous system for the Government to ensure that the incentives on offer are targeted fairly and benefit schemes in relation to their environmental performance. 7.2 CHP is the simultaneous generation of usable heat and power (usually electricity) in a single process. The term CHP is synonymous with cogeneration, which is commonly used in other Member States of the European Community and the United States. CHP uses a variety of fuels and technologies across a wide range of sizes and applications. The basic elements of a CHP plant comprise one or more prime movers (a reciprocating engine, gas turbine or Rankine cycle turbine using steam or organic fluids) driving electrical generators, with the heat generated in the process captured and put to further productive use, such as for industrial processes, hot water and space heating or cooling.
7.3 CHP is typically sized to make use of the available heat1, and connected to the lower voltage distribution system (i.e. embedded). This means that unlike conventional power stations, CHP can provide efficiency gains by avoiding significant transmission and distribution losses. These gains are reflected in the calculation of CO2 savings delivered by CHP (see 7.27-7.28). CHP can also provide
important network services such as black start2, improvements to power quality, and some have the ability to operate in island mode if the grid goes down. There are five principal types of CHP system: steam turbine, gas turbine, combined cycle systems, reciprocating engines and Organic Rankine Cycle (ORC) systems. Each of these is defined in paragraph 7.35 later in this chapter.
1 But not always, see paragraph 7.4. In such cases there is an impact upon the electrical capacity and electrical output classified as CHP. 2 Black start is the capability to operate in island mode if the grid goes down.
Key Points
The Good Quality CHP capacity fell by 159 MWe between 2015 and 2016 from 5,730 MWe to 5,571 MWe. (Table 7A)
The amount of good quality electricity produced in 2016 was 20.1 TWh (Table 7.4), which is 2.6 per cent higher than in 2015. The good quality electricity generated by CHP in 2016 corresponds to 6.3 per cent of all electricity supplied in the UK.
Seventy-one percent of the fuel used in CHP schemes was natural gas. This is 1.1 percentage points higher than in 2015. In 2016, the share of total fuel that was renewable was 12 per cent, a 0.7 percentage point increase between 2015 and 2016.
The Oil and Gas sector has the largest Good Quality CHP capacity (40 per cent), followed by the Chemicals sector (20 per cent), the Transport Commerce and Administration sector (9 per cent) and then the Food and Drink sector (8 per cent). The Paper sector is now only the sixth largest sector in terms of installed capacity. As recently as 2014 the Paper sector was the third largest sector.
The absolute CO2 savings delivered by CHP in 2016 were lower than in 2015. This is due to the provisional values for CO2 intensity of electricity displaced by CHP electricity being substantially lower in 2016 than in 2015, rather than falls in the outputs of CHP or efficiency of operation.
194
UK energy markets, and their effect on CHP 7.4 Two major factors affecting the economics of CHP are the relative cost of fuel (principally natural gas) and the value that can be realised for electricity both for own use and export. This is known as the spark gap (i.e. the difference between the price of electricity and the price of the gas required to generate that electricity). Energy price trends that are applicable to CHP schemes differ depending upon the size and sector of the scheme. At the start of 2013 the spark gap started to increase and has done so each quarter since. While longer term, sustained improvements in the spark gap would be necessary to encourage investment in new CHP capacity, there is evidence that the improvements to date have encouraged some large schemes to generate more electricity. This evidence is a sharp increase in the Load Factor (actual) compared to a modest increase in the Load Factor (CHPQA), as shown in Table 7A. The Load Factor (actual) in 2016 was at its highest level since 2008, while the Load Factor (CHPQA) in 2016 was at its highest level since 2012.
Use of CHPQA in producing CHP statistics 7.5 The CHPQA programme is the major source for CHP statistics. The following factors need to be considered when using the statistics produced:
Through CHPQA, scheme operators have been given guidance on how to determine the boundary of a CHP scheme (what is regarded as part of the CHP installation and what is not). A scheme
can include multiple CHP prime movers3, along with supplementary boilers and generating plant, subject to appropriate metering being installed to support the CHP scheme boundaries proposed, and subject to appropriate metering and threshold criteria. (See CHPQA Guidance Note 11 available at www.gov.uk/chpqa-guidance-notes). This point is relevant when considering the figures in Table 7D, where the power efficiencies, heat efficiencies and heat to power ratios stated in that table for 2016 are those of the scheme, which may not be just the prime mover.
The output of a scheme is based on gross power output. This means that power consumed by parasitic plant such as pumps and fans is included in the power output of the scheme.
The main purpose of a number of CHP schemes is the generation of electricity including export to other businesses and to the grid. Such schemes may not be sized to use all of the available heat. In such cases, the schemes’ total electrical capacity and electrical output have been scaled back using the methodologies outlined in CHPQA (see www.gov.uk/chpqa-guidance-notes). Only the output from highly-efficient or “Good Quality” schemes is counted in this chapter. Chapter 5 includes all CHP capacity, fuel inputs and power outputs, for both highly-efficient or “Good Quality” and less efficient, under the categories “Other generators”.
For year of operation 2011 onwards, new scale back criteria came into force in order to be consistent with the EU Cogeneration Directive. This results in a more severe scale back than was previously the case. This has contributed to some of the decrease in Good Quality electricity output and associated fuel consumption seen after 2010.
There are two load factors presented in Table 7A. Load Factor (CHPQA) is based on the Good Quality Power Output and Good Quality Power Capacity reported in this Chapter. Load Factor (Actual) is based on the Total Power Capacity and the Total Power Output. The Load Factor (CHPQA) is lower than the Load Factor (Actual) for schemes that have been scaled back on the power outputs. The load factor gives an indication of the degree to which the power generating capacity is utilized. Between 2007 and 2013 Load Factor (CHPQA) steadily declined, but has modestly improved over the last couple of years. This decline was confined to the industrial sectors, and was especially pronounced in the chemical and oil refinery sectors. As discussed above, there was an appreciable upturn in the Load Factor (Actual) in 2016, explained by a number of large CHP generators increasing their production of electricity.
3 The CHP prime mover is the heart of a CHP system and is a mechanical machine which drives the electricity generator or develops mechanical power for direct use
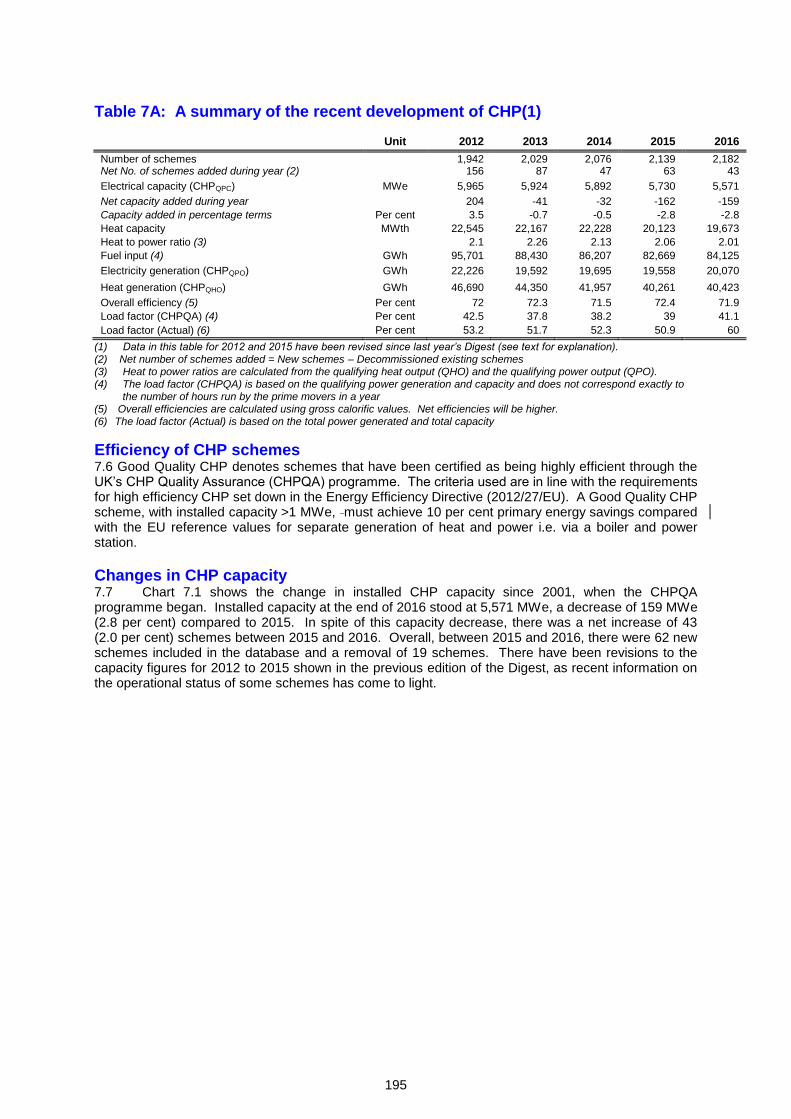
195
Table 7A: A summary of the recent development of CHP(1)
Unit 2012 2013 2014 2015 2016
Number of schemes
1,942 2,029 2,076 2,139 2,182 Net No. of schemes added during year (2)
156 87 47 63 43
Electrical capacity (CHPQPC) MWe 5,965 5,924 5,892 5,730 5,571
Net capacity added during year
204 -41 -32 -162 -159
Capacity added in percentage terms Per cent 3.5 -0.7 -0.5 -2.8 -2.8
Heat capacity MWth 22,545 22,167 22,228 20,123 19,673
Heat to power ratio (3)
2.1 2.26 2.13 2.06 2.01
Fuel input (4) GWh 95,701 88,430 86,207 82,669 84,125
Electricity generation (CHPQPO) GWh 22,226 19,592 19,695 19,558 20,070
Heat generation (CHPQHO) GWh 46,690 44,350 41,957 40,261 40,423
Overall efficiency (5) Per cent 72 72.3 71.5 72.4 71.9
Load factor (CHPQA) (4) Per cent 42.5 37.8 38.2 39 41.1
Load factor (Actual) (6) Per cent 53.2 51.7 52.3 50.9 60
(1) Data in this table for 2012 and 2015 have been revised since last year’s Digest (see text for explanation). (2) Net number of schemes added = New schemes – Decommissioned existing schemes (3) Heat to power ratios are calculated from the qualifying heat output (QHO) and the qualifying power output (QPO). (4) The load factor (CHPQA) is based on the qualifying power generation and capacity and does not correspond exactly to
the number of hours run by the prime movers in a year (5) Overall efficiencies are calculated using gross calorific values. Net efficiencies will be higher. (6) The load factor (Actual) is based on the total power generated and total capacity
Efficiency of CHP schemes 7.6 Good Quality CHP denotes schemes that have been certified as being highly efficient through the UK’s CHP Quality Assurance (CHPQA) programme. The criteria used are in line with the requirements for high efficiency CHP set down in the Energy Efficiency Directive (2012/27/EU). A Good Quality CHP scheme, with installed capacity >1 MWe, must achieve 10 per cent primary energy savings compared with the EU reference values for separate generation of heat and power i.e. via a boiler and power station.
Changes in CHP capacity 7.7 Chart 7.1 shows the change in installed CHP capacity since 2001, when the CHPQA programme began. Installed capacity at the end of 2016 stood at 5,571 MWe, a decrease of 159 MWe (2.8 per cent) compared to 2015. In spite of this capacity decrease, there was a net increase of 43 (2.0 per cent) schemes between 2015 and 2016. Overall, between 2015 and 2016, there were 62 new schemes included in the database and a removal of 19 schemes. There have been revisions to the capacity figures for 2012 to 2015 shown in the previous edition of the Digest, as recent information on the operational status of some schemes has come to light.
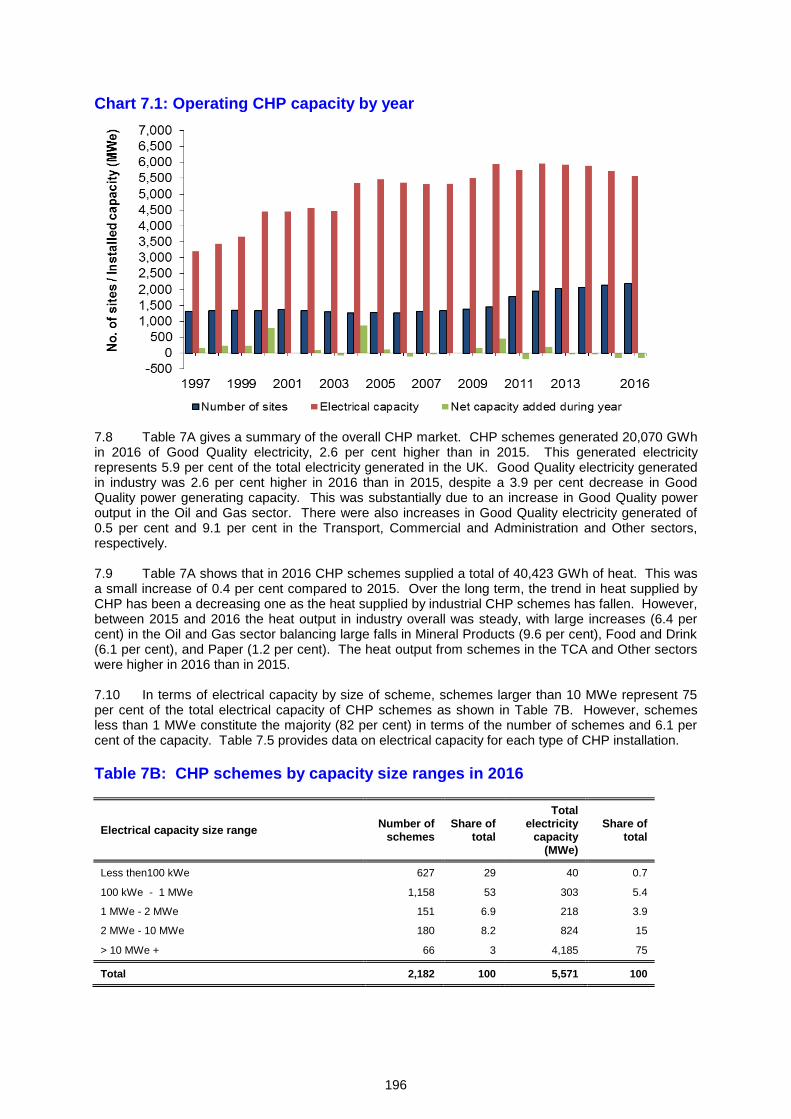
196
Chart 7.1: Operating CHP capacity by year
7.8 Table 7A gives a summary of the overall CHP market. CHP schemes generated 20,070 GWh in 2016 of Good Quality electricity, 2.6 per cent higher than in 2015. This generated electricity represents 5.9 per cent of the total electricity generated in the UK. Good Quality electricity generated in industry was 2.6 per cent higher in 2016 than in 2015, despite a 3.9 per cent decrease in Good Quality power generating capacity. This was substantially due to an increase in Good Quality power output in the Oil and Gas sector. There were also increases in Good Quality electricity generated of 0.5 per cent and 9.1 per cent in the Transport, Commercial and Administration and Other sectors, respectively. 7.9 Table 7A shows that in 2016 CHP schemes supplied a total of 40,423 GWh of heat. This was a small increase of 0.4 per cent compared to 2015. Over the long term, the trend in heat supplied by CHP has been a decreasing one as the heat supplied by industrial CHP schemes has fallen. However, between 2015 and 2016 the heat output in industry overall was steady, with large increases (6.4 per cent) in the Oil and Gas sector balancing large falls in Mineral Products (9.6 per cent), Food and Drink (6.1 per cent), and Paper (1.2 per cent). The heat output from schemes in the TCA and Other sectors were higher in 2016 than in 2015. 7.10 In terms of electrical capacity by size of scheme, schemes larger than 10 MWe represent 75 per cent of the total electrical capacity of CHP schemes as shown in Table 7B. However, schemes less than 1 MWe constitute the majority (82 per cent) in terms of the number of schemes and 6.1 per cent of the capacity. Table 7.5 provides data on electrical capacity for each type of CHP installation.
Table 7B: CHP schemes by capacity size ranges in 2016
Electrical capacity size range Number of
schemes Share of
total
Total electricity
capacity (MWe)
Share of total
Less then100 kWe 627 29 40 0.7
100 kWe - 1 MWe 1,158 53 303 5.4
1 MWe - 2 MWe 151 6.9 218 3.9
2 MWe - 10 MWe 180 8.2 824 15
> 10 MWe + 66 3 4,185 75
Total 2,182 100 5,571 100
197
7.11 Table 7.5 shows nearly 62 per cent of total electrical capacity is in combined cycle gas turbine (CCGT) mode, followed by reciprocating engines at 22 per cent. Over the years there has been a gradual decrease in the total capacity taken up by CCGT schemes and a gradual increase in the total capacity taken up by reciprocating engines. This is mirrored in the results for Table 7B where, over the years, there has been a gradual fall in the proportion of capacity >10 MWe and a gradual increase in the proportion of capacity falling under the other capacity ranges, where reciprocating engines are deployed. Over the long term there has been a significant fall in the proportion of overall capacity that is back pressure steam turbine, as this relatively inefficient and inflexible technology is phased out. The pass out condensing steam turbine also went through a decline in its proportion of total capacity. However, in recent years its share has increased as more biomass and waste fuelled CHP schemes have been brought on line. 7.12 Excluded from the statistics tables presented in this chapter are a number of very small CHP schemes (micro-CHP) installed since 2010 in response to the Feed-in Tariff (FiT) scheme. The overwhelming majority of these schemes are domestic. At the end of 2016 there were 511 such schemes registered with Ofgem for FiTs with a total installed capacity of 538 kWe. There are no data on electricity generation or fuel consumption for these schemes and, consequently, they have been left out of the statistics tables. However, if included, there would have a negligible impact upon the capacity and generation figures presented in the statistics tables. 7.13 Table 7.7 provides data on heat capacity for each type of CHP installation. Starting in the 2013 edition of the Digest, there has been a change implemented in how the heat capacity has been derived. Prior to this, for a number of schemes, the data held on heat capacity were either not complete or were not a true reflection of the capacity of the scheme to generate heat in CHP operating mode. To allow for this, a standard methodology was developed and applied for the first time in the 2013 edition of the Digest for the determination of the heat capacity. This is applied to new schemes and schemes undergoing a change in plant. Details of this methodology may be found in the CHP methodology note which is available at: www.gov.uk/government/publications/combined-heat-and-power-statistics-data-sources-and-methodologies
Fuel used by types of CHP installation 7.14 Table 7.2 shows the fuel used to generate electricity and heat in CHP schemes (see paragraphs 7.36 to 7.38, below for an explanation of the convention for dividing fuel between electricity and heat production). Table 7.3 gives the overall fuel used by types of CHP installation (which are explained in paragraph 7.35). Total fuel use is summarised in Chart 7.2. In 2016, 71 per cent of the total fuel use was natural gas. This is an increase of 1.1 percentage points compared with 2015. CHP schemes accounted for 7.2 per cent of UK gas demand in 2016 (see Table 4.3). The use of coal and fuel oil is now at extremely low levels, together taking up less than 1 per cent of overall fuel use in 2016. 7.15 The proportion of total fuel consumption that was renewable increased slightly between 2015 and 2016 from 11 per cent to 12 percent of the total. Gaseous renewable fuels constitute the single largest type of renewable fuel (47 per cent), followed by waste fuels (28 per cent) and biomass (24 per cent), with the balance being liquid renewable fuels. 7.16 Fuels which are liquids, solids or gases that are by-products or waste products from industrial processes, or are renewable fuels, accounted for 27 per cent of all fuel used in CHP in 2016. This proportion is substantially unchanged from 2015. Some of these by-product fuels are not commonly used by the mainstream electricity generating industry, and some would otherwise be flared or disposed of by some means. These fuels, with the exception of some waste gases, will generally be utilised in steam turbines being fed by boilers. In almost all cases, the technical nature of the combustion process, and the lower fuel quality (lower calorific value of the fuel, high moisture content of the fuel and the need to maintain certain combustion conditions to ensure complete disposal) will generally result in a lower efficiency. However, given that the use of such fuels avoids the use of fossil fuels, and since they need to be disposed of in some way, the use of these fuels in CHP provides environmental benefits.
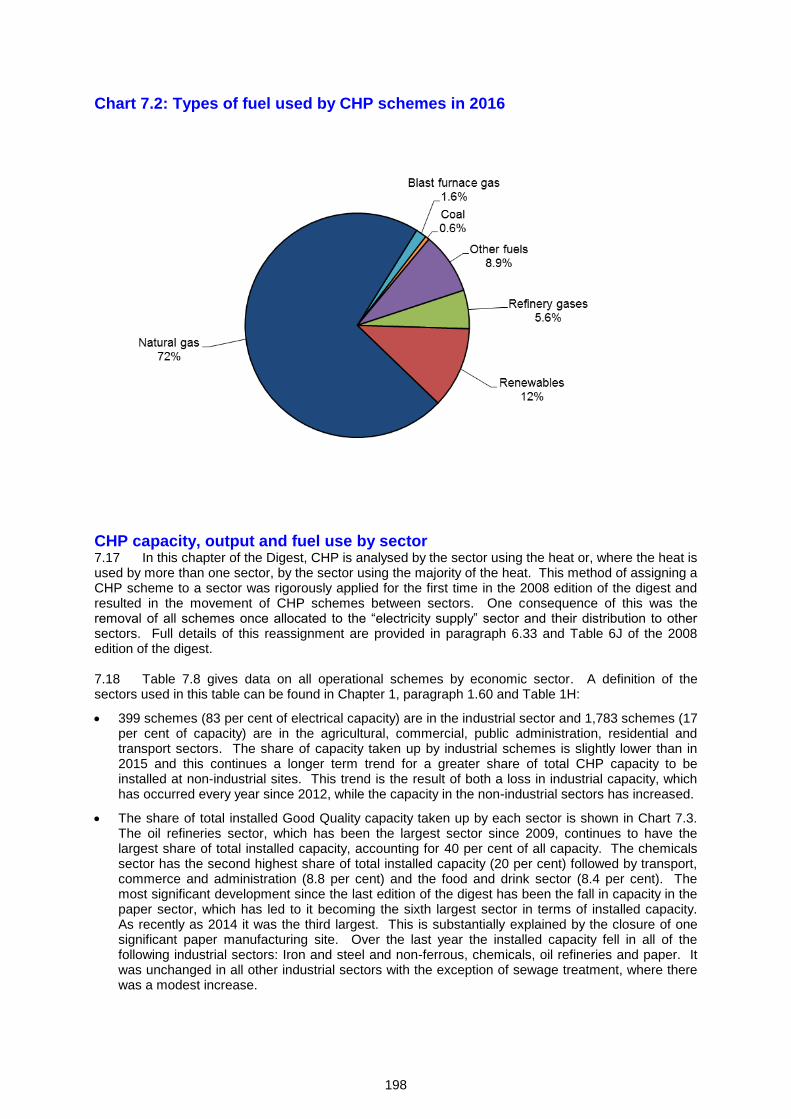
198
Chart 7.2: Types of fuel used by CHP schemes in 2016
CHP capacity, output and fuel use by sector 7.17 In this chapter of the Digest, CHP is analysed by the sector using the heat or, where the heat is used by more than one sector, by the sector using the majority of the heat. This method of assigning a CHP scheme to a sector was rigorously applied for the first time in the 2008 edition of the digest and resulted in the movement of CHP schemes between sectors. One consequence of this was the removal of all schemes once allocated to the “electricity supply” sector and their distribution to other sectors. Full details of this reassignment are provided in paragraph 6.33 and Table 6J of the 2008 edition of the digest. 7.18 Table 7.8 gives data on all operational schemes by economic sector. A definition of the sectors used in this table can be found in Chapter 1, paragraph 1.60 and Table 1H:
399 schemes (83 per cent of electrical capacity) are in the industrial sector and 1,783 schemes (17 per cent of capacity) are in the agricultural, commercial, public administration, residential and transport sectors. The share of capacity taken up by industrial schemes is slightly lower than in 2015 and this continues a longer term trend for a greater share of total CHP capacity to be installed at non-industrial sites. This trend is the result of both a loss in industrial capacity, which has occurred every year since 2012, while the capacity in the non-industrial sectors has increased.
The share of total installed Good Quality capacity taken up by each sector is shown in Chart 7.3. The oil refineries sector, which has been the largest sector since 2009, continues to have the largest share of total installed capacity, accounting for 40 per cent of all capacity. The chemicals sector has the second highest share of total installed capacity (20 per cent) followed by transport, commerce and administration (8.8 per cent) and the food and drink sector (8.4 per cent). The most significant development since the last edition of the digest has been the fall in capacity in the paper sector, which has led to it becoming the sixth largest sector in terms of installed capacity. As recently as 2014 it was the third largest. This is substantially explained by the closure of one significant paper manufacturing site. Over the last year the installed capacity fell in all of the following industrial sectors: Iron and steel and non-ferrous, chemicals, oil refineries and paper. It was unchanged in all other industrial sectors with the exception of sewage treatment, where there was a modest increase.
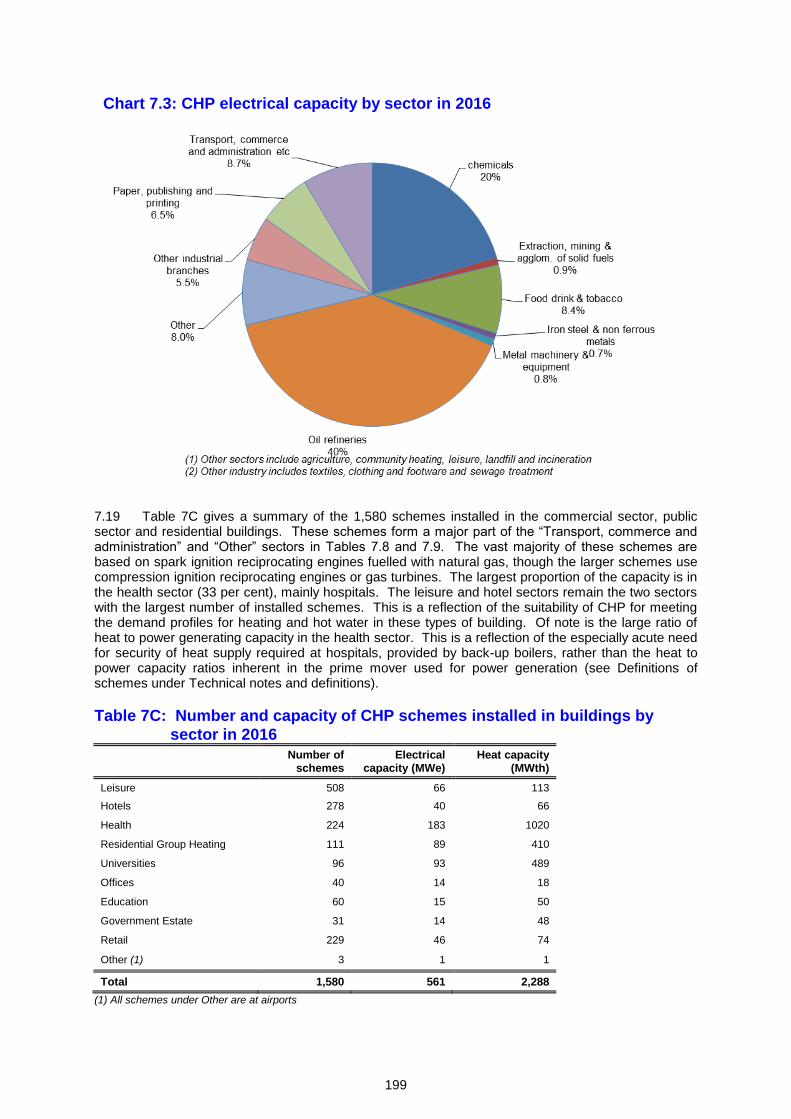
199
Chart 7.3: CHP electrical capacity by sector in 2016
7.19 Table 7C gives a summary of the 1,580 schemes installed in the commercial sector, public sector and residential buildings. These schemes form a major part of the “Transport, commerce and administration” and “Other” sectors in Tables 7.8 and 7.9. The vast majority of these schemes are based on spark ignition reciprocating engines fuelled with natural gas, though the larger schemes use compression ignition reciprocating engines or gas turbines. The largest proportion of the capacity is in the health sector (33 per cent), mainly hospitals. The leisure and hotel sectors remain the two sectors with the largest number of installed schemes. This is a reflection of the suitability of CHP for meeting the demand profiles for heating and hot water in these types of building. Of note is the large ratio of heat to power generating capacity in the health sector. This is a reflection of the especially acute need for security of heat supply required at hospitals, provided by back-up boilers, rather than the heat to power capacity ratios inherent in the prime mover used for power generation (see Definitions of schemes under Technical notes and definitions).
Table 7C: Number and capacity of CHP schemes installed in buildings by
sector in 2016
Number of
schemes Electrical
capacity (MWe) Heat capacity
(MWth)
Leisure 508 66 113
Hotels 278 40 66
Health 224 183 1020
Residential Group Heating 111 89 410
Universities 96 93 489
Offices 40 14 18
Education 60 15 50
Government Estate 31 14 48
Retail 229 46 74
Other (1) 3 1 1
Total 1,580 561 2,288
(1) All schemes under Other are at airports
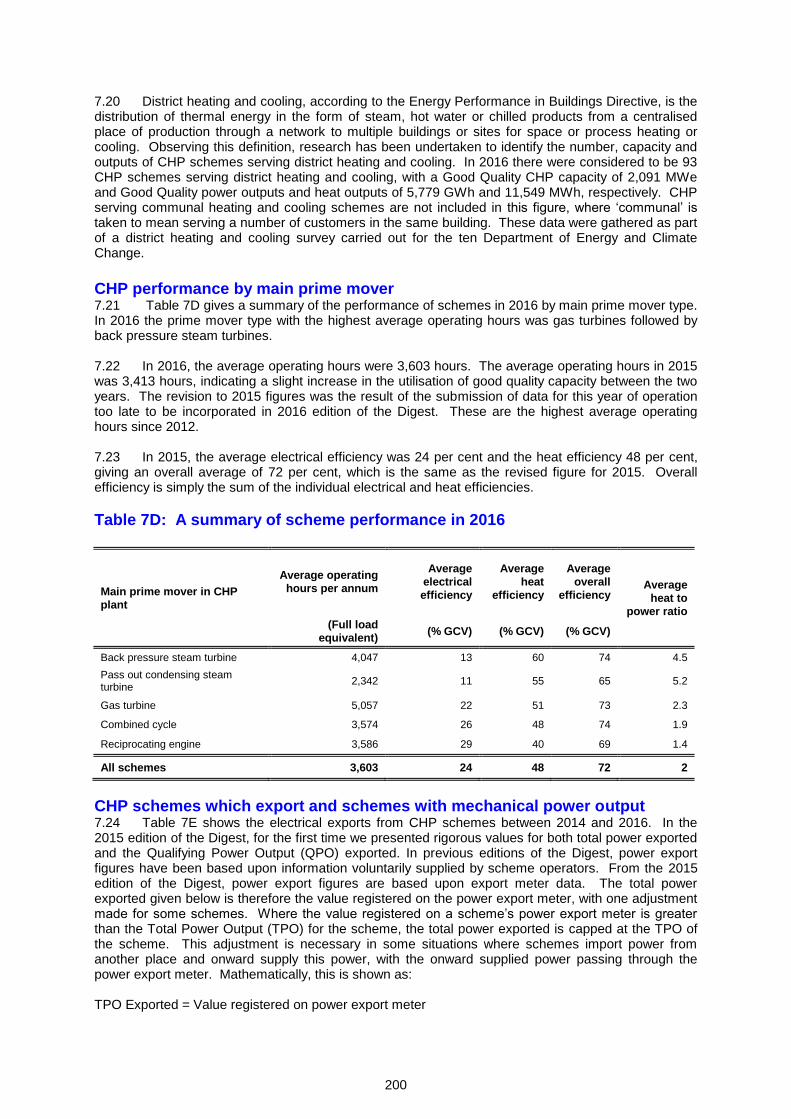
200
7.20 District heating and cooling, according to the Energy Performance in Buildings Directive, is the distribution of thermal energy in the form of steam, hot water or chilled products from a centralised place of production through a network to multiple buildings or sites for space or process heating or cooling. Observing this definition, research has been undertaken to identify the number, capacity and outputs of CHP schemes serving district heating and cooling. In 2016 there were considered to be 93 CHP schemes serving district heating and cooling, with a Good Quality CHP capacity of 2,091 MWe and Good Quality power outputs and heat outputs of 5,779 GWh and 11,549 MWh, respectively. CHP serving communal heating and cooling schemes are not included in this figure, where ‘communal’ is taken to mean serving a number of customers in the same building. These data were gathered as part of a district heating and cooling survey carried out for the ten Department of Energy and Climate Change.
CHP performance by main prime mover 7.21 Table 7D gives a summary of the performance of schemes in 2016 by main prime mover type. In 2016 the prime mover type with the highest average operating hours was gas turbines followed by back pressure steam turbines. 7.22 In 2016, the average operating hours were 3,603 hours. The average operating hours in 2015 was 3,413 hours, indicating a slight increase in the utilisation of good quality capacity between the two years. The revision to 2015 figures was the result of the submission of data for this year of operation too late to be incorporated in 2016 edition of the Digest. These are the highest average operating hours since 2012. 7.23 In 2015, the average electrical efficiency was 24 per cent and the heat efficiency 48 per cent, giving an overall average of 72 per cent, which is the same as the revised figure for 2015. Overall efficiency is simply the sum of the individual electrical and heat efficiencies.
Table 7D: A summary of scheme performance in 2016
Main prime mover in CHP plant
Average operating hours per annum
Average electrical efficiency
Average heat
efficiency
Average overall
efficiency Average
heat to power ratio
(Full load equivalent)
(% GCV) (% GCV) (% GCV)
Back pressure steam turbine 4,047 13 60 74 4.5
Pass out condensing steam turbine
2,342 11 55 65 5.2
Gas turbine 5,057 22 51 73 2.3
Combined cycle 3,574 26 48 74 1.9
Reciprocating engine 3,586 29 40 69 1.4
All schemes 3,603 24 48 72 2
CHP schemes which export and schemes with mechanical power output 7.24 Table 7E shows the electrical exports from CHP schemes between 2014 and 2016. In the 2015 edition of the Digest, for the first time we presented rigorous values for both total power exported and the Qualifying Power Output (QPO) exported. In previous editions of the Digest, power export figures have been based upon information voluntarily supplied by scheme operators. From the 2015 edition of the Digest, power export figures are based upon export meter data. The total power exported given below is therefore the value registered on the power export meter, with one adjustment made for some schemes. Where the value registered on a scheme’s power export meter is greater than the Total Power Output (TPO) for the scheme, the total power exported is capped at the TPO of the scheme. This adjustment is necessary in some situations where schemes import power from another place and onward supply this power, with the onward supplied power passing through the power export meter. Mathematically, this is shown as: TPO Exported = Value registered on power export meter
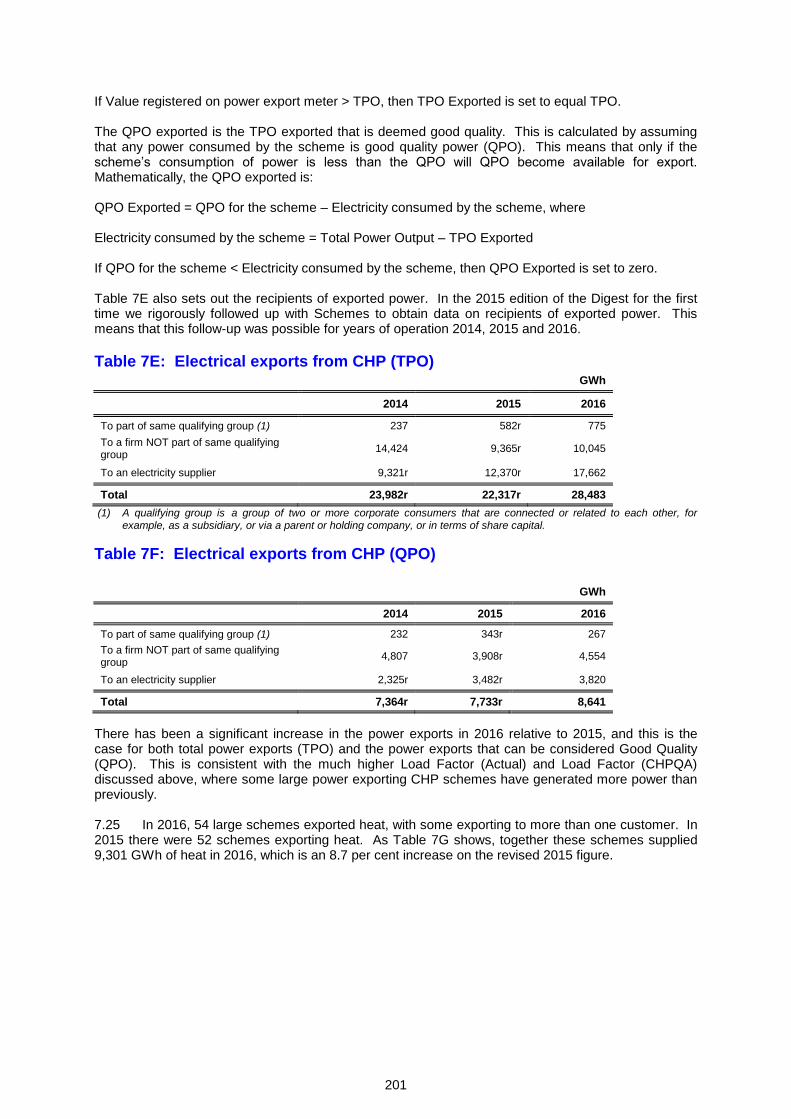
201
If Value registered on power export meter > TPO, then TPO Exported is set to equal TPO. The QPO exported is the TPO exported that is deemed good quality. This is calculated by assuming that any power consumed by the scheme is good quality power (QPO). This means that only if the scheme’s consumption of power is less than the QPO will QPO become available for export. Mathematically, the QPO exported is: QPO Exported = QPO for the scheme – Electricity consumed by the scheme, where Electricity consumed by the scheme = Total Power Output – TPO Exported If QPO for the scheme < Electricity consumed by the scheme, then QPO Exported is set to zero. Table 7E also sets out the recipients of exported power. In the 2015 edition of the Digest for the first time we rigorously followed up with Schemes to obtain data on recipients of exported power. This means that this follow-up was possible for years of operation 2014, 2015 and 2016.
Table 7E: Electrical exports from CHP (TPO)
GWh
2014 2015 2016
To part of same qualifying group (1) 237 582r 775
To a firm NOT part of same qualifying group
14,424 9,365r 10,045
To an electricity supplier 9,321r 12,370r 17,662
Total 23,982r 22,317r 28,483
(1) A qualifying group is a group of two or more corporate consumers that are connected or related to each other, for example, as a subsidiary, or via a parent or holding company, or in terms of share capital.
Table 7F: Electrical exports from CHP (QPO)
GWh
2014 2015 2016
To part of same qualifying group (1) 232 343r 267
To a firm NOT part of same qualifying group
4,807 3,908r 4,554
To an electricity supplier 2,325r 3,482r 3,820
Total 7,364r 7,733r 8,641
There has been a significant increase in the power exports in 2016 relative to 2015, and this is the case for both total power exports (TPO) and the power exports that can be considered Good Quality (QPO). This is consistent with the much higher Load Factor (Actual) and Load Factor (CHPQA) discussed above, where some large power exporting CHP schemes have generated more power than previously. 7.25 In 2016, 54 large schemes exported heat, with some exporting to more than one customer. In 2015 there were 52 schemes exporting heat. As Table 7G shows, together these schemes supplied 9,301 GWh of heat in 2016, which is an 8.7 per cent increase on the revised 2015 figure.
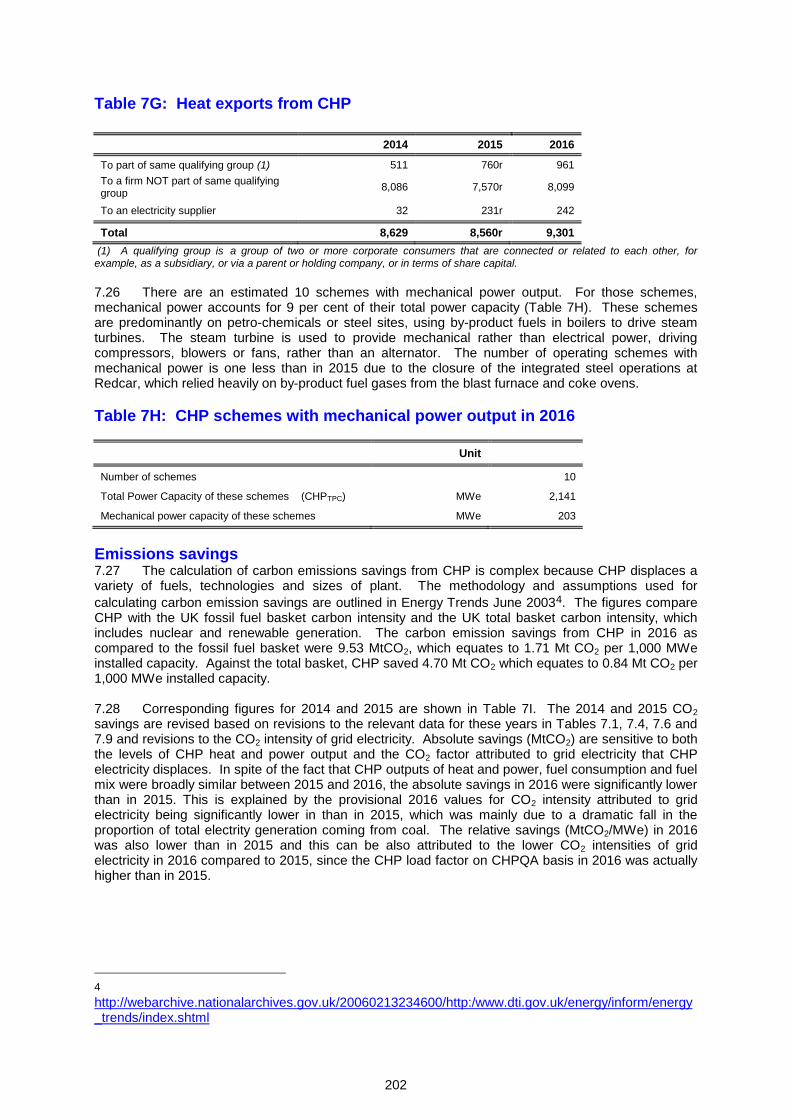
202
Table 7G: Heat exports from CHP
2014 2015 2016
To part of same qualifying group (1) 511 760r 961
To a firm NOT part of same qualifying group
8,086 7,570r 8,099
To an electricity supplier 32 231r 242
Total 8,629 8,560r 9,301
(1) A qualifying group is a group of two or more corporate consumers that are connected or related to each other, for example, as a subsidiary, or via a parent or holding company, or in terms of share capital.
7.26 There are an estimated 10 schemes with mechanical power output. For those schemes, mechanical power accounts for 9 per cent of their total power capacity (Table 7H). These schemes are predominantly on petro-chemicals or steel sites, using by-product fuels in boilers to drive steam turbines. The steam turbine is used to provide mechanical rather than electrical power, driving compressors, blowers or fans, rather than an alternator. The number of operating schemes with mechanical power is one less than in 2015 due to the closure of the integrated steel operations at Redcar, which relied heavily on by-product fuel gases from the blast furnace and coke ovens.
Table 7H: CHP schemes with mechanical power output in 2016
Unit
Number of schemes
10
Total Power Capacity of these schemes (CHPTPC) MWe 2,141
Mechanical power capacity of these schemes MWe 203
Emissions savings 7.27 The calculation of carbon emissions savings from CHP is complex because CHP displaces a variety of fuels, technologies and sizes of plant. The methodology and assumptions used for
calculating carbon emission savings are outlined in Energy Trends June 20034. The figures compare CHP with the UK fossil fuel basket carbon intensity and the UK total basket carbon intensity, which includes nuclear and renewable generation. The carbon emission savings from CHP in 2016 as compared to the fossil fuel basket were 9.53 MtCO2, which equates to 1.71 Mt CO2 per 1,000 MWe installed capacity. Against the total basket, CHP saved 4.70 Mt CO2 which equates to 0.84 Mt CO2 per 1,000 MWe installed capacity. 7.28 Corresponding figures for 2014 and 2015 are shown in Table 7I. The 2014 and 2015 CO2 savings are revised based on revisions to the relevant data for these years in Tables 7.1, 7.4, 7.6 and 7.9 and revisions to the CO2 intensity of grid electricity. Absolute savings (MtCO2) are sensitive to both the levels of CHP heat and power output and the CO2 factor attributed to grid electricity that CHP electricity displaces. In spite of the fact that CHP outputs of heat and power, fuel consumption and fuel mix were broadly similar between 2015 and 2016, the absolute savings in 2016 were significantly lower than in 2015. This is explained by the provisional 2016 values for CO2 intensity attributed to grid electricity being significantly lower in than in 2015, which was mainly due to a dramatic fall in the proportion of total electrity generation coming from coal. The relative savings (MtCO2/MWe) in 2016 was also lower than in 2015 and this can be also attributed to the lower CO2 intensities of grid electricity in 2016 compared to 2015, since the CHP load factor on CHPQA basis in 2016 was actually higher than in 2015.
4 http://webarchive.nationalarchives.gov.uk/20060213234600/http:/www.dti.gov.uk/energy/inform/energy_trends/index.shtml
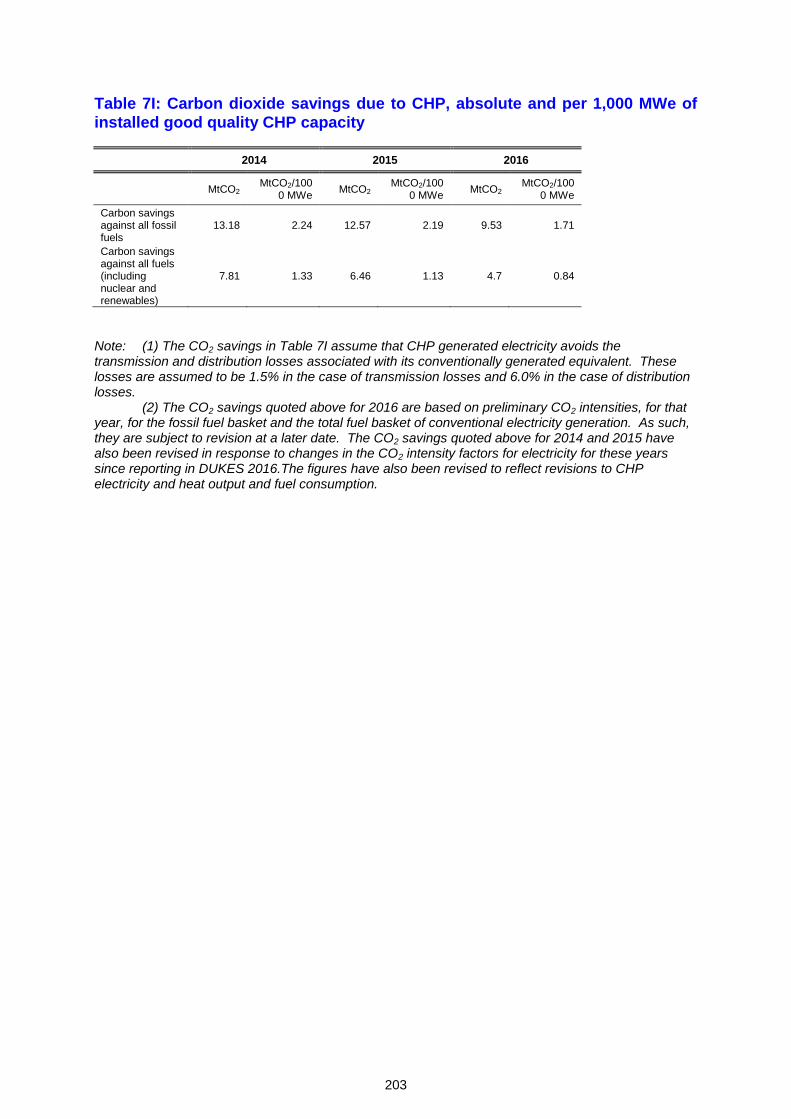
203
Table 7I: Carbon dioxide savings due to CHP, absolute and per 1,000 MWe of
installed good quality CHP capacity
2014 2015 2016
MtCO2 MtCO2/100
0 MWe MtCO2
MtCO2/1000 MWe
MtCO2 MtCO2/100
0 MWe
Carbon savings against all fossil fuels
13.18 2.24 12.57 2.19 9.53 1.71
Carbon savings against all fuels (including nuclear and renewables)
7.81 1.33 6.46 1.13 4.7 0.84
Note: (1) The CO2 savings in Table 7I assume that CHP generated electricity avoids the transmission and distribution losses associated with its conventionally generated equivalent. These losses are assumed to be 1.5% in the case of transmission losses and 6.0% in the case of distribution losses. (2) The CO2 savings quoted above for 2016 are based on preliminary CO2 intensities, for that year, for the fossil fuel basket and the total fuel basket of conventional electricity generation. As such, they are subject to revision at a later date. The CO2 savings quoted above for 2014 and 2015 have also been revised in response to changes in the CO2 intensity factors for electricity for these years since reporting in DUKES 2016.The figures have also been revised to reflect revisions to CHP electricity and heat output and fuel consumption.
204
Government policy towards CHP 7.29 There are a range of support measures to incentivise the growth of Good Quality CHP in the UK. These include:
Exemption from the Climate Change Levy (CCL) of all fuel inputs to, and electricity outputs from, Good Quality CHP. This exemption has been in place since the introduction of the CCL in 2001.
From April 2013, exemption from Carbon Price Support (CPS) on fuel to CHP consumed for the generation of heat
From April 2015, exemption from Carbon Price Support (CPS) on fuel to CHP consumed for the generation of Good Quality CHP electricity which is consumed on site
Eligibility to Enhanced Capital Allowances for Good Quality CHP plant and machinery.
Business Rates exemption for CHP power generation plant and machinery.
Reduction of VAT (from 20 to 5 per cent) on domestic micro-CHP installations.
Extension of the eligibility for Renewable Obligation Certificates (ROCs) to energy from waste plants that utilise CHP.
Specific Renewable Heat Incentive (RHI) for biomass fuelled Good Quality CHP certified under CHPQA.
Contract for Difference (CFD) for biomass fuelled CHP
The zero-rating of heat under the Carbon Reduction Commitment Energy Efficiency Scheme (CRC), this means that allowances do not have to be purchased by a site covered by CRC for heat that it imports. This incentivises the use of CHP heat outputs.
7.30 Table 7.1 shows the installed Good Quality CHP capacity in each year. However, this table hides the underlying market activity that replaces older capacity as it is taken out of service over time. Chart 7.4 gives an idea of the scale of this activity since 2000 for CHP schemes certified under CHPQA. The dotted line shows how much of the Good Quality CHPQA capacity that was in place in 2000 remained in place in subsequent years, while the upper line shows the actual Good Quality CHPQA capacity in place in each year. For any year since 2000, the gap between these two lines represents the new Good Quality CHPQA capacity installed between 2000 and that year. By 2016 there had been just over 3.0 GWe of new Good Quality CHPQA capacity installed since 2000.
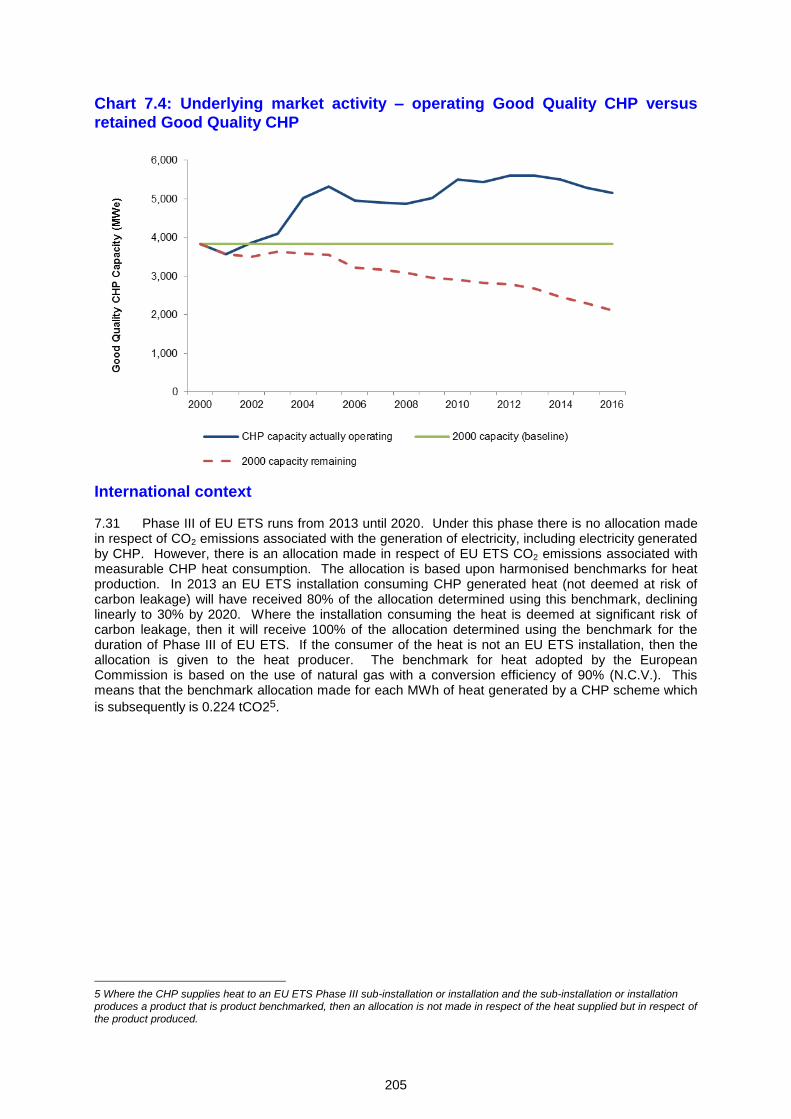
205
Chart 7.4: Underlying market activity – operating Good Quality CHP versus
retained Good Quality CHP
International context 7.31 Phase III of EU ETS runs from 2013 until 2020. Under this phase there is no allocation made in respect of CO2 emissions associated with the generation of electricity, including electricity generated by CHP. However, there is an allocation made in respect of EU ETS CO2 emissions associated with measurable CHP heat consumption. The allocation is based upon harmonised benchmarks for heat production. In 2013 an EU ETS installation consuming CHP generated heat (not deemed at risk of carbon leakage) will have received 80% of the allocation determined using this benchmark, declining linearly to 30% by 2020. Where the installation consuming the heat is deemed at significant risk of carbon leakage, then it will receive 100% of the allocation determined using the benchmark for the duration of Phase III of EU ETS. If the consumer of the heat is not an EU ETS installation, then the allocation is given to the heat producer. The benchmark for heat adopted by the European Commission is based on the use of natural gas with a conversion efficiency of 90% (N.C.V.). This means that the benchmark allocation made for each MWh of heat generated by a CHP scheme which
is subsequently is 0.224 tCO25.
5 Where the CHP supplies heat to an EU ETS Phase III sub-installation or installation and the sub-installation or installation produces a product that is product benchmarked, then an allocation is not made in respect of the heat supplied but in respect of the product produced.
206
Technical notes and definitions 7.32 These notes and definitions are in addition to the technical notes and definitions covering all fuels and energy as a whole in Chapter 1, paragraphs 1.28 to 1.61.
Data for 2016 7.33 The data are summarised from the results of a long-term project undertaken by Ricardo Energy & Environment on behalf of the Department of Business, Energy and Industrial Strategy (BEIS). Data are included for CHP schemes installed in all sectors of the UK economy.
7.34 Data for 2016 were based on data supplied to the CHPQA programme, information from the Iron and Steel Statistics Bureau (ISSB), information from Ofgem in respect of “Renewables Obligation Certificates” (ROCs), information from the CHP Sales database maintained by the CHPA and from a survey of anaerobic digestion (AD) sites. Ninety-five per cent of the total capacity is from schemes that have been certified under the CHPQA programme. Sewage Treatment Works and other AD schemes that do not provide returns to CHPQA have been included based on ROCs information from Ofgem returns. The data from these sources accounts for approximately 3.1 per cent of total electrical capacity. The balance of the capacity is for schemes covered by ISSB sources (<1 per cent), CHPA Sales Database (<1 per cent) and for schemes not covered by the above sources which were interpolated from historical data (<1 per cent).
Definitions of schemes 7.35 There are four principal types of CHP system:
Steam turbine, where steam at high pressure is generated in a boiler. In back pressure steam
turbine systems, the steam is wholly or partly used in a turbine before being exhausted from the
turbine at the required pressure for the site. In pass-out condensing steam turbine systems, a proportion of the steam used by the turbine is extracted at an intermediate pressure from the turbine with the remainder being fully condensed before it is exhausted at the exit. (Condensing steam turbines without passout and which do not utilise steam are not included in these statistics as they are not CHP). The boilers used in such schemes can burn a wide variety of fuels including coal, gas, oil, and waste-derived fuels. With the exception of waste-fired schemes, a steam turbine plant has often been in service for several decades. Steam turbine schemes capable of supplying useful steam have electrical efficiencies of between 10 and 20 per cent, depending on size, and thus between 70 per cent and 30 per cent of the fuel input is available as useful heat. Steam turbines used in CHP applications typically range in size from a few MWe to over 100 MWe.
Gas turbine systems, often aero-engine derivatives, where fuel (gas or gas-oil) is combusted in the gas turbine and the exhaust gases are normally used in a waste heat boiler to produce usable steam, though the exhaust gases may be used directly in some process applications. Gas turbines range from 30 kWe upwards, achieving electrical efficiency of 23 to 30 per cent (depending on size) and with the potential to recover up to 50 per cent of the fuel input as useful heat. They have been common in CHP since the mid 1980s. The waste heat boiler can include supplementary or auxiliary firing using a wide range of fuels, and thus the heat to power ratio of the scheme can vary.
Combined cycle systems, where the plant comprises more than one prime mover. These are usually gas turbines where the exhaust gases are utilised in a steam generator, the steam from which is passed wholly or in part into one or more steam turbines. In rare cases reciprocating engines may be linked with steam turbines. Combined cycle is suited to larger installations of 7 MWe and over. They achieve higher electrical efficiency and a lower heat to power ratio than steam turbines or gas turbines. Recently installed combined cycle gas turbine (CCGT) schemes have achieved an electrical efficiency approaching 50 per cent, with 20 per cent heat recovery, and a heat to power ratio of less than 1:1.
Reciprocating engine systems range from less than 100 kWe up to around 5 MWe, and are found in applications where production of hot water (rather than steam) is the main requirement, for example, on smaller industrial sites as well as in buildings. They are based on auto engine or
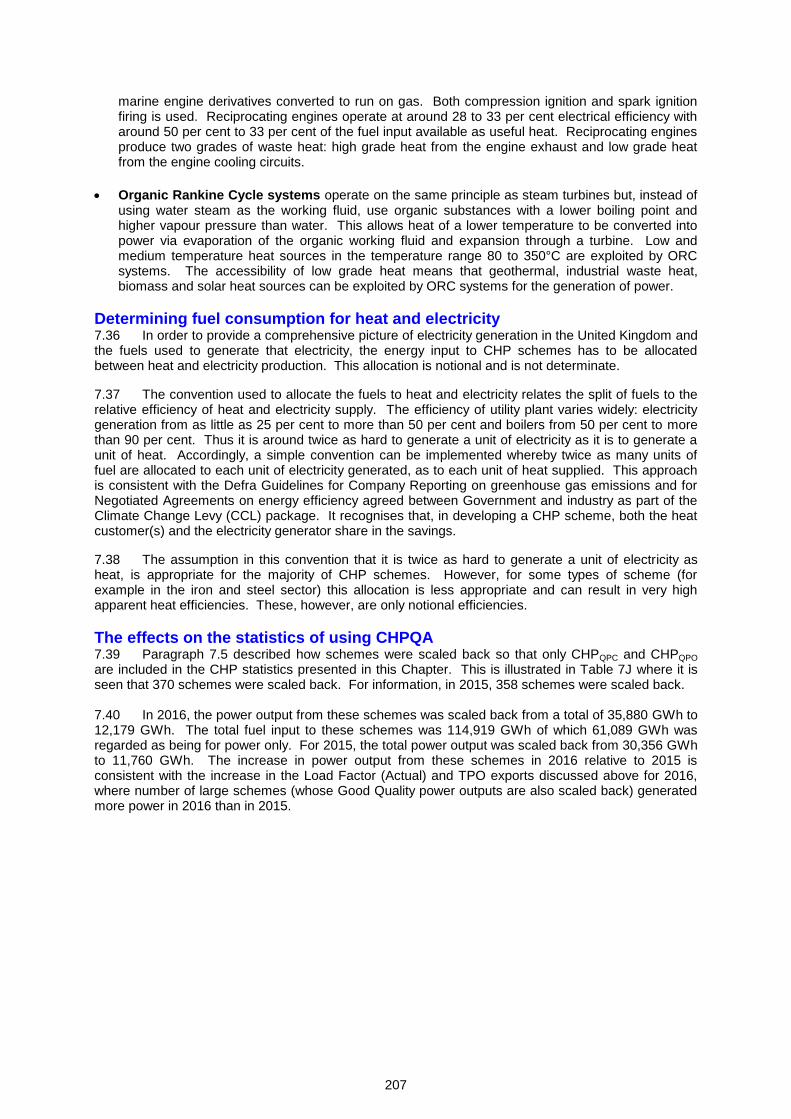
207
marine engine derivatives converted to run on gas. Both compression ignition and spark ignition firing is used. Reciprocating engines operate at around 28 to 33 per cent electrical efficiency with around 50 per cent to 33 per cent of the fuel input available as useful heat. Reciprocating engines produce two grades of waste heat: high grade heat from the engine exhaust and low grade heat from the engine cooling circuits.
Organic Rankine Cycle systems operate on the same principle as steam turbines but, instead of
using water steam as the working fluid, use organic substances with a lower boiling point and higher vapour pressure than water. This allows heat of a lower temperature to be converted into power via evaporation of the organic working fluid and expansion through a turbine. Low and medium temperature heat sources in the temperature range 80 to 350°C are exploited by ORC systems. The accessibility of low grade heat means that geothermal, industrial waste heat, biomass and solar heat sources can be exploited by ORC systems for the generation of power.
Determining fuel consumption for heat and electricity 7.36 In order to provide a comprehensive picture of electricity generation in the United Kingdom and the fuels used to generate that electricity, the energy input to CHP schemes has to be allocated between heat and electricity production. This allocation is notional and is not determinate.
7.37 The convention used to allocate the fuels to heat and electricity relates the split of fuels to the relative efficiency of heat and electricity supply. The efficiency of utility plant varies widely: electricity generation from as little as 25 per cent to more than 50 per cent and boilers from 50 per cent to more than 90 per cent. Thus it is around twice as hard to generate a unit of electricity as it is to generate a unit of heat. Accordingly, a simple convention can be implemented whereby twice as many units of fuel are allocated to each unit of electricity generated, as to each unit of heat supplied. This approach is consistent with the Defra Guidelines for Company Reporting on greenhouse gas emissions and for Negotiated Agreements on energy efficiency agreed between Government and industry as part of the Climate Change Levy (CCL) package. It recognises that, in developing a CHP scheme, both the heat customer(s) and the electricity generator share in the savings.
7.38 The assumption in this convention that it is twice as hard to generate a unit of electricity as heat, is appropriate for the majority of CHP schemes. However, for some types of scheme (for example in the iron and steel sector) this allocation is less appropriate and can result in very high apparent heat efficiencies. These, however, are only notional efficiencies.
The effects on the statistics of using CHPQA 7.39 Paragraph 7.5 described how schemes were scaled back so that only CHPQPC and CHPQPO are included in the CHP statistics presented in this Chapter. This is illustrated in Table 7J where it is seen that 370 schemes were scaled back. For information, in 2015, 358 schemes were scaled back. 7.40 In 2016, the power output from these schemes was scaled back from a total of 35,880 GWh to 12,179 GWh. The total fuel input to these schemes was 114,919 GWh of which 61,089 GWh was regarded as being for power only. For 2015, the total power output was scaled back from 30,356 GWh to 11,760 GWh. The increase in power output from these schemes in 2016 relative to 2015 is consistent with the increase in the Load Factor (Actual) and TPO exports discussed above for 2016, where number of large schemes (whose Good Quality power outputs are also scaled back) generated more power in 2016 than in 2015.
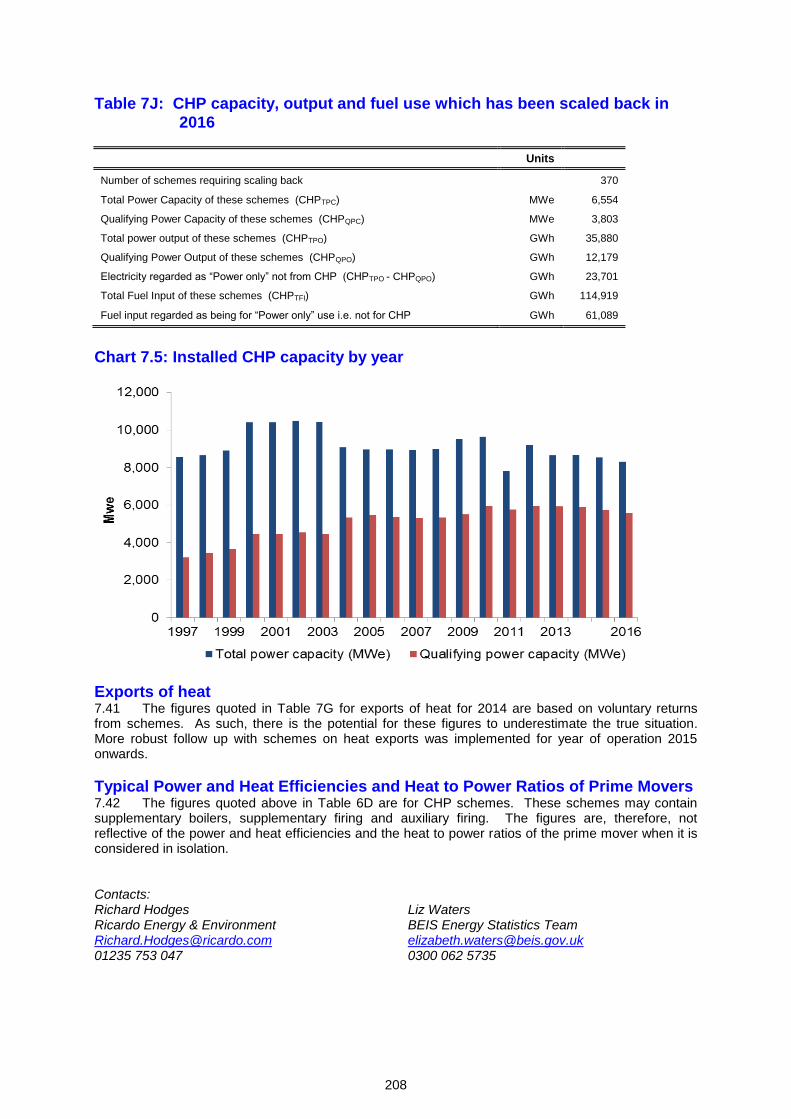
208
Table 7J: CHP capacity, output and fuel use which has been scaled back in
2016
Units
Number of schemes requiring scaling back 370
Total Power Capacity of these schemes (CHPTPC) MWe 6,554
Qualifying Power Capacity of these schemes (CHPQPC) MWe 3,803
Total power output of these schemes (CHPTPO) GWh 35,880
Qualifying Power Output of these schemes (CHPQPO) GWh 12,179
Electricity regarded as “Power only” not from CHP (CHPTPO - CHPQPO) GWh 23,701
Total Fuel Input of these schemes (CHPTFI) GWh 114,919
Fuel input regarded as being for “Power only” use i.e. not for CHP GWh 61,089
Chart 7.5: Installed CHP capacity by year
Exports of heat 7.41 The figures quoted in Table 7G for exports of heat for 2014 are based on voluntary returns from schemes. As such, there is the potential for these figures to underestimate the true situation. More robust follow up with schemes on heat exports was implemented for year of operation 2015 onwards.
Typical Power and Heat Efficiencies and Heat to Power Ratios of Prime Movers 7.42 The figures quoted above in Table 6D are for CHP schemes. These schemes may contain supplementary boilers, supplementary firing and auxiliary firing. The figures are, therefore, not reflective of the power and heat efficiencies and the heat to power ratios of the prime mover when it is considered in isolation. Contacts: Richard Hodges Ricardo Energy & Environment [email protected] 01235 753 047
Liz Waters BEIS Energy Statistics Team [email protected] 0300 062 5735

209
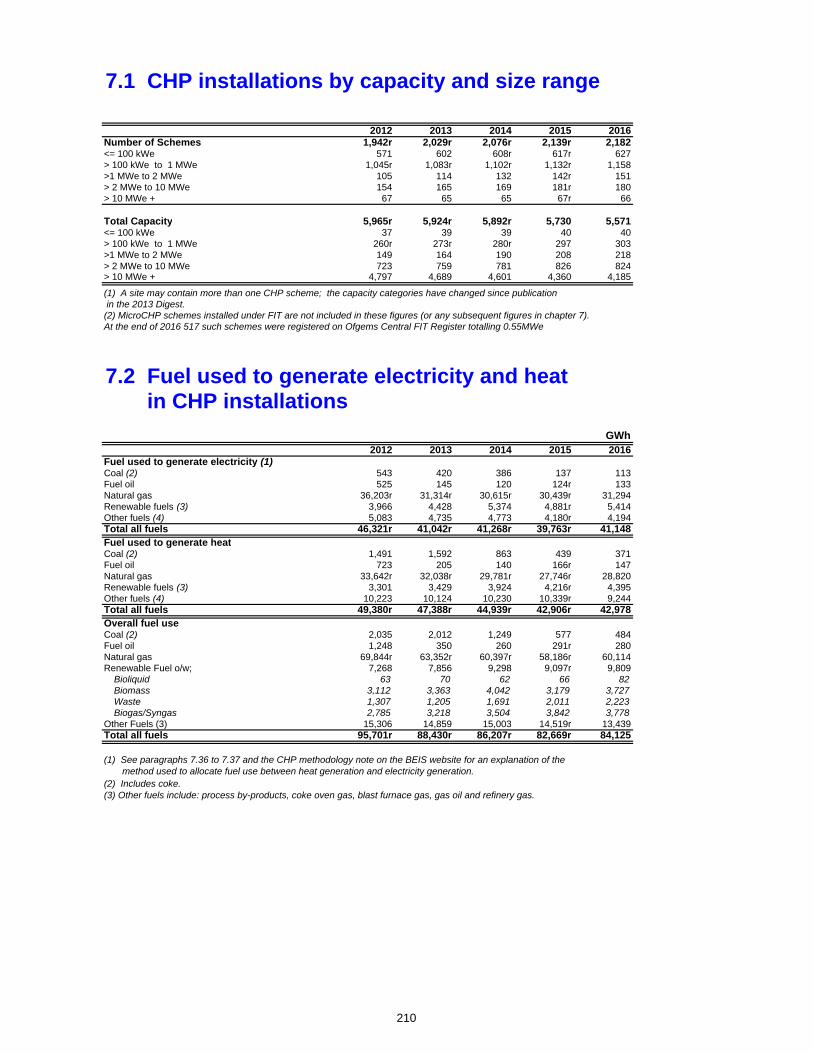
7.1 CHP installations by capacity and size range
2012 2013 2014 2015 2016Number of Schemes 1,942r 2,029r 2,076r 2,139r 2,182<= 100 kWe 571 602 608r 617r 627> 100 kWe to 1 MWe 1,045r 1,083r 1,102r 1,132r 1,158>1 MWe to 2 MWe 105 114 132 142r 151> 2 MWe to 10 MWe 154 165 169 181r 180> 10 MWe + 67 65 65 67r 66
Total Capacity 5,965r 5,924r 5,892r 5,730 5,571<= 100 kWe 37 39 39 40 40> 100 kWe to 1 MWe 260r 273r 280r 297 303>1 MWe to 2 MWe 149 164 190 208 218> 2 MWe to 10 MWe 723 759 781 826 824> 10 MWe + 4,797 4,689 4,601 4,360 4,185
(1) A site may contain more than one CHP scheme; the capacity categories have changed since publication in the 2013 Digest.(2) MicroCHP schemes installed under FIT are not included in these figures (or any subsequent figures in chapter 7).At the end of 2016 517 such schemes were registered on Ofgems Central FIT Register totalling 0.55MWe
7.2 Fuel used to generate electricity and heat in CHP installations
GWh2012 2013 2014 2015 2016
Fuel used to generate electricity (1)Coal (2) 543 420 386 137 113Fuel oil 525 145 120 124r 133Natural gas 36,203r 31,314r 30,615r 30,439r 31,294Renewable fuels (3) 3,966 4,428 5,374 4,881r 5,414Other fuels (4) 5,083 4,735 4,773 4,180r 4,194Total all fuels 46,321r 41,042r 41,268r 39,763r 41,148Fuel used to generate heatCoal (2) 1,491 1,592 863 439 371Fuel oil 723 205 140 166r 147Natural gas 33,642r 32,038r 29,781r 27,746r 28,820Renewable fuels (3) 3,301 3,429 3,924 4,216r 4,395Other fuels (4) 10,223 10,124 10,230 10,339r 9,244Total all fuels 49,380r 47,388r 44,939r 42,906r 42,978Overall fuel useCoal (2) 2,035 2,012 1,249 577 484Fuel oil 1,248 350 260 291r 280Natural gas 69,844r 63,352r 60,397r 58,186r 60,114Renewable Fuel o/w; 7,268 7,856 9,298 9,097r 9,809
Bioliquid 63 70 62 66 82Biomass 3,112 3,363 4,042 3,179 3,727Waste 1,307 1,205 1,691 2,011 2,223Biogas/Syngas 2,785 3,218 3,504 3,842 3,778
Other Fuels (3) 15,306 14,859 15,003 14,519r 13,439Total all fuels 95,701r 88,430r 86,207r 82,669r 84,125
(1) See paragraphs 7.36 to 7.37 and the CHP methodology note on the BEIS website for an explanation of the method used to allocate fuel use between heat generation and electricity generation.(2) Includes coke.(3) Other fuels include: process by-products, coke oven gas, blast furnace gas, gas oil and refinery gas.
210
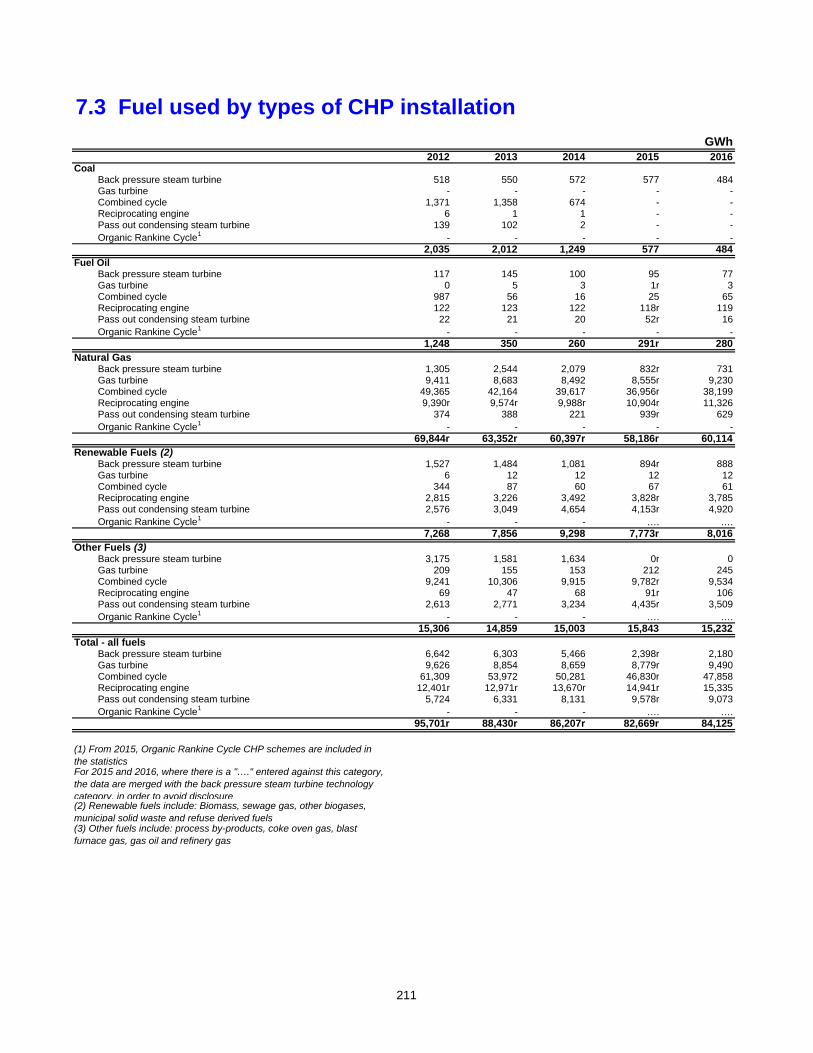
7.3 Fuel used by types of CHP installation
GWh2012 2013 2014 2015 2016
CoalBack pressure steam turbine 518 550 572 577 484Gas turbine - - - - -Combined cycle 1,371 1,358 674 - -Reciprocating engine 6 1 1 - -Pass out condensing steam turbine 139 102 2 - -Organic Rankine Cycle1 - - - - -
2,035 2,012 1,249 577 484Fuel Oil
Back pressure steam turbine 117 145 100 95 77Gas turbine 0 5 3 1r 3Combined cycle 987 56 16 25 65Reciprocating engine 122 123 122 118r 119Pass out condensing steam turbine 22 21 20 52r 16Organic Rankine Cycle1 - - - - -
1,248 350 260 291r 280Natural Gas
Back pressure steam turbine 1,305 2,544 2,079 832r 731Gas turbine 9,411 8,683 8,492 8,555r 9,230Combined cycle 49,365 42,164 39,617 36,956r 38,199Reciprocating engine 9,390r 9,574r 9,988r 10,904r 11,326Pass out condensing steam turbine 374 388 221 939r 629Organic Rankine Cycle1 - - - - -
69,844r 63,352r 60,397r 58,186r 60,114Renewable Fuels (2)
Back pressure steam turbine 1,527 1,484 1,081 894r 888Gas turbine 6 12 12 12 12Combined cycle 344 87 60 67 61Reciprocating engine 2,815 3,226 3,492 3,828r 3,785Pass out condensing steam turbine 2,576 3,049 4,654 4,153r 4,920Organic Rankine Cycle1 - - - …. ….
7,268 7,856 9,298 7,773r 8,016Other Fuels (3)
Back pressure steam turbine 3,175 1,581 1,634 0r 0Gas turbine 209 155 153 212 245Combined cycle 9,241 10,306 9,915 9,782r 9,534Reciprocating engine 69 47 68 91r 106Pass out condensing steam turbine 2,613 2,771 3,234 4,435r 3,509Organic Rankine Cycle1 - - - …. ….
15,306 14,859 15,003 15,843 15,232Total - all fuels
Back pressure steam turbine 6,642 6,303 5,466 2,398r 2,180Gas turbine 9,626 8,854 8,659 8,779r 9,490Combined cycle 61,309 53,972 50,281 46,830r 47,858Reciprocating engine 12,401r 12,971r 13,670r 14,941r 15,335Pass out condensing steam turbine 5,724 6,331 8,131 9,578r 9,073Organic Rankine Cycle1 - - - …. ….
95,701r 88,430r 86,207r 82,669r 84,125
(3) Other fuels include: process by-products, coke oven gas, blast furnace gas, gas oil and refinery gas
(1) From 2015, Organic Rankine Cycle CHP schemes are included in the statisticsFor 2015 and 2016, where there is a "…." entered against this category, the data are merged with the back pressure steam turbine technology category, in order to avoid disclosure(2) Renewable fuels include: Biomass, sewage gas, other biogases, municipal solid waste and refuse derived fuels
211
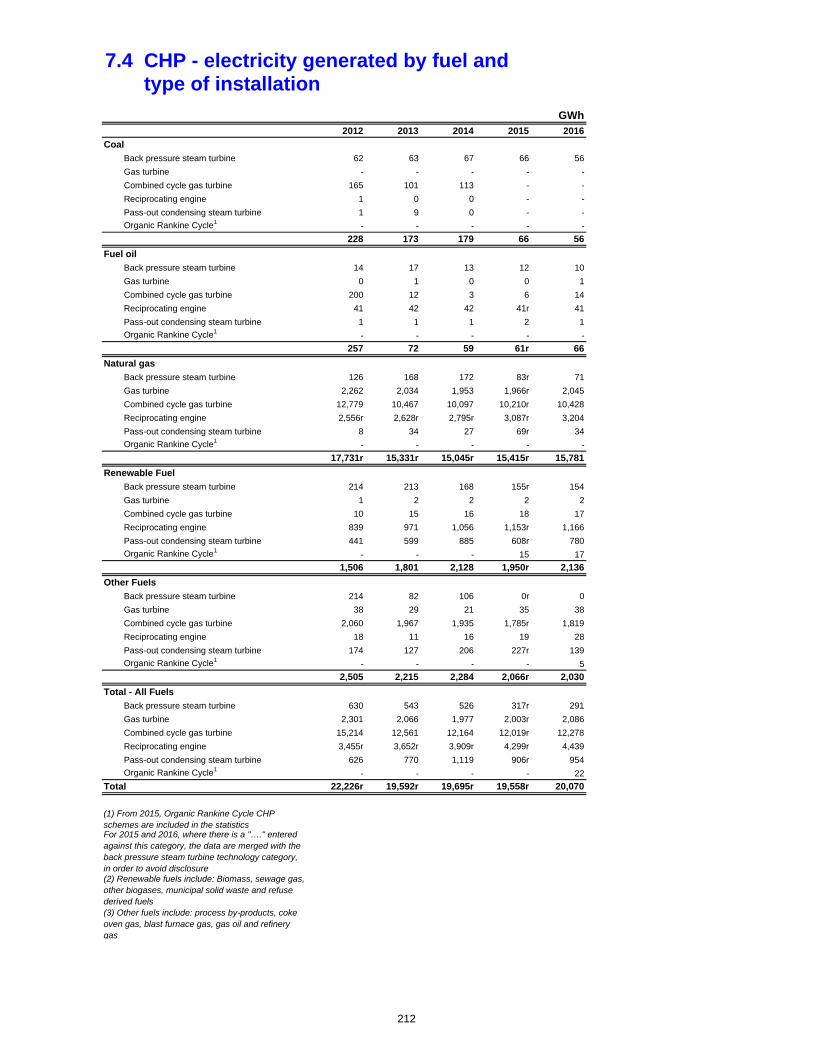
7.4 CHP - electricity generated by fuel and type of installation
GWh2012 2013 2014 2015 2016
Coal
Back pressure steam turbine 62 63 67 66 56
Gas turbine - - - - -
Combined cycle gas turbine 165 101 113 - -
Reciprocating engine 1 0 0 - -
Pass-out condensing steam turbine 1 9 0 - -
Organic Rankine Cycle1- - - - -
228 173 179 66 56
Fuel oil
Back pressure steam turbine 14 17 13 12 10
Gas turbine 0 1 0 0 1
Combined cycle gas turbine 200 12 3 6 14
Reciprocating engine 41 42 42 41r 41
Pass-out condensing steam turbine 1 1 1 2 1
Organic Rankine Cycle1- - - - -
257 72 59 61r 66
Natural gas
Back pressure steam turbine 126 168 172 83r 71
Gas turbine 2,262 2,034 1,953 1,966r 2,045
Combined cycle gas turbine 12,779 10,467 10,097 10,210r 10,428
Reciprocating engine 2,556r 2,628r 2,795r 3,087r 3,204
Pass-out condensing steam turbine 8 34 27 69r 34
Organic Rankine Cycle1- - - - -
17,731r 15,331r 15,045r 15,415r 15,781
Renewable Fuel
Back pressure steam turbine 214 213 168 155r 154
Gas turbine 1 2 2 2 2
Combined cycle gas turbine 10 15 16 18 17
Reciprocating engine 839 971 1,056 1,153r 1,166
Pass-out condensing steam turbine 441 599 885 608r 780
Organic Rankine Cycle1- - - 15 17
1,506 1,801 2,128 1,950r 2,136
Other Fuels
Back pressure steam turbine 214 82 106 0r 0
Gas turbine 38 29 21 35 38
Combined cycle gas turbine 2,060 1,967 1,935 1,785r 1,819
Reciprocating engine 18 11 16 19 28
Pass-out condensing steam turbine 174 127 206 227r 139
Organic Rankine Cycle1- - - - 5
2,505 2,215 2,284 2,066r 2,030
Total - All Fuels
Back pressure steam turbine 630 543 526 317r 291
Gas turbine 2,301 2,066 1,977 2,003r 2,086
Combined cycle gas turbine 15,214 12,561 12,164 12,019r 12,278
Reciprocating engine 3,455r 3,652r 3,909r 4,299r 4,439
Pass-out condensing steam turbine 626 770 1,119 906r 954
Organic Rankine Cycle1- - - - 22
Total 22,226r 19,592r 19,695r 19,558r 20,070
(1) From 2015, Organic Rankine Cycle CHP schemes are included in the statisticsFor 2015 and 2016, where there is a "…." entered against this category, the data are merged with the back pressure steam turbine technology category, in order to avoid disclosure(2) Renewable fuels include: Biomass, sewage gas, other biogases, municipal solid waste and refuse derived fuels(3) Other fuels include: process by-products, coke oven gas, blast furnace gas, gas oil and refinery gas
212
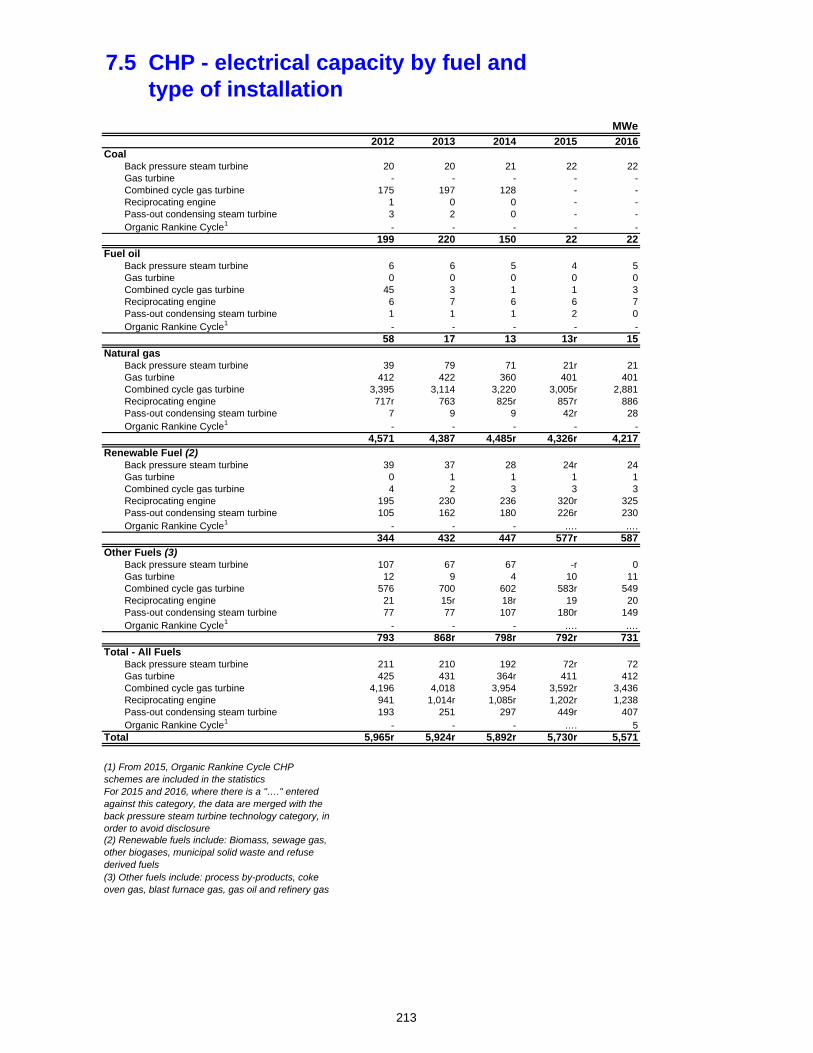
7.5 CHP - electrical capacity by fuel and type of installation
MWe2012 2013 2014 2015 2016
CoalBack pressure steam turbine 20 20 21 22 22Gas turbine - - - - -Combined cycle gas turbine 175 197 128 - -Reciprocating engine 1 0 0 - -Pass-out condensing steam turbine 3 2 0 - -Organic Rankine Cycle1 - - - - -
199 220 150 22 22Fuel oil
Back pressure steam turbine 6 6 5 4 5Gas turbine 0 0 0 0 0Combined cycle gas turbine 45 3 1 1 3Reciprocating engine 6 7 6 6 7Pass-out condensing steam turbine 1 1 1 2 0Organic Rankine Cycle1 - - - - -
58 17 13 13r 15Natural gas
Back pressure steam turbine 39 79 71 21r 21Gas turbine 412 422 360 401 401Combined cycle gas turbine 3,395 3,114 3,220 3,005r 2,881Reciprocating engine 717r 763 825r 857r 886Pass-out condensing steam turbine 7 9 9 42r 28Organic Rankine Cycle1 - - - - -
4,571 4,387 4,485r 4,326r 4,217Renewable Fuel (2)
Back pressure steam turbine 39 37 28 24r 24Gas turbine 0 1 1 1 1Combined cycle gas turbine 4 2 3 3 3Reciprocating engine 195 230 236 320r 325Pass-out condensing steam turbine 105 162 180 226r 230Organic Rankine Cycle1 - - - …. ….
344 432 447 577r 587Other Fuels (3)
Back pressure steam turbine 107 67 67 -r 0Gas turbine 12 9 4 10 11Combined cycle gas turbine 576 700 602 583r 549Reciprocating engine 21 15r 18r 19 20Pass-out condensing steam turbine 77 77 107 180r 149Organic Rankine Cycle1 - - - …. ….
793 868r 798r 792r 731Total - All Fuels
Back pressure steam turbine 211 210 192 72r 72Gas turbine 425 431 364r 411 412Combined cycle gas turbine 4,196 4,018 3,954 3,592r 3,436Reciprocating engine 941 1,014r 1,085r 1,202r 1,238Pass-out condensing steam turbine 193 251 297 449r 407Organic Rankine Cycle1 - - - …. 5
Total 5,965r 5,924r 5,892r 5,730r 5,571
(1) From 2015, Organic Rankine Cycle CHP schemes are included in the statisticsFor 2015 and 2016, where there is a "…." entered against this category, the data are merged with the back pressure steam turbine technology category, in order to avoid disclosure(2) Renewable fuels include: Biomass, sewage gas, other biogases, municipal solid waste and refuse derived fuels(3) Other fuels include: process by-products, coke oven gas, blast furnace gas, gas oil and refinery gas
213
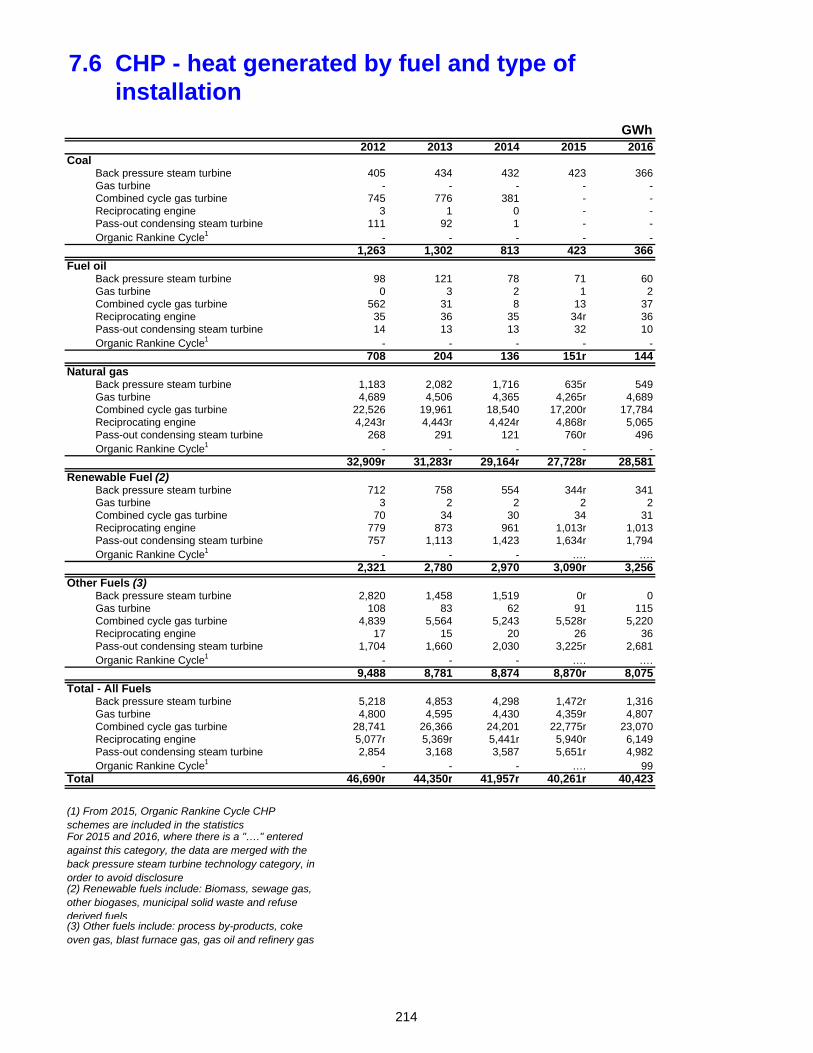
7.6 CHP - heat generated by fuel and type of installation
GWh2012 2013 2014 2015 2016
CoalBack pressure steam turbine 405 434 432 423 366Gas turbine - - - - -Combined cycle gas turbine 745 776 381 - -Reciprocating engine 3 1 0 - -Pass-out condensing steam turbine 111 92 1 - -Organic Rankine Cycle1 - - - - -
1,263 1,302 813 423 366Fuel oil
Back pressure steam turbine 98 121 78 71 60Gas turbine 0 3 2 1 2Combined cycle gas turbine 562 31 8 13 37Reciprocating engine 35 36 35 34r 36Pass-out condensing steam turbine 14 13 13 32 10Organic Rankine Cycle1 - - - - -
708 204 136 151r 144Natural gas
Back pressure steam turbine 1,183 2,082 1,716 635r 549Gas turbine 4,689 4,506 4,365 4,265r 4,689Combined cycle gas turbine 22,526 19,961 18,540 17,200r 17,784Reciprocating engine 4,243r 4,443r 4,424r 4,868r 5,065Pass-out condensing steam turbine 268 291 121 760r 496Organic Rankine Cycle1 - - - - -
32,909r 31,283r 29,164r 27,728r 28,581Renewable Fuel (2)
Back pressure steam turbine 712 758 554 344r 341Gas turbine 3 2 2 2 2Combined cycle gas turbine 70 34 30 34 31Reciprocating engine 779 873 961 1,013r 1,013Pass-out condensing steam turbine 757 1,113 1,423 1,634r 1,794Organic Rankine Cycle1 - - - …. ….
2,321 2,780 2,970 3,090r 3,256Other Fuels (3)
Back pressure steam turbine 2,820 1,458 1,519 0r 0Gas turbine 108 83 62 91 115Combined cycle gas turbine 4,839 5,564 5,243 5,528r 5,220Reciprocating engine 17 15 20 26 36Pass-out condensing steam turbine 1,704 1,660 2,030 3,225r 2,681Organic Rankine Cycle1 - - - …. ….
9,488 8,781 8,874 8,870r 8,075Total - All Fuels
Back pressure steam turbine 5,218 4,853 4,298 1,472r 1,316Gas turbine 4,800 4,595 4,430 4,359r 4,807Combined cycle gas turbine 28,741 26,366 24,201 22,775r 23,070Reciprocating engine 5,077r 5,369r 5,441r 5,940r 6,149Pass-out condensing steam turbine 2,854 3,168 3,587 5,651r 4,982Organic Rankine Cycle1 - - - …. 99
Total 46,690r 44,350r 41,957r 40,261r 40,423
(1) From 2015, Organic Rankine Cycle CHP schemes are included in the statisticsFor 2015 and 2016, where there is a "…." entered against this category, the data are merged with the back pressure steam turbine technology category, in order to avoid disclosure(2) Renewable fuels include: Biomass, sewage gas, other biogases, municipal solid waste and refuse derived fuels(3) Other fuels include: process by-products, coke oven gas, blast furnace gas, gas oil and refinery gas
214
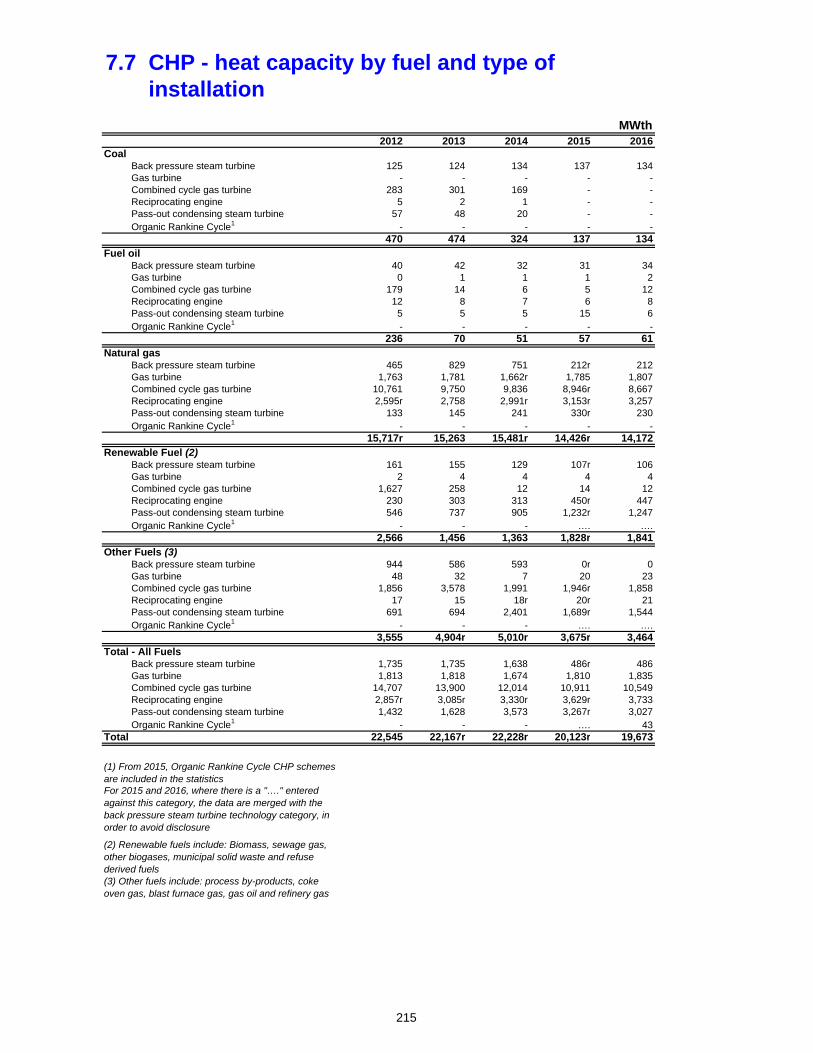
7.7 CHP - heat capacity by fuel and type of installation
MWth2012 2013 2014 2015 2016
CoalBack pressure steam turbine 125 124 134 137 134Gas turbine - - - - -Combined cycle gas turbine 283 301 169 - -Reciprocating engine 5 2 1 - -Pass-out condensing steam turbine 57 48 20 - -Organic Rankine Cycle1 - - - - -
470 474 324 137 134Fuel oil
Back pressure steam turbine 40 42 32 31 34Gas turbine 0 1 1 1 2Combined cycle gas turbine 179 14 6 5 12Reciprocating engine 12 8 7 6 8Pass-out condensing steam turbine 5 5 5 15 6Organic Rankine Cycle1 - - - - -
236 70 51 57 61Natural gas
Back pressure steam turbine 465 829 751 212r 212Gas turbine 1,763 1,781 1,662r 1,785 1,807Combined cycle gas turbine 10,761 9,750 9,836 8,946r 8,667Reciprocating engine 2,595r 2,758 2,991r 3,153r 3,257Pass-out condensing steam turbine 133 145 241 330r 230Organic Rankine Cycle1 - - - - -
15,717r 15,263 15,481r 14,426r 14,172Renewable Fuel (2)
Back pressure steam turbine 161 155 129 107r 106Gas turbine 2 4 4 4 4Combined cycle gas turbine 1,627 258 12 14 12Reciprocating engine 230 303 313 450r 447Pass-out condensing steam turbine 546 737 905 1,232r 1,247Organic Rankine Cycle1 - - - …. ….
2,566 1,456 1,363 1,828r 1,841Other Fuels (3)
Back pressure steam turbine 944 586 593 0r 0Gas turbine 48 32 7 20 23Combined cycle gas turbine 1,856 3,578 1,991 1,946r 1,858Reciprocating engine 17 15 18r 20r 21Pass-out condensing steam turbine 691 694 2,401 1,689r 1,544Organic Rankine Cycle1 - - - …. ….
3,555 4,904r 5,010r 3,675r 3,464Total - All Fuels
Back pressure steam turbine 1,735 1,735 1,638 486r 486Gas turbine 1,813 1,818 1,674 1,810 1,835Combined cycle gas turbine 14,707 13,900 12,014 10,911 10,549Reciprocating engine 2,857r 3,085r 3,330r 3,629r 3,733Pass-out condensing steam turbine 1,432 1,628 3,573 3,267r 3,027Organic Rankine Cycle1 - - - …. 43
Total 22,545 22,167r 22,228r 20,123r 19,673
(1) From 2015, Organic Rankine Cycle CHP schemes are included in the statisticsFor 2015 and 2016, where there is a "…." entered against this category, the data are merged with the back pressure steam turbine technology category, in order to avoid disclosure
(2) Renewable fuels include: Biomass, sewage gas, other biogases, municipal solid waste and refuse derived fuels(3) Other fuels include: process by-products, coke oven gas, blast furnace gas, gas oil and refinery gas
215
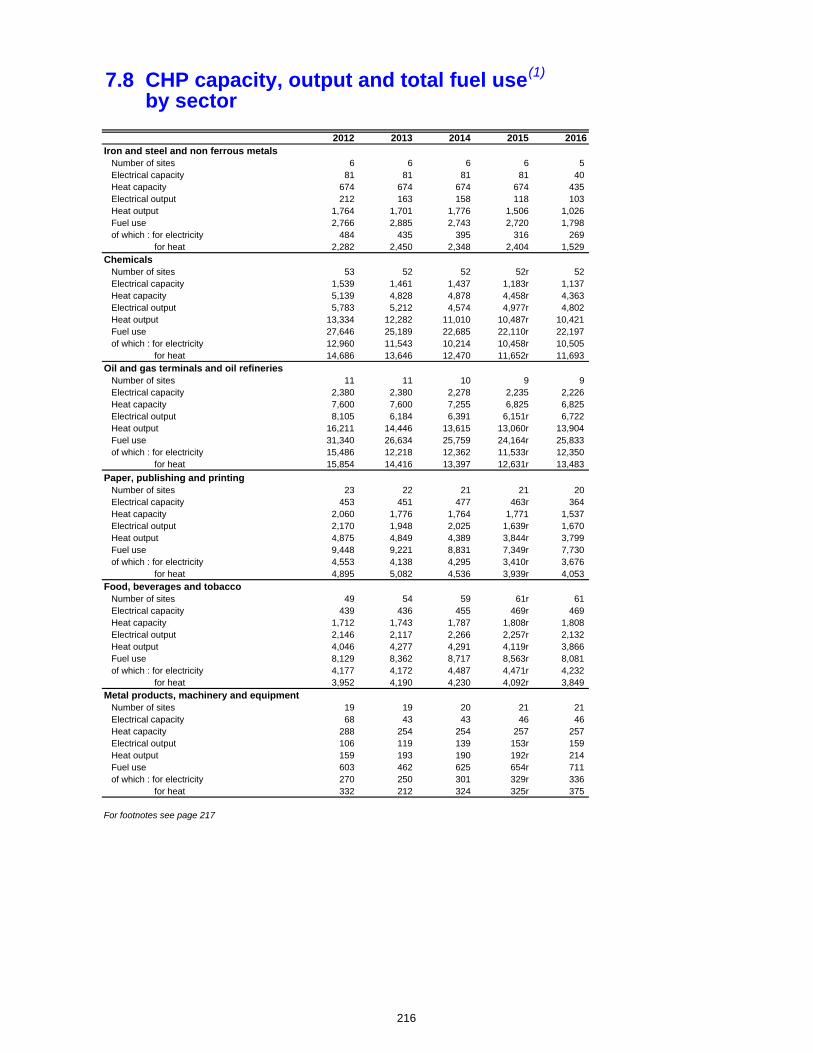
7.8 CHP capacity, output and total fuel use(1)
by sector
2012 2013 2014 2015 2016Iron and steel and non ferrous metals Number of sites 6 6 6 6 5 Electrical capacity 81 81 81 81 40 Heat capacity 674 674 674 674 435 Electrical output 212 163 158 118 103 Heat output 1,764 1,701 1,776 1,506 1,026 Fuel use 2,766 2,885 2,743 2,720 1,798 of which : for electricity 484 435 395 316 269 for heat 2,282 2,450 2,348 2,404 1,529
Chemicals Number of sites 53 52 52 52r 52 Electrical capacity 1,539 1,461 1,437 1,183r 1,137 Heat capacity 5,139 4,828 4,878 4,458r 4,363 Electrical output 5,783 5,212 4,574 4,977r 4,802 Heat output 13,334 12,282 11,010 10,487r 10,421 Fuel use 27,646 25,189 22,685 22,110r 22,197 of which : for electricity 12,960 11,543 10,214 10,458r 10,505 for heat 14,686 13,646 12,470 11,652r 11,693
Oil and gas terminals and oil refineries Number of sites 11 11 10 9 9 Electrical capacity 2,380 2,380 2,278 2,235 2,226 Heat capacity 7,600 7,600 7,255 6,825 6,825 Electrical output 8,105 6,184 6,391 6,151r 6,722 Heat output 16,211 14,446 13,615 13,060r 13,904 Fuel use 31,340 26,634 25,759 24,164r 25,833 of which : for electricity 15,486 12,218 12,362 11,533r 12,350 for heat 15,854 14,416 13,397 12,631r 13,483
Paper, publishing and printing Number of sites 23 22 21 21 20 Electrical capacity 453 451 477 463r 364 Heat capacity 2,060 1,776 1,764 1,771 1,537 Electrical output 2,170 1,948 2,025 1,639r 1,670 Heat output 4,875 4,849 4,389 3,844r 3,799 Fuel use 9,448 9,221 8,831 7,349r 7,730 of which : for electricity 4,553 4,138 4,295 3,410r 3,676 for heat 4,895 5,082 4,536 3,939r 4,053
Food, beverages and tobacco Number of sites 49 54 59 61r 61 Electrical capacity 439 436 455 469r 469 Heat capacity 1,712 1,743 1,787 1,808r 1,808 Electrical output 2,146 2,117 2,266 2,257r 2,132 Heat output 4,046 4,277 4,291 4,119r 3,866 Fuel use 8,129 8,362 8,717 8,563r 8,081 of which : for electricity 4,177 4,172 4,487 4,471r 4,232 for heat 3,952 4,190 4,230 4,092r 3,849
Metal products, machinery and equipment Number of sites 19 19 20 21 21 Electrical capacity 68 43 43 46 46 Heat capacity 288 254 254 257 257 Electrical output 106 119 139 153r 159 Heat output 159 193 190 192r 214 Fuel use 603 462 625 654r 711 of which : for electricity 270 250 301 329r 336 for heat 332 212 324 325r 375
For footnotes see page 217
216
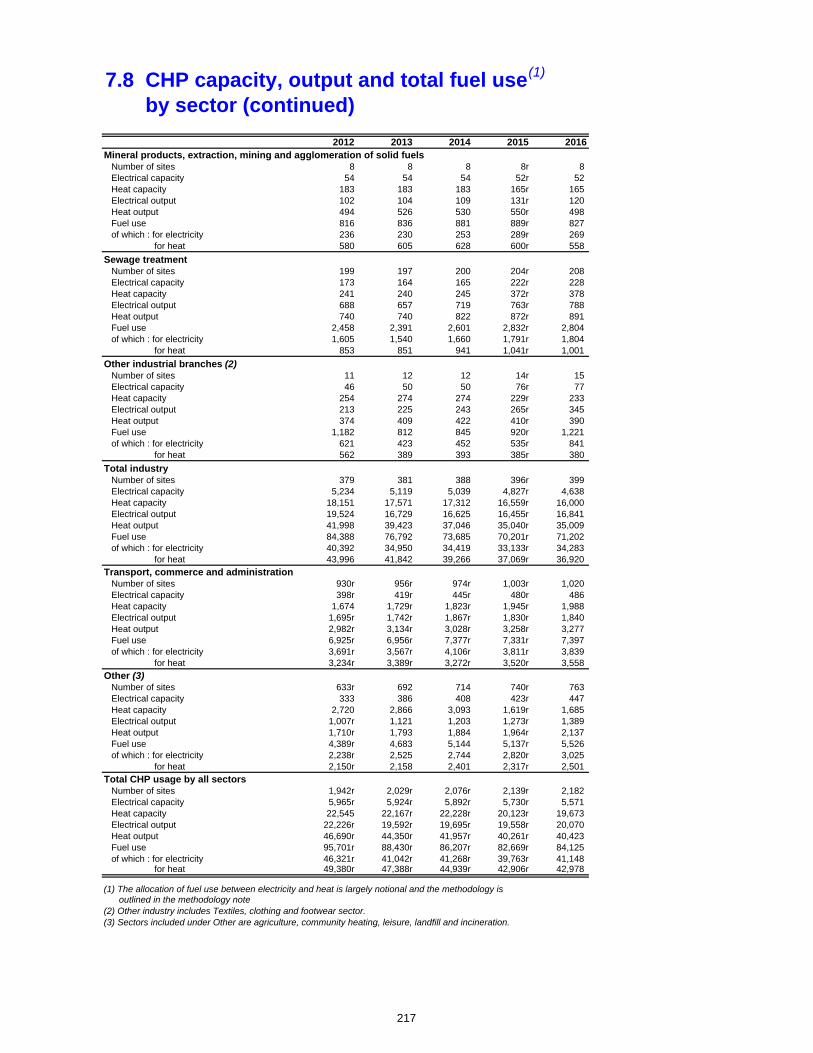
7.8 CHP capacity, output and total fuel use(1)
by sector (continued)
2012 2013 2014 2015 2016Mineral products, extraction, mining and agglomeration of solid fuels Number of sites 8 8 8 8r 8 Electrical capacity 54 54 54 52r 52 Heat capacity 183 183 183 165r 165 Electrical output 102 104 109 131r 120 Heat output 494 526 530 550r 498 Fuel use 816 836 881 889r 827 of which : for electricity 236 230 253 289r 269 for heat 580 605 628 600r 558
Sewage treatment Number of sites 199 197 200 204r 208 Electrical capacity 173 164 165 222r 228 Heat capacity 241 240 245 372r 378 Electrical output 688 657 719 763r 788 Heat output 740 740 822 872r 891 Fuel use 2,458 2,391 2,601 2,832r 2,804 of which : for electricity 1,605 1,540 1,660 1,791r 1,804 for heat 853 851 941 1,041r 1,001
Other industrial branches (2) Number of sites 11 12 12 14r 15 Electrical capacity 46 50 50 76r 77 Heat capacity 254 274 274 229r 233 Electrical output 213 225 243 265r 345 Heat output 374 409 422 410r 390 Fuel use 1,182 812 845 920r 1,221 of which : for electricity 621 423 452 535r 841 for heat 562 389 393 385r 380
Total industry Number of sites 379 381 388 396r 399 Electrical capacity 5,234 5,119 5,039 4,827r 4,638 Heat capacity 18,151 17,571 17,312 16,559r 16,000 Electrical output 19,524 16,729 16,625 16,455r 16,841 Heat output 41,998 39,423 37,046 35,040r 35,009 Fuel use 84,388 76,792 73,685 70,201r 71,202 of which : for electricity 40,392 34,950 34,419 33,133r 34,283 for heat 43,996 41,842 39,266 37,069r 36,920
Transport, commerce and administration Number of sites 930r 956r 974r 1,003r 1,020 Electrical capacity 398r 419r 445r 480r 486 Heat capacity 1,674 1,729r 1,823r 1,945r 1,988 Electrical output 1,695r 1,742r 1,867r 1,830r 1,840 Heat output 2,982r 3,134r 3,028r 3,258r 3,277 Fuel use 6,925r 6,956r 7,377r 7,331r 7,397 of which : for electricity 3,691r 3,567r 4,106r 3,811r 3,839 for heat 3,234r 3,389r 3,272r 3,520r 3,558
Other (3) Number of sites 633r 692 714 740r 763 Electrical capacity 333 386 408 423r 447 Heat capacity 2,720 2,866 3,093 1,619r 1,685 Electrical output 1,007r 1,121 1,203 1,273r 1,389 Heat output 1,710r 1,793 1,884 1,964r 2,137 Fuel use 4,389r 4,683 5,144 5,137r 5,526 of which : for electricity 2,238r 2,525 2,744 2,820r 3,025 for heat 2,150r 2,158 2,401 2,317r 2,501
Total CHP usage by all sectors Number of sites 1,942r 2,029r 2,076r 2,139r 2,182 Electrical capacity 5,965r 5,924r 5,892r 5,730r 5,571 Heat capacity 22,545 22,167r 22,228r 20,123r 19,673 Electrical output 22,226r 19,592r 19,695r 19,558r 20,070 Heat output 46,690r 44,350r 41,957r 40,261r 40,423 Fuel use 95,701r 88,430r 86,207r 82,669r 84,125 of which : for electricity 46,321r 41,042r 41,268r 39,763r 41,148 for heat 49,380r 47,388r 44,939r 42,906r 42,978
(1) The allocation of fuel use between electricity and heat is largely notional and the methodology is outlined in the methodology note(2) Other industry includes Textiles, clothing and footwear sector.(3) Sectors included under Other are agriculture, community heating, leisure, landfill and incineration.
217
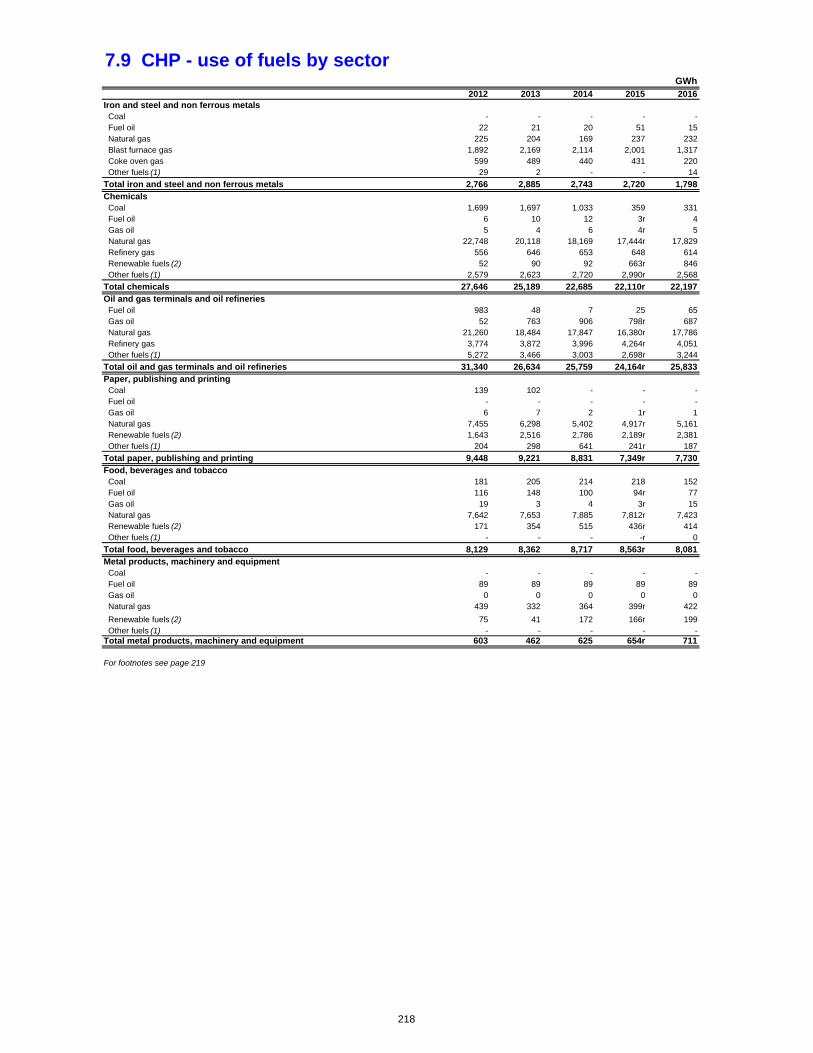
7.9 CHP - use of fuels by sector GWh
2012 2013 2014 2015 2016Iron and steel and non ferrous metals Coal - - - - - Fuel oil 22 21 20 51 15 Natural gas 225 204 169 237 232 Blast furnace gas 1,892 2,169 2,114 2,001 1,317 Coke oven gas 599 489 440 431 220 Other fuels (1) 29 2 - - 14
Total iron and steel and non ferrous metals 2,766 2,885 2,743 2,720 1,798Chemicals Coal 1,699 1,697 1,033 359 331 Fuel oil 6 10 12 3r 4 Gas oil 5 4 6 4r 5 Natural gas 22,748 20,118 18,169 17,444r 17,829 Refinery gas 556 646 653 648 614 Renewable fuels (2) 52 90 92 663r 846 Other fuels (1) 2,579 2,623 2,720 2,990r 2,568
Total chemicals 27,646 25,189 22,685 22,110r 22,197Oil and gas terminals and oil refineries Fuel oil 983 48 7 25 65 Gas oil 52 763 906 798r 687 Natural gas 21,260 18,484 17,847 16,380r 17,786 Refinery gas 3,774 3,872 3,996 4,264r 4,051 Other fuels (1) 5,272 3,466 3,003 2,698r 3,244
Total oil and gas terminals and oil refineries 31,340 26,634 25,759 24,164r 25,833Paper, publishing and printing Coal 139 102 - - - Fuel oil - - - - - Gas oil 6 7 2 1r 1 Natural gas 7,455 6,298 5,402 4,917r 5,161 Renewable fuels (2) 1,643 2,516 2,786 2,189r 2,381 Other fuels (1) 204 298 641 241r 187
Total paper, publishing and printing 9,448 9,221 8,831 7,349r 7,730Food, beverages and tobacco Coal 181 205 214 218 152 Fuel oil 116 148 100 94r 77 Gas oil 19 3 4 3r 15 Natural gas 7,642 7,653 7,885 7,812r 7,423 Renewable fuels (2) 171 354 515 436r 414 Other fuels (1) - - - -r 0
Total food, beverages and tobacco 8,129 8,362 8,717 8,563r 8,081Metal products, machinery and equipment Coal - - - - - Fuel oil 89 89 89 89 89 Gas oil 0 0 0 0 0 Natural gas 439 332 364 399r 422
Renewable fuels (2) 75 41 172 166r 199 Other fuels (1) - - - - -Total metal products, machinery and equipment 603 462 625 654r 711
For footnotes see page 219
218
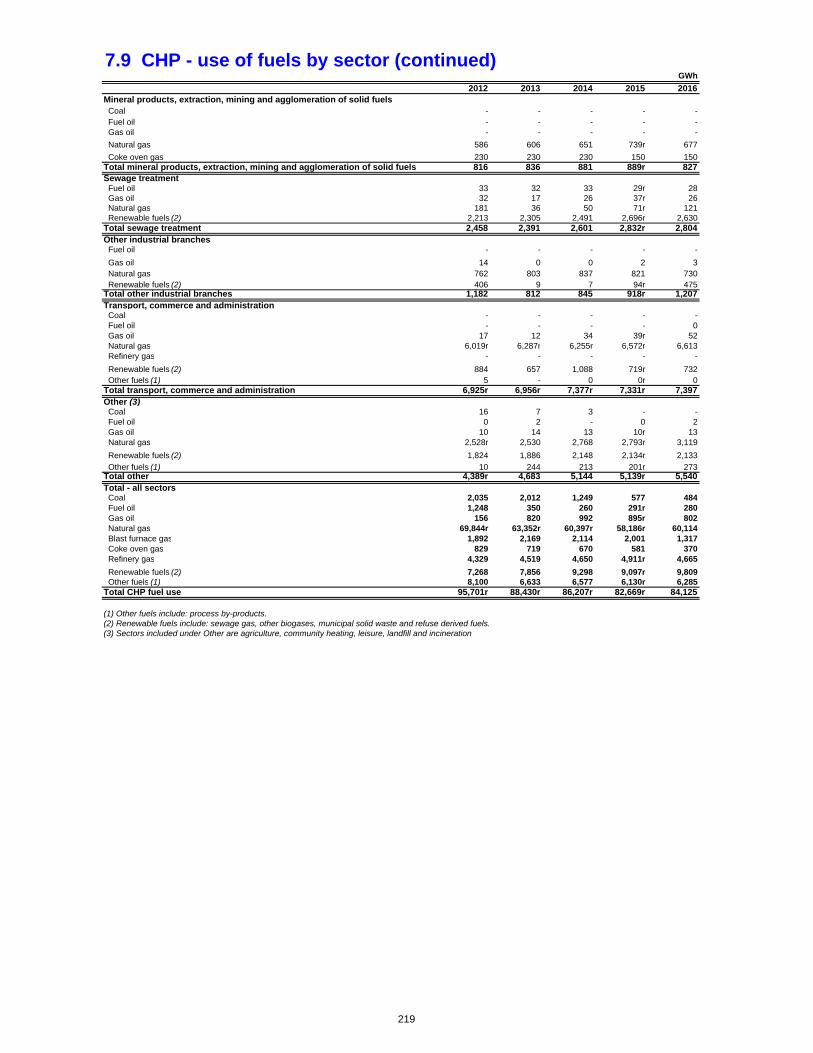
7.9 CHP - use of fuels by sector (continued)GWh
2012 2013 2014 2015 2016Mineral products, extraction, mining and agglomeration of solid fuels Coal - - - - - Fuel oil - - - - - Gas oil - - - - -
Natural gas 586 606 651 739r 677
Coke oven gas 230 230 230 150 150Total mineral products, extraction, mining and agglomeration of solid fuels 816 836 881 889r 827Sewage treatment Fuel oil 33 32 33 29r 28 Gas oil 32 17 26 37r 26 Natural gas 181 36 50 71r 121 Renewable fuels (2) 2,213 2,305 2,491 2,696r 2,630Total sewage treatment 2,458 2,391 2,601 2,832r 2,804Other industrial branches Fuel oil - - - - -
Gas oil 14 0 0 2 3 Natural gas 762 803 837 821 730 Renewable fuels (2) 406 9 7 94r 475Total other industrial branches 1,182 812 845 918r 1,207Transport, commerce and administration Coal - - - - - Fuel oil - - - - 0 Gas oil 17 12 34 39r 52 Natural gas 6,019r 6,287r 6,255r 6,572r 6,613 Refinery gas - - - - -
Renewable fuels (2) 884 657 1,088 719r 732 Other fuels (1) 5 - 0 0r 0Total transport, commerce and administration 6,925r 6,956r 7,377r 7,331r 7,397Other (3) Coal 16 7 3 - - Fuel oil 0 2 - 0 2 Gas oil 10 14 13 10r 13 Natural gas 2,528r 2,530 2,768 2,793r 3,119
Renewable fuels (2) 1,824 1,886 2,148 2,134r 2,133
Other fuels (1) 10 244 213 201r 273Total other 4,389r 4,683 5,144 5,139r 5,540Total - all sectors Coal 2,035 2,012 1,249 577 484 Fuel oil 1,248 350 260 291r 280 Gas oil 156 820 992 895r 802 Natural gas 69,844r 63,352r 60,397r 58,186r 60,114 Blast furnace gas 1,892 2,169 2,114 2,001 1,317 Coke oven gas 829 719 670 581 370 Refinery gas 4,329 4,519 4,650 4,911r 4,665
Renewable fuels (2) 7,268 7,856 9,298 9,097r 9,809 Other fuels (1) 8,100 6,633 6,577 6,130r 6,285Total CHP fuel use 95,701r 88,430r 86,207r 82,669r 84,125
(1) Other fuels include: process by-products.(2) Renewable fuels include: sewage gas, other biogases, municipal solid waste and refuse derived fuels.(3) Sectors included under Other are agriculture, community heating, leisure, landfill and incineration.
219
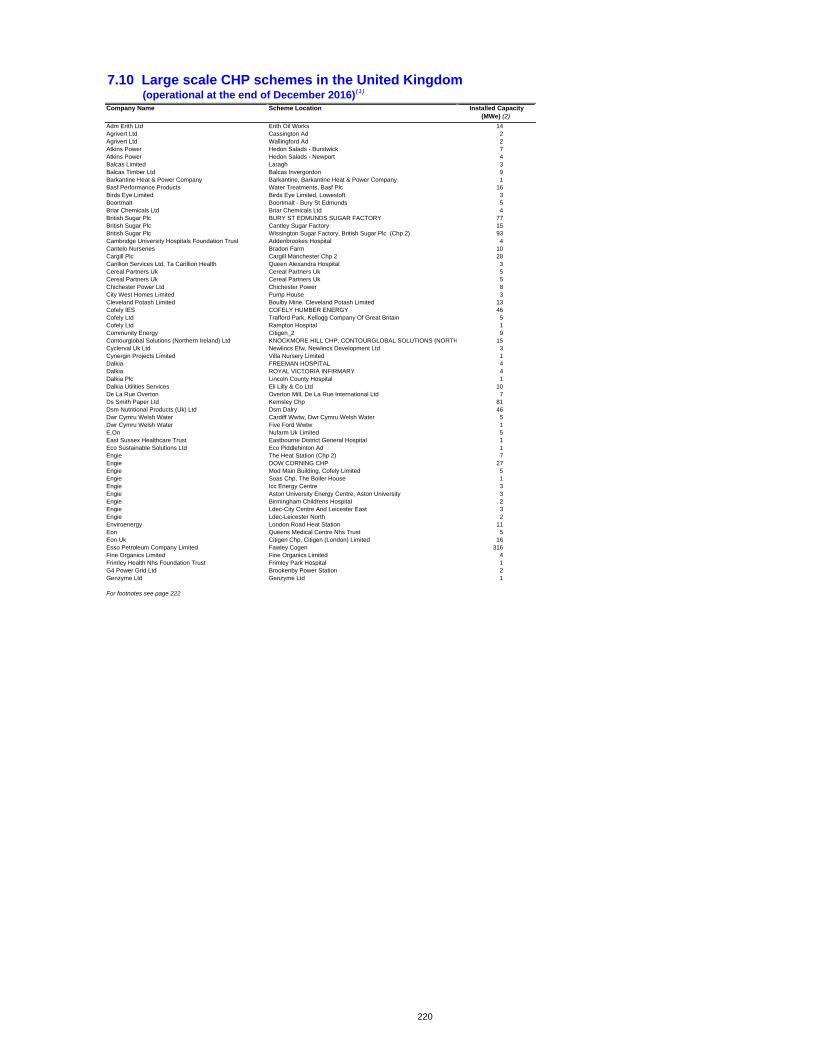
7.10 Large scale CHP schemes in the United Kingdom (operational at the end of December 2016)(1)
Company Name Scheme Location
Adm Erith Ltd Erith Oil Works 14Agrivert Ltd Cassington Ad 2Agrivert Ltd Wallingford Ad 2Atkins Power Hedon Salads - Burstwick 7Atkins Power Hedon Salads - Newport 4Balcas Limited Laragh 3Balcas Timber Ltd Balcas Invergordon 9Barkantine Heat & Power Company Barkantine, Barkantine Heat & Power Company 1Basf Performance Products Water Treatments, Basf Plc 16Birds Eye Limited Birds Eye Limited, Lowestoft 3Boortmalt Boortmalt - Bury St Edmunds 5Briar Chemicals Ltd Briar Chemicals Ltd 4British Sugar Plc BURY ST EDMUNDS SUGAR FACTORY 77British Sugar Plc Cantley Sugar Factory 15British Sugar Plc Wissington Sugar Factory, British Sugar Plc (Chp 2) 93Cambridge University Hospitals Foundation Trust Addenbrookes Hospital 4Cantelo Nurseries Bradon Farm 10Cargill Plc Cargill Manchester Chp 2 28Carillion Services Ltd, Ta Carillion Health Queen Alexandra Hospital 3Cereal Partners Uk Cereal Partners Uk 5Cereal Partners Uk Cereal Partners Uk 5Chichester Power Ltd Chichester Power 8City West Homes Limited Pump House 3Cleveland Potash Limited Boulby Mine. Cleveland Potash Limited 13Cofely IES COFELY HUMBER ENERGY 46Cofely Ltd Trafford Park, Kellogg Company Of Great Britain 5Cofely Ltd Rampton Hospital 1Community Energy Citigen_2 9Contourglobal Solutions (Northern Ireland) Ltd KNOCKMORE HILL CHP, CONTOURGLOBAL SOLUTIONS (NORTH 15Cyclerval Uk Ltd Newlincs Efw, Newlincs Development Ltd 3Cynergin Projects Limited Villa Nursery Limited 1Dalkia FREEMAN HOSPITAL 4Dalkia ROYAL VICTORIA INFIRMARY 4Dalkia Plc Lincoln County Hospital 1Dalkia Utilities Services Eli Lilly & Co Ltd 10De La Rue Overton Overton Mill, De La Rue International Ltd 7Ds Smith Paper Ltd Kemsley Chp 81Dsm Nutritional Products (Uk) Ltd Dsm Dalry 46Dwr Cymru Welsh Water Cardiff Wwtw, Dwr Cymru Welsh Water 5Dwr Cymru Welsh Water Five Ford Wwtw 1E.On Nufarm Uk Limited 5East Sussex Healthcare Trust Eastbourne District General Hospital 1Eco Sustainable Solutions Ltd Eco Piddlehinton Ad 1Engie The Heat Station (Chp 2) 7Engie DOW CORNING CHP 27Engie Mod Main Building, Cofely Limited 5Engie Soas Chp, The Boiler House 1Engie Icc Energy Centre 3Engie Aston University Energy Centre, Aston University 3Engie Birmingham Childrens Hospital 2Engie Ldec-City Centre And Leicester East 3Engie Ldec-Leicester North 2Enviroenergy London Road Heat Station 11Eon Queens Medical Centre Nhs Trust 5Eon Uk Citigen Chp, Citigen (London) Limited 16Esso Petroleum Company Limited Fawley Cogen 316Fine Organics Limited Fine Organics Limited 4Frimley Health Nhs Foundation Trust Frimley Park Hospital 1G4 Power Grid Ltd Brookenby Power Station 2Genzyme Ltd Genzyme Ltd 1
For footnotes see page 222
Installed Capacity (MWe) (2)
220
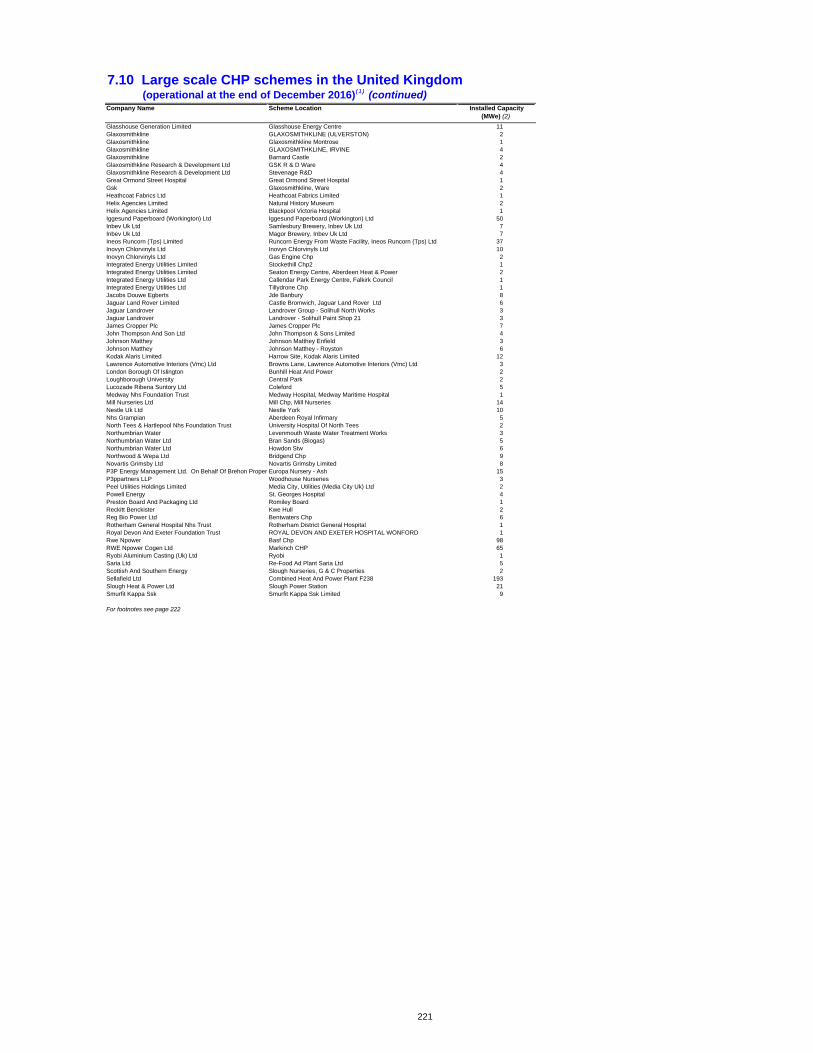
7.10 Large scale CHP schemes in the United Kingdom (operational at the end of December 2016)(1) (continued)Company Name Scheme Location
Glasshouse Generation Limited Glasshouse Energy Centre 11Glaxosmithkline GLAXOSMITHKLINE (ULVERSTON) 2Glaxosmithkline Glaxosmithkline Montrose 1Glaxosmithkline GLAXOSMITHKLINE, IRVINE 4Glaxosmithkline Barnard Castle 2Glaxosmithkline Research & Development Ltd GSK R & D Ware 4Glaxosmithkline Research & Development Ltd Stevenage R&D 4Great Ormond Street Hospital Great Ormond Street Hospital 1Gsk Glaxosmithkline, Ware 2Heathcoat Fabrics Ltd Heathcoat Fabrics Limited 1Helix Agencies Limited Natural History Museum 2Helix Agencies Limited Blackpool Victoria Hospital 1Iggesund Paperboard (Workington) Ltd Iggesund Paperboard (Workington) Ltd 50Inbev Uk Ltd Samlesbury Brewery, Inbev Uk Ltd 7Inbev Uk Ltd Magor Brewery, Inbev Uk Ltd 7Ineos Runcorn (Tps) Limited Runcorn Energy From Waste Facility, Ineos Runcorn (Tps) Ltd 37Inovyn Chlorvinyls Ltd Inovyn Chlorvinyls Ltd 10Inovyn Chlorvinyls Ltd Gas Engine Chp 2Integrated Energy Utilities Limited Stockethill Chp2 1Integrated Energy Utilities Limited Seaton Energy Centre, Aberdeen Heat & Power 2Integrated Energy Utilities Ltd Callendar Park Energy Centre, Falkirk Council 1Integrated Energy Utilities Ltd Tillydrone Chp 1Jacobs Douwe Egberts Jde Banbury 8Jaguar Land Rover Limited Castle Bromwich, Jaguar Land Rover Ltd 6Jaguar Landrover Landrover Group - Solihull North Works 3Jaguar Landrover Landrover - Solihull Paint Shop 21 3James Cropper Plc James Cropper Plc 7John Thompson And Son Ltd John Thompson & Sons Limited 4Johnson Matthey Johnson Matthey Enfield 3Johnson Matthey Johnson Matthey - Royston 6Kodak Alaris Limited Harrow Site, Kodak Alaris Limited 12Lawrence Automotive Interiors (Vmc) Ltd Browns Lane, Lawrence Automotive Interiors (Vmc) Ltd 3London Borough Of Islington Bunhill Heat And Power 2Loughborough University Central Park 2Lucozade Ribena Suntory Ltd Coleford 5Medway Nhs Foundation Trust Medway Hospital, Medway Maritime Hospital 1Mill Nurseries Ltd Mill Chp, Mill Nurseries 14Nestle Uk Ltd Nestle York 10Nhs Grampian Aberdeen Royal Infirmary 5North Tees & Hartlepool Nhs Foundation Trust University Hospital Of North Tees 2Northumbrian Water Levenmouth Waste Water Treatment Works 3Northumbrian Water Ltd Bran Sands (Biogas) 5Northumbrian Water Ltd Howdon Stw 6Northwood & Wepa Ltd Bridgend Chp 9Novartis Grimsby Ltd Novartis Grimsby Limited 8P3P Energy Management Ltd. On Behalf Of Brehon Proper Europa Nursery - Ash 15P3ppartners LLP Woodhouse Nurseries 3Peel Utilities Holdings Limited Media City, Utilities (Media City Uk) Ltd 2Powell Energy St. Georges Hospital 4Preston Board And Packaging Ltd Romiley Board 1Reckitt Benckister Kwe Hull 2Reg Bio Power Ltd Bentwaters Chp 6Rotherham General Hospital Nhs Trust Rotherham District General Hospital 1Royal Devon And Exeter Foundation Trust ROYAL DEVON AND EXETER HOSPITAL WONFORD 1Rwe Npower Basf Chp 98RWE Npower Cogen Ltd Markinch CHP 65Ryobi Aluminium Casting (Uk) Ltd Ryobi 1Saria Ltd Re-Food Ad Plant Saria Ltd 5Scottish And Southern Energy Slough Nurseries, G & C Properties 2Sellafield Ltd Combined Heat And Power Plant F238 193Slough Heat & Power Ltd Slough Power Station 21Smurfit Kappa Ssk Smurfit Kappa Ssk Limited 9
For footnotes see page 222
Installed Capacity (MWe) (2)
221
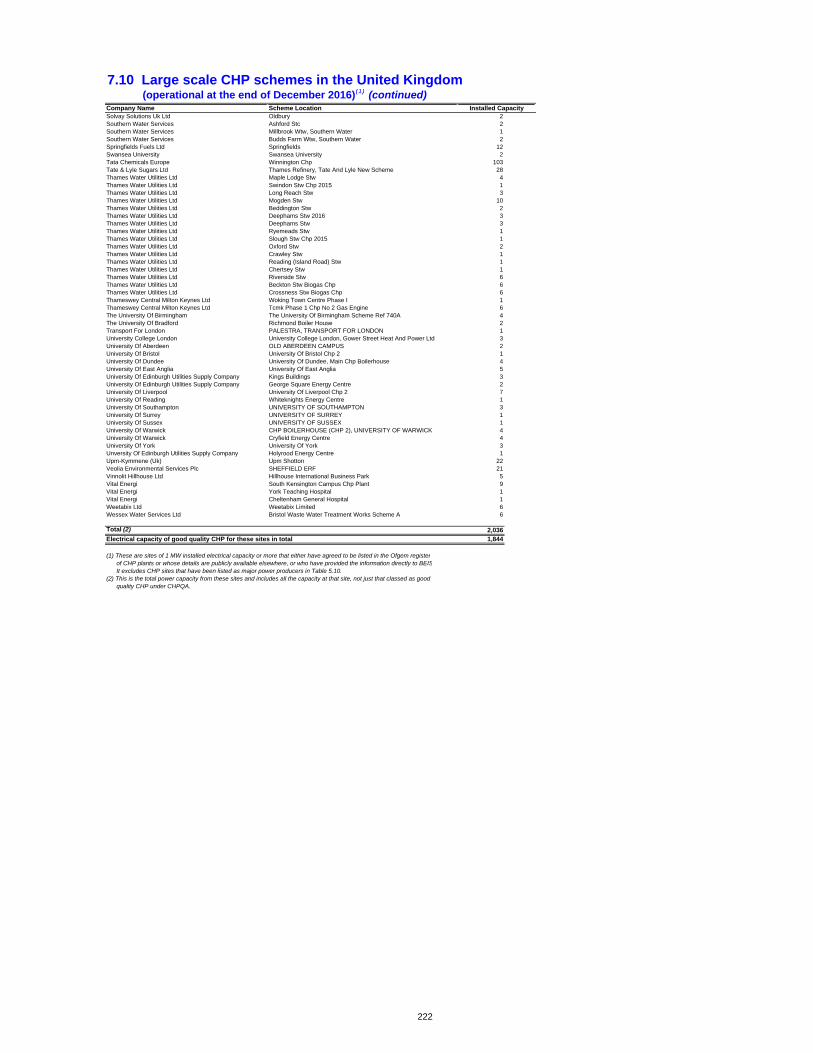
7.10 Large scale CHP schemes in the United Kingdom (operational at the end of December 2016)(1) (continued)Company Name Scheme LocationSolvay Solutions Uk Ltd Oldbury 2Southern Water Services Ashford Stc 2Southern Water Services Millbrook Wtw, Southern Water 1Southern Water Services Budds Farm Wtw, Southern Water 2Springfields Fuels Ltd Springfields 12Swansea University Swansea University 2Tata Chemicals Europe Winnington Chp 103Tate & Lyle Sugars Ltd Thames Refinery, Tate And Lyle New Scheme 28Thames Water Utilities Ltd Maple Lodge Stw 4Thames Water Utilities Ltd Swindon Stw Chp 2015 1Thames Water Utilities Ltd Long Reach Stw 3Thames Water Utilities Ltd Mogden Stw 10Thames Water Utilities Ltd Beddington Stw 2Thames Water Utilities Ltd Deephams Stw 2016 3Thames Water Utilities Ltd Deephams Stw 3Thames Water Utilities Ltd Ryemeads Stw 1Thames Water Utilities Ltd Slough Stw Chp 2015 1Thames Water Utilities Ltd Oxford Stw 2Thames Water Utilities Ltd Crawley Stw 1Thames Water Utilities Ltd Reading (Island Road) Stw 1Thames Water Utilities Ltd Chertsey Stw 1Thames Water Utilities Ltd Riverside Stw 6Thames Water Utilities Ltd Beckton Stw Biogas Chp 6Thames Water Utilities Ltd Crossness Stw Biogas Chp 6Thameswey Central Milton Keynes Ltd Woking Town Centre Phase I 1Thameswey Central Milton Keynes Ltd Tcmk Phase 1 Chp No 2 Gas Engine 6The University Of Birmingham The University Of Birmingham Scheme Ref 740A 4The University Of Bradford Richmond Boiler House 2Transport For London PALESTRA, TRANSPORT FOR LONDON 1University College London University College London, Gower Street Heat And Power Ltd 3University Of Aberdeen OLD ABERDEEN CAMPUS 2University Of Bristol University Of Bristol Chp 2 1University Of Dundee University Of Dundee, Main Chp Boilerhouse 4University Of East Anglia University Of East Anglia 5University Of Edinburgh Utilities Supply Company Kings Buildings 3University Of Edinburgh Utilities Supply Company George Square Energy Centre 2University Of Liverpool University Of Liverpool Chp 2 7University Of Reading Whiteknights Energy Centre 1University Of Southampton UNIVERSITY OF SOUTHAMPTON 3University Of Surrey UNIVERSITY OF SURREY 1University Of Sussex UNIVERSITY OF SUSSEX 1University Of Warwick CHP BOILERHOUSE (CHP 2), UNIVERSITY OF WARWICK 4University Of Warwick Cryfield Energy Centre 4University Of York University Of York 3Unversity Of Edinburgh Utilities Supply Company Holyrood Energy Centre 1Upm-Kymmene (Uk) Upm Shotton 22Veolia Environmental Services Plc SHEFFIELD ERF 21Vinnolit Hillhouse Ltd Hillhouse International Business Park 5Vital Energi South Kensington Campus Chp Plant 9Vital Energi York Teaching Hospital 1Vital Energi Cheltenham General Hospital 1Weetabix Ltd Weetabix Limited 6Wessex Water Services Ltd Bristol Waste Water Treatment Works Scheme A 6
Total (2) 2,036
Electrical capacity of good quality CHP for these sites in total 1,844
(1) These are sites of 1 MW installed electrical capacity or more that either have agreed to be listed in the Ofgem register of CHP plants or whose details are publicly available elsewhere, or who have provided the information directly to BEIS It excludes CHP sites that have been listed as major power producers in Table 5.10.(2) This is the total power capacity from these sites and includes all the capacity at that site, not just that classed as good quality CHP under CHPQA.
Installed Capacity
222
223
Digest of United Kingdom Energy Statistics 2017
Annexes Annex A: Energy and commodity
balances, conversion factors and calorific values
Annex B: Glossary and acronyms Annex C: Further sources of UK
energy publications
Annex D: Major events in the Energy Industry, 2015-2017
Department for Business, Energy and Industrial Strategy

224
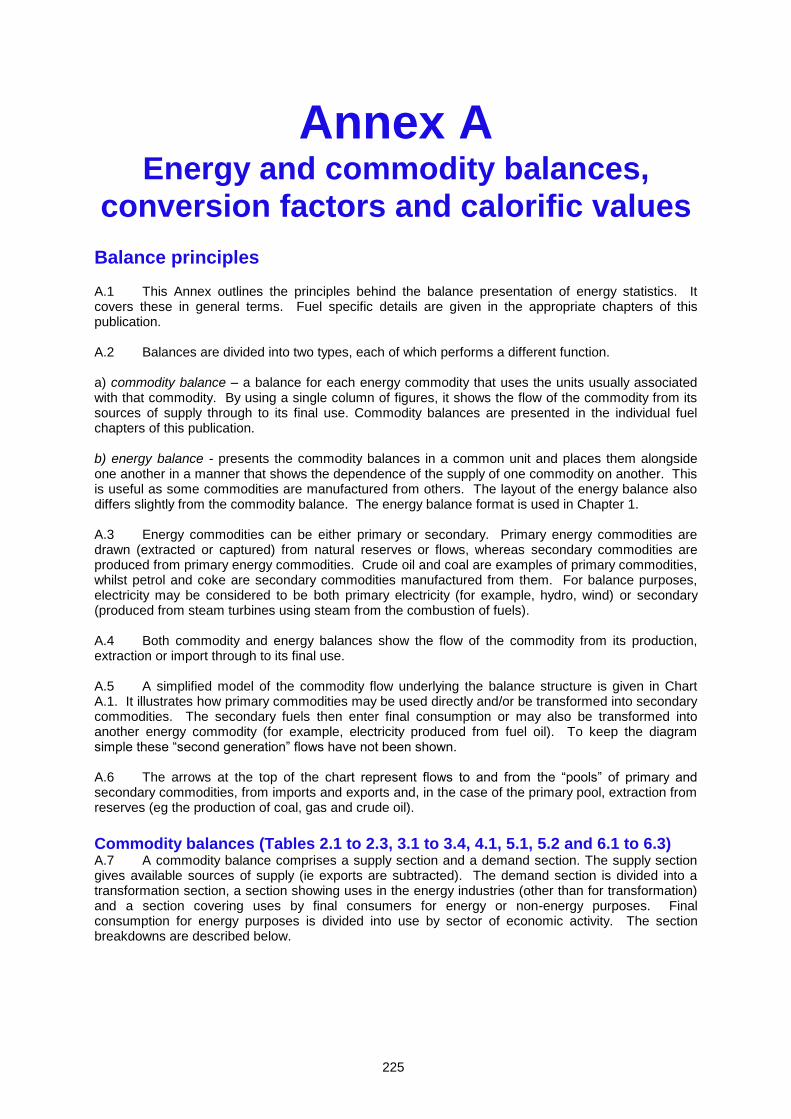
225
Annex A Energy and commodity balances,
conversion factors and calorific values
Balance principles A.1 This Annex outlines the principles behind the balance presentation of energy statistics. It covers these in general terms. Fuel specific details are given in the appropriate chapters of this publication. A.2 Balances are divided into two types, each of which performs a different function. a) commodity balance – a balance for each energy commodity that uses the units usually associated with that commodity. By using a single column of figures, it shows the flow of the commodity from its sources of supply through to its final use. Commodity balances are presented in the individual fuel chapters of this publication. b) energy balance - presents the commodity balances in a common unit and places them alongside one another in a manner that shows the dependence of the supply of one commodity on another. This is useful as some commodities are manufactured from others. The layout of the energy balance also differs slightly from the commodity balance. The energy balance format is used in Chapter 1. A.3 Energy commodities can be either primary or secondary. Primary energy commodities are drawn (extracted or captured) from natural reserves or flows, whereas secondary commodities are produced from primary energy commodities. Crude oil and coal are examples of primary commodities, whilst petrol and coke are secondary commodities manufactured from them. For balance purposes, electricity may be considered to be both primary electricity (for example, hydro, wind) or secondary (produced from steam turbines using steam from the combustion of fuels). A.4 Both commodity and energy balances show the flow of the commodity from its production, extraction or import through to its final use. A.5 A simplified model of the commodity flow underlying the balance structure is given in Chart A.1. It illustrates how primary commodities may be used directly and/or be transformed into secondary commodities. The secondary fuels then enter final consumption or may also be transformed into another energy commodity (for example, electricity produced from fuel oil). To keep the diagram simple these “second generation” flows have not been shown. A.6 The arrows at the top of the chart represent flows to and from the “pools” of primary and secondary commodities, from imports and exports and, in the case of the primary pool, extraction from reserves (eg the production of coal, gas and crude oil).
Commodity balances (Tables 2.1 to 2.3, 3.1 to 3.4, 4.1, 5.1, 5.2 and 6.1 to 6.3) A.7 A commodity balance comprises a supply section and a demand section. The supply section
gives available sources of supply (ie exports are subtracted). The demand section is divided into a transformation section, a section showing uses in the energy industries (other than for transformation) and a section covering uses by final consumers for energy or non-energy purposes. Final consumption for energy purposes is divided into use by sector of economic activity. The section breakdowns are described below.
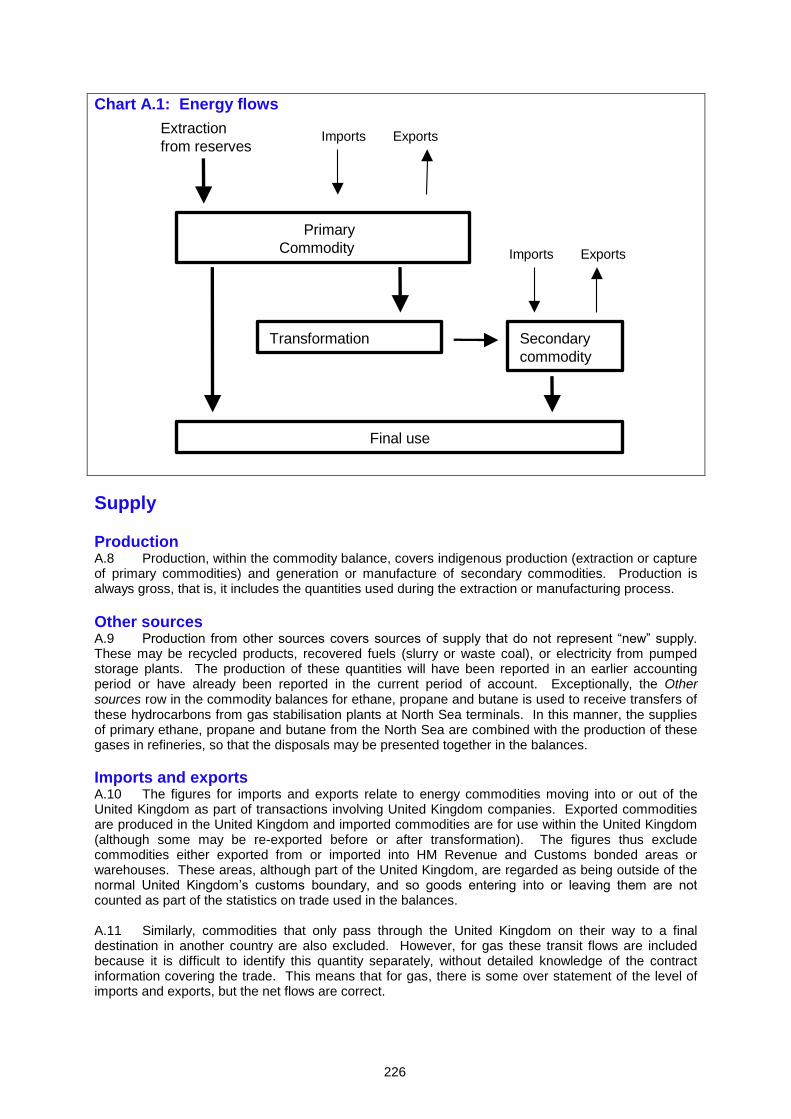
226
Chart A.1: Energy flows
Supply
Production A.8 Production, within the commodity balance, covers indigenous production (extraction or capture of primary commodities) and generation or manufacture of secondary commodities. Production is always gross, that is, it includes the quantities used during the extraction or manufacturing process.
Other sources A.9 Production from other sources covers sources of supply that do not represent “new” supply. These may be recycled products, recovered fuels (slurry or waste coal), or electricity from pumped storage plants. The production of these quantities will have been reported in an earlier accounting period or have already been reported in the current period of account. Exceptionally, the Other sources row in the commodity balances for ethane, propane and butane is used to receive transfers of these hydrocarbons from gas stabilisation plants at North Sea terminals. In this manner, the supplies of primary ethane, propane and butane from the North Sea are combined with the production of these gases in refineries, so that the disposals may be presented together in the balances.
Imports and exports A.10 The figures for imports and exports relate to energy commodities moving into or out of the United Kingdom as part of transactions involving United Kingdom companies. Exported commodities are produced in the United Kingdom and imported commodities are for use within the United Kingdom (although some may be re-exported before or after transformation). The figures thus exclude commodities either exported from or imported into HM Revenue and Customs bonded areas or warehouses. These areas, although part of the United Kingdom, are regarded as being outside of the normal United Kingdom’s customs boundary, and so goods entering into or leaving them are not counted as part of the statistics on trade used in the balances. A.11 Similarly, commodities that only pass through the United Kingdom on their way to a final destination in another country are also excluded. However, for gas these transit flows are included because it is difficult to identify this quantity separately, without detailed knowledge of the contract information covering the trade. This means that for gas, there is some over statement of the level of imports and exports, but the net flows are correct.
Extraction
from reservesImports Exports
Primary
Commodity
Transformation Secondary
commodity
Final use
Imports Exports
227
A.12 The convention in these balances is that exports are shown with a negative sign.
Marine bunkers A.13 These are deliveries of fuels (usually fuel oil or gas oil) to ships of any flag (including the United Kingdom) for consumption during their voyage to other countries. Marine bunkers are treated rather like exports and shown with a negative sign.
Stock changes A.14 Additions to (- sign) and withdrawals from stocks (+ sign) held by producers and transformation industries correspond to withdrawals from and additions to supply, respectively.
Transfers A.15 There are several reasons why quantities may be transferred from one commodity balance to another:
a commodity may no longer meet the original specification and be reclassified;
the name of the commodity may change through a change in use;
to show quantities returned to supply from consumers. These may be by-products of the use of commodities as raw materials rather than fuels.
A.16 A quantity transferred from a balance is shown with a negative sign to represent a withdrawal from supply and with a positive sign in the receiving commodity balance representing an addition to its supply. The transfers’ row in Tables 1.1 to 1.3 should ideally sum to zero with transfers from primary oils to petroleum products amounting to a net figure of zero. Similarly the manufactured gases and natural gas transfers should sum to zero. However differences in calorific values between the transferred fuels can result in non-zero values.
Total supply A.17 The total supply available for national use is obtained by summing the flows above this entry in the balance.
Total demand A.18 The various figures for the disposals and/or consumption of the commodities are summed to provide a measure of the demand for them. The main categories or sectors of demand are described in paragraphs A.31 to A.42.
Statistical difference A.19 Any excess of supply over demand is shown as a statistical difference. A negative figure indicates that demand exceeds supply. Statistical differences arise when figures are gathered from a variety of independent sources and reflect differences in timing, in definition of coverage of the activity, or in commodity definition. Differences also arise for methodological reasons in the measurement of the flow of the commodity eg if there are differences between the volumes recorded by the gas producing companies and the gas transporting companies. A non-zero statistical difference is normal and, provided that it is not too large, is preferable to a statistical difference of zero as this suggests that a data provider has adjusted a figure to balance the account.
Transformation A.20 The transformation section of the balance covers those processes and activities that transform the original primary (and sometimes secondary) commodity into a form which is better suited for specific uses than the original form. Most of the transformation activities correspond to particular energy industries whose main business is to manufacture the product associated with them. Certain activities involving transformation take place to make products that are only partly used for energy needs (coke oven coke) or are by-products of other manufacturing processes (coke oven and blast furnace gases). However, as these products and by-products are then used, at least in part, for their energy content they are included in the balance system. A.21 The figures given under the activity headings of this section represent the quantities used for transformation. The production of the secondary commodities will be shown in the Production row of the corresponding commodity balances. The transformation section of the energy balance shows, for each fuel, the net inputs for transformation uses. For example, Table 1.1 for 2016 shows that 1,384
228
thousand tonnes of oil equivalent of coal feeds into the production of 1,303 thousand tonnes of oil equivalent of coke, representing a loss of 81 thousand tonnes of oil equivalent in the manufacture of coke in 2016. In 2016, energy losses during the production of electricity and other secondary fuels amounted to 37.4 million tonnes of oil equivalent, (19 per cent of primary supply) shown in the transformation row in Table 1.1.
Electricity generation A.22 The quantities of fuels burned for the generation of electricity are shown in their commodity balances under this heading. The activity is divided into two parts, covering the major power producers (for whom the main business is the generation of electricity for sale) and autogenerators (whose main business is not electricity generation but who produce electricity for their own needs and may also sell surplus quantities). The amounts of fuels shown in the balance represent the quantities consumed for the gross generation of electricity. Where a generator uses combined heat and power plant, the figures include only the part of the fuel use corresponding to the electricity generated. A.23 In relation to autogenerators’ data, the figures for quantities of fuel used for electricity generation appear under the appropriate fuel headings in the Transformation section heading for Autogenerators, whilst the electricity generated appears in the Electricity column under Production. A breakdown of the information according to the branch of industry in which the generation occurs is not shown in the balance but is given in Chapter 5, Table 5.4. The figures for energy commodities consumed by the industry branches shown under final consumption include all use of electricity, but exclude the fuels combusted by the industry branches to generate the electricity.
Heat generation A.24 The quantities of fuel burned to generate heat that is sold under the provision of a contract to a third party are shown in their commodity balances under this heading. It includes heat that is generated and sold by combined heat and power plants and by community heating schemes (also called district heating).
Petroleum refineries A.25 Crude oil, natural gas liquids and other oils needed by refineries for the manufacture of finished petroleum products are shown under this heading.
Coke manufacture and blast furnaces A.26 Quantities of coal for coke ovens and all fuels used within blast furnaces are shown under this heading. The consumption of fuels for heating coke ovens and the blast air for blast furnaces are shown under Energy industry use.
Patent fuel manufacture A.27 The coals and other solid fuels used for the manufacture of solid patent fuels are reported under this heading.
Other A.28 Any minor transformation activities not specified elsewhere are captured under this heading.
Energy industry use A.29 Consumption by both extraction and transformation industries to support the transformation process (but not for transformation itself) are included here according to the energy industry concerned. Typical examples are the consumption of electricity in power plants (eg for lighting, compressors and cooling systems) and the use of extracted gases on oil and gas platforms for compressors, pumps and other uses. The headings in this section are identical to those used in the transformation section with the exception of Pumped storage. In this case, the electricity used to pump the water to the reservoir is reported. This section also includes consumption by those parts of the iron and steel industry which behave like an energy industry i.e. they are involved in the transformation processes (see paragraph A.20 of Annex A). In 2016, energy industry use amounted to 11.9 million tonnes of oil equivalent of energy (5.9 per cent of primary demand), down 4.8 per cent on 2015, reflecting the reduced energy needed as coal production fell and less coke manufacture. This series broadly follows the trend in UK energy production, so has generally been falling since 2000.

229
Losses A.30 This heading covers the intrinsic losses that occur during the transmission and distribution of electricity and gas (including manufactured gases). Other metering and accounting differences for gas and electricity are within the statistical difference, as are undeclared losses in other commodities.
Final consumption A.31 Final consumption covers both final energy consumption (by different consuming sectors) and the use of energy commodities for non-energy purposes, that is Non energy use. Final consumption occurs when the commodities used are not for transformation into secondary commodities. The energy concerned disappears from the account after use. Any fuel used for electricity generation by final consumers is identified and reported separately within the transformation section. When an enterprise generates electricity, the figure for final consumption of the industrial sector to which the enterprise belongs includes its use of the electricity it generates itself (as well as supplies of electricity it purchases from others) but does not include the fuel used to generate that electricity. A.32 The classification of consumers according to their main business follows, as far as practicable, the Standard Industrial Classification (SIC2007). The qualifications to, and constraints on, the classification are described in the technical notes to Chapter 1. Table 1G in Chapter 1 shows the breakdown of final consumers used, and how this corresponds to the SIC2007.
Industry A.33 Two sectors of industry (iron and steel and chemicals) require special mention because the activities they undertake fall across the transformation, final consumption and non-energy classifications used for the balances. Also, the data permitting an accurate allocation of fuel use within each of these major divisions are not readily available.
Iron and steel A.34 The iron and steel industry is a heavy energy user for transformation and final consumption activities. Figures shown under final consumption for this industry branch reflect the amounts that remain after quantities used for transformation and energy sector own use have been subtracted from the industry’s total energy requirements. Use of fuels for transformation by the industry may be identified within the transformation section of the commodity balances. A.35 The amounts of coal used for coke manufacture by the iron and steel industry are in the transformation section of the coal balance. Included in this figure is the amount of coal used for coke manufacture by the companies outside of the iron and steel industry, ie solid fuel manufacturers. The corresponding production of coke and coke oven gas may be found in the commodity balances for these products. The use of coke in blast furnaces is shown in the commodity balance for coke, and the gases produced from blast furnaces and the associated basic oxygen steel furnaces are shown in the production row of the commodity balance for blast furnace gas. A.36 Fuels used for electricity generation by the industry are included in the figures for electricity generation by autogenerators and are not distinguishable as being used by the iron and steel sector in the balances. Electricity generation and fuel used for this by broad industry group are given in Table 5.4. A.37 Fuels used to support coke manufacture and blast furnace gas production are included in the quantities shown under Energy industry use. These gases and other fuels do not enter coke ovens or blast furnaces, but are used to heat the ovens and the blast air supplied to furnaces.
Chemicals A.38 The petro-chemical industry uses hydrocarbon fuels (mostly oil products and gases) as feedstock for the manufacture of its products. Distinguishing the energy use of delivered fuels from their non-energy use is complicated by the absence of detailed information. The procedures adopted to estimate the use are described in paragraphs A.41 and A.42 under Non energy use.
Transport A.39 Figures under this heading are almost entirely quantities used strictly for transport purposes. However, the figures recorded against road transport may include some fuel that is actually consumed
230
in some “off-road” activities. Similarly, figures for railway fuels may include some amounts of burning oil not used directly for transport purposes. Transport sector use of electricity includes electricity used by rail companies (both over and underground) for traction purposes, and electricity used by electric road vehicles. The electricity used for non-traction purposes in industries classified to SIC2007 Groups 49 to 51 is included within the commercial sector. Fuels supplied to cargo and passenger ships undertaking international voyages are reported as Marine bunkers (see paragraph A.13). Supplies to fishing vessels are included under “agriculture”.
Other sectors A.40 The classification of all consumers groups under this heading, except domestic and transport, follows SIC2007 and is described in Table 1G in Chapter 1. The consistency of the classification across different commodities cannot be guaranteed because the figures reported are dependent on what the data suppliers can provide.
Non energy use A.41 The non energy use of fuels may be divided into two types. They may be used directly for their physical properties eg lubricants or bitumen used for road surfaces, or by the petro-chemical industry as raw materials for the manufacture of goods such as plastics. In their use by the petro-chemical industry, relatively little combustion of the fuels takes place and the carbon and/or hydrogen they contain are largely transferred into the finished product. However, in some cases heat from the manufacturing process or from combustion of by-products may be used. Data for this energy use are rarely available. Depending on the feedstock, non energy consumption is either estimated or taken to be the deliveries to the chemicals sector. A.42 Both types of non energy use are shown under the Non energy use heading at the foot of the balances.
The energy balance (Tables 1.1 to 1.3)
Principles A.43 The energy balance conveniently presents:
an overall view of the United Kingdom’s energy supplies;
the relative importance of each energy commodity;
dependence on imports;
the contribution of our own fossil and renewable resources;
the interdependence of commodities on one another. A.44 The energy balance is constructed directly from the commodity balances by expressing the data in a common unit, placing them beside one another and adding appropriate totals. Heat sold is also included as a fuel. However, some rearrangements of the commodity balance format is required to show transformation of primary into secondary commodities in an easily understood manner. A.45 Energy units are widely used as the common unit, and the current practice for the United Kingdom and the international organisations which prepare balances is to use the tonne of oil equivalent or a larger multiple of this unit, commonly thousands. One tonne of oil equivalent is defined as 10
7 kilocalories (41.868 gigajoules). The tonne of oil equivalent is another unit of energy like the
gigajoule, kilocalorie or kilowatt hour, rather than a physical quantity. It has been chosen as it is easier to visualise than the other units. Due to the natural variations in heating value of primary fuels such as crude oil, it is rare that one tonne of oil has an energy content equivalent to one tonne of oil equivalent, however it is generally within a few per cent of the heating value of a tonne of oil equivalent. The energy figures are calculated from the natural units of the commodity balances by multiplying by the factors representing the calorific (heating) value of the fuel. The gross calorific values of fuels are used for this purpose. When the natural unit of the commodity is already an energy unit (electricity in kilowatt hours, for example) the factors are just constants, converting one energy unit to another. A.46 Most of the underlying definitions and ideas of commodity balances can be taken directly over into the energy balance. However, production of secondary commodities and, in particular, electricity
231
are treated differently and need some explanation. The components of the energy balance are described below, drawing out the differences of treatment compared with the commodity balances.
Primary supply A.47 Within the energy balance, the production row covers only extraction of primary fuels and the generation of primary energy (hydro, nuclear, wind, solar photovoltaics). Note the change of row heading from Production in the commodity balances to Indigenous production in the energy balance. Production of secondary fuels and secondary electricity are shown in the transformation section and not in the indigenous production row at the top of the balance. A.48 For fossil fuels, indigenous production represents the marketable quantity extracted from the reserves. Indigenous production of Primary electricity comprises hydro-electricity, wind, photovoltaics and nuclear energy. The energy value for hydro-electricity is taken to be the energy content of the electricity produced from the hydro power plant and not the energy available in the water driving the turbines. A similar approach is adopted for electricity from wind generators and photovoltaics. The electricity is regarded as the primary energy form because there are currently no other uses of the energy resource “upstream” of the generation. The energy value attached to nuclear electricity is discussed in paragraph A.52. A.49 The other elements of the supply part of the balance are identical to those in the commodity balances. In particular, the sign convention is identical, so that figures for exports and international marine bunkers carry negative signs. A stock build carries a negative sign to denote it as a withdrawal from supply whilst a stock draw carries a positive sign to show it as an addition to supply. A.50 The Primary supply is the sum of the figures above it in the table, taking account of the signs, and expresses the national requirement for primary energy commodities from all sources and foreign supplies of secondary commodities. It is an indicator of the use of indigenous resources and external energy supplies. Both the amount and mixture of fuels in final consumption of energy commodities in the United Kingdom will differ from the primary supply. The “mix” of commodities in final consumption will be much more dependent on the manufacture of secondary commodities, in particular electricity.
Transformation A.51 Within an energy balance the presentation of the inputs to and outputs from transformation activities requires special mention, as it is carried out using a compact format. The transformation section also plays a key role in moving primary electricity from its own column in the balance into the electricity column, so that it can be combined with electricity from fossil fuelled power stations and the total disposals shown. A.52 Indigenous production of primary electricity comprises nuclear electricity, hydro electricity, electricity from wind generation and from solar photovoltaics. Nuclear electricity is obtained by passing steam from nuclear reactors through conventional steam turbine sets. The heat in the steam is considered to be the primary energy available and its value is calculated from the electricity generated using the average thermal efficiency of nuclear stations, currently 40.0 per cent (in 2016) in the United Kingdom. The electrical energy from hydro and wind is transferred from the Primary electricity column to the Electricity column using the transfers row because this electricity is in the form of primary energy and no transformation takes place. However, because the form of the nuclear energy is the steam from the nuclear reactors, the energy it contains is shown entering electricity generation and the corresponding electricity produced is included with all electricity generation in the figure, in the same row, under the Electricity column. A.53 Quantities of fuels entering transformation activities (fuels into electricity generation and heat generation, crude oil into petroleum product manufacture (refineries), or coal into coke ovens) are shown with a negative sign to represent the input and the resulting production is shown as a positive number. A.54 For electricity generated by Major power producers, the inputs are shown in the Major power producers’ row of the coal, manufactured fuel, primary oils, petroleum products, gas, bioenergy and waste and primary electricity columns. The total energy input to electricity generation is the sum of the values in these first seven columns. The Electricity column shows total electricity generated from these inputs and the transformation loss is the sum of these two figures, given in the Total column.
232
A.55 Within the transformation section, the negative figures in the Total column represent the losses in the various transformation activities. This is a convenient consequence of the sign convention chosen for the inputs and outputs from transformation. Any positive figures represent a transformation gain and, as such, are an indication of incorrect data. A.56 In the energy balance, the columns containing the input commodities for electricity generation, heat generation and oil refining are separate from the columns for the outputs. However, for the transformation activities involving solid fuels this is only partly the case. Coal used for the manufacture of coke is shown in the coke manufacture row of the transformation section in the coal column, but the related coke and coke oven gas production are shown combined in the Manufactured fuels column. Similarly, the input of coke to blast furnaces and the resulting production of blast furnace gas are not identifiable and have been combined in the Manufactured fuels column in the Blast furnace row. As a result, only the net loss from blast furnace transformation activity appears in the column. A.57 The share of each commodity or commodity group in primary supply can be calculated from the table. This table also shows the demand for primary as well as foreign supplies. Shares of primary supplies may be taken from the Primary supply row of the balance. Shares of fuels in final consumption may be calculated from the final consumption row.
Energy industry use and final consumption A.58 The figures for final consumption and energy industry use follow, in general, the principles and definitions described under commodity balances in paragraphs A.29 to A.42.
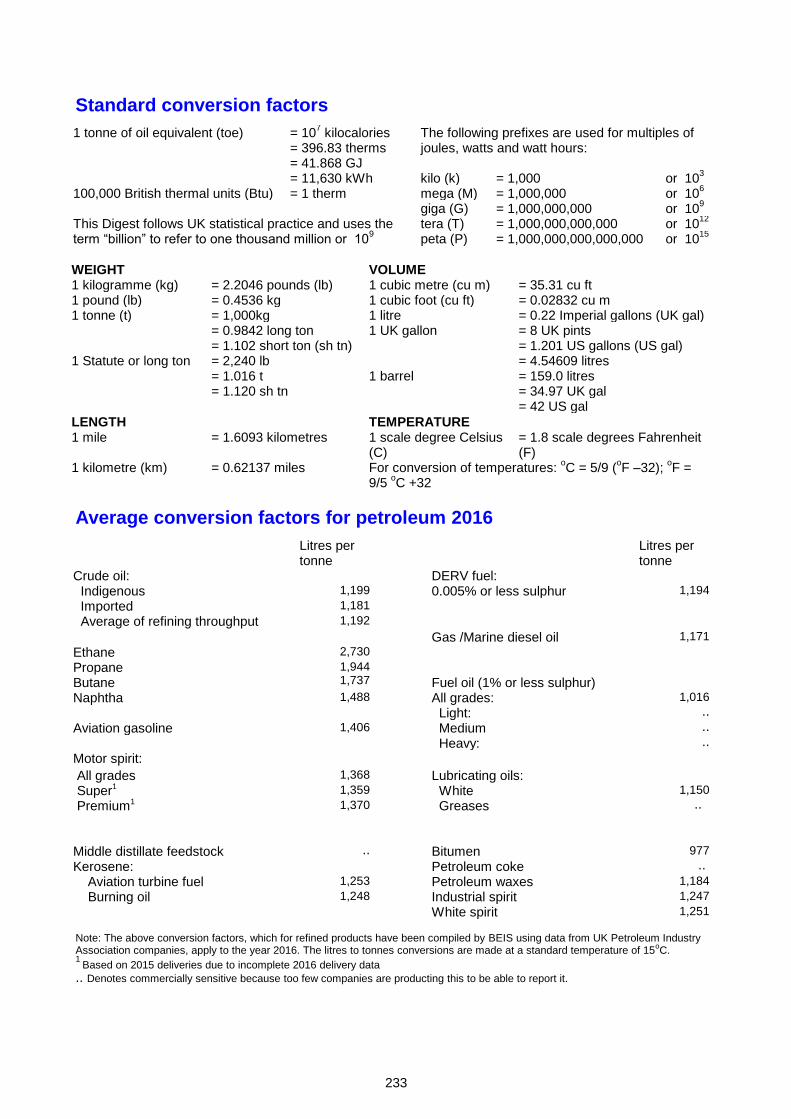
233
Standard conversion factors
1 tonne of oil equivalent (toe) = 107 kilocalories The following prefixes are used for multiples of
joules, watts and watt hours: = 396.83 therms = 41.868 GJ
kilo (k) = 1,000
or 10
3 = 11,630 kWh
100,000 British thermal units (Btu) = 1 therm mega (M) = 1,000,000 or 106
giga (G) = 1,000,000,000 or 109
This Digest follows UK statistical practice and uses the term “billion” to refer to one thousand million or 10
9
tera (T) = 1,000,000,000,000 or 1012
peta (P) = 1,000,000,000,000,000 or 10
15
WEIGHT VOLUME 1 kilogramme (kg) = 2.2046 pounds (lb) 1 cubic metre (cu m) = 35.31 cu ft 1 pound (lb) = 0.4536 kg 1 cubic foot (cu ft) = 0.02832 cu m 1 tonne (t) = 1,000kg 1 litre = 0.22 Imperial gallons (UK gal) = 0.9842 long ton 1 UK gallon = 8 UK pints = 1.102 short ton (sh tn) = 1.201 US gallons (US gal) 1 Statute or long ton = 2,240 lb = 4.54609 litres = 1.016 t 1 barrel = 159.0 litres = 1.120 sh tn = 34.97 UK gal = 42 US gal
LENGTH TEMPERATURE 1 mile = 1.6093 kilometres 1 scale degree Celsius
(C) = 1.8 scale degrees Fahrenheit (F)
1 kilometre (km) = 0.62137 miles For conversion of temperatures: oC = 5/9 (
oF –32);
oF =
9/5 oC +32
Average conversion factors for petroleum 2016
Litres per tonne
Litres per tonne
Crude oil: DERV fuel:
Indigenous 1,199 0.005% or less sulphur 1,194
Imported 1,181
Average of refining throughput 1,192
Gas /Marine diesel oil 1,171
Ethane 2,730
Propane Butane
1,944 1,737
Fuel oil (1% or less sulphur) Naphtha 1,488 All grades: 1,016
Light: ..
Aviation gasoline 1,406 Medium ..
Heavy: ..
Motor spirit:
All grades 1,368 Lubricating oils:
Super1 1,359 White 1,150
Premium1 1,370 Greases ..
Middle distillate feedstock .. Bitumen 977
Kerosene: Petroleum coke ..
Aviation turbine fuel 1,253 Petroleum waxes 1,184
Burning oil 1,248 Industrial spirit 1,247
White spirit 1,251
Note: The above conversion factors, which for refined products have been compiled by BEIS using data from UK Petroleum Industry Association companies, apply to the year 2016. The litres to tonnes conversions are made at a standard temperature of 15
oC.
1 Based on 2015 deliveries due to incomplete 2016 delivery data
.. Denotes commercially sensitive because too few companies are producting this to be able to report it.
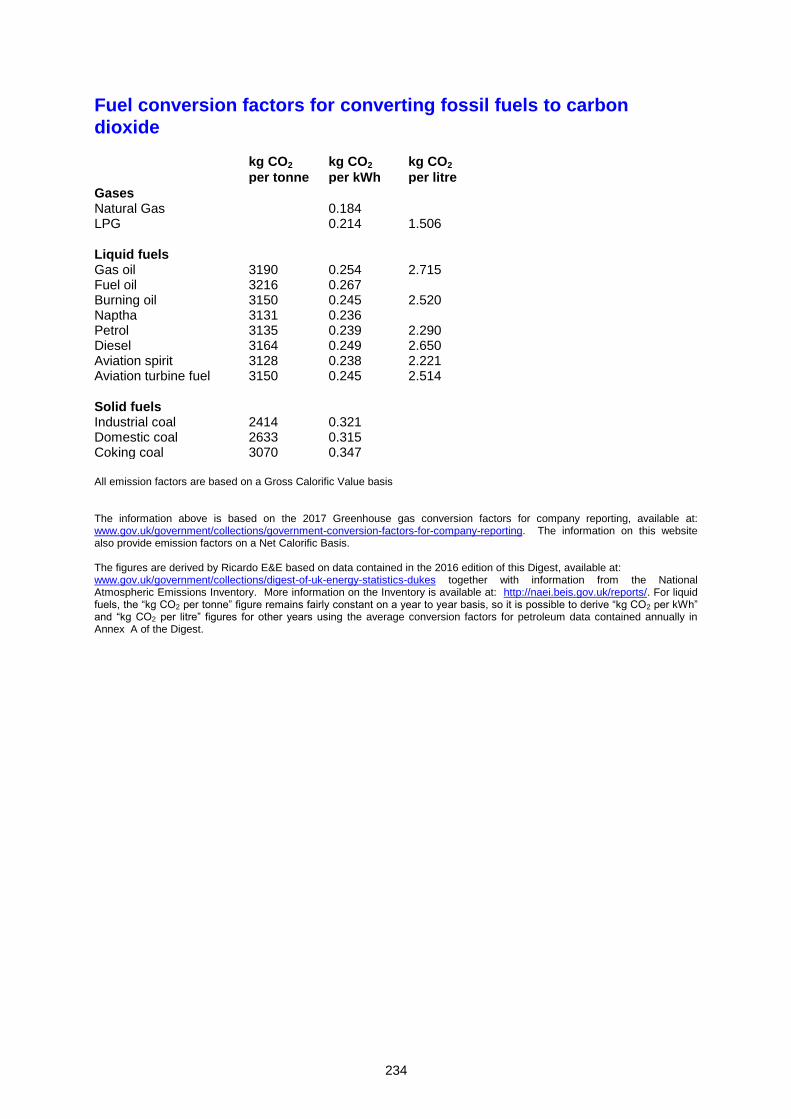
234
Fuel conversion factors for converting fossil fuels to carbon
dioxide
kg CO2
per tonne
kg CO2
per kWh
kg CO2
per litre
Gases
Natural Gas 0.184 LPG 0.214 1.506
Liquid fuels
Gas oil 3190 0.254 2.715 Fuel oil 3216 0.267 Burning oil 3150 0.245 2.520 Naptha 3131 0.236 Petrol 3135 0.239 2.290 Diesel 3164 0.249 2.650 Aviation spirit 3128 0.238 2.221 Aviation turbine fuel 3150 0.245 2.514
Solid fuels Industrial coal 2414 0.321 Domestic coal 2633 0.315 Coking coal 3070 0.347 All emission factors are based on a Gross Calorific Value basis The information above is based on the 2017 Greenhouse gas conversion factors for company reporting, available at: www.gov.uk/government/collections/government-conversion-factors-for-company-reporting. The information on this website also provide emission factors on a Net Calorific Basis. The figures are derived by Ricardo E&E based on data contained in the 2016 edition of this Digest, available at: www.gov.uk/government/collections/digest-of-uk-energy-statistics-dukes together with information from the National Atmospheric Emissions Inventory. More information on the Inventory is available at: http://naei.beis.gov.uk/reports/. For liquid fuels, the “kg CO2 per tonne” figure remains fairly constant on a year to year basis, so it is possible to derive “kg CO2 per kWh” and “kg CO2 per litre” figures for other years using the average conversion factors for petroleum data contained annually in Annex A of the Digest.
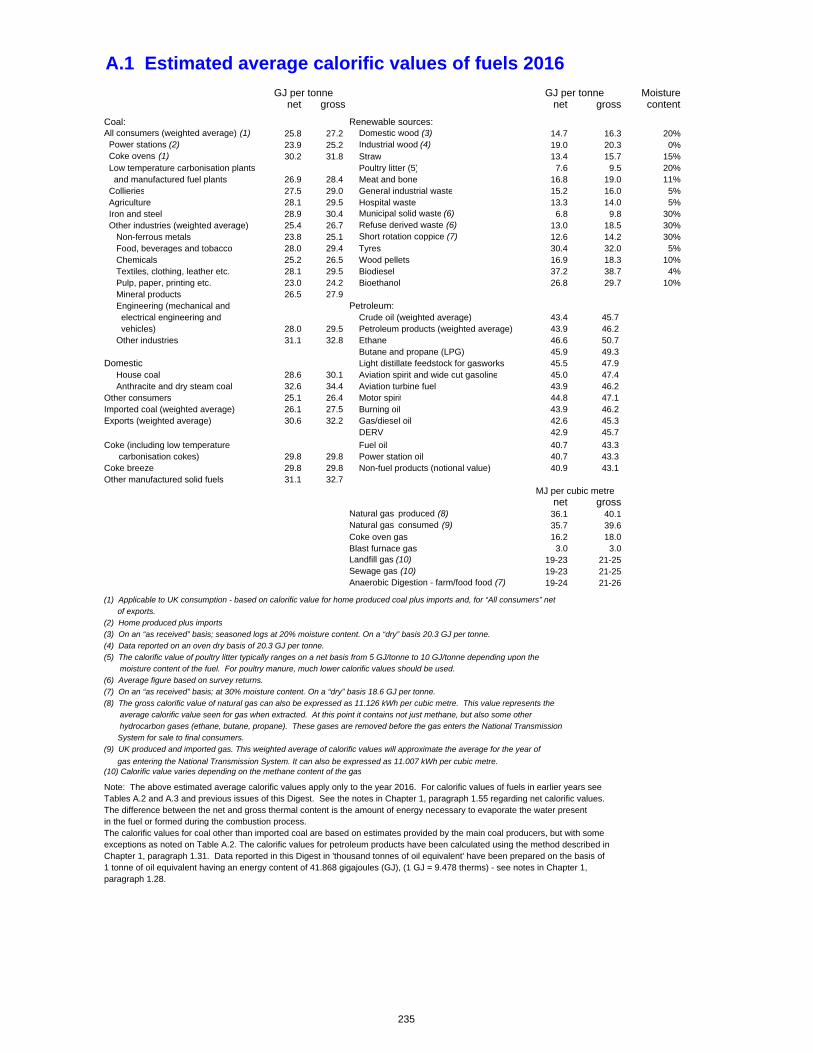
A.1 Estimated average calorific values of fuels 2016
Moisturenet gross net gross content
Coal: Renewable sources:All consumers (weighted average) (1) 25.8 27.2 Domestic wood (3) 14.7 16.3 20% Power stations (2) 23.9 25.2 Industrial wood (4) 19.0 20.3 0% Coke ovens (1) 30.2 31.8 Straw 13.4 15.7 15% Low temperature carbonisation plants Poultry litter (5) 7.6 9.5 20% and manufactured fuel plants 26.9 28.4 Meat and bone 16.8 19.0 11% Collieries 27.5 29.0 General industrial waste 15.2 16.0 5% Agriculture 28.1 29.5 Hospital waste 13.3 14.0 5% Iron and steel 28.9 30.4 Municipal solid waste (6) 6.8 9.8 30% Other industries (weighted average) 25.4 26.7 Refuse derived waste (6) 13.0 18.5 30% Non-ferrous metals 23.8 25.1 Short rotation coppice (7) 12.6 14.2 30% Food, beverages and tobacco 28.0 29.4 Tyres 30.4 32.0 5% Chemicals 25.2 26.5 Wood pellets 16.9 18.3 10% Textiles, clothing, leather etc. 28.1 29.5 Biodiesel 37.2 38.7 4% Pulp, paper, printing etc. 23.0 24.2 Bioethanol 26.8 29.7 10% Mineral products 26.5 27.9 Engineering (mechanical and Petroleum: electrical engineering and Crude oil (weighted average) 43.4 45.7 vehicles) 28.0 29.5 Petroleum products (weighted average) 43.9 46.2 Other industries 31.1 32.8 Ethane 46.6 50.7
Butane and propane (LPG) 45.9 49.3 Domestic Light distillate feedstock for gasworks 45.5 47.9 House coal 28.6 30.1 Aviation spirit and wide cut gasoline 45.0 47.4 Anthracite and dry steam coal 32.6 34.4 Aviation turbine fuel 43.9 46.2 Other consumers 25.1 26.4 Motor spirit 44.8 47.1 Imported coal (weighted average) 26.1 27.5 Burning oil 43.9 46.2 Exports (weighted average) 30.6 32.2 Gas/diesel oil 42.6 45.3
DERV 42.9 45.7
Coke (including low temperature Fuel oil 40.7 43.3 carbonisation cokes) 29.8 29.8 Power station oil 40.7 43.3 Coke breeze 29.8 29.8 Non-fuel products (notional value) 40.9 43.1 Other manufactured solid fuels 31.1 32.7
net grossNatural gas produced (8) 36.1 40.1Natural gas consumed (9) 35.7 39.6Coke oven gas 16.2 18.0Blast furnace gas 3.0 3.0Landfill gas (10) 19-23 21-25Sewage gas (10) 19-23 21-25Anaerobic Digestion - farm/food food (7) 19-24 21-26
(1) Applicable to UK consumption - based on calorific value for home produced coal plus imports and, for “All consumers” net
of exports.
(2) Home produced plus imports
(3) On an “as received” basis; seasoned logs at 20% moisture content. On a “dry” basis 20.3 GJ per tonne.
(4) Data reported on an oven dry basis of 20.3 GJ per tonne.
(5) The calorific value of poultry litter typically ranges on a net basis from 5 GJ/tonne to 10 GJ/tonne depending upon the
moisture content of the fuel. For poultry manure, much lower calorific values should be used.
(6) Average figure based on survey returns.
(7) On an “as received” basis; at 30% moisture content. On a “dry” basis 18.6 GJ per tonne.
(8) The gross calorific value of natural gas can also be expressed as 11.126 kWh per cubic metre. This value represents the
average calorific value seen for gas when extracted. At this point it contains not just methane, but also some other
hydrocarbon gases (ethane, butane, propane). These gases are removed before the gas enters the National Transmission
System for sale to final consumers.
(9) UK produced and imported gas. This weighted average of calorific values will approximate the average for the year of
gas entering the National Transmission System. It can also be expressed as 11.007 kWh per cubic metre.(10) Calorific value varies depending on the methane content of the gas
Note: The above estimated average calorific values apply only to the year 2016. For calorific values of fuels in earlier years seeTables A.2 and A.3 and previous issues of this Digest. See the notes in Chapter 1, paragraph 1.55 regarding net calorific values. The difference between the net and gross thermal content is the amount of energy necessary to evaporate the water present in the fuel or formed during the combustion process.The calorific values for coal other than imported coal are based on estimates provided by the main coal producers, but with some exceptions as noted on Table A.2. The calorific values for petroleum products have been calculated using the method described in Chapter 1, paragraph 1.31. Data reported in this Digest in 'thousand tonnes of oil equivalent' have been prepared on the basis of 1 tonne of oil equivalent having an energy content of 41.868 gigajoules (GJ), (1 GJ = 9.478 therms) - see notes in Chapter 1, paragraph 1.28.
GJ per tonne GJ per tonne
MJ per cubic metre
235
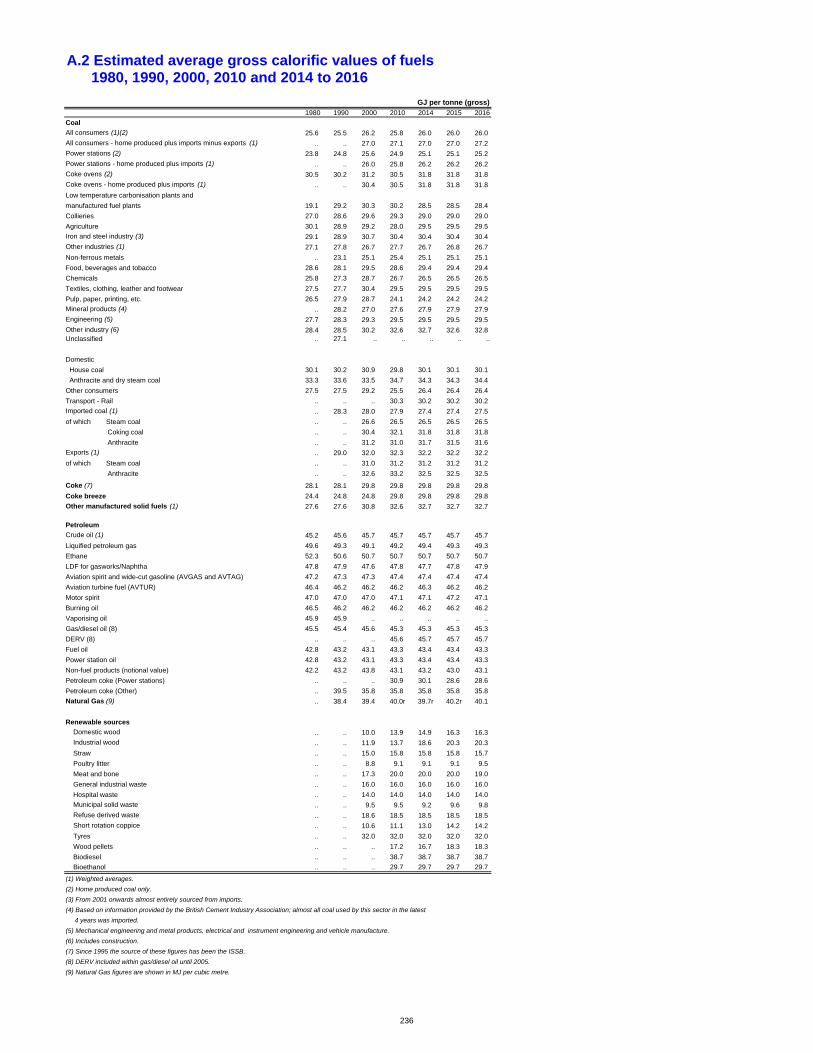
A.2 Estimated average gross calorific values of fuels 1980, 1990, 2000, 2010 and 2014 to 2016
GJ per tonne (gross)1980 1990 2000 2010 2014 2015 2016
Coal
All consumers (1)(2) 25.6 25.5 26.2 25.8 26.0 26.0 26.0
All consumers - home produced plus imports minus exports (1) .. .. 27.0 27.1 27.0 27.0 27.2
Power stations (2) 23.8 24.8 25.6 24.9 25.1 25.1 25.2
Power stations - home produced plus imports (1) .. .. 26.0 25.8 26.2 26.2 26.2
Coke ovens (2) 30.5 30.2 31.2 30.5 31.8 31.8 31.8
Coke ovens - home produced plus imports (1) .. .. 30.4 30.5 31.8 31.8 31.8
Low temperature carbonisation plants and
manufactured fuel plants 19.1 29.2 30.3 30.2 28.5 28.5 28.4
Collieries 27.0 28.6 29.6 29.3 29.0 29.0 29.0
Agriculture 30.1 28.9 29.2 28.0 29.5 29.5 29.5
Iron and steel industry (3) 29.1 28.9 30.7 30.4 30.4 30.4 30.4
Other industries (1) 27.1 27.8 26.7 27.7 26.7 26.8 26.7
Non-ferrous metals .. 23.1 25.1 25.4 25.1 25.1 25.1
Food, beverages and tobacco 28.6 28.1 29.5 28.6 29.4 29.4 29.4
Chemicals 25.8 27.3 28.7 26.7 26.5 26.5 26.5
Textiles, clothing, leather and footwear 27.5 27.7 30.4 29.5 29.5 29.5 29.5
Pulp, paper, printing, etc. 26.5 27.9 28.7 24.1 24.2 24.2 24.2
Mineral products (4) .. 28.2 27.0 27.6 27.9 27.9 27.9
Engineering (5) 27.7 28.3 29.3 29.5 29.5 29.5 29.5
Other industry (6) 28.4 28.5 30.2 32.6 32.7 32.6 32.8 Unclassified .. 27.1 .. .. .. .. ..
Domestic
House coal 30.1 30.2 30.9 29.8 30.1 30.1 30.1
Anthracite and dry steam coal 33.3 33.6 33.5 34.7 34.3 34.3 34.4
Other consumers 27.5 27.5 29.2 25.5 26.4 26.4 26.4
Transport - Rail .. .. .. 30.3 30.2 30.2 30.2
Imported coal (1) .. 28.3 28.0 27.9 27.4 27.4 27.5
of which Steam coal .. .. 26.6 26.5 26.5 26.5 26.5
Coking coal .. .. 30.4 32.1 31.8 31.8 31.8
Anthracite .. .. 31.2 31.0 31.7 31.5 31.6
Exports (1) .. 29.0 32.0 32.3 32.2 32.2 32.2
of which Steam coal .. .. 31.0 31.2 31.2 31.2 31.2
Anthracite .. .. 32.6 33.2 32.5 32.5 32.5
Coke (7) 28.1 28.1 29.8 29.8 29.8 29.8 29.8
Coke breeze 24.4 24.8 24.8 29.8 29.8 29.8 29.8
Other manufactured solid fuels (1) 27.6 27.6 30.8 32.6 32.7 32.7 32.7
Petroleum
Crude oil (1) 45.2 45.6 45.7 45.7 45.7 45.7 45.7
Liquified petroleum gas 49.6 49.3 49.1 49.2 49.4 49.3 49.3
Ethane 52.3 50.6 50.7 50.7 50.7 50.7 50.7
LDF for gasworks/Naphtha 47.8 47.9 47.6 47.8 47.7 47.8 47.9
Aviation spirit and wide-cut gasoline (AVGAS and AVTAG) 47.2 47.3 47.3 47.4 47.4 47.4 47.4
Aviation turbine fuel (AVTUR) 46.4 46.2 46.2 46.2 46.3 46.2 46.2
Motor spirit 47.0 47.0 47.0 47.1 47.1 47.2 47.1
Burning oil 46.5 46.2 46.2 46.2 46.2 46.2 46.2
Vaporising oil 45.9 45.9 .. .. .. .. ..
Gas/diesel oil (8) 45.5 45.4 45.6 45.3 45.3 45.3 45.3
DERV (8) .. .. .. 45.6 45.7 45.7 45.7
Fuel oil 42.8 43.2 43.1 43.3 43.4 43.4 43.3
Power station oil 42.8 43.2 43.1 43.3 43.4 43.4 43.3
Non-fuel products (notional value) 42.2 43.2 43.8 43.1 43.2 43.0 43.1
Petroleum coke (Power stations) .. .. .. 30.9 30.1 28.6 28.6
Petroleum coke (Other) .. 39.5 35.8 35.8 35.8 35.8 35.8
Natural Gas (9) .. 38.4 39.4 40.0r 39.7r 40.2r 40.1
Renewable sources
Domestic wood .. .. 10.0 13.9 14.9 16.3 16.3
Industrial wood .. .. 11.9 13.7 18.6 20.3 20.3
Straw .. .. 15.0 15.8 15.8 15.8 15.7
Poultry litter .. .. 8.8 9.1 9.1 9.1 9.5
Meat and bone .. .. 17.3 20.0 20.0 20.0 19.0
General industrial waste .. .. 16.0 16.0 16.0 16.0 16.0
Hospital waste .. .. 14.0 14.0 14.0 14.0 14.0
Municipal solid waste .. .. 9.5 9.5 9.2 9.6 9.8
Refuse derived waste .. .. 18.6 18.5 18.5 18.5 18.5
Short rotation coppice .. .. 10.6 11.1 13.0 14.2 14.2
Tyres .. .. 32.0 32.0 32.0 32.0 32.0
Wood pellets .. .. .. 17.2 16.7 18.3 18.3
Biodiesel .. .. .. 38.7 38.7 38.7 38.7
Bioethanol .. .. .. 29.7 29.7 29.7 29.7
(1) Weighted averages.
(2) Home produced coal only.
(3) From 2001 onwards almost entirely sourced from imports.
(4) Based on information provided by the British Cement Industry Association; almost all coal used by this sector in the latest
4 years was imported.
(5) Mechanical engineering and metal products, electrical and instrument engineering and vehicle manufacture.
(6) Includes construction.
(7) Since 1995 the source of these figures has been the ISSB.
(8) DERV included within gas/diesel oil until 2005.
(9) Natural Gas figures are shown in MJ per cubic metre.
236
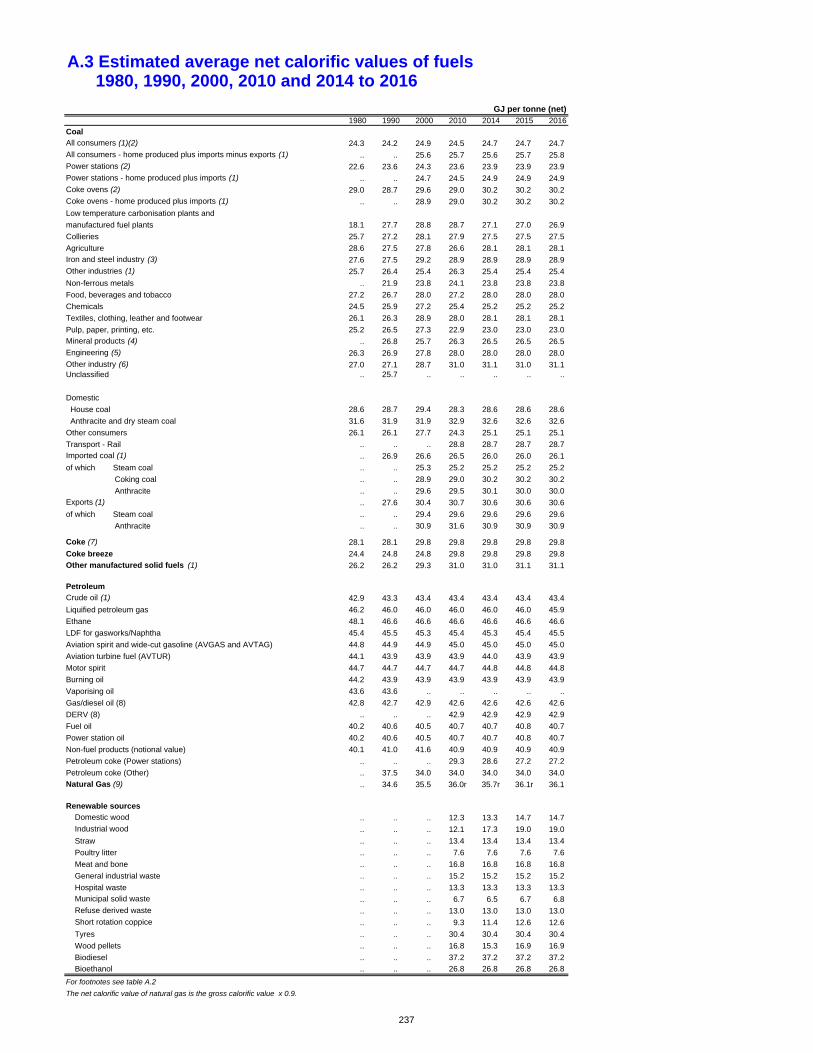
A.3 Estimated average net calorific values of fuels 1980, 1990, 2000, 2010 and 2014 to 2016
GJ per tonne (net)1980 1990 2000 2010 2014 2015 2016
Coal
All consumers (1)(2) 24.3 24.2 24.9 24.5 24.7 24.7 24.7
All consumers - home produced plus imports minus exports (1) .. .. 25.6 25.7 25.6 25.7 25.8
Power stations (2) 22.6 23.6 24.3 23.6 23.9 23.9 23.9
Power stations - home produced plus imports (1) .. .. 24.7 24.5 24.9 24.9 24.9
Coke ovens (2) 29.0 28.7 29.6 29.0 30.2 30.2 30.2
Coke ovens - home produced plus imports (1) .. .. 28.9 29.0 30.2 30.2 30.2
Low temperature carbonisation plants and
manufactured fuel plants 18.1 27.7 28.8 28.7 27.1 27.0 26.9
Collieries 25.7 27.2 28.1 27.9 27.5 27.5 27.5
Agriculture 28.6 27.5 27.8 26.6 28.1 28.1 28.1
Iron and steel industry (3) 27.6 27.5 29.2 28.9 28.9 28.9 28.9
Other industries (1) 25.7 26.4 25.4 26.3 25.4 25.4 25.4
Non-ferrous metals .. 21.9 23.8 24.1 23.8 23.8 23.8
Food, beverages and tobacco 27.2 26.7 28.0 27.2 28.0 28.0 28.0
Chemicals 24.5 25.9 27.2 25.4 25.2 25.2 25.2
Textiles, clothing, leather and footwear 26.1 26.3 28.9 28.0 28.1 28.1 28.1
Pulp, paper, printing, etc. 25.2 26.5 27.3 22.9 23.0 23.0 23.0
Mineral products (4) .. 26.8 25.7 26.3 26.5 26.5 26.5
Engineering (5) 26.3 26.9 27.8 28.0 28.0 28.0 28.0
Other industry (6) 27.0 27.1 28.7 31.0 31.1 31.0 31.1 Unclassified .. 25.7 .. .. .. .. ..
Domestic
House coal 28.6 28.7 29.4 28.3 28.6 28.6 28.6
Anthracite and dry steam coal 31.6 31.9 31.9 32.9 32.6 32.6 32.6
Other consumers 26.1 26.1 27.7 24.3 25.1 25.1 25.1
Transport - Rail .. .. .. 28.8 28.7 28.7 28.7
Imported coal (1) .. 26.9 26.6 26.5 26.0 26.0 26.1
of which Steam coal .. .. 25.3 25.2 25.2 25.2 25.2
Coking coal .. .. 28.9 29.0 30.2 30.2 30.2
Anthracite .. .. 29.6 29.5 30.1 30.0 30.0
Exports (1) .. 27.6 30.4 30.7 30.6 30.6 30.6
of which Steam coal .. .. 29.4 29.6 29.6 29.6 29.6
Anthracite .. .. 30.9 31.6 30.9 30.9 30.9
Coke (7) 28.1 28.1 29.8 29.8 29.8 29.8 29.8
Coke breeze 24.4 24.8 24.8 29.8 29.8 29.8 29.8
Other manufactured solid fuels (1) 26.2 26.2 29.3 31.0 31.0 31.1 31.1
Petroleum
Crude oil (1) 42.9 43.3 43.4 43.4 43.4 43.4 43.4
Liquified petroleum gas 46.2 46.0 46.0 46.0 46.0 46.0 45.9
Ethane 48.1 46.6 46.6 46.6 46.6 46.6 46.6
LDF for gasworks/Naphtha 45.4 45.5 45.3 45.4 45.3 45.4 45.5
Aviation spirit and wide-cut gasoline (AVGAS and AVTAG) 44.8 44.9 44.9 45.0 45.0 45.0 45.0
Aviation turbine fuel (AVTUR) 44.1 43.9 43.9 43.9 44.0 43.9 43.9
Motor spirit 44.7 44.7 44.7 44.7 44.8 44.8 44.8
Burning oil 44.2 43.9 43.9 43.9 43.9 43.9 43.9
Vaporising oil 43.6 43.6 .. .. .. .. ..
Gas/diesel oil (8) 42.8 42.7 42.9 42.6 42.6 42.6 42.6
DERV (8) .. .. .. 42.9 42.9 42.9 42.9
Fuel oil 40.2 40.6 40.5 40.7 40.7 40.8 40.7
Power station oil 40.2 40.6 40.5 40.7 40.7 40.8 40.7
Non-fuel products (notional value) 40.1 41.0 41.6 40.9 40.9 40.9 40.9
Petroleum coke (Power stations) .. .. .. 29.3 28.6 27.2 27.2
Petroleum coke (Other) .. 37.5 34.0 34.0 34.0 34.0 34.0
Natural Gas (9) .. 34.6 35.5 36.0r 35.7r 36.1r 36.1
Renewable sources
Domestic wood .. .. .. 12.3 13.3 14.7 14.7
Industrial wood .. .. .. 12.1 17.3 19.0 19.0
Straw .. .. .. 13.4 13.4 13.4 13.4
Poultry litter .. .. .. 7.6 7.6 7.6 7.6
Meat and bone .. .. .. 16.8 16.8 16.8 16.8
General industrial waste .. .. .. 15.2 15.2 15.2 15.2
Hospital waste .. .. .. 13.3 13.3 13.3 13.3
Municipal solid waste .. .. .. 6.7 6.5 6.7 6.8
Refuse derived waste .. .. .. 13.0 13.0 13.0 13.0
Short rotation coppice .. .. .. 9.3 11.4 12.6 12.6
Tyres .. .. .. 30.4 30.4 30.4 30.4
Wood pellets .. .. .. 16.8 15.3 16.9 16.9
Biodiesel .. .. .. 37.2 37.2 37.2 37.2
Bioethanol .. .. .. 26.8 26.8 26.8 26.8
For footnotes see table A.2
The net calorific value of natural gas is the gross calorific value x 0.9.
237

238
239
Annex B Glossary and Acronyms
Anthracite Within this publication, anthracite is coal classified as such by UK coal producers and importers of coal. Typically it has a high heat content making it particularly suitable for certain industrial processes and for use as a domestic fuel.
Associated gas Natural gas found in association with crude oil in a reservoir, either dissolved in the oil or as a cap above the oil.
Autogeneration Generation of electricity by companies whose main business is not electricity generation, the electricity being produced mainly for that company’s own use.
Aviation spirit A light hydrocarbon oil product used to power piston-engined aircraft power units.
Aviation turbine fuel
Backflows
The main aviation fuel used for powering aviation gas-turbine power units (jet aircraft engine). These are finished or semi-finished products, which are returned from final consumers to refineries for processing, blending or sale. They are usually by-products of petrochemical manufacturing.
BEIS Department for Business, Energy and Industrial Strategy
Benzole A colourless liquid, flammable, aromatic hydrocarbon by-product of the iron and steel making process. It is used as a solvent in the manufacture of styrenes and phenols but is also used as a constituent of motor fuel.
BETTA British Electricity Trading and Transmission Arrangements (BETTA) refer to changes to electricity generation, distribution and supply licences. On 1 April 2005, the England and Wales trading arrangements were extended to Scotland by the British Electricity Trading and Transmission Arrangements creating a single GB market for trading of wholesale electricity, with common arrangements for access to and use of GB transmission system. From 1 April 2005, NGC has become the System Operator for the whole of GB. BETTA replaced NETA on 4 April 2005.
Biodiesel (FAME - biodiesel produced to BS EN 14214). Produced from vegetable oils or animal fats by mixing them with ethanol or methanol to break them down.
Bioenergy Bioenergy is renewable energy made from material of recent biological origin derived from plant or animal matter.
Bioethanol Created from crops rich in starch or sugar by fermentation, distillation and finally dehydration.
Biogas Energy produced from the anaerobic digestion of sewage and industrial waste.
240
Biomass Renewable organic materials, such as wood, agricultural crops or wastes, and municipal wastes. Biomass can be burned directly or processed into biofuels such as ethanol and methane
Bitumen The residue left after the production of lubricating oil distillates and vacuum gas oil for upgrading plant feedstock. Used mainly for road making and construction purposes.
Blast furnace gas Mainly produced and consumed within the iron and steel industry. Obtained as a by-product of iron making in a blast furnace, it is recovered on leaving the furnace and used partly within the plant and partly in other steel industry processes or in power plants equipped to burn it. A similar gas is obtained when steel is made in basic oxygen steel converters; this gas is recovered and used in the same way.
Breeze Breeze can generally be described as coke screened below 19 mm (¾ inch) with no fines removed but the screen size may vary in different areas and to meet the requirements of particular markets.
BG British Gas
BOS Basic Oxygen Steel furnace gas
BNFL British Nuclear Fuels plc.
BRE Building Research Establishment
Burning oil A refined petroleum product, with a volatility in between that of motor spirit and gas diesel oil primarily used for heating and lighting.
Butane Hydrocarbon (C4H10), gaseous at normal temperature but generally stored and transported as a liquid. Used as a component in Motor Spirit to improve combustion, and for cooking and heating (see LPG).
Calorific values (CVs) The energy content of a fuel can be measured as the heat released on complete combustion. The SI (Système International) derived unit of energy and heat is the Joule. This is the energy in a given quantity of the fuel and is often measured in GJ per tonne. The energy content can be expressed as an upper (or gross) value and a lower (or net) value. The difference between the two values is due to the release of energy from the condensation of water in the products of combustion. Gross calorific values are used throughout this publication.
Carbon Emission
Reduction Target
(CERT)
The Carbon Emissions Reduction Target (CERT) follows on from the Energy Efficiency Commitment (EEC). CERT requires gas and electricity suppliers to achieve targets for a reduction in carbon emissions generated by the domestic sector.
CCA Climate Change Agreement. Climate Change Agreements allow energy intensive business users to receive a 65 per cent discount from the Climate Change Levy (CCL), in return for meeting energy efficiency or carbon saving targets. The CCL is a tax on the use of energy in industry, commerce and the public sector. The aim of the levy is to encourage users to improve energy efficiency and reduce emissions of greenhouse gases.
241
CCL Climate Change Levy. The Climate Change Levy is a tax on the use of energy in industry, commerce and the public sector, with offsetting cuts in employers' National Insurance Contributions and additional support for energy efficiency schemes and renewable sources of energy. The aim of the levy is to encourage users to improve energy efficiency and reduce emissions of greenhouse gases.
CO2 Carbon dioxide. Carbon dioxide contributes about 60 per cent of the potential global warming effect of man-made emissions of greenhouse gases. Although this gas is naturally emitted by living organisms, these emissions are offset by the uptake of carbon dioxide by plants during photosynthesis; they therefore tend to have no net effect on atmospheric concentrations. The burning of fossil fuels, however, releases carbon dioxide fixed by plants many millions of years ago, and thus increases its concentration in the atmosphere.
Co-firing The burning of biomass products in fossil fuel power stations
Coke oven coke The solid product obtained from carbonisation of coal, principally coking coal, at high temperature. It is low in moisture and volatile matter. Used mainly in iron and steel industry.
Coke oven gas Gas produced as a by-product of solid fuel carbonisation and gasification in coke ovens, but not from low temperature carbonisation plants. Synthetic coke oven gas is mainly natural gas which is mixed with smaller amounts of blast furnace and basic oxygen steel furnace gas to produce a gas with almost the same qualities as coke oven gas.
Coking coal Within this publication, coking coal is coal sold by producers for use in coke ovens and similar carbonising processes. The definition is not therefore determined by the calorific value or caking qualities of each batch of coal sold, although calorific values tend to be higher than for steam coal. Not all coals form cokes. For a coal to coke it must exhibit softening and agglomeration properties, ie the end product must be a coherent solid.
Colliery methane Methane released from coal seams in existing and abandoned deep mines and from coal beds which is piped to the surface and consumed at the colliery or transmitted by pipeline to consumers.
Combined Cycle Gas
Turbine (CCGT)
Combined cycle gas turbine power stations combine gas turbines and steam turbines which are connected to one or more electrical generators in the same plant. The gas turbine (usually fuelled by natural gas or oil) produces mechanical power (to drive the generator) and heat in the form of hot exhaust gases. These gases are fed to a boiler, where steam is raised at pressure to drive a conventional steam turbine, which is also connected to an electrical generator.
Combined Heat and
Power (CHP)
CHP is the simultaneous generation of usable heat and power (usually electricity) in a single process. The term CHP is synonymous with cogeneration and total energy, which are terms often used in the United States or other Member States of the European Community. The basic elements of a CHP plant comprise one or more prime movers driving electrical generators, where the steam or hot water generated in the process is utilised via suitable heat recovery equipment for use either in industrial processes or in community heating and space heating.
CHPQA Combined Heat and Power Quality Assurance Scheme
242
Conventional thermal
power stations
These are stations which generate electricity by burning fossil fuels to produce heat to convert water into steam, which then powers steam turbines.
Cracking/conversion A refining process using combinations of temperature, pressure and in some cases a catalyst to produce petroleum products by changing the composition of a fraction of petroleum, either by splitting existing longer carbon chains or combining shorter carbon chain components of crude oil or other refinery feedstocks. Cracking allows refiners to selectively increase the yield of specific fractions from any given input petroleum mix depending on their requirements in terms of output products.
CRC Carbon Reduction Commitment. The CRC Energy Efficiency scheme is a mandatory scheme aimed at improving energy efficiency and cutting emissions in large public and private sector organistaions.
Crude oil
A mineral oil consisting of a mixture of hydrocarbons of natural origins, yellow to black in colour, of variable density and viscosity.
DECC Department of Energy and Climate Change
DEFRA Department for Environment, Food and Rural Affairs
DERV Diesel engined road vehicle fuel used in internal combustion engines that are compression-ignited.
DFT Department for Transport
Distillation A process of separation of the various components of crude oil and refinery feedstocks using the different temperatures of evaporation and condensation of the different components of the mix received at the refineries.
DNC Declared net capacity and capability are used to measure the maximum power available from generating stations at a point in time.
DNO Distribution Network Operator
Downstream
Used in oil and gas processes to cover the part of the industry after the production of the oil and gas. For example, it covers refining, supply and trading, marketing and exporting.
DUKES Digest of United Kingdom Energy Statistics, the Digest provides essential information for everyone, from economists to environmentalists and from energy suppliers to energy users.
EHCS English House Condition Survey
Embedded Generation Embedded generation is electricity generation by plant which has been connected to the distribution networks of the public electricity distributors rather than directly to the National Grid Company's transmission systems. Typically they are either smaller stations located on industrial sites, or combined heat and power plant, or renewable energy plant such as wind farms, or refuse burning generators. The category also includes some domestic generators such as those with electric solar panels.
Energy use Energy use of fuel mainly comprises use for lighting, heating or cooling, motive power and power for appliances. See also non-energy use.
243
ESA European System of Accounts. An integrated system of economic accounts which is the European version of the System of National Accounts (SNA).
Ethane A light hydrocarbon gas (C2H6) in natural gas and refinery gas streams (see LPG).
EU-ETS European Union Emissions Trading Scheme. This began on 1st
January 2005 and involves the trading of emissions allowances as means of reducing emissions by a fixed amount.
EUROSTAT Statistical Office of the European Commission.
Exports For some parts of the energy industry, statistics on trade in energy related products can be derived from two separate sources. Firstly, figures can be reported by companies as part of systems for collecting data on specific parts of the energy industry (eg as part of the system for recording the production and disposals of oil from the UK continental shelf). Secondly, figures are also available from the general systems that exist for monitoring trade in all types of products operated by HM Revenue and Customs.
Feed-In Tariffs
The Feed-in Tariffs (FITs) scheme was introduced on 1 April 2010 to encourage deployment of small-scale (less than 5MW) low-carbon electricity generation. People with a qualifying technology receive a guaranteed payment from an electricity supplier of their choice for the electricity they generate and use, as well as a guaranteed payment for unused surplus electricity they export back to the grid.
Feedstock In the refining industry, a product or a combination of products derived from crude oil, destined for further processing other than blending. It is distinguished from use as a chemical feedstock etc.
Final energy
consumption
Energy consumption by final user – ie which is not being used for transformation into other forms of energy.
Fossil fuels Coal, natural gas and fuels derived from crude oil (for example petrol and diesel) are called fossil fuels because they have been formed over long periods of time from ancient organic matter.
Fuel oils The heavy oils from the refining process; used as fuel in furnaces and boilers of power stations, industry, in domestic and industrial heating, ships, locomotives, metallurgic operation, and industrial power plants etc.
Fuel oil - Light Fuel oil made up of heavier straight-run or cracked distillates and used in commercial or industrial burner installations not equipped with pre-heating facilities.
Fuel oil - Medium Other fuel oils, sometimes referred to as bunker fuels, which generally require pre-heating before being burned, but in certain climatic conditions do not require pre-heating.
Fuel oil - Heavy Other heavier grade fuel oils which in all situations require some form of pre-heating before being burned.
Fuel poverty A household is said to be in fuel poverty if they have required fuel costs that are above average (the national median level), and were they to spend that amount they would be left with a residual income below the official poverty line
244
Gas diesel oil The medium oil from the refinery process; used as a fuel in diesel engines (ie internal combustion engines that are compression-ignited), burned in central heating systems and used as a feedstock for the chemical industry.
GDP
Gross Domestic Product.
GDP deflator An index of the ratio of GDP at current prices to GDP at constant prices. It provides a measure of general price inflation within the whole economy.
Gigajoule (GJ) A unit of energy equal to 109 joules.
Gigawatt (GW) A unit of electrical power, equal to 109 watts.
Green Deal A scheme by which energy-saving improvements can be made to a home or business without having to pay all the costs up front; energy-saving improvements include:
insulation - eg loft or cavity wall insulation
heating
draught-proofing
double glazing
renewable energy technologies - eg solar panels or wind turbines
Heat pumps
Heat pumps use a heat exchanger (much like that installed in fridges and freezers – although running in reverse) to take heat from the ground or air and convert it into heating in the home (either radiators, underfloor heating or warm air heating systems and hot water). Ground source heat pumps use pipes which are buried in the ground to extract heat. Air source heat pumps absorb heat from the outside air. Heat pumps need electricity to run, but the heat they extract from the ground or air is constantly being renewed naturally.
Heat sold Heat (or steam) that is produced and sold under the provision of a contract. Heat sold is derived from heat generated by Combined Heat and Power (CHP) plants and from community heating schemes without CHP plants.
HMRC HM Revenue and Customs.
Imports Before the 1997 edition of the Digest, the term "arrivals" was used to distinguish figures derived from the former source from those import figures derived from the systems operated by HM Revenue and Customs. To make it clearer for users, a single term is now being used for both these sources of figures (the term imports) as this more clearly states what the figures relate to, which is goods entering the UK.
Indigenous production The extraction or capture of primary fuels: for oil this includes production from the UK Continental Shelf, both onshore and offshore.
Industrial spirit Refined petroleum fractions with boiling ranges up to 200ºC dependent on the use to which they are put – e.g. seed extraction, rubber solvents, perfume etc.
International Energy
Agency (IEA)
The IEA is an autonomous body located in Paris which was established in November 1974 within the framework of the Organisation for Economic Co-operation and Development (OECD) to implement an international energy programme.
245
ISSB International Steel Statistics Bureau
Joules A joule is a generic unit of energy in the conventional SI system. It is equal to the energy dissipated by an electrical current of 1 ampere driven by 1 volt for 1 second; it is also equal to twice the energy of motion in a mass of 1 kilogram moving at 1 metre per second.
Kilowatt (kW) 1,000 watts
Landfill gas The methane-rich biogas formed from the decomposition of organic material in landfill.
LDF Light distillate feedstock
LDZ Local distribution zone
Liquefied Natural Gas
(LNG)
Natural gas that has been converted to liquid form for ease of storage or transport.
Liquefied Petroleum
Gas (LPG)
Gas, usually propane or butane, derived from oil and put under pressure so that it is in liquid form. Often used to power portable cooking stoves or heaters and to fuel some types of vehicle, eg some specially adapted road vehicles, forklift trucks.
Lead Replacement
Petrol (LRP)
An alternative to Leaded Petrol containing a different additive to lead (in the UK usually potassium based) to perform the lubrication functions of lead additives in reducing engine wear.
Lubricating oils Refined heavy distillates obtained from the vacuum distillation of petroleum residues. Includes liquid and solid hydrocarbons sold by the lubricating oil trade, either alone or blended with fixed oils, metallic soaps and other organic and/or inorganic bodies.
Magnox A type of gas-cooled nuclear fission reactor developed in the UK, so called because of the magnesium alloy used to clad the uranium fuel.
Major Power
Producers (MPPs)
Companies whose prime purpose is the generation of electricity.
Megawatt (MW) 1,000 kilowatts. MWe is used to emphasise when electricity is being measured. MWt is used when heat (“thermal”) is being measured.
Micro CHP Micro CHP is a new technology that is expected to make a significant contribution to domestic energy efficiency in the future.
Motor spirit
Blended light petroleum product used as a fuel in spark-ignition internal combustion engines (other than aircraft engines).
NAEI National Atmospheric Emissions Inventory
Naphtha (Light distillate feedstock) – Petroleum distillate boiling predominantly below 200ºC.
National Allocation
Plan (NAP)
Under the EU Emissions Trading Scheme (EU-ETS) Directive each EU country must have a National Allocation Plan which lays down the overall contribution of the EU-ETS participants (the “cap”) for the country and the allowances that each sector and each individual installation covered under the Directive is allocated, effectively stating how much that sector can emit over the trading period of the scheme.
246
Natural gas Natural gas is a mixture of naturally occurring gases found either in isolation, or associated with crude oil, in underground reservoirs. The main components are methane, ethane, propane and butane. Hydrogen sulphide and carbon dioxide may also be present, but these are mostly removed at or near the well head in gas processing plants.
Natural gas -
compressed
Natural gas that has been compressed to reduce the volume it occupies to make it easier to transport other than in pipelines. Whilst other petroleum gases can be compressed such that they move into liquid form, the volatility of natural gas is such that liquefaction cannot be achieved without very high pressures and low temperatures being used. As such, the compressed form is usually used as a “half-way house”.
Natural gas liquids
(NGLs)
A mixture of liquids derived from natural gas and crude oil during the production process, including propane, butane, ethane and gasoline components (pentanes plus).
NDA Nuclear Decommissioning Authority
NETA New Electricity Trading Arrangements - In England and Wales these arrangements replaced “the pool” from 27 March 2001. The arrangements are based on bi-lateral trading between generators, suppliers, traders and customers and are designed to be more efficient, and provide more market choice.
NFFO Non Fossil Fuel Obligation. The 1989 Electricity Act empowers the Secretary of State to make orders requiring the Regional Electricity Companies in England and Wales to secure specified amounts of electricity from renewable sources.
NFPA Non Fossil Purchasing Agency
NIE Northern Ireland Electricity
NI NFFO Northern Ireland Non Fossil Fuel Obligation
Non-energy use Includes fuel used for chemical feedstock, solvents, lubricants, and road making material.
NOX Nitrogen oxides. A number of nitrogen compounds including nitrogen dioxide are formed in combustion processes when nitrogen in the air or the fuel combines with oxygen. These compounds can add to the natural acidity of rainfall.
NUTS Nonmenclature of Units for Territorial Statistics
OFGEM The regulatory office for gas and electricity markets
OFT Office of Fair Trading
ONS Office for National Statistics
Orimulsion An emulsion of bitumen in water that was used as a fuel in some power stations until 1997.
OTS Overseas Trade Statistics of the United Kingdom
247
Patent fuel A composition fuel manufactured from coal fines by shaping with the addition of a binding agent (typically pitch). The term manufactured solid fuel is also used.
Petrochemical
feedstock
All petroleum products intended for use in the manufacture of petroleum chemicals. This includes middle distillate feedstock of which there are several grades depending on viscosity. The boiling point ranges between 200°C and 400°C.
Petroleum cokes Carbonaceous material derived from hydrocarbon oils, uses for which include metallurgical electrode manufacture and in the manufacture of cement.
Photovoltaics The direct conversion of solar radiation into electricity by the interaction of light with the electrons in a semiconductor device or cell.
PILOT
Phase 2 (PILOT) is the successor body to the Oil & Gas Industry Task Force (OGITF) and was established on 1 January 2000, to secure the long-term future of the oil and gas industry in the UK. A forum that brings together Government and industry to address the challenges facing the oil and gas industry. One outcome of PILOT’s work is the published Code of Practice on Supply Chain Relationships.
Plant capacity The maximum power available from a power station at a point in time.
Plant loads, demands
and efficiency
Measures of how intensively and efficiently power stations are being used.
PPRS Petroleum production reporting system. Licensees operating in the UK Continental Shelf are required to make monthly returns on their production of hydrocarbons (oil and gas) to BEIS. This information is recorded in the PPRS, which is used to report flows, stocks and uses of hydrocarbon from the well-head through to final disposal from a pipeline or terminal (see DUKES internet annex F on the BEIS energy statistics website for further information).
Primary electricity Electricity obtained other than from fossil fuel sources, e.g. nuclear, hydro and other non-thermal renewables. Imports of electricity are also included.
Primary fuels Fuels obtained directly from natural sources, e.g. coal, oil and natural gas.
Process oils Partially processed feedstocks which require further processing before being classified as a finished product suitable for sale. They can also be used as a reaction medium in the production process.
Propane Hydrocarbon containing three carbon atoms (C3H8), gaseous at normal temperature, but generally stored and transported under pressure as a liquid.
RD Renewables Directive – this proposes that EU Member States adopt national targets that are consistent with the overall EU target of 20 per cent of energy from renewables by 2020.
Refinery fuel Petroleum products produced by the refining process that are used as fuel at refineries.
248
Reforming Processes by which the molecular structure of different fractions of petroleum can be modified. It usually involves some form of catalyst, most often platinum, and allows the conversion of lower grades of petroleum product into higher grades, improving their octane rating. It is a generic term for processes such as cracking, cyclization, dehydrogenation and isomerisation. These processes generally led to the production of hydrogen as a by-product, which can be used in the refineries in some desulphurization procedures.
Renewable energy
sources
Renewable energy includes solar power, wind, wave and tide, and hydroelectricity. Solid renewable energy sources consist of wood, straw, short rotation coppice, other biomass and the biodegradable fraction of wastes. Gaseous renewables consist of landfill gas and sewage gas. Non-biodegradable wastes are not counted as a renewables source but appear in the Renewable sources of energy chapter of this Digest for completeness.
Reserves With oil and gas these relate to the quantities identified as being present in underground cavities. The actual amounts that can be recovered depend on the level of technology available and existing economic situations. These continually change; hence the level of the UK’s reserves can change quite independently of whether or not new reserves have been identified.
RESTATS The Renewable Energy Statistics database for the UK.
Ricardo-AEA Formerly known as AEA Energy & Environment.
RO Renewables Obligation – this is an obligation on all electricity suppliers to supply a specific proportion of electricity from eligible renewable sources.
ROCs Renewables Obligation Certificates
Seasonal Performance
Factor
The Seasonal Performance Factor (SPF) of a heat pump is the total useful heat delivered during a year divided by the annual electricity consumption of the pump. The SPF gives an indication of the efficiency of the pump, with values greater than 1 implying that more useful heat is produced than the electricity used to power the pump.
Secondary fuels Fuels derived from natural primary sources of energy. For example electricity generated from burning coal, gas or oil is a secondary fuel, as are coke and coke oven gas.
SI (Système
International)
Refers to the agreed conventions for the measurement of physical
quantities.
SIC The United Kingdom Standard Industrial Classification of Economic Activities (SIC) is used to classify business establishments and other standard units by the type of economic activity in which they are engaged. It provides a framework for the collection, tabulation, presentation and analysis of data and its use promotes uniformity. In addition, it can be used for administrative purposes and by non-government bodies as a convenient way of classifying industrial activities into a common structure. The system is identical to the EUROSTAT System NACE at the four digit class level and the United Nations system ISIC at the two digit Divisional level.
249
SO2 Sulphur Dioxide. Sulphur dioxide is a gas produced by the combustion of sulphur-containing fuels such as coal and oil.
SRO Scottish Renewable Orders
Steam coal Within this publication, steam coal is coal classified as such by UK coal producers and by importers of coal. It tends to be coal having lower calorific values; the type of coal that is typically used for steam raising.
Synthetic coke oven
gas
Mainly a natural gas, which is mixed with smaller amounts of blast furnace, and BOS (basic oxygen steel furnace) gas to produce a gas with almost the same quantities as coke oven gas.
Tars Viscous materials usually derived from the destructive distillation of coal which are by-products of the coke and iron making processes.
Temperature
correction
The temperature corrected series of total inland fuel consumption indicates what annual consumption might have been if the average temperature during the year had been the same as the average for the years 1981 to 2010.
Terawatt (TW) 1,000 gigawatts
Therm A common unit of measurement similar to a tonne of oil equivalent which enables different fuels to be compared and aggregated.
Thermal efficiency The thermal efficiency of a power station is the efficiency with which heat energy contained in fuel is converted into electrical energy. It is calculated for fossil fuel burning stations by expressing electricity generated as a percentage of the total energy content of the fuel consumed (based on average gross calorific values). For nuclear stations it is calculated using the quantity of heat released as a result of fission of the nuclear fuel inside the reactor.
Thermal sources of
electricity
These include coal, oil, natural gas, nuclear, landfill gas, sewage gas, municipal solid waste, farm waste, tyres, poultry litter, short rotation coppice, straw, coke oven gas, blast furnace gas, and waste products from chemical processes.
Tonne of oil equivalent
(toe)
A common unit of measurement which enables different fuels to be compared and aggregated
TWh Terawatt hour
UKCS United Kingdom Continental Shelf
UKPIA UK Petroleum Industry Association. The trade association for the UK petroleum industry.
UKSA UK Statistics Authority
Ultra low sulphur
Diesel (ULSD)
A grade of diesel fuel which has a much lower sulphur content (less than 0.005 per cent or 50 parts per million) and of a slightly higher volatility than ordinary diesel fuels. As a result it produces fewer emissions when burned, and initially enjoyed a lower rate of hydrocarbon oil duty in the UK than ordinary diesel to promote its use, although duty rates on standard diesel and ULSD have since been equalised. Virtually 100 per cent of sales of DERV fuel in the UK are ULSD.

250
Ultra low sulphur
Petrol (ULSP)
A grade of motor spirit with a similar level of sulphur to ULSD (less than 0.005 per cent or 50 parts per million). ULSP initially enjoyed a lower rate of hydrocarbon oil duty in the UK than ordinary petrol to promote its use, although duty rates on standard petrol and ULSP have since been equalised. It has quickly replaced ordinary premium grade unleaded petrol in the UK market place.
Upstream A term to cover the activities related to the exploration, production and delivery to a terminal or other facility of oil or gas for export or onward shipment within the UK.
VAT Value added tax
Watt (W) The conventional unit to measure a rate of flow of energy. One watt amounts to 1 joule per second.
White spirit A highly refined distillate with a boiling range of about 150ºC to 200ºC used as a paint solvent and for dry cleaning purposes etc.
251
Annex C Further sources of United Kingdom
energy publications Some of the publications listed below give shorter term statistics, some provide further information about energy production and consumption in the United Kingdom and in other countries, and others provide more detail on a country or fuel industry basis. The list also covers recent publications on energy issues and policy, including statistical information, produced or commissioned by BEIS. The list is not exhaustive and the titles of publications and publishers may alter. All titles can be found on the GOV.UK website.
Department for Business, Energy and Industrial Strategy publications on
energy statistics
Energy Statistics Monthly, quarterly and annual statistics on production and consumption of overall energy and individual fuels in the United Kingdom together with energy prices is available in MS Excel format at: www.gov.uk/government/organisations/department-for-business-energy-and-industrial-strategy/about/statistics
Energy Trends A quarterly publication covering all major aspects of energy. It provides a comprehensive picture of energy production and use and contains analysis of data and articles covering energy issues. Available at: www.gov.uk/government/collections/energy-trends.
Energy Prices A quarterly publication containing tables, charts and commentary covering energy prices to domestic and industrial consumers for all the major fuels as well as presenting comparisons of fuel prices in the European Union and G7 countries. Available at: www.gov.uk/government/collections/quarterly-energy-prices.
Energy Flow Chart An annual publication illustrating the flow of primary fuels from home production and imports to their eventual final uses. They are shown in their original state and after being converted into different kinds of energy by the secondary fuel producers. The 2016 edition of the chart shows the flows for 2015. Available at: www.gov.uk/government/collections/energy-flow-charts.
UK Energy in Brief An annual publication summarising the latest statistics on energy production, consumption and prices in the United Kingdom. The figures are taken from “Digest of UK Energy Statistics”. Available at: www.gov.uk/government/collections/uk-energy-in-brief
Energy Consumption in the United Kingdom Energy consumption in the United Kingdom brings together statistics from a variety of sources to produce a comprehensive review of energy consumption and changes in efficiency, intensity and output since the 1970s, with a particular focus on trends since 1990. The information is presented in five sections covering overall energy consumption and energy consumption in the transport, domestic, industrial and service sectors. Available at: www.gov.uk/government/collections/energy-consumption-in-the-uk

252
Sub-National Energy Consumption statistics Sub-National data are produced by BEIS to emphasise the importance of local and regional decision making for energy policy in delivering a number of national energy policy objectives. Data is available at: www.gov.uk/government/organisations/department-for-business-energy-and-industrial-strategy/about/statistics
Fuel Poverty statistics An annual report detailing the latest statistics on fuel poverty. Available at: www.gov.uk/government/collections/fuel-poverty-statistics
Household Energy Efficiency statistics BEIS publishes a range of information relating to the Energy Company Obligation (ECO) and Green Deal (GD). The headline release presents monthly updates of ECO measures and quarterly updates of in-depth ECO statistics, carbon savings and the Green Deal schemes. The detailed report presents annual updates on in-depth Green Deal statistics and insulation levels. Data is available at: www.gov.uk/government/collections/household-energy-efficiency-national-statistics
National Energy Efficiency Data-framework (NEED) BEIS has constructed a National Energy Efficiency Data-framework (NEED) to enable detailed statistical analysis of energy efficiency. The data framework matches the gas and electricity consumption data collected for BEIS sub-national energy consumption statistics and records of energy efficiency measures in the Homes Energy Efficiency Database (HEED) run by the Energy Saving Trust (EST), as well as typographic data about dwellings and households. Data is available at: www.gov.uk/government/collections/national-energy-efficiency-data-need-framework
UK Greenhouse Gas Emissions statistics Emissions data are produced by BEIS to show progress against the UK’s goals, both international and domestic, for reducing greenhouse gas emissions. Data is available at: www.gov.uk/government/collections/uk-greenhouse-gas-emissions-statistics
UK Energy and CO2 emissions projections The Updated Energy Projections (UEP) are published annually by BEIS. They provide updated projections and analysis of energy use and carbon dioxide emissions in the UK. The UEP exercise incorporates all firm environmental policy measures and is based on updated assumptions consistent with the most recent UK Budget announcements. The latest report is available at: www.gov.uk/government/collections/energy-and-emissions-projections
253
Department for Business, Energy and Industrial Strategy policy publications on
energy and climate change
Energy Act 2016 The Energy Act 2016 was given Royal Assent on 12 May 2016. The Act is available at: www.legislation.gov.uk/ukpga/2016/20/contents/enacted
Annual Energy Statement The Annual Energy Statement fulfilled the commitment in the Coalition Programme for the Government to present an annual statement of energy policy to Parliament. The first statement was delivered to Parliament on 27 June 2010, with subsequent statements delivered on 23 November 2011, 29 November 2012 and 31 October 2013. The last Statement, delivered on 6 November 2014, is available at: www.gov.uk/government/publications/annual-energy-statement-2014
Energy Act 2013 The Energy Act 2013 was given Royal Assent on 18 December 2013. The Act is available at: www.legislation.gov.uk/ukpga/2013/32/contents
Energy Act 2011 The Energy Act 2011 was given Royal Assent on 18 October 2011. The Act is available at: www.legislation.gov.uk/ukpga/2011/16/contents
Electricity Market Reform (EMR) White Paper On 12 July 2011 ‘Planning our electric future: a White Paper for secure, affordable and low-carbon electricity’ was published. The White Paper sets out key measures to attract investment, reduce the impact on consumer bills, and create a secure mix of electricity sources including gas, new nuclear, renewables, and carbon capture and storage. The White Paper is available at: www.gov.uk/government/publications/planning-our-electric-future-a-white-paper-for-secure-affordable-and-low-carbon-energy
Energy Act 2010 The Energy Act 2010 was given Royal Assent on 8 April 2010. The Act is available at: www.legislation.gov.uk/ukpga/2010/27/contents
UK Low Carbon Transition Plan The UK Low Carbon Transition Plan was published on 15 July 2009. The Plan is available at: www.gov.uk/government/publications/the-uk-low-carbon-transition-plan-national-strategy-for-climate-and-energy
Energy Act 2008 The Energy Act 2008 was granted Royal Assent on 26 November 2008. The Act is available at: www.legislation.gov.uk/ukpga/2008/32/contents
Climate Change Act 2008 The Climate Change Act 2008 was granted Royal Assent on 26 November 2008. The Act is available at: www.legislation.gov.uk/ukpga/2008/27/contents
254
Other publications including energy information General Eurostat Regional Yearbook (annual); Statistical Office of the European Commission – Eurostat Eurostat Yearbook (annual); Statistical Office of the European Commission - Eurostat Eurostatistics (monthly); Statistical Office of the European Commission – Eurostat Overseas Trade Statistics (OTS) of the United Kingdom; H.M. Revenue and Customs
- OTS trade with EU countries (monthly) - OTS trade with non-EU countries (monthly)
UK Index of production (monthly); Office for National Statistics United Kingdom Minerals Yearbook; British Geological Survey
Energy BP Statistical Review of World Energy (annual); BP Energy Balance Sheets; Statistical Office of the European Commission – Eurostat Energy Statistics; Statistical Office of the European Commission – Eurostat Energy Balances (annual); United Nations Statistical Office Energy Statistics Yearbook (annual); United Nations Statistical Office World Energy Statistics and Balances (annual); International Energy Agency
Coal Annual Reports and Accounts of The Coal Authority and the private coal companies; (apply to the Headquarters of the company concerned) Coal Information (annual); International Energy Agency Coal Statistics (quarterly); International Energy Agency
Oil and Gas Annual Reports and Accounts of National Grid, Centrica and the independent oil and gas supply companies; (contact the Headquarters of the company concerned directly) National Grid – Gas Ten Year Statement - (annual); National Grid Oil and Gas Information (annual); International Energy Agency Oil and Gas Statistics (quarterly); International Energy Agency Petroleum Review (monthly); Energy Institute
Electricity Annual Reports and Accounts of the Electricity Supply Companies, Distributed Companies and Generators; (apply to the Headquarters of the company concerned) Annual Report and Accounts of The Office of Gas and Electricity Markets; OFGEM Electricity Information (annual); International Energy Agency Electricity Statistics (quarterly); International Energy Agency National Grid – Electricity Ten Year Statement - (annual); National Grid
Renewables Renewables Information (annual); International Energy Agency
Prices Energy Prices and Taxes (quarterly); International Energy Agency
255
Useful energy related websites
The BEIS section of the GOV.UK website can be found at: www.gov.uk/government/organisations/department-for-business-energy-and-industrial-strategy
Other Government web sites
Department for Communities and Local Government.
www.gov.uk/government/organisations/department-for-communities-and-local-government
Department for Environment, Food and Rural Affairs
www.gov.uk/government/organisations/department-for-environment-food-rural-affairs
Department for Transport www.gov.uk/government/organisations/department-for-transport
HM Government Online (GOV.UK) www.gov.uk/ HM Revenue & Customs www.gov.uk/government/organisations/hm-
revenue-customs Northern Ireland Executive www.northernireland.gov.uk/ Ofgem (The Office of Gas and Electricity Markets)
www.ofgem.gov.uk/
The Scottish Government www.gov.scot/ The Scottish Parliament www.parliament.scot/ UK Parliament www.parliament.uk/ UK Statistics Authority www.statisticsauthority.gov.uk/ Welsh Government http://gov.wales/
Other useful energy related web sites
BP www.bp.com/ British Geological Survey www.bgs.ac.uk/ BRE (Building Research Establishment)
www.bre.co.uk/
The Coal Authority www.gov.uk/government/organisations/the-coal-authority
Energy Institute www.energyinst.org/home Energy Networks Association www.energynetworks.org/ Energy UK www.energy-uk.org.uk/ Europa (European Union Online) http://europa.eu/ Eurostat (European statistics) http://ec.europa.eu/eurostat Interconnector www.interconnector.com/ International Energy Agency (IEA) www.iea.org/ International Steel Statistics Bureau (ISSB)
www.issb.co.uk/
National Grid www2.nationalgrid.com/ Oil & Gas UK http://oilandgasuk.co.uk/ Renewable UK www.renewableuk.com/ Ricardo Energy & Environment http://ee.ricardo.com/ The Stationery Office www.tso.co.uk/ UK-AIR: Air Information Resource https://uk-air.defra.gov.uk/ UK Petroleum Industry Association www.ukpia.com/home.aspx United Nations Statistics Division https://unstats.un.org/home/ US Department of Energy https://energy.gov/ US Energy Information Administration
www.eia.gov/

256
257
Annex D Major events in the
Energy Industry
2017 Electricity
The foundation stone for the new ElecLink electricity connection between Britain and France was laid in February 2017. The interconnector will run through the Channel Tunnel between Sellindge in the UK and Les Mandarins in France, and will provide 1000MW of electricity, enough capacity to power up to 2 million homes.
Energy Efficiency
Homes across Great Britain will get extra support to make their homes cheaper and easier to keep warm thanks to reforms that came into force in April 2017. Changes to the Energy Company Obligation (ECO) will make sure energy companies give support to people struggling to meet their heating bills, with plans announced to extend the scheme from April 2017 to September 2018.
Smart Meters
A Smart Meters bill was included in the Queen’s speech in June 2017 to allow the Government to continue to oversee the successful completion of the rollout of smart meters and protect consumers, leading to £5.7 billion of net benefits to Britain.
2016 Energy Policy The Energy Bill received Royal Assent in May 2016. In summary the Bill:
Creates the framework to formally establish the Oil and Gas Authority (OGA) as an independent regulator, taking the form of a government company, so that it can act with greater flexibility and independence. It gives the OGA new powers including: access to external meetings; data acquisition and retention; dispute resolution; and sanctions. It also enables the transfer of the Secretary of State of the Department for Business, Energy and Industrial Strategy (BEIS) existing regulatory powers in respect of oil and gas to the OGA. The Secretary of State’s environmental regulatory functions in relation to oil and gas are not transferred to the OGA.
Enables more comprehensive charging of the offshore oil and gas industry in relation to environmental regulatory functions carried out by BEIS.
Makes local communities the primary decision makers on new
onshore wind developments, alongside measures taken by the Department for Communities and Local Government. It removes the need for the Secretary of State of BEIS consent for large onshore wind farms (over 50 megawatt) in England and Wales under the Electricity Act 1989.
Brings forward the early closure of the Renewables Obligation subsidy scheme to new onshore wind developments in Great Britain.
258
2016 (continued)
Electricity The Government gave development consent to the Hornsea Project Two offshore wind farm off the coast of Yorkshire in August 2016. Once built, the windfarm will deliver 1,800 megawatts of low carbon electricity to around 1.8 million UK homes.
The Government gave consent in January 2016 for a new electric line
connection, which will form a major part of the infrastructure needed for the transmission of electricity from Hinkley Point C nuclear power station. The project will be the first scheme to use the new T-pylon, which resulted from a competition held in 2011 by the Royal Institute of British Architects, BEIS and National Grid to explore the potential for a new generation of pylon design
Nuclear Following a comprehensive review of the Hinkley Point C project, and a
revised agreement with EDF, the Government in September 2016 decided to proceed with the first new nuclear power station for a generation. A new legal framework will be imposed on future foreign investment in Britain’s critical infrastructure, which will include nuclear energy and apply after Hinkley.
2015 Climate Change A new global climate agreement was agreed at the United Nations
conference on climate change in Paris in December 2015. For the first time ever 195 countries, including the world’s largest emitters, have committed to act together to combat climate change and be held equally accountable. The agreement sets out a clear long-term goal of net zero emissions by the end of the century, showing that the world is committed to decarbonising. Progress against this goal will be independently assessed in 2018 and every five years thereafter. Coal Kellingley Colliery located at Beal in North Yorkshire, closed on 18 December 2015, marking the end of deep-pit coal mining in the UK.
Electricity The Government gave approval in October 2015 for the construction of the Ferrybridge Multifuel 2 Power Station at Knottingley, West Yorkshire. If built, the power station will be capable of producing up to 90MWe of electricity, by burning fuel derived from refuse and industrial and commercial waste, such as wood, which would have originally ended up in landfill. The Government gave approval in September 2015 for the construction of a new gas power plant in Sutton Bridge, Lincolnshire. If built, the station will produce up to 1.8 GW of electricity. The Government gave approval in August 2015 for the construction of an offshore windfarm off the UK North East coast. If built, Dogger Bank Teesside A and B Offshore wind project will include up to 400 wind turbines in total, across two offshore wind generating stations, each with an installed capacity of up to 1.2 GW. Onshore elements will be located in Redcar and Cleveland, with the potential to generate enough green electricity to power up to 1.8 million British homes. The Government approved the construction of two gas-fired power generation plants in July 2015 by Progress Power Ltd in Eye, Suffolk, and by Hirwaun Power Limited near Aberdare in South Wales. Both plants will have a generating capacity of up to 299 megawatts of electrical output.
259
2015 (continued)
Planning consent was given in June 2015 for the construction of the world’s first tidal lagoon. If built, turbines in the proposed six-mile horseshoe shaped sea wall around Swansea Bay in Wales could generate around 500GWh per year of low carbon electricity.
The Government gave consent to the Dogger Bank Creyke Beck A and B
offshore wind project off the coast of Yorkshire in February 2015. Once built it will generate enough electricity to power almost 2 million homes.
Energy Policy
The Government set out in November 2015 their vision for an energy system that puts consumers first, delivers more competition, reduces the burden on bill-payers and ensures enough electricity generation to power the nation, supported by 4 key policy priorities:
Consultation on ending unabated coal-fired power stations by 2025
New gas-fired power stations a priority
Commitment to offshore wind support completes commitment to secure, low-carbon, affordable electricity supplies
Move towards a smarter energy system
A new Energy Bill was proposed in the Queen's Speech in May 2015 which will:
Ensure there will be affordable and reliable energy for businesses and families;
Give the Oil and Gas Authority the powers it needs to become a robust, independent and effective regulator, and enable it to maximise the economic recovery of oil and gas from UK waters.
Change the law to give local communities the final say on wind farm applications.
The Infrastructure Act became law in February 2015 enshrining new
measures to make it easier, quicker and simpler to get Britain building. The legislation will give local people the right to buy a stake in renewable energy projects, as well as boosting energy security and economic growth by extracting domestic shale gas, which has the potential to create jobs, making the UK less reliant on imports from abroad and so help tackle climate change.
Fuel Poverty
A new Fuel Poverty strategy, the first for over a decade, was launched in March 2015 which outlines the challenges and actions for the next 15 years to ensure Government take the right steps to tackle fuel poverty and to get help to those who need it most. A new legally binding target, in force since December 2014, forms a key part of the new strategy; it requires that as many fuel poor homes as reasonably practicable, achieve a minimum energy efficiency rating of a Band C, by 2030. The strategy also set out interim milestones: to lift as many fuel poor homes in England as is reasonably practicable to Band E by 2020; and Band D by 2025 .

260
BEIS news stories including press releases, speeches and statements are available here. For major events in earlier years see the full version of this annex on the BEIS section of the GOV.UK website at: www.gov.uk/government/collections/digest-of-uk-energy-statistics-dukes
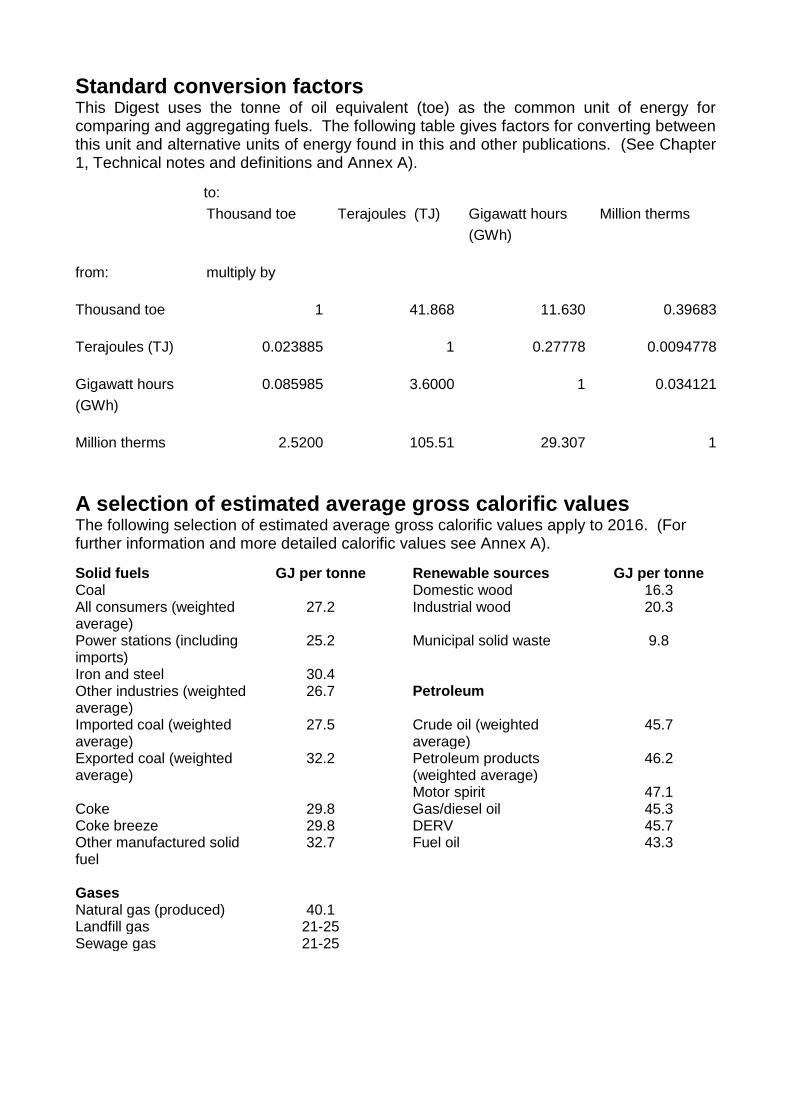
Standard conversion factors This Digest uses the tonne of oil equivalent (toe) as the common unit of energy for comparing and aggregating fuels. The following table gives factors for converting between this unit and alternative units of energy found in this and other publications. (See Chapter 1, Technical notes and definitions and Annex A).
to:
Thousand toe Terajoules (TJ) Gigawatt hours
(GWh)
Million therms
from: multiply by
Thousand toe 1 41.868 11.630 0.39683
Terajoules (TJ) 0.023885 1 0.27778 0.0094778
Gigawatt hours
(GWh)
0.085985 3.6000 1 0.034121
Million therms 2.5200 105.51 29.307 1
A selection of estimated average gross calorific values The following selection of estimated average gross calorific values apply to 2016. (For further information and more detailed calorific values see Annex A).
Solid fuels GJ per tonne Renewable sources GJ per tonne Coal Domestic wood 16.3 All consumers (weighted average)
27.2 Industrial wood 20.3
Power stations (including imports)
25.2 Municipal solid waste 9.8
Iron and steel 30.4 Other industries (weighted average)
26.7 Petroleum
Imported coal (weighted average)
27.5 Crude oil (weighted average)
45.7
Exported coal (weighted average)
32.2 Petroleum products (weighted average)
46.2
Motor spirit 47.1 Coke 29.8 Gas/diesel oil 45.3 Coke breeze 29.8 DERV 45.7 Other manufactured solid fuel
32.7 Fuel oil 43.3
Gases Natural gas (produced) 40.1 Landfill gas 21-25 Sewage gas 21-25

© Crown copyright 2017 Department for Business, Energy & Industrial Strategy 1 Victoria Street, London SW1H 0ET www.gov.uk/beis