Embed Size (px)
Citation preview
Education and Employment of Biological and Medical Scientists
2015
Data from National Surveys
Howard H. Garrison and Elisabeth Campbell
FASEB Office of Public Affairs

2
Contents (1 of 7)
Graduate School Applications Graduate School Applications in Biological and Health S
ciences [Slide 10]
Graduate Records Examination (GRE) Scores Mean Quantitative Scores of US Citizens and Permanent
Residents Intending to Enroll in Biological and Health Sciences [Slide 12]
Graduate School Enrollment First
Time, Full Time Biological and Medical Sciences Graduate Students in Doctorate Granting Departments by Citizenship/Visa Status [Slide 14]
First Time, Full Time Biological and Medical Sciences Grad Students in Doctorate Granting Departments by Ethnicity (US Citizens and Permanent Residents Only) [Slide 15]
3
Contents (2 of 7)
Graduate School Enrollment (continued) Total Biological and Medical Sciences Graduate Students i
n Doctorate Granting Departments by Citizenship/Visa Status [Slide 16]− US Citizens & Permanent Residents Only [Slide 17]− Temporary Residents Only [Slide 18]
Total Biological and Medical Sciences Graduate Students in Doctorate Granting Departments by Ethnicity (US Citizens and Permanent Residents Only) [Slide 19]
Total Biological and Medical Sciences Graduate Students in Doctorate Granting Departments by Sex [Slide 20]
Full Time Biological and Medical Sciences Graduate Students in Doctorate Granting Departments by Mechanism of Support [Slide 21]
4
Contents (3 of 7)
NIH Trainees and Fellows Pre-Doctoral and Post-Doctoral Positions on NIH Training
Grants and Fellowships [Slide 23]
Fellowship (F32) Applications and Awards [Slide 24] NIH Spending on Training Grants and Fellowships [Slide 2
5] Doctorate Awards
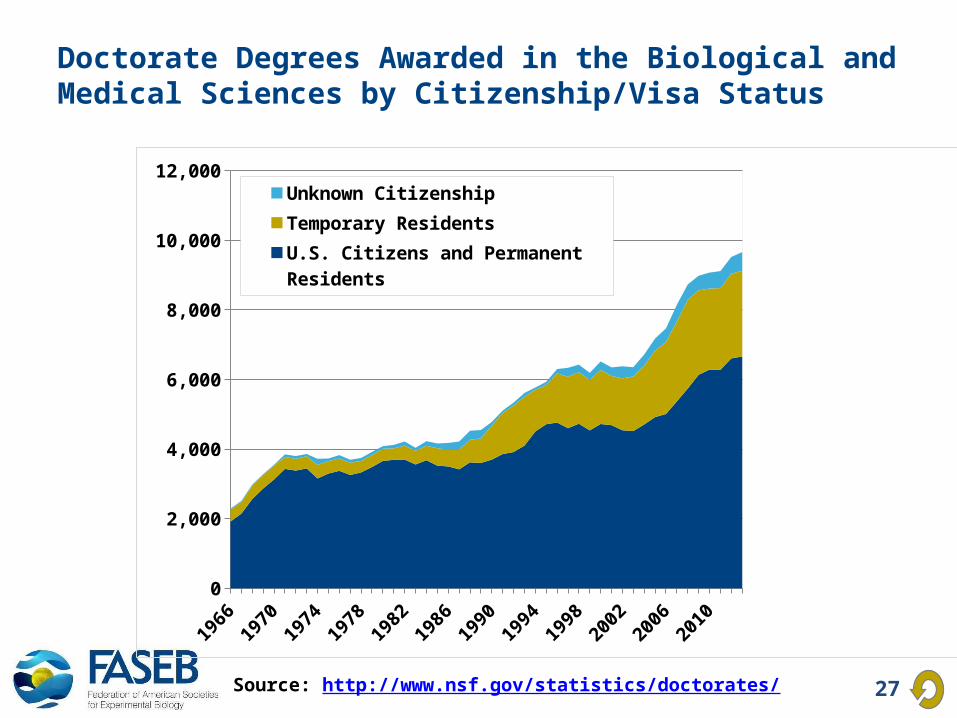
Doctorate Degrees Awarded in the Biological and Medical Sciences by Citizenship/Visa Status [Slide 27]
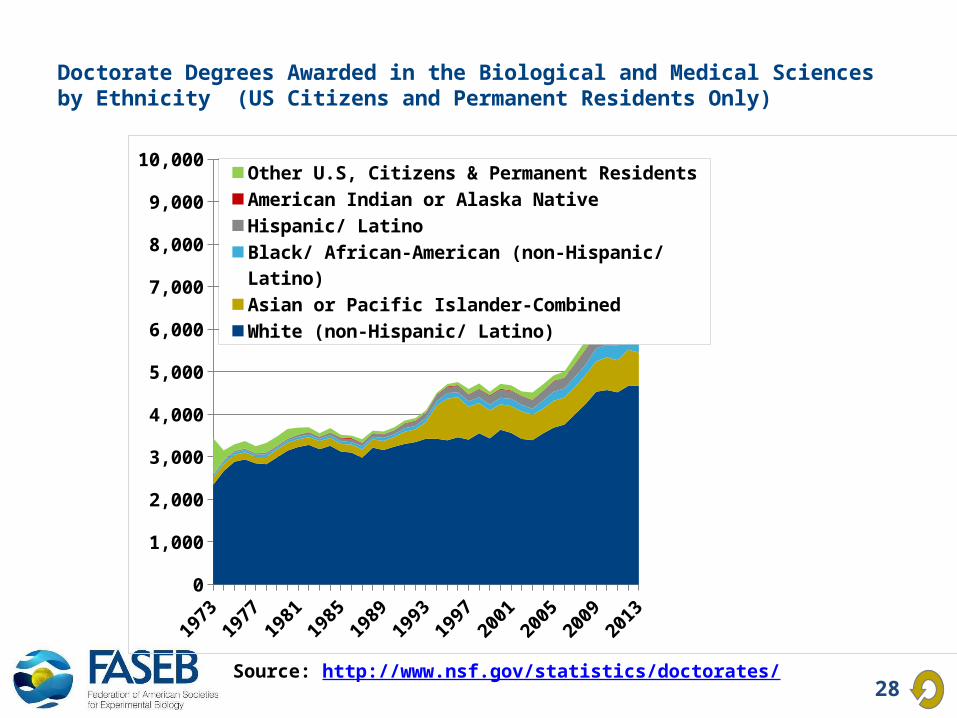
Doctorate Degrees Awarded in the Biological and Medical Sciences by Ethnicity (US Citizens and Permanent Residents Only) [Slide 28]
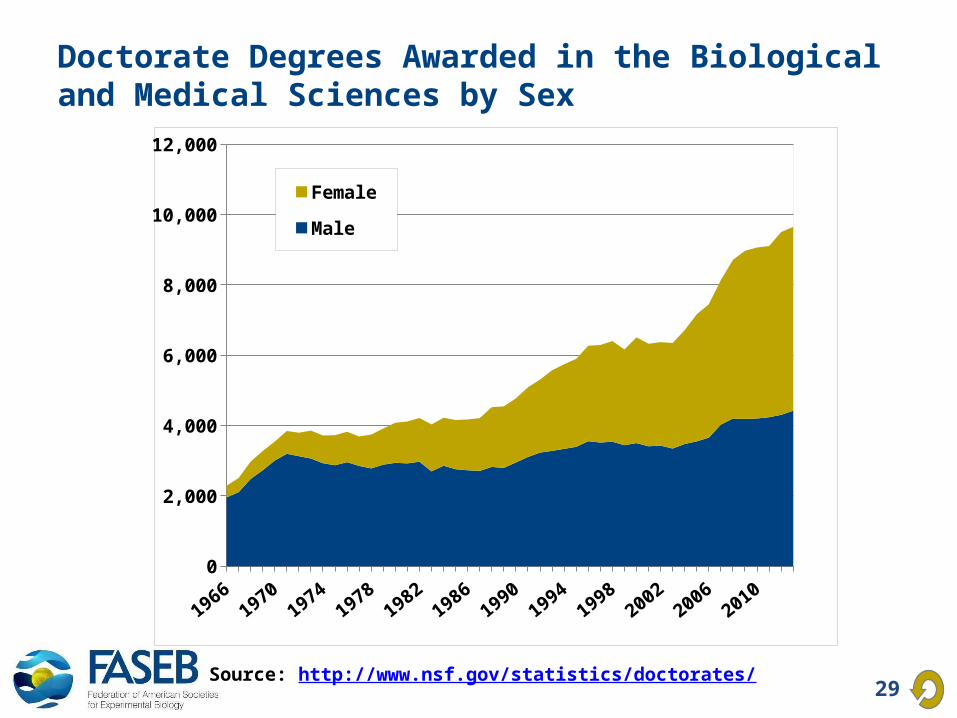
Doctorate Degrees Awarded in the Biological and Medical Sciences by Sex [Slide 29]
5
Contents (4 of 7)
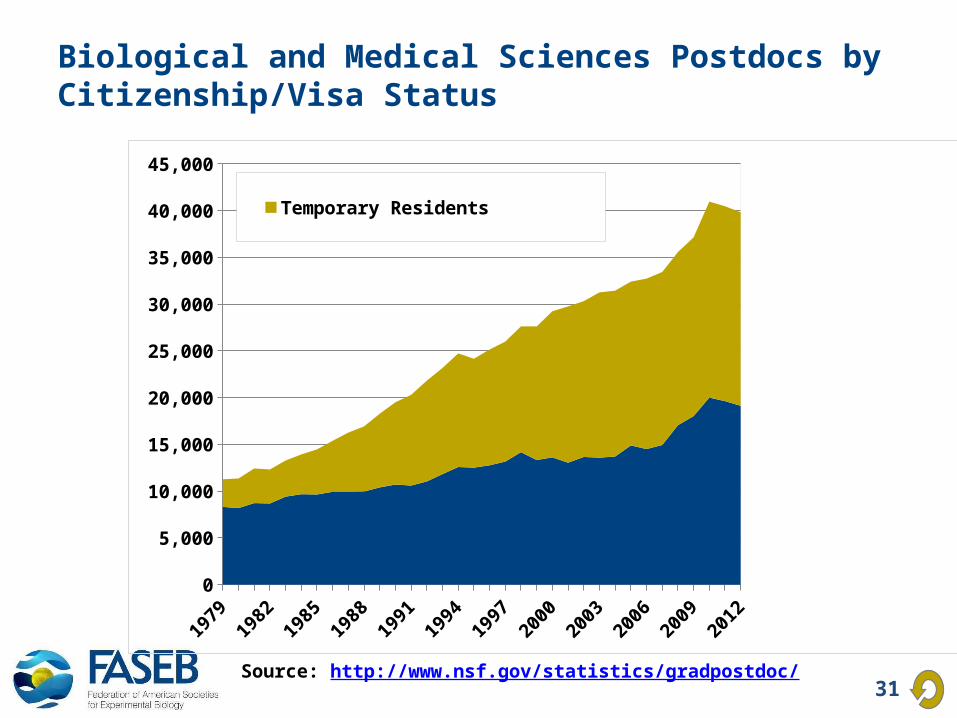
Academic Postdoctoral Appointments Biological and Medical Sciences Postdocs by Citizenship/
Visa Status [Slide 31]
Biological and Medical Sciences Postdocs by Degree and Citizenship/ Visa Status [Slide 32]− US Postdocs with MD or PhD [Slide 33]− Temporary Resident Postdocs with MD or PhD [Slide 34]
Biological and Medical Sciences Postdocs by Sex and Citizenship/ Visa Status [Slide 35]
Biological and Medical Sciences Postdocs by Source of Support Slide 36]
6
Contents (5 of 7)
Postdoctoral Appointments for Individuals with PhDs from US Institutions Percent of US Biomedical PhDs with Postdoc 1-2 Years Po
st-PhD [Slide 38]
Percent of US Biomedical PhDs with Postdoc 3-4 Years Post-PhD [Slide 39]
Percent of US Biomedical PhDs with Academic Postdoc 1-2 Years Post-PhD [Slide 40]
Percent of US Biomedical PhDs with Academic Postdoc 3-4 Years Post-PhD [Slide 41]
Stay Rates of Foreign Doctorate Recipients from US Universities Stay Rates for Temporary Residents with Life Science Do
ctorates [Slide 43]
7
Contents (6 of 7)
Employment Status of Individuals with PhDs from US Institutions Employment of Biomedical Science PhDs by Sector of Em
ployment [Slide 45]
Distribution of Biomedical Science PhDs by Sector of Employment [Slide 46]
Academically Employed Biomedical PhDs by Tenure Status [Slide 47]
Distribution of Academically Employed Biomedical PhDs by Tenure Status [Slide 48]
Percentage of U.S. Biomedical Science PhDs Holding Tenure or Tenure-Track Positions, Total [Slide 49]
Percentage of U.S. Biomedical Science PhDs Holding Tenure or Tenure-Track Positions 5-6 Years Post-PhD [Slide 50]
8
Contents (7 of 7)
Medical School Faculty Appointments Medical School Faculty Members by Degree and Departm
ent Type [Slide 52]
Total and New Faculty 1970-2007 in U.S. Medical Schools [Slide 53]
NIH Grant Applications and Awards Age of First Time R01 Equivalent Investigators [Slide 55] Number of Competing Awards (Including First R01) [Slide
56] Employment in Industry
Employment in U.S. Biotechnology Firms, 1992-2012 [Slide 58]
Employment in U.S. Pharmaceutical Companies, 1999-2010[Slide 59]

9
Graduate School Applications

10
Graduate School Applications in Health and Biological Sciences
Source: http://www.cgsnet.org/
19911993
19951997
19992001
20032005
20072009
20112013
0
50,000
100,000
150,000
200,000
250,000
300,000
350,000
400,000
Biological Sciences
Health Sciences

11
Graduate Records Examination (GRE) Scores
12
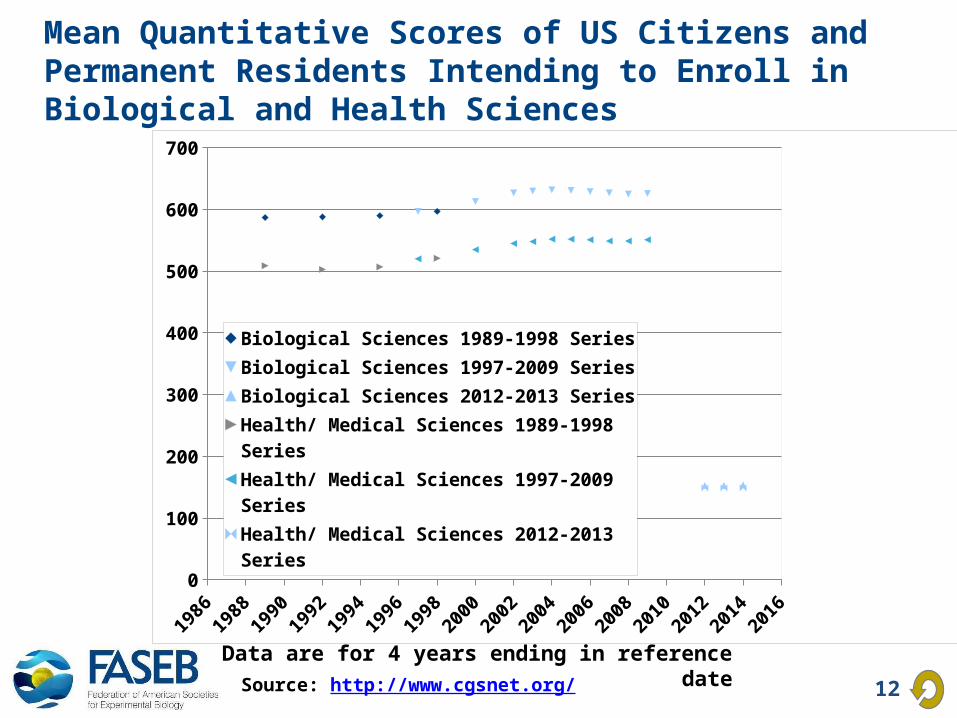
Mean Quantitative Scores of US Citizens and Permanent Residents Intending to Enroll in Biological and Health Sciences
Source: http://www.cgsnet.org/
Data are for 4 years ending in reference date1986
19881990
19921994
19961998
20002002
20042006
20082010
20122014
20160
100
200
300
400
500
600
700
Biological Sciences 1989-1998 Series
Biological Sciences 1997-2009 Series
Biological Sciences 2012-2013 Series
Health/ Medical Sciences 1989-1998 Series
Health/ Medical Sciences 1997-2009 Series
Health/ Medical Sciences 2012-2013 Series

13
Graduate School Enrollment
14
20002001
20022003
20042005
20062007
20082009
20102011
20120
2,000
4,000
6,000
8,000
10,000
12,000
14,000
16,000
18,000
20,000
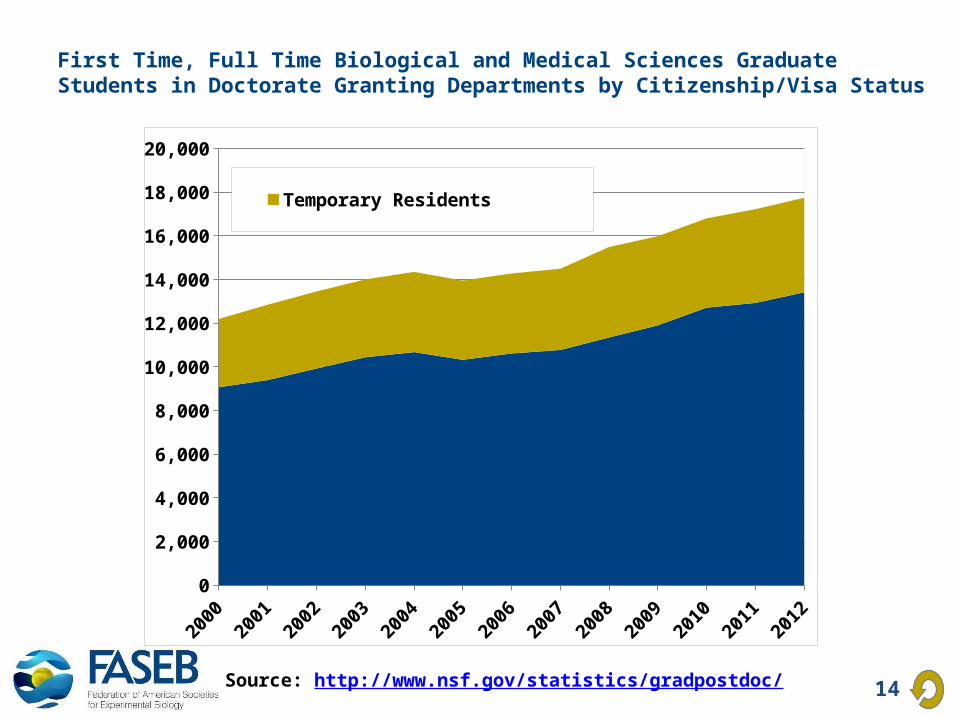
Temporary ResidentsUS Citizens and Permanent Res-idents
First Time, Full Time Biological and Medical Sciences Graduate Students in Doctorate Granting Departments by Citizenship/Visa Status
Source: http://www.nsf.gov/statistics/gradpostdoc/
15
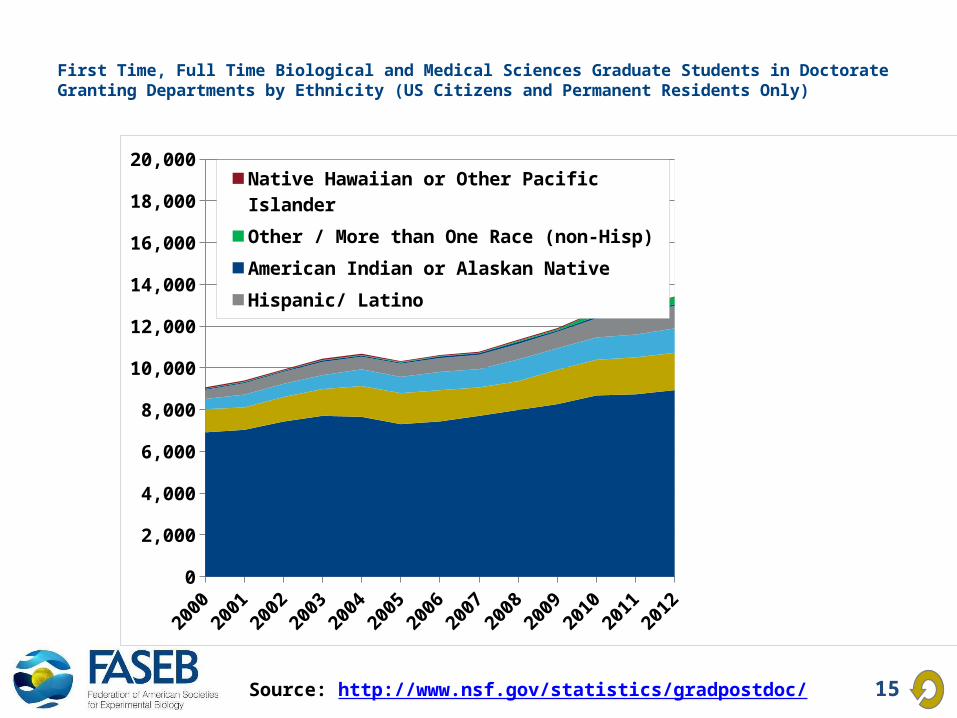
First Time, Full Time Biological and Medical Sciences Graduate Students in Doctorate Granting Departments by Ethnicity (US Citizens and Permanent Residents Only)
Source: http://www.nsf.gov/statistics/gradpostdoc/
20002001
20022003
20042005
20062007
20082009
20102011
20120
2,000
4,000
6,000
8,000
10,000
12,000
14,000
16,000
18,000
20,000Native Hawaiian or Other Pacific IslanderOther / More than One Race (non-Hisp)American Indian or Alaskan NativeHispanic/ LatinoBlack/African American (non-Hispanic/ Latino)AsianWhite (non-Hispanic/ Latino)
16
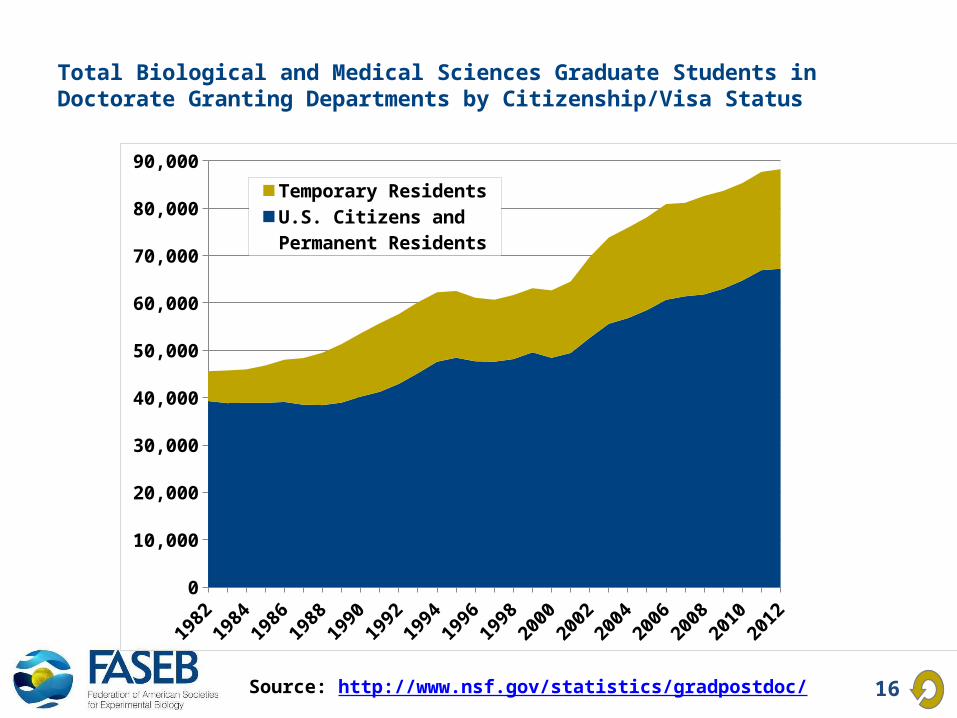
Total Biological and Medical Sciences Graduate Students in Doctorate Granting Departments by Citizenship/Visa Status
Source: http://www.nsf.gov/statistics/gradpostdoc/
19821984
19861988
19901992
19941996
19982000
20022004
20062008
20102012
0
10,000
20,000
30,000
40,000
50,000
60,000
70,000
80,000
90,000
Temporary Residents
U.S. Citizens and Per-manent Residents
17
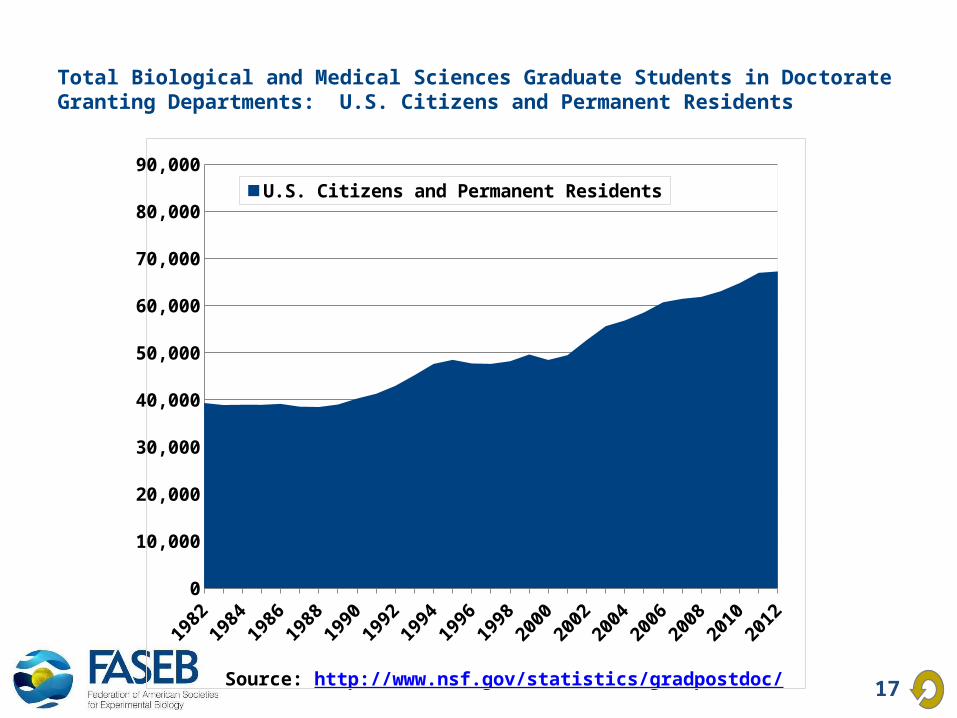
Total Biological and Medical Sciences Graduate Students in Doctorate Granting Departments: U.S. Citizens and Permanent Residents
Source: http://www.nsf.gov/statistics/gradpostdoc/
0
10,000
20,000
30,000
40,000
50,000
60,000
70,000
80,000
90,000
U.S. Citizens and Permanent Residents
18
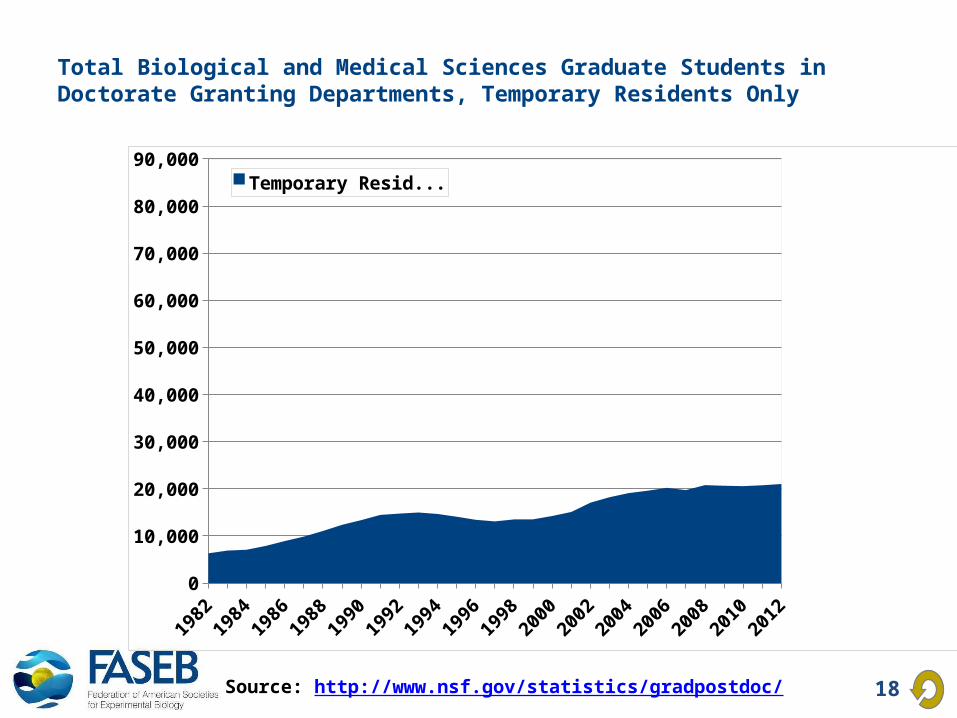
Total Biological and Medical Sciences Graduate Students in Doctorate Granting Departments, Temporary Residents Only
Source: http://www.nsf.gov/statistics/gradpostdoc/
19821984
19861988
19901992
19941996
19982000
20022004
20062008
20102012
0
10,000
20,000
30,000
40,000
50,000
60,000
70,000
80,000
90,000Temporary Residents
19
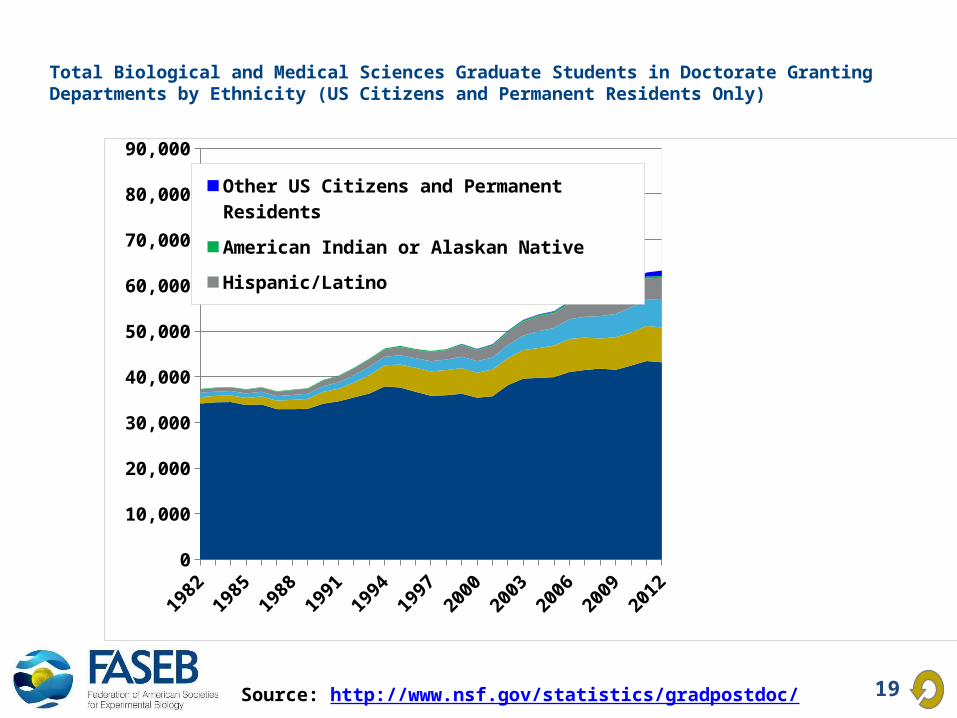
Total Biological and Medical Sciences Graduate Students in Doctorate Granting Departments by Ethnicity (US Citizens and Permanent Residents Only)
Source: http://www.nsf.gov/statistics/gradpostdoc/
19821984
19861988
19901992
19941996
19982000
20022004
20062008
20102012
0
10,000
20,000
30,000
40,000
50,000
60,000
70,000
80,000
90,000Other US Citizens and Permanent ResidentsAmerican Indian or Alaskan NativeHispanic/LatinoBlack/African American (non-Hispanic/Latino)Asian or Pacific IslanderWhite (non-Hispanic/Latino)
20
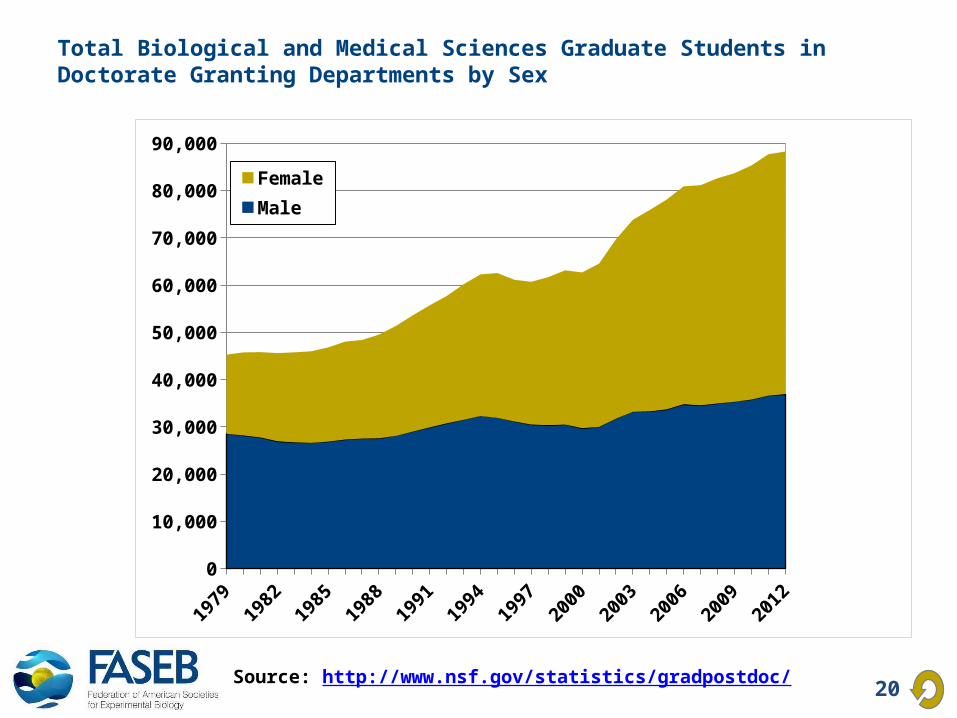
Total Biological and Medical Sciences Graduate Students in Doctorate Granting Departments by Sex
Source: http://www.nsf.gov/statistics/gradpostdoc/
19791981
19831985
19871989
19911993
19951997
19992001
20032005
20072009
20110
10,000
20,000
30,000
40,000
50,000
60,000
70,000
80,000
90,000
Female
Male
21
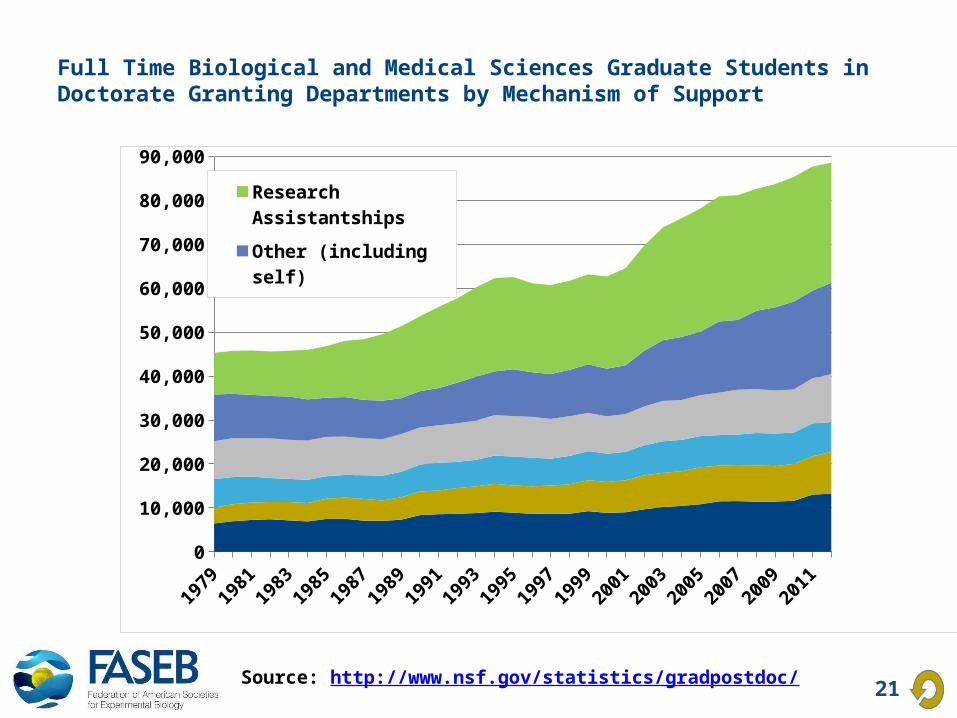
Full Time Biological and Medical Sciences Graduate Students in Doctorate Granting Departments by Mechanism of Support
Source: http://www.nsf.gov/statistics/gradpostdoc/
19791981
19831985
19871989
19911993
19951997
19992001
20032005
20072009
20110
10,000
20,000
30,000
40,000
50,000
60,000
70,000
80,000
90,000Research AssistantshipsOther (including self)Teaching AssistantshipsTraineeshipsFellowshipsUnknown

22
NIH Trainees and Fellows
23
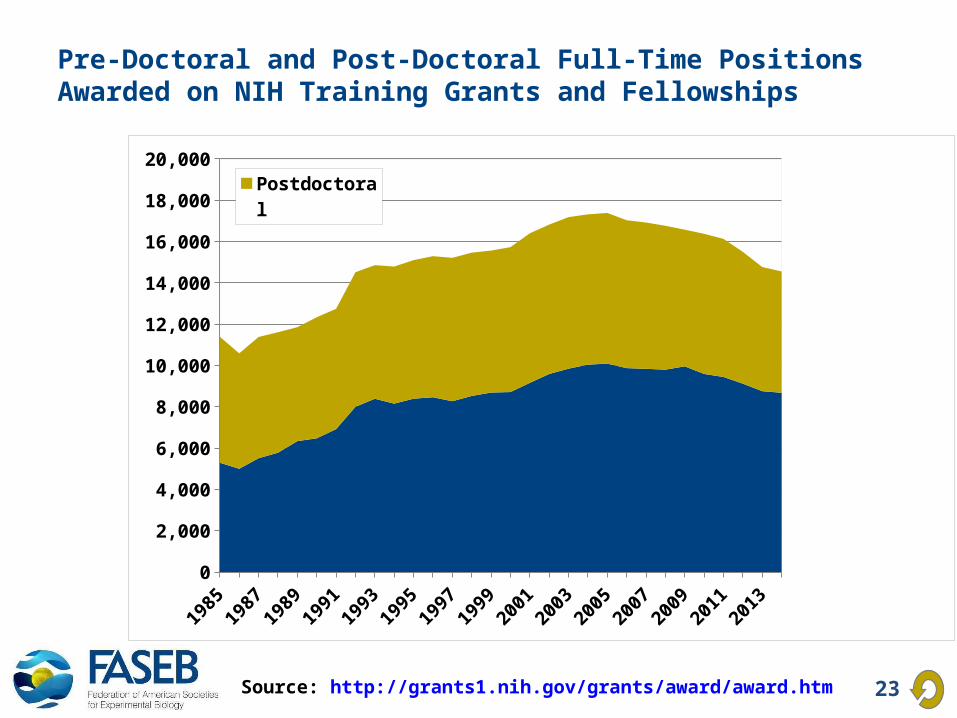
Pre-Doctoral and Post-Doctoral Full-Time Positions Awarded on NIH Training Grants and Fellowships
Source: http://grants1.nih.gov/grants/award/award.htm
19851987
19891991
19931995
19971999
20012003
20052007
20092011
20130
2,000
4,000
6,000
8,000
10,000
12,000
14,000
16,000
18,000
20,000
PostdoctoralPredoctoral
24
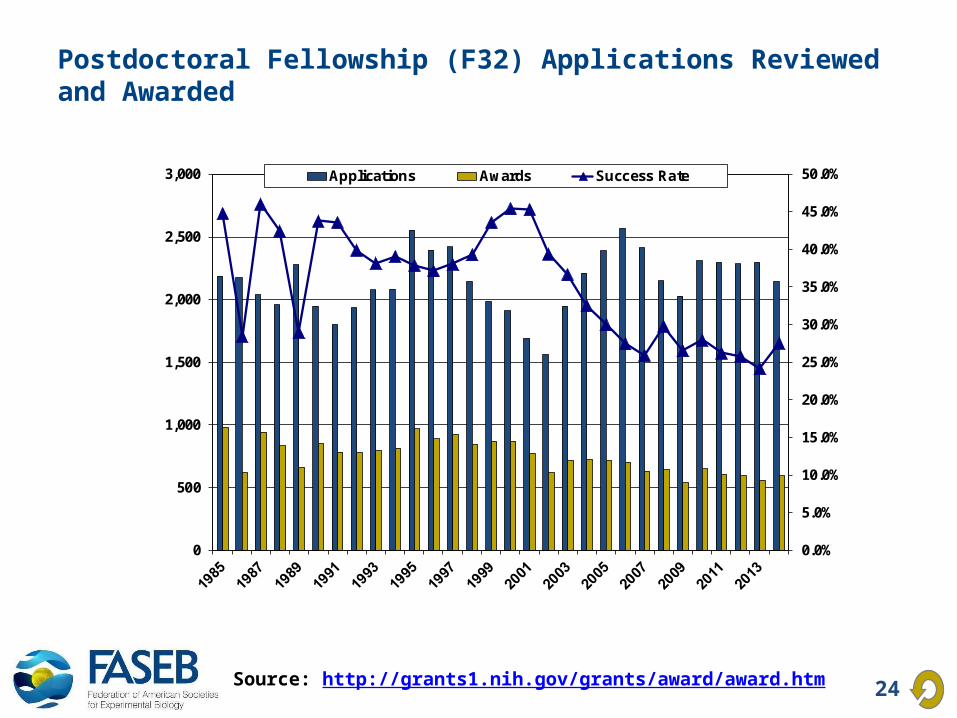
Postdoctoral Fellowship (F32) Applications Reviewed and Awarded
0.0%
5.0%
10.0%
15.0%
20.0%
25.0%
30.0%
35.0%
40.0%
45.0%
50.0%
0
500
1,000
1,500
2,000
2,500
3,000 Applications Awards Success Rate
Source: http://grants1.nih.gov/grants/award/award.htm
25
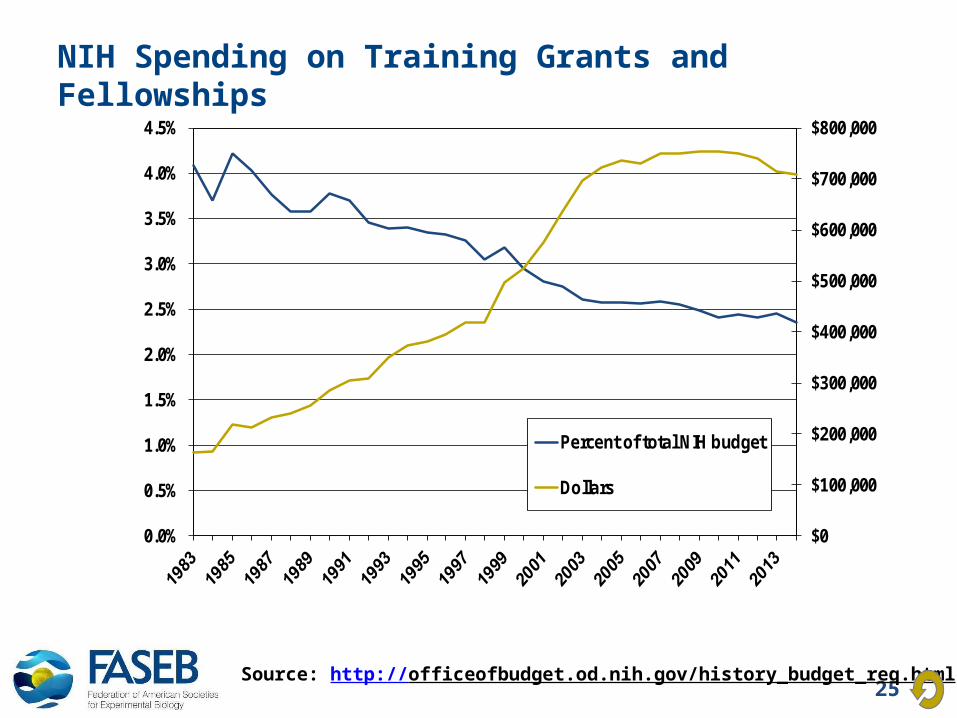
NIH Spending on Training Grants and Fellowships
$0
$100,000
$200,000
$300,000
$400,000
$500,000
$600,000
$700,000
$800,000
0.0%
0.5%
1.0%
1.5%
2.0%
2.5%
3.0%
3.5%
4.0%
4.5%
Percent of total NIH budget
Dollars
Source: http://officeofbudget.od.nih.gov/history_budget_req.html

26
Doctorate Awards
27
Doctorate Degrees Awarded in the Biological and Medical Sciences by Citizenship/Visa Status
19661970
19741978
19821986
19901994
19982002
20062010
0
2,000
4,000
6,000
8,000
10,000
12,000
Unknown Citizenship
Temporary Residents
U.S. Citizens and Permanent Residents
Source: http://www.nsf.gov/statistics/doctorates/
28
Doctorate Degrees Awarded in the Biological and Medical Sciences by Ethnicity (US Citizens and Permanent Residents Only)
Source: http://www.nsf.gov/statistics/doctorates/
19731976
19791982
19851988
19911994
19972000
20032006
20092012
0
1,000
2,000
3,000
4,000
5,000
6,000
7,000
8,000
9,000
10,000Other U.S, Citizens & Permanent Residents
American Indian or Alaska Native
Hispanic/ Latino
Black/ African-American (non-Hispanic/ Latino)
Asian or Pacific Islander-Combined
White (non-Hispanic/ Latino)
29
Doctorate Degrees Awarded in the Biological and Medical Sciences by Sex
19661969
19721975
19781981
19841987
19901993
19961999
20022005
20082011
0
2,000
4,000
6,000
8,000
10,000
12,000
Female
Male
Source: http://www.nsf.gov/statistics/doctorates/

30
Academic Postdoctoral Appointments
31
Biological and Medical Sciences Postdocs by Citizenship/Visa Status
Source: http://www.nsf.gov/statistics/gradpostdoc/
19791981
19831985
19871989
19911993
19951997
19992001
20032005
20072009
20110
5,000
10,000
15,000
20,000
25,000
30,000
35,000
40,000
45,000Temporary ResidentsU.S. Citizens and Permanent Res-idents
32
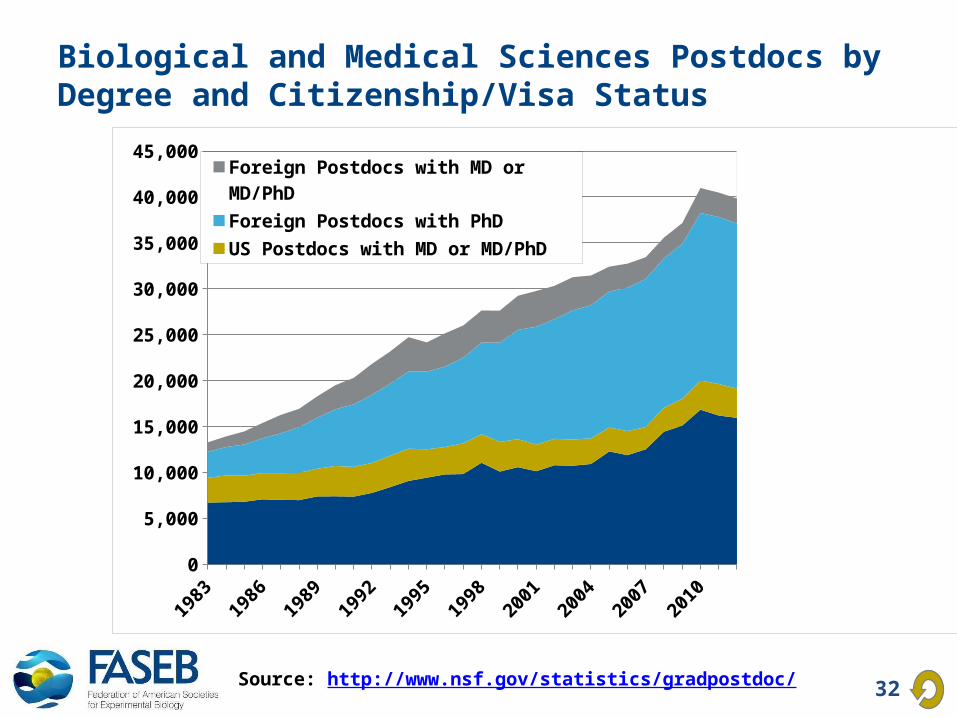
Biological and Medical Sciences Postdocs by Degree and Citizenship/Visa Status
Source: http://www.nsf.gov/statistics/gradpostdoc/
19831985
19871989
19911993
19951997
19992001
20032005
20072009
20110
5,000
10,000
15,000
20,000
25,000
30,000
35,000
40,000
45,000Foreign Postdocs with MD or MD/PhD
Foreign Postdocs with PhD
US Postdocs with MD or MD/PhD
US Postdocs with PhD
33
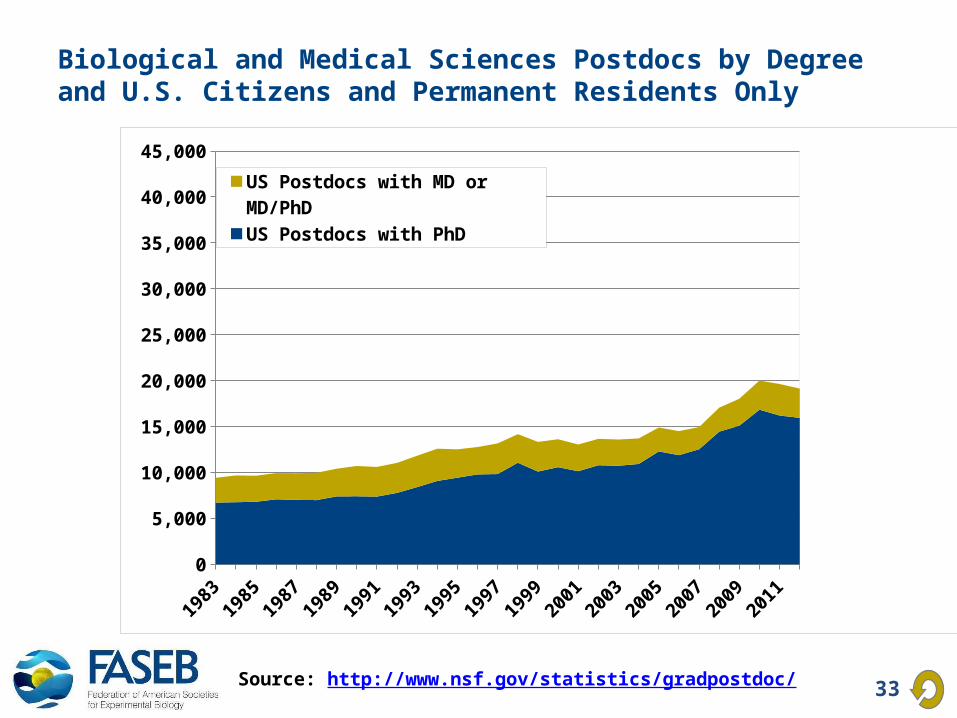
Biological and Medical Sciences Postdocs by Degree and U.S. Citizens and Permanent Residents Only
Source: http://www.nsf.gov/statistics/gradpostdoc/
19831985
19871989
19911993
19951997
19992001
20032005
20072009
20110
5,000
10,000
15,000
20,000
25,000
30,000
35,000
40,000
45,000
US Postdocs with MD or MD/PhD
US Postdocs with PhD
34
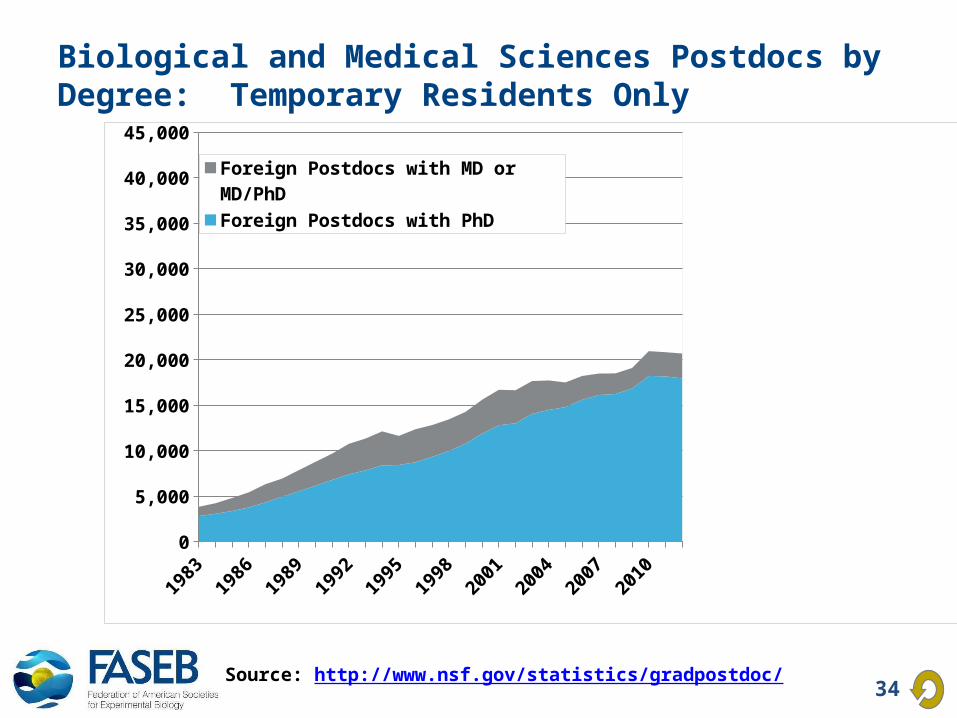
Biological and Medical Sciences Postdocs by Degree: Temporary Residents Only
Source: http://www.nsf.gov/statistics/gradpostdoc/
19831985
19871989
19911993
19951997
19992001
20032005
20072009
20110
5,000
10,000
15,000
20,000
25,000
30,000
35,000
40,000
45,000
Foreign Postdocs with MD or MD/PhD
Foreign Postdocs with PhD
35
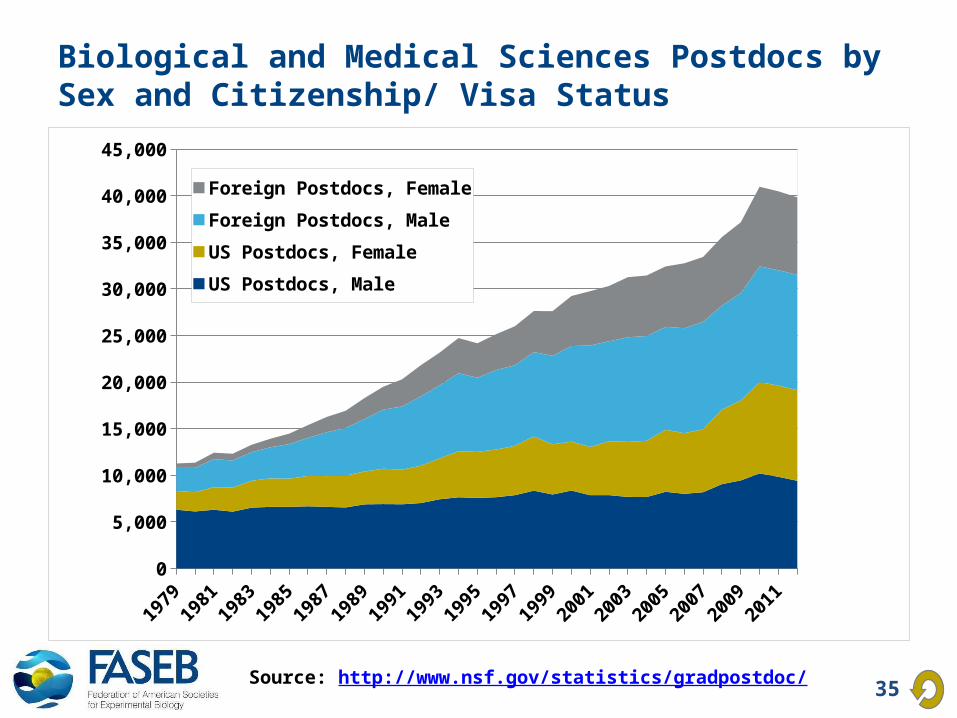
Biological and Medical Sciences Postdocs by Sex and Citizenship/ Visa Status
Source: http://www.nsf.gov/statistics/gradpostdoc/
19791981
19831985
19871989
19911993
19951997
19992001
20032005
20072009
20110
5,000
10,000
15,000
20,000
25,000
30,000
35,000
40,000
45,000
Foreign Postdocs, Female
Foreign Postdocs, Male
US Postdocs, Female
US Postdocs, Male
36
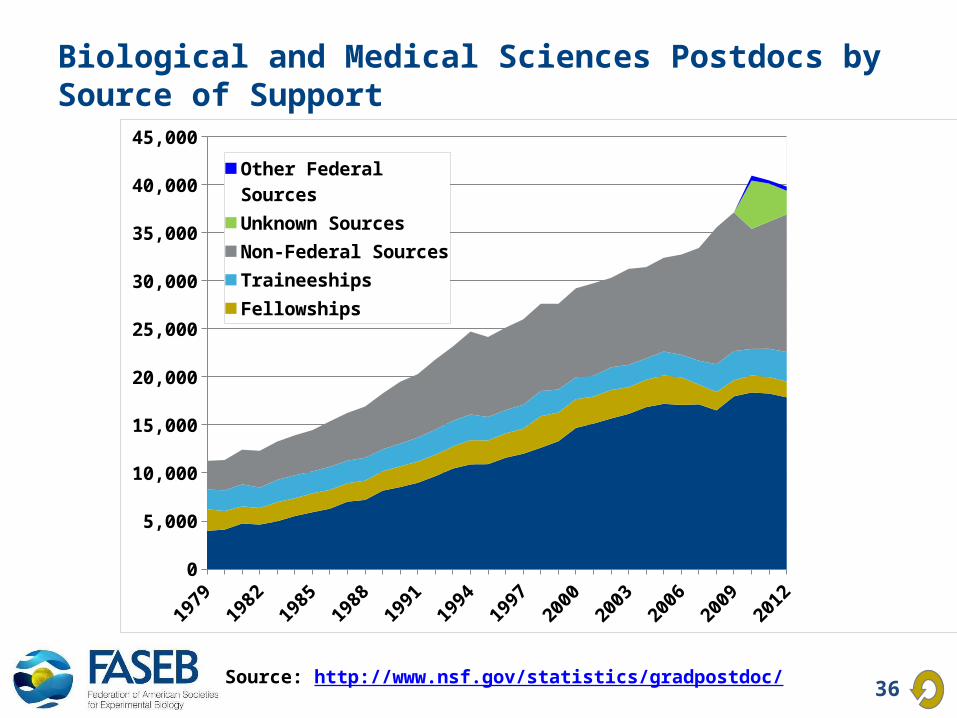
Biological and Medical Sciences Postdocs by Source of Support
Source: http://www.nsf.gov/statistics/gradpostdoc/
19791981
19831985
19871989
19911993
19951997
19992001
20032005
20072009
20110
5,000
10,000
15,000
20,000
25,000
30,000
35,000
40,000
45,000
Other Federal Sources
Unknown Sources
Non-Federal Sources
Traineeships
Fellowships
Research Grants
37
Postdoctoral Appointments for Individuals with PhDs from US Institutions
38
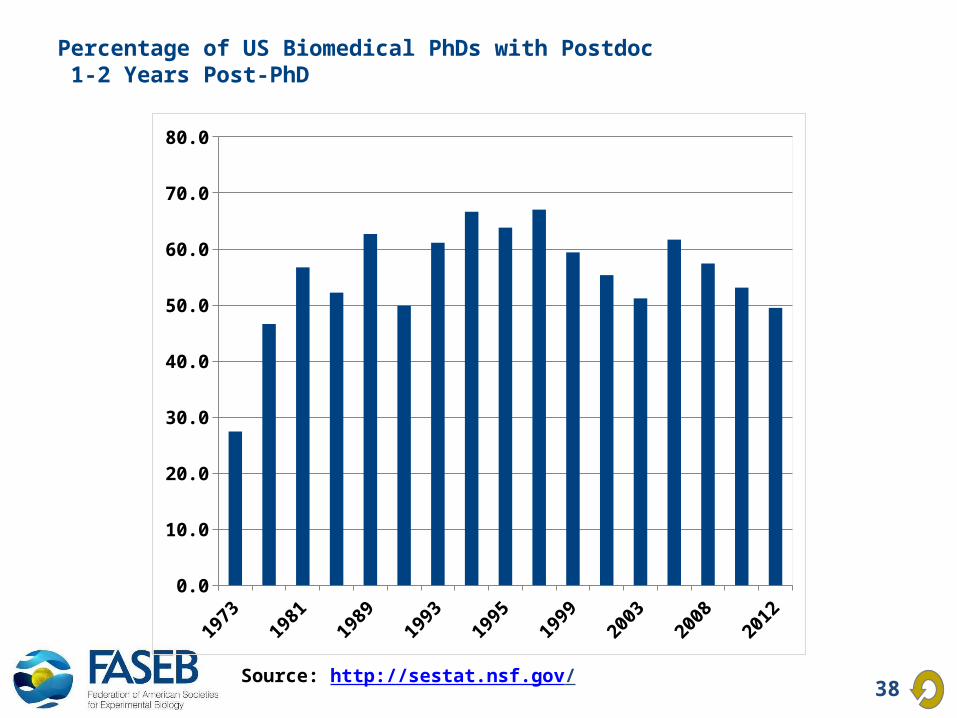
Percentage of US Biomedical PhDs with Postdoc 1-2 Years Post-PhD
Source: http://sestat.nsf.gov/
19731977
19811985
19891991
1993
1993 NEW
19951997
19992001
20032006
20082010
20120.0
10.0
20.0
30.0
40.0
50.0
60.0
70.0
80.0
39
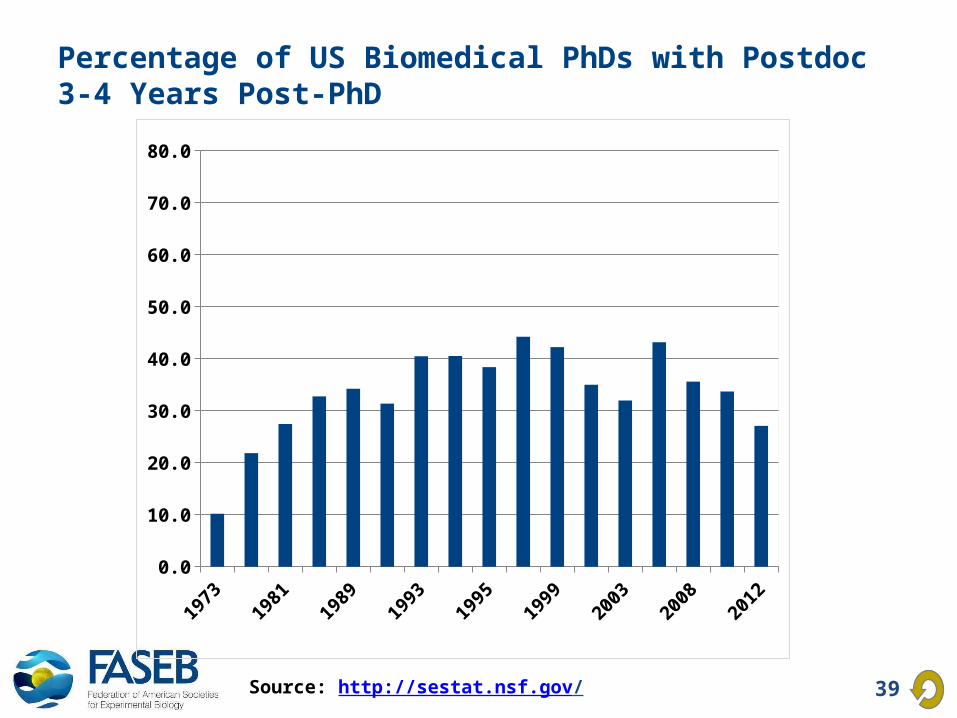
Percentage of US Biomedical PhDs with Postdoc 3-4 Years Post-PhD
Source: http://sestat.nsf.gov/
19731977
19811985
19891991
1993
1993...
19951997
19992001
20032006
20082010
20120.0
10.0
20.0
30.0
40.0
50.0
60.0
70.0
80.0
40
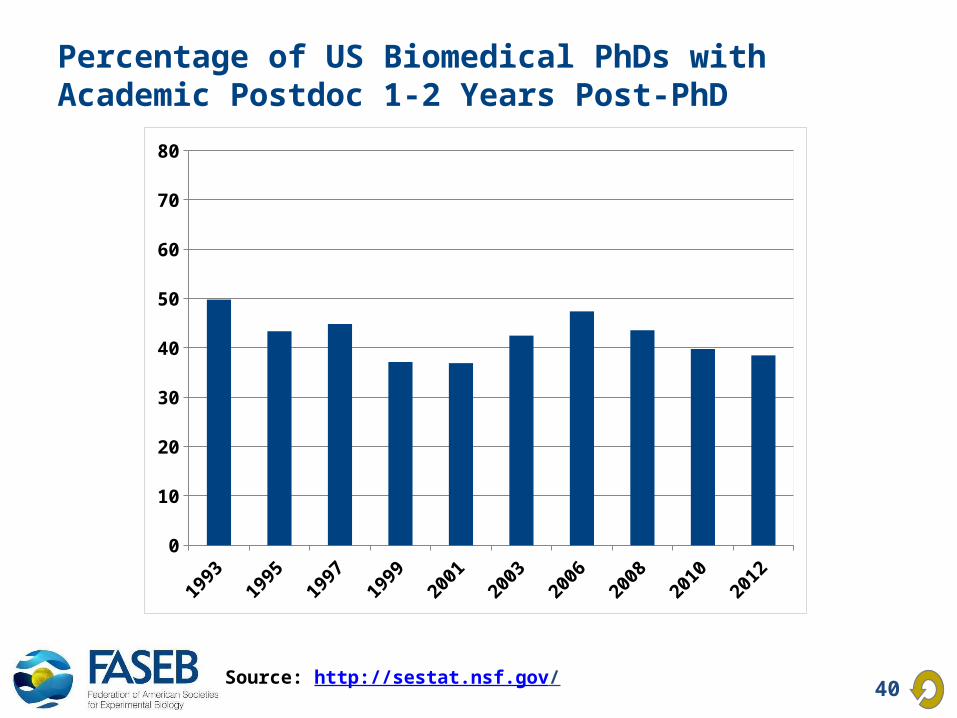
Percentage of US Biomedical PhDs with Academic Postdoc 1-2 Years Post-PhD
Source: http://sestat.nsf.gov/
19931995
19971999
20012003
20062008
20102012
0
10
20
30
40
50
60
70
80
41
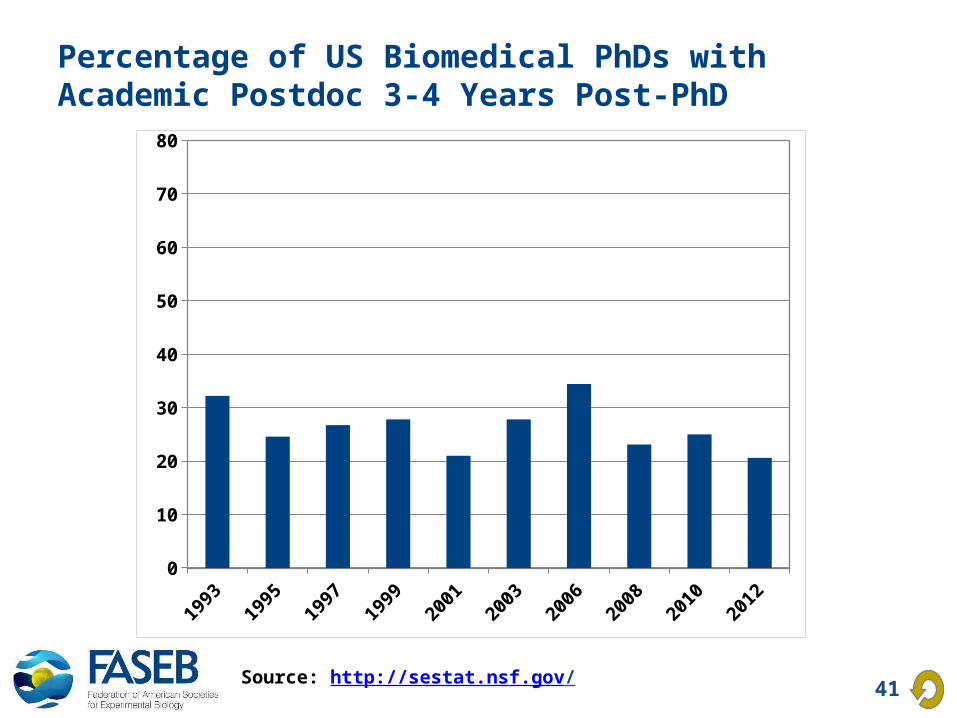
Percentage of US Biomedical PhDs with Academic Postdoc 3-4 Years Post-PhD
Source: http://sestat.nsf.gov/
19931995
19971999
20012003
20062008
20102012
0
10
20
30
40
50
60
70
80

42
Stay Rates of Foreign Doctorate Recipients from US Universities
43
19841986
19881990
19921994
19961998
20002002
20042006
0
10
20
30
40
50
60
70
80
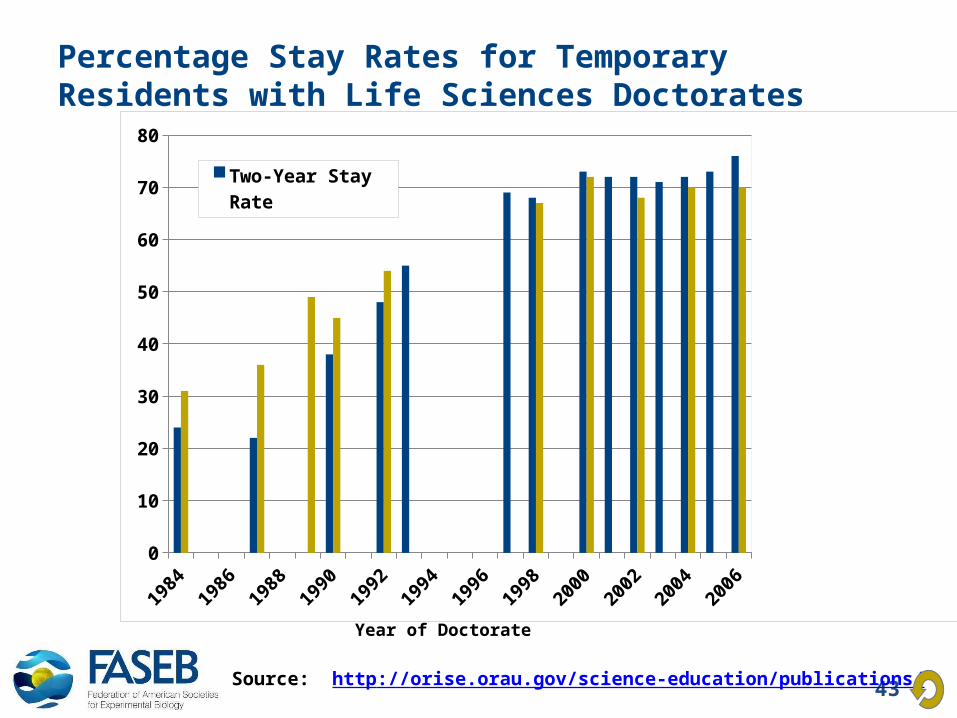
Two-Year Stay Rate
Five-Year Stay Rate
Percentage Stay Rates for Temporary Residents with Life Sciences Doctorates
Source: http://orise.orau.gov/science-education/publications/
Year of Doctorate

44
Employment Status of Individuals with PhDs from US Institutions
45
19731977
19811985
19891991
1993
1993 NEW
19951997
19992001
20032006
20082010
2012 -
20,000
40,000
60,000
80,000
100,000
120,000
140,000
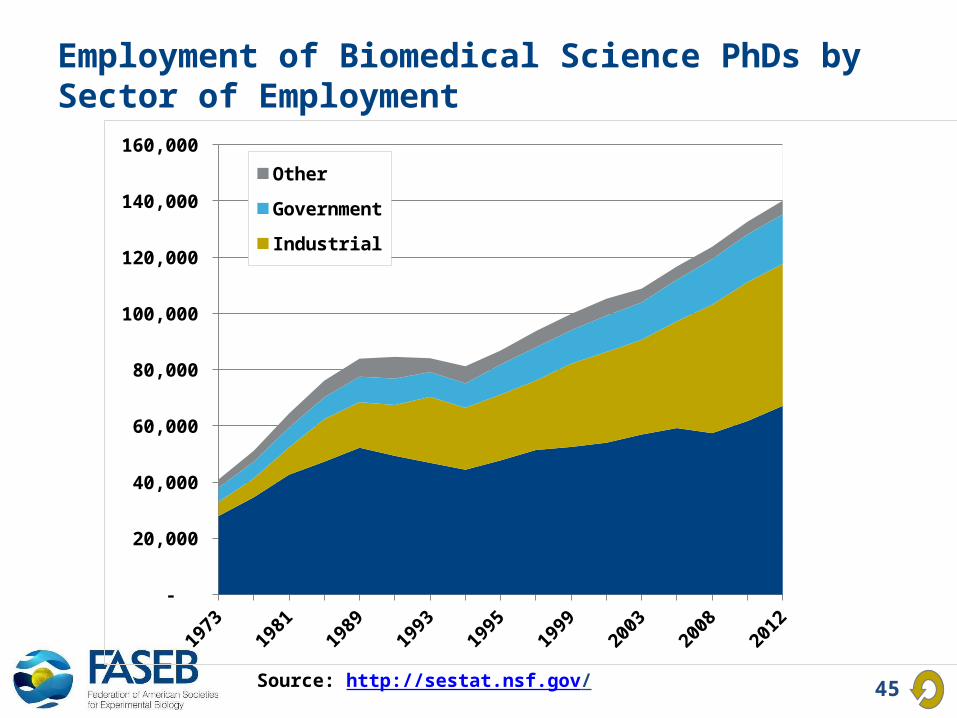
160,000 Other
Government
Industrial
All Academic
Employment of Biomedical Science PhDs bySector of Employment
Source: http://sestat.nsf.gov/

46
Distribution of Biomedical Science PhDs bySector of Employment
Source: http://sestat.nsf.gov/
19731977
19811985
19891991
1993
1993 NEW
19951997
19992001
20032006
20082010
20120%
10%
20%
30%
40%
50%
60%
70%
80%
90%
100%
Other
Government
Industrial
All Academic
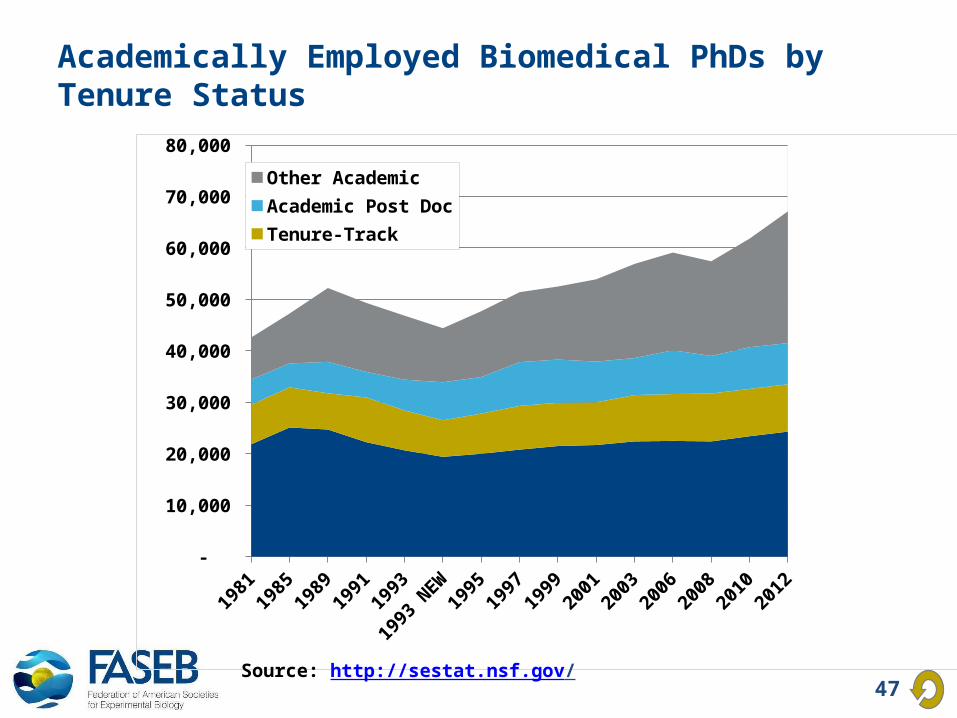
47
19811985
19891991
1993
1993 NEW
19951997
19992001
20032006
20082010
2012 -
10,000
20,000
30,000
40,000
50,000
60,000
70,000
80,000 Other AcademicAcademic Post DocTenure-TrackTenured
Academically Employed Biomedical PhDs by Tenure Status
Source: http://sestat.nsf.gov/
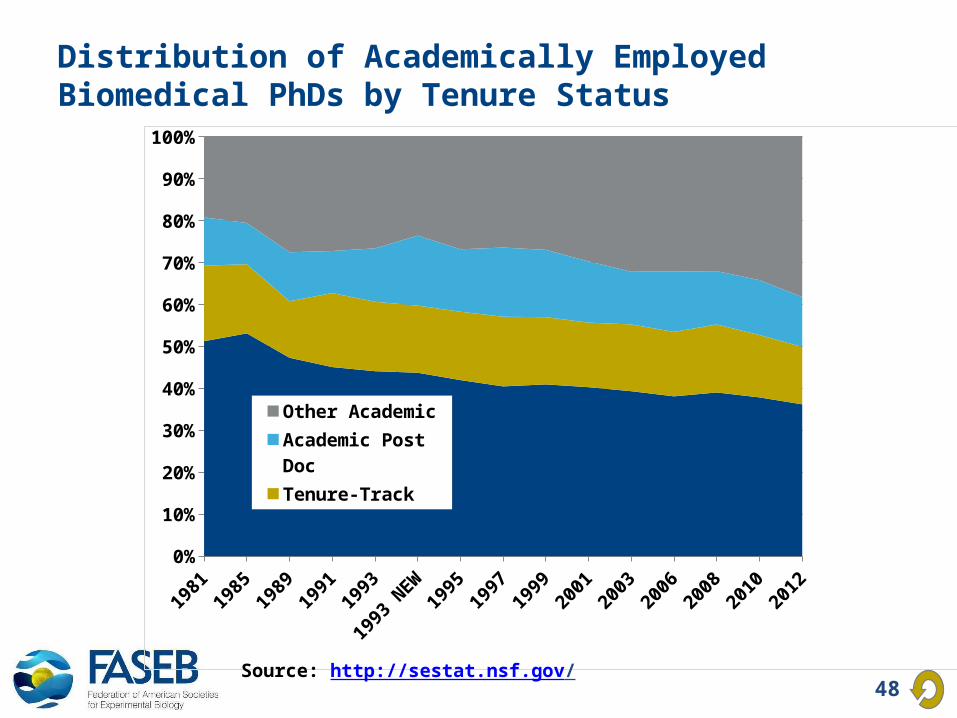
48
19811985
19891991
1993
1993 NEW
19951997
19992001
20032006
20082010
20120%
10%
20%
30%
40%
50%
60%
70%
80%
90%
100%
Other Academic
Academic Post Doc
Tenure-Track
Tenured
Distribution of Academically Employed Biomedical PhDs by Tenure Status
Source: http://sestat.nsf.gov/
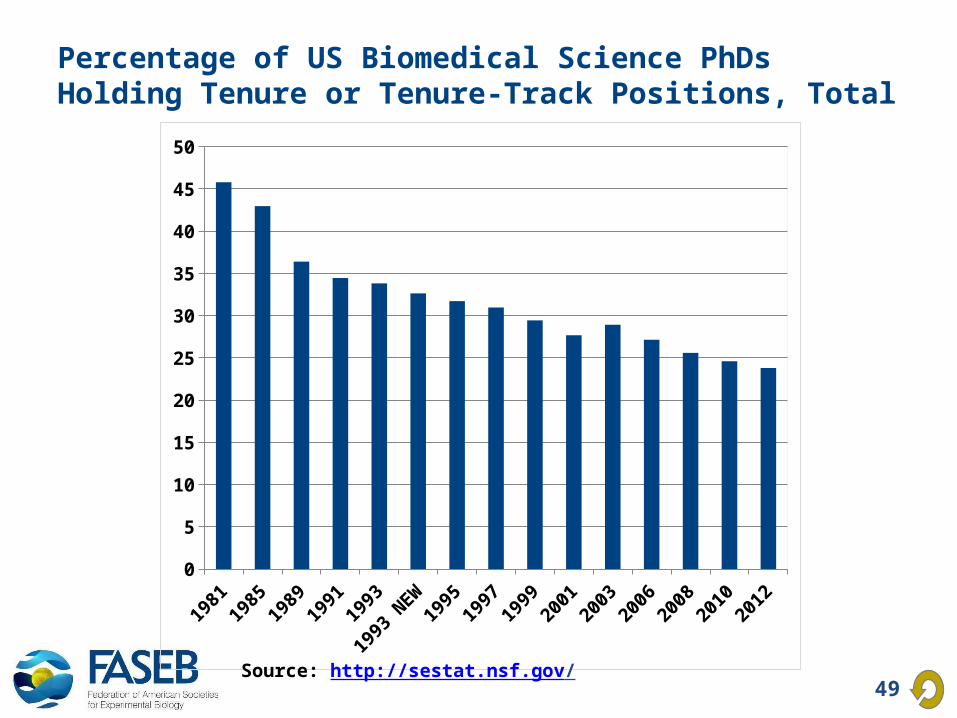
49
19811985
19891991
1993
1993 NEW
19951997
19992001
20032006
20082010
20120
5
10
15
20
25
30
35
40
45
50
Percentage of US Biomedical Science PhDs Holding Tenure or Tenure-Track Positions, Total
Source: http://sestat.nsf.gov/
50
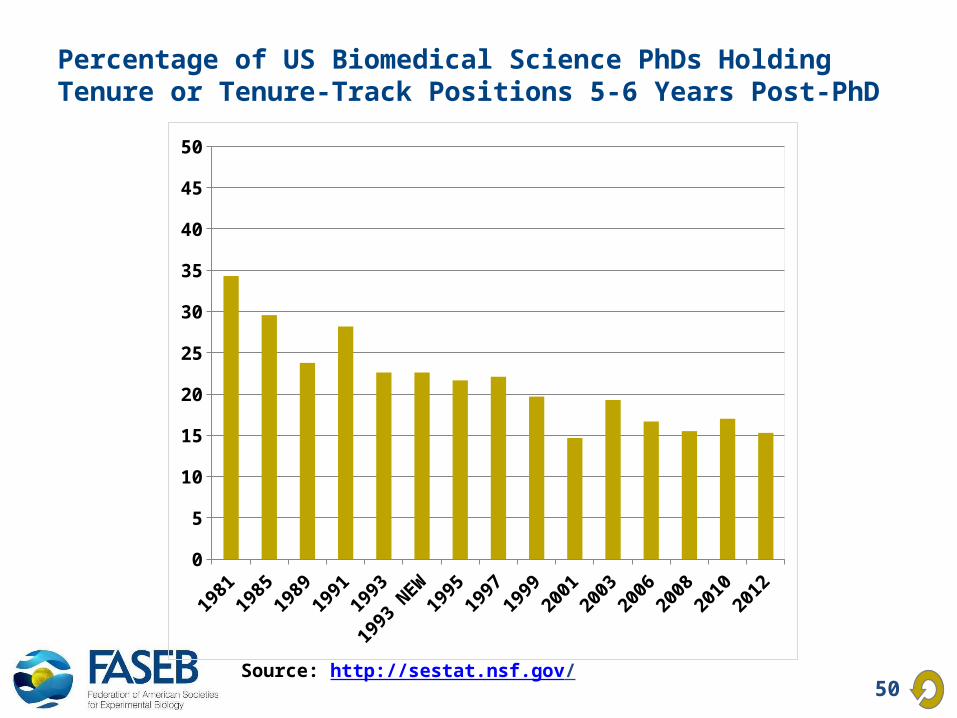
Percentage of US Biomedical Science PhDs Holding Tenure or Tenure-Track Positions 5-6 Years Post-PhD
Source: http://sestat.nsf.gov/
19811985
19891991
1993
1993 NEW
19951997
19992001
20032006
20082010
20120
5
10
15
20
25
30
35
40
45
50

51
Medical School Faculty Appointments
52
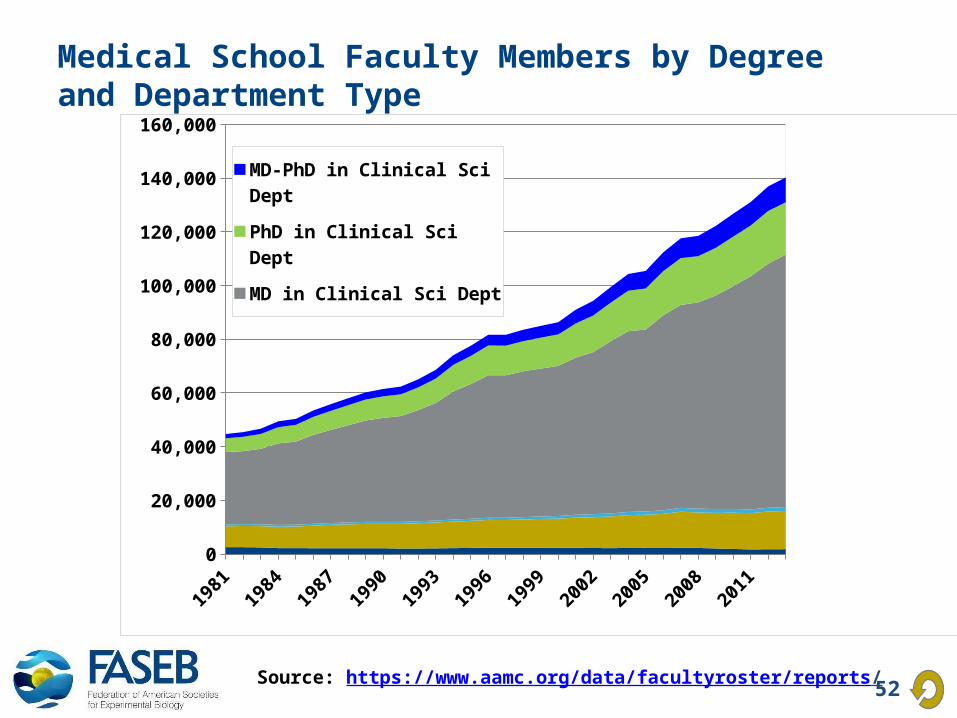
Medical School Faculty Members by Degree and Department Type
Source: https://www.aamc.org/data/facultyroster/reports/
19811983
19851987
19891991
19931995
19971999
20012003
20052007
20092011
20130
20,000
40,000
60,000
80,000
100,000
120,000
140,000
160,000
MD-PhD in Clinical Sci Dept
PhD in Clinical Sci Dept
MD in Clinical Sci Dept
MD-PhD in Basic Sci Dept
PhD in Basic Sci Dept
MD in Basic Sci Dept
53
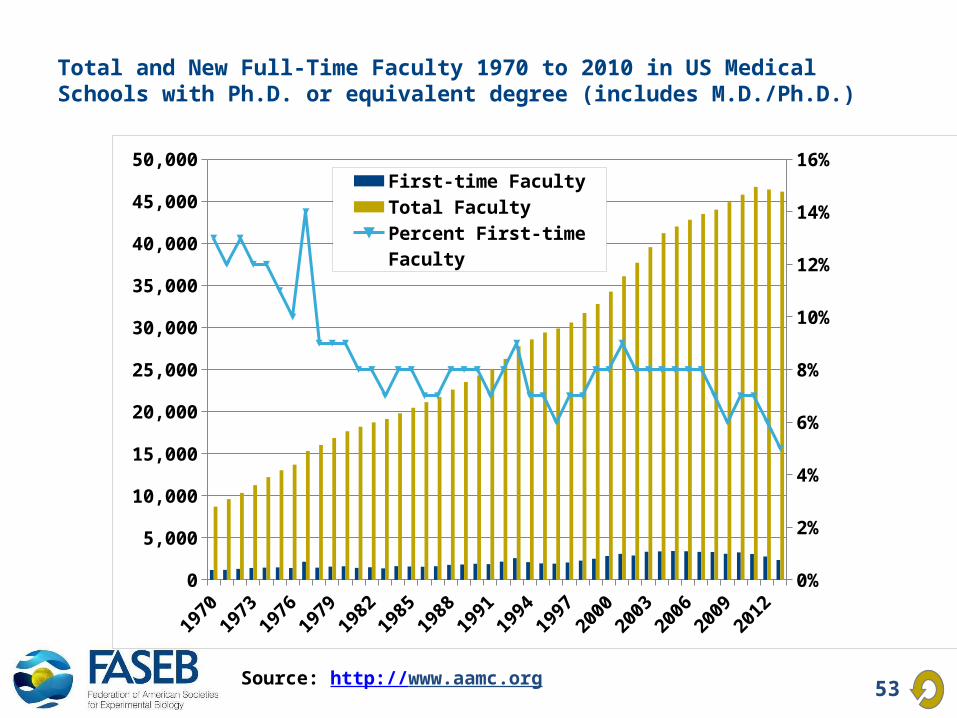
Total and New Full-Time Faculty 1970 to 2010 in US Medical Schools with Ph.D. or equivalent degree (includes M.D./Ph.D.)
Source: http://www.aamc.org
19701973
19761979
19821985
19881991
19941997
20002003
20062009
20120
5,000
10,000
15,000
20,000
25,000
30,000
35,000
40,000
45,000
50,000
0%
2%
4%
6%
8%
10%
12%
14%
16%
First-time Faculty
Total Faculty
Percent First-time Faculty

54
NIH Grant Applications and Awards
55
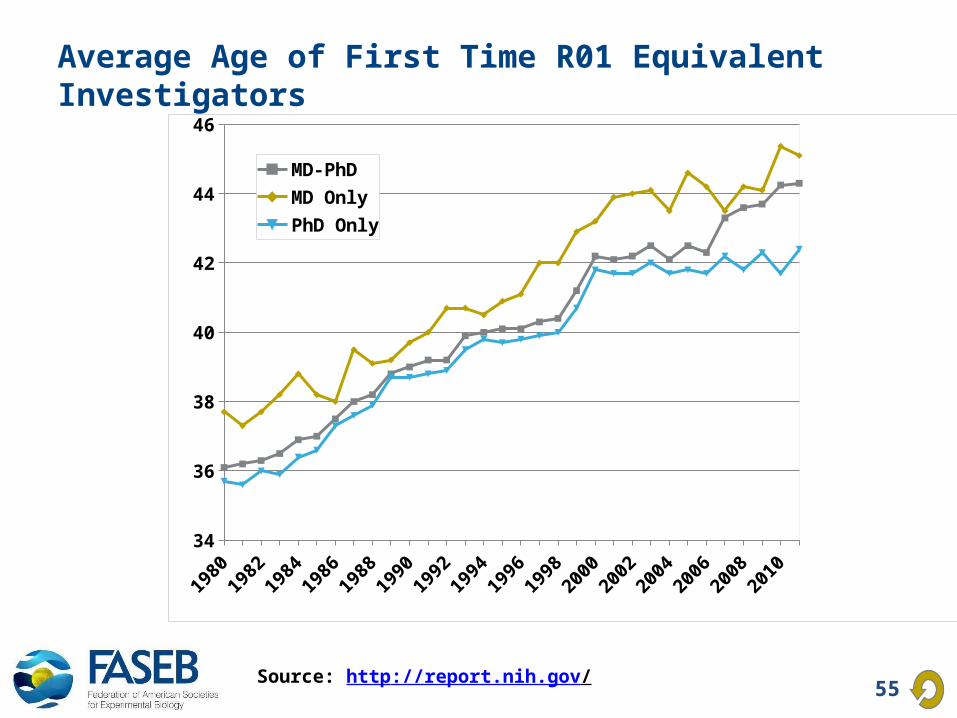
Average Age of First Time R01 Equivalent Investigators
Source: http://report.nih.gov/
19801982
19841986
19881990
19921994
19961998
20002002
20042006
20082010
34
36
38
40
42
44
46
MD-PhD
MD Only
PhD Only
56
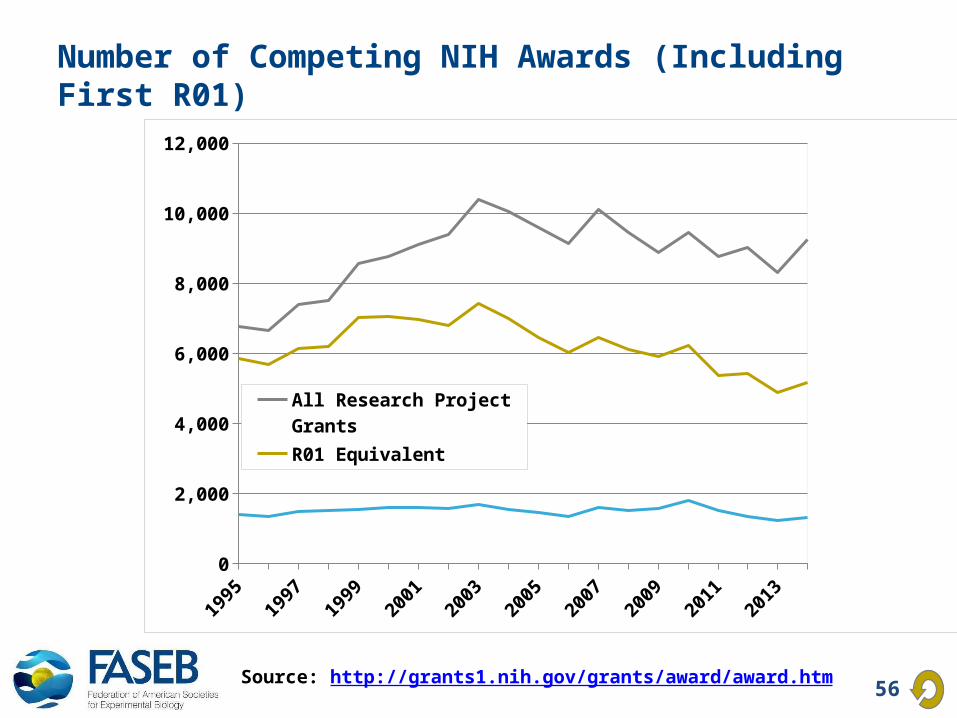
Number of Competing NIH Awards (Including First R01)
Source: http://grants1.nih.gov/grants/award/award.htm
19951997
19992001
20032005
20072009
20112013
0
2,000
4,000
6,000
8,000
10,000
12,000
All Research Project GrantsR01 EquivalentFirst-Time RO1 Equivalent

57
Employment in Industry
58
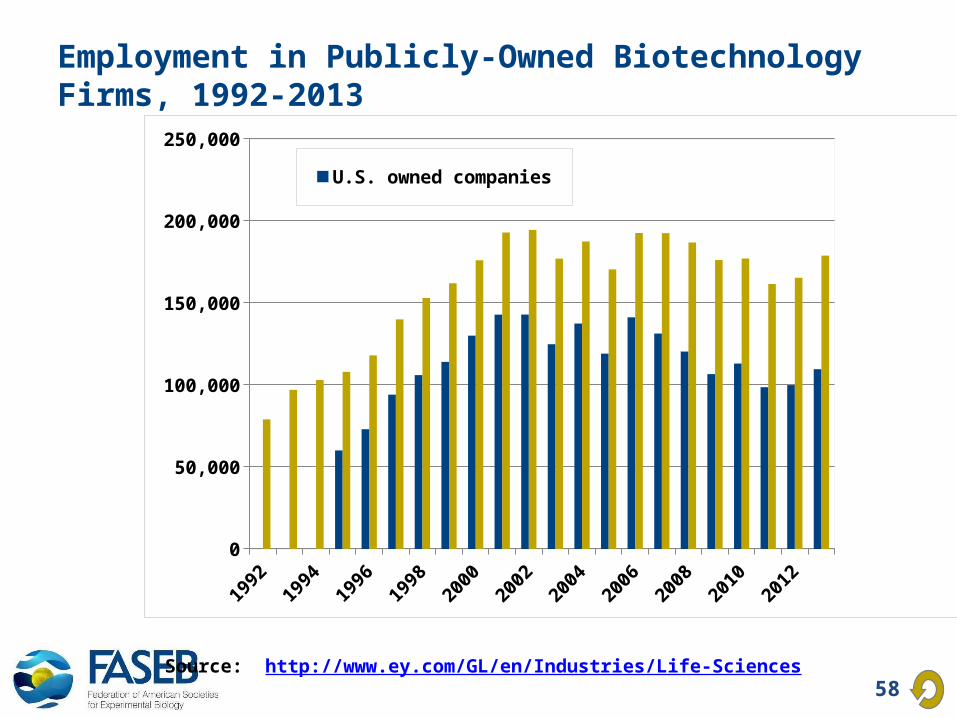
Employment in Publicly-Owned Biotechnology Firms, 1992-2013
19921994
19961998
20002002
20042006
20082010
20120
50,000
100,000
150,000
200,000
250,000
U.S. owned companies
Total, all biotech companies
Source: http://www.ey.com/GL/en/Industries/Life-Sciences
59
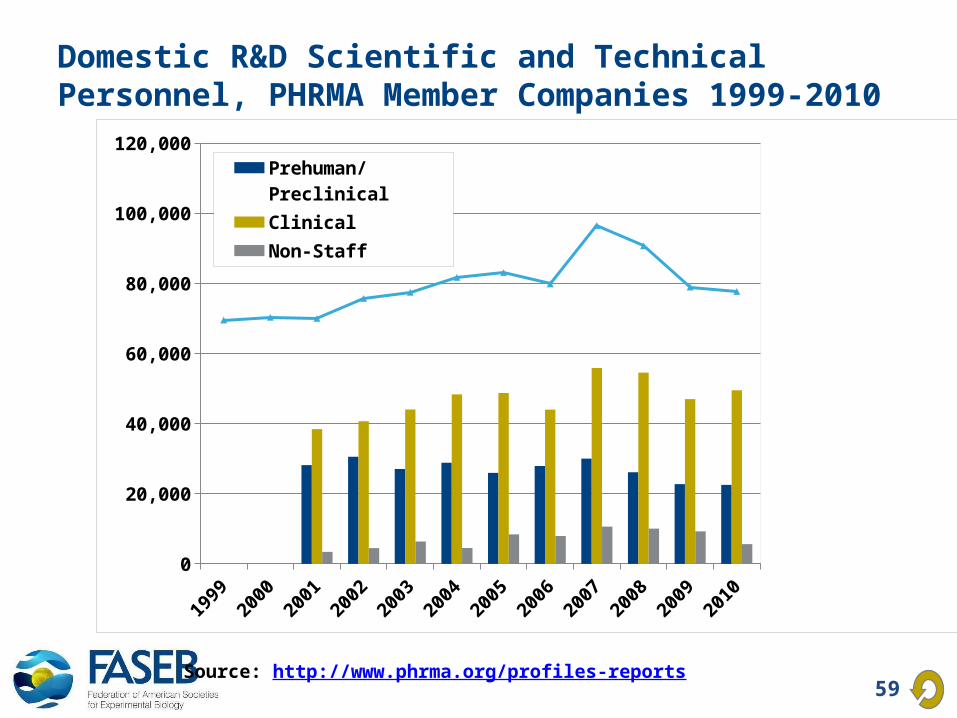
19992000
20012002
20032004
20052006
20072008
20092010
0
20,000
40,000
60,000
80,000
100,000
120,000
Prehuman/Preclinical
Clinical
Non-Staff
Total R&D Staff
Domestic R&D Scientific and Technical Personnel, PHRMA Member Companies 1999-2010
Source: http://www.phrma.org/profiles-reports

60
Contact Us
For comments or questions, please contact Howard Garrison at [email protected] or call 301-634-7650.