Embed Size (px)
Citation preview
Spring 2013 1
EDSGN100 Truss Bridge Design Final Design Report
Introduction to Engineering Design EDGSN 100; Section 001
Fantastic Four (Design Team #3)
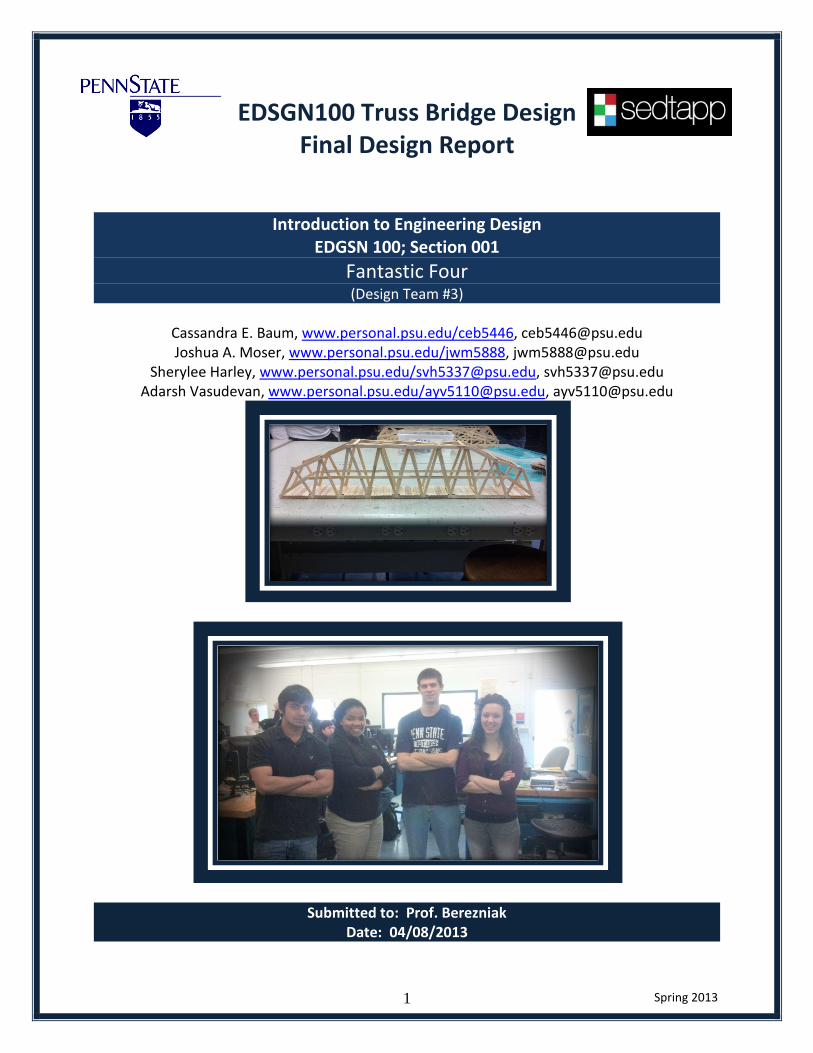
Cassandra E. Baum, www.personal.psu.edu/ceb5446, [email protected] Joshua A. Moser, www.personal.psu.edu/jwm5888, [email protected]
Sherylee Harley, www.personal.psu.edu/[email protected], [email protected] Adarsh Vasudevan, www.personal.psu.edu/[email protected], [email protected]
Submitted to: Prof. Berezniak Date: 04/08/2013
Spring 2013 2
EDSGN100 Truss Bridge Design Final Design Report
Table of Contents
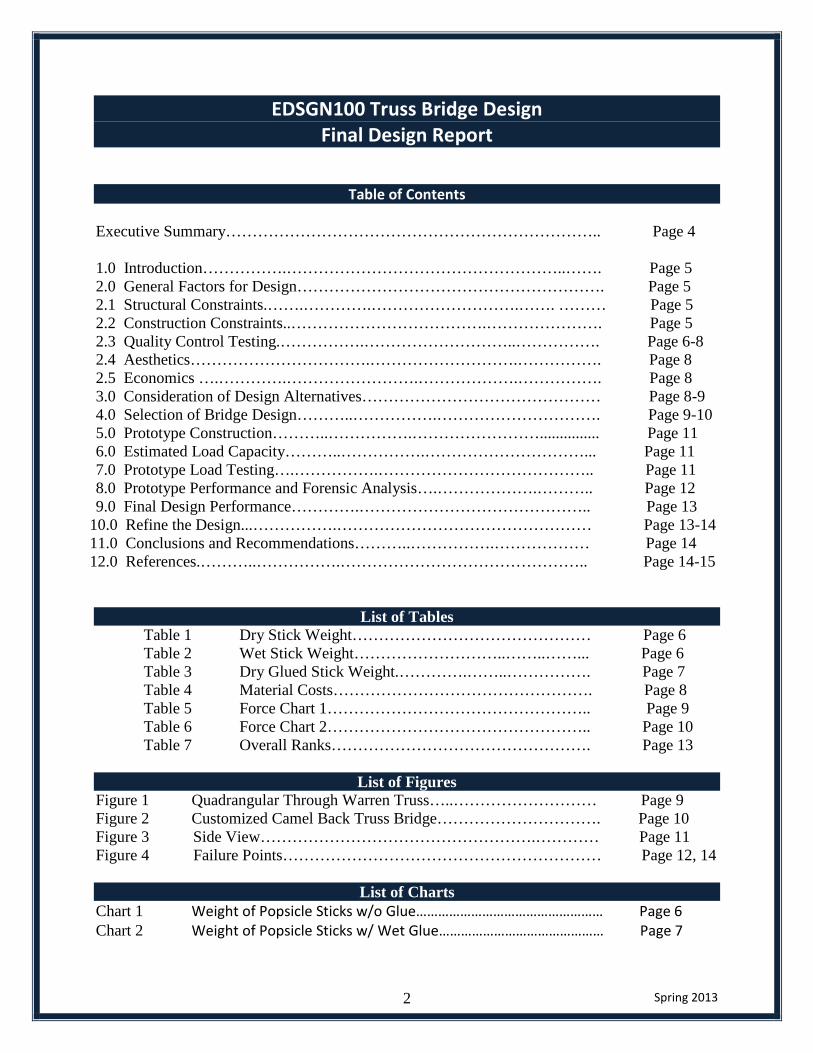
Executive Summary…………………………………………………………….. Page 4 1.0 Introduction…………….……………………………………………..……. Page 5 2.0 General Factors for Design…………………………………………………. Page 5 2.1 Structural Constraints.…….………….……………………….……. ……… Page 5 2.2 Construction Constraints..……………………………….…………………. Page 5 2.3 Quality Control Testing.…………….………………………..……………. Page 6-8 2.4 Aesthetics…………………………….……………………….……………. Page 8 2.5 Economics ….………….…………………….……………….……………. Page 8 3.0 Consideration of Design Alternatives……………………………………… Page 8-9 4.0 Selection of Bridge Design………..…………….…………………………. Page 9-10 5.0 Prototype Construction………..…………….……………………............... Page 11 6.0 Estimated Load Capacity………..…………….…………………………... Page 11 7.0 Prototype Load Testing….…………….………………………………….. Page 11 8.0 Prototype Performance and Forensic Analysis….……………….……….. Page 12 9.0 Final Design Performance………….…………………………………….. Page 13
10.0 Refine the Design...…………….………………………………………… Page 13-14 11.0 Conclusions and Recommendations………..…………….……………… Page 14 12.0 References.………..…………….……………………………………….. Page 14-15
List of Tables Table 1 Dry Stick Weight……………………………………… Page 6 Table 2 Wet Stick Weight………………………..……..……... Page 6 Table 3 Dry Glued Stick Weight.………….……..……………. Page 7 Table 4 Material Costs…………………………………………. Page 8 Table 5 Force Chart 1………………………………………….. Page 9 Table 6 Force Chart 2………………………………………….. Page 10 Table 7 Overall Ranks…………………………………………. Page 13
List of Figures
Figure 1 Quadrangular Through Warren Truss…..……………………… Page 9 Figure 2 Customized Camel Back Truss Bridge…………………………. Page 10 Figure 3 Side View…………………………………………….………… Page 11 Figure 4 Failure Points…………………………………………………… Page 12, 14
List of Charts Chart 1 Weight of Popsicle Sticks w/o Glue…………………………………………… Page 6 Chart 2 Weight of Popsicle Sticks w/ Wet Glue……………………………………… Page 7
Spring 2013 3
Chart 3 Weight of Popsicle Sticks w/ Dry Glue……………………………………… Page 8
Spring 2013 4
EDSGN100 Truss Bridge Design Final Design Report
Executive Summary
We were approached by a company to design a bridge that was strong, aesthetically pleasing,
and economically efficient. We were to come up with a prototype using wood craft sticks and
white Elmer’s glue. We were given specific specifications that we needed to follow, or else or
company would not be pleased with our efforts and we would not get paid with a good grade.
Through some analysis, we tested to see how many craft sticks we could use without going over
the maximum weight. We then made our bids based off of this estimate. We bought a lot of
materials for a simple bridge design. Our design was simple because we were trying to make it a
realistic task where we would not be given all the material and money that we wanted. For our
purchasing of materials, we went with the better safe than sorry approach; however we did not
use a lot of our materials. We came up with a customized Camel Back Truss Bridge design, to
make it a very realistic type of bridge that could be used. Once we constructed our bridge, we
tested it by adding weight to a bucket that was suspended from the deck of our bridge, ten inches
from the one side. The quality of which we built our prototype was great. We definitely took our
time to make sure that we put everything together in the correct way. Our bridge performed in an
average matter, where we held 47.6 pounds, which was good for the amount of material we used.
Our bridge failed on the deck as well as our one end post. Our bridge could have been improved
through the use of more lateral bracing and struts towards the ends of our bridge. We also
decided that the next time we would improve our design by adding structural support underneath
the deck, because we had no support there. Overall our bridge did extremely well with our
rankings in the class. We were tied for second best overall bridge design, and we feel that we
could make this ranking even better through the implementation of everything that we have
Spring 2013 5
learned in this engineering design process. We are now more prepared and ready for the next
task than when we were before we started this project.
1.0. Introduction. Design project 1 was to build a truss bridge using popsicle sticks and Elmer’s glue. While building the bridge we were to make the strongest prototype we could, but also minimize cost and weight and also make it aesthetically pleasing. Upon building the bridge we were given certain constraints including weight and dimensions. Before beginning construction we did testing to see how much glue was required to glue two popsicle sticks together with the most strength. Also in our concept design we had to consider the ease of construction, aesthetics, strength, and weight. After construction we will load test it to failure then analyze why it failed.
2.0 General Factors for Design.
2.1 Structural Constraints.
Our bridge was to be 30-34 inches in length, while not exceeding 400g. It could not be taller than 10 inches and below the deck could not exceed 3 inches. The width had to be no more than 5 inches. Overall the bridge would have to accommodate a 4 by 4 inch vehicle. There are no I-beams or box-beams allowed. Popsicle sticks are not allowed to overlap over 50% of another stick. Our prototype was a customized Camelback Truss Bridge because we felt the simple design would work best as a realistic situation and our customized touch would increase the aesthetics a little.
2.2 Construction Constraints.
We were limited to only 2 types of materials, including wood craft sticks and white Elmer’s glue. Connections of the sticks could only contain 6 sticks maximum. There must be at least a 1-inch clear gap between any two stacks. The deck of the bridge had to be completely continuous along its width and length, while containing a gap at 10 inches from one end to allow the load to be attached during the testing process. For load testing, the bridge will set on supports that will be provided by the Instructor. No special supports may be used. The end supports will have the dimensions of: 3/4-inches wide x 3/4-inches high x 5-inches long. The end supports will be placed 29-inches apart (center-to-center).
Spring 2013 6
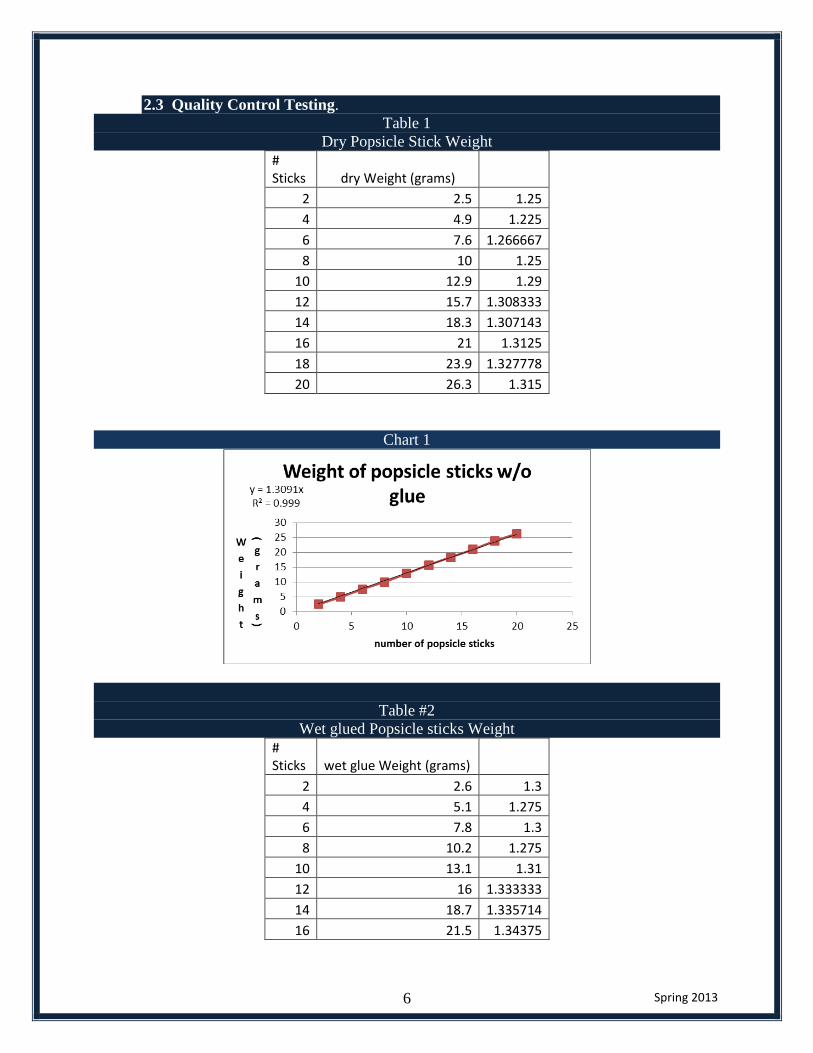
2.3 Quality Control Testing. Table 1
Dry Popsicle Stick Weight # Sticks dry Weight (grams)
2 2.5 1.25 4 4.9 1.225 6 7.6 1.266667 8 10 1.25
10 12.9 1.29 12 15.7 1.308333 14 18.3 1.307143 16 21 1.3125 18 23.9 1.327778 20 26.3 1.315
Chart 1
Table #2
Wet glued Popsicle sticks Weight # Sticks wet glue Weight (grams)
2 2.6 1.3 4 5.1 1.275 6 7.8 1.3 8 10.2 1.275
10 13.1 1.31 12 16 1.333333 14 18.7 1.335714 16 21.5 1.34375
Spring 2013 7
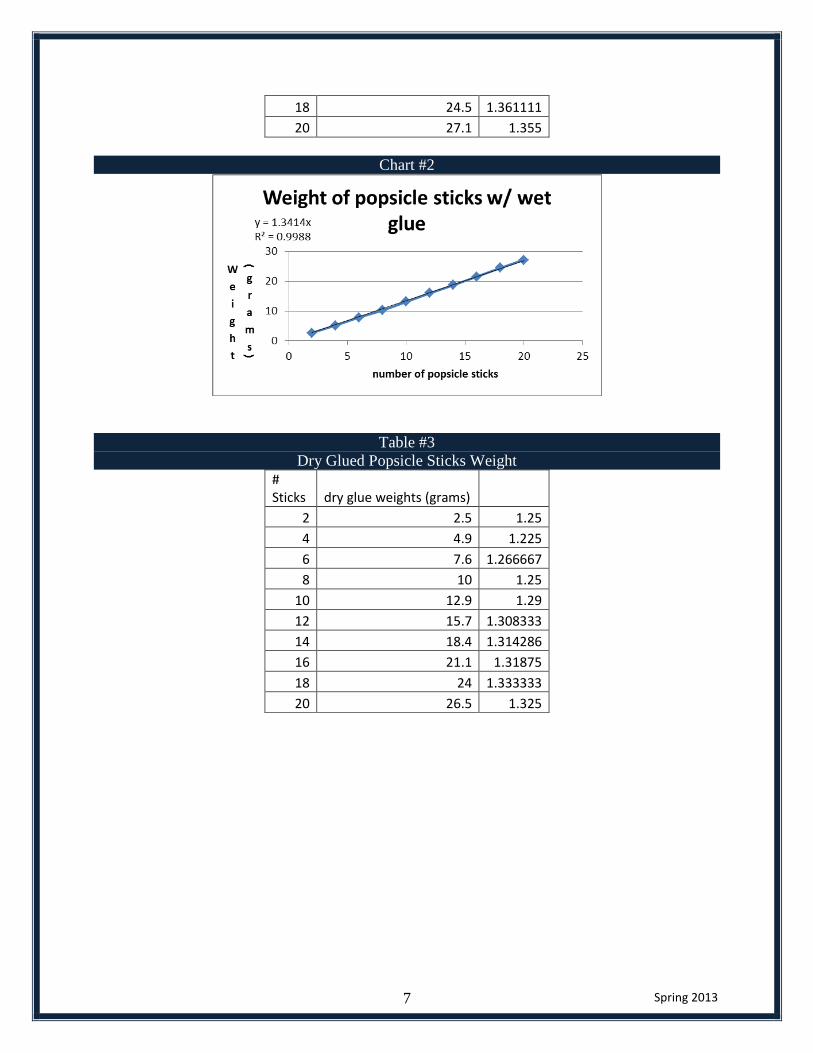
18 24.5 1.361111 20 27.1 1.355
Chart #2
Table #3 Dry Glued Popsicle Sticks Weight
# Sticks dry glue weights (grams)
2 2.5 1.25 4 4.9 1.225 6 7.6 1.266667 8 10 1.25
10 12.9 1.29 12 15.7 1.308333 14 18.4 1.314286 16 21.1 1.31875 18 24 1.333333 20 26.5 1.325

Spring 2013 8
Chart #3
As seen by our graphs and tables, we used data collected, essentially, by the entire class to construct equations to see how much of each type of material we could use, while still staying under the 400g limit. We weighed the sticks in groups of twos to make a rough graph of how the sticks, wet sticks, and dry stick’s weights increased with more sticks.
2.4 Aesthetics.
Our bridge design is a hybrid of a Camelback and K-Truss design, we thought that the curvature gave the design a better appeal to people and overall created a more aesthetic bridge. With a very basic and common bridge appearance, we felt the aesthetics would be familiar to a common person.
2.5 Economics.
We had to pay for the wood craft sticks individually and the glue per gram. In the first round of buying, the sticks cost $1000 and the glue cost $5000 per gram. As seen in the table, we bought 315 sticks and 50 grams of glue. We definitely spent too much during this time because we did not use all of our materials. I guess it’s better safe than sorry though. We bought extras to account for the possibility of getting a number of faulty sticks. We did not need to buy extra materials.
Table 4
3.0 Consideration of Design Alternatives. We considered this simple quadrangular bridge design because we felt it was one of the most basic types of bridges out there. People often overlook the simple things in life. But if it is simple and very common, scientists and engineers must be a reason for it. This is why we considered it.
Spring 2013 9
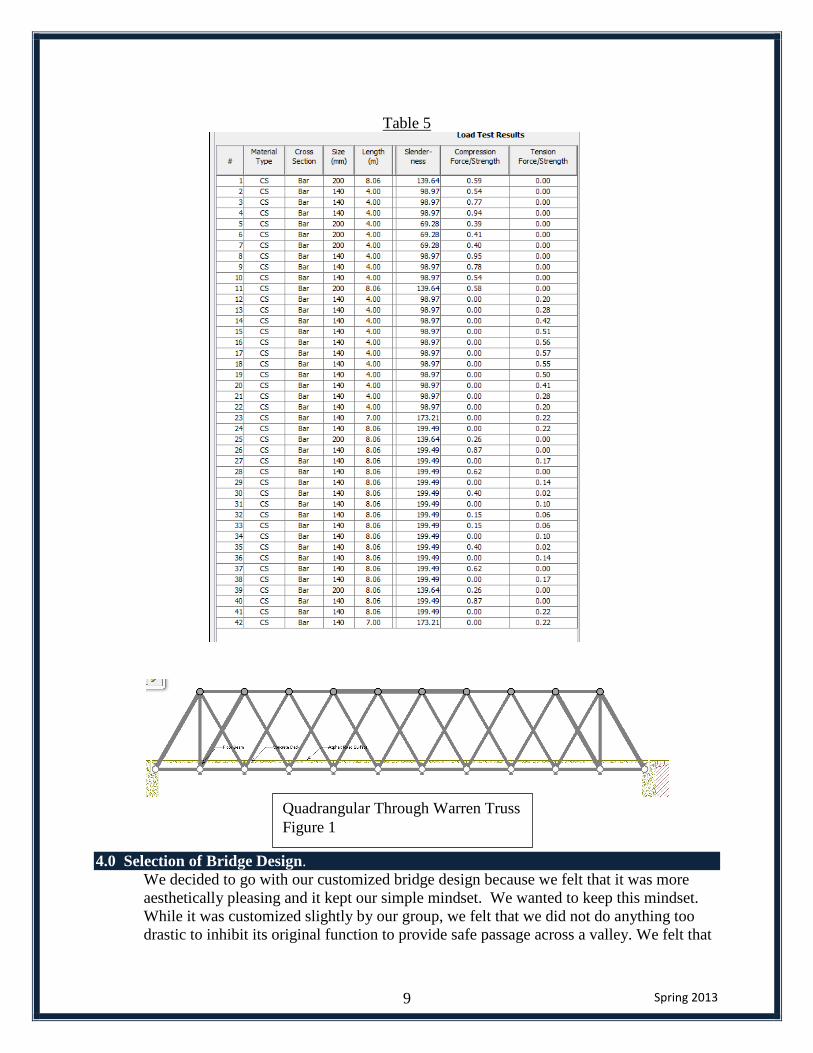
Table 5
4.0 Selection of Bridge Design. We decided to go with our customized bridge design because we felt that it was more aesthetically pleasing and it kept our simple mindset. We wanted to keep this mindset. While it was customized slightly by our group, we felt that we did not do anything too drastic to inhibit its original function to provide safe passage across a valley. We felt that
Quadrangular Through Warren Truss Figure 1

Spring 2013 10
the weight, strength, and cost would be very similar for both bridges. Ease of construction and aesthetics were why we picked this bridge type.
Table 6
Customized Camel Back Truss Bridge Figure 2
Spring 2013 11
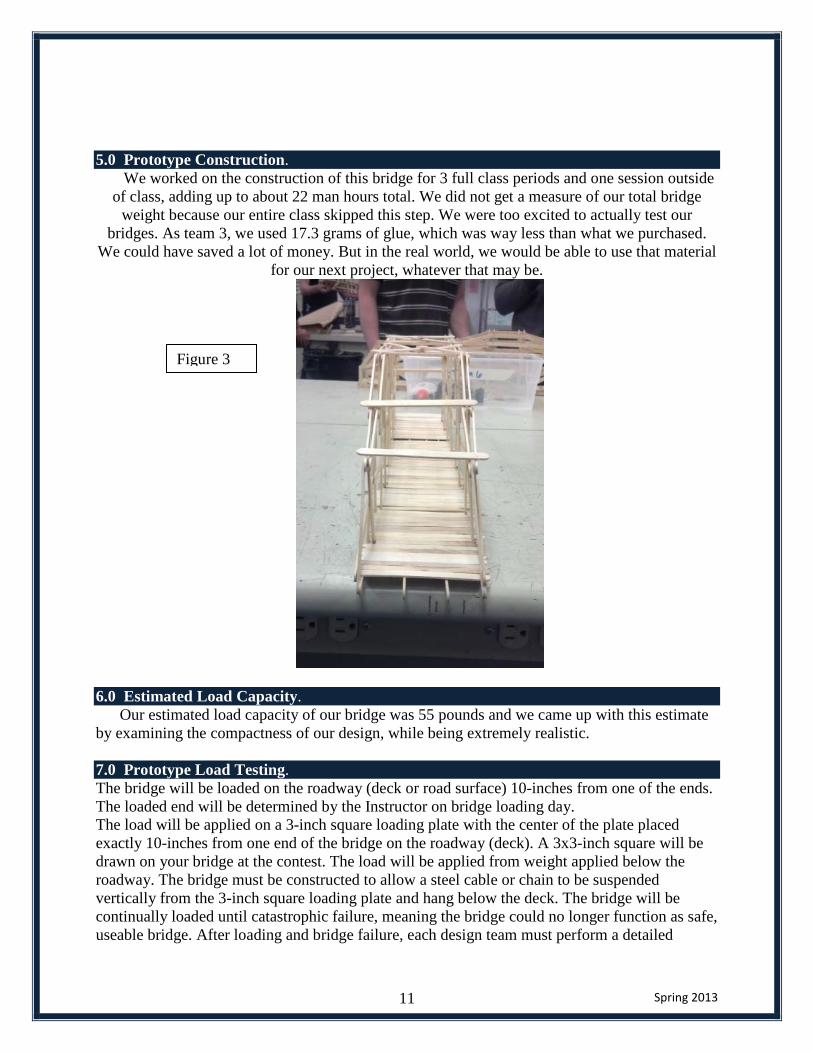
5.0 Prototype Construction.
We worked on the construction of this bridge for 3 full class periods and one session outside of class, adding up to about 22 man hours total. We did not get a measure of our total bridge
weight because our entire class skipped this step. We were too excited to actually test our bridges. As team 3, we used 17.3 grams of glue, which was way less than what we purchased.
We could have saved a lot of money. But in the real world, we would be able to use that material for our next project, whatever that may be.
6.0 Estimated Load Capacity.
Our estimated load capacity of our bridge was 55 pounds and we came up with this estimate by examining the compactness of our design, while being extremely realistic.
7.0 Prototype Load Testing. The bridge will be loaded on the roadway (deck or road surface) 10-inches from one of the ends. The loaded end will be determined by the Instructor on bridge loading day. The load will be applied on a 3-inch square loading plate with the center of the plate placed exactly 10-inches from one end of the bridge on the roadway (deck). A 3x3-inch square will be drawn on your bridge at the contest. The load will be applied from weight applied below the roadway. The bridge must be constructed to allow a steel cable or chain to be suspended vertically from the 3-inch square loading plate and hang below the deck. The bridge will be continually loaded until catastrophic failure, meaning the bridge could no longer function as safe, useable bridge. After loading and bridge failure, each design team must perform a detailed
Figure 3
Spring 2013 12
orensic engineering investigation to determine the cause of bridge failure. The investigation shall be documented with notes, sketches, drawings, and photographs. 8.0 Prototype Performance and Forensic Analysis.
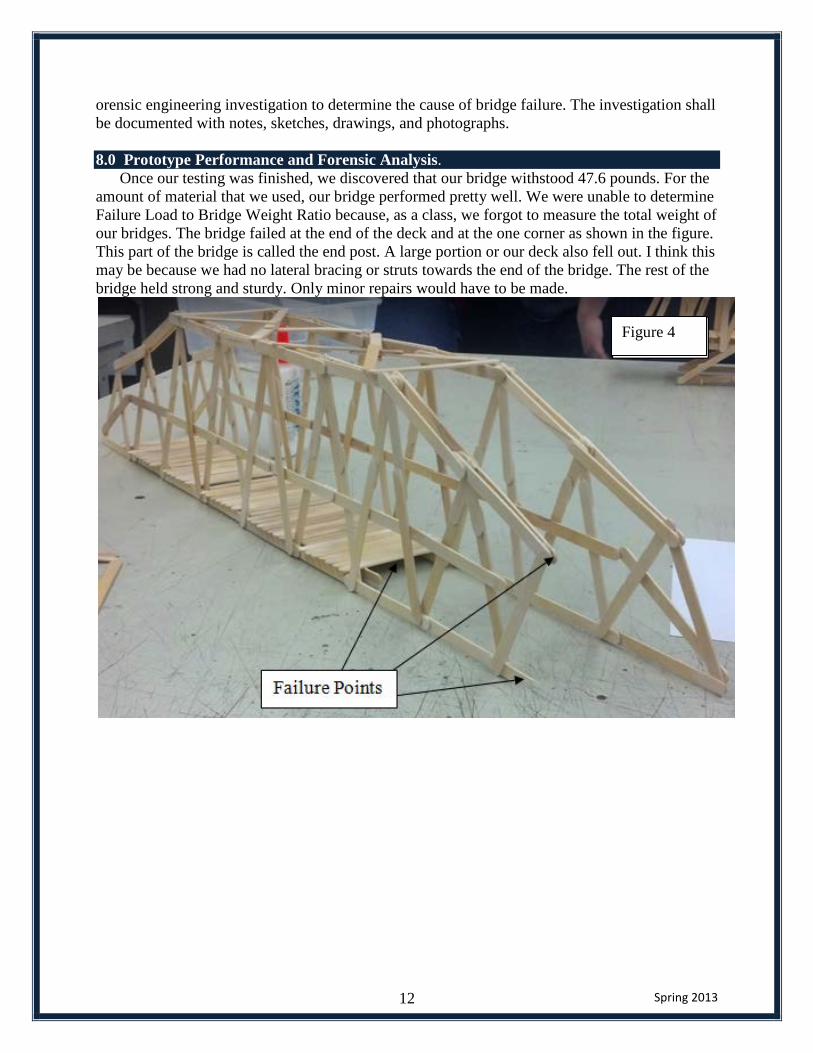
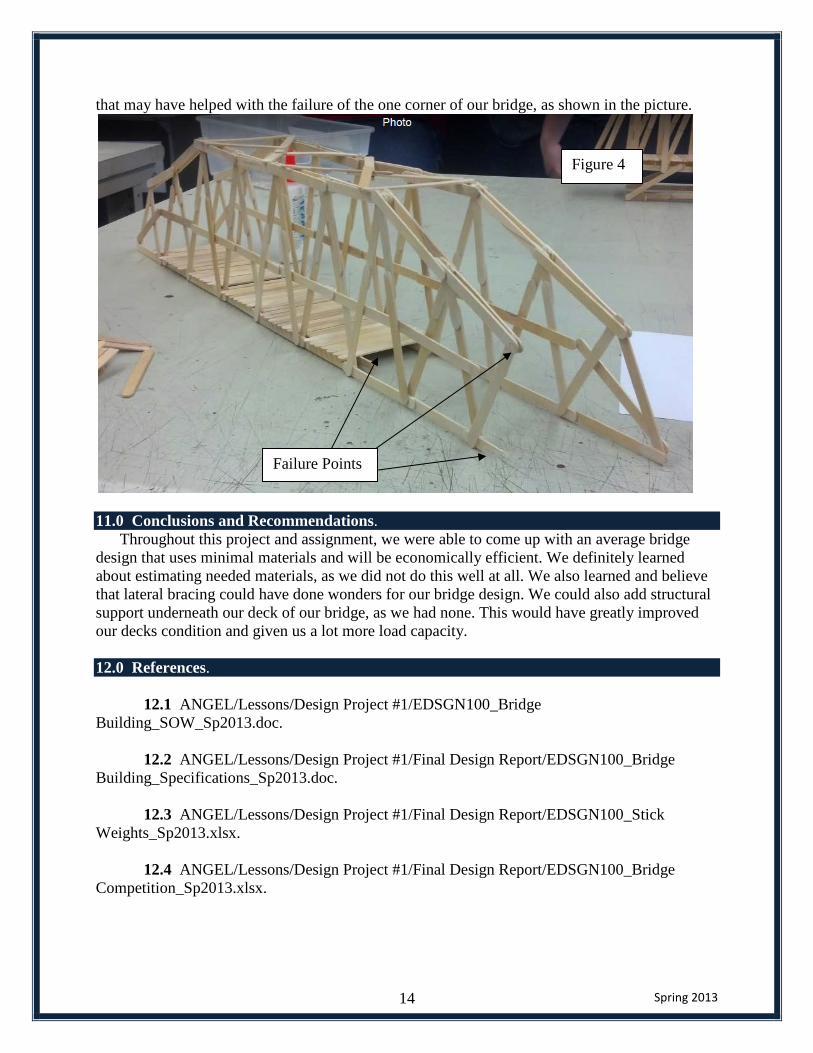
Once our testing was finished, we discovered that our bridge withstood 47.6 pounds. For the amount of material that we used, our bridge performed pretty well. We were unable to determine Failure Load to Bridge Weight Ratio because, as a class, we forgot to measure the total weight of our bridges. The bridge failed at the end of the deck and at the one corner as shown in the figure. This part of the bridge is called the end post. A large portion or our deck also fell out. I think this may be because we had no lateral bracing or struts towards the end of the bridge. The rest of the bridge held strong and sturdy. Only minor repairs would have to be made.
Figure 4
Spring 2013 13
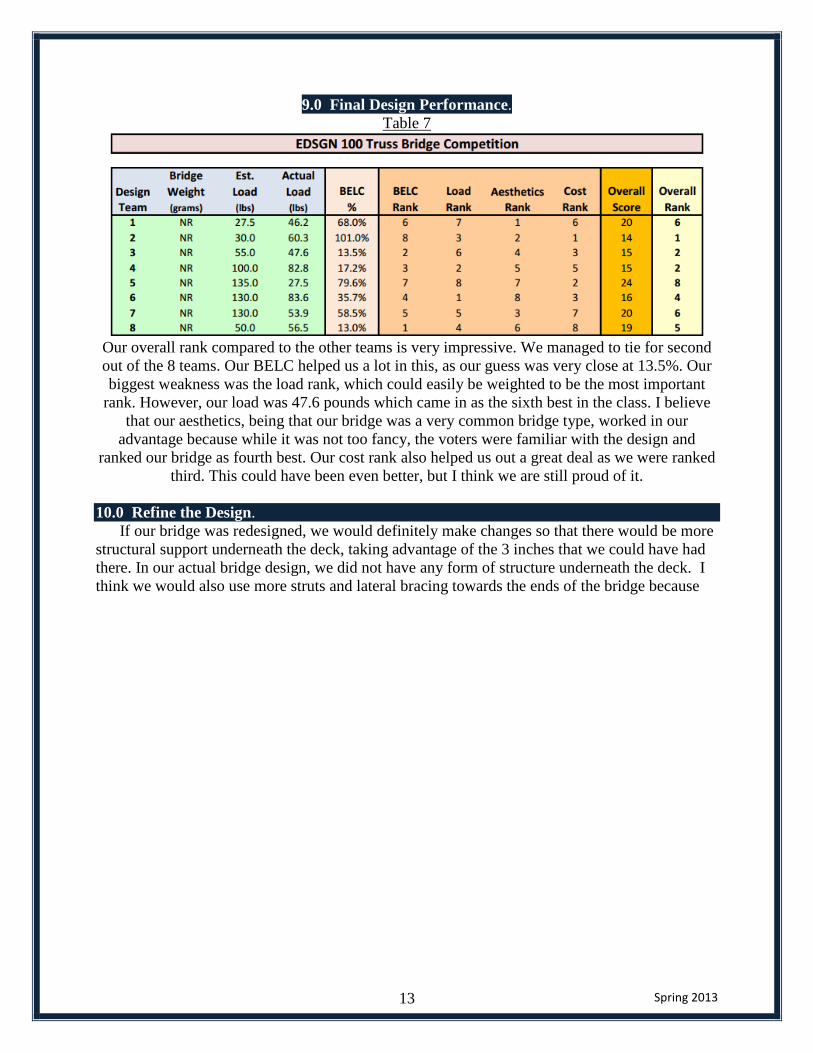
9.0 Final Design Performance. Table 7
Our overall rank compared to the other teams is very impressive. We managed to tie for second out of the 8 teams. Our BELC helped us a lot in this, as our guess was very close at 13.5%. Our biggest weakness was the load rank, which could easily be weighted to be the most important
rank. However, our load was 47.6 pounds which came in as the sixth best in the class. I believe that our aesthetics, being that our bridge was a very common bridge type, worked in our
advantage because while it was not too fancy, the voters were familiar with the design and ranked our bridge as fourth best. Our cost rank also helped us out a great deal as we were ranked
third. This could have been even better, but I think we are still proud of it. 10.0 Refine the Design.
If our bridge was redesigned, we would definitely make changes so that there would be more structural support underneath the deck, taking advantage of the 3 inches that we could have had there. In our actual bridge design, we did not have any form of structure underneath the deck. I think we would also use more struts and lateral bracing towards the ends of the bridge because
Spring 2013 14
that may have helped with the failure of the one corner of our bridge, as shown in the picture.
11.0 Conclusions and Recommendations.
Throughout this project and assignment, we were able to come up with an average bridge design that uses minimal materials and will be economically efficient. We definitely learned about estimating needed materials, as we did not do this well at all. We also learned and believe that lateral bracing could have done wonders for our bridge design. We could also add structural support underneath our deck of our bridge, as we had none. This would have greatly improved our decks condition and given us a lot more load capacity.
12.0 References.
12.1 ANGEL/Lessons/Design Project #1/EDSGN100_Bridge Building_SOW_Sp2013.doc.
12.2 ANGEL/Lessons/Design Project #1/Final Design Report/EDSGN100_Bridge
Building_Specifications_Sp2013.doc. 12.3 ANGEL/Lessons/Design Project #1/Final Design Report/EDSGN100_Stick
Weights_Sp2013.xlsx. 12.4 ANGEL/Lessons/Design Project #1/Final Design Report/EDSGN100_Bridge
Competition_Sp2013.xlsx.
Failure Points
Figure 4
Spring 2013 15
12.5 West Point Bridge Designer (2011). Developed by Colonel Stephen Ressler, Department of Civil and Mechanical Engineering, U.S. Military Academy, West Point, NY <http://bridgecontest.usma.edu/download2011.htm>.
12.6 Virtual Laboratory: Bridge Designer. Johns Hopkins University, Baltimore, MD
<http://www.jhu.edu/virtlab/bridge/bridge.htm>.
http://teachers.sduhsd.net/delliott/Files-POE/WP%20FF%20Bridges/common%20truss%20bridges.gif