Embed Size (px)
Citation preview
Connectivity Broadband market developments in the EU
Digital Economy and Society Index Report 2018 Connectivity
DESI Report 2018 – Connectivity
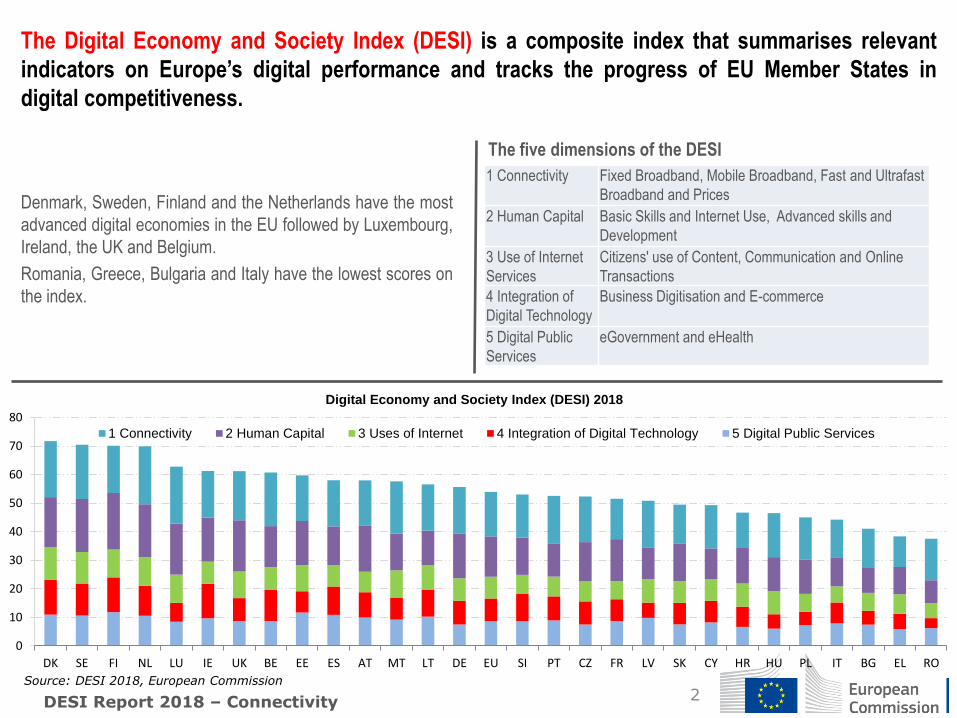
Denmark, Sweden, Finland and the Netherlands have the most
advanced digital economies in the EU followed by Luxembourg,
Ireland, the UK and Belgium.
Romania, Greece, Bulgaria and Italy have the lowest scores on
the index.
2
The Digital Economy and Society Index (DESI) is a composite index that summarises relevant
indicators on Europe’s digital performance and tracks the progress of EU Member States in
digital competitiveness.
1 Connectivity Fixed Broadband, Mobile Broadband, Fast and Ultrafast
Broadband and Prices
2 Human Capital Basic Skills and Internet Use, Advanced skills and
Development
3 Use of Internet
Services
Citizens' use of Content, Communication and Online
Transactions
4 Integration of
Digital Technology
Business Digitisation and E-commerce
5 Digital Public
Services
eGovernment and eHealth
The five dimensions of the DESI
0
10
20
30
40
50
60
70
80
DK SE FI NL LU IE UK BE EE ES AT MT LT DE EU SI PT CZ FR LV SK CY HR HU PL IT BG EL RO
Digital Economy and Society Index (DESI) 2018
1 Connectivity 2 Human Capital 3 Uses of Internet 4 Integration of Digital Technology 5 Digital Public Services
Source: DESI 2018, European Commission
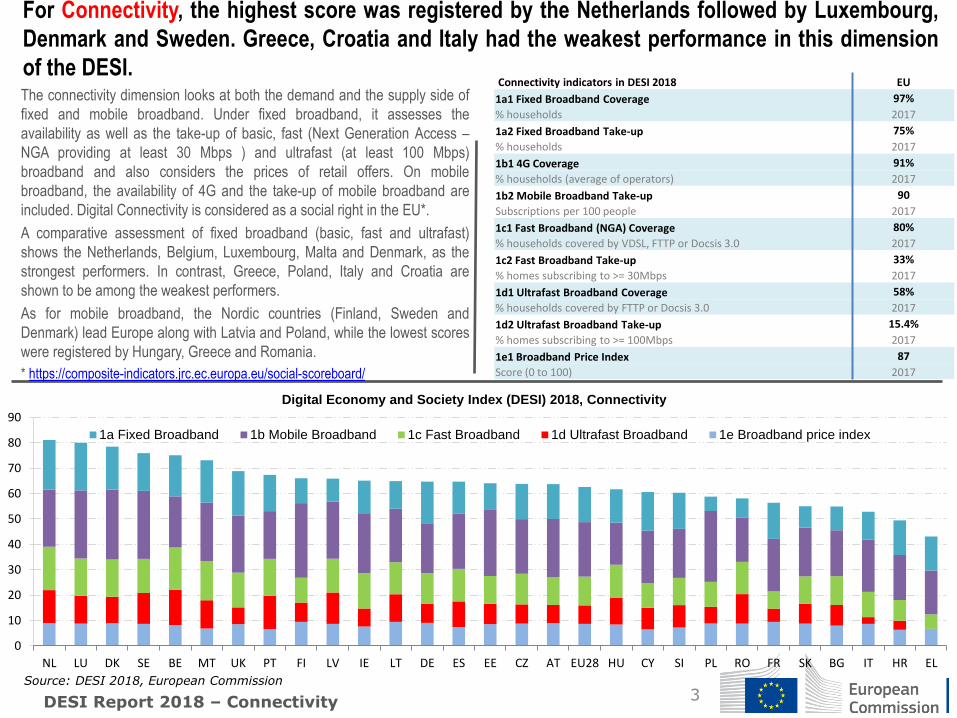
The connectivity dimension looks at both the demand and the supply side of
fixed and mobile broadband. Under fixed broadband, it assesses the
availability as well as the take-up of basic, fast (Next Generation Access –
NGA providing at least 30 Mbps ) and ultrafast (at least 100 Mbps)
broadband and also considers the prices of retail offers. On mobile
broadband, the availability of 4G and the take-up of mobile broadband are
included. Digital Connectivity is considered as a social right in the EU*.
A comparative assessment of fixed broadband (basic, fast and ultrafast)
shows the Netherlands, Belgium, Luxembourg, Malta and Denmark, as the
strongest performers. In contrast, Greece, Poland, Italy and Croatia are
shown to be among the weakest performers.
As for mobile broadband, the Nordic countries (Finland, Sweden and
Denmark) lead Europe along with Latvia and Poland, while the lowest scores
were registered by Hungary, Greece and Romania.
* https://composite-indicators.jrc.ec.europa.eu/social-scoreboard/
3
For Connectivity, the highest score was registered by the Netherlands followed by Luxembourg,
Denmark and Sweden. Greece, Croatia and Italy had the weakest performance in this dimension
of the DESI.
DESI Report 2018 – Connectivity
Connectivity indicators in DESI 2018 EU
1a1 Fixed Broadband Coverage 97%
% households 2017
1a2 Fixed Broadband Take-up 75%
% households 2017
1b1 4G Coverage 91%
% households (average of operators) 2017
1b2 Mobile Broadband Take-up 90
Subscriptions per 100 people 2017
1c1 Fast Broadband (NGA) Coverage 80%
% households covered by VDSL, FTTP or Docsis 3.0 2017
1c2 Fast Broadband Take-up 33%
% homes subscribing to >= 30Mbps 2017
1d1 Ultrafast Broadband Coverage 58%
% households covered by FTTP or Docsis 3.0 2017
1d2 Ultrafast Broadband Take-up 15.4%
% homes subscribing to >= 100Mbps 2017
1e1 Broadband Price Index 87
Score (0 to 100) 2017
0
10
20
30
40
50
60
70
80
90
NL LU DK SE BE MT UK PT FI LV IE LT DE ES EE CZ AT EU28 HU CY SI PL RO FR SK BG IT HR EL
Digital Economy and Society Index (DESI) 2018, Connectivity
1a Fixed Broadband 1b Mobile Broadband 1c Fast Broadband 1d Ultrafast Broadband 1e Broadband price index
Source: DESI 2018, European Commission
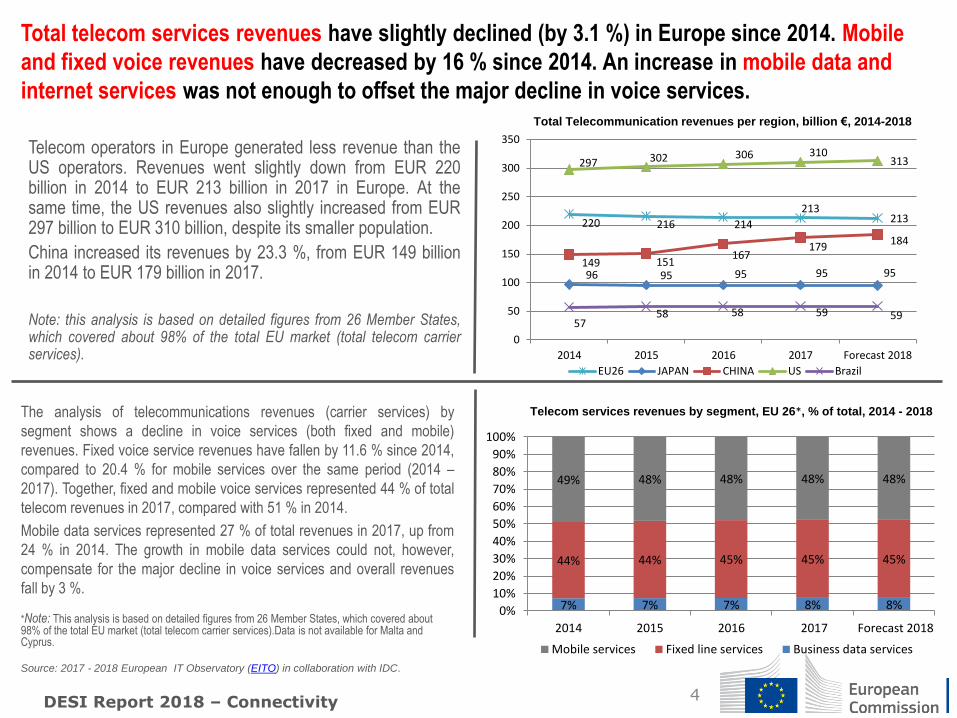
Telecom operators in Europe generated less revenue than the US operators. Revenues went slightly down from EUR 220 billion in 2014 to EUR 213 billion in 2017 in Europe. At the same time, the US revenues also slightly increased from EUR 297 billion to EUR 310 billion, despite its smaller population.
China increased its revenues by 23.3 %, from EUR 149 billion in 2014 to EUR 179 billion in 2017.
Note: this analysis is based on detailed figures from 26 Member States, which covered about 98% of the total EU market (total telecom carrier services).
4
Total telecom services revenues have slightly declined (by 3.1 %) in Europe since 2014. Mobile
and fixed voice revenues have decreased by 16 % since 2014. An increase in mobile data and
internet services was not enough to offset the major decline in voice services.
The analysis of telecommunications revenues (carrier services) by
segment shows a decline in voice services (both fixed and mobile)
revenues. Fixed voice service revenues have fallen by 11.6 % since 2014,
compared to 20.4 % for mobile services over the same period (2014 –
2017). Together, fixed and mobile voice services represented 44 % of total
telecom revenues in 2017, compared with 51 % in 2014.
Mobile data services represented 27 % of total revenues in 2017, up from
24 % in 2014. The growth in mobile data services could not, however,
compensate for the major decline in voice services and overall revenues
fall by 3 %.
*Note: This analysis is based on detailed figures from 26 Member States, which covered about 98% of the total EU market (total telecom carrier services).Data is not available for Malta and Cyprus.
Source: 2017 - 2018 European IT Observatory (EITO) in collaboration with IDC.
DESI Report 2018 – Connectivity
220 216 214
213 213
96 95 95 95 95 149 151
167 179
184
297 302 306 310 313
57 58 58 59 59
0
50
100
150
200
250
300
350
2014 2015 2016 2017 Forecast 2018
EU26 JAPAN CHINA US Brazil
Total Telecommunication revenues per region, billion €, 2014-2018
7% 7% 7% 8% 8%
44% 44% 45% 45% 45%
49% 48% 48% 48% 48%
0%
10%
20%
30%
40%
50%
60%
70%
80%
90%
100%
2014 2015 2016 2017 Forecast 2018
Mobile services Fixed line services Business data services
Telecom services revenues by segment, EU 26*, % of total, 2014 - 2018
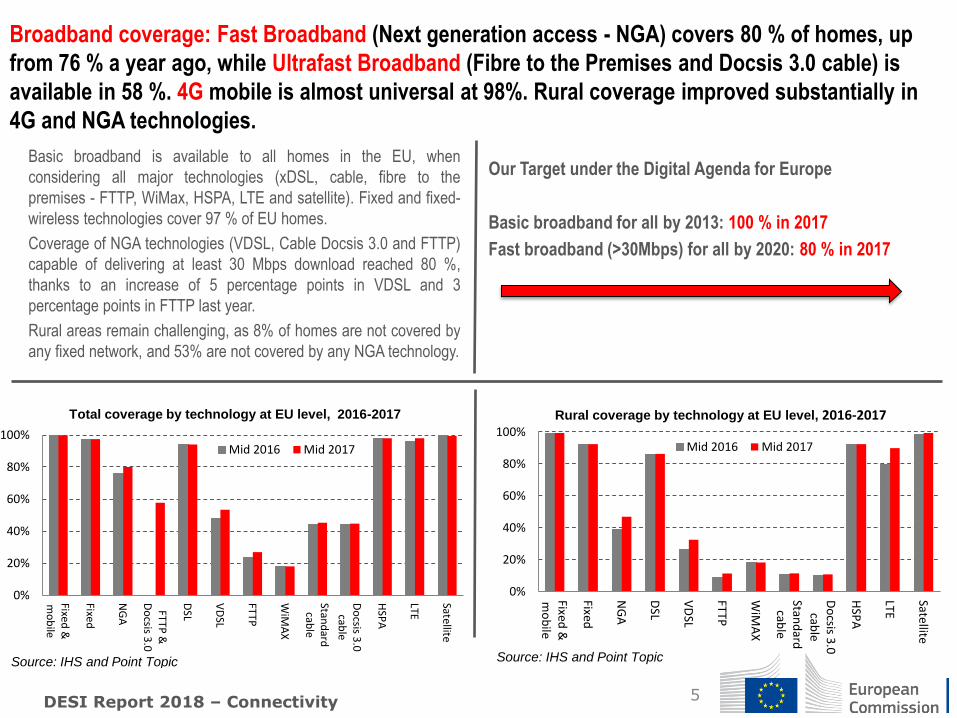
Basic broadband is available to all homes in the EU, when
considering all major technologies (xDSL, cable, fibre to the
premises - FTTP, WiMax, HSPA, LTE and satellite). Fixed and fixed-
wireless technologies cover 97 % of EU homes.
Coverage of NGA technologies (VDSL, Cable Docsis 3.0 and FTTP)
capable of delivering at least 30 Mbps download reached 80 %,
thanks to an increase of 5 percentage points in VDSL and 3
percentage points in FTTP last year.
Rural areas remain challenging, as 8% of homes are not covered by
any fixed network, and 53% are not covered by any NGA technology.
Broadband coverage: Fast Broadband (Next generation access - NGA) covers 80 % of homes, up
from 76 % a year ago, while Ultrafast Broadband (Fibre to the Premises and Docsis 3.0 cable) is
available in 58 %. 4G mobile is almost universal at 98%. Rural coverage improved substantially in
4G and NGA technologies.
5
Our Target under the Digital Agenda for Europe
Basic broadband for all by 2013: 100 % in 2017
Fast broadband (>30Mbps) for all by 2020: 80 % in 2017
DESI Report 2018 – Connectivity
0%
20%
40%
60%
80%
100%
Fixed
&m
ob
ile
Fixed
NG
A
FTTP &
Do
csis 3.0
DSL
VD
SL
FTTP
WiM
AX
Stand
ardcab
le
Do
csis 3.0
cable
HSP
A
LTE
Satellite
Mid 2016 Mid 2017
Total coverage by technology at EU level, 2016-2017
Source: IHS and Point Topic
0%
20%
40%
60%
80%
100%
Fixed &
mo
bile
Fixed
NG
A
DSL
VD
SL
FTTP
WiM
AX
Stand
ardcab
le
Do
csis 3.0
cable
HSP
A
LTE
Satellite
Mid 2016 Mid 2017
Rural coverage by technology at EU level, 2016-2017
Source: IHS and Point Topic
6
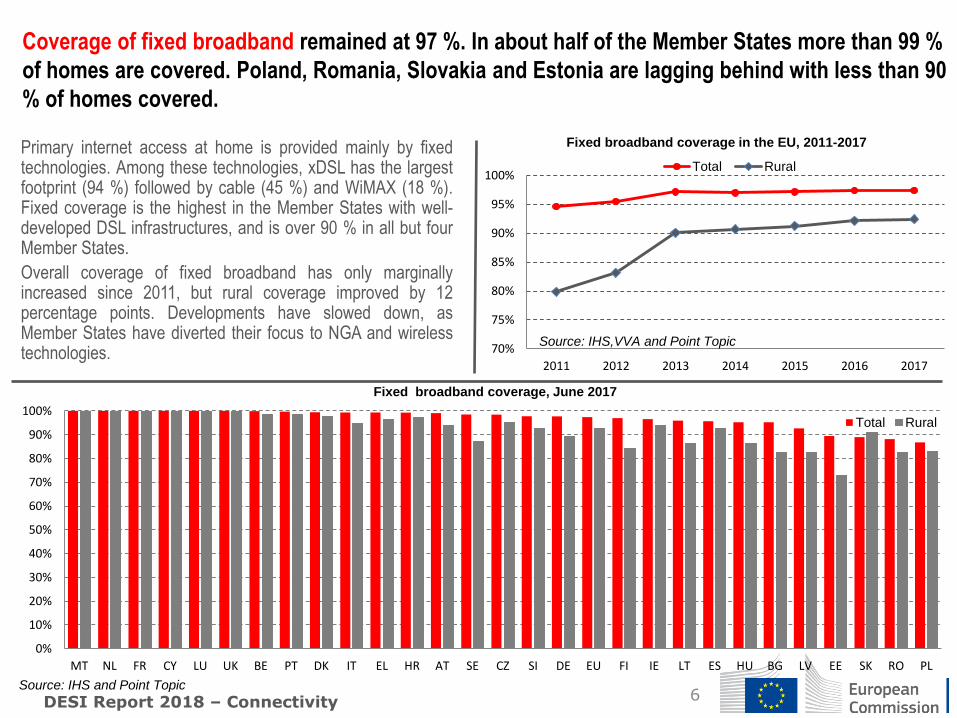
Primary internet access at home is provided mainly by fixed technologies. Among these technologies, xDSL has the largest footprint (94 %) followed by cable (45 %) and WiMAX (18 %). Fixed coverage is the highest in the Member States with well-developed DSL infrastructures, and is over 90 % in all but four Member States.
Overall coverage of fixed broadband has only marginally increased since 2011, but rural coverage improved by 12 percentage points. Developments have slowed down, as Member States have diverted their focus to NGA and wireless technologies.
Coverage of fixed broadband remained at 97 %. In about half of the Member States more than 99 %
of homes are covered. Poland, Romania, Slovakia and Estonia are lagging behind with less than 90
% of homes covered.
DESI Report 2018 – Connectivity
0%
10%
20%
30%
40%
50%
60%
70%
80%
90%
100%
MT NL FR CY LU UK BE PT DK IT EL HR AT SE CZ SI DE EU FI IE LT ES HU BG LV EE SK RO PL
Total Rural
Fixed broadband coverage, June 2017
Source: IHS and Point Topic
70%
75%
80%
85%
90%
95%
100%
2011 2012 2013 2014 2015 2016 2017
Total Rural
Fixed broadband coverage in the EU, 2011-2017
Source: IHS,VVA and Point Topic
7
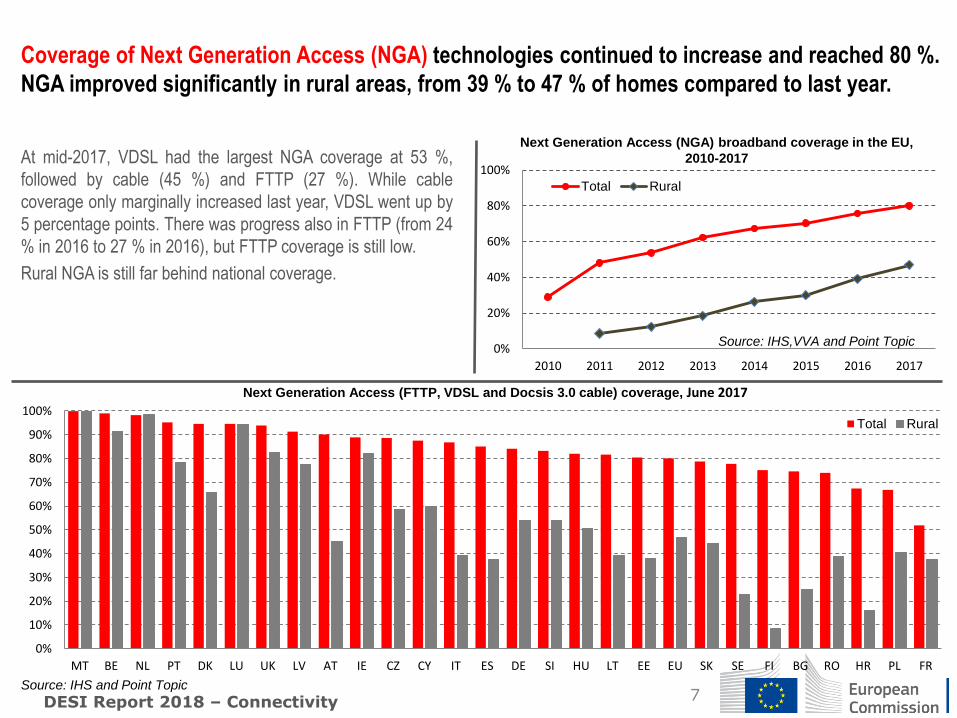
At mid-2017, VDSL had the largest NGA coverage at 53 %,
followed by cable (45 %) and FTTP (27 %). While cable
coverage only marginally increased last year, VDSL went up by
5 percentage points. There was progress also in FTTP (from 24
% in 2016 to 27 % in 2016), but FTTP coverage is still low.
Rural NGA is still far behind national coverage.
Coverage of Next Generation Access (NGA) technologies continued to increase and reached 80 %.
NGA improved significantly in rural areas, from 39 % to 47 % of homes compared to last year.
DESI Report 2018 – Connectivity
0%
20%
40%
60%
80%
100%
2010 2011 2012 2013 2014 2015 2016 2017
Total Rural
Next Generation Access (NGA) broadband coverage in the EU,
2010-2017
Source: IHS,VVA and Point Topic
0%
10%
20%
30%
40%
50%
60%
70%
80%
90%
100%
MT BE NL PT DK LU UK LV AT IE CZ CY IT ES DE SI HU LT EE EU SK SE FI BG RO HR PL FR
Total Rural
Next Generation Access (FTTP, VDSL and Docsis 3.0 cable) coverage, June 2017
Source: IHS and Point Topic
8
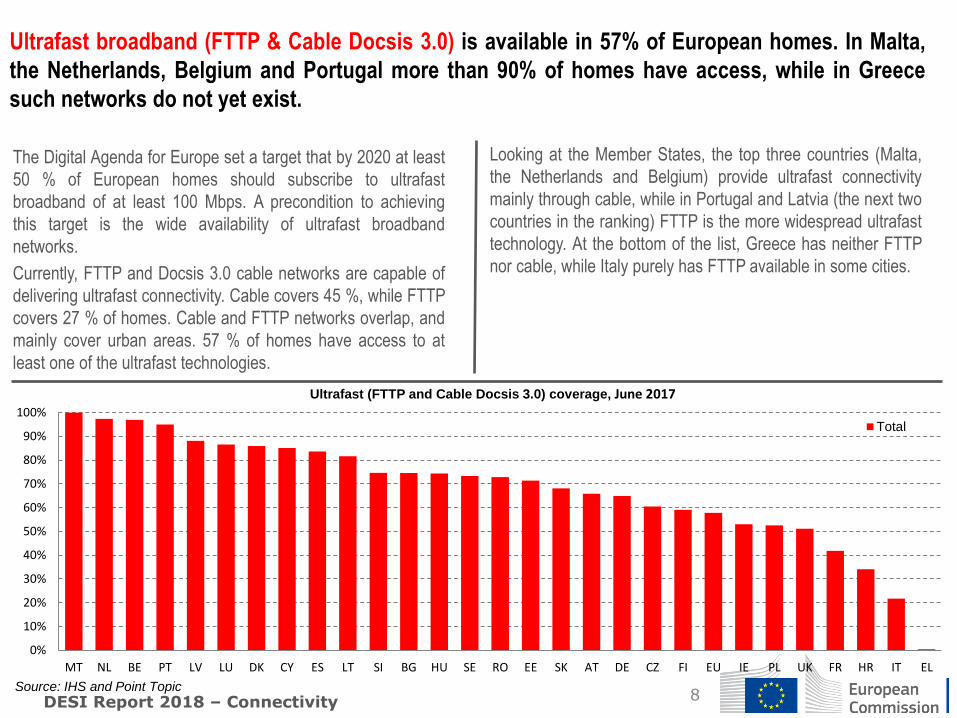
The Digital Agenda for Europe set a target that by 2020 at least
50 % of European homes should subscribe to ultrafast
broadband of at least 100 Mbps. A precondition to achieving
this target is the wide availability of ultrafast broadband
networks.
Currently, FTTP and Docsis 3.0 cable networks are capable of
delivering ultrafast connectivity. Cable covers 45 %, while FTTP
covers 27 % of homes. Cable and FTTP networks overlap, and
mainly cover urban areas. 57 % of homes have access to at
least one of the ultrafast technologies.
Ultrafast broadband (FTTP & Cable Docsis 3.0) is available in 57% of European homes. In Malta,
the Netherlands, Belgium and Portugal more than 90% of homes have access, while in Greece
such networks do not yet exist.
DESI Report 2018 – Connectivity
Looking at the Member States, the top three countries (Malta,
the Netherlands and Belgium) provide ultrafast connectivity
mainly through cable, while in Portugal and Latvia (the next two
countries in the ranking) FTTP is the more widespread ultrafast
technology. At the bottom of the list, Greece has neither FTTP
nor cable, while Italy purely has FTTP available in some cities.
0%
10%
20%
30%
40%
50%
60%
70%
80%
90%
100%
MT NL BE PT LV LU DK CY ES LT SI BG HU SE RO EE SK AT DE CZ FI EU IE PL UK FR HR IT EL
Total
Ultrafast (FTTP and Cable Docsis 3.0) coverage, June 2017
Source: IHS and Point Topic
9
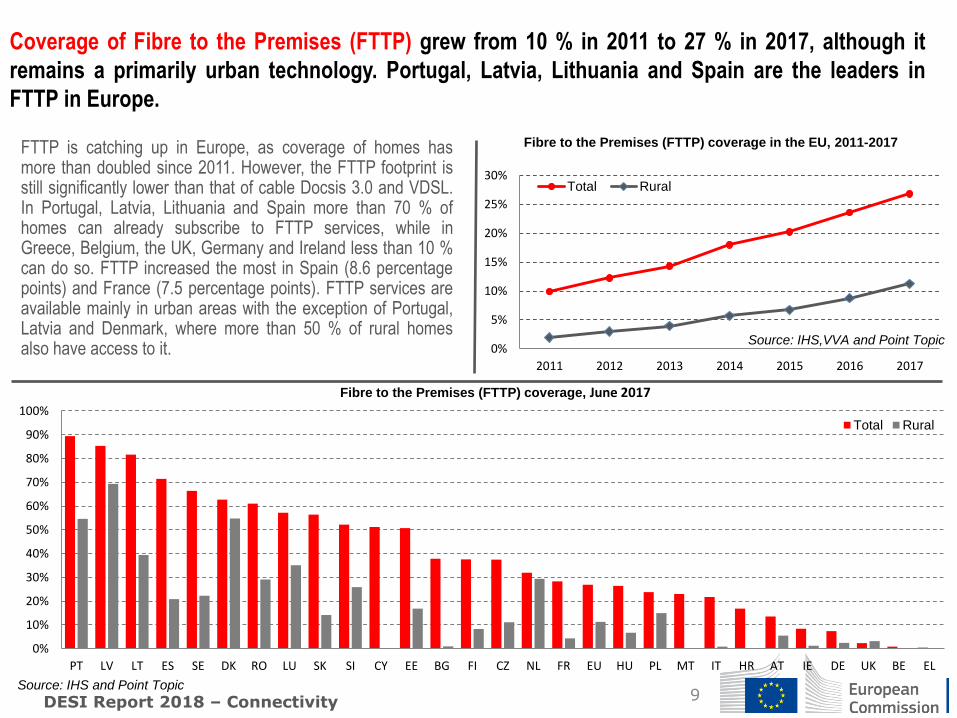
FTTP is catching up in Europe, as coverage of homes has more than doubled since 2011. However, the FTTP footprint is still significantly lower than that of cable Docsis 3.0 and VDSL. In Portugal, Latvia, Lithuania and Spain more than 70 % of homes can already subscribe to FTTP services, while in Greece, Belgium, the UK, Germany and Ireland less than 10 % can do so. FTTP increased the most in Spain (8.6 percentage points) and France (7.5 percentage points). FTTP services are available mainly in urban areas with the exception of Portugal, Latvia and Denmark, where more than 50 % of rural homes also have access to it.
Coverage of Fibre to the Premises (FTTP) grew from 10 % in 2011 to 27 % in 2017, although it
remains a primarily urban technology. Portugal, Latvia, Lithuania and Spain are the leaders in
FTTP in Europe.
DESI Report 2018 – Connectivity
0%
5%
10%
15%
20%
25%
30%
2011 2012 2013 2014 2015 2016 2017
Total Rural
Fibre to the Premises (FTTP) coverage in the EU, 2011-2017
Source: IHS,VVA and Point Topic
0%
10%
20%
30%
40%
50%
60%
70%
80%
90%
100%
PT LV LT ES SE DK RO LU SK SI CY EE BG FI CZ NL FR EU HU PL MT IT HR AT IE DE UK BE EL
Total Rural
Fibre to the Premises (FTTP) coverage, June 2017
Source: IHS and Point Topic
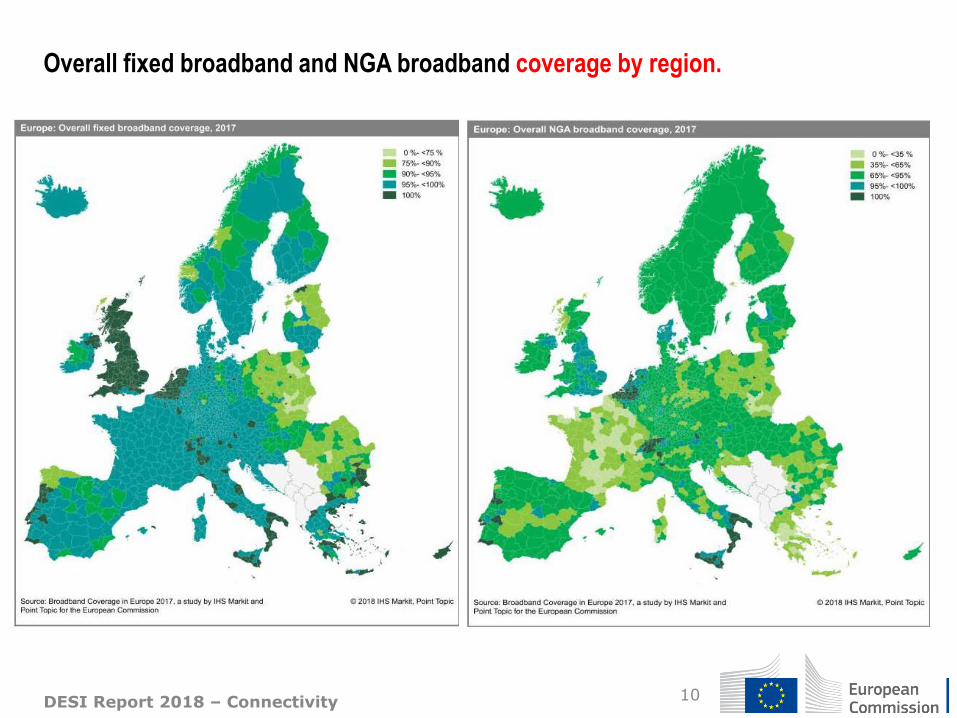
Overall fixed broadband and NGA broadband coverage by region.
10 DESI Report 2018 – Connectivity
11
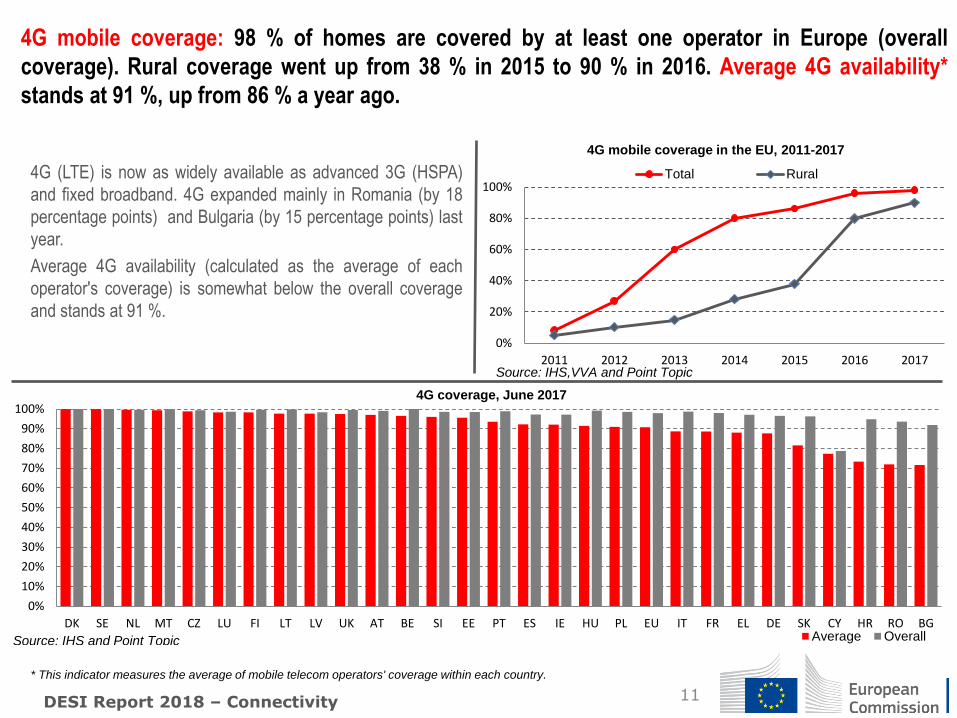
4G (LTE) is now as widely available as advanced 3G (HSPA)
and fixed broadband. 4G expanded mainly in Romania (by 18
percentage points) and Bulgaria (by 15 percentage points) last
year.
Average 4G availability (calculated as the average of each
operator's coverage) is somewhat below the overall coverage
and stands at 91 %.
4G mobile coverage: 98 % of homes are covered by at least one operator in Europe (overall
coverage). Rural coverage went up from 38 % in 2015 to 90 % in 2016. Average 4G availability*
stands at 91 %, up from 86 % a year ago.
DESI Report 2018 – Connectivity
* This indicator measures the average of mobile telecom operators' coverage within each country.
0%
10%
20%
30%
40%
50%
60%
70%
80%
90%
100%
DK SE NL MT CZ LU FI LT LV UK AT BE SI EE PT ES IE HU PL EU IT FR EL DE SK CY HR RO BGAverage Overall
4G coverage, June 2017
Source: IHS and Point Topic
0%
20%
40%
60%
80%
100%
2011 2012 2013 2014 2015 2016 2017
Total Rural
4G mobile coverage in the EU, 2011-2017
Source: IHS,VVA and Point Topic
12
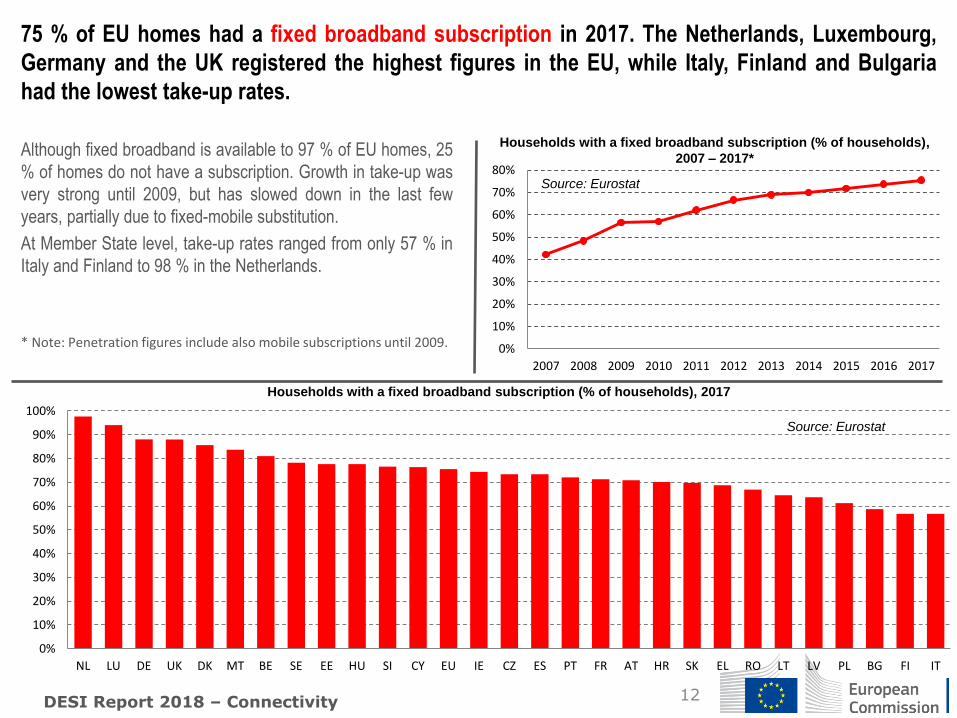
Although fixed broadband is available to 97 % of EU homes, 25
% of homes do not have a subscription. Growth in take-up was
very strong until 2009, but has slowed down in the last few
years, partially due to fixed-mobile substitution.
At Member State level, take-up rates ranged from only 57 % in
Italy and Finland to 98 % in the Netherlands.
* Note: Penetration figures include also mobile subscriptions until 2009.
75 % of EU homes had a fixed broadband subscription in 2017. The Netherlands, Luxembourg,
Germany and the UK registered the highest figures in the EU, while Italy, Finland and Bulgaria
had the lowest take-up rates.
DESI Report 2018 – Connectivity
0%
10%
20%
30%
40%
50%
60%
70%
80%
90%
100%
NL LU DE UK DK MT BE SE EE HU SI CY EU IE CZ ES PT FR AT HR SK EL RO LT LV PL BG FI IT
Households with a fixed broadband subscription (% of households), 2017
Source: Eurostat
0%
10%
20%
30%
40%
50%
60%
70%
80%
2007 2008 2009 2010 2011 2012 2013 2014 2015 2016 2017
Households with a fixed broadband subscription (% of households),
2007 – 2017*
Source: Eurostat
13
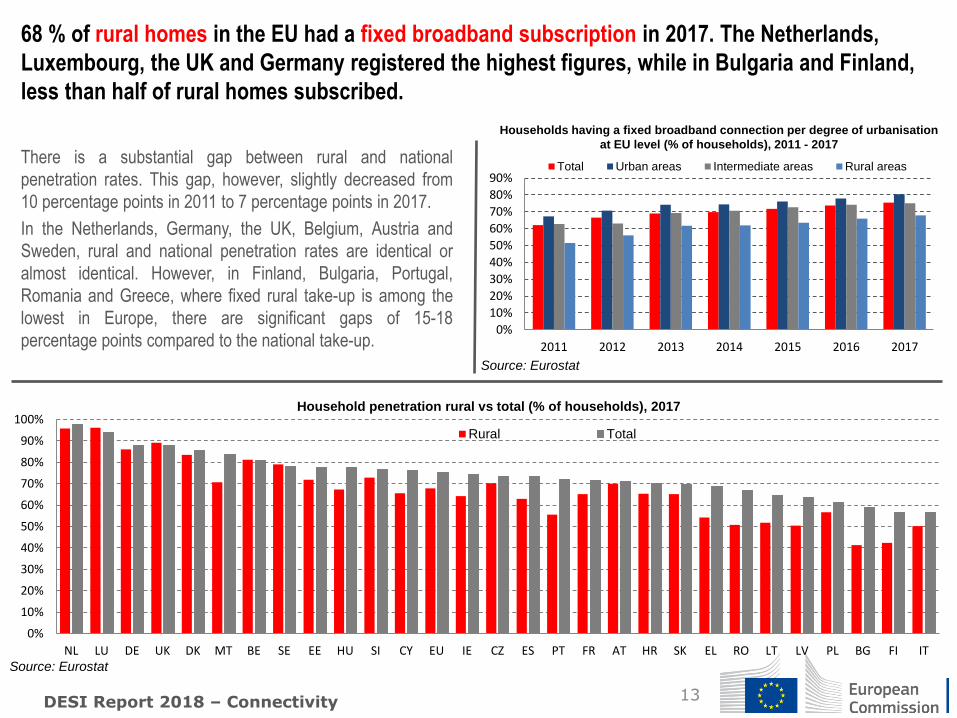
There is a substantial gap between rural and national
penetration rates. This gap, however, slightly decreased from
10 percentage points in 2011 to 7 percentage points in 2017.
In the Netherlands, Germany, the UK, Belgium, Austria and
Sweden, rural and national penetration rates are identical or
almost identical. However, in Finland, Bulgaria, Portugal,
Romania and Greece, where fixed rural take-up is among the
lowest in Europe, there are significant gaps of 15-18
percentage points compared to the national take-up.
68 % of rural homes in the EU had a fixed broadband subscription in 2017. The Netherlands,
Luxembourg, the UK and Germany registered the highest figures, while in Bulgaria and Finland,
less than half of rural homes subscribed.
DESI Report 2018 – Connectivity
0%
10%
20%
30%
40%
50%
60%
70%
80%
90%
2011 2012 2013 2014 2015 2016 2017
Total Urban areas Intermediate areas Rural areas
Households having a fixed broadband connection per degree of urbanisation
at EU level (% of households), 2011 - 2017
Source: Eurostat
0%
10%
20%
30%
40%
50%
60%
70%
80%
90%
100%
NL LU DE UK DK MT BE SE EE HU SI CY EU IE CZ ES PT FR AT HR SK EL RO LT LV PL BG FI IT
Rural Total
Household penetration rural vs total (% of households), 2017
Source: Eurostat
14
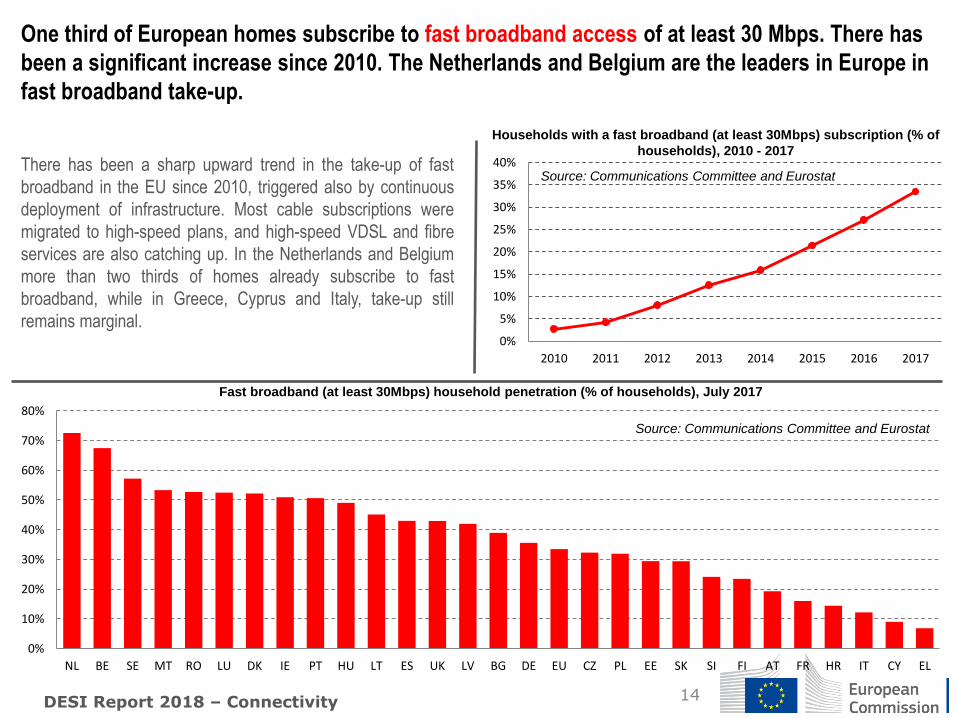
There has been a sharp upward trend in the take-up of fast
broadband in the EU since 2010, triggered also by continuous
deployment of infrastructure. Most cable subscriptions were
migrated to high-speed plans, and high-speed VDSL and fibre
services are also catching up. In the Netherlands and Belgium
more than two thirds of homes already subscribe to fast
broadband, while in Greece, Cyprus and Italy, take-up still
remains marginal.
One third of European homes subscribe to fast broadband access of at least 30 Mbps. There has
been a significant increase since 2010. The Netherlands and Belgium are the leaders in Europe in
fast broadband take-up.
DESI Report 2018 – Connectivity
0%
10%
20%
30%
40%
50%
60%
70%
80%
NL BE SE MT RO LU DK IE PT HU LT ES UK LV BG DE EU CZ PL EE SK SI FI AT FR HR IT CY EL
Fast broadband (at least 30Mbps) household penetration (% of households), July 2017
Source: Communications Committee and Eurostat
0%
5%
10%
15%
20%
25%
30%
35%
40%
2010 2011 2012 2013 2014 2015 2016 2017
Households with a fast broadband (at least 30Mbps) subscription (% of
households), 2010 - 2017
Source: Communications Committee and Eurostat
15
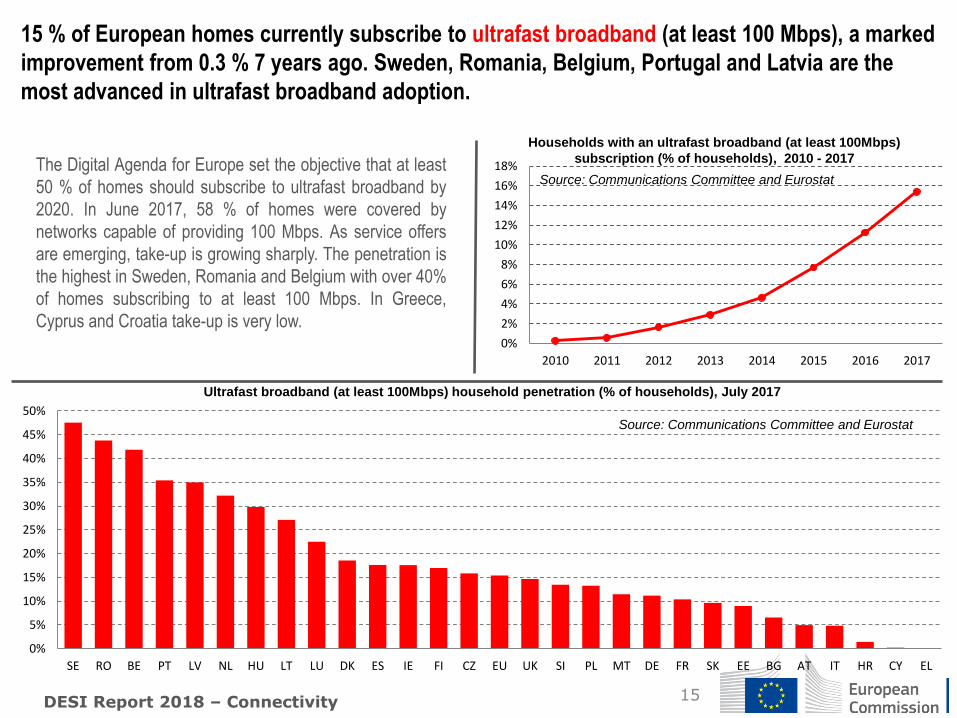
The Digital Agenda for Europe set the objective that at least
50 % of homes should subscribe to ultrafast broadband by
2020. In June 2017, 58 % of homes were covered by
networks capable of providing 100 Mbps. As service offers
are emerging, take-up is growing sharply. The penetration is
the highest in Sweden, Romania and Belgium with over 40%
of homes subscribing to at least 100 Mbps. In Greece,
Cyprus and Croatia take-up is very low.
15 % of European homes currently subscribe to ultrafast broadband (at least 100 Mbps), a marked
improvement from 0.3 % 7 years ago. Sweden, Romania, Belgium, Portugal and Latvia are the
most advanced in ultrafast broadband adoption.
DESI Report 2018 – Connectivity
0%
5%
10%
15%
20%
25%
30%
35%
40%
45%
50%
SE RO BE PT LV NL HU LT LU DK ES IE FI CZ EU UK SI PL MT DE FR SK EE BG AT IT HR CY EL
Ultrafast broadband (at least 100Mbps) household penetration (% of households), July 2017
Source: Communications Committee and Eurostat
0%
2%
4%
6%
8%
10%
12%
14%
16%
18%
2010 2011 2012 2013 2014 2015 2016 2017
Households with an ultrafast broadband (at least 100Mbps)
subscription (% of households), 2010 - 2017
Source: Communications Committee and Eurostat
16
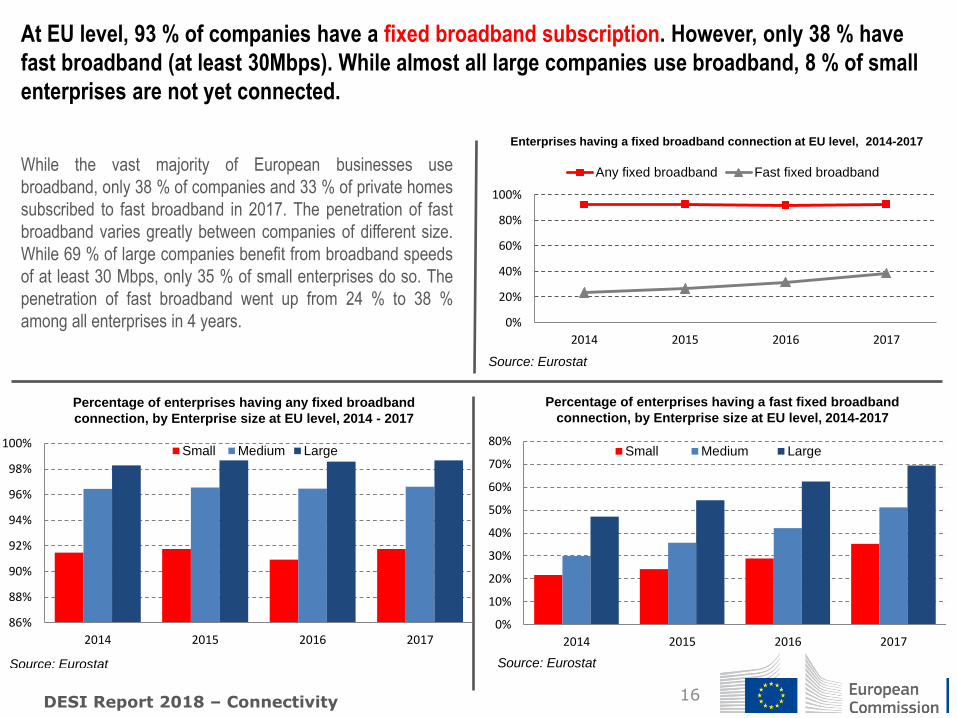
While the vast majority of European businesses use
broadband, only 38 % of companies and 33 % of private homes
subscribed to fast broadband in 2017. The penetration of fast
broadband varies greatly between companies of different size.
While 69 % of large companies benefit from broadband speeds
of at least 30 Mbps, only 35 % of small enterprises do so. The
penetration of fast broadband went up from 24 % to 38 %
among all enterprises in 4 years.
At EU level, 93 % of companies have a fixed broadband subscription. However, only 38 % have
fast broadband (at least 30Mbps). While almost all large companies use broadband, 8 % of small
enterprises are not yet connected.
DESI Report 2018 – Connectivity
0%
20%
40%
60%
80%
100%
2014 2015 2016 2017
Any fixed broadband Fast fixed broadband
Enterprises having a fixed broadband connection at EU level, 2014-2017
Source: Eurostat
0%
10%
20%
30%
40%
50%
60%
70%
80%
2014 2015 2016 2017
Small Medium Large
Percentage of enterprises having a fast fixed broadband
connection, by Enterprise size at EU level, 2014-2017
Source: Eurostat
86%
88%
90%
92%
94%
96%
98%
100%
2014 2015 2016 2017
Small Medium Large
Percentage of enterprises having any fixed broadband
connection, by Enterprise size at EU level, 2014 - 2017
Source: Eurostat
17
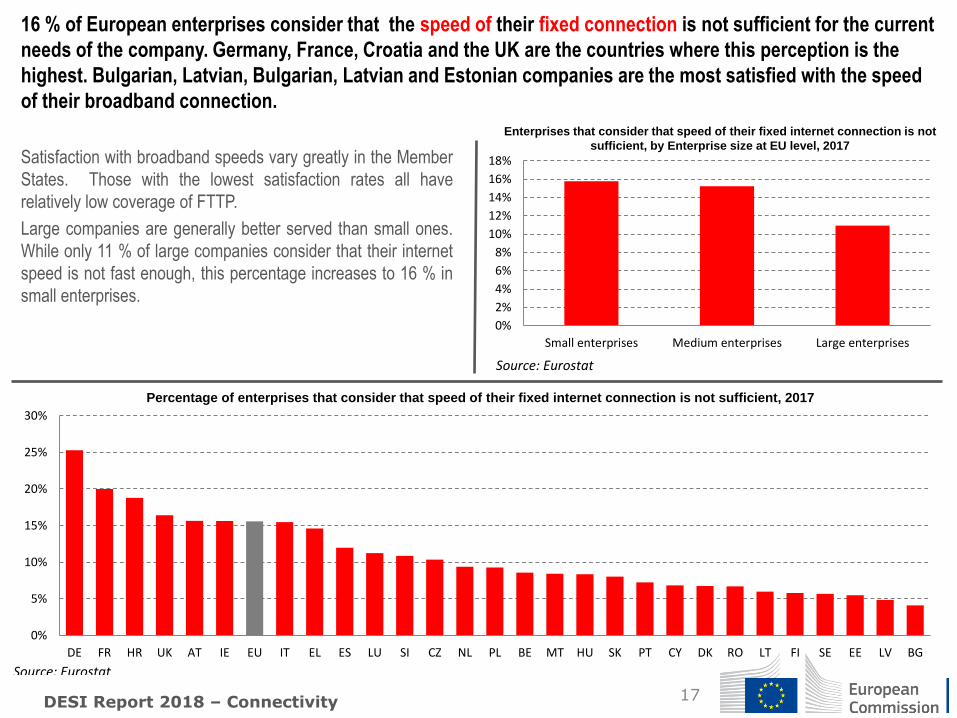
16 % of European enterprises consider that the speed of their fixed connection is not sufficient for the current
needs of the company. Germany, France, Croatia and the UK are the countries where this perception is the
highest. Bulgarian, Latvian, Bulgarian, Latvian and Estonian companies are the most satisfied with the speed
of their broadband connection.
DESI Report 2018 – Connectivity
0%
5%
10%
15%
20%
25%
30%
DE FR HR UK AT IE EU IT EL ES LU SI CZ NL PL BE MT HU SK PT CY DK RO LT FI SE EE LV BG
Percentage of enterprises that consider that speed of their fixed internet connection is not sufficient, 2017
Source: Eurostat
Satisfaction with broadband speeds vary greatly in the Member
States. Those with the lowest satisfaction rates all have
relatively low coverage of FTTP.
Large companies are generally better served than small ones.
While only 11 % of large companies consider that their internet
speed is not fast enough, this percentage increases to 16 % in
small enterprises.
0%
2%
4%
6%
8%
10%
12%
14%
16%
18%
Small enterprises Medium enterprises Large enterprises
Enterprises that consider that speed of their fixed internet connection is not
sufficient, by Enterprise size at EU level, 2017
Source: Eurostat
18
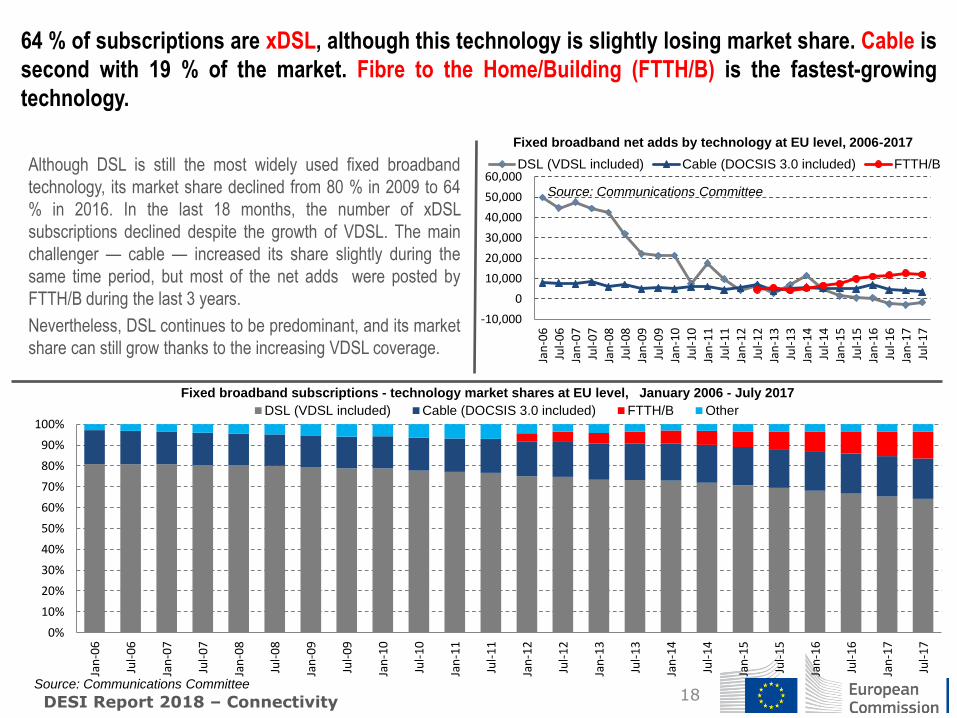
Although DSL is still the most widely used fixed broadband
technology, its market share declined from 80 % in 2009 to 64
% in 2016. In the last 18 months, the number of xDSL
subscriptions declined despite the growth of VDSL. The main
challenger — cable — increased its share slightly during the
same time period, but most of the net adds were posted by
FTTH/B during the last 3 years.
Nevertheless, DSL continues to be predominant, and its market
share can still grow thanks to the increasing VDSL coverage.
64 % of subscriptions are xDSL, although this technology is slightly losing market share. Cable is
second with 19 % of the market. Fibre to the Home/Building (FTTH/B) is the fastest-growing
technology.
DESI Report 2018 – Connectivity
-10,000
0
10,000
20,000
30,000
40,000
50,000
60,000
Jan
-06
Ju
l-0
6 J
an-0
7 J
ul-
07
Jan
-08
Ju
l-0
8 J
an-0
9 J
ul-
09
Jan
-10
Ju
l-1
0 J
an-1
1 J
ul-
11
Jan
-12
Ju
l-1
2 J
an-1
3 J
ul-
13
Jan
-14
Ju
l-1
4 J
an-1
5 J
ul-
15
Jan
-16
Ju
l-1
6 J
an-1
7 J
ul-
17
DSL (VDSL included) Cable (DOCSIS 3.0 included) FTTH/B
Fixed broadband net adds by technology at EU level, 2006-2017
Source: Communications Committee
0%
10%
20%
30%
40%
50%
60%
70%
80%
90%
100%
Jan
-06
Ju
l-0
6
Jan
-07
Ju
l-0
7
Jan
-08
Ju
l-0
8
Jan
-09
Ju
l-0
9
Jan
-10
Ju
l-1
0
Jan
-11
Ju
l-1
1
Jan
-12
Ju
l-1
2
Jan
-13
Ju
l-1
3
Jan
-14
Ju
l-1
4
Jan
-15
Ju
l-1
5
Jan
-16
Ju
l-1
6
Jan
-17
Ju
l-1
7
DSL (VDSL included) Cable (DOCSIS 3.0 included) FTTH/B Other
Fixed broadband subscriptions - technology market shares at EU level, January 2006 - July 2017
Source: Communications Committee
19
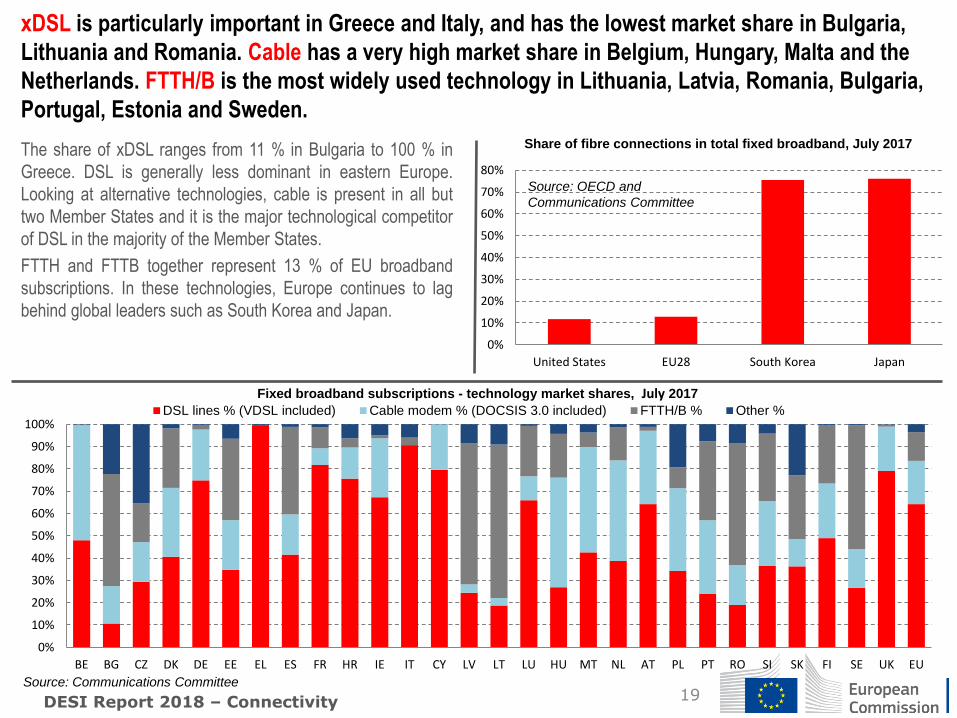
The share of xDSL ranges from 11 % in Bulgaria to 100 % in
Greece. DSL is generally less dominant in eastern Europe.
Looking at alternative technologies, cable is present in all but
two Member States and it is the major technological competitor
of DSL in the majority of the Member States.
FTTH and FTTB together represent 13 % of EU broadband
subscriptions. In these technologies, Europe continues to lag
behind global leaders such as South Korea and Japan.
xDSL is particularly important in Greece and Italy, and has the lowest market share in Bulgaria,
Lithuania and Romania. Cable has a very high market share in Belgium, Hungary, Malta and the
Netherlands. FTTH/B is the most widely used technology in Lithuania, Latvia, Romania, Bulgaria,
Portugal, Estonia and Sweden.
DESI Report 2018 – Connectivity
0%
10%
20%
30%
40%
50%
60%
70%
80%
90%
100%
BE BG CZ DK DE EE EL ES FR HR IE IT CY LV LT LU HU MT NL AT PL PT RO SI SK FI SE UK EU
DSL lines % (VDSL included) Cable modem % (DOCSIS 3.0 included) FTTH/B % Other %
Fixed broadband subscriptions - technology market shares, July 2017
Source: Communications Committee
0%
10%
20%
30%
40%
50%
60%
70%
80%
United States EU28 South Korea Japan
Share of fibre connections in total fixed broadband, July 2017
Source: OECD and
Communications Committee
20
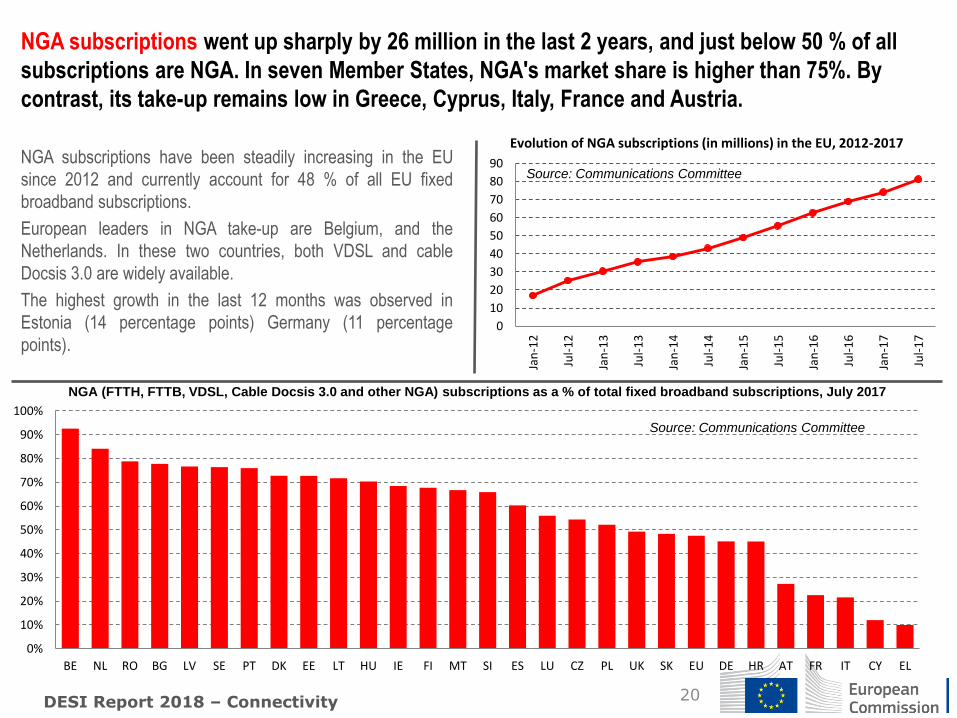
NGA subscriptions have been steadily increasing in the EU
since 2012 and currently account for 48 % of all EU fixed
broadband subscriptions.
European leaders in NGA take-up are Belgium, and the
Netherlands. In these two countries, both VDSL and cable
Docsis 3.0 are widely available.
The highest growth in the last 12 months was observed in
Estonia (14 percentage points) Germany (11 percentage
points).
NGA subscriptions went up sharply by 26 million in the last 2 years, and just below 50 % of all
subscriptions are NGA. In seven Member States, NGA's market share is higher than 75%. By
contrast, its take-up remains low in Greece, Cyprus, Italy, France and Austria.
DESI Report 2018 – Connectivity
0
10
20
30
40
50
60
70
80
90
Jan
-12
Ju
l-1
2
Jan
-13
Ju
l-1
3
Jan
-14
Ju
l-1
4
Jan
-15
Ju
l-1
5
Jan
-16
Ju
l-1
6
Jan
-17
Ju
l-1
7
Evolution of NGA subscriptions (in millions) in the EU, 2012-2017
Source: Communications Committee
0%
10%
20%
30%
40%
50%
60%
70%
80%
90%
100%
BE NL RO BG LV SE PT DK EE LT HU IE FI MT SI ES LU CZ PL UK SK EU DE HR AT FR IT CY EL
NGA (FTTH, FTTB, VDSL, Cable Docsis 3.0 and other NGA) subscriptions as a % of total fixed broadband subscriptions, July 2017
Source: Communications Committee
21
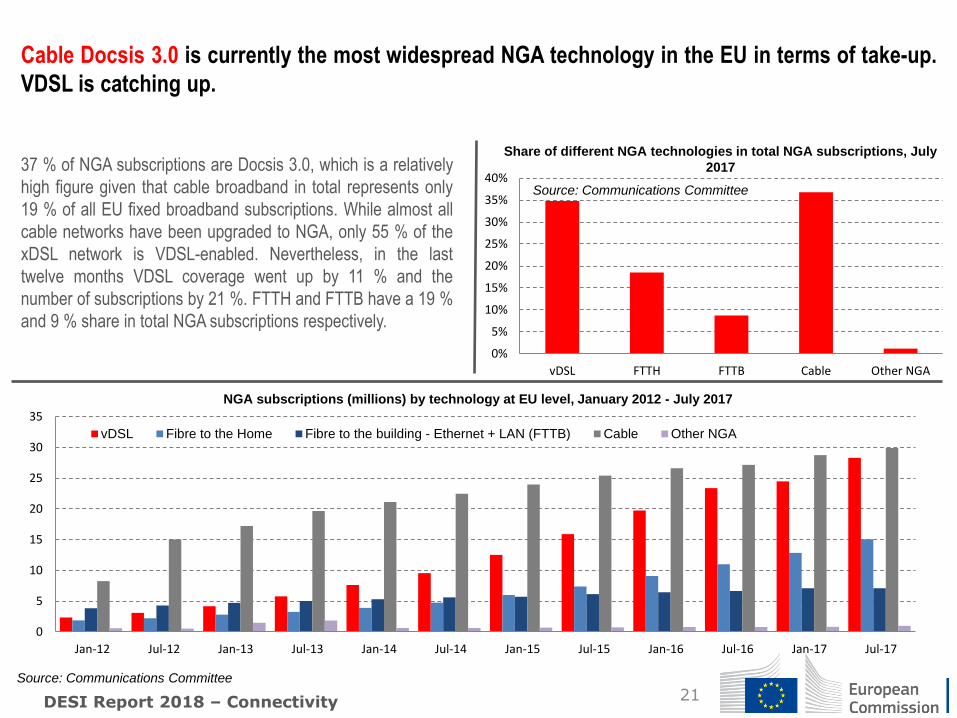
37 % of NGA subscriptions are Docsis 3.0, which is a relatively
high figure given that cable broadband in total represents only
19 % of all EU fixed broadband subscriptions. While almost all
cable networks have been upgraded to NGA, only 55 % of the
xDSL network is VDSL-enabled. Nevertheless, in the last
twelve months VDSL coverage went up by 11 % and the
number of subscriptions by 21 %. FTTH and FTTB have a 19 %
and 9 % share in total NGA subscriptions respectively.
Cable Docsis 3.0 is currently the most widespread NGA technology in the EU in terms of take-up.
VDSL is catching up.
DESI Report 2018 – Connectivity
0
5
10
15
20
25
30
35
Jan-12 Jul-12 Jan-13 Jul-13 Jan-14 Jul-14 Jan-15 Jul-15 Jan-16 Jul-16 Jan-17 Jul-17
vDSL Fibre to the Home Fibre to the building - Ethernet + LAN (FTTB) Cable Other NGA
NGA subscriptions (millions) by technology at EU level, January 2012 - July 2017
Source: Communications Committee
0%
5%
10%
15%
20%
25%
30%
35%
40%
vDSL FTTH FTTB Cable Other NGA
Share of different NGA technologies in total NGA subscriptions, July
2017
Source: Communications Committee
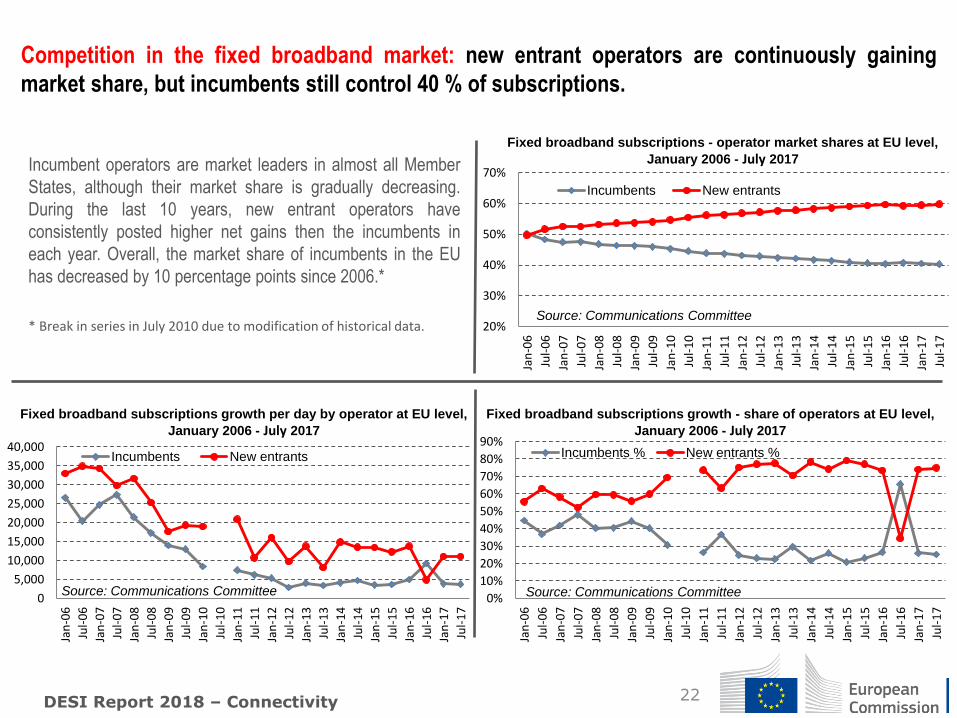
Incumbent operators are market leaders in almost all Member
States, although their market share is gradually decreasing.
During the last 10 years, new entrant operators have
consistently posted higher net gains then the incumbents in
each year. Overall, the market share of incumbents in the EU
has decreased by 10 percentage points since 2006.*
* Break in series in July 2010 due to modification of historical data.
Competition in the fixed broadband market: new entrant operators are continuously gaining
market share, but incumbents still control 40 % of subscriptions.
22 DESI Report 2018 – Connectivity
20%
30%
40%
50%
60%
70%
Jan
-06
Ju
l-0
6
Jan
-07
Ju
l-0
7
Jan
-08
Ju
l-0
8
Jan
-09
Ju
l-0
9
Jan
-10
Ju
l-1
0
Jan
-11
Ju
l-1
1
Jan
-12
Ju
l-1
2
Jan
-13
Ju
l-1
3
Jan
-14
Ju
l-1
4
Jan
-15
Ju
l-1
5
Jan
-16
Ju
l-1
6
Jan
-17
Ju
l-1
7
Incumbents New entrants
Fixed broadband subscriptions - operator market shares at EU level,
January 2006 - July 2017
Source: Communications Committee
0
5,000
10,000
15,000
20,000
25,000
30,000
35,000
40,000
Jan
-06
Ju
l-0
6
Jan
-07
Ju
l-0
7
Jan
-08
Ju
l-0
8
Jan
-09
Ju
l-0
9
Jan
-10
Ju
l-1
0
Jan
-11
Ju
l-1
1
Jan
-12
Ju
l-1
2
Jan
-13
Ju
l-1
3
Jan
-14
Ju
l-1
4
Jan
-15
Ju
l-1
5
Jan
-16
Ju
l-1
6
Jan
-17
Ju
l-1
7Incumbents New entrants
Fixed broadband subscriptions growth per day by operator at EU level,
January 2006 - July 2017
Source: Communications Committee 0%
10%
20%
30%
40%
50%
60%
70%
80%
90%
Jan
-06
Ju
l-0
6
Jan
-07
Ju
l-0
7
Jan
-08
Ju
l-0
8
Jan
-09
Ju
l-0
9
Jan
-10
Ju
l-1
0
Jan
-11
Ju
l-1
1
Jan
-12
Ju
l-1
2
Jan
-13
Ju
l-1
3
Jan
-14
Ju
l-1
4
Jan
-15
Ju
l-1
5
Jan
-16
Ju
l-1
6
Jan
-17
Ju
l-1
7
Incumbents % New entrants %
Fixed broadband subscriptions growth - share of operators at EU level,
January 2006 - July 2017
Source: Communications Committee
23
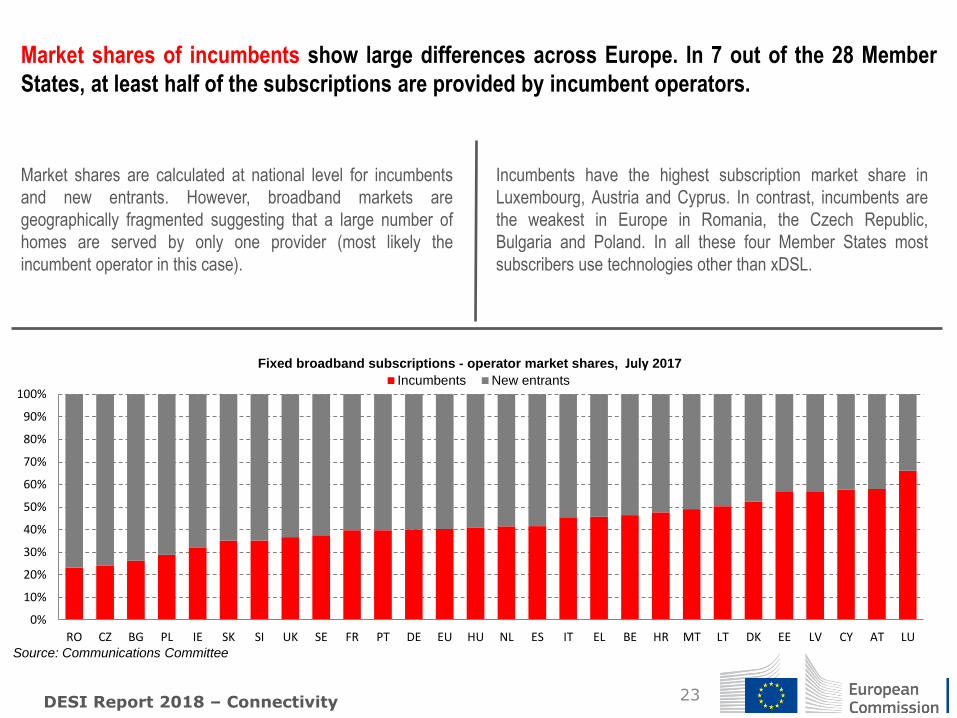
Market shares are calculated at national level for incumbents
and new entrants. However, broadband markets are
geographically fragmented suggesting that a large number of
homes are served by only one provider (most likely the
incumbent operator in this case).
Market shares of incumbents show large differences across Europe. In 7 out of the 28 Member
States, at least half of the subscriptions are provided by incumbent operators.
Incumbents have the highest subscription market share in
Luxembourg, Austria and Cyprus. In contrast, incumbents are
the weakest in Europe in Romania, the Czech Republic,
Bulgaria and Poland. In all these four Member States most
subscribers use technologies other than xDSL.
DESI Report 2018 – Connectivity
0%
10%
20%
30%
40%
50%
60%
70%
80%
90%
100%
RO CZ BG PL IE SK SI UK SE FR PT DE EU HU NL ES IT EL BE HR MT LT DK EE LV CY AT LU
Incumbents New entrants
Fixed broadband subscriptions - operator market shares, July 2017
Source: Communications Committee
24
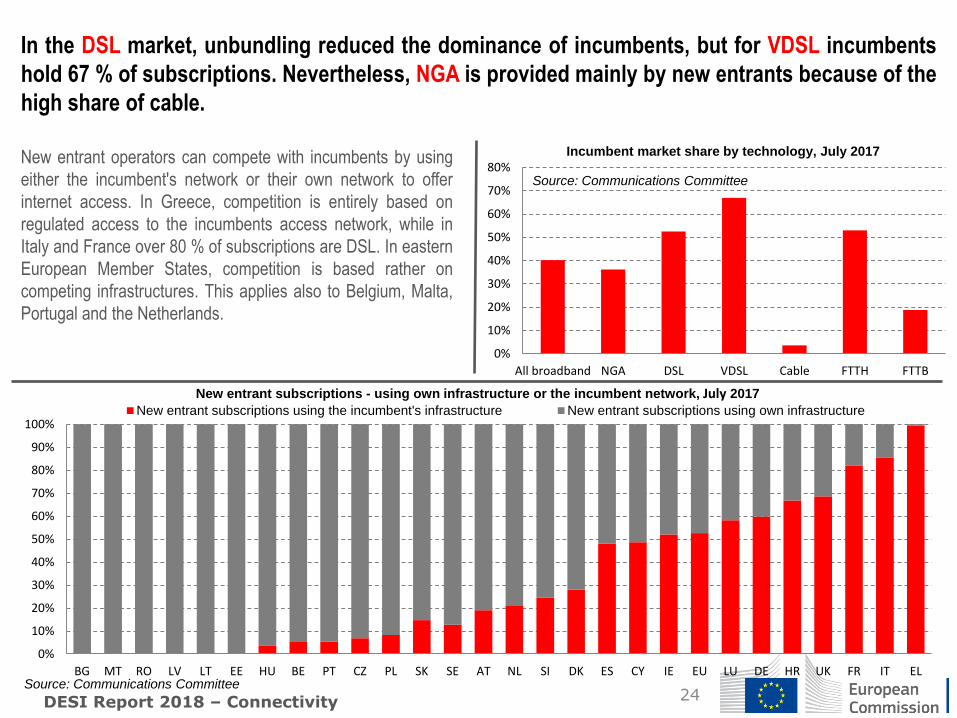
New entrant operators can compete with incumbents by using
either the incumbent's network or their own network to offer
internet access. In Greece, competition is entirely based on
regulated access to the incumbents access network, while in
Italy and France over 80 % of subscriptions are DSL. In eastern
European Member States, competition is based rather on
competing infrastructures. This applies also to Belgium, Malta,
Portugal and the Netherlands.
In the DSL market, unbundling reduced the dominance of incumbents, but for VDSL incumbents
hold 67 % of subscriptions. Nevertheless, NGA is provided mainly by new entrants because of the
high share of cable.
DESI Report 2018 – Connectivity
0%
10%
20%
30%
40%
50%
60%
70%
80%
90%
100%
BG MT RO LV LT EE HU BE PT CZ PL SK SE AT NL SI DK ES CY IE EU LU DE HR UK FR IT EL
New entrant subscriptions using the incumbent's infrastructure New entrant subscriptions using own infrastructure
New entrant subscriptions - using own infrastructure or the incumbent network, July 2017
Source: Communications Committee
0%
10%
20%
30%
40%
50%
60%
70%
80%
All broadband NGA DSL VDSL Cable FTTH FTTB
Incumbent market share by technology, July 2017
Source: Communications Committee
25
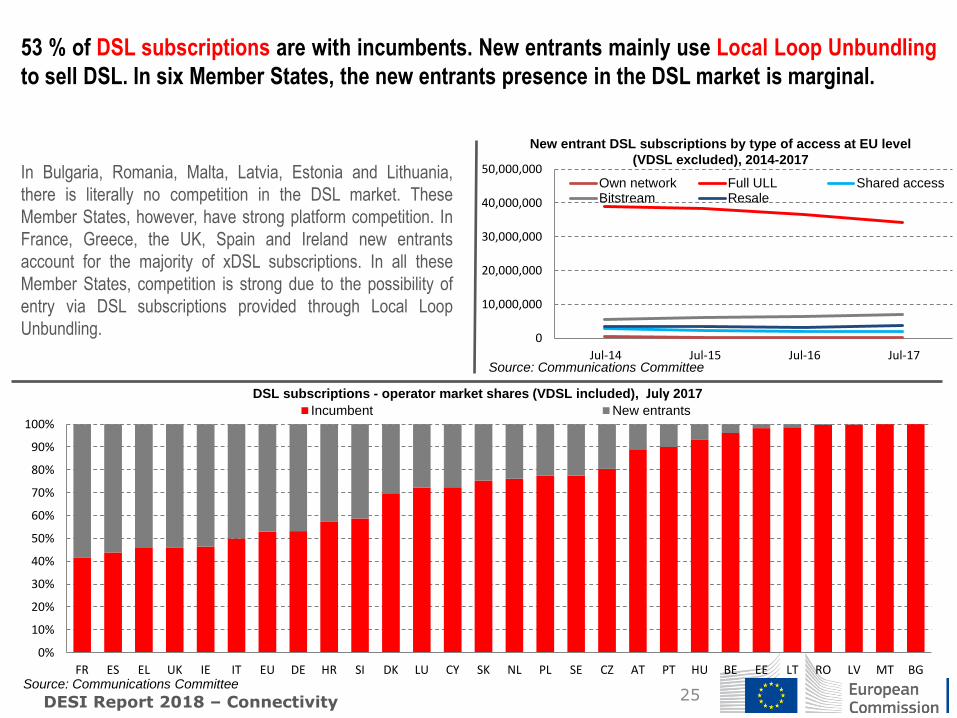
In Bulgaria, Romania, Malta, Latvia, Estonia and Lithuania,
there is literally no competition in the DSL market. These
Member States, however, have strong platform competition. In
France, Greece, the UK, Spain and Ireland new entrants
account for the majority of xDSL subscriptions. In all these
Member States, competition is strong due to the possibility of
entry via DSL subscriptions provided through Local Loop
Unbundling.
53 % of DSL subscriptions are with incumbents. New entrants mainly use Local Loop Unbundling
to sell DSL. In six Member States, the new entrants presence in the DSL market is marginal.
DESI Report 2018 – Connectivity
0
10,000,000
20,000,000
30,000,000
40,000,000
50,000,000
Jul-14 Jul-15 Jul-16 Jul-17
Own network Full ULL Shared accessBitstream Resale
New entrant DSL subscriptions by type of access at EU level
(VDSL excluded), 2014-2017
Source: Communications Committee
0%
10%
20%
30%
40%
50%
60%
70%
80%
90%
100%
FR ES EL UK IE IT EU DE HR SI DK LU CY SK NL PL SE CZ AT PT HU BE EE LT RO LV MT BG
Incumbent New entrants
DSL subscriptions - operator market shares (VDSL included), July 2017
Source: Communications Committee
26
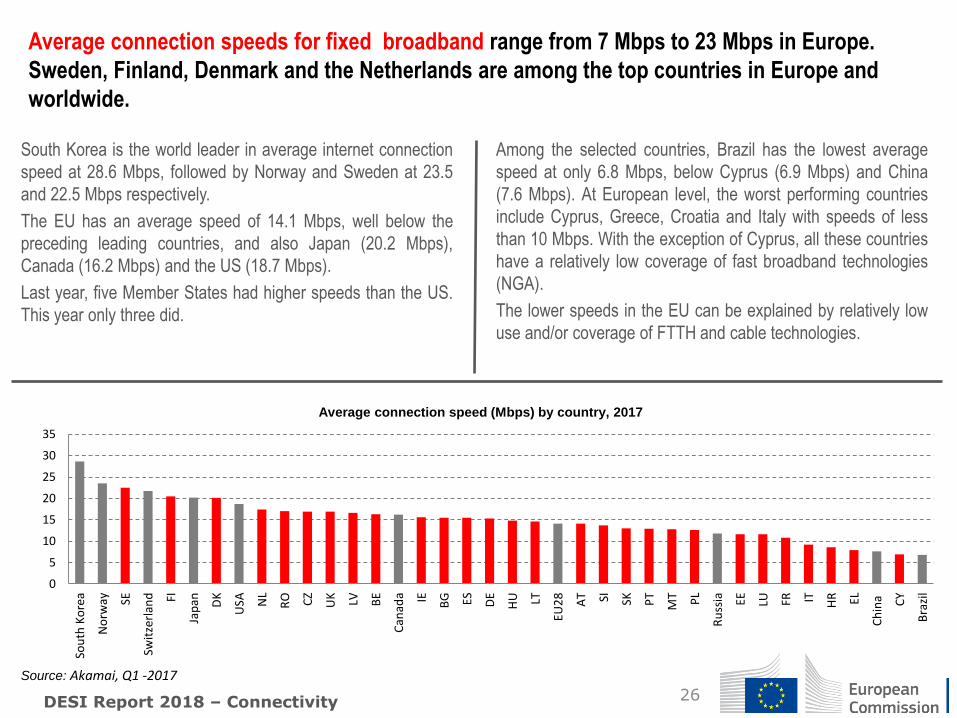
South Korea is the world leader in average internet connection
speed at 28.6 Mbps, followed by Norway and Sweden at 23.5
and 22.5 Mbps respectively.
The EU has an average speed of 14.1 Mbps, well below the
preceding leading countries, and also Japan (20.2 Mbps),
Canada (16.2 Mbps) and the US (18.7 Mbps).
Last year, five Member States had higher speeds than the US.
This year only three did.
Average connection speeds for fixed broadband range from 7 Mbps to 23 Mbps in Europe.
Sweden, Finland, Denmark and the Netherlands are among the top countries in Europe and
worldwide.
DESI Report 2018 – Connectivity
Among the selected countries, Brazil has the lowest average
speed at only 6.8 Mbps, below Cyprus (6.9 Mbps) and China
(7.6 Mbps). At European level, the worst performing countries
include Cyprus, Greece, Croatia and Italy with speeds of less
than 10 Mbps. With the exception of Cyprus, all these countries
have a relatively low coverage of fast broadband technologies
(NGA).
The lower speeds in the EU can be explained by relatively low
use and/or coverage of FTTH and cable technologies.
0
5
10
15
20
25
30
35
Sou
th K
ore
a
No
rway SE
Swit
zerl
and FI
Jap
an DK
USA N
L
RO CZ
UK LV BE
Can
ada IE BG ES DE
HU LT
EU2
8
AT SI SK PT
MT PL
Ru
ssia EE LU FR IT HR EL
Ch
ina CY
Bra
zil
Average connection speed (Mbps) by country, 2017
Source: Akamai, Q1 -2017
27
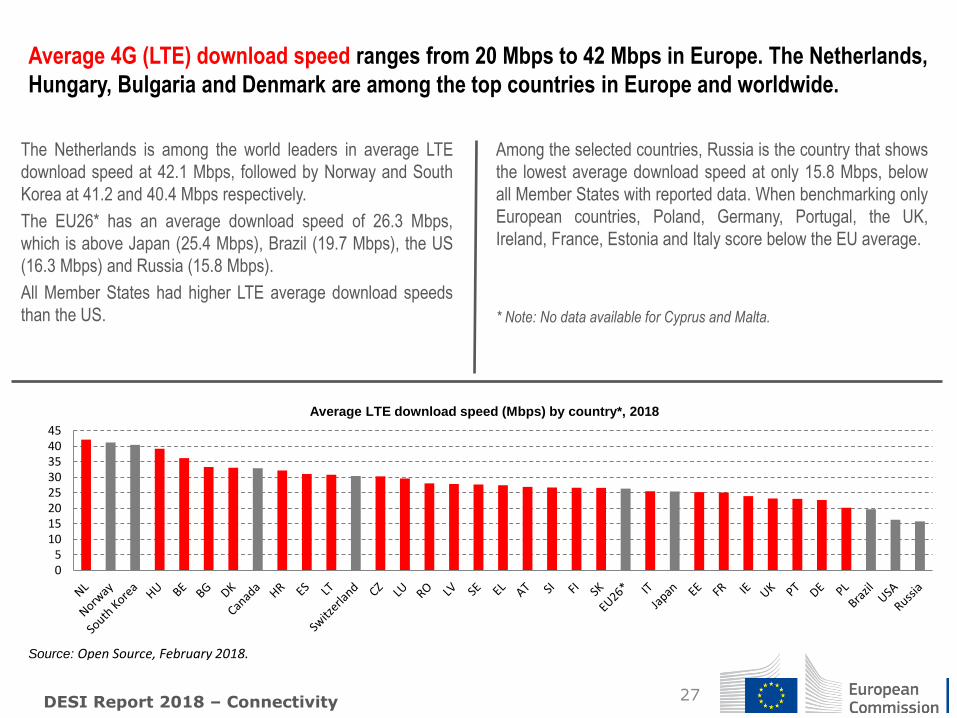
The Netherlands is among the world leaders in average LTE
download speed at 42.1 Mbps, followed by Norway and South
Korea at 41.2 and 40.4 Mbps respectively.
The EU26* has an average download speed of 26.3 Mbps,
which is above Japan (25.4 Mbps), Brazil (19.7 Mbps), the US
(16.3 Mbps) and Russia (15.8 Mbps).
All Member States had higher LTE average download speeds
than the US.
Average 4G (LTE) download speed ranges from 20 Mbps to 42 Mbps in Europe. The Netherlands,
Hungary, Bulgaria and Denmark are among the top countries in Europe and worldwide.
DESI Report 2018 – Connectivity
Among the selected countries, Russia is the country that shows
the lowest average download speed at only 15.8 Mbps, below
all Member States with reported data. When benchmarking only
European countries, Poland, Germany, Portugal, the UK,
Ireland, France, Estonia and Italy score below the EU average.
* Note: No data available for Cyprus and Malta.
05
1015202530354045
Average LTE download speed (Mbps) by country*, 2018
Source: Open Source, February 2018.
28
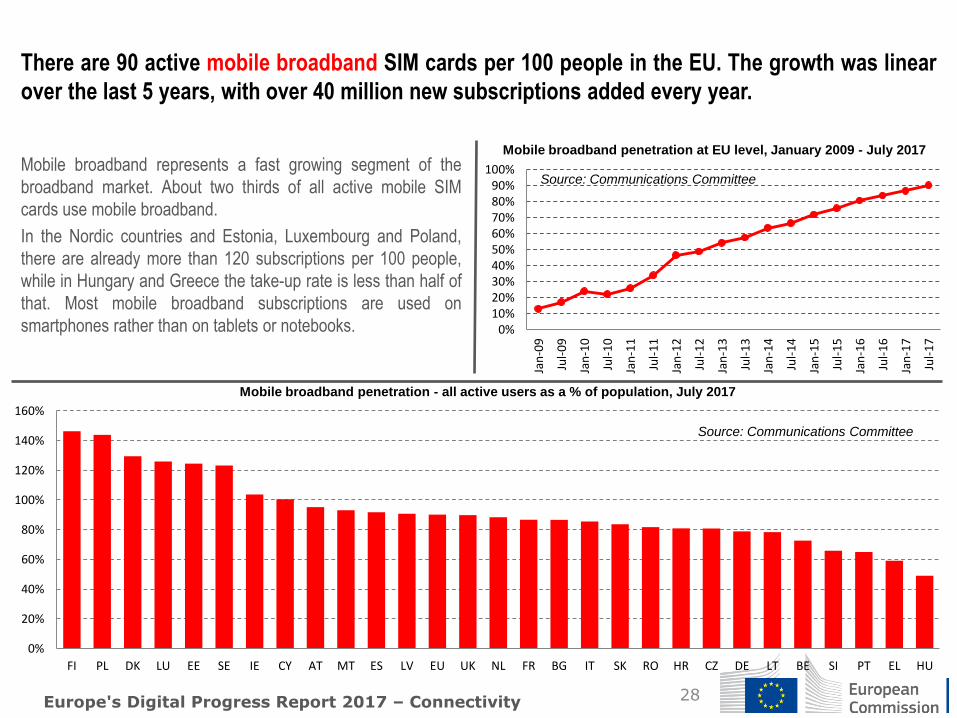
Mobile broadband represents a fast growing segment of the
broadband market. About two thirds of all active mobile SIM
cards use mobile broadband.
In the Nordic countries and Estonia, Luxembourg and Poland,
there are already more than 120 subscriptions per 100 people,
while in Hungary and Greece the take-up rate is less than half of
that. Most mobile broadband subscriptions are used on
smartphones rather than on tablets or notebooks.
There are 90 active mobile broadband SIM cards per 100 people in the EU. The growth was linear
over the last 5 years, with over 40 million new subscriptions added every year.
Europe's Digital Progress Report 2017 – Connectivity
0%10%20%30%40%50%60%70%80%90%
100%
Jan
-09
Ju
l-0
9
Jan
-10
Ju
l-1
0
Jan
-11
Ju
l-1
1
Jan
-12
Ju
l-1
2
Jan
-13
Ju
l-1
3
Jan
-14
Ju
l-1
4
Jan
-15
Ju
l-1
5
Jan
-16
Ju
l-1
6
Jan
-17
Ju
l-1
7
Mobile broadband penetration at EU level, January 2009 - July 2017
Source: Communications Committee
0%
20%
40%
60%
80%
100%
120%
140%
160%
FI PL DK LU EE SE IE CY AT MT ES LV EU UK NL FR BG IT SK RO HR CZ DE LT BE SI PT EL HU
Mobile broadband penetration - all active users as a % of population, July 2017
Source: Communications Committee
29
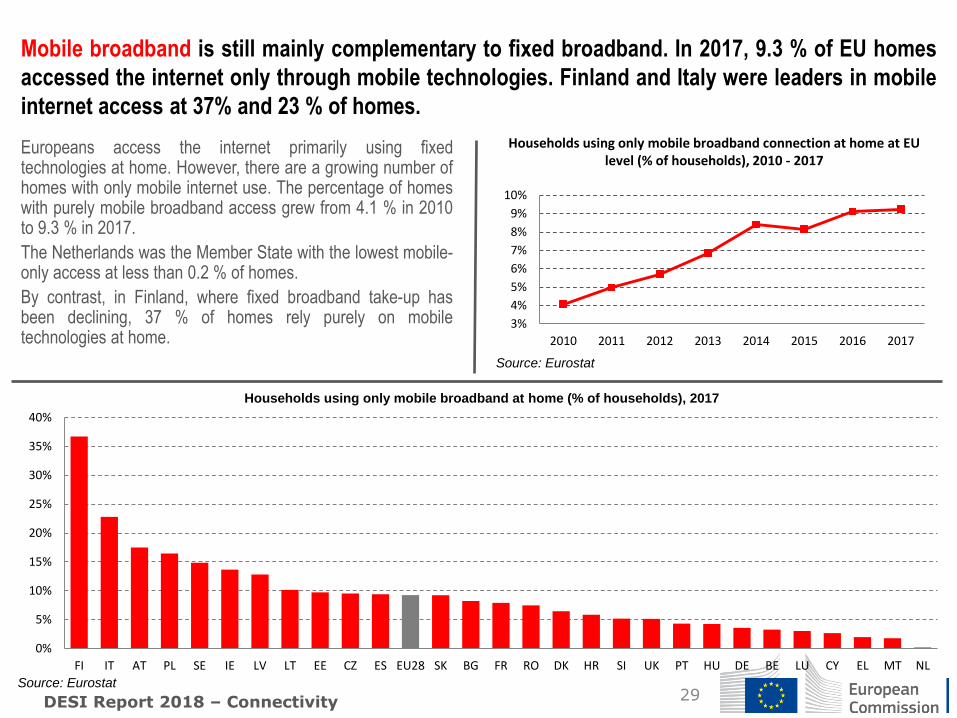
Europeans access the internet primarily using fixed technologies at home. However, there are a growing number of homes with only mobile internet use. The percentage of homes with purely mobile broadband access grew from 4.1 % in 2010 to 9.3 % in 2017.
The Netherlands was the Member State with the lowest mobile-only access at less than 0.2 % of homes.
By contrast, in Finland, where fixed broadband take-up has been declining, 37 % of homes rely purely on mobile technologies at home.
Mobile broadband is still mainly complementary to fixed broadband. In 2017, 9.3 % of EU homes
accessed the internet only through mobile technologies. Finland and Italy were leaders in mobile
internet access at 37% and 23 % of homes.
DESI Report 2018 – Connectivity
3%
4%
5%
6%
7%
8%
9%
10%
2010 2011 2012 2013 2014 2015 2016 2017
Households using only mobile broadband connection at home at EU level (% of households), 2010 - 2017
Source: Eurostat
0%
5%
10%
15%
20%
25%
30%
35%
40%
FI IT AT PL SE IE LV LT EE CZ ES EU28 SK BG FR RO DK HR SI UK PT HU DE BE LU CY EL MT NL
Households using only mobile broadband at home (% of households), 2017
Source: Eurostat
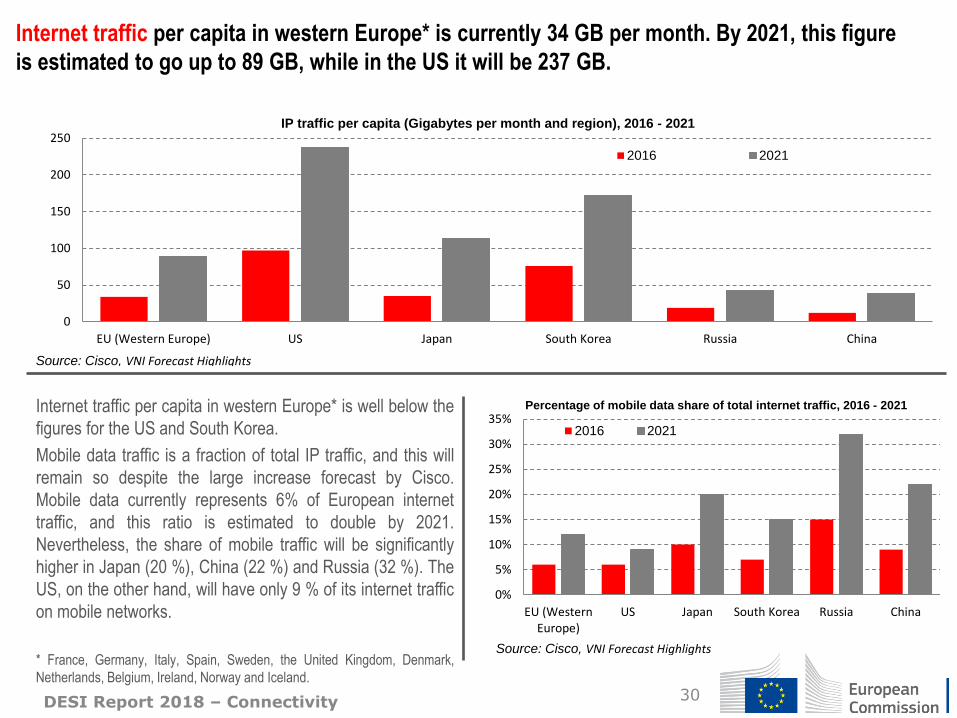
Internet traffic per capita in western Europe* is currently 34 GB per month. By 2021, this figure
is estimated to go up to 89 GB, while in the US it will be 237 GB.
30 DESI Report 2018 – Connectivity
Internet traffic per capita in western Europe* is well below the
figures for the US and South Korea.
Mobile data traffic is a fraction of total IP traffic, and this will
remain so despite the large increase forecast by Cisco.
Mobile data currently represents 6% of European internet
traffic, and this ratio is estimated to double by 2021.
Nevertheless, the share of mobile traffic will be significantly
higher in Japan (20 %), China (22 %) and Russia (32 %). The
US, on the other hand, will have only 9 % of its internet traffic
on mobile networks.
* France, Germany, Italy, Spain, Sweden, the United Kingdom, Denmark,
Netherlands, Belgium, Ireland, Norway and Iceland.
0
50
100
150
200
250
EU (Western Europe) US Japan South Korea Russia China
2016 2021
IP traffic per capita (Gigabytes per month and region), 2016 - 2021
Source: Cisco, VNI Forecast Highlights
0%
5%
10%
15%
20%
25%
30%
35%
EU (WesternEurope)
US Japan South Korea Russia China
2016 2021
Percentage of mobile data share of total internet traffic, 2016 - 2021
Source: Cisco, VNI Forecast Highlights
31
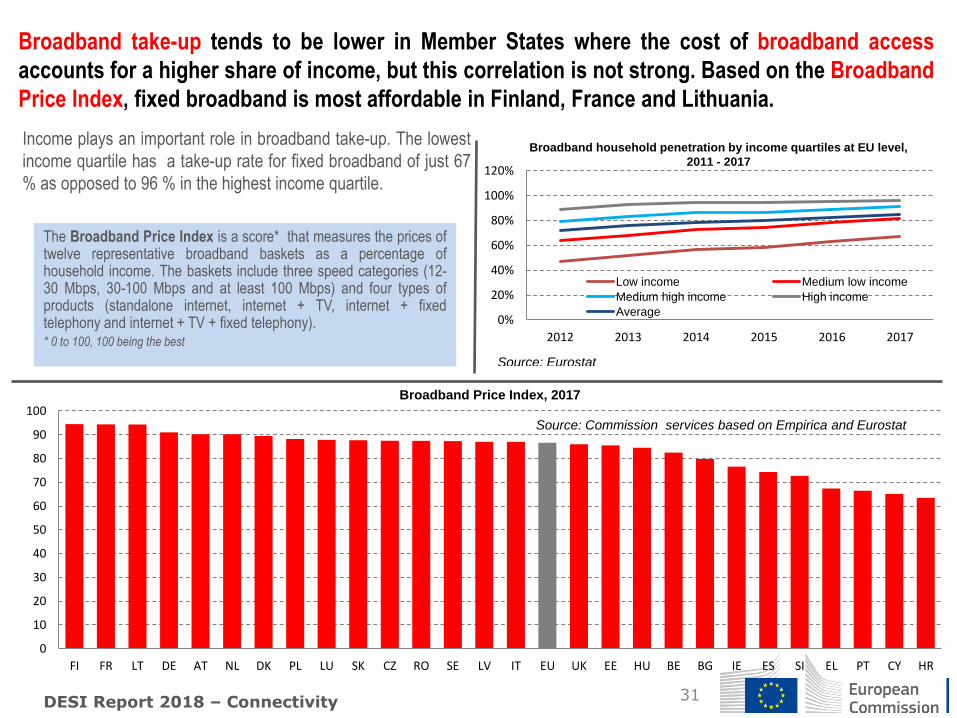
Income plays an important role in broadband take-up. The lowest
income quartile has a take-up rate for fixed broadband of just 67
% as opposed to 96 % in the highest income quartile.
Broadband take-up tends to be lower in Member States where the cost of broadband access
accounts for a higher share of income, but this correlation is not strong. Based on the Broadband
Price Index, fixed broadband is most affordable in Finland, France and Lithuania.
DESI Report 2018 – Connectivity
0
10
20
30
40
50
60
70
80
90
100
FI FR LT DE AT NL DK PL LU SK CZ RO SE LV IT EU UK EE HU BE BG IE ES SI EL PT CY HR
Broadband Price Index, 2017
Source: Commission services based on Empirica and Eurostat
The Broadband Price Index is a score* that measures the prices of twelve representative broadband baskets as a percentage of household income. The baskets include three speed categories (12-30 Mbps, 30-100 Mbps and at least 100 Mbps) and four types of products (standalone internet, internet + TV, internet + fixed telephony and internet + TV + fixed telephony). * 0 to 100, 100 being the best
0%
20%
40%
60%
80%
100%
120%
2012 2013 2014 2015 2016 2017
Low income Medium low income
Medium high income High income
Average
Broadband household penetration by income quartiles at EU level,
2011 - 2017
Source: Eurostat
32
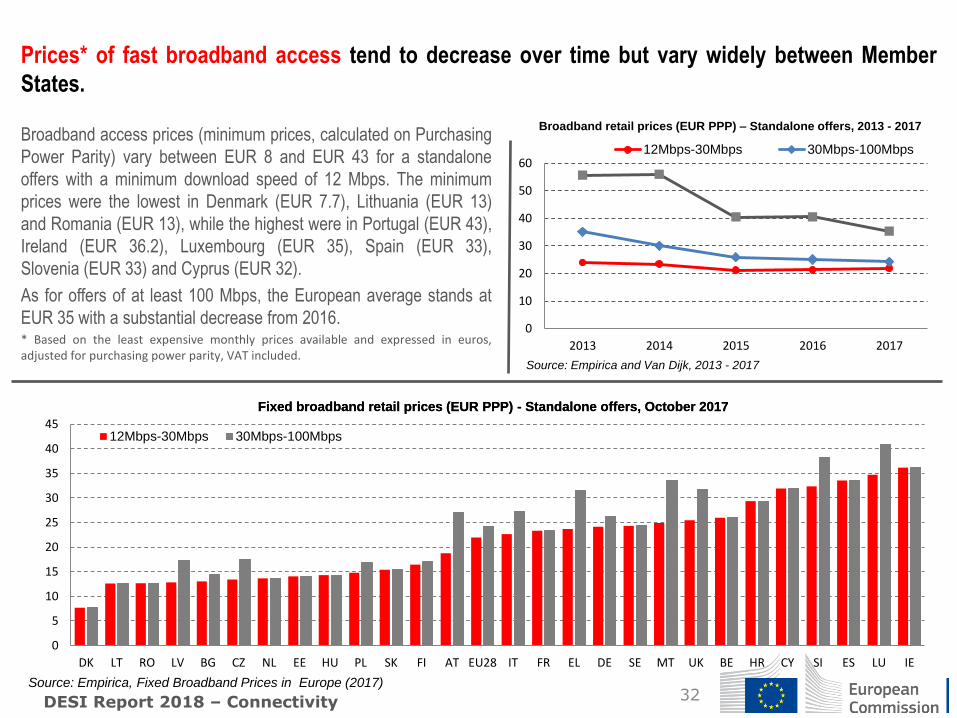
Broadband access prices (minimum prices, calculated on Purchasing
Power Parity) vary between EUR 8 and EUR 43 for a standalone
offers with a minimum download speed of 12 Mbps. The minimum
prices were the lowest in Denmark (EUR 7.7), Lithuania (EUR 13)
and Romania (EUR 13), while the highest were in Portugal (EUR 43),
Ireland (EUR 36.2), Luxembourg (EUR 35), Spain (EUR 33),
Slovenia (EUR 33) and Cyprus (EUR 32).
As for offers of at least 100 Mbps, the European average stands at
EUR 35 with a substantial decrease from 2016. * Based on the least expensive monthly prices available and expressed in euros, adjusted for purchasing power parity, VAT included.
Prices* of fast broadband access tend to decrease over time but vary widely between Member
States.
DESI Report 2018 – Connectivity
0
5
10
15
20
25
30
35
40
45
DK LT RO LV BG CZ NL EE HU PL SK FI AT EU28 IT FR EL DE SE MT UK BE HR CY SI ES LU IE
12Mbps-30Mbps 30Mbps-100Mbps
Fixed broadband retail prices (EUR PPP) - Standalone offers, October 2017 Fixed broadband retail prices (EUR PPP) - Standalone offers, October 2017
Source: Empirica, Fixed Broadband Prices in Europe (2017)
0
10
20
30
40
50
60
2013 2014 2015 2016 2017
12Mbps-30Mbps 30Mbps-100Mbps
Broadband retail prices (EUR PPP) – Standalone offers, 2013 - 2017
Source: Empirica and Van Dijk, 2013 - 2017
33
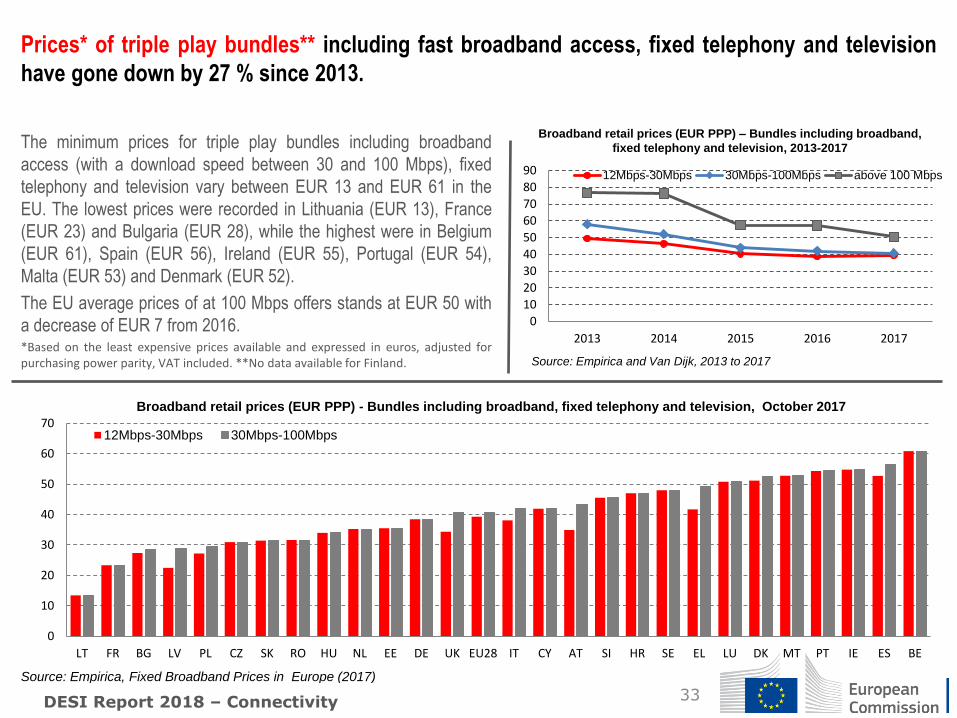
The minimum prices for triple play bundles including broadband
access (with a download speed between 30 and 100 Mbps), fixed
telephony and television vary between EUR 13 and EUR 61 in the
EU. The lowest prices were recorded in Lithuania (EUR 13), France
(EUR 23) and Bulgaria (EUR 28), while the highest were in Belgium
(EUR 61), Spain (EUR 56), Ireland (EUR 55), Portugal (EUR 54),
Malta (EUR 53) and Denmark (EUR 52).
The EU average prices of at 100 Mbps offers stands at EUR 50 with
a decrease of EUR 7 from 2016. *Based on the least expensive prices available and expressed in euros, adjusted for purchasing power parity, VAT included. **No data available for Finland.
Prices* of triple play bundles** including fast broadband access, fixed telephony and television
have gone down by 27 % since 2013.
DESI Report 2018 – Connectivity
0
10
20
30
40
50
60
70
LT FR BG LV PL CZ SK RO HU NL EE DE UK EU28 IT CY AT SI HR SE EL LU DK MT PT IE ES BE
12Mbps-30Mbps 30Mbps-100Mbps
Broadband retail prices (EUR PPP) - Bundles including broadband, fixed telephony and television, October 2017
Source: Empirica, Fixed Broadband Prices in Europe (2017)
0
10
20
30
40
50
60
70
80
90
2013 2014 2015 2016 2017
12Mbps-30Mbps 30Mbps-100Mbps above 100 Mbps
Broadband retail prices (EUR PPP) – Bundles including broadband,
fixed telephony and television, 2013-2017
Source: Empirica and Van Dijk, 2013 to 2017
34
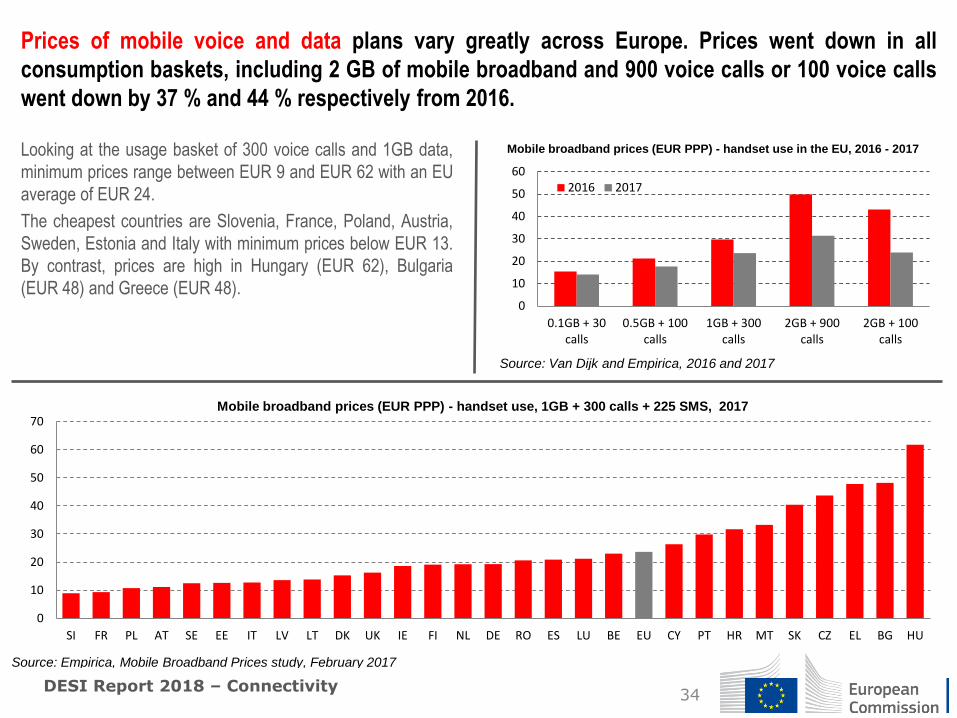
Looking at the usage basket of 300 voice calls and 1GB data,
minimum prices range between EUR 9 and EUR 62 with an EU
average of EUR 24.
The cheapest countries are Slovenia, France, Poland, Austria,
Sweden, Estonia and Italy with minimum prices below EUR 13.
By contrast, prices are high in Hungary (EUR 62), Bulgaria
(EUR 48) and Greece (EUR 48).
Prices of mobile voice and data plans vary greatly across Europe. Prices went down in all
consumption baskets, including 2 GB of mobile broadband and 900 voice calls or 100 voice calls
went down by 37 % and 44 % respectively from 2016.
DESI Report 2018 – Connectivity
0
10
20
30
40
50
60
0.1GB + 30calls
0.5GB + 100calls
1GB + 300calls
2GB + 900calls
2GB + 100calls
2016 2017
Mobile broadband prices (EUR PPP) - handset use in the EU, 2016 - 2017
Source: Van Dijk and Empirica, 2016 and 2017
0
10
20
30
40
50
60
70
SI FR PL AT SE EE IT LV LT DK UK IE FI NL DE RO ES LU BE EU CY PT HR MT SK CZ EL BG HU
Mobile broadband prices (EUR PPP) - handset use, 1GB + 300 calls + 225 SMS, 2017
Source: Empirica, Mobile Broadband Prices study, February 2017
35
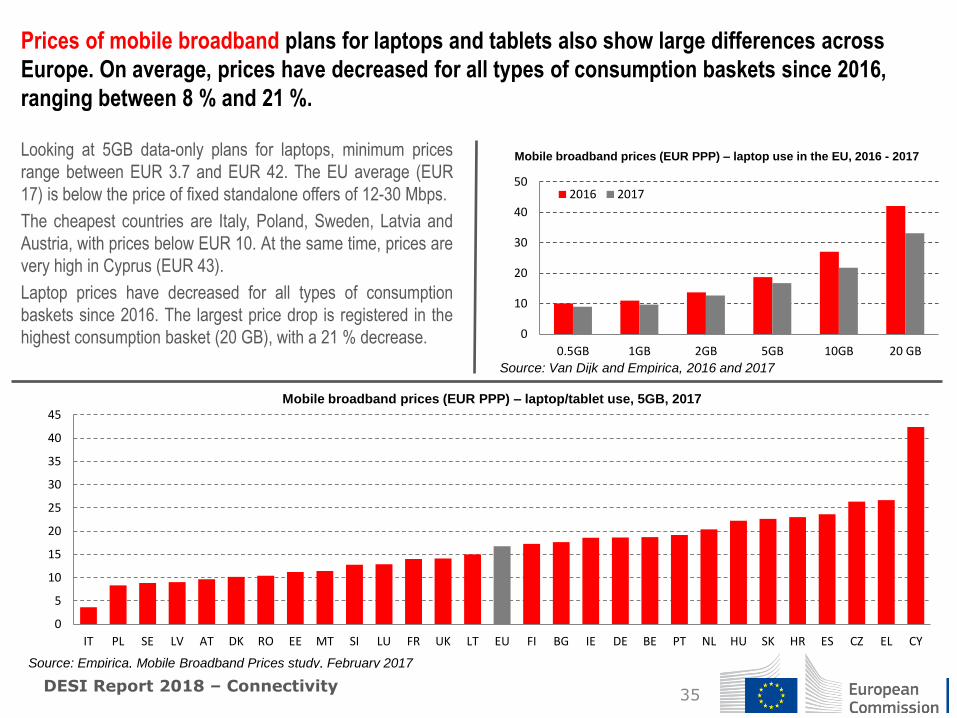
Looking at 5GB data-only plans for laptops, minimum prices
range between EUR 3.7 and EUR 42. The EU average (EUR
17) is below the price of fixed standalone offers of 12-30 Mbps.
The cheapest countries are Italy, Poland, Sweden, Latvia and
Austria, with prices below EUR 10. At the same time, prices are
very high in Cyprus (EUR 43).
Laptop prices have decreased for all types of consumption
baskets since 2016. The largest price drop is registered in the
highest consumption basket (20 GB), with a 21 % decrease.
Prices of mobile broadband plans for laptops and tablets also show large differences across
Europe. On average, prices have decreased for all types of consumption baskets since 2016,
ranging between 8 % and 21 %.
DESI Report 2018 – Connectivity
0
5
10
15
20
25
30
35
40
45
IT PL SE LV AT DK RO EE MT SI LU FR UK LT EU FI BG IE DE BE PT NL HU SK HR ES CZ EL CY
Mobile broadband prices (EUR PPP) – laptop/tablet use, 5GB, 2017
Source: Empirica, Mobile Broadband Prices study, February 2017
0
10
20
30
40
50
0.5GB 1GB 2GB 5GB 10GB 20 GB
2016 2017
Mobile broadband prices (EUR PPP) – laptop use in the EU, 2016 - 2017
Source: Van Dijk and Empirica, 2016 and 2017
DESI Report 2018 – Connectivity 36
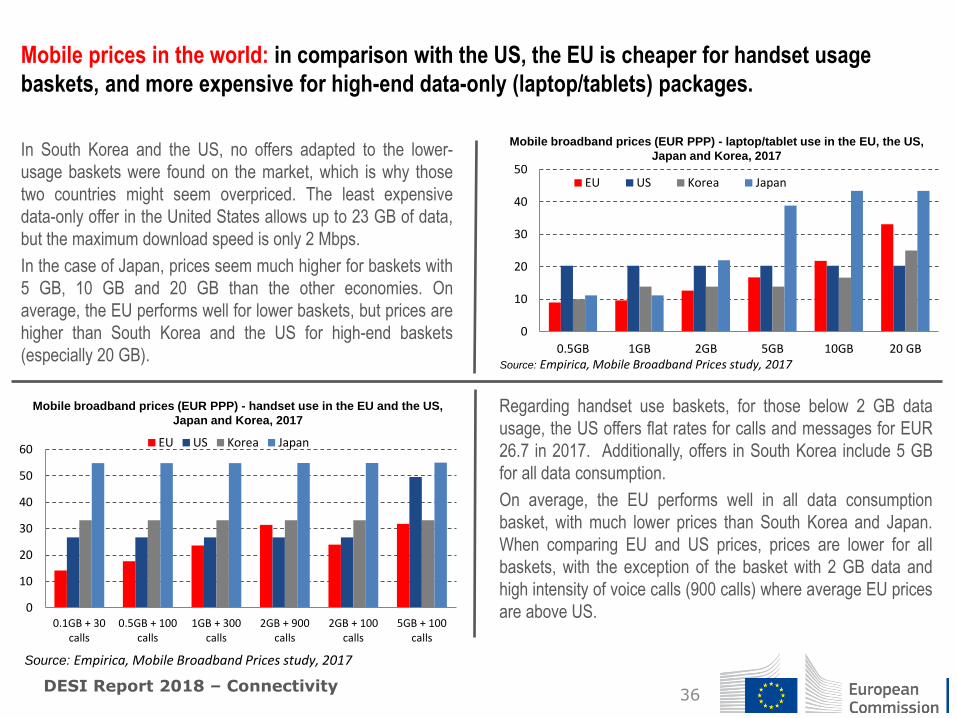
Regarding handset use baskets, for those below 2 GB data
usage, the US offers flat rates for calls and messages for EUR
26.7 in 2017. Additionally, offers in South Korea include 5 GB
for all data consumption.
On average, the EU performs well in all data consumption
basket, with much lower prices than South Korea and Japan.
When comparing EU and US prices, prices are lower for all
baskets, with the exception of the basket with 2 GB data and
high intensity of voice calls (900 calls) where average EU prices
are above US.
In South Korea and the US, no offers adapted to the lower-
usage baskets were found on the market, which is why those
two countries might seem overpriced. The least expensive
data-only offer in the United States allows up to 23 GB of data,
but the maximum download speed is only 2 Mbps.
In the case of Japan, prices seem much higher for baskets with
5 GB, 10 GB and 20 GB than the other economies. On
average, the EU performs well for lower baskets, but prices are
higher than South Korea and the US for high-end baskets
(especially 20 GB).
Mobile prices in the world: in comparison with the US, the EU is cheaper for handset usage
baskets, and more expensive for high-end data-only (laptop/tablets) packages.
0
10
20
30
40
50
60
0.1GB + 30calls
0.5GB + 100calls
1GB + 300calls
2GB + 900calls
2GB + 100calls
5GB + 100calls
EU US Korea Japan
Mobile broadband prices (EUR PPP) - handset use in the EU and the US,
Japan and Korea, 2017
Source: Empirica, Mobile Broadband Prices study, 2017
0
10
20
30
40
50
0.5GB 1GB 2GB 5GB 10GB 20 GB
EU US Korea Japan
Mobile broadband prices (EUR PPP) - laptop/tablet use in the EU, the US,
Japan and Korea, 2017
Source: Empirica, Mobile Broadband Prices study, 2017
Telecoms markets: General trends
37
Under the connectivity objectives for the European
gigabit society, by 2025 all European households need to
have access to at least 100 Mbps connectivity (upgradable
to Gbps). In addition, gigabit connectivity should be available
for all main socioeconomic drivers and all urban areas, while
major terrestrial transport paths should have uninterrupted
5G coverage.
In many Member States the deployment of fibre networks
(FTTH/B) has increased. This is inter alia due to the
supporting regulatory measures (e.g. access to ducts), as
well as co-investment agreements, commercial wholesale
access agreements and mobile network sharing
agreements. Very often, however, FTTB/FTTH is almost
exclusively deployed in urban areas and in business parks.
As regards take-up of very high speed networks (over 100
Mbps), there has often been a difficult early period in most
areas where unfamiliar new access services are deployed,
before demand picks up.
Most Member States have national broadband plans in
place that focus (among other things) on reaching minimum
download speeds. Some Member States have adjusted their
plans to reflect the gigabit objectives.
Many Member States have either: (i) publicly consulted
on 5G-related challenges (e.g. conditions for 5G roll-out,
new use cases, technologies and services, new bands)
when setting up a national strategy; (ii) have already
published a national plan or strategy; or (iii) at least
entered such plan or strategy in their government
programmes. A few Member States have earmarked
investments to promote the development of 5G. Many
operators have started or announced 5G trials.
Effective and impartial governance of telecoms
markets is crucial in fast-changing markets. Still, in some
Member States concerns have arisen about the national
regulatory authority’s independence and regulatory
capacity. Both should be ensured and must not be
undermined.
The trend towards offering bundled services and fixed-
mobile convergence continues and in many Member
States has even increased significantly. Offers consisting
of two or three services are the most frequent bundles.
Often it is difficult for new customers to obtain services
as a single offer. Moreover, access to (premium) content
has become a clear competitive advantage in many
markets.
DESI Report 2018 – Connectivity
More EU-harmonised spectrum underpins future spectrum needs within the EU, while assignment
varies between national markets (1/2).
38
Following the adoption of Commission Implementing
Decision (EU) 2016/687 harmonising the 700 MHz band, the
total amount of spectrum harmonised at EU level for
wireless broadband use amounts to 1 090 MHz.
Member States are required to authorise the 700 MHz band
by 2020, unless there are justified reasons for delaying it
until mid-2022 at the latest. The authorisation process has
already been completed in three Member States (Finland,
France and Germany).
All Member States but one have met the first milestone set
out in the Decision, which is to finalise cross-border
coordination with other Member States by 31 December
2017. This is a major success for roadmap-based migration
across Europe, which is embedded in EU legislation with a
binding end date for assignment.
* A limited list of justified reasons is set out in the Annex to the
Decision of the European Parliament and the Council on the use of the
470-790 MHz band in the Union.
DESI Report 2018 – Connectivity
The 800 MHz band (the ‘digital dividend’) is currently assigned (in two cases not entirely) in 26 Member States, 11 of which had been granted a derogation from the original deadline under Article 6(4) of the Radio Spectrum Policy Programme (RSPP). Two Member States have not yet assigned and/or made available the 800 MHz band: while Malta resumed the assignment process after the withdrawal of a proposed merger between two of the three mobile operators, Bulgaria still invokes the exception under Article 1(3) RSPP due to incumbent military use.
Moreover, with a view to reaching the target of 1 200 MHz harmonised for wireless broadband set by the RSPP, the Commission is working on the possible extension of the 1.5 GHz band to provide additional download capacity for 5G services representing an additional 50 MHz**.
** The adoption of a harmonisation decision on the 1.5 GHz extension bands is ongoing at the time of writing. Once such Commission Implementing Decision will enter into force, the total amount of spectrum harmonised for wireless broadband will go up to 1140 MHz.
39
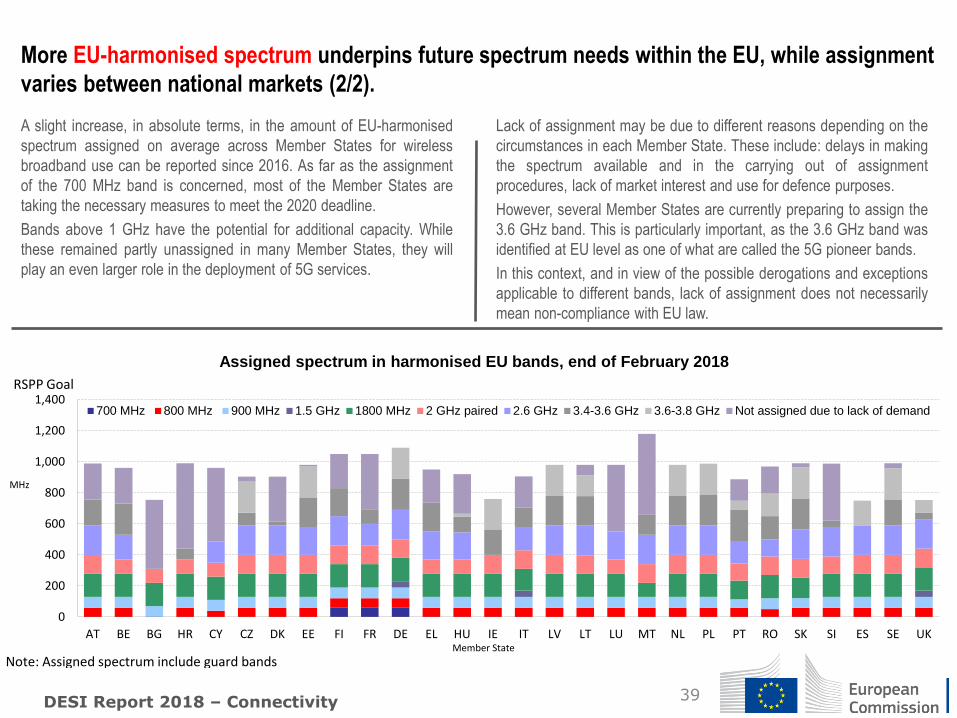
A slight increase, in absolute terms, in the amount of EU-harmonised
spectrum assigned on average across Member States for wireless
broadband use can be reported since 2016. As far as the assignment
of the 700 MHz band is concerned, most of the Member States are
taking the necessary measures to meet the 2020 deadline.
Bands above 1 GHz have the potential for additional capacity. While
these remained partly unassigned in many Member States, they will
play an even larger role in the deployment of 5G services.
More EU-harmonised spectrum underpins future spectrum needs within the EU, while assignment
varies between national markets (2/2).
Lack of assignment may be due to different reasons depending on the
circumstances in each Member State. These include: delays in making
the spectrum available and in the carrying out of assignment
procedures, lack of market interest and use for defence purposes.
However, several Member States are currently preparing to assign the
3.6 GHz band. This is particularly important, as the 3.6 GHz band was
identified at EU level as one of what are called the 5G pioneer bands.
In this context, and in view of the possible derogations and exceptions
applicable to different bands, lack of assignment does not necessarily
mean non-compliance with EU law.
DESI Report 2018 – Connectivity
0
200
400
600
800
1,000
1,200
1,400
AT BE BG HR CY CZ DK EE FI FR DE EL HU IE IT LV LT LU MT NL PL PT RO SK SI ES SE UK
700 MHz 800 MHz 900 MHz 1.5 GHz 1800 MHz 2 GHz paired 2.6 GHz 3.4-3.6 GHz 3.6-3.8 GHz Not assigned due to lack of demand
Assigned spectrum in harmonised EU bands, end of February 2018
MHz
RSPP Goal
Note: Assigned spectrum include guard bands Member State
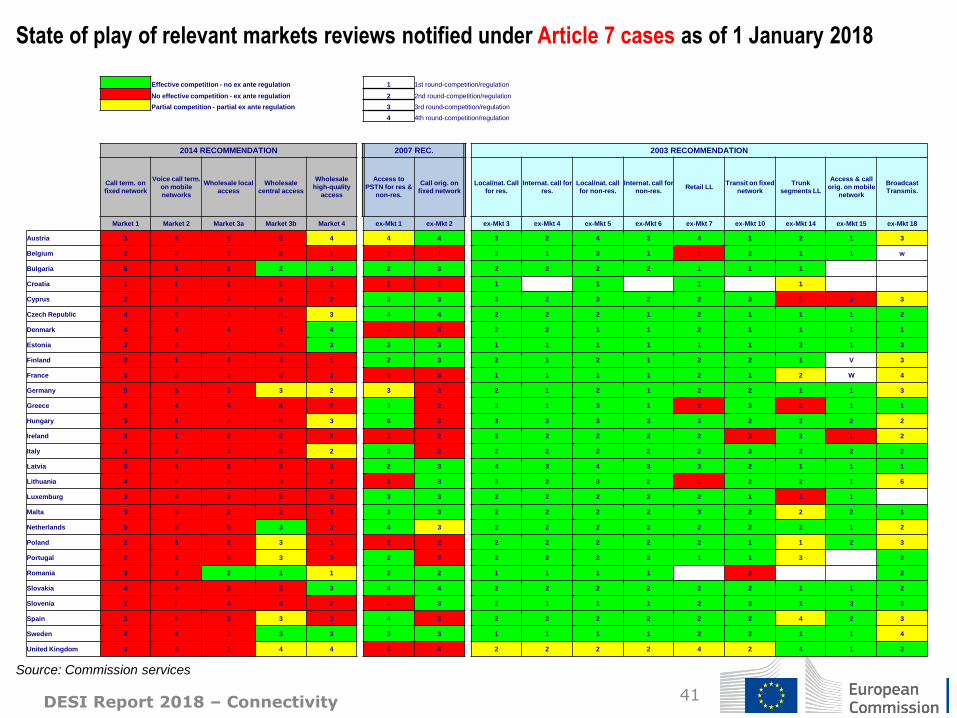
The Commission has sent warnings to several Member States not carrying out the analysis of
the relevant telecom markets on time.
40
National regulatory authorities must carry out an
analysis of telecom markets susceptible to regulation
every 3 years (Article 16(6)(a) of the Framework
Directive).
As markets evolve and competition develops,
regulatory remedies imposed in the past need to be
adjusted or even removed to adapt to the developing
market conditions.
In the European Electronic Communications Code,
the Commission has proposed to extend the market
review cycle to 5 years (instead of 3) to achieve a
better balance between adequacy and
appropriateness of regulation — on the one hand —
and the legal certainty and stability of regulation —
on the other.
DESI Report 2018 – Connectivity
In October 2017, the Commission sent letters of
formal notice to seven Member States where the
delays were even over 5 years: the countries
concerned were Belgium, Spain, Ireland, Hungary,
Slovenia, Poland and Romania*.
The markets in question include not only key
broadband markets as listed in the 2014
Recommendation on relevant markets for the
purpose of ex ante regulation in the electronic
communications sector but also ‘older’ markets
removed from the list and which are still regulated in
some Member States on the basis of very outdated
market analyses.
* Spain and Slovenia have notified the corresponding market
reviews in early 2018.
41 DESI Report 2018 – Connectivity
State of play of relevant markets reviews notified under Article 7 cases as of 1 January 2018
Source: Commission services
Effective competition - no ex ante regulation 1 1st round-competition/regulation
No effective competition - ex ante regulation 2 2nd round-competition/regulation
Partial competition - partial ex ante regulation 3 3rd round-competition/regulation
4 4th round-competition/regulation
2014 RECOMMENDATION 2007 REC. 2003 RECOMMENDATION
Call term. on
fixed network
Voice call term.
on mobile
networks
Wholesale local
access
Wholesale
central access
Wholesale
high-quality
access
Access to
PSTN for res &
non-res.
Call orig. on
fixed network
Local/nat. Call
for res.
Internat. call for
res.
Local/nat. call
for non-res.
Internat. call for
non-res. Retail LL
Transit on fixed
network
Trunk
segments LL
Access & call
orig. on mobile
network
Broadcast
Transmis.
Market 1 Market 2 Market 3a Market 3b Market 4 ex-Mkt 1 ex-Mkt 2 ex-Mkt 3 ex-Mkt 4 ex-Mkt 5 ex-Mkt 6 ex-Mkt 7 ex-Mkt 10 ex-Mkt 14 ex-Mkt 15 ex-Mkt 18
Austria 3 4 5 5 4 4 4 3 2 4 3 4 1 2 1 3
Belgium 2 3 2 2 1 2 1 3 1 3 1 1 2 1 1 w
Bulgaria 5 3 2 2 3 2 3 2 2 2 2 1 1 1
Croatia 1 1 1 1 1 1 1 1 1 1 1
Cyprus 2 3 4 4 2 3 3 3 2 3 2 2 3 2 3 3
Czech Republic 4 4 4 4 3 4 4 2 2 2 1 2 1 1 1 2
Denmark 4 4 4 4 4 3 3 2 2 1 1 2 1 1 1 1
Estonia 3 4 4 4 3 3 3 1 1 1 1 1 1 2 1 3
Finland 2 1 3 3 1 2 3 2 1 2 1 2 2 1 V 3
France 5 5 5 5 3 5 5 1 1 1 1 2 1 2 W 4
Germany 5 5 3 3 2 3 3 2 1 2 1 2 2 1 1 3
Greece 3 4 4 4 2 3 2 3 1 3 1 2 3 2 1 1
Hungary 3 5 4 4 3 6 3 3 3 3 3 3 2 2 2 2
Ireland 3 1 2 2 2 3 2 2 2 2 2 2 2 2 1 2
Italy 3 4 3 3 2 3 2 2 2 2 2 2 3 2 2 2
Latvia 5 4 3 3 3 2 3 4 3 4 3 3 2 1 1 1
Lithuania 4 3 3 3 2 1 3 3 2 3 2 1 2 2 1 6
Luxemburg 3 4 2 2 2 3 3 2 2 2 2 2 1 1 1
Malta 3 3 2 2 3 3 3 2 2 2 2 3 2 2 2 1
Netherlands 5 5 5 3 3 4 3 2 2 2 2 2 2 2 1 2
Poland 2 3 2 3 1 2 2 2 2 2 2 2 1 1 2 3
Portugal 2 2 3 3 3 2 2 2 2 2 2 1 1 3 2
Romania 3 3 2 1 1 2 2 1 1 1 1 2 2
Slovakia 4 4 3 3 3 4 4 2 2 2 2 2 2 1 1 2
Slovenia 2 5 4 4 2 3 3 2 1 1 1 2 3 1 3 3
Spain 3 4 3 3 3 4 3 2 2 2 2 2 2 4 2 3
Sweden 4 4 3 3 3 3 3 1 1 1 1 2 2 1 1 4
United Kingdom 3 4 2 4 4 5 4 2 2 2 2 4 2 4 1 2
Development of national broadband plans
42
Most Member States have gradually adopted national
broadband plans (NBPs) since the adoption of the
‘Digital Agenda for Europe’ (DAE) 2020 targets — i.e.
coverage of 30 Mbps download for all Europeans and
take-up of 100 Mbps subscriptions by at least 50 % of
European households. The plans are devised to
integrate all relevant aspects of an effective broadband
policy and resources, enabling policy makers and
public authorities to properly plan any necessary public
action in the telecommunications sector.
A large majority of Member States have started
implementing their NBPs, albeit covering various time
periods ranging from 2017 to 2022. Some NBPs are
integrated within broader strategic approaches, while others
are documents specifically dedicated to broadband
deployment. In some countries, there are multiple official
documents drafted by different national authorities,
specifying aspects related to such broadband developments.
In accordance with the connectivity objectives for the gigabit
society, by 2025 all European households, whether rural or
urban, need to have access to internet connectivity offering
a downlink of at least 100 Mbps (upgradable to Gbps). Only
very few NPBs have so far been adjusted to reflect those
objectives.
DESI Report 2018 – Connectivity
Content-wise, nearly all Member States’ NBPs focus on reaching minimum download speeds — in most cases in terms of coverage (availability of commercial offer on a given territory) and sometimes also penetration (actual take-up in the form of internet access subscriptions). In contrast, emphasis on upload data rates is rather exceptional (e.g. in Denmark, Luxembourg or Ireland). In addition, operational measures to foster demand for digital applications and high-speed internet access are relatively infrequent.
Notably, some Member States have held consultations on their draft NBPs. These include the Czech Republic (‘Digital Czech Republic’), France (‘National Programme for Very High Speed Broadband’) and Slovakia (‘National Strategy for Broadband Access in the Slovak Republic’)*.
Some Member States (e.g. Sweden, the UK, France, Spain, Germany and Austria) have already started to adapt the targets of their NBPs to the new EU broadband targets for 2025 proposed by the Commission in its September 2016 Communication "Connectivity for a Competitive Digital Single Market - Towards a European Gigabit Society".
* OECD countries which ran public consultation procedures before drafting their NBPs are: Canada (‘Improving Canada’s Digital Advantage’), Ireland (‘Next Generation Broadband’), Japan (‘Path of light’), and the US (‘Connecting America: The National Broadband Plan‘).
Broadband targets in national broadband plans
43
Although some NBPs do not have targets on
penetration/take-up or have set targets on other features
(e.g. upload speeds), the following general observations can
be made:
• 11 Member States have set more ambitious objectives
in their NBPs than the DAE-2020 targets (Austria,
Belgium, Bulgaria, Denmark, Estonia, Finland,
Germany, Hungary, Luxembourg, Slovenia and
Sweden);
• 14 Member States’ NBP objectives are convergent with
the DAE-2020 targets (Croatia, Cyprus, Czech
Republic, Greece, Ireland, Italy, Latvia, Lithuania,
Malta, Netherlands, Poland, Portugal, Slovakia and
Spain);
• 3 Member States have partly less ambitious objectives
in their NBPs than the DAE-2020 targets (France,
Romania and the UK) as regards at least one
parameter (e.g. speed, end date).
DESI Report 2018 – Connectivity
Declared broadband targets in NBPs are, first and
foremost, intended as a guide. Their practical feasibility
and actual success will depend on the use of appropriate
means including legal measures and financial resources.
Therefore, it is important that Member States have the
necessary resources and tools in place, rather than
merely policy targets, to facilitate the actual roll-out of
broadband infrastructure on their territories.
To facilitate the exchange of best practice between
Member States on adapting their NBPs to the gigabit
targets for 2025, in 2017 the Commission set up a
Communications Committee working group on 5G. The
working group should also identify common elements and
best practices which can potentially become part of the
revised NBPs.
44 DESI Report 2018 – Connectivity
Funding national broadband plans
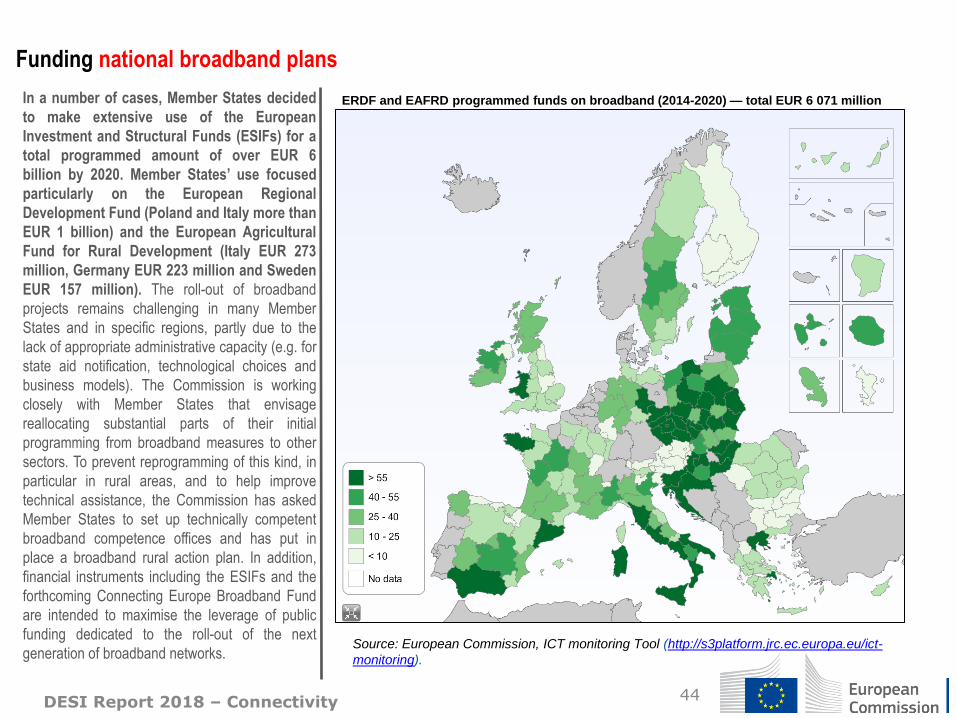
Source: European Commission, ICT monitoring Tool (http://s3platform.jrc.ec.europa.eu/ict-
monitoring).
ERDF and EAFRD programmed funds on broadband (2014-2020) — total EUR 6 071 million In a number of cases, Member States decided
to make extensive use of the European
Investment and Structural Funds (ESIFs) for a
total programmed amount of over EUR 6
billion by 2020. Member States’ use focused
particularly on the European Regional
Development Fund (Poland and Italy more than
EUR 1 billion) and the European Agricultural
Fund for Rural Development (Italy EUR 273
million, Germany EUR 223 million and Sweden
EUR 157 million). The roll-out of broadband
projects remains challenging in many Member
States and in specific regions, partly due to the
lack of appropriate administrative capacity (e.g. for
state aid notification, technological choices and
business models). The Commission is working
closely with Member States that envisage
reallocating substantial parts of their initial
programming from broadband measures to other
sectors. To prevent reprogramming of this kind, in
particular in rural areas, and to help improve
technical assistance, the Commission has asked
Member States to set up technically competent
broadband competence offices and has put in
place a broadband rural action plan. In addition,
financial instruments including the ESIFs and the
forthcoming Connecting Europe Broadband Fund
are intended to maximise the leverage of public
funding dedicated to the roll-out of the next
generation of broadband networks.
5G Observatory - progress towards 5G market introduction
45 DESI Report 2018 – Connectivity
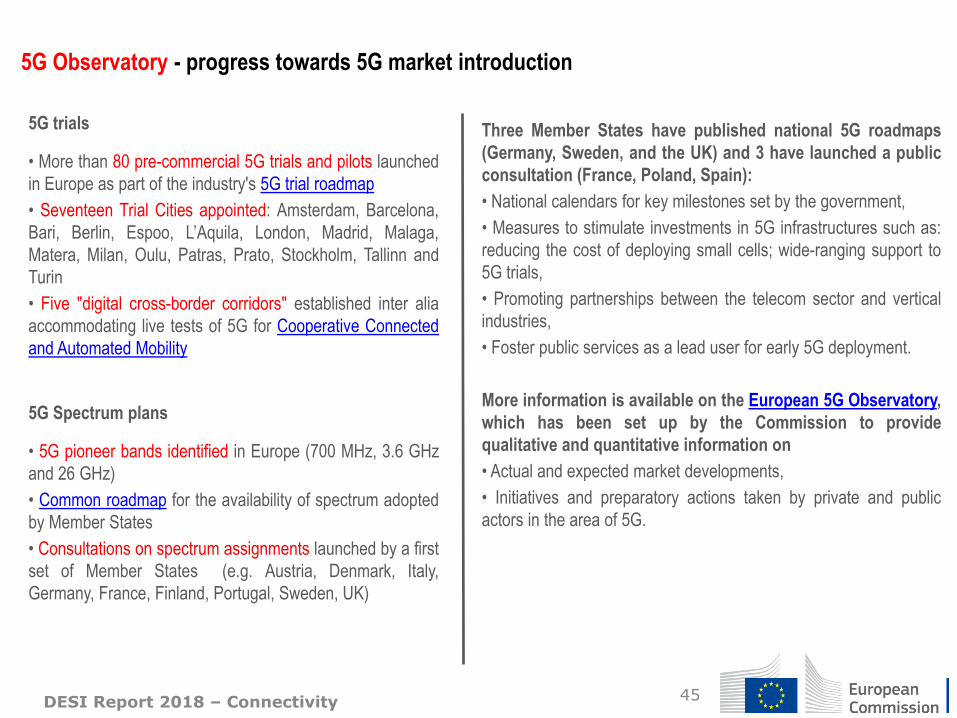
5G trials
• More than 80 pre-commercial 5G trials and pilots launched
in Europe as part of the industry's 5G trial roadmap
• Seventeen Trial Cities appointed: Amsterdam, Barcelona,
Bari, Berlin, Espoo, L’Aquila, London, Madrid, Malaga,
Matera, Milan, Oulu, Patras, Prato, Stockholm, Tallinn and
Turin
• Five "digital cross-border corridors" established inter alia
accommodating live tests of 5G for Cooperative Connected
and Automated Mobility
5G Spectrum plans
• 5G pioneer bands identified in Europe (700 MHz, 3.6 GHz
and 26 GHz)
• Common roadmap for the availability of spectrum adopted
by Member States
• Consultations on spectrum assignments launched by a first
set of Member States (e.g. Austria, Denmark, Italy,
Germany, France, Finland, Portugal, Sweden, UK)
Three Member States have published national 5G roadmaps
(Germany, Sweden, and the UK) and 3 have launched a public
consultation (France, Poland, Spain):
• National calendars for key milestones set by the government,
• Measures to stimulate investments in 5G infrastructures such as:
reducing the cost of deploying small cells; wide-ranging support to
5G trials,
• Promoting partnerships between the telecom sector and vertical
industries,
• Foster public services as a lead user for early 5G deployment.
More information is available on the European 5G Observatory,
which has been set up by the Commission to provide
qualitative and quantitative information on
• Actual and expected market developments,
• Initiatives and preparatory actions taken by private and public
actors in the area of 5G.
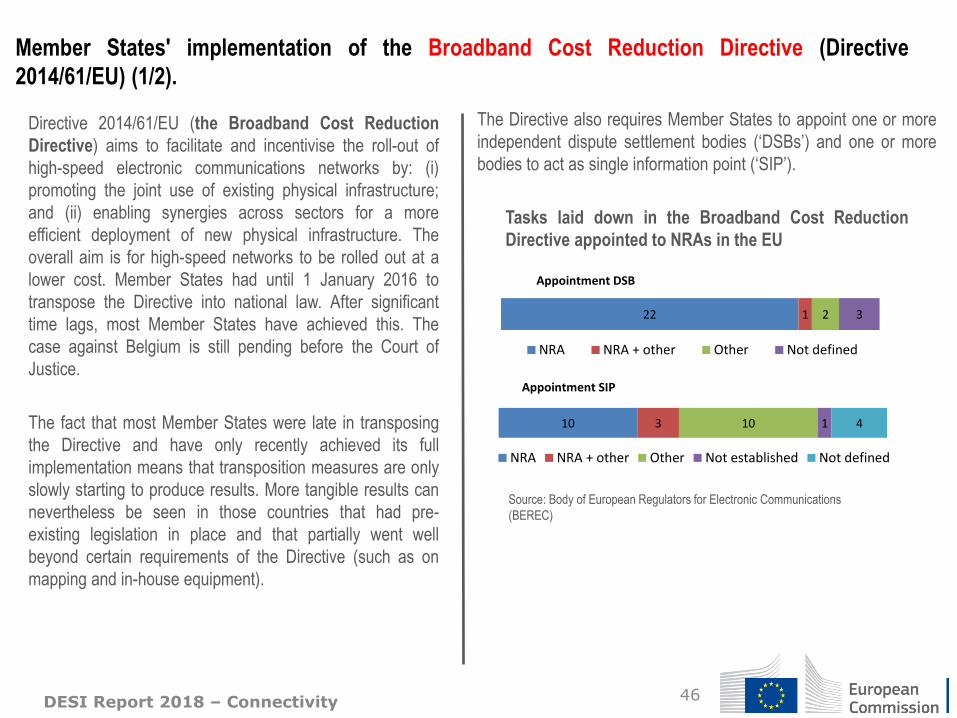
The Directive also requires Member States to appoint one or more
independent dispute settlement bodies (‘DSBs’) and one or more
bodies to act as single information point (‘SIP’).
Member States' implementation of the Broadband Cost Reduction Directive (Directive
2014/61/EU) (1/2).
46 DESI Report 2018 – Connectivity
Directive 2014/61/EU (the Broadband Cost Reduction
Directive) aims to facilitate and incentivise the roll-out of
high-speed electronic communications networks by: (i)
promoting the joint use of existing physical infrastructure;
and (ii) enabling synergies across sectors for a more
efficient deployment of new physical infrastructure. The
overall aim is for high-speed networks to be rolled out at a
lower cost. Member States had until 1 January 2016 to
transpose the Directive into national law. After significant
time lags, most Member States have achieved this. The
case against Belgium is still pending before the Court of
Justice.
The fact that most Member States were late in transposing
the Directive and have only recently achieved its full
implementation means that transposition measures are only
slowly starting to produce results. More tangible results can
nevertheless be seen in those countries that had pre-
existing legislation in place and that partially went well
beyond certain requirements of the Directive (such as on
mapping and in-house equipment).
22 1 2 3
Appointment DSB
NRA NRA + other Other Not defined
10 3 10 1 4
Appointment SIP
NRA NRA + other Other Not established Not defined
Source: Body of European Regulators for Electronic Communications
(BEREC)
Tasks laid down in the Broadband Cost Reduction
Directive appointed to NRAs in the EU
Member States' implementation of the Broadband Cost Reduction Directive (Directive
2014/61/EU) (2/2).
47 DESI Report 2018 – Connectivity
The tasks of the single information point were allocated to
the NRA (or partially to the NRA) in 14 Member States. In 10
Member States other organisations are in charge of
performing this function: in most cases this is a ministry.
The Directive provides for the possibility to require all public-
sector bodies to make minimum information they are holding
on existing physical infrastructure available via the SIP.
Several Member States have imposed such an obligation on
public-sector bodies and some Member States have also
obliged other organisations, for instance network operators,
to make available information via the SIP.
The main challenges NRAs were faced with as SIP relate to
collecting the data and the information which has to be
provided, and on how to incentivise those who have to
provide information to meet this obligation.
Long delays in permit granting, in particular for mobile
network roll-out, also still pose a challenge in many Member
States.
The tasks of the dispute settlement body were allocated
to the national regulatory authority or partially to the NRA
in most of the Member States and to other organisations
only in two Member States.
In several countries, the NRA already had tasks to fulfil as
DSB before the entry into force of the Broadband Cost
Reduction Directive. An increase in the number of
disputes can be observed since the application of the
Directive. The most important challenges the NRAs have
faced as DSB so far relate to: (i) setting the price for
access to existing physical infrastructure; (ii) the
appropriation of costs for coordination of civil works and:
(iii) (un)justified refusal of access to existing physical
infrastructure.
In several Member States, NRAs have also started
developing rules or guidelines on dispute settlement (e.g.
the process the NRA is likely to follow in resolving
disputes). These may enhance legal certainty and
overcome the general reluctance of the stakeholders
involved.
Widespread use of roam like at home across Member States since 15 June 2017 (1/2).
48
Since 15 June 2017, mobile operators in the EU/EEA are not
allowed to levy any roaming surcharges for any fair usage of
roaming services by their customers (‘roam like at home’,
RLAH), except in a few cases duly authorised by national
regulators to avoid any increase in domestic prices (see
below on sustainability derogations).
We observe broadly successful implementation of the new
roaming rules, overall consumer satisfaction and a
considerable rise in travellers’ roaming data consumption, as
well as substantial increases in roaming voice calls since 15
June 2017. According to the last BEREC International
Roaming Benchmark Report, despite the introduction of
RLAH, the average retail revenue per user slightly increased
in most Member States in Q3 2017 (first RLAH quarter)
compared to Q2 2017.
NRAs have the responsibility to monitor and enforce EU
roaming rules in the Member States. It is therefore
necessary that all Member States have equipped them with
the appropriate powers to penalise non-compliance with the
rules.
According to the last BEREC International Roaming Benchmark
Report, more than 95 % of EU/EEA subscribers are roaming-
enabled. Almost 90 % of them benefit from RLAH. Less than 9
% are on an alternative roaming tariffs.
Sustainability derogations have been granted by national
regulators to operators falling in categories which were
foreseen to be likely candidates for the derogation, i.e. some
mobile virtual network operators in several Member States and
some mobile network operators in some of the very low-data-
price Member States with high roaming imbalances and/or low
revenues per user (Estonia, Lithuania, Finland). Even in the
latter countries, more than 70 % of subscribers benefit from
RLAH. In total, less than 2 % of EU/EEA subscribers are
subject to a small roaming surcharge due to a derogation
(RLAH+).
According to the last BEREC International Roaming Benchmark
Report, on average in the EU/EEA roaming traffic was
multiplied by 5.3 and 2.4 respectively for data and voice in Q3
2017 compared to Q3 2016. The increase in outbound roaming
traffic was particularly high for operators in Poland, Romania,
Latvia, Bulgaria, Croatia and Slovenia.
DESI Report 2018 – Connectivity
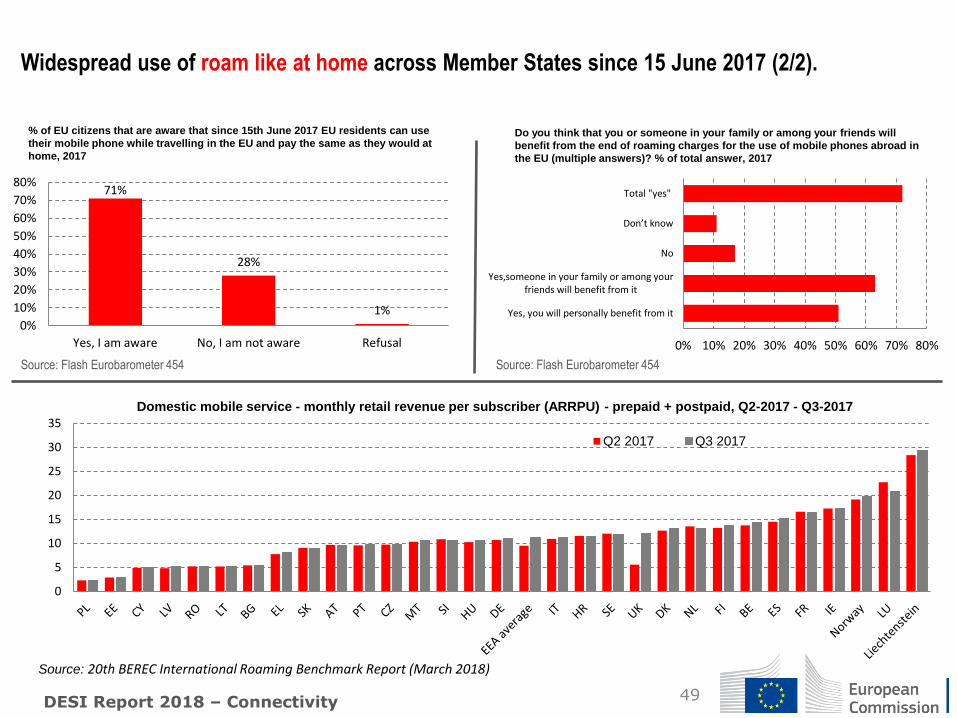
49
Widespread use of roam like at home across Member States since 15 June 2017 (2/2).
DESI Report 2018 – Connectivity
0% 10% 20% 30% 40% 50% 60% 70% 80%
Yes, you will personally benefit from it
Yes,someone in your family or among yourfriends will benefit from it
No
Don’t know
Total "yes"
Do you think that you or someone in your family or among your friends will
benefit from the end of roaming charges for the use of mobile phones abroad in
the EU (multiple answers)? % of total answer, 2017
Source: Flash Eurobarometer 454
71%
28%
1% 0%
10%
20%
30%
40%
50%
60%
70%
80%
Yes, I am aware No, I am not aware Refusal
% of EU citizens that are aware that since 15th June 2017 EU residents can use
their mobile phone while travelling in the EU and pay the same as they would at
home, 2017
Source: Flash Eurobarometer 454
0
5
10
15
20
25
30
35
Q2 2017 Q3 2017
Domestic mobile service - monthly retail revenue per subscriber (ARRPU) - prepaid + postpaid, Q2-2017 - Q3-2017
Source: 20th BEREC International Roaming Benchmark Report (March 2018)
Member States’ implementation of the net neutrality rules (Regulation (EU) 2015/2120)
(1/2).
50 DESI Report 2018 – Connectivity
The business models on zero-rating services adopted by
many EU operators have been generally open, without
discriminating between specific content providers in a given
category.
Other practices relevant from a net neutrality perspective
were also identified: blocking of ports, availability of private
IP addresses, video on demand as a specialised service,
altering/routing of traffic, different treatment of traffic, use of
deep packet inspection, free choice of modems and
interruption of IP connections.
Net neutrality annual Reports
Under Article 5 of Regulation (EU) 2015/2120 national
regulatory authorities are required to publish annual reports
on their monitoring and findings and to share these reports
with the Commission. The annual country reports on open
internet from national regulators covering 2017 are available
at:
https://ec.europa.eu/digital-single-market/en/news/annual-
country-reports-open-internet-national-regulators-2017
Under the EU net neutrality rules, Europeans must have
access to the online content and services they wish,
regardless of where this content originates from or is
stored. These rights are established by directly applicable
EU legislation and cannot be changed by mere
administrative decision.
Specific BEREC guidelines and close cooperation
between NRAs, BEREC and the Commission contribute
to a consistent application of the rules throughout the EU.
Net neutrality issues
Many NRAs have started to analyse individual commercial
offers emerging on the market on a case-by-case basis.
Several NRAs launched investigations regarding zero-
rating services and assessed them according to the
BEREC guidelines. Some NRAs (e.g. in Germany,
Hungary, Italy, Sweden, [Portugal]) found that the
investigated zero-rating practice was in breach of
Regulation 2015/2120, because it was accompanied by
unlawful traffic management practices.
Several NRAs (e.g. in Belgium, Estonia and Latvia) found
that the investigated zero-rating practice was compliant
with the Regulation.
51 DESI Report 2018 – Connectivity
Transparency measures
Several NRAs have adopted measures on the transparency
obligations set out in the Regulation (for example: in
Germany, Hungary and Lithuania)
The EETT in Greece is currently preparing a decision with
more specific requirements for the implementation of
Regulation (EU) 2015/2120. The decision will include
requirements on the estimation of speeds, zero-rating and
information transparency.
ANACOM in Portugal is considering preparing in 2018 some
recommendations or communications to operators in order
to support or improve implementation of the transparency
measures in Article 4.
Net neutrality penalties
Article 6 of Regulation (EU) 2015/2120 stipulates that
‘Member States shall lay down the rules on penalties
applicable to infringements of Articles 3, 4 and 5’. The
deadline to notify the Commission of these rules and
measures was 30 April 2016.
By mid-February 2018 the Commission had received
notifications in this regard from 22 Member States.
Penalties are in place in another three Member States
(Croatia, Czech Republic, Italy), but these were not
notified to the Commission.
In three Member States (Austria, Ireland and Portugal)
there are as yet no penalties related to net neutrality.
Sanctioning power of NRAs
Most NRAs (e.g. in Belgium, Germany, Denmark, Finland,
France, Greece, Hungary, Italy, Luxembourg, Latvia,
Malta, Poland, Slovenia, Sweden, Slovakia and the UK)
can impose such fines and penalty payments directly.
There are only a few exceptions (e.g. Ireland).
Member States’ implementation of the net neutrality rules (Regulation (EU) 2015/2120)
(2/2).
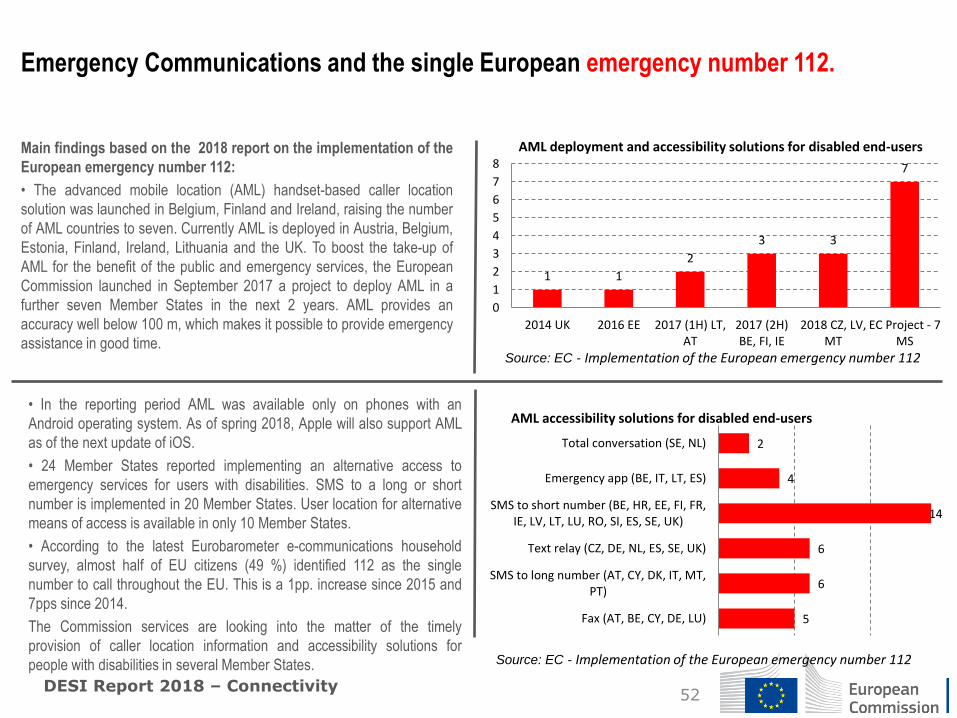
Emergency Communications and the single European emergency number 112.
DESI Report 2018 – Connectivity 52
• In the reporting period AML was available only on phones with an
Android operating system. As of spring 2018, Apple will also support AML
as of the next update of iOS.
• 24 Member States reported implementing an alternative access to
emergency services for users with disabilities. SMS to a long or short
number is implemented in 20 Member States. User location for alternative
means of access is available in only 10 Member States.
• According to the latest Eurobarometer e-communications household
survey, almost half of EU citizens (49 %) identified 112 as the single
number to call throughout the EU. This is a 1pp. increase since 2015 and
7pps since 2014.
The Commission services are looking into the matter of the timely
provision of caller location information and accessibility solutions for
people with disabilities in several Member States.
Main findings based on the 2018 report on the implementation of the
European emergency number 112:
• The advanced mobile location (AML) handset-based caller location
solution was launched in Belgium, Finland and Ireland, raising the number
of AML countries to seven. Currently AML is deployed in Austria, Belgium,
Estonia, Finland, Ireland, Lithuania and the UK. To boost the take-up of
AML for the benefit of the public and emergency services, the European
Commission launched in September 2017 a project to deploy AML in a
further seven Member States in the next 2 years. AML provides an
accuracy well below 100 m, which makes it possible to provide emergency
assistance in good time.
1 1
2
3 3
7
0
1
2
3
4
5
6
7
8
2014 UK 2016 EE 2017 (1H) LT,AT
2017 (2H)BE, FI, IE
2018 CZ, LV,MT
EC Project - 7MS
AML deployment and accessibility solutions for disabled end-users
Source: EC - Implementation of the European emergency number 112
5
6
6
14
4
2
Fax (AT, BE, CY, DE, LU)
SMS to long number (AT, CY, DK, IT, MT,PT)
Text relay (CZ, DE, NL, ES, SE, UK)
SMS to short number (BE, HR, EE, FI, FR,IE, LV, LT, LU, RO, SI, ES, SE, UK)
Emergency app (BE, IT, LT, ES)
Total conversation (SE, NL)
Source: EC - Implementation of the European emergency number 112
AML accessibility solutions for disabled end-users


![Product and Process Evaluation of Handwriting Difficultiesimg2.timg.co.il/CommunaFiles/30227613.pdf · 2008. 8. 4. · Educational Psychology Review [jepr] pp686-edpr-455577 November](https://img.pdfslide.us/doc/110x75/5fff463e853d8c20ca74acce/product-and-process-evaluation-of-handwriting-2008-8-4-educational-psychology.jpg)


![Review of Graph Comprehension Research: Implications …nschwartz/Shah, Hoeffner - 2002... · P1: FYJ Educational Psychology Review [jepr] pp317-edpr-363437 November 15, 2001 12:4](https://img.pdfslide.us/doc/110x75/5b7bae597f8b9a184a8d164a/review-of-graph-comprehension-research-implications-nschwartzshah-hoeffner-.jpg)