Embed Size (px)
Citation preview

Edita: Universidad de Extremadura Servicio de Publicaciones Caldereros 2. Planta 3ª Cáceres 10071 Correo e.: [email protected] http://www.unex.es/publicaciones
D. Ramón Cava López, Doctor en Veterinaria y Profesor Titular del Área de Tecnología de los Alimentos de la Facultad de Veterinaria de la Universidad de Extremadura INFORMA que la Tesis Doctoral titulada “Evaluación De La Calidad Y Aptitud Tecnológica De La Carne Y Productos Curados De Cerdos Ibéricos Procedentes De Distintos Cruces Con Líneas Genéticas De Cerdo Duroc” presentado por la Licenciada Dña María Rosario Ramírez Bernabé, ha sido realizado bajo mi dirección en la Unidad de Tecnología de los Alimentos de la Facultad de Veterinaria. Hallándose concluido y reuniendo a mi entender las condiciones necesarias, autorizo su presentación para su defensa ante el tribunal que ha de juzgarlo. En Cáceres 23 de Octubre de 2006 Fdo.: Dr. Ramón Cava López
FACULTAD DE VETERINARIA Tecnología de los Alimentos Dr. Ramón Cava López Campus Universitario Avda. Universidad s/n E-10071-CÁCERES Teléfono: 927 257169 Fax: 927 257110 e-mail: [email protected]


Ahora, cuando se contempla con satisfacción el final del trabajo realizado, creo que es
el momento de mostrar mi agradecimiento a muchas personas e instituciones que de forma
directa o indirecta han contribuido a que esta Tesis Doctoral haya finalizado.
A Ramón Cava, director de esta Tesis, por haberle dedicado tantísimo esfuerzo a este
trabajo y porque gracias a él ha empezado a apasionarme la investigación.
A mis compañeros de las Unidades de Tecnología e Higiene de los Alimentos,
especialmente a David Morcuende. También, a Inma Linares, por su trabajo en el laboratorio
en los primeros meses; a Luis Ladero, por estar siempre dispuesto a ayudar; a Mario Estévez,
por su colaboración al principio de la Tesis y a Mª Jesús Andrade, a Sonia Ventanas y Diana
Martín. Además, quisiera agradecer a Ana Galaz y a Ángela Jurado su apoyo durante este final
de Tesis.
A José Manuel Fuentes y al resto del Departamento de Bioquímica de la Facultad de
Enfermería, porque guardo un grato recuerdo del tiempo en que realicé las determinaciones
enzimáticas en vuestro laboratorio.
A Sergio Sánchez, por ser una persona íntegra y un amigo de los que perduran a pesar
del tiempo.
A mis amigas de Almendralejo y a mis amigos “de México”, porque siempre han sabido
darme buenos consejos.
Y por supuesto, a mi familia y a Moisés, porque ellos son lo primero en mi vida y mi
principal apoyo.
A la Universidad de Extremadura y al Ministerio de Educación y Ciencia por
proporcionarme el soporte económico para el desarrollo de este trabajo.
A las empresas VIDOSA donde se sacrificaron los animales y a JAIBESA, donde se
curaron los productos cárnicos estudiados; al CENSYRA, por su participación en este proyecto.
Finally, I would like to thank all people of the Division of Meat Science of the Swedish
University of Agricultural Science, in Uppsala (Sweden) for their collaboration during my staying
in their centre, especially, Kerstin Lundström, the head of the Division; Jana Pickova (you
cannot imagine how much I learned from you); Sabine Sampels because without you, my
staying in Sweden would have been very different, and Sophie Fredriksson, for her helpful
attitude every time, and to Nùria Panella, because we spent a very nice time together.


A mis padres, a mi hermana.


INDEX
page GENERAL ABSTRACT 3 INTRODUCTION 7 1. - Economical importance of pork production and Iberian production in Spain. 7 2. – The Iberian pig and its rearing systems. 8 3. – The Duroc breed and its relationship with the Iberian breed. 10 4. – Policy and regulation of Iberian dry-cured meat products: Quality regulation of Iberian dry-cured meat products (Norma de Calidad para el jamón ibérico, paleta ibérica y caña de lomo ibérico elaborados en España. R.D. 1083/2001 B.O.E. 5th October, 2001). 11 5. – Iberian dry-cured meat products manufacture. 12 6. – Factors of quality of meat and meat products 13 6.1. - Breed and genotype 14 6.2.- Gender 14 6.3.- Type of muscle 15 6.4.- Feeding 15 6.5.- Intramuscular fat content 16 6.6.- pH decline and ultimate pH 20 7. – Deterioration of meat and meat products during refrigerated storage. 22 7.1.- Color changes. 22 7.2.- Lipid oxidation. 24 7.3.- Lipolytic changes. 25 7.4.- Protein oxidation. 26 APPROACH, OBJECTIVES AND EXPERIMENTAL DESIGN 35 1.- MATERIALS AND METHODS 41 1.1- MATERIALS 41 1.1.a- Animals 41 1.1.b- Refrigerated storage trial. 41 1.1.c- Dry-curing process. 42 2.- METHODS 42 2.1.-Growth performance and carcass composition. 42 2.2.- pH. 43 2.3.- Drip and cook loss. 43 2.4.- Lipid extraction. 43 2.5.- Protein content. 44 2.6.- Moisture content. 44 2.7.- Haem pigments. 44 2.8.- Instrumental colour. 44 2.9.- Intramuscular lipids fractionation. 44 2.10.- Methylation and analysis of fatty acids. 45 2.11.- Iron-ascorbate induced oxidation. 45 2.12.- Lipid oxidation. 45 2.13.- Protein oxidation. 46 2.14.- Determination of the activity of lipogenic enzymes. 46 2.15.- Weight loss of dry-cured products by refrigerated storage. 47 2.16.- Texture analysis. 47 2.17.- Sensory analysis of dry-cured meat products. 47 2.18.- Volatile analyses of dry-cured meat products. 48 2.19.- Statistical analysis. 49

page RESULTS AND DISCUSSION
CHAPTER 1: Carcass composition and meat quality of 3 different Iberian x Duroc genotype pigs 53 CHAPTER 2: Fatty acid composition and adipogenic enzyme activity of muscle and adipose tissue as affected by Iberian x Duroc pig genotype 67 CHAPTER 3: The crossbreeding of different Duroc lines with Iberian pig affects colour and oxidative stability. 85 CHAPTER 4: Changes in fatty acid composition of 2 muscles from 3 Iberian x Duroc genotypes after refrigerated storage 99 CHAPTER 5: Effect of Iberian x Duroc genotype on dry-cured loin quality. 121 CHAPTER 6: Composition, instrumental and sensory analysis of dry-cured hams as affected by the Iberian x Duroc genotype. 137 CHAPTER 7: Volatile profiles of dry-cured meat products from 3 different Iberian x Duroc genotypes 153 CHAPTER 8: Effect of physicochemical characteristics of raw muscles from three Iberian x Duroc genotypes on dry-cured meat products quality 173
GENERAL DISCUSSION 191 1.- Growth performance, production traits and carcass composition. 191 2. - Meat quality 191 3. - Changes on meat quality during refrigerated storage. 191 4. - Dry-cured loin and ham quality and volatile profile 194 4.1.- Dry-cured meat products quality. 196 4.2.- Volatile profile of dry-cured meat products. 198 5.- Relationship between raw material and dry-cured meat products quality 200 CONCLUSIONS 207

ABBREVIATIONS
ADG. Average daily gain.
BF. Biceps femoris.
BFT. Backfat thickness.
BOE. Boletín Oficial del Estado.
CL. Cook loss.
DL. Drip loss.
DMA. Dimethylacetals
DU. Duroc.
FA. Fatty acids.
FAMEs. Fatty acids methyl esters.
FID. Flame ionization detector.
FFA. Free fatty acids.
G6PDH. Glucose 6 phosphate dehydrogenase.
GEN. Genotype.
HFT. Hamfat thickness.
IILP. Iron-induced lipid peroxidation.
IMF. Intramuscular fat.
KOP. Killing out percentage.
LD. Longissimus dorsi.
Mb. Myoglobin.
ME. Malic enzyme.
MUFA. Monounsaturated fatty acids.
NL. Neutral lipids.
PL. Polar lipids.
PUFA. Polyunsaturated fatty acids.
SCF. Subcutaneous fat.
SEM. Standard error mean.
SFA. Saturated fatty acids.
TBA. Tiobarbituric acid
TPA. Texture profile analysis.
WBSF. Warner-Bratzler shear force.
WL. Weight loss.


General abstract

Abstract
GENERAL ABSTRACT Three different Iberian x Duroc genotype pigs were studied: GEN1: ♂ Iberian x ♀ Duroc1; GEN2: ♂
Duroc1 x ♀ Iberian; GEN3: ♂ Duroc2 x ♀ Iberian. GEN1 and GEN2 are reciprocal crosses, while the
difference between GEN2 and GEN3 is the Duroc sire line. The genotype of pigs Duroc1 (DU1) was
selected for the manufacture dry-cured meat products while Duroc2 pigs (DU2) were selected for
meat production. Meat quality and storage stability were evaluated in Longissimus dorsi and Biceps
femoris muscles. In addition, dry-cured meat products quality was studied in dry-cured loin and dry-
cured ham. No important differences were found between reciprocal crosses, and some of them
could by caused by the different slaughter weight. However, the Duroc sire line affected meat and
dry-cured meat products quality. Although GEN3 had better production parameters and higher meat
pieces yields, meat quality from this genotype in both muscles had characteristics related to PSE
condition. Besides, meat from this genotype was most sensitive to changes under storage. Meat
products quality from GEN3 was also lower, mainly caused by: the lowest fattening level of the
pieces for the manufacture of meat products and the lowest postmortem pH. Therefore, the cross
with non-adequate Duroc sire lines could seriously decrease meat and meat products quality from
Iberian pigs.
RESUMEN GENERAL Se estudiaron 3 cruces ibérico x duroc: GEN1 (♂ ibérico x ♀ duroc1); GEN2 (♂ duroc1 x ♀ ibérico);
GEN3: (♂ duroc2 x ♀ ibérico). GEN1 y GEN2 son cruces recíprocos, mientras que GEN2 y GEN3 se
diferencian en la línea paterna duroc. El genotipo de los cerdos duroc1 correspondió a animales
seleccionados para la producción de productos cárnicos, mientras que el genotipo de los cerdos
duroc2 correspondió a un genotipo carnicero, con animales seleccionados para la producción de
carne. Se evaluó la calidad de la carne fresca y los cambios durante la refrigeración en 2 músculos
(Longissimus dorsi y Biceps femoris). Además se estudió la calidad de los productos curados (lomo
y jamón curado). No se encontraron grandes diferencias entre los cruces recíprocos, y las
diferencias que se encontraron, pudieron deberse a las diferencias del peso al sacrificio. Sin
embargo, la línea paterna utilizada tuvo un gran efecto en la calidad de la carne y los productos
cárnicos curados. De este modo, aunque el GEN3 obtuvo mejores parámetros productivos y mayor
rendimiento de piezas nobles, la calidad de su carne fresca en los dos músculos analizados fue
inferior, ya que ésta mostró características de carne con condición PSE y una mayor susceptibilidad
a los cambios durante la refrigeración. La calidad de sus productos curados también fue inferior,
principalmente debido 2 causas: el menor engrasamiento de las piezas cárnicas para la elaboración
de productos curados y el valor del pH postmortem más bajo en este genotipo. Por tanto, la
utilización de genotipos duroc no adecuados podrían comprometer seriamente la calidad de la carne
y de los productos curados procedentes del cerdo ibérico.
3


Introduction

Introduction
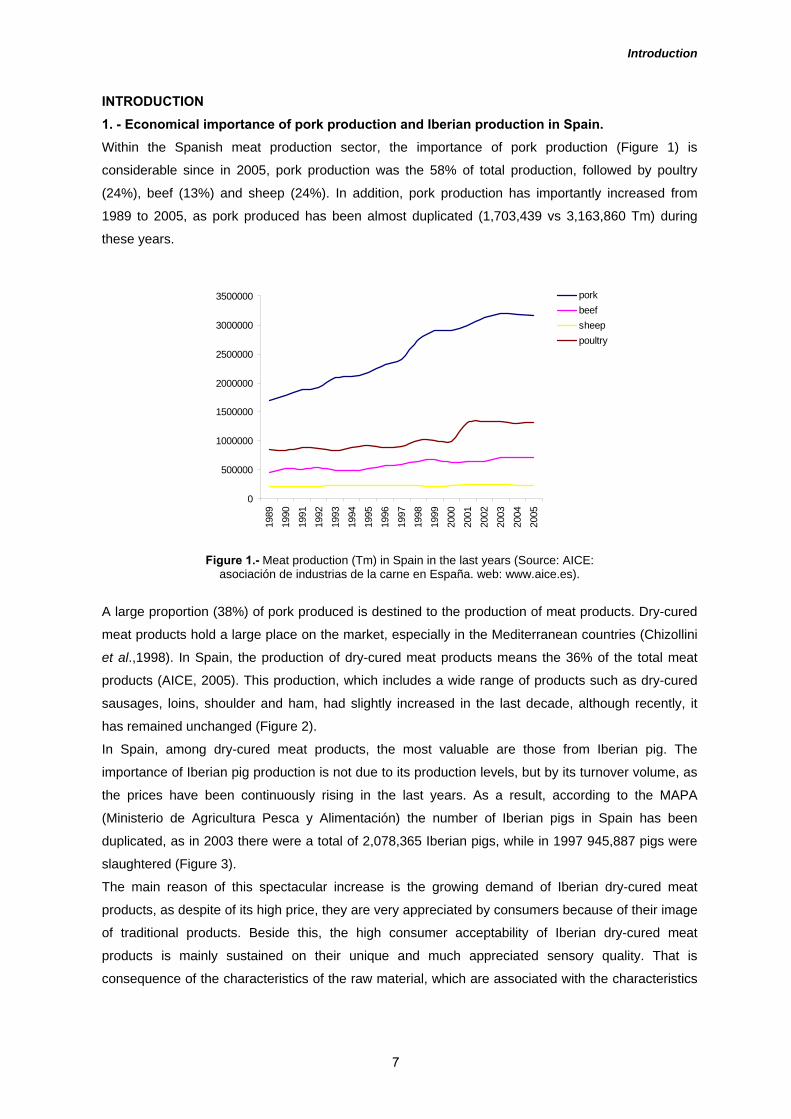
INTRODUCTION 1. - Economical importance of pork production and Iberian production in Spain. Within the Spanish meat production sector, the importance of pork production (Figure 1) is
considerable since in 2005, pork production was the 58% of total production, followed by poultry
(24%), beef (13%) and sheep (24%). In addition, pork production has importantly increased from
1989 to 2005, as pork produced has been almost duplicated (1,703,439 vs 3,163,860 Tm) during
these years.
Figure 1.- Meat production (Tm) in Spain in the last years (Source: AICE: asociación de industrias de la carne en España. web: www.aice.es).
A large proportion (38%) of pork produced is destined to the production of meat products. Dry-cured
meat products hold a large place on the market, especially in the Mediterranean countries (Chizollini
et al.,1998). In Spain, the production of dry-cured meat products means the 36% of the total meat
products (AICE, 2005). This production, which includes a wide range of products such as dry-cured
sausages, loins, shoulder and ham, had slightly increased in the last decade, although recently, it
has remained unchanged (Figure 2).
In Spain, among dry-cured meat products, the most valuable are those from Iberian pig. The
importance of Iberian pig production is not due to its production levels, but by its turnover volume, as
the prices have been continuously rising in the last years. As a result, according to the MAPA
(Ministerio de Agricultura Pesca y Alimentación) the number of Iberian pigs in Spain has been
duplicated, as in 2003 there were a total of 2,078,365 Iberian pigs, while in 1997 945,887 pigs were
slaughtered (Figure 3).
The main reason of this spectacular increase is the growing demand of Iberian dry-cured meat
products, as despite of its high price, they are very appreciated by consumers because of their image
of traditional products. Beside this, the high consumer acceptability of Iberian dry-cured meat
products is mainly sustained on their unique and much appreciated sensory quality. That is
consequence of the characteristics of the raw material, which are associated with the characteristics
0
500000
1000000
1500000
2000000
2500000
3000000
3500000
1989
1990
1991
1992
1993
1994
1995
1996
1997
1998
1999
2000
2001
2002
2003
2004
2005
porkbeefsheeppoultry
7

Introduction
of the Iberian breed and the traditional rearing system as well as the prolonged traditional processing
method, which in the case of dry-cured ham can reach between 1-2 years.
Figure 2.- Dry-cured meat products production (thousands of Tm) in Spain in the last decade (Source: AICE: Asociación de Industrias de la Carne en España. web:
www. aice.es)
Moreover, recently, the consumption of Iberian pork has grown (although no data is available).
Iberian pork can be considered a high quality alternative to meat from lean pigs commonly consumed
in Spain. Different studies (Estévez et al., 2003a,b) have compared Iberian and industrial genotypes
meat quality and have found better quality traits in Iberian pig such as better visual appearance and
shelf-life.
Figure 3.- Thousands of heads of Iberian pig in Spain in the last years (Source www.MAPA.es)
2. – The Iberian pig and its rearing systems. The Iberian pig is considered a rustic breed traditionally free-range reared in the south west of the
Iberian Peninsula. The Iberian breed is one of the scarce non-improved breeds which survives to the
modern techniques of pig production based on improved genotypes and intensive rearing systems.
The origins of the Iberian breed are in ancient pigs named Sus mediterraneus or Sus scrofa
meridionalis. The Iberian pig is perfectly adapted to environment conditions of the Mediterranean
evergreen forest in which are free-range reared. The Iberian pig’s habitat is the pastureland known
1295
1660
1878
2098
1878
2078
945
500
700
900
1100
1300
1500
1700
1900
2100
2300
1997 1998 1999 2000 2001 2002 2003
0
50
100
150
200
250
300
1995 1996 1997 1998 1999 2000 2001 2002 2003 2004 2005
dry-cured ham and shoulder
0
50
100
150
200
1995 1996 1997 1998 1999 2000 2001 2002 2003 2004 2005
dry-cured sausages
8
Introduction
as “Dehesa”, the ecosystem of the “Mediterranean forest”, mainly composed by evergreen oaks
(Quercus ilex), cork oaks (Quercus suber) and gall oaks (Quercus lusitanica).
Iberian pig production is unique in Europe and represents a sustainable and friendly system of
production, in which this breed is perfectly adapted to the environmental conditions of the south west
of the Iberian Peninsula, characterized by cold winters and dry and hot summers, together with
periods of abundance and shortage of feed which coincides with the autumn-winter and summer
seasons, respectively. Traditionally, the origin of the production system of Iberian pig was to take
advantage of the natural resources of the environment, such as acorns and pasture, mainly during
the autumn and winter seasons in a productive system named “montanera”. However, natural
resources in this rearing system are available only for a limited number of pigs and for a few months
(3–4 months) since acorns are only available from late November to March.
“Dehesa’s” sources are a limiting factor for this production as it is not always possible to feed all the
pigs by this system. Consequently, it is becoming common the supplementation with concentrate
fodders during fattening phase in free-range systems or the use of concentrates and more intensive
production systems such as in semi-intensive or in confinement rearing systems (López-Bote, 1998).
Nowadays, it is estimated that around the 60% of Iberian pigs are intensively reared (Cruz, 2006).
Although in the last years the number of Iberian pig has been increasing, reaching more than 2
millions of animals (AICE, 2005), this situation was not the same 50 years ago. In the fifties and
sixties, the census of Iberian pig was so small that it was nearby to disappear. But in the seventies
and especially in the eighties, the demand of dry-cured Iberian meat products increased the same as
the income of the Spanish families.
This traditional production system, in which pigs need to be reared for a long time to achieve the high
weights necessary for the manufacture of dry-cured meat products and which also need a long time
of ripening, has survived due to the high prices of these meat products.
During the fattening phase (free-range reared or semi-intensively reared) Iberian pig will put on a
third of its final weight in about 3 months (from 105kg to 145-150kg) mainly in the form of
subcutaneous fat and in the muscle (intra and intermuscular fat). Pigs are slaughtered at high live
weights (140-160 kg) with around 14 months, because the quality characteristics of the meat
products require carcass with high fat content. During this period, subcutaneous adipose tissue and
intramuscular lipid content are importantly increased, leading to a raw material very different from
industrial genotypes (Coutron-Gambotti et al., 1998; López-Bote, 1998).
Dry-cured hams are the most appreciated Iberian product, followed by dry-cured shoulders and dry-
cured loins. These products are classified into different commercial types with variable prices
according to the fatty acid profile of the subcutaneous fat and the rearing system. The more
expensive dry-cured products are those from pigs reared outdoors in the “Dehesas” and fed mainly
with acorns and pasture, while the least expensive come from pigs reared indoors with concentrate
feeds. In the market, products with different quality can be found depending on these parameters.
So, dry-cured meat products are considered as “de bellota” o “terminado en montanera”, when the
pigs are fattened on acorns and grass; “de recebo” o “terminado en recebo” when the end of the
9

Introduction
fattening period of the pigs is by acorns and grass as well as with commercial diets and “de cebo”
when pigs are only fed with commercial diets.
Important differences in the quality of dry-cured hams have been reported depending on the fattening
period. In general, dry-cured products from free-range-reared pigs fed on acorn and pasture had
better quality than pigs fed on concentrates (i.e. Carrapiso, et al., 2002a; Cava et al 1997; Petrón et
al., 2004).
In Iberian pig, the fat content and its fatty acids composition play a determinant role in the nutritive,
sensory and technological quality of the meat for the manufacture of dry-cured products. Meat from
Iberian pigs free-range reared reflects the fatty acid composition of acorns (with high levels of oleic
acid) and grass, being rich in monounsaturated fatty acids, especially oleic acid (C18:1n-9) which is
considered one of the main characteristics of Iberian pig’s tissues and products (Cava et al., 1997).
Acorns and pasture are also sources of antioxidant substances (such as alpha and gamma
tocopherols) and meat from animals free-range reared contains higher amounts of these compounds
than those from pigs reared under other rearing systems (Rey et al., 2006; Cava et al., 1999). High
monounsaturated fatty acids and antioxidant contents provide to the meat from pigs free-range
reared a high oxidative stability under storage (Cava et al., 2000a; Estévez et al., 2003a) or in the
manufacture of dry-cured meat products (Cava et al., 1997; Ruiz et al., 1998, Cava et al., 2000b).
3. – The Duroc breed and its relationship with the Iberian breed. The Iberian pig is one of the non selected pig breeds which has survived without changes from
centuries. The lack of selection in terms of productive parameters has conducted to a breed with
poor growth performance and production traits in comparison with industrial genotypes, such as low
prolificity (7-8 piglets per litter), 1.6-1.7 litter/sow/year and a low growth rate (Daza, 2000). For these
reasons, the Iberian pig has been crossed with breeds such as Tamworth, Large Black, Berkshire,
etc, to increase its productive parameters. Duroc was the breed which had better results in the
crossing with Iberian (Aparicio, 1987). So, nowadays, crossbreeding of Iberian pig is limited to
crosses with Duroc breed.
The origin of Duroc breed is in the USA (Briggs, 1969). The Duroc breed was introduced in Europe
mainly due to its higher intramuscular fat content compared with other breeds (Barton-Gade, 1987)
which has a positive influence on sensory qualities especially in dry-cured meat products
(Gandemer, 2002). In addition, Duroc crosses have higher postmortem pH (Tibau et al., 1997;
García-Macías, et al., 1996), higher redness and IMF content (Armero et al., 1999) and better
juiciness, tenderness and flavour (Candek-Potokar et al., 1998) than other breeds.
Iberian pigs have been traditionally crossed with Duroc pigs to improve some production parameters
such as the growth rate, the weight at slaughter and the carcass yield (López-Bote, 1998). By this
cross, production parameters have been improved such as more piglets per sow, with increases of
the prolificity of 2-3 pigs; it also improves the growth rate, the feed efficiency and the lean content,
particularly of hams and loins, increasing the weight at weaning and at end of fattening (Dobao et al.,
1986, Aparicio, 1987).
10
Introduction
The cross with Duroc is not considered to produce serious damages in the quality of meat and dry-
cured meat products (Tejeda et al., 2002, Antequera et al., 1994, Andrés et al., 2001). However,
other authors consider that crossbreeding had a slight effect on dry- cured ham (Carrapiso et al.,
2003) and dry-cured loin quality (Ventanas et al., in press) and others have reported more marked
differences in Biceps femoris muscles between pure Iberian pigs and Iberian x Duroc genotypes,
such as a reduction of IMF and iron levels and the modification of the fatty acid composition
(Ventanas et al., 2006a).
4. – Policy and regulation of Iberian dry-cured meat products: Quality regulation of Iberian dry-cured meat products (Norma de Calidad para el jamón ibérico, paleta ibérica y caña de lomo ibérico elaborados en España. R.D. 1083/2001 B.O.E. 5th October, 2001). In the year 2000, the number of Iberian reproductive sows was around 200,000 heads; though only
around the 50% were pure Iberian (Buxadé, 2000). Although this percentage seems to be high, it has
importantly decreased in the last years since for instance in the seventies most of the sows (85-90%)
were crossed (Daza et al., 2000).
Because of the increase of the demand of Iberian products and the high frequency of the Iberian x
Duroc crosses, a specific law to regulate Iberian market was passed in 2001 (R.D. 1083/2001 B.O.E.
5th October, 2001). One of the main aspects that this law regulates is the pig genotype for the
manufacture of Iberian meat products. Besides of pure Iberian pigs (100%), it also permits the
crosses with Duroc, but in the crosses it is necessary to use pure Iberian sows, while sire genotype
can be Duroc or Iberian x Duroc, in order to preserve the biodiversity of the Iberian breed.
On the other hand, this law has produced important changes in the traditional reproductive scheme in
Iberian x Duroc crosses, as Duroc or hybrid sows were preferred instead of Iberian sows since it was
generally believed the existence of production advantages. In this respect, a recent study
(Morcuende et al., in press) has reported an effect of the maternal line on the characteristics of the
piglets, especially on production parameters, which is known as “maternal effect”; so pigs from
Iberian sows had worse production parameters than those from Duroc sows. However, Iberian x
Duroc reciprocal cross does not affect quality traits (Ventanas et al., 2006a; Morcuende et al., in
press).
Nevertheless, Duroc breed can not be considered a homogeneous breed due to its widespread
distribution what has made it object of different genetic selections. Important differences have been
reported between Duroc lines by Lonergan et al., (2001), who found a serious reduction of the meat
quality from a selected Duroc line for increased lean growth efficiency. Meat from this line showed
higher drip loss and lower early postmortem pH values. Moreover, Soriano et al., (2005) and Cilla et
al., (2006) evaluated different Duroc sire lines in crosses with industrial genotypes and found an
important influence of the Duroc line on carcass composition, meat and dry-cured ham quality. This
means that, when choosing animals for purchase from farms, it will be advisable to take into account
the genetic traits selected and not just the animal breed.
11

Introduction
5. – Iberian dry-cured meat products manufacture. The manufacture of Iberian dry-cured loins and hams has an important tradition in Spain. Iberian dry-
cured meat products have been traditionally produced by means of natural weather conditions. In
traditional process, the pigs are slaughtered in winter and loins, shoulders and legs are salted, dried
and matured under natural conditions of temperature and relative humidity: the relative humidity is
continuously reduced as long as the temperature is increased. Sodium chloride, nitrites and the
dehydratation of the pieces during drying process conduct to the stabilization of the piece without risk
of spoilage by reducing water activity.
In the case of Iberian dry-cured ham, the total manufacture process lasts between 20-36 months.
The manufacture of Iberian dry-cured ham comprises four stages: 1. Salting “Salado”, 2. Post-
salting/resting “Post-salado/Asentamiento”, 3. Drying “Secadero” and 4. Ageing in cellar “Bodega”
(Figure 4). In the first, hams are rubbed with salt and nitrites/nitrates and placed in piles with
alternate layers of hams and salt at refrigeration temperature (0- 4°C) and high relative humidity (90-
95%) for 0.65-2 days per kg (López-Bote, 1998). After salting is completed, ham surface is brushed
to remove the rests of salt. Lately, consumer’s demands and health requirements tend to decrease
salt content of dry-cured ham; however, this could favour the development of softer textures, which
could affect the overall quality of dry-cured Iberian ham (Andrés et al., 2004). In the post-
salting/resting phase, hams are held at increasing temperature (4-15ºC) and decreasing relative
humidity (90-70%) for 80-100days to favour a homogeneous distribution of salt throughout the piece
and the loss of water that conduct to the stabilization of the ham. At the end, the piece is stable from
a point of view of spoilage. After post-salting, hams are held under natural conditions during the
summertime (for around 1-1.5months), temperatures could reach more than 30ºC and the relative
humidity is low (less than 50%). High temperature for a long period lead to an intense formation of
flavour and taste precursors that will be transformed into flavour and taste compounds in the next
phase. Finally, the hams are aged in cellars (“bodegas”) under natural conditions with mild
temperatures (14-18ºC) and relative humidity (65-80%) for more than 12 months. This is the most
important and distinctive phase in the manufacture of dry-cured Iberian ham. Time and moderate
temperature lead to the formation of pleasant odour, taste and flavour compounds derived from fat
and protein and the formation of new compounds from the interaction of lipid and protein-derived
compounds (Ruiz et al., 1999). Microorganisms play a key role in this stage for the generation of
flavour precursors in dry-cured meat products (Nuñez et al., 1996; Martin et al., in press).
In dry-cured loin, the process is very different. The muscle is rubbed with a seasoning mixture of
olive oil, salt and species (garlic, oregano and Spanish paprika) for some days at refrigeration
temperature. Then muscles are stuffed into casings and they undergo a drying process during 3-4
months at around 6ºC and 80-85% of relative humidity.
In dry-cured ham, the rise of temperature during several stages of the processing, and the prolonged
ripening time in the cellar allow a group of complex chemical reactions (lipolysis and lipid oxidation,
protein and amino acids degradation and Maillard reactions) to take place in a greater extent than in
other type of dry-cured hams, which contribute to the volatile and non-volatile compounds formation
(García et al., 1991; López et al., 1992).
12

Introduction
Fatty acids released during processing of Iberian ham mainly come from phospholipid fraction
(Martin et al., 1999). The development of lipolytic process enhances lipid oxidation reactions and
produces a wide variety of aromatic compounds. Additionally, during the ripening of dry-cured ham,
proteins also undergo proteolitic reactions (reviewed by Toldrá et al., 1997), which favour the
interaction of these compounds with others derived from lipid oxidation by means of Maillard
reaction. This is an important source of volatile compounds with great influence in the overall final
flavour of Iberian dry-cured ham (Carrapiso et al., 2002b). In general, Iberian ham flavour is
increased with ripening time (Ruiz et al., 1998), however, some authors have reported that an
excessive time of ripening decreases the acceptability of dry-cured ham due to the appearance of
texture problems (Cilla et al., 2005). On the other hand, recently, Ventanas et al., (2006b) have
reported an increase of protein oxidation associated with lipid oxidation during ripening of dry-cured
products, which suggests that oxidation processes not only affect lipids but also proteins.
Figure 4.- Stages of the manufacture of Iberian dry-cured ham (1. Salting “Salado”, 2. Post-salting/Resting
“Post-salado/Reposo”, 3. Dryer “Secadero”, 4. Ageing in cellar “Bodega”)
6. – Factors of quality of meat and meat products The quality of meat and meat products is influenced by intrinsic factors such as breed, genotype,
type of muscle, feeding regime, and extrinsic factors such as pre-slaughter handling and slaughter
procedure, which influence pH decline and ultimate pH (reviewed by Rosenvold and Andersen, 2003)
1
2
3
4
13

Introduction
6.1. - Breed and genotype Several studies have been devoted to determine the effect of different pig breeds and crosses on
production performance (Blasco et al., 1994; Blanchard et al., 1999) and meat and meat products
quality traits (Guerrero et al., 1996).
Two types of genes, polygenes and major genes are distinguished among genes affecting meat
quality traits. Polygenes are defined as genes whose individual effect on a trait is small in relation to
the total variance of this trait. A gene is considered a major gene when the difference between the
mean values of the individual homozygotes for this gene is equal or superior to one phenotypic
standard deviation of the trait. Two major genes affecting meat quality traits have been identified in
the pig: the Halothane gene and the RN gene (Sellier and Monin, 1994). The abbreviation RN stands
for Rendement Napole (Napole yield; Naveau et al., 1986).
Halothane gene The Halothane gene causes malignant hyperthermia, which can be triggered by stress or exposure
to the anaesthetic gas halothane (reviewed by Sellier, 1998). The effects of this gene have been
closely associated to development of pale, soft and exudative (PSE) meat (Briskey, 1964). It is
widely accepted that halothane sensitivity induces an acceleration of the post mortem pH decline,
and consequently increases the frequency of PSE meat (Sellier and Monin, 1994) and also affects
the colour as this factor is strongly influenced by the post mortem pH decline and ultimate pH (Warris
and Brown, 1987; Bendall and Swatland, 1988).
RN gene The presence of a dominant mutation (denoted RN-) with large effects on meat quality and
processing yield in Hampshire pigs is associated with reduced technological yield (Napole yield or in
French Rendement Napole, from which the gene has its name) (Naveau, 1986; Lundström et al.,
1996). This mutation is related to the codification of a muscle-specific isoform of the regulatory
gamma subunit of adenosine monophosphate-activated protein kinase (AMPK). AMPK has a key
role in regulating energy metabolism in eukaryotic cells and is activated by an increase in the ratio of
adenosin monophosphate (AMP) to adenosin triphosphate (ATP). Activated AMPK is expected to
inhibit glycogen synthesis and stimulate glycogen degradation. The RN- mutation has only been
found in Hampshire pigs or crossbred pigs including Hampshire, and not in any other pig breed
(Milan et al., 2000), although new alleles has been identified in the pig breeds Hampshire, Large
White and Wild Boar (Milan et al., 2000). Ciobanu et al. (2001) found the new allele in the pig breeds
Landrace, Large White, Berkshire, Duroc and Duroc Synthetic and reported that it had effects on
glycogen content and on certain meat quality traits, such as ultimate pH and colour.
6.2.- Gender The influence of sex on pork quality is controversial. Numerous papers have described significant
differences between castrated, males and females in parameters closely related with meat quality
such as tenderness, juiciness or palatability (Fortin et al., 2005; Jeremiah et al., 1999; Ellis et al..,
1993 and 1996). However others authors did not found differences in meat quality traits as affected
by gender (Blanchard et al., 1999). Martel et al., (1988) and Nold et al., (1997) described that meat
14
Introduction
from castrated was more tender than meat from entire males and females, probably due to a higher
intramuscular fat content. In dry-cured hams, the use of castrated males conducts to improved traits
against entire males (Bañón et al., 2003). Similarly, Gou et al., (1995) reported lower weight loss
during drying of dry-cured hams and higher intramuscular fat contents in hams from castrates than
those from females.
6.3.- Type of muscle Differences between oxidative and glycolytic muscles are caused by a different fat content, fatty acid
profile of lipid fractions and prooxidant substances content. Glycolytic muscles contain less total
lipids, triglycerides and phospholipid than oxidative ones (Alasnier et al., 1996). This is caused by the
smaller fibre diameters and the higher proportion of mitochondrial membranes of oxidative muscles
than in glycolytic ones. Additionally, long-chain PUFA, which are the main substrates for oxidation
during meat processing, are more abundant in phospholipids from oxidative muscles than in
glycolytic ones (Alasnier and Gandemer, 1998). Fatty acid composition of phospolipids influences
oxidative stability of pork, as the higher the proportion of PUFA, the more the susceptibility to
oxidation (Cava et al., 1999). Moreover, some other prooxidant factors such as heme content in
muscle are influenced by muscle fibre type (Aristtoy and Toldrá, 1998; Henckel et al., 1997). In this
respect, oxidative muscles show higher myoglobin content, so that they have a redder colour (Andrés
et al., 1999, Cava et al., 2003).
As a consequence of the different characteristics of the muscles, oxidative meat is more prone to
suffer oxidative and lipolytic deterioration than glycolytic muscles which could reduce as a
consequence its shelf-life during refrigerated storage (Morcuende et al., 2003, Andrés et al., 2001).
These effects appear to be more intense in muscles from pigs with a high tendency to fat
accumulation and a high content of heme pigments, like Iberian pig muscles, than in lean pigs
(Morcuende et al., 2003).
6.4.- Feeding Body fat comes from a combination of fats produced endogenously and those from the diet.
Therefore, the body fat composition reflects the composition of the dietary fat to some extent,
especially in monogastric animals. In pigs, dietary fatty acids are absorbed unchanged from the
intestine and incorporated into tissue lipids. Fatty acids absorbed from the diet, especially
polyunsaturated ones, specifically inhibit endogenous synthesis of fatty acids, inflating the effect of
dietary fat composition on body fat composition (reviewed by Pettigrew and Esnaola, 2001).
Therefore, fatty acid composition of feeding fat is a great influencing factor for fat composition in pigs
(i.e. Wood, 1984; Warnants et al., 1999; Cava et al., 1997, Pettigrew and Esnaola, 2001, Rosenvold
and Andersen 2003). According to Fontanillas et al., (1998) and Romans et al., (1995), dietary
polyunsaturated fatty acids (PUFA) are readily incorporated into pig fat, whereas dietary
monounsaturated (MUFA) and saturated fatty acids (SFA) have less influence on fat composition.
Similarly, Warnants et al., (1996) found a linear relationship between the feed PUFA content and the
PUFA content of intramuscular fat (IMF) and backfat.
15

Introduction
In the case of Iberian pig, feeding affects importantly the quality of meat and meat products. Meat
from pigs reared outdoors, in “Montanera”, has high amounts of monounsaturated fatty acids (MUFA)
in the total lipids; triglyceride and phospholipid fractions since acorns are rich in them (Cava et al.,
1997). In addition, pork from Iberian pigs has lower content of PUFA than those fed with commercial
fodders (Estévez and Cava, 2003b). Mixed diets from pigs reared in intensive are commonly
composed by cheap raw materials with abundant PUFAs, which could cause undesirable
technological and sensory consequences on meat quality (Morrissey et al., 1998).
Beside this, the feeding with natural pastures and acorns causes an increase of natural antioxidants
concentration (tocopherols) in meat (Cava et al., 2000a). The higher lipid oxidative stability of meat
as a result of the incorporation of antioxidant from grass has been described in previous papers
(Cava et al., 2000a; Nilzén et al., 2001; Estévez and Cava, 2003a). Other authors have described the
protecting role of natural antioxidants, mainly tocopherols in refrigerated meat and in dry-cured meat
products (Alasnier et al., 2000a; Cava et al., 1999).
Logically, fattening diet also affects the quantity and composition of the lipid of dry-cured hams. Total
intramuscular lipids and triacylglycerols content were higher in hams from pigs reared in Montanera
than those from pigs fed with commercial fodders (Petrón et al., 2004). In addition, these hams
contained more oleic acid and less stearic and palmitic acids (Petrón et al., 2004).
6.5.- Intramuscular fat content It is generally recognized that differences in IMF content explain an important part of the genetic
variation in eating quality of porcine meat. In this respect, non selected breeds have higher IMF
content than selected genotypes as these pigs have been generally selected to improve lean growth.
The decrease of IMF content has been so important in the last years, especially in industrial
genotypes, that it affected the quality of meat, decreasing the juiciness. Nowadays, one of the
strategies to improve IMF content is the genetic selection. Heritability for IMF content indicates
substantial genetic variation in this trait but it differs considerably among studies from 0.26 to as high
as 0.86 with an average of 0.5 (reviewed by Gerbens, 2004). Some authors have found significant
correlations between backfat thickness and IMF content (Hovenier et al., 1993). However, in general,
carcass fatness and marbling are not perfectly correlated, but ordinarily, nutritional interventions that
alter one, cause the other to move in the same direction also. Nevertheless, this is not a problem that
affects Iberian pig, as due to its adipogenic character and the heavy slaughter weights, they have
very high levels of intramuscular fat, which is a factor of prime importance for the production of dry-
cured meat products (Gandermer, 2002), although by the inclusion of selected genotypes, it could be
altered.
Generally, the increase of IMF content in meat is mainly due to an increase in triglycerides content as
demonstrate different studies in pigs (Cameron and Enser, 1991; Essén-Gustavsson et al., 1994)
and rabbits (Gondret et al., 1998). The synthesis of adipose tissue triglycerides, the major
constituents of depot fat, either proceeds from fatty acids synthesised “de novo” (especially from
dietary carbohydrates) in that tissue (O'Hea and Leveille, 1969) or from fatty acids obtained from
16
Introduction
circulating triglycerides as a result of adipose tissue lipoprotein lipase activity (Steffen et al., 1978).
However, the liver has little importance in fatty acid synthesis in pig (O'Hea and Leveille, 1969).
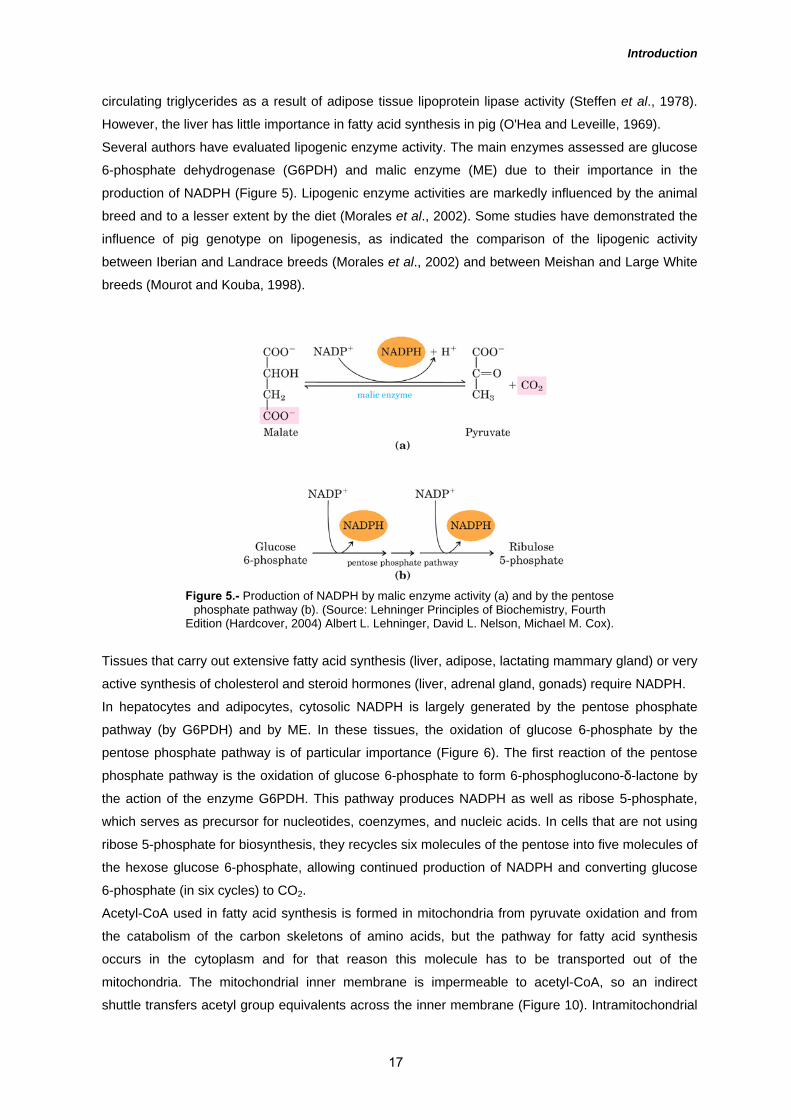
Several authors have evaluated lipogenic enzyme activity. The main enzymes assessed are glucose
6-phosphate dehydrogenase (G6PDH) and malic enzyme (ME) due to their importance in the
production of NADPH (Figure 5). Lipogenic enzyme activities are markedly influenced by the animal
breed and to a lesser extent by the diet (Morales et al., 2002). Some studies have demonstrated the
influence of pig genotype on lipogenesis, as indicated the comparison of the lipogenic activity
between Iberian and Landrace breeds (Morales et al., 2002) and between Meishan and Large White
breeds (Mourot and Kouba, 1998).
Figure 5.- Production of NADPH by malic enzyme activity (a) and by the pentose phosphate pathway (b). (Source: Lehninger Principles of Biochemistry, Fourth
Edition (Hardcover, 2004) Albert L. Lehninger, David L. Nelson, Michael M. Cox).
Tissues that carry out extensive fatty acid synthesis (liver, adipose, lactating mammary gland) or very
active synthesis of cholesterol and steroid hormones (liver, adrenal gland, gonads) require NADPH.
In hepatocytes and adipocytes, cytosolic NADPH is largely generated by the pentose phosphate
pathway (by G6PDH) and by ME. In these tissues, the oxidation of glucose 6-phosphate by the
pentose phosphate pathway is of particular importance (Figure 6). The first reaction of the pentose
phosphate pathway is the oxidation of glucose 6-phosphate to form 6-phosphoglucono-δ-lactone by
the action of the enzyme G6PDH. This pathway produces NADPH as well as ribose 5-phosphate,
which serves as precursor for nucleotides, coenzymes, and nucleic acids. In cells that are not using
ribose 5-phosphate for biosynthesis, they recycles six molecules of the pentose into five molecules of
the hexose glucose 6-phosphate, allowing continued production of NADPH and converting glucose
6-phosphate (in six cycles) to CO2.
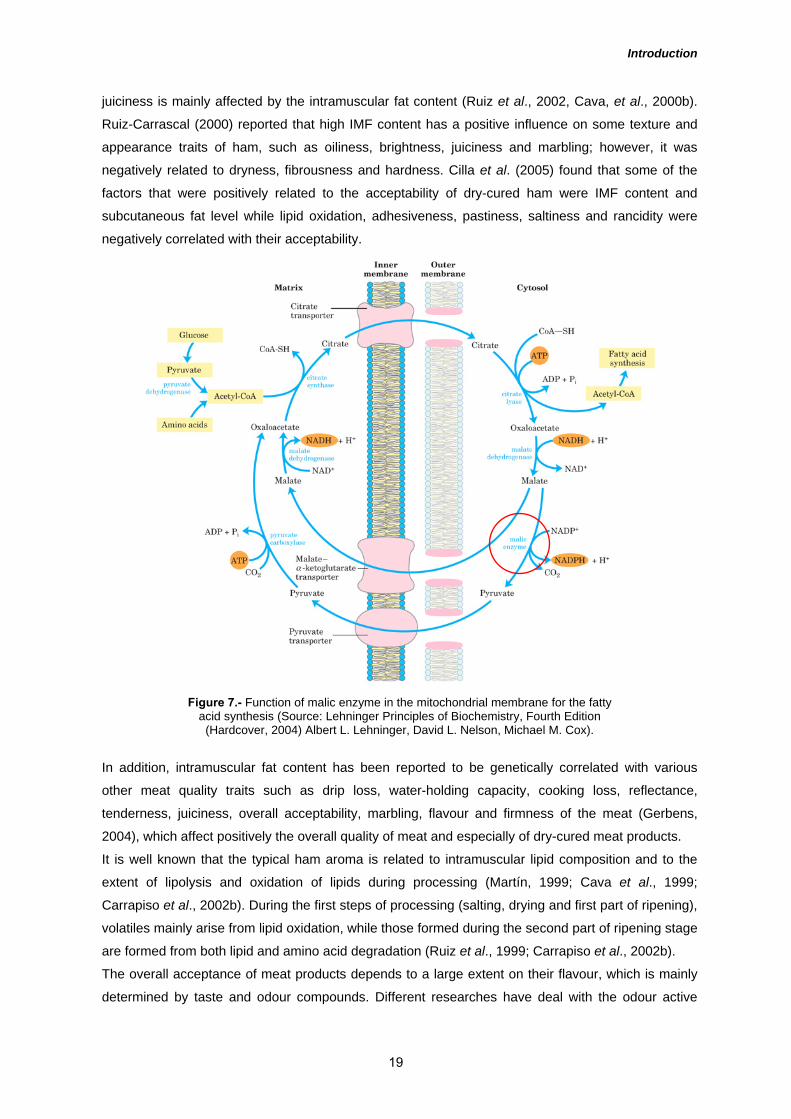
Acetyl-CoA used in fatty acid synthesis is formed in mitochondria from pyruvate oxidation and from
the catabolism of the carbon skeletons of amino acids, but the pathway for fatty acid synthesis
occurs in the cytoplasm and for that reason this molecule has to be transported out of the
mitochondria. The mitochondrial inner membrane is impermeable to acetyl-CoA, so an indirect
shuttle transfers acetyl group equivalents across the inner membrane (Figure 10). Intramitochondrial
17

Introduction
acetyl-CoA first reacts with oxaloacetate to form citrate, which then passes through the inner
membrane on the citrate transporter. In the cytosol, acetyl-CoA is regenerated in an ATPdependent
reaction. Oxaloacetate cannot return to the mitochondrial matrix directly, so cytosolic malate
dehydrogenase reduces the oxaloacetate to malate, which returns to the mitochondrial matrix.
Alternatively, the malate produced in the cytosol is used to generate cytosolic NADPH through the
activity of malic enzyme. These molecules of NADPH produced will be used in fatty acids synthesis.
Figure 6.- General scheme of the pentose phosphate pathway. (Source: Lehninger Principles of Biochemistry, Fourth Edition (Hardcover, 2004) Albert L. Lehninger,
David L. Nelson, Michael M. Cox).
The first step of the fatty acids synthesis is the formation of malonyl-CoA from acetyl-CoA which are
used by the fatty acid synthase for the synthesis of fatty acids. All the reactions of fatty acid
synthesis are carried out by the multiple enzymatic activities of fatty acid synthase. The primary fatty
acid synthesized by fatty acid synthase is palmitate. Palmitate is then released from the enzyme and
can then undergo separate elongation and/or unsaturation to produce other fatty acid molecules.
Several studies revealed that IMF content is one of the most important traits that influence eating
quality traits such as tenderness, juiciness, flavor and taste (reviewed by Verbeke et al., 1999). In
terms of technological quality, fat distribution and its fatty acid composition regulate water migration
during drying of dry-cured meat (Arnau, 1998). An inadequate intramuscular fat content conducts to a
fast dehydratation of the dry-cured products, leading to an inappropriate development of quality
attributes. Furthermore, the level and composition of IMF play an important role in textural aspect
such as in hardness, juiciness and brightness as well as in the production of flavour compounds
(Ruiz et al., 2000, 2002; Cava et al., 1999, Carrapiso et al., 2002b). In addition, the juiciness
perceived during chewing is one of the main factors for the acceptability of dry-cured Iberian ham
(Ruiz et al., 2002). The juiciness of dry-cured meat products is determined by two factors: at the
beginning, it is influenced by the water content, however, as dry-cured products have low moisture,
18
Introduction
juiciness is mainly affected by the intramuscular fat content (Ruiz et al., 2002, Cava, et al., 2000b).
Ruiz-Carrascal (2000) reported that high IMF content has a positive influence on some texture and
appearance traits of ham, such as oiliness, brightness, juiciness and marbling; however, it was
negatively related to dryness, fibrousness and hardness. Cilla et al. (2005) found that some of the
factors that were positively related to the acceptability of dry-cured ham were IMF content and
subcutaneous fat level while lipid oxidation, adhesiveness, pastiness, saltiness and rancidity were
negatively correlated with their acceptability.
Figure 7.- Function of malic enzyme in the mitochondrial membrane for the fatty
acid synthesis (Source: Lehninger Principles of Biochemistry, Fourth Edition (Hardcover, 2004) Albert L. Lehninger, David L. Nelson, Michael M. Cox).
In addition, intramuscular fat content has been reported to be genetically correlated with various
other meat quality traits such as drip loss, water-holding capacity, cooking loss, reflectance,
tenderness, juiciness, overall acceptability, marbling, flavour and firmness of the meat (Gerbens,
2004), which affect positively the overall quality of meat and especially of dry-cured meat products.
It is well known that the typical ham aroma is related to intramuscular lipid composition and to the
extent of lipolysis and oxidation of lipids during processing (Martín, 1999; Cava et al., 1999;
Carrapiso et al., 2002b). During the first steps of processing (salting, drying and first part of ripening),
volatiles mainly arise from lipid oxidation, while those formed during the second part of ripening stage
are formed from both lipid and amino acid degradation (Ruiz et al., 1999; Carrapiso et al., 2002b).
The overall acceptance of meat products depends to a large extent on their flavour, which is mainly
determined by taste and odour compounds. Different researches have deal with the odour active
19
Introduction
volatile compounds responsible of the characteristic aroma of the Iberian dry-cured ham (Carrapiso
et al., 2002ab). In comparison with other types of dry-cured hams, Iberian ham has significantly
higher aldehyde content (Sabio et al., 1998). Moreover, Iberian ham is richer in volatile compounds
than other types such as Bayonne ham, Corsican ham, Serrano ham, Parma ham and light Italian
country ham (Sabio et al., 1998). Most of the volatiles of Iberian dry-cured ham are formed by lipid
oxidation. High intramuscular fat content favours aroma compounds retention in meat because
triacylglycerols are a good solvent for these compounds which mainly arise from lipid oxidation
(García et al., 1991; López et al., 1992). The main volatiles generated through oxidation process are
aldehydes, which have large impact on the overall aroma of dry-cured meat products because of
their typical aroma and their low odour threshold (Shahidi et al., 1986).
6.6.- pH decline and ultimate pH Meat quality is closely linked to the genotype and those changes related with pH decline and ultimate
pH values. Thus, the existence of the halothane and the RN- gene (“Rendement Napole”) is
associated with PSE meat. In pigs subjected to a short-stress situation, the relationship between the genetic susceptibility to
stress and meat quality has been demonstrated to be the main cause of pale, soft and exudative
meat (PSE) (Cassens et al., 1975). Stressing environmental conditions such as the density of
animals and inadequate transports, favour the development of abnormal meat quality. In addition,
behavioural, physiological and metabolic responses to aversive situations depend on genetic
background and prior experience of the animals (Terlow, 2005), so Duroc pigs are relatively
insensitive to slaughter conditions in comparison with other breeds such as Large White (Terlow,
2005).
All these factors affect the development of rigor mortis and pH decline. After slaughter, along the
ATP available to break down the actin and myosin bonds is decreasing, muscles cannot relax and
become inextensible (Aberle et al., 2001), which is one of the characteristics of rigor mortis.
Moreover, after bleeding, anaerobic muscular metabolism continues in the absence of oxygen and
nutrients to produce lactic acid. So, the lactate formation increases while the pH is progressively
declining. Normally, the pH in the muscle decreases from 7.0 to around 5.3–5.8 (Smulders et al.,
1992).
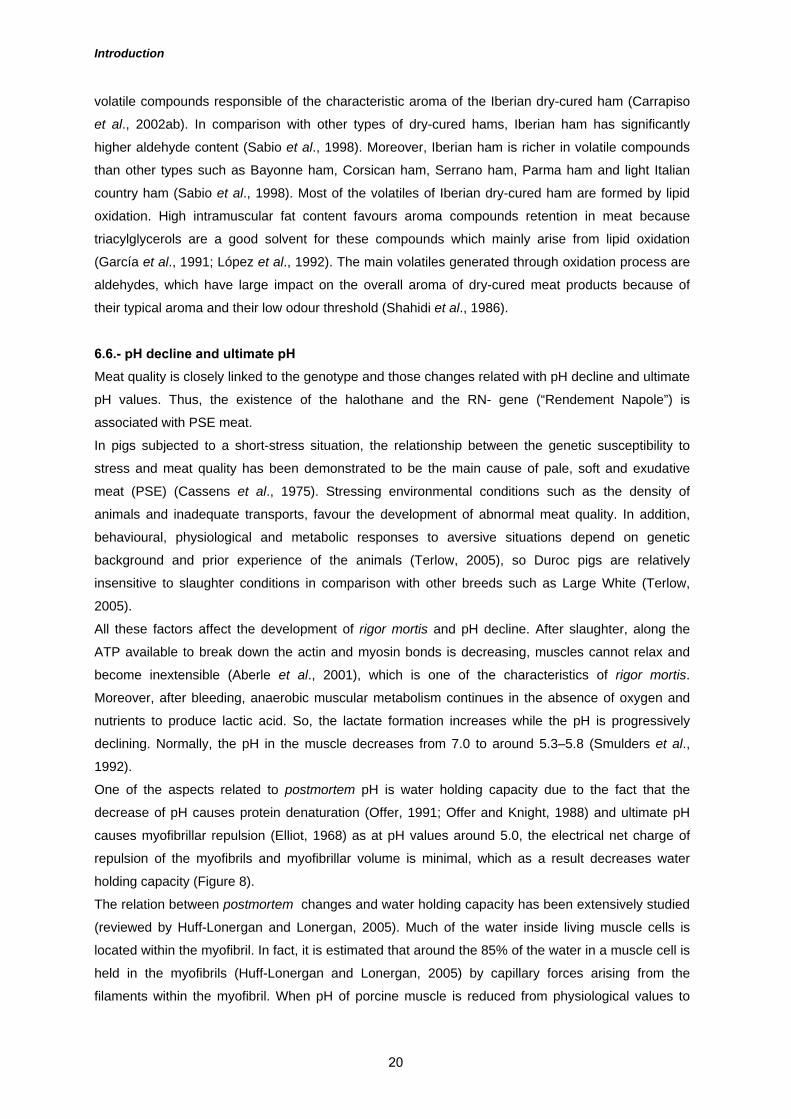
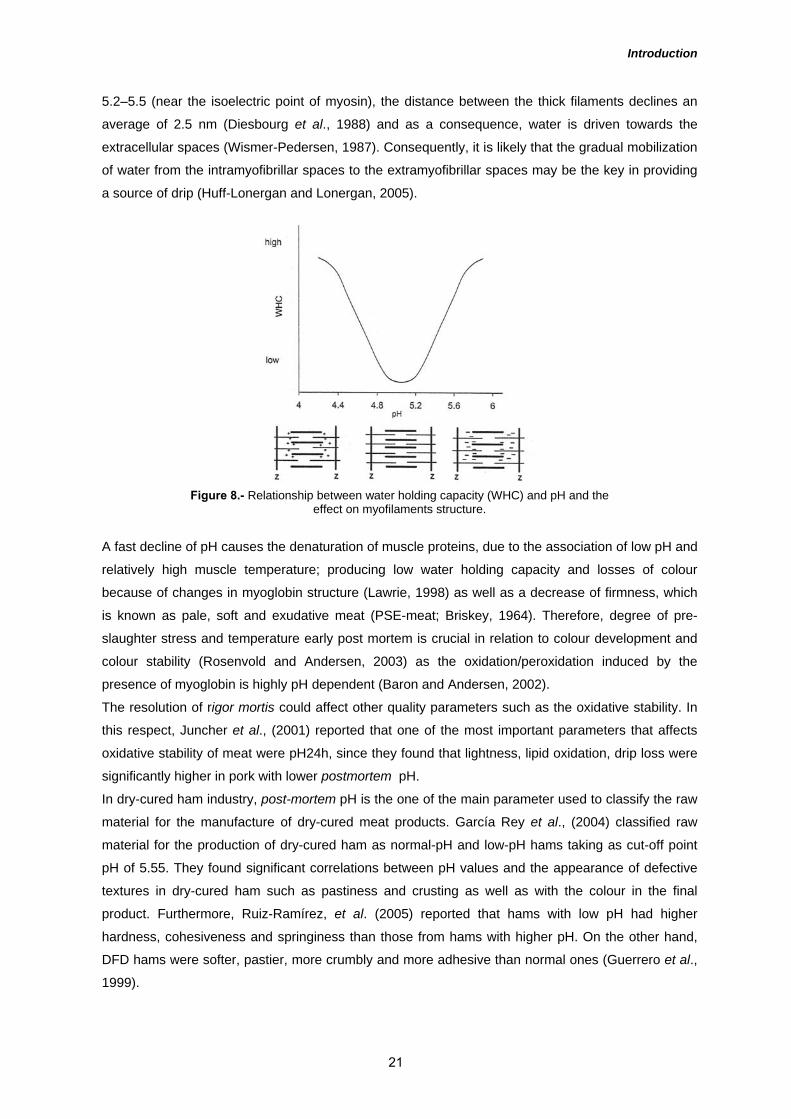
One of the aspects related to postmortem pH is water holding capacity due to the fact that the
decrease of pH causes protein denaturation (Offer, 1991; Offer and Knight, 1988) and ultimate pH
causes myofibrillar repulsion (Elliot, 1968) as at pH values around 5.0, the electrical net charge of
repulsion of the myofibrils and myofibrillar volume is minimal, which as a result decreases water
holding capacity (Figure 8).
The relation between postmortem changes and water holding capacity has been extensively studied
(reviewed by Huff-Lonergan and Lonergan, 2005). Much of the water inside living muscle cells is
located within the myofibril. In fact, it is estimated that around the 85% of the water in a muscle cell is
held in the myofibrils (Huff-Lonergan and Lonergan, 2005) by capillary forces arising from the
filaments within the myofibril. When pH of porcine muscle is reduced from physiological values to
20
Introduction
5.2–5.5 (near the isoelectric point of myosin), the distance between the thick filaments declines an
average of 2.5 nm (Diesbourg et al., 1988) and as a consequence, water is driven towards the
extracellular spaces (Wismer-Pedersen, 1987). Consequently, it is likely that the gradual mobilization
of water from the intramyofibrillar spaces to the extramyofibrillar spaces may be the key in providing
a source of drip (Huff-Lonergan and Lonergan, 2005).
Figure 8.- Relationship between water holding capacity (WHC) and pH and the effect on myofilaments structure.
A fast decline of pH causes the denaturation of muscle proteins, due to the association of low pH and
relatively high muscle temperature; producing low water holding capacity and losses of colour
because of changes in myoglobin structure (Lawrie, 1998) as well as a decrease of firmness, which
is known as pale, soft and exudative meat (PSE-meat; Briskey, 1964). Therefore, degree of pre-
slaughter stress and temperature early post mortem is crucial in relation to colour development and
colour stability (Rosenvold and Andersen, 2003) as the oxidation/peroxidation induced by the
presence of myoglobin is highly pH dependent (Baron and Andersen, 2002).
The resolution of rigor mortis could affect other quality parameters such as the oxidative stability. In
this respect, Juncher et al., (2001) reported that one of the most important parameters that affects
oxidative stability of meat were pH24h, since they found that lightness, lipid oxidation, drip loss were
significantly higher in pork with lower postmortem pH.
In dry-cured ham industry, post-mortem pH is the one of the main parameter used to classify the raw
material for the manufacture of dry-cured meat products. García Rey et al., (2004) classified raw
material for the production of dry-cured ham as normal-pH and low-pH hams taking as cut-off point
pH of 5.55. They found significant correlations between pH values and the appearance of defective
textures in dry-cured ham such as pastiness and crusting as well as with the colour in the final
product. Furthermore, Ruiz-Ramírez, et al. (2005) reported that hams with low pH had higher
hardness, cohesiveness and springiness than those from hams with higher pH. On the other hand,
DFD hams were softer, pastier, more crumbly and more adhesive than normal ones (Guerrero et al.,
1999).
21
Introduction
Postmortem pH is important for the colour of cured meat products, since both formation of
nitrosylmyoglobin during curing and the formation of nitrosyl heme pigments from oxidized pigments
during storage is acid catalyzed (Andersen and Skibsted, 1992). Moreover, a low initial pH in
muscles favours lipid oxidation in dry-cured hams (Buscailhon et al., 1994) and therefore, the
development of rancidity. Chizzolini et al., (1996) evaluated the relationship between raw material
and dry-cured ham quality. They found that pH was the most determinant factor measured in fresh
for meat products quality, as they found a close relation between this parameter and sensory and
instrumental colour values. However, this relationship was not strong enough as maturing appears to
have a positive effect on the colour of pale meat. They also associated lean firmness of matured
hams with the colour and pH of the fresh meat.
The incidence of exudative meats in Iberian pigs is practically non-existent, whereas the cross of
Iberian pigs with selected Duroc lines could introduce undesirable characteristics, which could affect
the quality of fresh meat and dry-cured meat products.
7. – Deterioration of meat and meat products during refrigerated storage. 7.1.- Color changes. The colour of fresh pork is influenced by intrinsic factors such as genotype, gender, type of muscle,
dietary supplementation with antioxidants (vitamin E), and extrinsic factors such as pre-slaughter
handling and slaughter procedure, which influence pH decline and ultimate pH, and beside this,
storage time and conditions (temperature, atmosphere, light, etc) (Faustman and Cassens, 1990;
Renerre, 1990; Sellier and Monin, 1994; Rosenvold and Andersen, 2003).
Meat colour influences consumer’s choice and acceptance as meat with a grey-brown colour is
generally associated with non-fresh products (Krammer, 1994). Meat colour depends on the
pigments concentration, mainly myoglobin and its chemical state as well as on the overall physical
state of meat such as pH, myofibril proteins state, denaturation degree (Ledward, 1992, Renerre,
1990). Myoglobin and haemoglobin, together with mitochondrial citocrome c, are responsible for the
characteristic red colour of meat (Govindarajan, 1973; Giddings, 1977); although myoglobin is the
main muscle heme pigment (Figure 9). Myoglobin is a globular protein formed by an apo protein
(globin) and an iron-containing heme group, Fe-protoporphyrin, which is the chromophore of
myoglobin (Stryer, 1981). The apo protein fraction consists of 8 α-helices linked by short non-helical
sections which are around the heme group. The iron atom bind to the four nitrogens in the centre of
the protoporphyrin ring can form two additional bonds, one on either side of the heme plane, the fifth
and sixth coordinating positions. The fifth coordinating position is bound to histidine on the globin,
and the sixth is free for binding to different small ligands such as O2, H2O, OH-, NO and CO (Hamm,
1975; Stryer, 1981).
The colour of myoglobin (Figure 10) is determined by the redox state of the iron atom, ferrous (Fe2+)
and ferric (Fe3+), and by the type of ligand bound (Govindarajan, 1973; Hamm, 1975). Oxygen can
only be bound to myoglobin in the ferrous redox state, whereas H2O is bound in the ferric redox state
at physiological pH and below (Govindarajan, 1973). The colour cycle of fresh meat is reversible and
dynamic (Figure 10) with constant interconversion of mainly three species: deoxymyoglobin (Mb),
22

Introduction
oxymyoglobin (MbO2) and metmyoglobin (MetMb) (Govindarajan, 1973). Myoglobin, provides a
purple colour to meat and can be transformed into oxymyoglobin (MbFe(II) O) when it is linked to
oxygenum, with an attractive bright red colour. The surface colour changes from purple to bright red,
due to oxygenation of Mb to MbO2, when fresh meat is exposed to oxygen, this reaction is known as
blooming (Govindarajan, 1973; Giddings, 1977). Finally, metmyoglobin (MbFe(III)) is formed when
Fe2+ of the myoglobin is oxidized to Fe3+ and has brown colour very undesirable for consumers as it
is associated with non-fresh products.
Figure 9.- Myoglobin structure (left) and heme group (right)
On the other hand, colour formation and stability are very important quality traits of dry-cured meat
products. During manufacture, nitrates and nitrites added to meat to form the characteristic pigment
of cured-meat: nitrosylmyoglobin. Nitrosylmyoglobin is a myoglobin derivative, where the ligand nitric
oxide (NO), formed from nitrite in acid media, is coordinated to central Fe2+ in heme group. The same
reaction is produced with the haemoglobin, the blood pigment, which can also be present in low
concentrations in meat. Oxidative discoloration of cured meats converts the nitrosylmyoglobin,
MbFe(II)NO, to nitrate and metmyoglobin, MbFe(III), which is not only detrimental for appearance,
but also for the oxidative stability of unsaturated lipids. The stability of the total pigments and nitroso
myoglobin formation depends on microbiological, enzymatic and chemical processes, which are in
turn influenced by factors such as pH, redox potential, curing salt concentration, temperature and
moisture content (Chasco et al., 1996).
The relationship between lipid oxidation and oxymyoglobin oxidation has been the subject of
numerous research papers over the years as the oxidation of myoglobin to metmyoglobin during the
storage results in meat discolouration (reviewed by Baron and Andersen, 2002). At high unsaturated
fatty acid/heme protein ratios both oxymyoglobin and metmyoglobin are denatured resulting in
exposure of the heme group to the environment, which raises a hematin-induced peroxidation
mechanism. Such processes might contribute to the poor stability of meat and meat products with
high fat content (Baron and Andersen, 2002)
23

Introduction
On the other hand, meat stored under low temperatures has a limited shelf-life due to biochemical
changes developed after slaughter such as lipolysis and lipid oxidation of muscle lipids (Gray et al.,
1996; Kanner, 1994; Morrissey et al., 1998).
Figure 10,- Chemical species of myoglobin.
7.2.- Lipid oxidation. Regardless of microbial spoilage, lipid oxidation is the main factor reducing the quality and shelf-life
of meat and meat products (Morrissey et al., 1998). The main consequences of lipid oxidation are i.
the generation of toxic compounds such as MDA and hydroperoxides, ii. the losses in the nutritional
value due to vitamins and essential fatty acids oxidation and iii. the development of rancid flavours
and undesirable colours, among others (Gray et al., 1996).
The overall mechanism of lipid oxidation is generally a free radicals chain reaction including three
steps: i. initiation, ii. propagation and iii. termination (Frankel, 1982, 1985). The first step of lipid
oxidation involves the abstraction of a hydrogen atom from a methylene carbon in an unsaturated
fatty acid (RH) to form fatty acyl (R-) and peroxyl radicals (RO
2
-). The generation of the primary
radicals is facilitated by the presence of oxidation initiators such as transition metals (iron and
copper), oxidants, various homolysis –prone substances or enzymes (Kanner et al., 1994; Gray et
al., 1996). Once a free radical is generated, the chain reaction of oxidation is initiated, new free
OMb(RED)
MetMb(BROWN)
Denatured MetMb(DARK BROWN)
Mb(PURPLE)
O2
O2
oxygenation
deoxygenation
oxidation(lose e-)
reduction(gain e-)
oxidation(lose e-)
HEAT
HEAT HEAT
Nitric oxide Mb(RED)
Nitrosyl hemochrome(PINK)
Nitric oxide MetMb(BROWN)
NO
NO
reduction(gain e-)
HEAT
OMb(RED)
MetMb(BROWN)
Denatured MetMb(DARK BROWN)
Mb(PURPLE)
O2
O2
oxygenation
deoxygenation
oxidation(lose e-)
reduction(gain e-)
oxidation(lose e-)
HEAT
HEAT HEAT
Nitric oxide Mb(RED)
Nitrosyl hemochrome(PINK)
Nitric oxide MetMb(BROWN)
NO
NO
reduction(gain e-)
HEAT
24
Introduction
radicals are formed and the process is easily propagated to other fatty acids which are consequently
oxidised forming new peroxyl radicals and lipid hydroperoxides (ROOH) (Morrissey et al., 1998).
Both primary lipid oxidation products undergo carbon-carbon cleavage to form small molecular
weight stable breakdown products (secondary lipid oxidation products) including aldehydes, ketones,
alcohols, hydrocarbons, esters, furans and lactones (Frankel, 1985; Morrissey et al., 1998).
Intensity of lipid oxidative reactions depend on several factors such as the amount and
characteristics of the muscle lipids (i.e. lipid content, fatty acid composition, distribution of
unsaturated lipids in lipid fractions), the presence of prooxidant factors (i.e. iron, copper, sodium
chloride) and antioxidant factors (i.e. tocopherols, antioxidant enzymes, nitrite) and the balance
between prooxidants and antioxidants factors (Morrissey et al., 1998).
Oxidative stability of muscle foods is largely determined by the amount of muscle lipids (Morrissey et
al., 1998) being positively correlated fat content and lipid oxidation. Additionally, the fatty acid
composition of muscle lipids affects the sensitivity of meat to oxidative reactions. Thus, the
susceptibility of fatty acids to oxidation increases with the number of double bonds and therefore,
polyunsaturated fatty acids are more prone to suffer oxidation reactions than monounsaturated and
saturated fatty acids (Nawar, 1996). In this sense, membrane phospholipids, due to their rich
polyunsatured fatty acid composition and the proximity to prooxidant systems are the place for the
initial development of oxidised flavours in raw meat during storage.
The role of iron and muscle heme pigments as lipid oxidation promoters is well established (Kanner,
1994). Heme and non-heme iron in the forms oxidized or reduced have the ability to promote the
catalysis of oxidation of unsaturated fatty acids (Halliwell and Gutteridge, 1986) by different
mechanisms, including direct and indirect initiation and indirect initiation-propagation (Schaich,
1992).
Muscle antioxidants enhance the oxidative stability of tissues reducing the development of oxidative
reactions during storage and processing of meat and meat products and minimizing the adverse
effects on quality (Morrissey et al.., 1998). Thus, tocopherols inhibit oxidative decomposition of
polyunsaturated fatty acids as well as oxymyoglobin oxidation (Faustman et al., 1989; Yin et al.,
1993).
Undesirable flavours appearance is related to oxidation development as lipid oxidation products
favour the development of off-flavours, particularly during storage. However, lipid oxidation also has
positive implications especially in dry-cured meat products, as some of the volatile compounds which
show pleasant flavour notes in Iberian dry-cured meat products arise from the oxidation of
unsaturated fatty acids (Carrapiso et al., 2002b).
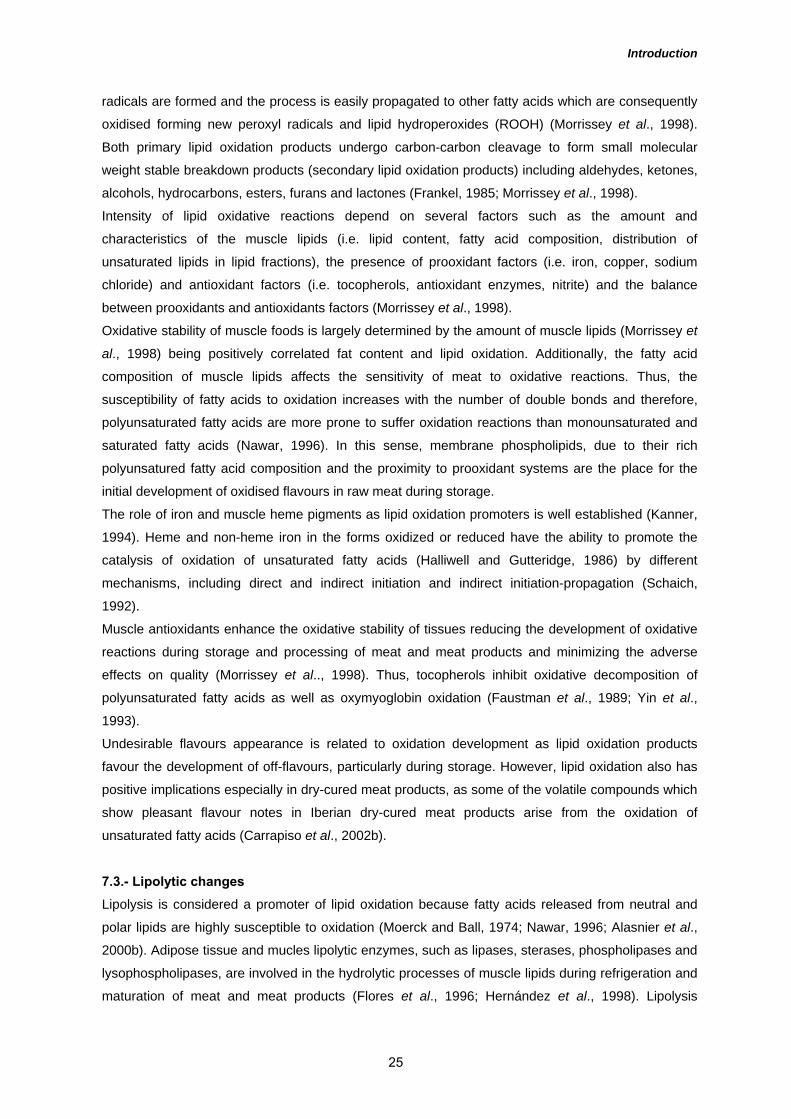
7.3.- Lipolytic changes Lipolysis is considered a promoter of lipid oxidation because fatty acids released from neutral and
polar lipids are highly susceptible to oxidation (Moerck and Ball, 1974; Nawar, 1996; Alasnier et al.,
2000b). Adipose tissue and mucles lipolytic enzymes, such as lipases, sterases, phospholipases and
lysophospholipases, are involved in the hydrolytic processes of muscle lipids during refrigeration and
maturation of meat and meat products (Flores et al., 1996; Hernández et al., 1998). Lipolysis
25
Introduction
releases free fatty acids from both triacylglycerols and phospholipids (Alasnier et al., 2000b), and
thus, favour lipid oxidation because free fatty acids are very sensitive to lipid oxidation (Nawar,
1996). Moreover, most of those free fatty acids are long chain polyunsaturated fatty acids (Alasnier et
al., 2000b), which enhance oxidative reactions.
7.4.- Protein oxidation In meat and meat products, both protein and lipid oxidation are processes closely related (Mercier et
al., 1998, 2004; Ventanas et al, 2006b), being protein oxidation affected by similar oxidation
promoters capable to oxidize unsaturated fatty acids (muscle heme pigments, transition metals,
oxidative enzymes…). Protein oxidation undergoes similar processes to those described for lipid
oxidation, involving initiation, propagation and termination stages (Schaich, 1980). Oxidative
processes of proteins involve the oxidation of aminoacids, especially aminoacids with reactive side
chains (sulphydryl, thioether, amino, imidazole or indole ring) by free-radicals and non-radicals
reactive oxygen substances. The oxidation of proteins leads to the loss of sulphydryl groups and the
formation of carbonyl compounds (Xiong, 2000) which have been used to measure the extent of
protein oxidation (Levine et al., 1990; Mercier et al., 1998; Ventanas et al, 2006a). In meat, protein
oxidation processes occur after slaughter in myofibrillar proteins (Martinaud et al., 1997). The
consequences of protein oxidation are not clear but they could be linked with a decrease in muscle
protein functionality contributing to decrease water holding capacity and changes in textural
characteristics (Xiong, 2000; Huff-Lonergan and Lonergan, 2005) and modifications in the nutritional
value (Meucci et al., 1991; Liu and Xiong, 1997).
BIBLIOGRAPHY Aberle E. D., Forrest J. C., Gerrard D. E., Mille E.
W., Hedrick H. B., Judge M. D., and Merkel R. A. (2001). Principles of Meat Science. Dubuque, IA, USA: Kendall/Hunt Co.
AICE, (2005). Asociación de industrias de la carne en España. www.aice.es
Alasnier C., and Gandemer G. (1998). Fatty acid and aldehyde composition of individual phospholipid classes of rabbit skeletal muscles is related to the metabolic type of the fibre. Meat Science, 48, 314, 225-235
Alasnier, C., Meynier, A., Viau, M.,and Gandemer,G. (2000a). Hydrolytic and oxidative changes in the lipids of chicken breast and thigh muscles during refrigerated storage. Journal of Food Science, 65, 9–14.
Alasnier C., David-Briand E., and Gandemer G. (2000b). Lipolysis in muscles during refrigerated storage as related to the metabolic type of the fibres in the rabbit. Meat Science, 54, 127–134.
Alasnier C., Rémignon H. and Gandemer G. (1996). Lipid Characteristics Associated with Oxidative and Glycolytic Fibres in Rabbit Muscles. Meat Science, 43, Nos 3- 4. 213- 224.
Andersen, H., and Skibsted, L. H. (1992). Kinetics and mechanism of thermal oxidation and photooxidation of nitrosylmyoglobin in aqueous
solution. Journal of Agricultural and Food Chemistry, 40, 1741–1750.
Andrés A.I., Cava R., Ventanas J., Thovar V., Ruiz J. (2004). Sensory characteristics of Iberian ham: Influence of salt content and processing conditions. Meat Science, 68, 45–51
Andrés A.I., Ruiz J., Ventanas J., Tejeda J.F., Mayoral A.I. (1999). Muscle fibre types in Iberian pigs: influence of crossbreeding with Duroc breed and rearing conditions. Annales de Zootechnie. 48, 397-405.
Andrés, A.I., Cava, R., Mayoral, A.I, Tejeda, J.F., Morcuende, D., Ruiz, J. (2001) Oxidative stability and fatty acid composition of pig muscles as affected by rearing system, crossbreeding and metabolic type of muscle fibre Meat Science 59, 1, 39–47
Antequera T., Garcia C., Lopez-Bote C., Ventanas J., Asensio M. A. and Cordoba J. J. (1994). Evolution of different physicochemical parameters during ripening Iberian ham from Iberian (loo-percent) and Iberian x Duroc pigs (50%). Revista española de Ciencia y Tecnologia de Alimentos 34, 178-190.
Aparicio Macarro J.B. (1987). El cerdo Ibérico. Premio de Investigación Sánchez Romero Carvajal. Jabugo. S.A.
26
Introduction
Aristtoy M-C. and Toldrá F., (1998). Concentration of free amino acids and dipeptides in porcine skeletal muscles with different oxidative patterns. Meat Science 50, 327–332
Armero E., Flores M., Toldrá F., Barbosa J., Olivet J., Pla M. and Baselga M. (1999). Effects of pig sire type and sex on carcass traits, meat quality and sensory quality of dry cured ham. Journal of Science of Food and Agriculture, 79, 1147-1154
Arnau J. (1998) Principales problemas tecnológicos en la elaboración de jamón curado. In Special Symposium-44th ICOMST Barcelona, Spain, pp.72–86.
Bañón S., Gil M.D. and Garrido M.D. (2003). The effeect of castration on the eating quality of dry-cured ham. Meat Science, 65, 1031-1037.
Baron C., Andersen H., (2002) Myoglobin-Induced Lipid Oxidation. A Review. J. Agricultural Food Chemistry, 50, 3887- 3897
Barton-Gade P. A. (1987). Meat and fat quality in boars, castrates and gilts. Livestock Production Science, 16, 187–196.
Bendall J.R. and Swatland H.J. (1988). A review of the relationships of pH with physical aspects of pork quality. Meat Science, 24, 85-126.
Blanchard P.J., Ellis M., Warkup C.C., Hardy B., Chatwick J.P. and Deans G.A. (1999). The influence of rate of lean and fat tissue development on pork eating quality. Animal Science, 68, 477-485.
Blasco A., Gou P., Gispert M., Estan J., Soler Q., A. Diestre and J. Tibau (1994). Comparison of five types of pig crosses. I. growth and carcass traits. Livestock Production Science, 40, 2, 171-178
Briggs H.M. (1969). Modern Breeds of Livestock. Third Edition, Mac Millan Company.
Briskey E.J. (1964). Etiological status associated studies of pale, soft, exudative porcine musculature. Advances in Food Research, 13, 89-178.
Buscailhon S., Berdagué J. L., Gandemer G., Touraille C., and Monin G. (1994). Effects of initial pH on compositional changes and sensory traits of french dry-cured hams. Journal of Muscle Foods, 5, 257–270.
Buxadé C., (2000). Estructura del subsector. En: Porcino Ibérico: aspectos claves. Coordinadores: Buxadé Carbó C., Daza Andrada A. Mundi- Prensa. Madrid
Cameron N. D., Enser M. B. (1991) Fatty acid composition of lipid in Longissimus dorsi muscle of Duroc and British Landrace pigs and its relationship with eating quality. Meat Science, 29, 4, 295-307
Candek-Potokar M., Zlender B. y Bonhneau M. (1998). Effects of breed an slaughter weight on longissimus dorsi muscle biochemical traits and sensory quality in pigs. Annuales de la Zootenchnie, 47, 3-16.
Carrapiso A.I., Bonilla F., García C. (2003). Effect of crossbreeding and rearing system on sensory characteristics of Iberian ham. Meat Science, 65, 623–629
Carrapiso A.I., Jurado A., Timón M.L., García C. (2002a). Odor-active compounds of Iberian
hams with different aroma characteristics. Journal Agricultural Food Chemistry, 50, 6453-6458
Carrapiso A.I., Ventanas J., García C. (2002b). Characterization of the Most Odor-Active Compounds of Iberian Ham Headspace J. Agricultural and Food Chemistry, 50, 1996-2000
Cassens R. G., Marple D. N., and Eikelenboom G. (1975). Animal physiology and meat quality. Advanced Food Research, 21, 71-155.
Cava R., Estévez M., Ruiz J., Morcuende D. (2003). Physicochemical characteristics of three muscles from free-range reared Iberian pigs slaughtered at 90 kg live weight. Meat Science 63, 533–541
Cava R., Ruiz J., López-Bote C., Martín L., García C., Ventanas J., Antequera T. (1997). Influence of finishing diet on fatty acid profiles of intramuscular lipids, triglycerides and phospholipids in muscles of the Iberian pig. Meat Science, 45, 2, 263-270
Cava R., Ruíz J., Ventanas J., and Antequera T. (1999). Oxidative and lipolytic changes during ripening of Iberian hams as affected by feeding regime: extensive feeding and alpha-tocopheryl acetate supplementation. Meat Science, 52, 2, 165-172.
Cava R., Ventanas J., Ruiz J., Andrés A.I., Antequera T. (2000a). Sensory characteristics of Iberian ham: Influence of rearing system and muscle location. Food Science and Technology International, 6, 3, 235-242.
Cava R., Ventanas J., Tejeda, J.F., Ruiz J. (2000b). Effect of free-range rearing and α-tocopherol and copper supplementation on fatty acid profiles and susceptibility to lipid oxidation of fresh meat from Iberian pigs. Food Chemistry, 68, 51-59
Chasco J, Lizaso G., Beriain MJ. (1996). Cured colour development during sausage processing. Meat Science, 44, 203–211.
Chizzolini R., Novelli E. and Zanardi E. (1998) Oxidation in traditional mediterranean meat products. Meat Science, 49, 1, S87-S99
Chizzolini R., Novelli E., Campanini G., Dazzi G., Madarena G., Zanardi E., Pachioli M.T., Rossi A., (1996) Lean Colour of Green and Matured Parma Hams: Comparative Evaluation and Technological Relevance of Sensory and Objective Data. Meat Science, 44, 3, 159- 172
Cilla I., Martínez L., Beltrán J.A., Roncalés P. (2005) Factors affecting acceptability of dry-cured ham throughout extended maturation under ‘‘bodega’’ conditions. Meat Science, 69, 789–795
Cilla, I., Altarriba, J., Guerrero, L., Gispert, M., Martínez, L., Moreno, C., Beltrán, J.A., Guàrdia, M.D., Diestre, A., Arnau, J., and Roncalés, P. (2006) Effect of different Duroc line sires on carcass composition, meat quality and dry-cured ham acceptability Meat Science, 72, 2, 252-260
Ciobanu, D., Bastiaansen, J., Malek, M., Helm, J., Woollard, J., Plastow, G. and Rotschild, M. (2001). Evidence for new alleles in the protein kinase adenosine monophosphateactivated γ3-subunit gene associated with low glycogen
27

Introduction
content in pig skeletal muscle and improved meat quality. Genetics, 159, 1151-1162.
Coutron-Gambotti C., Gandemer G., and Casabianca F. (1998) Effects of Substituting a Concentrated Diet for Chestnuts on the Lipid Traits of Muscle and Adipose Tissues in Corsican and Corsican × Large White Pigs Reared in a Sylvo-Pastoral System in Corsica. Meat Science, 50, 2, 163-174
Cruz (2006) El sector ibérico: análisis de la producción de carnes frescas y elaboración de productos curados. Nº141. Eurocarne.
Daza A. (2000). Sistemas de Explotación. . En: Porcino Ibérico: aspectos claves. Coordinadores: Buxadé Carbó C., Daza Andrada A. Mundi- Prensa. Madrid
Diesbourg, L., Swatland, H. J., and Millman, B. M. (1988). X-raydiffraction measurements of postmortem changes in the myofilament lattice of pork. Journal of Animal Science, 66, 1048–1054.
Dobao, M. T., Rodriganez, J. and Silio, L. (1986) Heritability of a canalized trait-teat number in
Elliott, G. F. (1968). Force-balances and stability in hexagonally-packed polyelectrolyte systems. Journal of Theoretical Biology, 21, 71 –87.
Ellis, M. and McKey, F.K. (1993). Factors affecting quality of pork. In Growth of the pig. Ed. Hollis G.R. CAB International. Pp 215-239.
Ellis, M. Webb, A.J., Avery, P.J. and Brown, I. (1996). The influence of terminal sire genotype, slaughter weight, feeding regime and slaughterhouse on growth performance and carcass and meat quality in pigs and on organoleptic properties of fresh pork. Animal Science, 62, 521-530.
Essén-Gustavsson, B. Karlsson A., Lundström K., Enfält A. -C. (1994) Intramuscular fat and muscle fibre lipid contents in halothane-gene-free pigs fed high or low protein diets and its relation to meat quality . Meat Science, 38, 2, 269-277
Estévez M., Morcuende D., Cava, R. (2003a). Oxidative and colour changes in meat from three lines of free-range reared Iberian pigs slaughtered at 90 kg live weight and from industrial pig during refrigerated storage. Meat Science, 65, 3, 1139-1146
Estévez M., Morcuende D., Cava, R. (2003b). Physico-chemical characteristics of M. Longissimus dorsi from three lines of free-range reared Iberian pigs slaughtered at 90 kg live-weight and commercial pigs: a comparative study.Meat Science, 64, 4, 499-506.
Faustman, C. and Cassens, R.G. (1990). The biochemical basis for discoloration in fresh meat: a review. Journal of Muscle Foods, 1, 217-243.
Faustman, C., Cassens, R.G., Schaefer, D.M., Buege, D.R., Williams, S.N. and Scheller, K.K. (1989). Improvement of pigment and lipid stability in Holstein steers by dietary supplementation with vitamin E. Journal of Food Science, 54, 858-862.
Flores, M., Alasnier, C., Aristoy, M. C., Navarro, J. L., Gandemer, G., and Toldrá, F. (1996). Activity of aminopeptidase and lipolytic
enzymes in five skeletal muscles with various oxidative patterns. Journal of the Science of Food and Agriculture, 70, 127–130.
Fontanillas, R., Barroeta, A., Baucells, M. D., and Guardiola, F. (1998). Backfat acid evolution in swine fed diets high in either Cis-monounsaturated, trans or (n-3) fats. Journal of Animal Science, 76, 1045–1055.
Fortin, A., Robertson, W.,M. and Tong, A.K.W. (2005). The eating quality of Canadian pork and its relationship with intramuscular fat. Meat Science, 69, 297-305.
Frankel E. N. (1982). Volatile lipid oxidation products. Progress in Lipid Research, 22, 133.
Frankel E. N. (1985). Chemistry of autoxidation: Mechanism, products and flavor significance. In D. B. Min, and T. Smouse (Eds.), Flavor chemistry of fats and oils (pp. 1–37). Champaign, Illinois: American Oil Chemist Society Press.
Gandemer, G. (2002). Lipids in muscles and adipose tissues, changes during processing and sensory properties of meat products. Meat Science, 62, 309-321.
García C., Berdagué J. J., Antequera T., López-Bote C., Córdoba J. J., and Ventanas J. (1991). Volatile compounds of dry cured Iberian ham. Food Chemistry, 41, 23–32.
García-Macías J.A., Gispert, M., Oliver, M.A, Diestre A., Alonso, P., Muñoz-Luna A., Siggens K. and Cuthbert-Heavens D. (1996). The Effect of Cross, Slaughter Weight and Halothane Genotype on the Leanness and Meat and Fat Quality in Pigs Carcasses. Animal Science, 63, 487-496.
García-Rey RM., García-Garrido J.A., Quiles-Zafra R., Tapiador J., Luque de Castro M.D. (2004). Relationship between pH before salting and dry-cured ham quality. Meat Science 67, 625–632
Gerbens F. (2004) Genetic Control of Intramuscular Fat Accretion. Ed. Pas, M. F. W te. In Muscle Development of Livestock Animals : Physiology, Genetics, and Meat Quality.Editorial CABI Publishing.
Giddings G.G., (1977). The basis of color in muscle foods. CRC Critical Reviews in Food Technology, 9, 81-114.
Gondret, F., Lefaucheur, L., Louveau, I., Lebret, B., Pichodo, X., Le Cozler, Y. (2005). Influence of piglet birth weight on postnatal growth performance, tissue lipogenic capacity and muscle histological traits at market weight. Livestock Production Science, 93, 2, 15, 137-146
Gou P., Guerrero L. and Arnau J. (1995). Sex and crossbred effect of the characteristics of dry-cured ham. Meat Science, 40, 21-31.
Govindarajan S. (1973). Fresh meat colour. CRC Critical Reviews in Food Technology, 1, 117-140.
Gray, J.I., Gomaa, E.A., and Buckley, D.J. (1996) Oxidative Quality and Shelf life of meats. Meat Science, 43, S, S111-123.
Guerrero L., Gou P., Alonso P. and Arnau J. (1996). Study of the physicochemical and sensorial characteristics of dry-cured ham in 3
28

Introduction
pig genetic lines. Journal of Science of Food and Agriculture, 70, 4, 526-530
Guerrero, L., Gou, P., and Arnau, J. (1999). The influence of meat pH on mechanical and sensory texture properties of dry–cured ham. Meat Science, 52, 267–273.
Halliwell, B.; Gutteridge, J. M. C. Free Radicals in Biology and Medicine, 2nd ed.; Clarendon Press/Oxford University Press:New York, 1989.
Hamm R. (1975). Muskelfarbstoff und Fleischfarbe. Die Fleischwirtschaft. 10, 1415-1418.
Henckel P., Oksbjerg N., Erlandsen E., Barton-Gade P. and Bejerholm C., (1997). Histo- and biochemical characteristics of the Longissimus dorsi muscle in pigs and their relationships to performance and meat quality. Meat Science 47, pp. 311–321
Hernández P., Navarro J. L., and Toldrá F. (1998). Lipid composition and lipolytic enzyme activities in porcine skeletal muscles with different oxidative pattern. Meat Science, 49, 1–10.
Hovenier, R., Brascamp E.W., Kanis, E., Van Der Werf J.H.J. and Wassenber. A. (1993). Economic values for optimal traits: the example of meat quality in pigs. Journal of Animal Science. 71, 1429-1433.
Huff-Lonergan E., and Lonergan S. M. (2005) Mechanisms of water-holding capacity of meat: The role of postmortem biochemical and structural changes. Meat Science, 71, 1, 194-204
Jeremiah. L.E., Gibson, J.P., Gibson, L.L., Ball, R.O., Acker, C. and Fortin, A. (1999). The influence of breed gender and PSS (halothane) genotype on meat quality, cooking loss, and palatability of pork. Food Research International, 32, 59-71.
Juncher, D., Ronn, B., Mortensen, E.T., Henckel, P., Karlsson A., Skibsted L.H.,and Bertelsen, G. (2001) Effect of pre-slaughter physiological conditions on the oxidative stability of colour and lipid during chill storage of pork. Meat Science 58, 347-357.
Kanner, J. (1994). Oxidative processes in meat and meat products: Quality implications. Meat Science, 36, 169-186
Krammer, A. (1994). Use of color measurements in quality control of food. Food Technology, 48, 10, 62–71.
Lawrie, R. A. (1998). Lawrie_s meat science (pp. 216) (6th ed.). Cambridge, England: Woodhead, Ltd.
Ledward,D. A. (1992). Color of raw and cooked meat. In D. A. Ledward,D. E. Johnston, and M. K. Knight (Eds.), The chemistry of muscle based foods (pp. 128–144). Cambridge,UK: The Royal Society of Chemistry.
Levine, R.L., Garland, D., Oliver, C.N., Amici, A., Climent, I., Lenz, A.G., Ahn, B.W., Shatiel, S. and Stadtman, E.R. (1990). Determination of carbonyl content in oxidatively modified proteins. Methods in Enzymology, 186, 141-151.
Liu, G. and Xiong, Y.L. (1997). Thermal denaturation and in vitro digestibility of oxidized
myosin. IFT Annual Meeting: Book of Abstracts. Abst. 56-4.
Lonergan, S. M., Huff-Lonergan, E., Rowe, L.J., Kuhlers, D. L., and Jungst, S.B. (2001) Selection for lean growth efficiency in Duroc pigs influences pork quality. Journal Animal Science, 79, 2075-2085
López, M. O., De la Hoz, L., Cambero, M. I., Gallardo, E., Reglero, G., and Ordóñez, J. A. (1992). Volatile compounds of dry hams from Iberian pigs. Meat Science, 31, 267–277.
López-Bote, C.J. (1998). Sustained utilisation of the Iberian pig breed. Meat Science, 49, Suppl. I, Sl7-S27.
Lundström, K., Andersson, A., and Hansson, I. (1996). Effect of the RN gene on technological and sensory meat quality in crossbred pigs with Hampshire as terminal sire. Meat Science, 42, 145–153.
Martel, J., Minvielle, F. and Poste, L.M. (1988). Effect of crossbreeding and sex on carcass composition, cooking properties and sensory characteristics of pork. Journal of Animal Science, 66, 41-46.
Martín A., Córdoba J.J., Aranda E., Guía Córdoba M., Asensio M.A. (in press) Contribution of a selected fungal population to the volatile compounds on dry-cured ham. International Journal of Food Microbiology
Martín L., Córdoba J.J., Ventanas J., Antequera T. (1999). Changes in intramuscular lipids during ripening of Iberian dry-cured ham. Meat Science 51, 129-134
Martinaud, A., Mercier, Y., Marinova, P., Tassy, C., Gatellier, P., and Renerre, M. (1997). Comparison of oxidative processes on myofibrillar proteins from beef during maturation and by different model oxidation systems. Journal of Agricultural and Food Chemistry, 45, 2481–2487.
Mercier, Y., Gatellier, P. and Renerre, M. (2004) Lipid and protein oxidation in vitro, and antioxidant potential in meat from Charolais cows finished on pasture or mixed diet Meat Science, 66, 2, 467-473
Mercier, Y., Gatellier, P., Viau, M., Remignon, H., and Renerre, M. (1998) Effect of dietary fat and vitamin E on colour stability and on lipid and protein oxidation in turkey meat during storage, Meat Science, 48, 3-4, 301-318
Meucci, E., Mordente, A., and Martorana, A., (1991). Metal-catalyzed oxidation of human serum albumin: conformational and functional changes. Journal of Biological Chemistry, 266, 4692-4699.
Milan, D., Jeon, J.-T., Looft, C., Amarger, V., Robic, A., Thelander, M., Rogel-Gaillard, C., Paul, S., Iannuccelli, N., Rask, L., Ronne, H., Lundström, K., Reinsch, R., Gellin, J., Kalm, E., Le Roy, P., Chardon, P. and Andersson, L. (2000). A mutation in PRKAG3 associated with excess glycogen content in pig skeletal muscle. Meat Science, 288, 1248-1251.
Moerck, K.E. and Ball, H.R. (1974). Lipids autoxidation in mechanically deboned chicken meat. Journal of Food Science, 39, 876-879.
29

Introduction
Morales, J., Pérez, J. F., Baucells, M. D., Mourot, J., and Gasa, J. (2002). Comparative digestibility and lipogenic activity in Landrace and Iberian finishing pigs fed ad libitum corn- and corn–sorghum–acorn-based diets. Livestock Production Science, 77 (2-3), 195-205.
Morcuende D., Estévez M., Ruiz, J., Cava, R. (2003) Oxidative and lipolytic deterioration of different muscles from free-range reared Iberian pigs under refrigerated storage. Meat Science, 65, 1157-1164.
Morcuende, D., Estévez, M., Ramírez, R., and Cava, R. (in press). Effect of the Iberian x Duroc reciprocal cross on production parameters, meat quality and lipogenic enzyme activities. Meat Science
Morrissey, P.A., Sheehy, P.J.A., Galvin, K., Kerry, J.P, and Buckley, D.J. (1998). Lipid stability in meat and meat products. Meat Science, 49, Supplement 1, S73-S86
Mourot, J., Kouba, M. (1998). Lipogenic enzyme activities in muscles of growing Large White and Meishan pigs. Livestock Production Science, 55, 127–133
Naveau, J. (1986). The genetic determination of meat quality in pigs. Heritability of the technological yield of meat prepared by the ‘‘Napole’’ method. Journe´es de la Recherche Porcine en France, 18, 265–276.
Nawar, WW. (1996). Lipids. In Food Chemistry, O.R. Fennema (ed.), Marcel Dekker, Inc., New York, 225-319
Nilzén V., Babol J., Dutta P. C., Lundeheim N., Enfält A. C., Lundström K. (2001). Free range rearing of pigs with access to pasture grazing—effect on fatty acid composition and lipid oxidation products. Meat Science, 58, 267–275
Nold R.A., Romans J.R., Costello W.J., Henson J.A., Libal G.W. (1997). Sensory characteristics and carcass traits of board, barrow, and gilts fed high or adequate protein diets and slaughtered at 100 or 110kg. Journal of Animal Science, 75, 2641-2651.
Nuñez F., Rodriguez M.M., Cordoba J.J., Bermúdez M. E. and Asensio M. A. (1996). Yeast population during ripening of dry-cured Iberian ham. International Journal of Food Microbiology 29, 27 l-280.
Offer G. (1991). Modelling of the formation of pale, soft and exudative meat: effect of chilling regime and rate and extent of glycolysis. Meat Science, 30, 157–184.
Offer, G., and Knight, P. (1988). The structural basis of water-holding in meat. Part 2: drip losses. In R. Lawrie (Ed.), Development in meat science 4 (pp. 172–243). London: Elsevier Applied Science.
O’Hea, E.K., and Leveille, G.A. (1969) Significance of adipose tissue and liver as sites of fatty acid synthesis in the pig and the efficiency of utilization of various substrates for lipogenesis. Journal Nutr, 99, 338-344.
Petrón M. J., Muriel E., Timón M. L., Martín L. and Antequera T. (2004). Fatty acids and triacylglycerols profiles from different types of
Iberian dry-cured hams. Meat Science, 68, 1, 71-77
Pettigrew J. E. and. Esnaola M. A. Swine nutrition and pork quality: A review. J. Anim. Sci. 79(E. Suppl.): E316–E342
Renerre, M. (1990). Review: factors involved in the discoloration of beef meat. International Journal of Food Science and Technology, 25, 613–630.
Rey A.I., Daza A., López-Carrasco C., López-Bote C.J. (2006). Feeding Iberian pigs with acorns and grass in either free-range or confinement affects the carcass characteristics and fatty acids and tocopherols accumulation in Longissimus dorsi muscle and backfat. Meat Science, 73, 1, 66-74
Romans, J. R., Johnson, R. C., Wulf, D. M., Libal, G. W., and Costello, W. J. (1995). Effects of ground flaxseed in swine diet on pigs performance and on physical and sensory characteristics and omega-3 fatty acid content of pork: I. Dietary level of flaxseed. Journal of Animal Science, 73, 1982–1989.
Rosenvold K., and Andersen H.J. (2003). Factors of significance for pork quality—a review. Meat Science, 64, 3, 219-237
Ruiz J., Ventanas J., Cava R., Andrés A., García C.(1999). Volatile compounds of dry-cured Iberian ham as affected by the length of the curing process. Meat Science, 52, 19-27
Ruiz J., Ventanas J., Cava, R., Timón M. L. and García C. (1998) Sensory characteristics of Iberian ham: influence of processing time and slice location. Food Research International, 31, No. 1, 53-58.
Ruiz, J., García, C., Muriel, E., Andrés, A. I. and Ventanas J. (2002). Influence of sensory characteristics on the acceptability of dry-cured ham. Meat Science, 61, 4, 347-354.
Ruiz-Carrascal, J. Ventanas, J. Cava, R. Andrés A. I. and García C. (2000) Texture and appearance of dry cured ham as affected by fat content and fatty acid composition. Food Research International, 33, 2, 91-95.
Ruiz-Ramírez J., Arnau J., Serra X., Gou P. (2005) Relationship between water content, NaCl content, pH and texture parameters in dry-cured muscles. Meat Science, 70, 579–587
Sabio E., Vidal-Aragón M.C., Bernalte M.J., Gata J.L. (1998) Volatile compounds present in six different types of dry-cured ham from south European countries. Food Chemistry, 61, 4, 493,503
Schaich, K. M. (1980). Free radical initiation in proteins and amino acids by ionizing and ultraviolet radiations and lipid oxidation. III: Free radical transfer from oxidizing lipids. CRC Critical Reviews in Food Science and Nutrition, 13, 189–244.
Schaich, K. M. (1992). Metals and lipid oxidation. Contemporary issues. Lipids, 27, 209-218.
Sellier, P. (1998). Genetics of meat and carcass traits. In M. Rothschild, and A. Ruvinsky (Eds.), The genetics of the pig (pp. 463–510). Wallingford, UK: CAB International.
Sellier, P. and Monin, G. (1994). Genetics of pig meat quality: A review. Journal of Muscle Foods, 5, 187-219.
30
Introduction
Shahidi F., Rubin L. J., D’Souza L. A. (1986). Meat flavor volatiles: a review of the composition, techniqueof analysis and sensory evaluation. CRC Crit. Rev. Food Sci. Nutr., 24, 141–243.
Smulders F. J. M., Toldrá F., Flores J., and Prieto M. (1992). New technologies for meat and meat products (pp. 182,186–188). Utrecht, The Netherlands: Audet Tijdschriften.
Soriano A., Quiles R., Mariscal C., García-Ruiz A.. (2005). Pig sire type and sex effects on carcass traits, meat quality and physicochemical and sensory characteristics of Serrano dry-cured ham. Journal of the Science of Food and Agriculture 85, 1914–1924.
Steffen, D.G., Brown, L.J., Mersmann, H.J. (1978). Ontogenic development of swine (Sus domesticus) adipose tissue lipases. Comp. Biochem. Physil. 59B, 195-201.
Stryer L. (1981). Biochemistry. 2nd Edition. W.H. Freeman and Company, San Francisco, California. USA. 949 .
Tejeda J.F., Gandemer G., Antequera T., Viau M., García C. (2002). Lipid traits of muscles as related to genotype and fattening diet in Iberian pigs: total intramuscular lipids and triacylglycerols. Meat Science, 60, 357–363
Terlow C. (2005) Stress reactions at slaughter and meat quality in pigs: genetic background and prior experience. A brief review of recent findings. Livestock Production Science, 94, 125–135
Tibau J., Puigvert X., Soler J., Trilla N., Diestr. A., Gispert M., Fernández J., Manteca X. (1997). Incidencia de Factores Genéticos y de Comportamiento en la Eficiencia del Crecimiento, la Composición y la Calidad de la Canal y de la Carne en Distintas Razas Porcinas. Anaporc, 171, 74-91.
Toldrá F., Flores M., Sanz Y. (1997) Dry-cured ham flavour: enzymatic generation and process influence. Food Chemistry, 59, 4. 523 -530.
Ventanas, S., Ventanas J., Jurado A., Estévez M. (2006a). Quality traits in muscle biceps femoris and back-fat from purebred Iberian and reciprocal Iberian x Duroc crossbred pigs. Meat Science 73 , 651–659
Ventanas, S., Estevez, M., Tejeda, J.F., and Ruiz, J. (2006b) Protein and lipid oxidation in Longissimus dorsi and dry-cured loin from Iberian pigs as affected by crossbreeding and diet. Meat Science, 72, 4, 647-655.
Ventanas S., Ventanas J., Ruiz J. (in press) Sensory characteristics of Iberian dry-cured loins: Influence of crossbreeding and rearing system. Meat Science
Verbeke W., Van Oeckel M. J., Warnants N., Viaene J. and Boucque C. V. (1999) Consumer perceptions, facts and possibilities to improve acceptability of health and sensory characteristics of pork. Meat Science, 53, 77– 99.
Warnants N., Van Oeckel M. J., and Boucquè Ch.V. (1996). Incorporation of dietary polyunsaturated fatty acids in pork tissues and its implications for the quality of the end products. Meat Science, 44, 125–144.
Warnants N., Van Oeckel M. J., and Boucquè Ch.V. (1999). Incorporation of dietary polyunsaturated fatty acids into pork fatty tissues. Journal of Animal Science, 77, 2478–2490.
Warris P.D. and Brown S.N. (1987). The relationship between initial pH, reflectance and exudation in pig muscle. Meat Science, 20, 65-74.
Wismer-Pedersen J., (1987). Water. In: Price, J.F., Schweigert, B.S. (Eds.), The Science of Meat and Meat Products, (3rd edition)- Food and Nutrition Press, Connecticut, USA.
Wood J. D. (1984). Fat deposition and the quality of fat tissue in meat animals. In J. Wiseman (Ed.), Fats in animal nutrition (pp. 407–435). London: Butterworths.
Xiong Y. L. (2000). Protein oxidation and implications for muscle foods quality. In E. A. Decker, C. Faustman, and C. J. Lopez-Bote (Eds.), Antioxidants in muscle foods (pp. 85–111). New York: Wiley.
Yin M.C., Faustman C., Riesen J.W. and Williams S.N. (1993). Alpha-tocopherol and ascorbate delay oxymyoglobin and phospholipids oxidation in vitro. Journal of Food Science, 58, 1273-1276, 1281.
31


Approach, objectives and experimental design


Approach, objectives and experimental design
2. APPROACH, OBJECTIVES AND EXPERIMENTAL DESIGN. Iberian dry-cured meat products are highly appreciated by consumers because of their high sensory
quality. This is a result of three main factors the rearing system, the manufacture process and the
characteristics of the Iberian pig breed.
In the last years, the high consumer’s demand of the Iberian meat products has conducted to a fast
growing of this market which is still increasing. In order to provide raw materials to the industry, the
traditional rearing system has changed, and nowadays, semi-intensive systems and crossbreeding
with Duroc breed are common in the Iberian pig productive sector.
The high growth of Iberian sector has needed a specific law, which was passed in 2001 (BOE, 2001)
and that regulates the manufacture of dry-cured products with the label of “Iberian”. This law
regulates the rearing and feeding of the animals (free-range reared or fed on concentrates, age and
slaughter weight …), the conditions of maturation of the products (relative humidity and temperature
conditions, duration of each maturation phase and the length of the process…) and specially the
breed of the pigs (pure Iberian pigs or Duroc x Iberian crossed pigs). Concerning this last point, it is
required the use of pure Iberian pigs (labelled as “Ibérico puro”, “pure Iberian”) or Duroc x Iberian
crossed pigs (labelled as “Ibérico”, “Iberian”) in which the females must be a pure Iberian pig sow, in
order to preserve the purity of Iberian breed and their biodiversity.
The crosses with Duroc breed are so popular because they improve productive parameters of Iberian
pigs, such as the increase in 1-2 piglets/sow. Besides, they also improve the growth rate, and the
weight at weaning and at the end of fattening (Dobao et al.., 1986, Aparicio, 1987) and without an
important decrease in the quality of meat and dry-cured meat products (Tejeda et al.., 2002,
Antequera et al.., 1994, Andrés et al.., 2001). However, there is some controversy about the effect
of crossbreeding with Duroc. Some authors (Carrapiso et al.., 2003) have reported that
crossbreeding had a slight effect on dry- cured ham quality. In the contrary, other authors (Ventanas
et al.., 2006, Ventanas et al.., in press) have reported a marked decrease of meat and dry-cured loin
quality in Iberian x Duroc genotypes respect to those from pure Iberian pigs.
However, the Duroc genotype used in these crosses also should be taken into account, as Duroc
cannot be considered a homogeneous breed due to its widespread distribution. Therefore, the
characterization of the different lines of Duroc for Iberian production seems to be of prime
importance. There are previous studies which evidence some differences between Duroc lines
(Soriano et al.., 2005, Cilla et al.., 2006) in terms of carcass composition and fresh meat and dry-
cured ham quality. In addition, Lonergan et al.., (2001) compared different selected Duroc lines and found that the Duroc
line selected to increase lean growth efficiency decreased meat quality. In addition, there are some
previous studies about the effect of the reciprocal cross (Morcuende et al.., in press; Ventanas et al..,
2006) but there are no previous research about the influence of the Duroc line in the crosses with
Iberian and their consequences the productive parameters and the quality of meat and dry-cured
meat products.
35
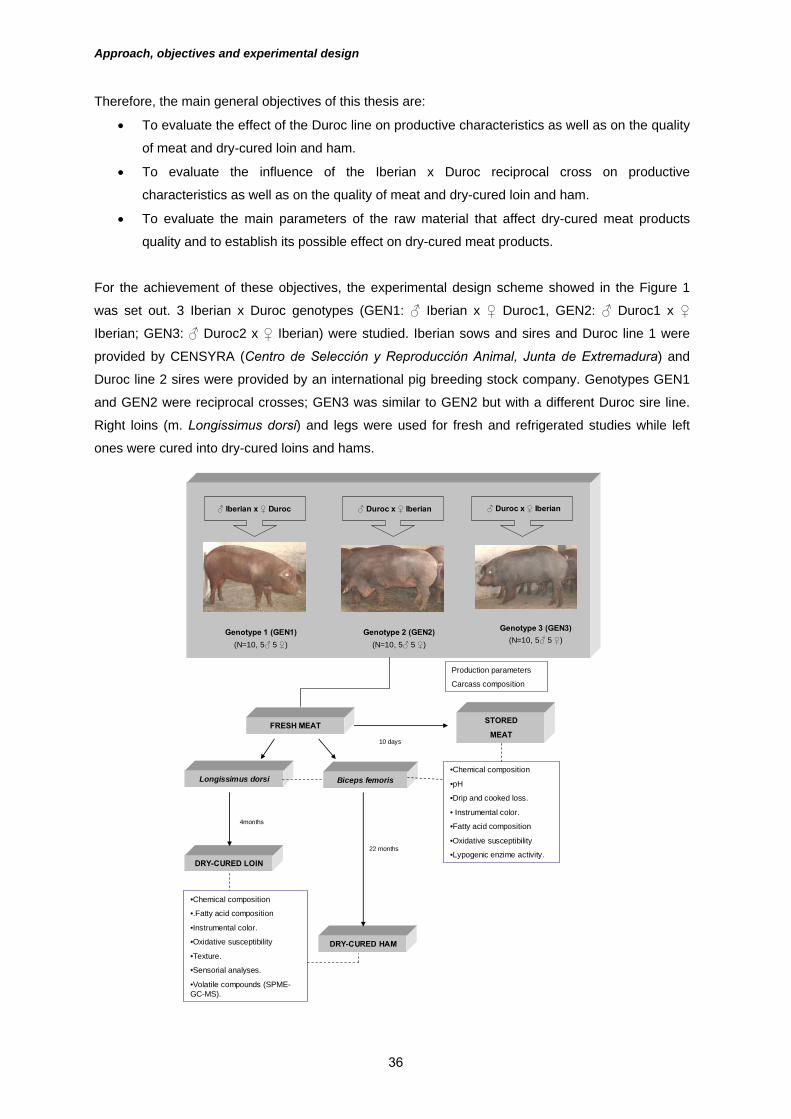
Approach, objectives and experimental design
Therefore, the main general objectives of this thesis are:
• To evaluate the effect of the Duroc line on productive characteristics as well as on the quality
of meat and dry-cured loin and ham.
• To evaluate the influence of the Iberian x Duroc reciprocal cross on productive
characteristics as well as on the quality of meat and dry-cured loin and ham.
• To evaluate the main parameters of the raw material that affect dry-cured meat products
quality and to establish its possible effect on dry-cured meat products.
For the achievement of these objectives, the experimental design scheme showed in the Figure 1
was set out. 3 Iberian x Duroc genotypes (GEN1: ♂ Iberian x ♀ Duroc1, GEN2: ♂ Duroc1 x ♀
Iberian; GEN3: ♂ Duroc2 x ♀ Iberian) were studied. Iberian sows and sires and Duroc line 1 were
provided by CENSYRA (Centro de Selección y Reproducción Animal, Junta de Extremadura) and
Duroc line 2 sires were provided by an international pig breeding stock company. Genotypes GEN1
and GEN2 were reciprocal crosses; GEN3 was similar to GEN2 but with a different Duroc sire line.
Right loins (m. Longissimus dorsi) and legs were used for fresh and refrigerated studies while left
ones were cured into dry-cured loins and hams.
Genotype 1 (GEN1)(N=10, 5♂ 5 ♀)
Genotype 2 (GEN2)(N=10, 5♂ 5 ♀)
Genotype 3 (GEN3)(N=10, 5♂ 5 ♀)
FRESH MEAT STORED
MEAT
Longissimus dorsi Biceps femoris
DRY-CURED LOIN
DRY-CURED HAM
10 days
22 months
4months
Production parameters
Carcass composition
•Chemical composition
•pH
•Drip and cooked loss.
• Instrumental color.
•Fatty acid composition
•Oxidative susceptibility
•Lypogenic enzime activity.
•Chemical composition
•.Fatty acid composition
•Instrumental color.
•Oxidative susceptibility
•Texture.
•Sensorial analyses.
•Volatile compounds (SPME-GC-MS).
♂ Iberian x ♀ Duroc ♂ Duroc x ♀ Iberian ♂ Duroc x ♀ Iberian
36

Approach, objectives and experimental design
In order to facilitate the presentation and discussion of findings, this thesis has been divided in 8
chapters:
Chapter 1. “CARCASS COMPOSITION AND MEAT QUALITY OF 3 DIFFERENT IBERIAN
X DUROC GENOTYPE PIGS”
Chapter 2. “FATTY ACID COMPOSITION AND ADIPOGENIC ENZYME ACTIVITY OF
MUSCLE AND ADIPOSE TISSUE AS AFFECTED BY IBERIAN x DUROC PIG GENOTYPE”
Chapter 3. ”THE CROSSBREEDING OF DIFFERENT DUROC LINES WITH IBERIAN PIG
AFFECTS COLOR AND OXIDATIVE STABILITY OF MEAT DURING STORAGE”
Chapter 4. “CHANGES IN FATTY ACID COMPOSITION OF 2 MUSCLES FROM 3 IBERIAN
x DUROC GENOTYPES AFTER REFRIGERATED STORAGE”
Chapter 5. “EFFECT OF IBERIAN x DUROC GENOTYPES ON DRY-CURED LOIN
QUALITY”
Chapter 6. “COMPOSITION, INSTRUMENTAL AND SENSORY ANALYSIS OF DRY-
CURED HAMS AS AFFECTED BY THE IBERIAN x DUROC GENOTYPE” Chapter 7. “VOLATILE PROFILE OF DRY-CURED MEAT PRODUCTS FROM 3
DIFFERENT IBERIAN x DUROC GENOTYPES” Chapter 8. “EFFECT OF PHYSICO-CHEMICAL CHARACTERISTICS OF RAW MUSCLES
FROM THREE IBERIAN x DUROC GENOTYPES ON DRY-CURED MEAT PRODUCTS
QUALITY” BIBLIOGRAPHY Andrés, A., Cava, R., Mayoral, A.I., Tejeda, J.F.,
Morcuende, D., and Ruiz, J. (2001) Oxidative stability and fatty acid composition of pig muscles as affected by rearing system, crossbreeding and metabolic type of muscle fibre. Meat Science 59, 39–47
Antequera, T., Garcia, C., Lopez-Bote, C., Ventanas, J., Asensio, M. A., and Cordoba, J. J. (1994). Evolution of different physicochemical parameters during ripening Iberian ham from Iberian (loo-percent) and Iberian x Duroc pigs (50%). Revista española de Ciencia y Tecnologia de Alimentos 34, 178-190.
Aparicio Macarro, J.B. (1987). El cerdo Ibérico. Premio de Investigación Sánchez Romero Carvajal. Jabugo. S.A.
B.O.E., 15 de Octubre del 2001. Real Decreto 1083/2001, de 5 de Octubre, por el que se aprueba la Norma de Calidad para el jamón ibérico, paleta ibérica y caña de lomo ibérico elaborados en España.
Carrapiso, A.I., Bonilla, F., and García, C. (2003). Effect of crossbreeding and rearing system on sensory characteristics of Iberian ham. Meat Science 65, 623–629.
Cilla, I., Altarriba, J., Guerrero, L., Gispert, M., Martínez, L., Moreno, C., Beltrán, J.A., Guàrdia, M.D., Diestre, A., Arnau, J., and Roncalés, P. (2006) Effect of different Duroc line sires on carcass composition, meat quality and dry-cured ham acceptability Meat Science 72, 2, 252-260
Dobao, M. T., Rodriganez, J. and Silio, L. (1986) Heritability of a canalized trait-teat number in
Iberian pigs. Genetique Selection Evolution 18, 173-183.
Lonergan, S. M., Huff-Lonergan, E., Rowe, L.J., Kuhlers, D. L., and Jungst, S.B. (2001) Selection for lean growth efficiency in Duroc pigs influences pork quality. Journal Animal Science 79, 2075-2085
Morcuende, D., Estévez, M., Ramírez, R., and Cava, R. (in press). Effect of the Iberian x Duroc reciprocal cross on production parameters, meat quality and lipogenic enzyme activities. Meat Science , (accepted)
Soriano, A., Quiles, R., Mariscal, C., and García-Ruiz, A. (2005). Pig sire type and sex effects on carcass traits, meat quality and physicochemical and sensory characteristics of Serrano dry-cured ham. Journal of the Science of Food and Agriculture 85, 1914–1924.
Tejeda, J.F., Gandemer, G., Antequera, T. Viau M., and García C. (2002) Lipid traits of muscles as related to genotype and fattening diet in Iberian pigs: total intramuscular lipids and triacylglycerols. Meat Science 60, 357–363
Ventanas, S, Ventanas, J., and Ruiz, J. Sensory characteristics of Iberian dry-cured loins: Influence of crossbreeding and rearing system. Meat Science, in press
Ventanas, S., Ventanas, J., Jurado, J., Estévez, M. (2006). Quality traits in muscle biceps femoris and back-fat from purebred Iberian and reciprocal Iberian x Duroc crossbred pigs. Meat Science 73, 651–659.
37


Materials and methods


Materials and methods
1.- MATERIALS 1.1.- Samples 1.1.a.- Animals. 3 groups of 10 pigs each one were studied (5 males and 5 females) from different
genotypes: GEN1: ♂ Iberian x ♀ Duroc1, GEN2: ♂ Duroc1 x ♀ Iberian; GEN3: ♂ Duroc2 x ♀ Iberian
(Image 1). The genotype Duroc1 (DU1) was selected for the production of dry-cured meat products
(hams, loins, shoulders), with a high level of fat. The genotype Duroc2 (DU2) was selected for meat
production, with high percentages of meat cuts and low carcass fat. Pigs were provided by the
CENSYRA (Centro de Selección y Reproducción Animal, Junta de Extremadura) which is a
reproductive centre which developed the trial to obtain the different genotypes. In the project were
used 21 sows and 6 barrows (2 from each genotype). Iberian and one Duroc line were provided by
CENSYRA (Centro de Selección y Reproducción Animal, Junta de Extremadura). The other Duroc
sire line was provided by an international pig breeding stock company. 101 piglets were born, among
which were randomly selected 10 pigs from each genotype. Pigs were all castrated as is traditionally
done. Males were castrated and females ovariectomized. Surgical procedure performed under local
anesthesia (2% de lidocaine hydrochloride) previous sedation with azaperone (Stresnil) 1h before
intervention. At 3 months age, pigs were moved to the farm of the Faculty of Veterinary Science
(University of Extremadura) in Cáceres and raised all together in a semi-intensive system. They were
fed ad libitum with diets shown in Table 1 and provided by the company PICAB.
Table 1. Proximate composition (%) and fatty acid composition (% total fatty acids) of the pig diets.
MIXED DIET I from 60 to 100kg l.w.
MIXED DIET II from 100 to 165kg l.w.
Proximate composition (%) Crude protein 16.0 13.5 Crude fat 3.3 5.0 Crude fiber 4.8 3.7 Ash 6.9 6.2 Lysine 0.9 0.5 Metabolizable energy (Kcal./Kg.) 3071.5 3183.7 Fatty acid composition (% total fatty acids) C14:0 0.1 0.1 C16:0 14.6 21.0 C18:0 4.4 5.6 C18:1n-9 23.3 31.3 C18:2n-6 34.7 35.1 C18:3n-6 2.0 2.3
Pigs were randomly slaughtered after 316 days of rearing with 150-165Kg live weight in the slaughter
plant VIDOSA (Higuera La Real, Badajoz). After slaughter, loins and legs, subcutaneous fat samples
were removed from the carcasses. Subcutaneous fat samples were taken at 5th-6th rib. Right loins
(m. Longissimus dorsi) and legs were used for fresh and refrigerated studies while left ones were
cured into dry-cured loins and hams. M. Biceps femoris were dissected from raw legs and dry-cured
hams.
1.1.b.- Refrigerated storage trial. After slaughter, Longissimus dorsi (LD) and Biceps femoris (BF)
were removed from carcass and sliced (1.5 cm thick) using a slicing machine. They were placed on
Styrofoam meat trays, over-wrapped with PVC oxygen permeable films and stored under fluorescent
41
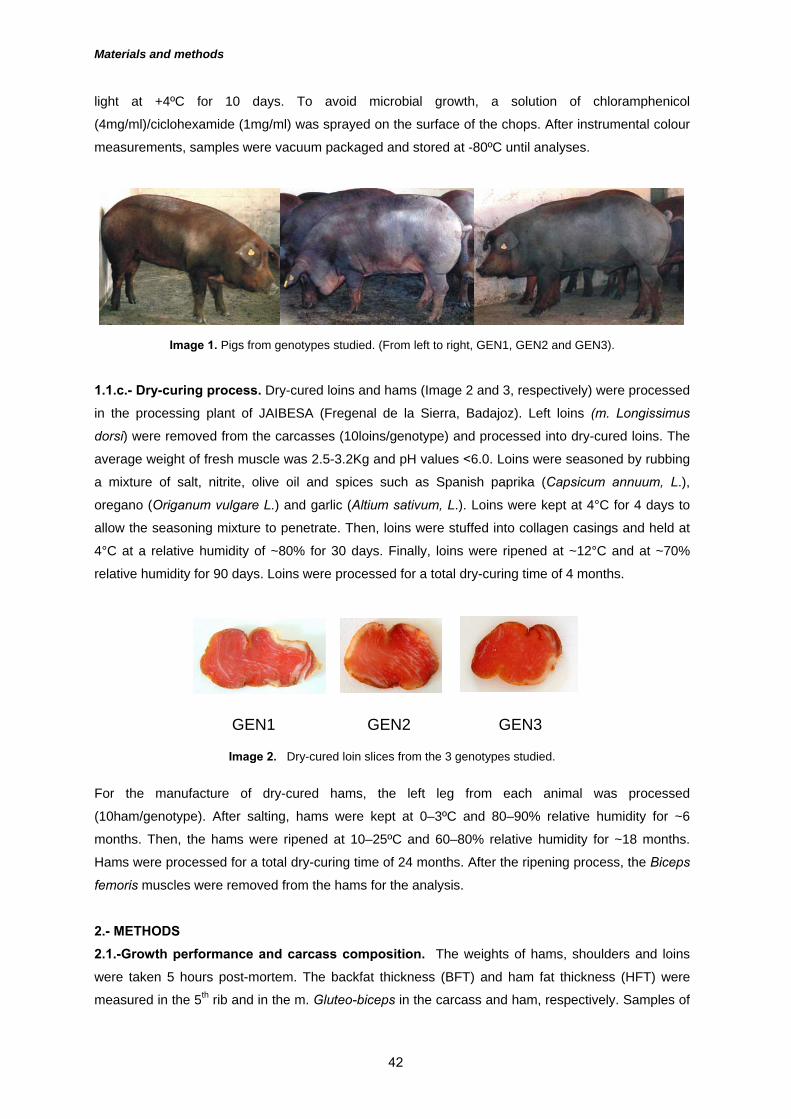
Materials and methods
light at +4ºC for 10 days. To avoid microbial growth, a solution of chloramphenicol
(4mg/ml)/ciclohexamide (1mg/ml) was sprayed on the surface of the chops. After instrumental colour
measurements, samples were vacuum packaged and stored at -80ºC until analyses.
Image 1. Pigs from genotypes studied. (From left to right, GEN1, GEN2 and GEN3).
1.1.c.- Dry-curing process. Dry-cured loins and hams (Image 2 and 3, respectively) were processed
in the processing plant of JAIBESA (Fregenal de la Sierra, Badajoz). Left loins (m. Longissimus
dorsi) were removed from the carcasses (10loins/genotype) and processed into dry-cured loins. The
average weight of fresh muscle was 2.5-3.2Kg and pH values <6.0. Loins were seasoned by rubbing
a mixture of salt, nitrite, olive oil and spices such as Spanish paprika (Capsicum annuum, L.),
oregano (Origanum vulgare L.) and garlic (Altium sativum, L.). Loins were kept at 4°C for 4 days to
allow the seasoning mixture to penetrate. Then, loins were stuffed into collagen casings and held at
4°C at a relative humidity of ~80% for 30 days. Finally, loins were ripened at ~12°C and at ~70%
relative humidity for 90 days. Loins were processed for a total dry-curing time of 4 months.
Image 2. Dry-cured loin slices from the 3 genotypes studied.
For the manufacture of dry-cured hams, the left leg from each animal was processed
(10ham/genotype). After salting, hams were kept at 0–3ºC and 80–90% relative humidity for ~6
months. Then, the hams were ripened at 10–25ºC and 60–80% relative humidity for ~18 months.
Hams were processed for a total dry-curing time of 24 months. After the ripening process, the Biceps
femoris muscles were removed from the hams for the analysis.
2.- METHODS 2.1.-Growth performance and carcass composition. The weights of hams, shoulders and loins
were taken 5 hours post-mortem. The backfat thickness (BFT) and ham fat thickness (HFT) were
measured in the 5th rib and in the m. Gluteo-biceps in the carcass and ham, respectively. Samples of
GEN1 GEN3GEN2
42
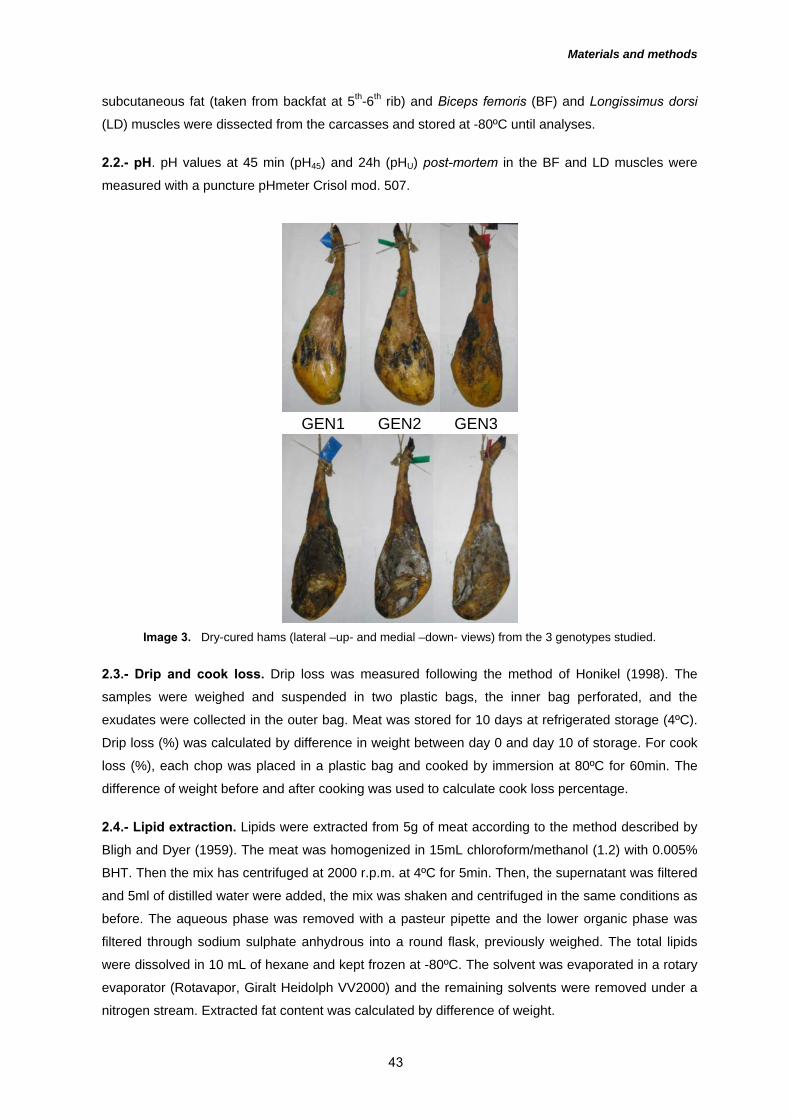
Materials and methods
subcutaneous fat (taken from backfat at 5th-6th rib) and Biceps femoris (BF) and Longissimus dorsi
(LD) muscles were dissected from the carcasses and stored at -80ºC until analyses. 2.2.- pH. pH values at 45 min (pH45) and 24h (pHU) post-mortem in the BF and LD muscles were
measured with a puncture pHmeter Crisol mod. 507.
Image 3. Dry-cured hams (lateral –up- and medial –down- views) from the 3 genotypes studied.
2.3.- Drip and cook loss. Drip loss was measured following the method of Honikel (1998). The
samples were weighed and suspended in two plastic bags, the inner bag perforated, and the
exudates were collected in the outer bag. Meat was stored for 10 days at refrigerated storage (4ºC).
Drip loss (%) was calculated by difference in weight between day 0 and day 10 of storage. For cook
loss (%), each chop was placed in a plastic bag and cooked by immersion at 80ºC for 60min. The
difference of weight before and after cooking was used to calculate cook loss percentage. 2.4.- Lipid extraction. Lipids were extracted from 5g of meat according to the method described by
Bligh and Dyer (1959). The meat was homogenized in 15mL chloroform/methanol (1.2) with 0.005%
BHT. Then the mix has centrifuged at 2000 r.p.m. at 4ºC for 5min. Then, the supernatant was filtered
and 5ml of distilled water were added, the mix was shaken and centrifuged in the same conditions as
before. The aqueous phase was removed with a pasteur pipette and the lower organic phase was
filtered through sodium sulphate anhydrous into a round flask, previously weighed. The total lipids
were dissolved in 10 mL of hexane and kept frozen at -80ºC. The solvent was evaporated in a rotary
evaporator (Rotavapor, Giralt Heidolph VV2000) and the remaining solvents were removed under a
nitrogen stream. Extracted fat content was calculated by difference of weight.
GEN1 GEN3GEN2
43
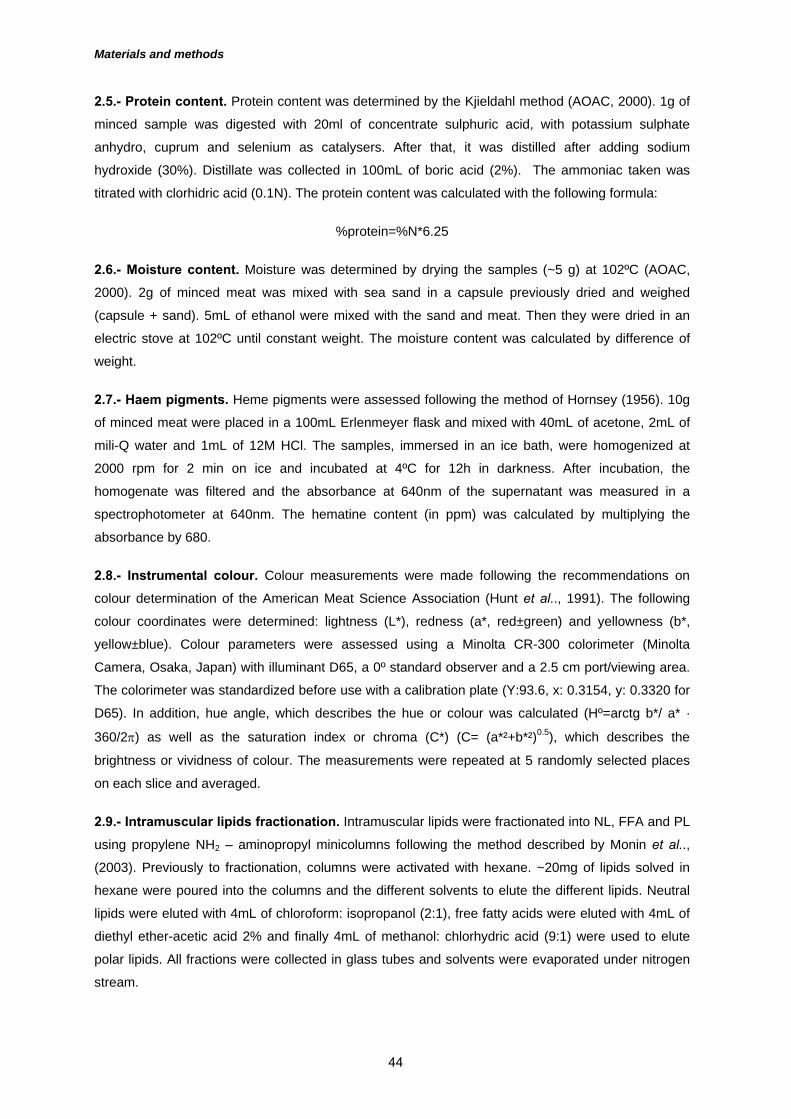
Materials and methods
2.5.- Protein content. Protein content was determined by the Kjieldahl method (AOAC, 2000). 1g of
minced sample was digested with 20ml of concentrate sulphuric acid, with potassium sulphate
anhydro, cuprum and selenium as catalysers. After that, it was distilled after adding sodium
hydroxide (30%). Distillate was collected in 100mL of boric acid (2%). The ammoniac taken was
titrated with clorhidric acid (0.1N). The protein content was calculated with the following formula:
%protein=%N*6.25
2.6.- Moisture content. Moisture was determined by drying the samples (~5 g) at 102ºC (AOAC,
2000). 2g of minced meat was mixed with sea sand in a capsule previously dried and weighed
(capsule + sand). 5mL of ethanol were mixed with the sand and meat. Then they were dried in an
electric stove at 102ºC until constant weight. The moisture content was calculated by difference of
weight.
2.7.- Haem pigments. Heme pigments were assessed following the method of Hornsey (1956). 10g
of minced meat were placed in a 100mL Erlenmeyer flask and mixed with 40mL of acetone, 2mL of
mili-Q water and 1mL of 12M HCl. The samples, immersed in an ice bath, were homogenized at
2000 rpm for 2 min on ice and incubated at 4ºC for 12h in darkness. After incubation, the
homogenate was filtered and the absorbance at 640nm of the supernatant was measured in a
spectrophotometer at 640nm. The hematine content (in ppm) was calculated by multiplying the
absorbance by 680. 2.8.- Instrumental colour. Colour measurements were made following the recommendations on
colour determination of the American Meat Science Association (Hunt et al.., 1991). The following
colour coordinates were determined: lightness (L*), redness (a*, red±green) and yellowness (b*,
yellow±blue). Colour parameters were assessed using a Minolta CR-300 colorimeter (Minolta
Camera, Osaka, Japan) with illuminant D65, a 0º standard observer and a 2.5 cm port/viewing area.
The colorimeter was standardized before use with a calibration plate (Y:93.6, x: 0.3154, y: 0.3320 for
D65). In addition, hue angle, which describes the hue or colour was calculated (Hº=arctg b*/ a* ·
360/2π) as well as the saturation index or chroma (C*) (C= (a*²+b*²)0.5), which describes the
brightness or vividness of colour. The measurements were repeated at 5 randomly selected places
on each slice and averaged. 2.9.- Intramuscular lipids fractionation. Intramuscular lipids were fractionated into NL, FFA and PL
using propylene NH2 – aminopropyl minicolumns following the method described by Monin et al..,
(2003). Previously to fractionation, columns were activated with hexane. ~20mg of lipids solved in
hexane were poured into the columns and the different solvents to elute the different lipids. Neutral
lipids were eluted with 4mL of chloroform: isopropanol (2:1), free fatty acids were eluted with 4mL of
diethyl ether-acetic acid 2% and finally 4mL of methanol: chlorhydric acid (9:1) were used to elute
polar lipids. All fractions were collected in glass tubes and solvents were evaporated under nitrogen
stream.
44

Materials and methods
2.10.- Methylation and analysis of fatty acids. Lipids from the subcutaneous adipose tissue were
extracted by the De Pedro et al.., (1997) method using a microvawe oven. ~20mg of the melted fat
were taken for the methylation. Fatty acid methyl esters (FAMEs) were prepared by
transesterification with methanol in sulphuric acid (5% of sulphuric acid in methanol). Lipids or lipid
fractions obtained following fractionation analysis described previously were placed in screw-top test
tubes and mixed with 1mL of 0.5% sodium methylate. They were maintained in an electric stove at
80ºC for 30min, and were vortexed every 10min. Then 1mL of sulphuric acid (5%) in methanol was
added, and again, tubes were kept in the stove for 30min. When tubes were cold, 1mL of hexane and
1mL of saturated NaCl were added. After the centrifugation the upper organic phase was taken in
glass chromatography vials. FAMEs were analyzed in a Hewlett-Packard model HP-5890A gas
chromatograph, equipped with a flame ionization detector (FID). FAMEs were separated on a
semicapillary column (Hewlett-Packard FFAP-TPA fused-silica column, 30m length, 0.53mm i.d., and
1.0mm film thickness). The injector and detector temperatures were held at 230°C and the oven
temperature, at 220°C. The flow rate of the carrier gas (N2) was set at 1.8 mL/min. Identification of
FAMEs was based on retention times of reference compounds (Sigma). Fatty acid composition was
expressed as percent of total FAMEs.
2.11.- Iron-ascorbate induced oxidation. The susceptibility of muscle tissue homogenates to iron
ascorbate-induced lipid oxidation was determined by the method of Kornbrust and Mavis (1980).
Aliquots of 1mL of homogenates (1g meat in 9mL of KCl 1.15%) were incubated at 37ºC with 80 mM
Tris-maleate buffer (pH 7.4), 5mM FeSO4 and 2mM ascorbic acid in a total volume of 10mL. At fixed
time intervals, (0, 50, 100 and 200min) aliquots (1mL) were taken for the measurement of 2-
thiobarbituric acid-reactive substances (TBA-RS) by the method of Buege and Aust (1978) by adding
2mL of TBA-TCA-ClH and heating it at 100ºC for 15min. The measurements in the spectrophotomer
were made at 535nm. TBA-RS were expressed as nmol malondialdehyde (MDA)/mg protein. Protein
was measured in muscle homogenates following Lowry procedure (Lowry et al.., 1951), adding
NaOH (0.1N) and a solution made of cuprum sulphate (0.5%, w/v), with sodium carbonate (2%, w/v)
and potassium sodium tartrate (0.2%, w/v) diluted in a basic solution. Finally, Folin-Ciccalteau
reagent was added. The measurement was made at 740nm by spectrophotometry. Protein
concentration was measured by comparison with a standard of BSA (bovine serum albumin). 2.12.- Lipid oxidation. Lipid oxidation was assessed in duplicate by the 2-thiobarbituric acid (TBA)
method of Salih et al.., (1987). 2g of sample were homogenized with 7.5mL of percloric acid (3.86%)
and 0.25mL of BHT (4.2% in ethanol) at 2000 rpm for 2 min. Homogenisations took place in an ice
bath to minimise the development of oxidative reactions during extraction of TBA-RS.
The homogenate was filtered through with a double paper filter and centrifuged at 3000rpm for 2min.
After that, 2mL aliquots (in duplicate) were mixed with 2mL of tiobarbituric acid (0.02M). The tubes
were heated at 90ºC for 30min in a hot water bath. After cooling, tubes were centrifuged at 3000rpm
for 2min and the absorbance was measured at 508nm, 532nm and 600nm. Corrected absorbance at
532nm was calculated following the formula:
45

Materials and methods
Abs532nm= Abs532nm – [(Abs508nm - Abs600nm) * (600-532) / (600-508)] - Abs600nm
A standard curve was prepared using different dilutions of a solution of 1,1,3,3-tetraethoxypropane
(TEP) (0.2268 g) in 1L of 3.86% perchloric acid. TBA-RS values were calculated from the standard
curve and expressed as mg malondialdehyde/kg meat.
2.13.- Protein oxidation. Protein oxidation was assessed by measurement of carbonyl groups
formed during incubation with 2,4-dinitrophenylhydrazine (DNPH) in 2N HCl following the method
described by Oliver et al.., (1987). Homogenates (1g of sample in 10mL of 0.15M KCL buffer) were
divided into two 0.1mL aliquots (A and B), and placed in eppendorfs. Proteins were precipitated in
both aliquots (A and B) with 1mL 10% TCA and centrifuged at 2240g for 5min. 1mL of 2N HCL was
added to pellet A (used to measure protein concentration) and 1mL of 0.2% 2,4-
dinitrophenylhydrazine (DNPH) in 2N HCL was added to pellet B (used for carbonyl concentration
measurement). Both samples were incubated at room temperature for 1h. Later, samples were again
precipitated with 1mL of 10% TCA and washed twice with 1mL ethanol:ethyl acetate (1:1) to
eliminate previous reagents. Finally, 1.5mL of 6M guanidine HCL with 20mM sodium phosphate
buffer was added. Carbonyl concentration was measured on the treated sample (B) by measuring
DNPH incorporated on the basis of absorption of 21.0 mM−1 cm−1 at 370nm for protein hydrazones.
Results were expressed as nmol of DNPH fixed per milligram of protein. Protein concentration was
calculated by spectrophotometry at 280nm using bovine serum albumin (BSA) as standard. Protein
oxidation was expressed as nmol carbonyls/mg protein.
2.14.- Determination of the activity of lipogenic enzymes. For the measurement of lipogenic
enzymes glucose-6-phosphate dehydrogenase (G6PDH) and malic enzyme (ME) activity in
subcutaneous fat and in Longissimus dorsi and Biceps femoris muscles, 2g of subcutaneous fat or
muscles –Longissimus dorsi and Biceps femoris- were homogenized in 10 (adipose tissue) or 5
(muscle) mL of an ice-cold 25mM Tris-HCL buffer containing 9% glycerol, 5mM MgCl2 and 7mM β-
mercaptoethanol (pH 7.6). Then, the homogenates were centrifuged at 3000×g at 4ºC for 10min and
the supernatant was again centrifuged at 25000×g at 4ºC for 20min. Finally, the supernatant was
collected for glucose-6-phosphate dehydrogenase (G6PDH) (EC 1.1.1.49) and malic enzyme (ME)
activities (EC 1.1.1.40). Enzyme activities were measured at 340nm for 30min at 30°C with a
thermospectrophotometer (Thermo Electron Corp. Helios α. Waltham, MA) and expressed on the
basis of nmol NADP reduced to NADPH per min per mg protein, by the extinction coefficient of
NADPH at 340nm of 6.22 × 10⁶ M−1 cm−1. Determinations were made in triplicate.
Glucose-6-phosphate dehydrogenase (G6PDH) was determined by the method of Bautista et al..,
(1988). The enzyme extracts were mixed with Tris buffer (1M, pH 8) NADP+ (10 mM) and MgCl2 (0.1
M). The reaction was initiated by the addition of 60 µL of glucose-6-phosphate to a final volume of 1
mL and monitored at 340nm.
Malic enzyme (ME) determination was measured according to the method of Spina et al.., (1970).
The reaction mixture contained Tris buffer (0.5M, pH 7.4), NADP+ (40mM), MgCl2 (0.1 M), NH4
46

Materials and methods
(80mM), KCl (2M) and malic acid (200 mM). The reaction was initiated by the addition of 400µL of
the enzyme extract to a final volume of 1 mL and monitored at 340nm.
Protein determination was measured spectrophotometrically at 595nm according to the method of
Bradford (1976) in microtiter plates. 10μL of enzyme extracts were added in each bowl. Finally,
200μL of Bradford reactive composed of Commassie brilliant blue in ethanol and phosphoric acid
(85%) were added in each bowl. The plate was incubated at room temperature for 5 min. At last, the
absorbencies were measured in an ELISA lector (595nm) using a curve of BSA (bovine serum
albumin) as standard.
2.15.- Weight loss of dry-cured products by refrigerated storage. Dry-cured loins were cut into
cubes of 1cm3. The pieces were supported with a needle in a Styrofoam plate to allow a similar
drying on each face of the cube. The samples were refrigerated at 4ºC for 10 days. The cubes were
weighed before (day 0) and after the storage (day 5 and 10). The percentage of loss was calculated
by difference of weight as follows:
((Wb-Wa)/Wb)x100;
Where: Wb: weight before storage Wa: weight after storage.
2.16.- Texture analysis. Texture analysis was performed in a texturometer TA XT-2i Texture
Analyser (STable Micro Systems Ltd., Surrey, U.K.). For the determination of texture profile analysis
(TPA) uniform portions of the dry-cured loins and hams were cut into 1cm3 cubes. Samples were
axially compressed to 50% of the original height with a flat plunger of 50 mm diameter (P/50) at a
crosshead speed of 2mm/s through a 2-cycle sequence. The following texture parameters were
measured from force–deformation curves (Bourne, 1978): Hardness (N/cm2) = maximum force
required to compress the sample (peak force during the 1st compression cycle); adhesiveness (N s) =
work necessary to pull the compressing plunger away from the sample; springiness (cm) = height
that the sample recovers during the time that elapses between the end of the 1st compression and
the start of the 2nd; cohesiveness (dimensionless) = extent to which the sample could be deformed
before rupture (A1/A2, A1 being the total energy required to for the 1st compression and A2 the total
energy required for the 2nd compression); chewiness (N s) = the work needed to chew a solid sample
to a steady state of swallowing (hardness x cohesiveness x springiness). For Warner-Bratzler (W-B)
analyses, samples were prepared in 2 x 30 x 15mm slices (thickness x length x width) using a slicing
machine. Samples were cut with a Warner-Bratzler blade (HDP/BS) in perpendicular direction to the
muscle fibres. Determinations were repeated 8 times per sample and were averaged.
2.17.- Sensory analysis of dry-cured meat products. Fourteen trained panellists formed the
tasting panel. Analyses were developed in tasting rooms with the conditions specified in UNE
regulation. FIZZ Network (version 1.01: Biosystemes, France) software was used for the sessions
and the recording data obtained. M. Biceps femoris, dissected from hams, and dry-cured loins were
sliced (2mm thick) parallel and transversal to muscle fibre direction, respectively, with a slicing
machine. Three slices of each dry-cured product were given to panellists who evaluated different
47
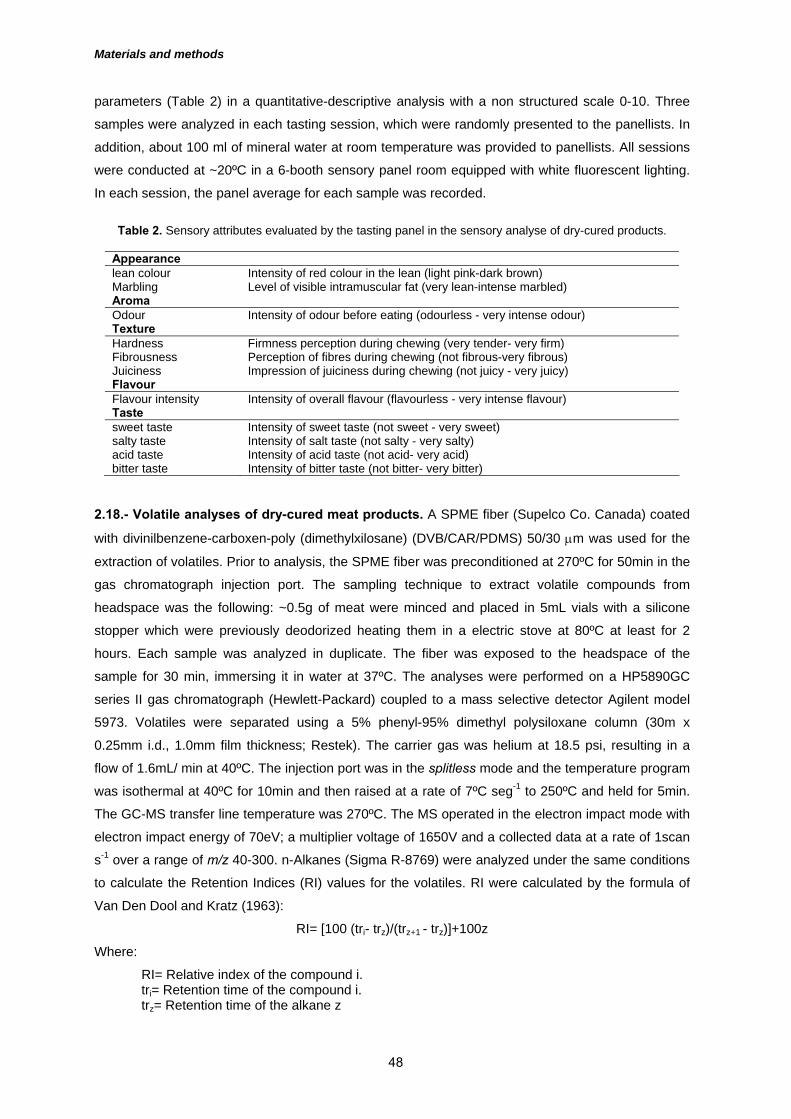
Materials and methods
parameters (Table 2) in a quantitative-descriptive analysis with a non structured scale 0-10. Three
samples were analyzed in each tasting session, which were randomly presented to the panellists. In
addition, about 100 ml of mineral water at room temperature was provided to panellists. All sessions
were conducted at ~20ºC in a 6-booth sensory panel room equipped with white fluorescent lighting.
In each session, the panel average for each sample was recorded.
Table 2. Sensory attributes evaluated by the tasting panel in the sensory analyse of dry-cured products.
Appearance lean colour Intensity of red colour in the lean (light pink-dark brown) Marbling Level of visible intramuscular fat (very lean-intense marbled) Aroma Odour Intensity of odour before eating (odourless - very intense odour) Texture Hardness Firmness perception during chewing (very tender- very firm) Fibrousness Perception of fibres during chewing (not fibrous-very fibrous) Juiciness Impression of juiciness during chewing (not juicy - very juicy) Flavour Flavour intensity Intensity of overall flavour (flavourless - very intense flavour) Taste sweet taste Intensity of sweet taste (not sweet - very sweet) salty taste Intensity of salt taste (not salty - very salty) acid taste Intensity of acid taste (not acid- very acid) bitter taste Intensity of bitter taste (not bitter- very bitter)
2.18.- Volatile analyses of dry-cured meat products. A SPME fiber (Supelco Co. Canada) coated
with divinilbenzene-carboxen-poly (dimethylxilosane) (DVB/CAR/PDMS) 50/30 μm was used for the
extraction of volatiles. Prior to analysis, the SPME fiber was preconditioned at 270ºC for 50min in the
gas chromatograph injection port. The sampling technique to extract volatile compounds from
headspace was the following: ~0.5g of meat were minced and placed in 5mL vials with a silicone
stopper which were previously deodorized heating them in a electric stove at 80ºC at least for 2
hours. Each sample was analyzed in duplicate. The fiber was exposed to the headspace of the
sample for 30 min, immersing it in water at 37ºC. The analyses were performed on a HP5890GC
series II gas chromatograph (Hewlett-Packard) coupled to a mass selective detector Agilent model
5973. Volatiles were separated using a 5% phenyl-95% dimethyl polysiloxane column (30m x
0.25mm i.d., 1.0mm film thickness; Restek). The carrier gas was helium at 18.5 psi, resulting in a
flow of 1.6mL/ min at 40ºC. The injection port was in the splitless mode and the temperature program
was isothermal at 40ºC for 10min and then raised at a rate of 7ºC seg-1 to 250ºC and held for 5min.
The GC-MS transfer line temperature was 270ºC. The MS operated in the electron impact mode with
electron impact energy of 70eV; a multiplier voltage of 1650V and a collected data at a rate of 1scan
s-1 over a range of m/z 40-300. n-Alkanes (Sigma R-8769) were analyzed under the same conditions
to calculate the Retention Indices (RI) values for the volatiles. RI were calculated by the formula of
Van Den Dool and Kratz (1963):
RI= [100 (tri- trz)/(trz+1 - trz)]+100z
Where:
RI= Relative index of the compound i. tri= Retention time of the compound i. trz= Retention time of the alkane z
48
Materials and methods
trz+1= Retention time of the alkane z+1 z= number of carbon atoms in alkane z
Volatile compounds were identified by comparison with reference compounds (Sigma, Aldrich), by
comparison of RI with those described by Kondjoyan and Berdagué (1996) and by comparison of
their mass spectra with those contained in Wiley library.
2.19.- Statistical analysis. The effects of genotype and sex were analyzed by the Analysis of
Variance (ANOVA) procedure of SPSS, version 12.0 (SPSS, 2003). A two-way analysis of the
variance (genotype and sex) with interaction (genotype x sex) was carried out. Means were used to
compare differences. Tukey’s test was applied to compare the mean values of the genotypes. The
relationships between traits were analyzed by the calculation of Pearson’s coefficient and by the
principal component analysis (PCA).
BIBLIOGRAPHY AOAC (2000). Official methods of analysis (15th ed).
Washington, DC: Association of Official Analytical Chemists.
Bautista, J.M., Garrido-Pertierra, A., and Soler., G. (1988). Glucose-6-phosphate dehidrogenase from Dicentrarchus labrax liver: kinetic mechanism and kinetics of NADPH inhibition. Biochimica et Biophysica Acta, 967, 3, 354-363.
Bligh, E.G., and Dyer, W.J. (1959). A rapid method of total lipid extraction and purification. Canadian Journal of Biochemistry and Physiology, 37, 911-917.
Bourne, M. C. (1978). Texture profile analysis. Food Technology, 32, 62–66, 72.
Bradford, M. (1976). A rapid and sensitive method for the quantification of microgram quantities of protein utilizing the principle of protein-dye binding. Analytical Biochemistry, 72, 248-254.
Buege, J. A., and Aust, S. D. (1978). Microsomal lipid peroxidation. In S., Fleischer, and L., Packer. Methods in enzimology (Vol. 52, p. 302). NY: Academic Press
De Pedro, E., Casillas, M. and Miranda, C. M. (1997). Microwave Oven Application in the Extraction of Fat from the Subcutaneous Tissue of Iberian Pig Ham. Meat Science, 45, 1, 45-51.
Fizz (1995) Fizz for Window version. Byosytemes. Honikel, K.O. (1998). Reference methods for the
assessment of physical characteristics of meat. Meat Science, 49, 4, 447-457.
Hornsey, H. C. (1956). The colour of cooked cured pork. 1. Estimation of the nitric oxide-haem pigments. Journal of the Science of Food and Agriculture, 7, 534-541.
Hunt, M.C., Acton, J.C., Benedict, R.C., Calkins, C.R., Cornforth, D.P., Jeremiah, L.E., Olson, D.G., Salm, C.P., Savell, J.W., Shivas, S.D. (1991). AMSA guidelines for meatcolour evaluation. In Proceedings 44th annual reciprocal meat conference, 9–12 July 1991.
Kondjoyan, N., Berdagué, J. L. (1996). A Compilation of RelativeRetention Indices of the Analysis of Aromatic Compounds; Laboratoire flaveur, station de recherches sur la viande, INRA:Theix, France.
Kornbrust, D.J. and Mavis, R.D. (1980). Relative susceptibility of microsomes from lung, heart, liver, kidney, brain and testes to lipid peroxidation: correlation with vitamin E content. Lipids 15, 315–322
Lowry, O.H., Rosebrough, N.J., Farr, A.L. and Randall, R.J., 1951. Protein measurement with the Folin-phenol reagent. Journal of Biological Chemistry 193, 265–275L
Monin, G., Hortós, M., Díaz, I., Rock, E., and Garcia-Regueiro, J. A. (2003). Lipolysis and lipid oxidation during chilled storage of meat from Large White and Pietrain pigs. Meat Science, 64, 7–12.
Oliver, C.N., Ahn, B.W., Moerman, E.J., Goldstein, S., and Satadtman, E.R. (1987). Aged-related changes in oxidized proteins. Journal of Biological Chemistry, 262, 5488-5491.
Salih, A. M., Smith, D. M., Price, J. F., and Dawson, L. E. (1987). Modified extraction 2-thiobarbituric acid method for measuring lipid oxidation in poultry. Poultry Science, 66, 1483–1489.
Spina, J., Bright, H.J., and Rosenbloom, J. (1970). Purification and properties of L-Malic Enzyme from Escherichia coli. Biochemistry, 9 (19), 3794-3801.
SPSS (2003) Inc. SPSS 12.0 for Windows SPSS Inc. Chicago.
Van Den Dool, H. and Kratz, P. (1963). A generalisation of the retention index system including linear temperature programmed gas-liquid partition chromatography. J. Chromatog. 11, 463-471
.
49


Chapter I


Chapter I. Carcass composition and meat quality
CARCASS COMPOSITION AND MEAT QUALITY OF 3 DIFFERENT IBERIAN X DUROC GENOTYPE PIGS1
ABSTRACT
Carcass composition and meat quality of Longissimus dorsi (LD) and Biceps femoris (BF) muscles from 3 different Iberian x Duroc genotype pigs were studied: GEN1: ♂ Iberian x ♀ Duroc1; GEN2: ♂ Duroc1 x ♀ Iberian; GEN3: ♂ Duroc2 x ♀ Iberian. Duroc1 (DU1) were selected for manufacture dry-cured meat products while Duroc2 (DU2) were pigs selected for meat production, with high percentages of meat cuts and low carcass fat. Genotype had a significant effect on the differences found while sex had not. GEN2 showed the highest weights at days 180 and 238 of weaning and the highest slaughter weights (day 316) followed by GEN3, while the lowest weights were found in GEN1. GEN3 had well conformed carcasses in comparison with GEN1 and GEN2, since GEN3 showed the highest percentages of ham and loin and the highest weight of loin as well as the lowest back and ham fat thickness. However, the use of DU2 pigs in the cross with Iberian had negative effects on meat quality, as GEN3 gave the worst meat quality in both muscles analyzed, in postmortem pH, cook and drip loss, and colour and the lowest percentages of intramuscular fat (IMF). In subcutaneous fat (SCF), GEN3 had higher percentages of polyunsaturated fatty acids (PUFA) than GEN2, while GEN2 had higher saturated fatty acids (SFA) levels. In LD, IMF from GEN3 showed the highest percentage of MUFA and PUFA; while the fatty acid profile of GEN2 was more saturated. BF muscle showed similar trend, but not significantly. On the other hand, few differences were found between reciprocal crosses (GEN1 vs. GEN2). GEN2 showed higher IMF in LD than GEN1, agreeing with their carcass weight. As a result, GEN1 had a fatty acid profile of IMF in the LD more unsaturated.
Keywords: meat quality, carcass, Iberian, Duroc, crossbreeding, pH.
1.- INTRODUCTION The number of Iberian pigs (pure and crossed) has increased in recent years, mainly as a
consequence of the increase in consumption of dry-cured meat products and fresh meat, which has
improved the productive and feeding systems of the Iberian pig. Nowadays, one of the alternatives
applied to improve productive parameters is to cross with the Duroc breed at 50%. These crosses
increase the number of piglets per sow and the weight at weaning and at the end of fattening
(Aparicio, 1987), without changes on the adaptation capacity of the Iberian pig to the environment
and without reducing the quality of the cured meat products (Antequera, García, López, Ventanas,
Asensio, & Córdoba, 1994; López-Bote, 1998; Tejeda, Gandemer, Antequera, Viau, & García, 2002).
Iberian x Duroc crosses are so popular that it is estimated that among the pigs slaughtered as
“Iberian”, less than the 25% are pure (Sierra, 1992). This makes it important to assess the selection
of the Duroc lines to cross with Iberian, because the Duroc breed cannot be considered a
homogeneous breed as a consequence of its vast distribution (Jonnes, 1988), which has favoured
genetic selection according to the different criteria of production and meat quality.
Some authors (Castellanos, Barragán, Rodríguez, Toro, & Silió, 1997) have warned that the high
frequency of Iberian x Duroc crosses could be a danger for the genetic purity of the Iberian breed. As
a consequence, a specific law for Iberian products was passed in 2001 in Spain (B.O.E., 15th
October 2001). One of the most important aspects of this law is the genotypes that can be used in
the manufacture of dry-cured meat products (hams, shoulders and loins) labelled as “Iberian”. The 1 Ramírez, R., & Cava, R. (2006). Carcass composition and meat quality of 3 different Iberian x Duroc genotype pigs. doi:10.1016/j.meatsci.2006.08.003
53
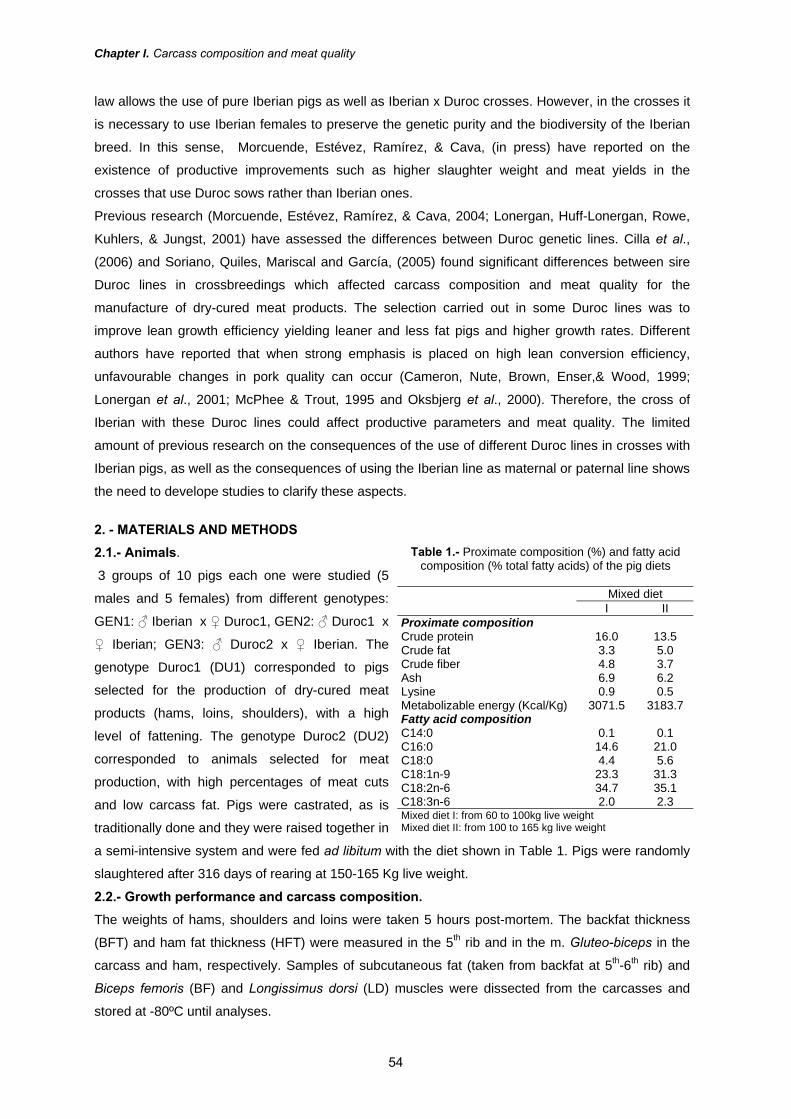
Chapter I. Carcass composition and meat quality
law allows the use of pure Iberian pigs as well as Iberian x Duroc crosses. However, in the crosses it
is necessary to use Iberian females to preserve the genetic purity and the biodiversity of the Iberian
breed. In this sense, Morcuende, Estévez, Ramírez, & Cava, (in press) have reported on the
existence of productive improvements such as higher slaughter weight and meat yields in the
crosses that use Duroc sows rather than Iberian ones.
Previous research (Morcuende, Estévez, Ramírez, & Cava, 2004; Lonergan, Huff-Lonergan, Rowe,
Kuhlers, & Jungst, 2001) have assessed the differences between Duroc genetic lines. Cilla et al.,
(2006) and Soriano, Quiles, Mariscal and García, (2005) found significant differences between sire
Duroc lines in crossbreedings which affected carcass composition and meat quality for the
manufacture of dry-cured meat products. The selection carried out in some Duroc lines was to
improve lean growth efficiency yielding leaner and less fat pigs and higher growth rates. Different
authors have reported that when strong emphasis is placed on high lean conversion efficiency,
unfavourable changes in pork quality can occur (Cameron, Nute, Brown, Enser,& Wood, 1999;
Lonergan et al., 2001; McPhee & Trout, 1995 and Oksbjerg et al., 2000). Therefore, the cross of
Iberian with these Duroc lines could affect productive parameters and meat quality. The limited
amount of previous research on the consequences of the use of different Duroc lines in crosses with
Iberian pigs, as well as the consequences of using the Iberian line as maternal or paternal line shows
the need to develope studies to clarify these aspects.
2. - MATERIALS AND METHODS 2.1.- Animals.
3 groups of 10 pigs each one were studied (5
males and 5 females) from different genotypes:
GEN1: ♂ Iberian x ♀ Duroc1, GEN2: ♂ Duroc1 x
♀ Iberian; GEN3: ♂ Duroc2 x ♀ Iberian. The
genotype Duroc1 (DU1) corresponded to pigs
selected for the production of dry-cured meat
products (hams, loins, shoulders), with a high
level of fattening. The genotype Duroc2 (DU2)
corresponded to animals selected for meat
production, with high percentages of meat cuts
and low carcass fat. Pigs were castrated, as is
traditionally done and they were raised together in
a semi-intensive system and were fed ad libitum with the diet shown in Table 1. Pigs were randomly
slaughtered after 316 days of rearing at 150-165 Kg live weight.
2.2.- Growth performance and carcass composition. The weights of hams, shoulders and loins were taken 5 hours post-mortem. The backfat thickness
(BFT) and ham fat thickness (HFT) were measured in the 5th rib and in the m. Gluteo-biceps in the
carcass and ham, respectively. Samples of subcutaneous fat (taken from backfat at 5th-6th rib) and
Biceps femoris (BF) and Longissimus dorsi (LD) muscles were dissected from the carcasses and
stored at -80ºC until analyses.
Table 1.- Proximate composition (%) and fatty acid composition (% total fatty acids) of the pig diets
Mixed diet I II Proximate composition Crude protein 16.0 13.5 Crude fat 3.3 5.0 Crude fiber 4.8 3.7 Ash 6.9 6.2 Lysine 0.9 0.5 Metabolizable energy (Kcal/Kg) 3071.5 3183.7 Fatty acid composition C14:0 0.1 0.1 C16:0 14.6 21.0 C18:0 4.4 5.6 C18:1n-9 23.3 31.3 C18:2n-6 34.7 35.1 C18:3n-6 2.0 2.3 Mixed diet I: from 60 to 100kg live weight Mixed diet II: from 100 to 165 kg live weight
54
Chapter I. Carcass composition and meat quality
2.3.- Muscles composition. pH values 45 min (pH45) and 24h (pHU) after slaughter in the BF and LD muscles were measured
with a puncture pHmeter Crisol mod. 507. Lipids were extracted from 5g of meat with
chloroform/methanol (1:2), according to Bligh and Dyer (1959). Protein content was determined by
the Kjieldalh method (AOAC, 2000), moisture was determined by drying the samples (~5 g) at 102ºC
(AOAC, 2000) and haem pigments were assessed following the method of Hornsey (1956).
2.4.- Fatty acid profile determination. Fatty acid methyl esters (FAMEs) were prepared by transesterification using methanol in the
presence of sulphuric acid (5% of sulphuric acid in methanol). FAMEs were analyzed in a Hewlett-
Packard model HP-5890A gas chromatograph, equipped with a flame ionization detector (FID). They
were separated on a semicapillary column (Hewlett-Packard FFAP-TPA fused-silica column, 30m
length, 0.53mm i.d., and 1.0mm film thickness). The injector and detector temperatures were held at
230 °C and the oven temperature, at 220°C. The flow rate of the carrier gas (N2) was set at
1.8mL/min. Identification of FAMEs was based on retention times of reference compounds (Sigma).
Fatty acid composition was expressed as percent of major FAMEs.
2.5.- Instrumental colour. Colour measurements were made following the recommendations on colour determination of the
American Meat Science Association (Hunt et al., 1991). The following colour coordinates were
determined: lightness (L*), redness (a*, red±green) and yellowness (b*, yellow±blue). Colour
parameters were determined using a Minolta CR-300 colorimeter (Minolta Camera, Osaka, Japan)
with illuminant D65, a 0º standard observer and a 2.5 cm port/viewing area. The colorimeter was
standardized before use with a white tile. In addition, hue angle, which describes the hue or colour
was calculated (Hº=arctg b*/ a* · 360/2π) as well as the saturation index or chroma (C*) (C=
(a*²+b*²)0.5), which describes the brightness or vividness of colour. The measurements were repeated
at 5 randomly selected places on each slice and averaged.
2.6.- Drip and cook loss. Drip loss was measured following the method of Honikel (1998). The samples were weighed and
suspended in two plastic bags, the inner bag perforated, and the exudates was collected in the outer
bag. Meat was stored for 10 days at refrigerated storage (4ºC). Drip loss (%) was calculated by
difference in weight between day 0 and day 10 of storage. For cook loss (%), each chop was placed
in a plastic bag and cooked by immersion at 80ºC for 60 min. The difference of weight before and
after cooking was used to calculate cook loss percentage. 2.7.- Statistical analysis.
The effects of genotype and sex were analyzed by the Analysis of Variance (ANOVA) procedure of
SPSS, version 12.0 (SPSS, 2003). A two-way analysis of the variance (genotype and sex) with
interaction (genotype x sex) was carried out. Means were used to compare differences. HSD Tukey’s
test was applied to compare the mean values of the genotypes. The relationships between traits
were analyzed by the calculation of Pearson’s coefficient.
55
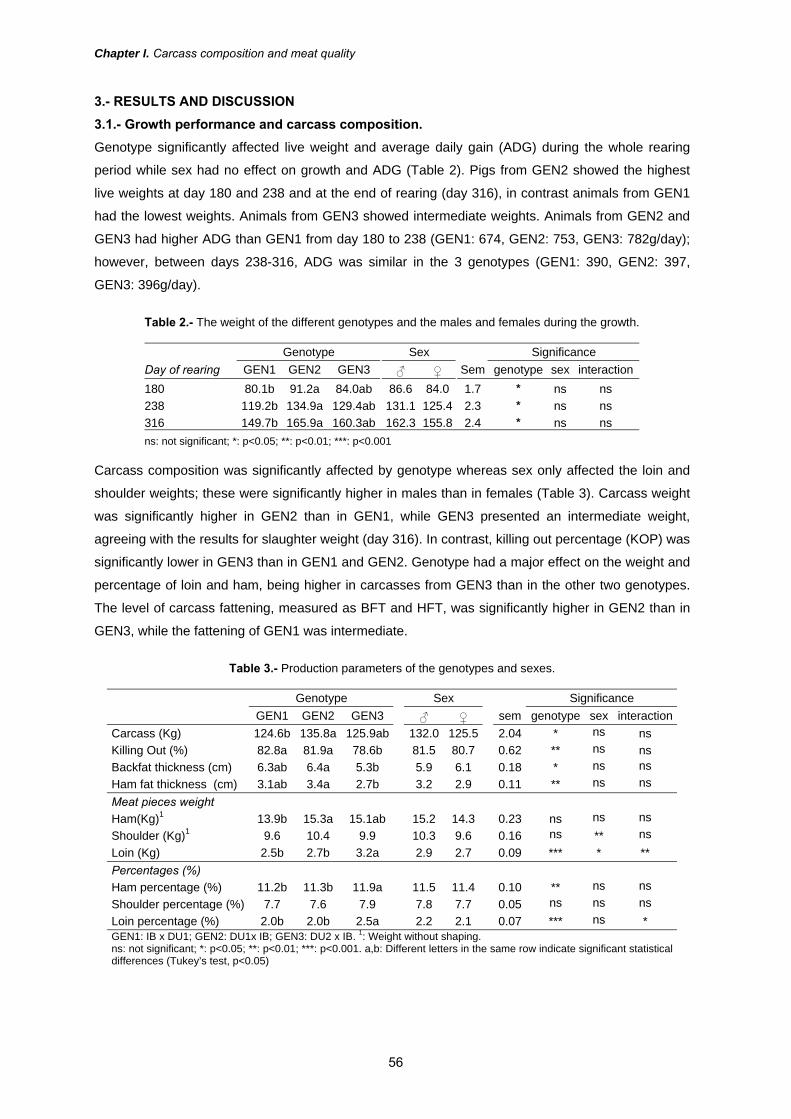
Chapter I. Carcass composition and meat quality
3.- RESULTS AND DISCUSSION 3.1.- Growth performance and carcass composition. Genotype significantly affected live weight and average daily gain (ADG) during the whole rearing
period while sex had no effect on growth and ADG (Table 2). Pigs from GEN2 showed the highest
live weights at day 180 and 238 and at the end of rearing (day 316), in contrast animals from GEN1
had the lowest weights. Animals from GEN3 showed intermediate weights. Animals from GEN2 and
GEN3 had higher ADG than GEN1 from day 180 to 238 (GEN1: 674, GEN2: 753, GEN3: 782g/day);
however, between days 238-316, ADG was similar in the 3 genotypes (GEN1: 390, GEN2: 397,
GEN3: 396g/day).
Table 2.- The weight of the different genotypes and the males and females during the growth.
Genotype Sex Significance Day of rearing GEN1 GEN2 GEN3 ♂ ♀ Sem genotype sex interaction 180 80.1b 91.2a 84.0ab 86.6 84.0 1.7 * ns ns 238 119.2b 134.9a 129.4ab 131.1 125.4 2.3 * ns ns 316 149.7b 165.9a 160.3ab 162.3 155.8 2.4 * ns ns ns: not significant; *: p<0.05; **: p<0.01; ***: p<0.001
Carcass composition was significantly affected by genotype whereas sex only affected the loin and
shoulder weights; these were significantly higher in males than in females (Table 3). Carcass weight
was significantly higher in GEN2 than in GEN1, while GEN3 presented an intermediate weight,
agreeing with the results for slaughter weight (day 316). In contrast, killing out percentage (KOP) was
significantly lower in GEN3 than in GEN1 and GEN2. Genotype had a major effect on the weight and
percentage of loin and ham, being higher in carcasses from GEN3 than in the other two genotypes.
The level of carcass fattening, measured as BFT and HFT, was significantly higher in GEN2 than in
GEN3, while the fattening of GEN1 was intermediate.
Table 3.- Production parameters of the genotypes and sexes.
Genotype Sex Significance GEN1 GEN2 GEN3 ♂ ♀ sem genotype sex interactionCarcass (Kg) 124.6b 135.8a 125.9ab 132.0 125.5 2.04 * ns ns Killing Out (%) 82.8a 81.9a 78.6b 81.5 80.7 0.62 ** ns ns Backfat thickness (cm) 6.3ab 6.4a 5.3b 5.9 6.1 0.18 * ns ns Ham fat thickness (cm) 3.1ab 3.4a 2.7b 3.2 2.9 0.11 ** ns ns Meat pieces weight Ham(Kg)1 13.9b 15.3a 15.1ab 15.2 14.3 0.23 ns ns ns Shoulder (Kg)1 9.6 10.4 9.9 10.3 9.6 0.16 ns ** ns Loin (Kg) 2.5b 2.7b 3.2a 2.9 2.7 0.09 *** * ** Percentages (%) Ham percentage (%) 11.2b 11.3b 11.9a 11.5 11.4 0.10 ** ns ns Shoulder percentage (%) 7.7 7.6 7.9 7.8 7.7 0.05 ns ns ns Loin percentage (%) 2.0b 2.0b 2.5a 2.2 2.1 0.07 *** ns * GEN1: IB x DU1; GEN2: DU1x IB; GEN3: DU2 x IB. 1: Weight without shaping. ns: not significant; *: p<0.05; **: p<0.01; ***: p<0.001. a,b: Different letters in the same row indicate significant statistical differences (Tukey’s test, p<0.05)
56

Chapter I. Carcass composition and meat quality
Results show an important effect of the Duroc sire line on carcass composition. Therefore, the use of
Duroc lines selected on the basis of their productive parameters (DU2) produce hybrids (GEN3) with
high weights and percentages of the main cuts and low levels of carcass fat. Nonetheless, for the
manufacture of high quality dry-cured meat products (hams, shoulders, loins...) a high level of
fattening is required to provide correct ripening during maturation for the development of their
sensory characteristics (Gandemer, 2002).
As regards the differences between reciprocal crosses (GEN1 vs GEN2), only small differences were
found, which suggests that maternal effects did not play an important role on productive and carcass
parameters. These results contrast with those reported by Morcuende et al. (in press) in a study with
Iberian x Duroc reciprocal crosses, who found better productive parameters in animals from Duroc
sows than in animals from Iberian sows.
3.2.- Meat quality parameters. In general, differences found in meat quality were mainly due to pig genotype, sex did not affect them
(Table 4). Regarding differences between muscles, the effect of the genotype on the parameters
analyzed was more marked in LD than in BF muscle.
The rate of pH decline was significantly higher in GEN3 than in GEN1 and GEN2. In this respect, the
pH value at 45min post-mortem (pH45min) was significantly lower in BF from GEN3 than in the other
two genotypes, and the ultimate pH values (pHU) were the lowest in LD and BF from GEN3.
Muscles from GEN3 tended to have a higher loss of water during cooking and storage than those
from GEN1 and GEN2. Thus, drip loss during refrigerated storage was the highest in the LD from
GEN3 and significantly higher than GEN1 in the BF. Similarly, water loss during cooking was higher
in muscles from GEN3 than in the other two genotypes, although differences were only significant in
the LD.
Regarding instrumental colour, lightness (CIE L*-value) was highest in LD and BF from GEN3, which
indicates that meat from GEN3 was paler in comparison with the other genotypes. No significant
differences were found in CIE a*-value and CIE b*-value due to genotype. The effect of sex on
instrumental colour was small and only redness (CIE a*-value) of the BF muscle was significantly
higher in females than in males. The content of heme pigments was highest in GEN1 in both
muscles, although the differences were only significant in LD.
The incidence of PSE meat is one of the main quality problems in pork (Oliver, Gisperr, & Diesdre,
1993). The appearance of this type of meat can be monitored by measurements of pH, instrumental
colour and exudate loss (Kauffman et al., 1993) as PSE meat is characterized by its intense
paleness, low pH, low consistency and intense exudation (Briskey, 1964). Findings indicate that LD
and BF from GEN3 showed the characteristics of PSE meat since they were paler (CIE-L*), had high
acidification post-mortem (pH45 and pHU) and were associated with high drip and cook losses. Post-
mortem pH is important since it is normally associated to muscle paleness. In this respect, significant
negative correlations (p<0.01) were found (r=-0.624) between pHU and L*.
The IMF level is one of the muscle parameters that influence meat and meat products quality. GEN2
showed higher IMF contents than GEN3 in both muscles, whereas in the reciprocal crosses (GEN1
57

Chapter I. Carcass composition and meat quality
vs GEN2); IMF of the LD muscle was higher in GEN2 than in GEN1, according to the higher fat and
carcass weights of GEN2. Differences due to genotype were only significant in LD, although BF
showed the same trend. Therefore, meat from GEN2 because of the higher content of IMF has the
best characteristics for the manufacture of high quality meat products, in which an increase in IMF
supposes a marked enhancement of quality (Gandemer, 2002). However, the lower IMF content in
LD and BF of the GEN3 could be negative for the sensorial characteristics of meat and meat
products, such as taste, aroma, tenderness and/or juiciness (Essén-Gustavson, Karlsson,
Lundström, & Enfalt, 1994; Ruiz-Carrascal, Ventanas, Cava, Andrés, & García, 2000).
Table 4.- Moisture, intramuscular fat (IMF) and protein contents (g/1000g), haem pigments
(mg/100g) pH, drip loss (% DL) cook loss (%CL) and instrumental colour of the LD and BF muscles.
Genotype Sex Significance GEN1 GEN2 GEN3 ♂ ♀ sem genotype sex Interaction pH45 LD 5.7 5.8 5.8 5.7 5.8 0.05 ns ns ns pH45 BF 5.8a 5.9a 5.6b 5.7 5.7 0.05 ** ns ns pHU LD 5.7a 5.5ab 5.1b 5.4 5.4 0.07 * ns ns pHU BF 5.8a 5.7a 5.2b 5.5 5.6 0.06 *** ns ns Drip and cook loss DL LD (%) 4.0b 4.3b 6.0a 4.8 4.8 0.30 ** ns ns DL BF (%) 3.4b 4.0ab 5.1a 3.9 4.4 0.28 * ns ns CL LD (%) 6.0b 6.5b 10.4a 8.1 7.3 0.54 *** ns ns CL BF (%) 9.7 11.0 11.6 10.9 10.7 0.35 ns ns ns Instrumental colour Cie L* LD 48.9b 53.1a 52.8a 51.8 51.6 0.52 *** ns ns Cie L* BF 41.9b 42.4b 46.8a 44.7 42.9 0.74 * ns ns Cie a* LD 10.2 10.0 9.9 9.9 10.2 0.26 ns ns ns Cie a* BF 18.3 17.4 17.9 17.2 18.5 0.31 ns * ns Cie b* LD 4.3 4.9 5.0 4.7 48 0.17 ns ns ns Cie b* BF 6.2 6.2 7.2 6.7 6.4 0.23 ns ns ns Haem pigments Hematine LD (mg/Kg) 48.7a 38.3b 37.9b 41.0 41.7 1.42 ** ns ns Hematine BF (mg/Kg) 93.1 86.8 82.4 80.6 93.4 2.26 ns *** ** Chemical composition Moisture LD (g/100g) 71.4ab 70.3b 71.7a 71.0 71.2 0.24 * ns ns Moisture BF (g/100g) 74.1a 73.3b 73.6b 73.6 73.5 0.16 * ns ns Protein LD (g/100g) 23.4a 21.3b 21.3b 22.2 21.7 0.34 * ns ns Protein BF (g/100g) 19.2b 19.3b 20.5a 19.9 19.5 0.23 * ns ns IMF LD (g/100g) 3.8b 5.9a 3.5b 4.4 4.4 0.28 *** ns ns IMF BF (g/100g) 3.4 3.7 3.0 3.4 3.4 0.17 ns ns ns GEN1: IB x DU1; GEN2: DU1x IB; GEN3: DU2 x IB LD: Longissimus dorsi; BF: Biceps femoris, DL drip loss, CL cook loss ns: not significant; *: p<0.05; **: p<0.01; ***: p<0.001. a,b: Different letters in the same row indicate significant statistical differences (Tukey’s test, p<0.05)
Sex of animals had no effect on the fatty acid composition of SCF and IMF of LD and BF muscles,
however, genotype significantly affected fatty acid profiles of both locations (Table 5).
SCF from GEN3 had a higher content of unsaturated fatty acids than GEN1, mainly due to a higher
content of C18:2n-6 and polyunsaturated fatty acids (PUFA), and a lower content of C18:0 than
GEN2. The differences between genotypes GEN2 and GEN3 are due to the different paternal lines of
Duroc (DU1 and DU2); whereas no significant differences were found between reciprocal crosses
(GEN1 vs. GEN2).
The genotype significantly affected fatty acid composition of IMF from the LD muscle, while the BF
muscle did not show significant differences among genotypes, although the trend was similar to LD
(Table 5). PUFA content was significantly higher in LD from GEN1 and GEN3 than from GEN2,
58
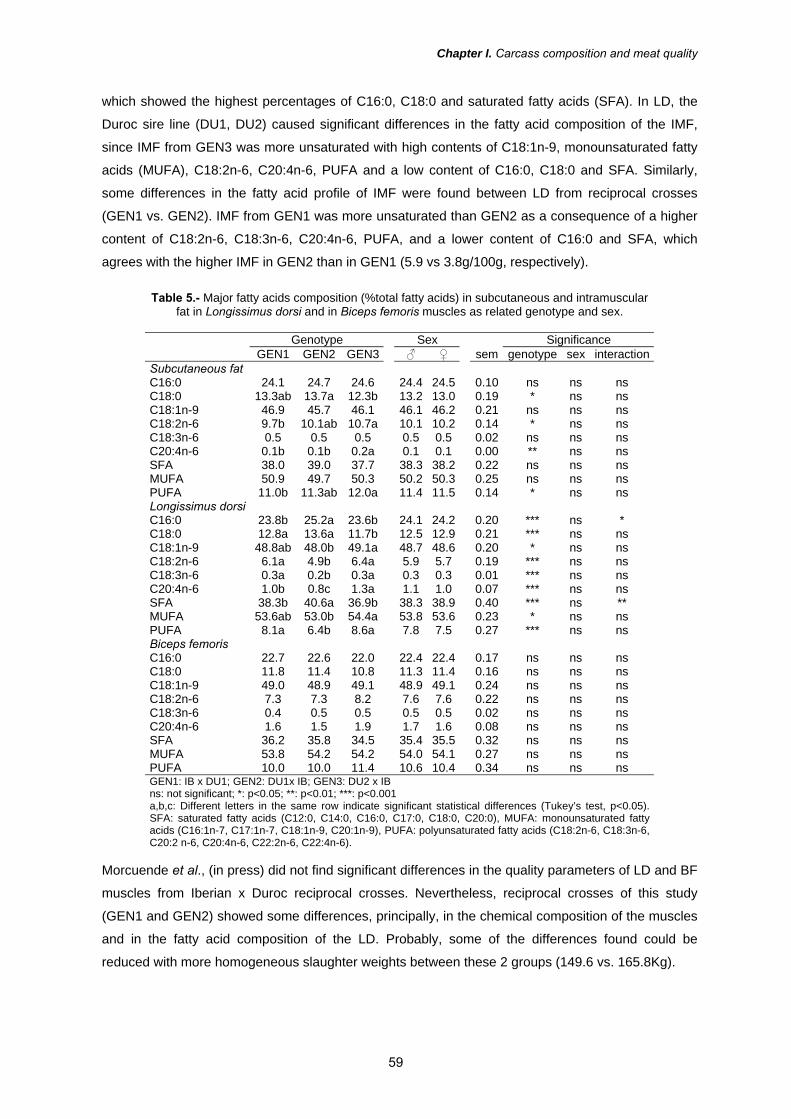
Chapter I. Carcass composition and meat quality
which showed the highest percentages of C16:0, C18:0 and saturated fatty acids (SFA). In LD, the
Duroc sire line (DU1, DU2) caused significant differences in the fatty acid composition of the IMF,
since IMF from GEN3 was more unsaturated with high contents of C18:1n-9, monounsaturated fatty
acids (MUFA), C18:2n-6, C20:4n-6, PUFA and a low content of C16:0, C18:0 and SFA. Similarly,
some differences in the fatty acid profile of IMF were found between LD from reciprocal crosses
(GEN1 vs. GEN2). IMF from GEN1 was more unsaturated than GEN2 as a consequence of a higher
content of C18:2n-6, C18:3n-6, C20:4n-6, PUFA, and a lower content of C16:0 and SFA, which
agrees with the higher IMF in GEN2 than in GEN1 (5.9 vs 3.8g/100g, respectively).
Table 5.- Major fatty acids composition (%total fatty acids) in subcutaneous and intramuscular fat in Longissimus dorsi and in Biceps femoris muscles as related genotype and sex.
Genotype Sex Significance GEN1 GEN2 GEN3 ♂ ♀ sem genotype sex interaction Subcutaneous fat C16:0 24.1 24.7 24.6 24.4 24.5 0.10 ns ns ns C18:0 13.3ab 13.7a 12.3b 13.2 13.0 0.19 * ns ns C18:1n-9 46.9 45.7 46.1 46.1 46.2 0.21 ns ns ns C18:2n-6 9.7b 10.1ab 10.7a 10.1 10.2 0.14 * ns ns C18:3n-6 0.5 0.5 0.5 0.5 0.5 0.02 ns ns ns C20:4n-6 0.1b 0.1b 0.2a 0.1 0.1 0.00 ** ns ns SFA 38.0 39.0 37.7 38.3 38.2 0.22 ns ns ns MUFA 50.9 49.7 50.3 50.2 50.3 0.25 ns ns ns PUFA 11.0b 11.3ab 12.0a 11.4 11.5 0.14 * ns ns Longissimus dorsi C16:0 23.8b 25.2a 23.6b 24.1 24.2 0.20 *** ns * C18:0 12.8a 13.6a 11.7b 12.5 12.9 0.21 *** ns ns C18:1n-9 48.8ab 48.0b 49.1a 48.7 48.6 0.20 * ns ns C18:2n-6 6.1a 4.9b 6.4a 5.9 5.7 0.19 *** ns ns C18:3n-6 0.3a 0.2b 0.3a 0.3 0.3 0.01 *** ns ns C20:4n-6 1.0b 0.8c 1.3a 1.1 1.0 0.07 *** ns ns SFA 38.3b 40.6a 36.9b 38.3 38.9 0.40 *** ns ** MUFA 53.6ab 53.0b 54.4a 53.8 53.6 0.23 * ns ns PUFA 8.1a 6.4b 8.6a 7.8 7.5 0.27 *** ns ns Biceps femoris C16:0 22.7 22.6 22.0 22.4 22.4 0.17 ns ns ns C18:0 11.8 11.4 10.8 11.3 11.4 0.16 ns ns ns C18:1n-9 49.0 48.9 49.1 48.9 49.1 0.24 ns ns ns C18:2n-6 7.3 7.3 8.2 7.6 7.6 0.22 ns ns ns C18:3n-6 0.4 0.5 0.5 0.5 0.5 0.02 ns ns ns C20:4n-6 1.6 1.5 1.9 1.7 1.6 0.08 ns ns ns SFA 36.2 35.8 34.5 35.4 35.5 0.32 ns ns ns MUFA 53.8 54.2 54.2 54.0 54.1 0.27 ns ns ns PUFA 10.0 10.0 11.4 10.6 10.4 0.34 ns ns ns GEN1: IB x DU1; GEN2: DU1x IB; GEN3: DU2 x IB ns: not significant; *: p<0.05; **: p<0.01; ***: p<0.001 a,b,c: Different letters in the same row indicate significant statistical differences (Tukey’s test, p<0.05). SFA: saturated fatty acids (C12:0, C14:0, C16:0, C17:0, C18:0, C20:0), MUFA: monounsaturated fatty acids (C16:1n-7, C17:1n-7, C18:1n-9, C20:1n-9), PUFA: polyunsaturated fatty acids (C18:2n-6, C18:3n-6, C20:2 n-6, C20:4n-6, C22:2n-6, C22:4n-6).
Morcuende et al., (in press) did not find significant differences in the quality parameters of LD and BF
muscles from Iberian x Duroc reciprocal crosses. Nevertheless, reciprocal crosses of this study
(GEN1 and GEN2) showed some differences, principally, in the chemical composition of the muscles
and in the fatty acid composition of the LD. Probably, some of the differences found could be
reduced with more homogeneous slaughter weights between these 2 groups (149.6 vs. 165.8Kg).
59

Chapter I. Carcass composition and meat quality
Differences in fatty acid profiles between
genotypes could be attributed to different
causes: i) a different content of IMF; ii) a
different potential for endogenous synthesis of
fatty acids. On the one hand, the lowest content
of PUFA in GEN2 could be caused by the
dilution effect of phospholipids and/or PUFA due
to a high content of IMF. Similar results have
been found by other authors in breeds or
genotypes with high IMF contents (Cameron &
Enser, 1991; Suzuki, Shibata, Kadowaki, Abe, &
Toyoshima, 2003; Morcuende et al., in press).
On the other hand, differences in the thickness
of back and ham fat and the different fatty acid
compositions, especially of SFA, suggest a
different adipogenic potential for the genotypes,
as a result of a different capacity for the
synthesis and storage of fat related to genetic
characteristics. This was supported by the
significant correlations between BFT and HFT
and the percentages of the major fatty acids
found (Table 6). BFT and HFT correlated
positively with C16:0, C18:0 and SFA, whereas
they correlated negatively with C18:1n-9,
C18:2n-6, PUFA and MUFA. It could indicate a
higher adipogenic character of GEN2 than
GEN3, while GEN1 would show an intermediate adipogenic potential. In pigs, endogenous synthesis
of fatty acids takes place from acetyl CoA and malonil CoA molecules to produce palmitic acid
(C16:0), from which stearic acid (C18:0) is synthesized. The highest proportion of SFA in GEN2
could suggest a high endogenous synthesis capacity of this genotype, as a consequence of the
increase of the activity of the metabolic routes in which the enzymes involved in the synthesis of “de
novo” fatty acids take part (Mourot & Kouba, 1998). In a parallel study, Ramírez, Morcuende and
Cava (2006) determined the activity of lipogenic enzymes in LD and BF muscles and in SCF, finding
a higher activity of both enzymes in GEN1 and GEN2 than in GEN3.
The differences in the fatty acid profile of SCF and IMF due to the genotype could have important
consequences. Firstly, the fatty acid profile of the SCF determines Iberian pig carcass value (De
Pedro, Casillas, & Miranda, 1997; García-Olmo et al., 2002), so differences in the fatty acid profile
between genotypes can modify carcass classifications with regard to quality, which as a
consequence can change its economic value. In addition, high proportions of PUFA reduce the
oxidative stability of lipids, which could have negative effects on the sensory characteristics of fresh
Table 6. Pearson’s coeficient correlation (r) between fatty acid composition of the subcutaneous and
intramuscular fat of the L. dorsi and B. femoris and back and ham fat thickess (BFT, HFT).
Subcutaneous fat BFT HFT C16:0 0.120 -0.140 C18:0 0.286 0.374* C18:1n-9 0.194 -0.05 C18:2n-6 -0.631** -0.189 SFA 0.347 0.318 MUFA 0.076 -0.149 PUFA -0.636** -0.237 Longissimus dorsi BFT HFT C16:0 0.467 * 0.279 C18:0 0.433 0.042 C18:1n-9 -0.255* 0.126 C18:2n-6 -0.462* -0.374* SFA 0.491** 0.187 MUFA -0.260 0.155 PUFA -0.497** -0.403* Biceps femoris BFT HFT C16:0 0.362 0.249 C18:0 0.147 0.111 C18:1n-9 0.047 0.195 C18:2n-6 -0.322 -0.398* SFA 0.300 0.227 MUFA 0.096 0.223 PUFA -0.342 -0.377* SFA: saturated fatty acids (C12:0, C14:0, C16:0, C17:0, C18:0, C20:0), MUFA: monounsaturated fatty acids (C16:1n-7, C17:1n-7, C18:1n-9, C20:1n-9), PUFA: polyunsaturated fatty acids (C18:2n-6, C18:3n-6, C20:2n-6, C20:4n-6, C22:2n-6, C22:4n-6). *: Bilateral significant Pearson’s correlation at level p<0.05 **: Bilateral significant Pearson’s correlation at level p<0.01.
60
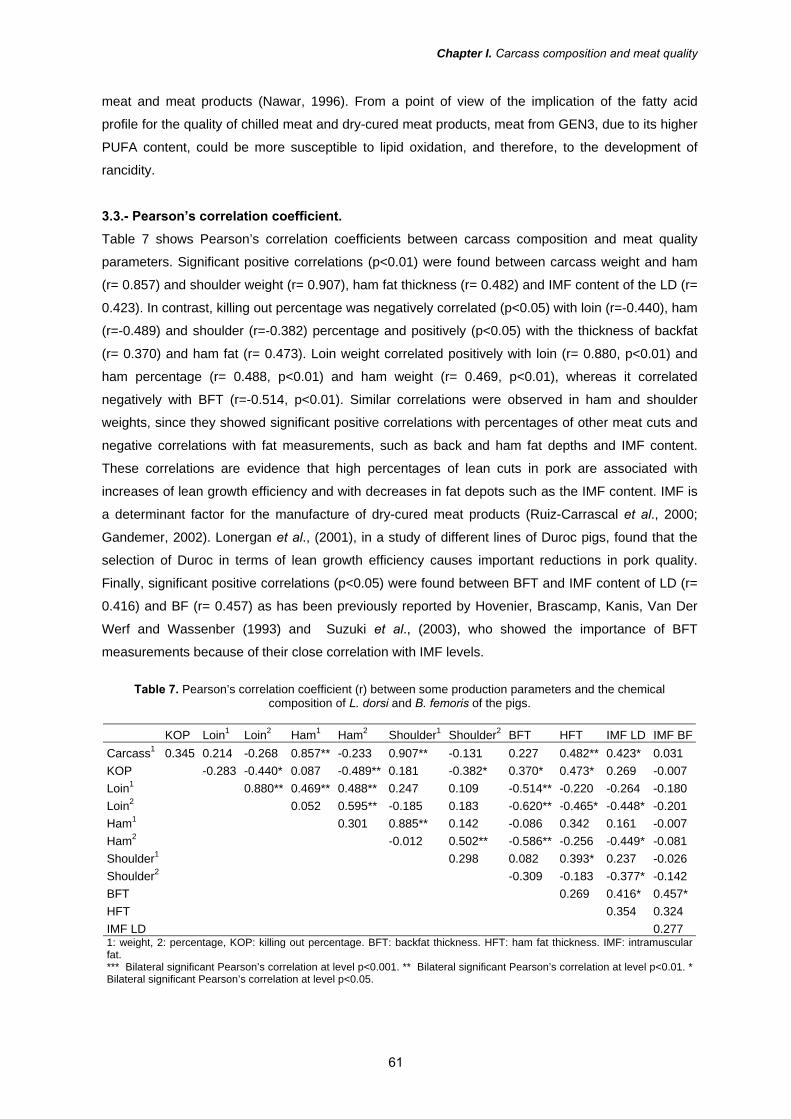
Chapter I. Carcass composition and meat quality
meat and meat products (Nawar, 1996). From a point of view of the implication of the fatty acid
profile for the quality of chilled meat and dry-cured meat products, meat from GEN3, due to its higher
PUFA content, could be more susceptible to lipid oxidation, and therefore, to the development of
rancidity.
3.3.- Pearson’s correlation coefficient. Table 7 shows Pearson’s correlation coefficients between carcass composition and meat quality
parameters. Significant positive correlations (p<0.01) were found between carcass weight and ham
(r= 0.857) and shoulder weight (r= 0.907), ham fat thickness (r= 0.482) and IMF content of the LD (r=
0.423). In contrast, killing out percentage was negatively correlated (p<0.05) with loin (r=-0.440), ham
(r=-0.489) and shoulder (r=-0.382) percentage and positively (p<0.05) with the thickness of backfat
(r= 0.370) and ham fat (r= 0.473). Loin weight correlated positively with loin (r= 0.880, p<0.01) and
ham percentage (r= 0.488, p<0.01) and ham weight (r= 0.469, p<0.01), whereas it correlated
negatively with BFT (r=-0.514, p<0.01). Similar correlations were observed in ham and shoulder
weights, since they showed significant positive correlations with percentages of other meat cuts and
negative correlations with fat measurements, such as back and ham fat depths and IMF content.
These correlations are evidence that high percentages of lean cuts in pork are associated with
increases of lean growth efficiency and with decreases in fat depots such as the IMF content. IMF is
a determinant factor for the manufacture of dry-cured meat products (Ruiz-Carrascal et al., 2000;
Gandemer, 2002). Lonergan et al., (2001), in a study of different lines of Duroc pigs, found that the
selection of Duroc in terms of lean growth efficiency causes important reductions in pork quality.
Finally, significant positive correlations (p<0.05) were found between BFT and IMF content of LD (r=
0.416) and BF (r= 0.457) as has been previously reported by Hovenier, Brascamp, Kanis, Van Der
Werf and Wassenber (1993) and Suzuki et al., (2003), who showed the importance of BFT
measurements because of their close correlation with IMF levels.
Table 7. Pearson’s correlation coefficient (r) between some production parameters and the chemical
composition of L. dorsi and B. femoris of the pigs. KOP Loin1 Loin2 Ham1 Ham2 Shoulder1 Shoulder2 BFT HFT IMF LD IMF BFCarcass1 0.345 0.214 -0.268 0.857** -0.233 0.907** -0.131 0.227 0.482** 0.423* 0.031 KOP -0.283 -0.440* 0.087 -0.489** 0.181 -0.382* 0.370* 0.473* 0.269 -0.007 Loin1 0.880** 0.469** 0.488** 0.247 0.109 -0.514** -0.220 -0.264 -0.180 Loin2 0.052 0.595** -0.185 0.183 -0.620** -0.465* -0.448* -0.201 Ham1 0.301 0.885** 0.142 -0.086 0.342 0.161 -0.007 Ham2 -0.012 0.502** -0.586** -0.256 -0.449* -0.081 Shoulder1 0.298 0.082 0.393* 0.237 -0.026 Shoulder2 -0.309 -0.183 -0.377* -0.142 BFT 0.269 0.416* 0.457* HFT 0.354 0.324 IMF LD 0.277 1: weight, 2: percentage, KOP: killing out percentage. BFT: backfat thickness. HFT: ham fat thickness. IMF: intramuscular fat. *** Bilateral significant Pearson’s correlation at level p<0.001. ** Bilateral significant Pearson’s correlation at level p<0.01. * Bilateral significant Pearson’s correlation at level p<0.05.
61
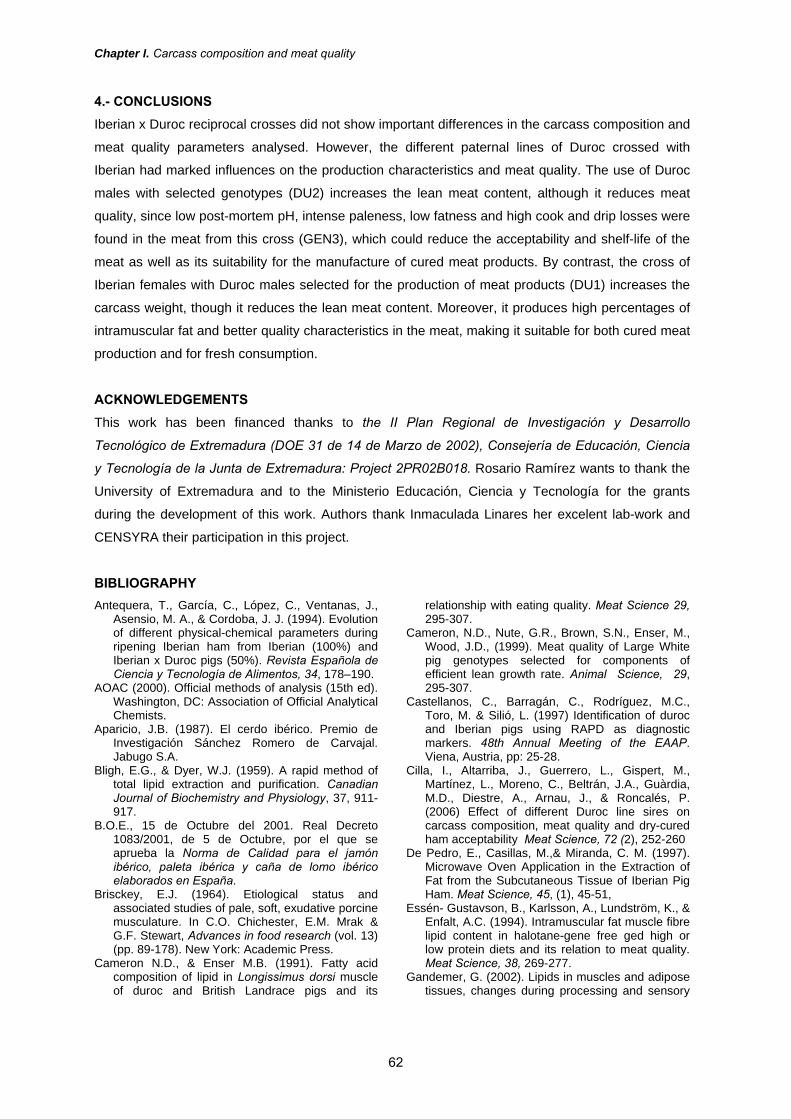
Chapter I. Carcass composition and meat quality
4.- CONCLUSIONS Iberian x Duroc reciprocal crosses did not show important differences in the carcass composition and
meat quality parameters analysed. However, the different paternal lines of Duroc crossed with
Iberian had marked influences on the production characteristics and meat quality. The use of Duroc
males with selected genotypes (DU2) increases the lean meat content, although it reduces meat
quality, since low post-mortem pH, intense paleness, low fatness and high cook and drip losses were
found in the meat from this cross (GEN3), which could reduce the acceptability and shelf-life of the
meat as well as its suitability for the manufacture of cured meat products. By contrast, the cross of
Iberian females with Duroc males selected for the production of meat products (DU1) increases the
carcass weight, though it reduces the lean meat content. Moreover, it produces high percentages of
intramuscular fat and better quality characteristics in the meat, making it suitable for both cured meat
production and for fresh consumption.
ACKNOWLEDGEMENTS This work has been financed thanks to the II Plan Regional de Investigación y Desarrollo
Tecnológico de Extremadura (DOE 31 de 14 de Marzo de 2002), Consejería de Educación, Ciencia
y Tecnología de la Junta de Extremadura: Project 2PR02B018. Rosario Ramírez wants to thank the
University of Extremadura and to the Ministerio Educación, Ciencia y Tecnología for the grants
during the development of this work. Authors thank Inmaculada Linares her excelent lab-work and
CENSYRA their participation in this project.
BIBLIOGRAPHY Antequera, T., García, C., López, C., Ventanas, J.,
Asensio, M. A., & Cordoba, J. J. (1994). Evolution of different physical-chemical parameters during ripening Iberian ham from Iberian (100%) and Iberian x Duroc pigs (50%). Revista Española de Ciencia y Tecnología de Alimentos, 34, 178–190.
AOAC (2000). Official methods of analysis (15th ed). Washington, DC: Association of Official Analytical Chemists.
Aparicio, J.B. (1987). El cerdo ibérico. Premio de Investigación Sánchez Romero de Carvajal. Jabugo S.A.
Bligh, E.G., & Dyer, W.J. (1959). A rapid method of total lipid extraction and purification. Canadian Journal of Biochemistry and Physiology, 37, 911-917.
B.O.E., 15 de Octubre del 2001. Real Decreto 1083/2001, de 5 de Octubre, por el que se aprueba la Norma de Calidad para el jamón ibérico, paleta ibérica y caña de lomo ibérico elaborados en España.
Brisckey, E.J. (1964). Etiological status and associated studies of pale, soft, exudative porcine musculature. In C.O. Chichester, E.M. Mrak & G.F. Stewart, Advances in food research (vol. 13) (pp. 89-178). New York: Academic Press.
Cameron N.D., & Enser M.B. (1991). Fatty acid composition of lipid in Longissimus dorsi muscle of duroc and British Landrace pigs and its
relationship with eating quality. Meat Science 29, 295-307.
Cameron, N.D., Nute, G.R., Brown, S.N., Enser, M., Wood, J.D., (1999). Meat quality of Large White pig genotypes selected for components of efficient lean growth rate. Animal Science, 29, 295-307.
Castellanos, C., Barragán, C., Rodríguez, M.C., Toro, M. & Silió, L. (1997) Identification of duroc and Iberian pigs using RAPD as diagnostic markers. 48th Annual Meeting of the EAAP. Viena, Austria, pp: 25-28.
Cilla, I., Altarriba, J., Guerrero, L., Gispert, M., Martínez, L., Moreno, C., Beltrán, J.A., Guàrdia, M.D., Diestre, A., Arnau, J., & Roncalés, P. (2006) Effect of different Duroc line sires on carcass composition, meat quality and dry-cured ham acceptability Meat Science, 72 (2), 252-260
De Pedro, E., Casillas, M.,& Miranda, C. M. (1997). Microwave Oven Application in the Extraction of Fat from the Subcutaneous Tissue of Iberian Pig Ham. Meat Science, 45, (1), 45-51,
Essén- Gustavson, B., Karlsson, A., Lundström, K., & Enfalt, A.C. (1994). Intramuscular fat muscle fibre lipid content in halotane-gene free ged high or low protein diets and its relation to meat quality. Meat Science, 38, 269-277.
Gandemer, G. (2002). Lipids in muscles and adipose tissues, changes during processing and sensory
62

Chapter I. Carcass composition and meat quality
properties of meat products. Meat Science, 62, 309-321.
García-Olmo, J., De Pedro, E., Garrido, A., Paredes, A. Sanabria, C., Santolalla, M. Salas, J. García-Hierro, J.R. , Gonzalez, I., García-Cachan, M.D., Guirao, J. (2002). Determination of the precision of the fatty acid analysis of Iberian pig fat by gas chromatography. Results of a mini collaborative study. Meat Science 60, 103–109.
Honikel, K.O. (1998). Reference methods for the assessment of physical characteristics of meat. Meat Science, 49, (4), 447-457.
Hornsey, H. C. (1956). The colour of cooked cured pork. 1. Estimation of the nitric oxide-haem pigments. Journal of the Science of Food and Agriculture, 7, 534-541.
Hovenier, R., Brascamp E.W., Kanis, E., Van Der Werf J.H.J. & Wassenber. A. (1993). Economic values for optimal traits: the example of meat quality in pigs. Journal of Animal Science. 71, 1429-1433.
Hunt, M.C., Acton, J.C., Benedict, R.C., Calkins, C.R., Cornforth, D.P., Jeremiah, L.E., Olson, D.G., Salm, C.P., Savell, J.W., Shivas, S.D. (1991). AMSA guidelines for meatcolour evaluation. In Proceedings 44th annual reciprocal meat conference, 9–12 July 1991.
Jonnes, G.F. (1998). Genetic aspects of domestication, common breeds and their origin. In M. F. Rothschild & A. Ruvinsky (Eds). The genetics of the pig (pp 17-50). New York. CAB International
Kauffman, R.G., Sybesma, W., Smulders, F.J.M., Eikelenboom, G., Engel, B., van Laack, R.L.J.M., Hoving-Bolingk, A.H., Sterrenberg, P., Nordheim, E.V., Walstra, P., & van del Wal, P.G. (1993). The effectiveness of examining early post mortem musculature to predict ultimate pork quality. Meat Science. 34, 283-300.
Lonergan, S. M., Huff-Lonergan, E., Rowe, L.J., Kuhlers, D. L., & Jungst, S.B. (2001). Selection for lean growth efficiency in Duroc pigs influences pork quality. Journal of Animal Science.. 79:2075-2085
López-Bote, C.J. (1998). Sustained utilisation of the iberian pig breed. In Proceedings of the 44th ICOMST. Barcelona, August 30th-September 4th, L2, 14-21.
McPhee, C.P.,& Trout, G.R. (1995). The effects of selection for lean growth and the halothane allele on carcass and meat quality of pigs transported long and short distances to slaughter. Livestock Production Science 42, 55-62
Morcuende, D., Estévez, M., Ramírez, R., & Cava, R. (in press). Effect of the Iberian x Duroc reciprocal cross on productive parameters, meat quality and lipogenic enzyme activities. Meat Science
Morcuende, D., Estévez, M., Ramírez, M.R., & Cava, R. (2004). Influencia de la genética porcina en la obtención de materia prima de calidad: estudio de dos líneas de cerdos duroc. Eurocarne, 123: 91-101.
Mourot, J., & Kouba, M. (1998). Lipogenic enzyme activities in muscles of growing Large White and Meishan pigs. Livestock Production Science 55, 127-133.
Nawar, WW. (1996). Lipids. In Food Chemistry, O.R. Fennema (ed.), Marcel Dekker, Inc., New York. 225-319.
Oksbjerg, N., Petersen, J.S., Sorensen, I.L., Henckel, P., Vestergaard, M., Ertbjerg, P., Moller, A.J., Bejerholm, C., Stoier, S. (2000). Long-term changes in performance and meat quality of Danish Landrace pigs: a study on a current compared with an unimproved genotype. Animal Science, 71, 81– 92.
Oliver, M.A., Gisperr, M., & Diesdre, A. (1993). The effects of breed and halothane sensitivity on pig meat quality. Meat Science, 35, 105-118.
Ramírez, R., Morcuende, D. & Cava, R. (2006). Adipogenic activity of 3 different genotypes Iberian x Duroc pigs. Submitted to Food Chemistry
Ruiz-Carrascal, J., Ventanas, J., Cava, R., Andrés, A.I., & García, C. (2000). Texture and appearance of dry cured ham as affected by fat content and fatty acid composition. Food Research International, 33, 91-95.
Sierra Alfranca, I. (1992). Intensificación reproductiva en el cerdo ibérico. Sistemas genéticos y de manejo. Anaporc, 115,46-50.
SPSS (2003) Inc. SPSS 12.0 for Windows SPSS Inc. Chicago.
Soriano, A., Quiles, R., Mariscal, C., & García, A. (2005). Pig sire type and sex effects on carcass traits, meat quality and physicochemical and sensory characteristics of Serrano dry-cured ham. Journal of Science of Food Agriculture, 85, 914–1924.
Suzuki, K., Shibata, T., Kadowaki, H., Abe, H., & Toyoshima, T. (2003). Meat quality comparision of Berkshire, duroc and crossbred pigs sired by Berkshire and duroc. Meat Science, 64, 35-42.
Tejeda, J.F., Gandemer, G., Antequera, T., Viau, M., & García, C. (2002). Lipid traits of muscles as related to genotype and fattening diet in Iberian pigs: total intramuscular lipids and triacylglycerols. Meat Science 60, 357–363.
63


Chapter II

Chapter II. Fatty acid composition and adipogenic activity
FATTY ACID COMPOSITION AND ADIPOGENIC ENZYME ACTIVITY OF MUSCLE AND ADIPOSE TISSUE AS AFFECTED BY IBERIAN X DUROC PIG
GENOTYPE1
ABSTRACT
The adipogenic potential of subcutaneous fat (SCF) and muscles Longissimus dorsi (LD) and Biceps femoris (BF) were evaluated in 3 different Iberian x Duroc pig genotypes: GEN1: ♂ Iberian x ♀ Duroc1, GEN2: ♂ Duroc1 x ♀ Iberian; GEN3: ♂ Duroc2 x ♀ Iberian. GEN1 and GEN2 are reciprocal crosses, while the difference between GEN2 and GEN3 is the Duroc sire line. Reciprocal crosses (GEN1 vs GEN2) showed similar traits, while the genotype of the Duroc sire line (GEN2 vs GEN3) significantly influenced the adipogenic character. GEN3 had lower fat depths and a more unsaturated SCF than GEN2. The intramuscular fat (IMF) content of the LD was higher in GEN2 than in GEN3, while BF showed a similar trend. The fatty acid composition of IMF and neutral lipid fraction (NL) in LD and BF was more unsaturated in GEN3 than in GEN2. Glucose-6-phosphate dehydrogenase (G6PDH) and malic enzyme (ME) activities in SCF and in both muscles analysed were higher in GEN2 than in GEN3. The highest fat depths and IMF of GEN1 and GEN2 was in accordance to the highest G6PDH and ME activities, which indicates that the lipid synthesis and depot in muscles and in SCF were higher in GEN1 and GEN2 than in GEN3; being these differences associated with the Duroc sire line. Therefore, the use of Duroc selected genotypes reduces the adipogenic character of Iberian x Duroc crosses which could have important repercussions on the quality of meat and dry-cured products.
Keywords: lipogenic enzymes; glucose-6-phosphate dehydrogenase; malic enzyme; intramuscular
fat; fatty acid; Duroc line; Iberian pig. 1.- INTRODUCTION Nowadays, the Iberian pig breed has increased its popularity, because the meat and meat products
traditionally obtained from this breed are highly appreciated by consumers for their excellent quality.
Different studies have shown that meat from Iberian pigs has better quality (colour, fatty acid profile
and sensory characteristics) than that obtained from industrial genotype pigs (Estévez, Morcuende,
Cava, 2003). As a result, the census of Iberian pigs has increased in the last years, which has
conducted to an improvement of the feeding and productive systems. As Iberian is a rustic breed with
a slow growth rate and low prolificity (Dobao, García, De Pedro, Rodrigáñez, & Silió, 1986), to
improve productive parameters, one of the alternatives more often applied is the cross of Iberian pigs
with Duroc at 50%. A high proportion of Iberian pigs are crossed with Duroc since it increases the
prolificity in 2-3 piglets, improves the growth rate, the feed efficiency and the lean content (Dobao et
al., 1986) without a significant reduction of the quality of the meat and meat products (López-Bote,
1998). These crosses are so frequent that it is estimated that between the animals slaughtered as
“Iberian”, less than the 25% are pure Iberian (Sierra, 1992).
Despite of the fact that the consumption of Iberian pig fresh meat has increased in the last years, the
production of Iberian pigs is mainly focused on obtaining raw meat to manufacture dry-cured meat
products. For this purpose, the industry requires fat carcasses from castrated heavy pigs slaughtered
at around 160kg of live weight. A high intramuscular fat content is important to aid a slow
dehydratation during the curing process (Gandemer, 2002). Fat content and fatty acid composition
1 Mª Rosario Ramírez, David Morcuende and Ramón Cava. Fatty acid composition and adipogenic enzyme activity of muscle and adipose tissue as affected by Iberian x Duroc pig genotype. Accepted for publication in Food Chemistry
67

Chapter II. Fatty acid composition and adipogenic activity
are determinant factors for the quality of Iberian dry-cured meat products (Ruiz-Carrascal, Ventanas,
Cava, Andrés, & García, 2000). Cava, Ruíz, Ventanas, and Antequera (1999) observed a marked
influence of intramuscular fatty acid composition of fresh meat on the flavour of Iberian dry-cured
meat products. Besides, fatty acid composition of intramuscular fat with high levels of linoleic acid
can affect water migration, as a very unsaturated fat avoids water migration within the piece, and as
a consequence, retards drying process (López-Bote, 1998; Girard, Bucharles, Berdague, &
Ramihone, 1989).
In Spain, a specific law for Iberian products was passed in 2001 to regulate the Iberian market
(B.O.E., 15th October 2001). One of the most important aspects that this law regulates is the
genotype used for the manufacture of dry-cured meat products (hams, forelegs and loins) labelled as
“Iberian”. The law allows using pure Iberian pigs as well as Iberian x Duroc crosses, but in the
crosses obliges always to employ Iberian females to preserve the genetic patrimony and the
biodiversity of the Iberian breed. This fact makes it really important the assess and selection of the
Duroc paternal line for the cross with Iberian, because Duroc breed is so widespread, that cannot be
considered an homogeneous breed since important differences in productive and carcass
parameters and in the quality of meat and meat products have been reported (Cilla et al., 2006;
Lonergan, Huff-Lonergan, Rowe, Kuhlers, & Jungst 2001). However, concerning differences between
Iberian x Duroc reciprocal crosses, Morcuende, Estévez, Ramírez, & Cava (2003) did not find
important differences between them.
By contrast to other species in which the lipogenesis of fatty acids takes place in the liver, in pigs, it
mainly takes place in situ, in the adipose tissues (O’Hea & Leveille, 1969). The synthesis of
triglycerides of the adipose tissue comes from fatty acid from circulating triglycerides as a result of
adipose lipoprotein lipase activity (Steffen, Brown, & Mersmann, 1978) and from fatty acid the
synthesised de novo (mainly from diet starch) in that tissue (O’Hea & Leveille, 1969). The NADPH for
synthesis of de novo fatty acids is supplied by malic enzyme (ME) and by glucose-6-phosphate
dehydrogenase (G6PDH) (Young, Sharago, & Lardy, 1964; Wise & Ball, 1964). The G6PDH takes
part in the route of pentose phosphate while the ME transforms malic acid in pyruvic acid.
Endogenous synthesis of fatty acids comes from acetyl CoA and malonil CoA molecules to produce
palmitic acid (C16:0), from which can be synthesized stearic acid (C18:0) by elongation, being these
fatty acids unsaturated, by means of desaturase enzymes, in palmitoleic acid (C16:1n-7) and oleic
acid (C18:1n-9). Differences in the lipogenic enzyme activity are mostly caused by animal genotype
and to a less extent by the diet (Morales, Pérez, Baucells, Mourot, & Gasa, 2002). In this respect,
higher lipogenic activity has been found in rustic breeds with high intramuscular fat levels than in
industrial ones (Mourot & Kouba, 1998; Morales et al., 2002). Moreover, we have found important
differences among genotypes in a previous study (Ramírez & Cava, 2006) in meat quality. The
objectives of this study were to assess the consequences of the use of different Duroc paternal lines
in Iberian x Duroc crosses as well as the differences between Iberian x Duroc reciprocal crosses on
the adipogenic character and fatty acid composition of subcutaneous and intramuscular fat.
68

Chapter II. Fatty acid composition and adipogenic activity
2.- MATERIALS AND METHODS 2.1.- Animals. In order to develop this work, 3 groups of 10 pigs each one were studied (5 males and 5 females)
from different genotypes: GEN1: ♂ Iberian x ♀ Duroc1, GEN2: ♂ Duroc1 x ♀ Iberian; GEN3: ♂
Duroc2 x ♀ Iberian. GEN1 and GEN2 are reciprocal crosses, while the difference between GEN2
and GEN3 is the Duroc sire line. The genotype Duroc1 (DU1) were pigs selected for the manufacture
of dry-cured meat products (hams, loins, forelegs), with a high level of fattening. The genotype
Duroc2 (DU2) were animals selected for meat production, with high percentages of meat cuts and
with low carcass fattening. Pigs were raised all together in an intensive system and were fed ad
libitum with the concentrate feeds shown in table 1. Pigs were randomly slaughtered after 316 days
of rearing with 150-165Kg live weight.
Table 1.- Proximate composition (%) and fatty acid
composition (% total fatty acids) of the pig diets
Mixed diet I II Proximate composition Crude protein 16.0 13.5 Crude fat 3.3 5.0 Crude fiber 4.8 3.7 Ash 6.9 6.2 Lysine 0.9 0.5 Metabolizable energy (Kcal/Kg) 3071.5 3183.7 Fatty acid composition C14:0 0.1 0.1 C16:0 14.6 21.0 C18:0 4.4 5.6 C18:1n-9 23.3 31.3 C18:2n-6 34.7 35.1 C18:3n-6 2.0 2.3 Mixed diet I: from 60 to 100kg live weight Mixed diet II: from 100 to 165 kg live weight
2.2.- Back fat and ham thickness. The backfat thickness (BFT) and ham fat thickness (HFT) were measured in the 5th rib and in the
Biceps femoris muscle in the carcass and ham, respectively. Biceps femoris (BF) and Longissimus
dorsi (LD) muscles were removed from the carcasses and stored at -80ºC until their analyses. For
the analyses, the central part of the muscles was taken. Subcutaneous fat (SCF) was taken from the
inner layer of the backfat in the 5-6th thoracic rib and also was stored at -80ºC until being analysed.
2.3.- Fat extraction, lipid fractionation and fatty acid analysis. Intramuscular lipids were extracted from 5g of meat with chloroform/methanol (1:2) according to the
method described by Bligh and Dyer (1959) and quantified by weighing after solvent evaporation.
Moisture content was determined by drying samples at 102ºC until constant weight according AOAC
method (AOAC, 2000). Total lipid extracts from intramuscular fat were fractionated by solid phase
extraction on 100mg aminopropyl minicolumns (Varian, CA), following the procedure described by
Monin, Hortós, Díaz, Rock, and García-Regueiro (2003). Fatty acid methyl esters (FAMEs) from
neutral lipids (NL), total IMF and SCF were prepared by acidic esterification (5% sulphuric acid in
methanol). FAMEs were analysed in a Hewlett-Packard model HP-5890A gas chromatograph
equipped with a flame ionization detector (FID). The FAMEs were separated on a semicapillary
69

Chapter II. Fatty acid composition and adipogenic activity
column (Hewlett-Packard FFAP-TPA fused-silica column, 30m length, 0.53mm i.d., and 1.0 µm film
thickness). The injector and detector temperatures were held at 230°C. The column oven
temperature was maintained at 220°C. The flow rate of the carrier gas (N2) was set at 1.8mL/min.
Identification of FAMEs was based on retention times of reference compounds (SIGMA). Fatty acid
composition was expressed as percentage of FAMEs analysed.
2.4.- Tissue enzyme activity of lipogenesis enzymes. 1g of SCF or 2g of muscles –LD and BF- were homogenized in 10mL of an ice-cold 25mM Tris-HCL
buffer containing 9% glycerol, 5mM MgCl2 and 7mM β-mercaptoethanol (pH 7.6). The homogenate
was centrifuged at 3000×g at 4ºC for 10 min and the supernatant was recentrifuged at 25000×g at
4ºC for 20 min. The resulting supernatants were analyzed for glucose-6-phosphate dehydrogenase
(G6PDH) (EC 1.1.1.49) and malic enzyme (ME) (EC 1.1.1.40) activities.
Enzyme activities were measured at 340 nm at 30 °C for 3 min with a thermospectrophotometer
(Thermo Electron Corp. Helios α. Waltham, MA) and expressed on the basis of nmol NADP+ reduced
to NADPH per min per mg protein, using the extinction coefficient of NADPH at 340 nm of
6.22 × 10⁶ M−1 cm−1. Glucose-6-phosphate dehydrogenase (G6PDH) was determined by the method
of Bautista, Garrido-Pertierra, & Soler (1988). 400 μL of the enzymatic extract were mixed with 540
μL of a buffer at pH 8 (10mL of Tris 1M, 2ml of NADP+ 10 mM, 10 ml of MgCl2 0.1 M and 63 mL of
mili-Q water). The reaction was initiated by the addition of 60 μL of glucose-6-phosphate 20mM. The
rate of reduction of NADP+ was monitored at 340nm. Malic enzyme (ME) determination was
measured according to the method of Spina, Bright & Rosenbloom. (1970). The reaction mixture
contained 25μL of NADP+ 40 mM, 252 μL of mili-Q water and 323 μL of a buffer with pH 7.4 (200 μL
of Tris 0.5 M, 10 μL of MgCl2 0.1M, 12.5 μL of NH4 80mM, 50 μL of KCl 2M, 50 μL of malic acid
200mM). The reaction was initiated by the addition of 400μL of the enzyme extract to a final volume
of 1 mL and monitored at 340 nm. Protein determination was measured spectrophotometrically at
595nm according to the method of Bradford (1976). All enzymes determinations were carried out in
triplicates.
2.5.- Statistical analysis.
The effects of genotype and sex were analysed by the Analysis of Variance procedure of SPSS,
version 12.0 (SPSS, 2003). A two-way analysis of the variance (genotype and sex) with interaction
(genotype x sex) was applied. Means were used to compare differences. When means were
significantly different a HSD Turkey’s test was applied to compare the mean values of the genotypes.
The relationships between traits were analysed by the calculation of Pearson’s coefficient. Principal
component analysis (PCA) was applied to determine relationships between variables and samples.
3.- RESULTS AND DISCUSSION 3.1.- Fat depths and fatty acid composition of subcutaneous fat. Fat depths and fatty acid composition were significantly influenced by genotype, while they were not
affected by animal sex (Table 2). Backfat thickness –BFT- and ham fat thickness –HFT- were
significantly higher in GEN2 than in GEN3, while GEN1 carcasses had an intermediate degree of
fattening. There was no effect of animal sex on fatty acid composition of SCF, whereas important
70

Chapter II. Fatty acid composition and adipogenic activity
differences were found between genotypes. SCF of GEN3 was the most unsaturated, since it
showed the highest percentages of C18:2n-6, C20:4n-6 and PUFA and the lowest of C18:0.
Table 2. Fat depths (mm) and fatty acid composition (g/100g FA) of subcutaneous fat from 3 different Iberian x
Duroc genotypes.
Genotype Sex Significance GEN1 GEN2 GEN3 ♂ ♀ gen sex interactionFat depths(mm) BFT 63ab±7.7 64a±8.8 53b±9.1 59±9.9 61±9.6 * ns ns HFT 31ab±4.2 34a±5.2 27b±5.8 32±5.1 29±6.3 ** ns ns Fatty acid composition C12:0 0.05±0.00 0.05±0.01 0.13±0.01 0.11±0.01 0.05±0.00 ns ns ns C14:0 0.04±0.01 0.04±0.00 0.05±0.01 0.05±0.01 0.05±0.01 ns ns ns C16:0 24.10±0.47 24.68±0.59 24.61±0.37 24.41±0.52 24.54±0.57 ns ns ns C16:1 n-7 2.14b±0.19 2.24b±0.21 2.68a±0.26 2.30±0.27 2.42±0.36 *** ns ns C17:0 0.31±0.03 0.30±0.04 0.32±0.05 0.31±0.04 0.31±0.04 ns ns ns C17:1 n-7 0.31±0.02 0.30±0.04 0.36±0.08 0.32±0.04 0.33±0.07 ns ns ns C18:0 13.35ab±0.56 13.71a±0.83 12.35b±1.02 13.23±0.94 13.03±1.07 * ns ns C18:1 n-9 46.96±0.87 45.71±0.94 46.07±1.29 46.18±1.38 46.26±0.92 ns ns ns C18:2 n-6 9.70b±0.69 10.07ab±0.41 10.67a±0.77 10.12±0.86 10.20±0.64 * ns ns C18:3 n-6 0.47±0.11 0.49±0.11 0.57±0.04 0.48±0.14 0.53±0.04 ns ns ns C20:0 0.21±0.02 0.22±0.02 0.21±0.02 0.22±0.02 0.21±0.02 ns ns ns C20:1n-9 1.49a±0.17 1.40ab±0.17 1.20b±0.20 1.44±0.22 1.28±0.18 ** ns ns C20:2 n-6 0.67±0.06 0.63±0.08 0.54±0.16 0.62±0.15 0.61±0.07 ns ns ns C20:4 n-6 0.15b±0.02 0.15b±0.01 0.17a±0.01 0.16±0.02 0.15±0.01 ** ns ns C22:4 n-6 0.07±0.04 0.01±0.03 0.06±0.04 0.06±0.04 0.03±0.04 ns ns ns SFA 38.05±0.76 39.00±1.08 37.68±1.31 38.33±1.06 38.18±1.34 ns ns ns MUFA 50.90±0.98 49.65±1.10 50.30±1.61 50.24±1.55 50.29±1.14 ns ns ns PUFA 11.05b±0.74 11.34ab±0.47 12.01a±0.78 11.44±0.88 11.53±0.68 * ns ns GEN:genotype. GEN1: IB x DU1; GEN2: DU1x IB; GEN3: DU2 x IB. BFT: backfat thickness. HFT: ham fat thickness. SFA: saturated fatty acids, MUFA: monounsaturated fatty acids, PUFA: polyunsaturated fatty acids. ns: not significant, * p<0.05, ** p <0.01, ***p<0.001. a,b: Different letters in the same row indicate significant statistical differences within the same day of analysis (Tukey’s test, p<0.05).
Results indicate a higher fattening in GEN2 carcasses than in those from the other two genotypes,
while no significant differences were found between the reciprocal crosses (GEN1 vs. GEN2).
However, the differences found between the genotypes from the 2 paternal lines of Duroc (GEN2 vs.
GEN3) indicate that the cross of a selected Duroc genotype (DU2) with Iberian reduced carcass fat
and increased the degree of unsaturation of SCF. Differences in fatty acid composition are explained
by differences in carcass fattening due to genotype. As more developed is the backfat in the carcass,
higher is the proportion of fatty acids stored in the adipose tissue arising from de novo fatty acid
synthesis, specifically SFA and MUFA, and less is the content in PUFA, since the proportion of PUFA
provided by dietary lipids is lower (Gandemer, 2002). In terms of meat and technological quality, fatty
acid composition has an important effect on softness and oxidative stability of fat and meat, being
associated high PUFA level with a softer fat and with an increase in rancidity (Wood et al., 2003).
71
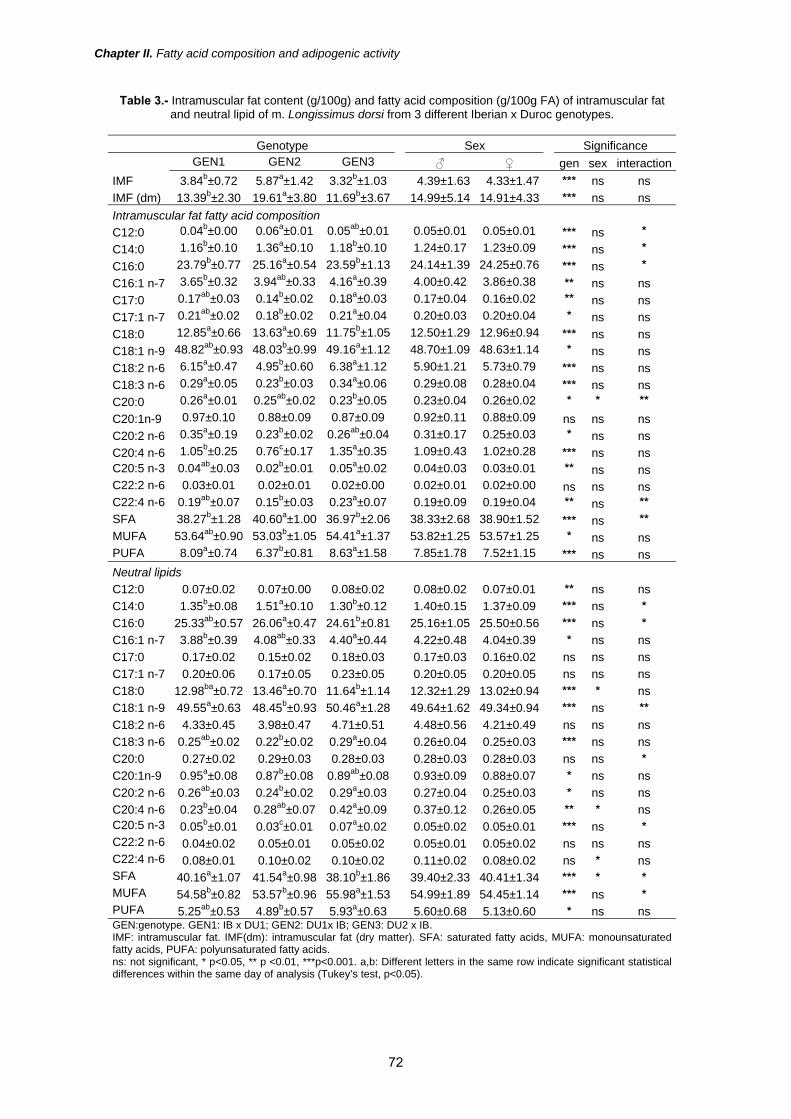
Chapter II. Fatty acid composition and adipogenic activity
Table 3.- Intramuscular fat content (g/100g) and fatty acid composition (g/100g FA) of intramuscular fat and neutral lipid of m. Longissimus dorsi from 3 different Iberian x Duroc genotypes.
Genotype Sex Significance GEN1 GEN2 GEN3 ♂ ♀ gen sex interactionIMF 3.84b±0.72 5.87a±1.42 3.32b±1.03 4.39±1.63 4.33±1.47 *** ns ns IMF (dm) 13.39b±2.30 19.61a±3.80 11.69b±3.67 14.99±5.14 14.91±4.33 *** ns ns Intramuscular fat fatty acid composition C12:0 0.04b±0.00 0.06a±0.01 0.05ab±0.01 0.05±0.01 0.05±0.01 *** ns * C14:0 1.16b±0.10 1.36a±0.10 1.18b±0.10 1.24±0.17 1.23±0.09 *** ns * C16:0 23.79b±0.77 25.16a±0.54 23.59b±1.13 24.14±1.39 24.25±0.76 *** ns * C16:1 n-7 3.65b±0.32 3.94ab±0.33 4.16a±0.39 4.00±0.42 3.86±0.38 ** ns ns C17:0 0.17ab±0.03 0.14b±0.02 0.18a±0.03 0.17±0.04 0.16±0.02 ** ns ns C17:1 n-7 0.21ab±0.02 0.18b±0.02 0.21a±0.04 0.20±0.03 0.20±0.04 * ns ns C18:0 12.85a±0.66 13.63a±0.69 11.75b±1.05 12.50±1.29 12.96±0.94 *** ns ns C18:1 n-9 48.82ab±0.93 48.03b±0.99 49.16a±1.12 48.70±1.09 48.63±1.14 * ns ns C18:2 n-6 6.15a±0.47 4.95b±0.60 6.38a±1.12 5.90±1.21 5.73±0.79 *** ns ns C18:3 n-6 0.29a±0.05 0.23b±0.03 0.34a±0.06 0.29±0.08 0.28±0.04 *** ns ns C20:0 0.26a±0.01 0.25ab±0.02 0.23b±0.05 0.23±0.04 0.26±0.02 * * ** C20:1n-9 0.97±0.10 0.88±0.09 0.87±0.09 0.92±0.11 0.88±0.09 ns ns ns C20:2 n-6 0.35a±0.19 0.23b±0.02 0.26ab±0.04 0.31±0.17 0.25±0.03 * ns ns C20:4 n-6 1.05b±0.25 0.76c±0.17 1.35a±0.35 1.09±0.43 1.02±0.28 *** ns ns C20:5 n-3 0.04ab±0.03 0.02b±0.01 0.05a±0.02 0.04±0.03 0.03±0.01 ** ns ns C22:2 n-6 0.03±0.01 0.02±0.01 0.02±0.00 0.02±0.01 0.02±0.00 ns ns ns C22:4 n-6 0.19ab±0.07 0.15b±0.03 0.23a±0.07 0.19±0.09 0.19±0.04 ** ns ** SFA 38.27b±1.28 40.60a±1.00 36.97b±2.06 38.33±2.68 38.90±1.52 *** ns ** MUFA 53.64ab±0.90 53.03b±1.05 54.41a±1.37 53.82±1.25 53.57±1.25 * ns ns PUFA 8.09a±0.74 6.37b±0.81 8.63a±1.58 7.85±1.78 7.52±1.15 *** ns ns Neutral lipids C12:0 0.07±0.02 0.07±0.00 0.08±0.02 0.08±0.02 0.07±0.01 ** ns ns C14:0 1.35b±0.08 1.51a±0.10 1.30b±0.12 1.40±0.15 1.37±0.09 *** ns * C16:0 25.33ab±0.57 26.06a±0.47 24.61b±0.81 25.16±1.05 25.50±0.56 *** ns * C16:1 n-7 3.88b±0.39 4.08ab±0.33 4.40a±0.44 4.22±0.48 4.04±0.39 * ns ns C17:0 0.17±0.02 0.15±0.02 0.18±0.03 0.17±0.03 0.16±0.02 ns ns ns C17:1 n-7 0.20±0.06 0.17±0.05 0.23±0.05 0.20±0.05 0.20±0.05 ns ns ns C18:0 12.98ba±0.72 13.46a±0.70 11.64b±1.14 12.32±1.29 13.02±0.94 *** * ns C18:1 n-9 49.55a±0.63 48.45b±0.93 50.46a±1.28 49.64±1.62 49.34±0.94 *** ns ** C18:2 n-6 4.33±0.45 3.98±0.47 4.71±0.51 4.48±0.56 4.21±0.49 ns ns ns C18:3 n-6 0.25ab±0.02 0.22b±0.02 0.29a±0.04 0.26±0.04 0.25±0.03 *** ns ns C20:0 0.27±0.02 0.29±0.03 0.28±0.03 0.28±0.03 0.28±0.03 ns ns * C20:1n-9 0.95a±0.08 0.87b±0.08 0.89ab±0.08 0.93±0.09 0.88±0.07 * ns ns C20:2 n-6 0.26ab±0.03 0.24b±0.02 0.29a±0.03 0.27±0.04 0.25±0.03 * ns ns C20:4 n-6 0.23b±0.04 0.28ab±0.07 0.42a±0.09 0.37±0.12 0.26±0.05 ** * ns C20:5 n-3 0.05b±0.01 0.03c±0.01 0.07a±0.02 0.05±0.02 0.05±0.01 *** ns * C22:2 n-6 0.04±0.02 0.05±0.01 0.05±0.02 0.05±0.01 0.05±0.02 ns ns ns C22:4 n-6 0.08±0.01 0.10±0.02 0.10±0.02 0.11±0.02 0.08±0.02 ns * ns SFA 40.16a±1.07 41.54a±0.98 38.10b±1.86 39.40±2.33 40.41±1.34 *** * * MUFA 54.58b±0.82 53.57b±0.96 55.98a±1.53 54.99±1.89 54.45±1.14 *** ns * PUFA 5.25ab±0.53 4.89b±0.57 5.93a±0.63 5.60±0.68 5.13±0.60 * ns ns GEN:genotype. GEN1: IB x DU1; GEN2: DU1x IB; GEN3: DU2 x IB. IMF: intramuscular fat. IMF(dm): intramuscular fat (dry matter). SFA: saturated fatty acids, MUFA: monounsaturated fatty acids, PUFA: polyunsaturated fatty acids. ns: not significant, * p<0.05, ** p <0.01, ***p<0.001. a,b: Different letters in the same row indicate significant statistical differences within the same day of analysis (Tukey’s test, p<0.05).
72
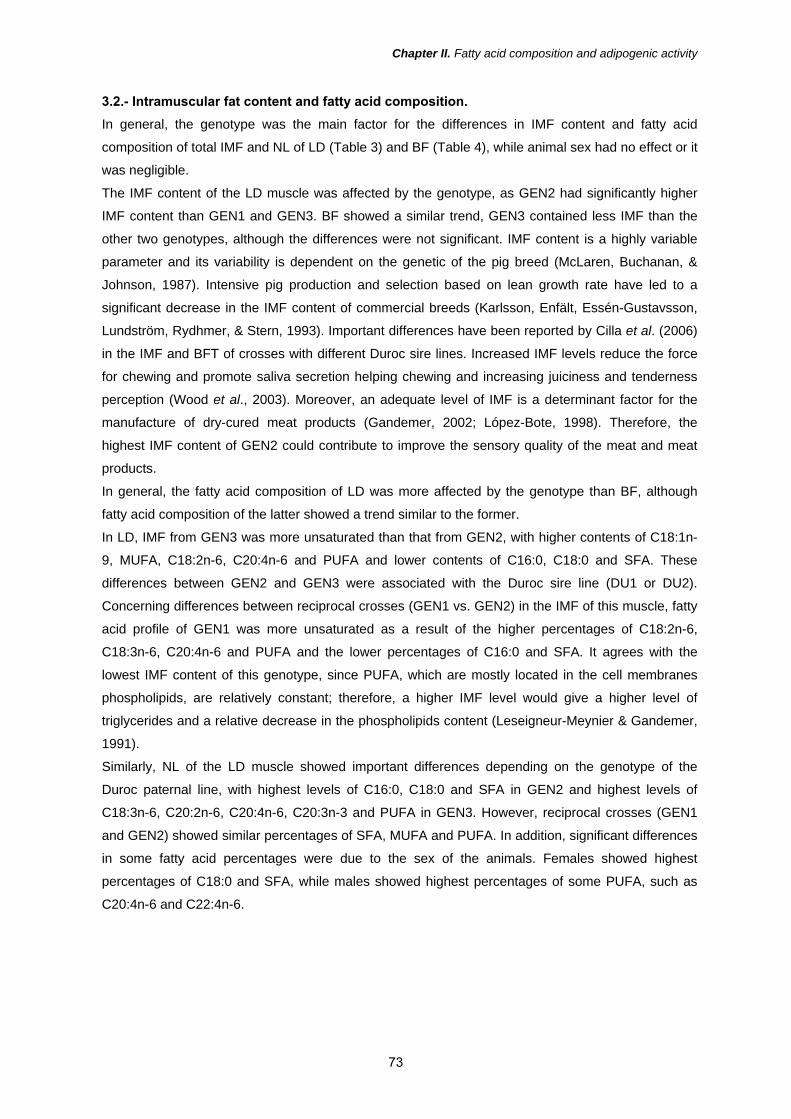
Chapter II. Fatty acid composition and adipogenic activity
3.2.- Intramuscular fat content and fatty acid composition. In general, the genotype was the main factor for the differences in IMF content and fatty acid
composition of total IMF and NL of LD (Table 3) and BF (Table 4), while animal sex had no effect or it
was negligible.
The IMF content of the LD muscle was affected by the genotype, as GEN2 had significantly higher
IMF content than GEN1 and GEN3. BF showed a similar trend, GEN3 contained less IMF than the
other two genotypes, although the differences were not significant. IMF content is a highly variable
parameter and its variability is dependent on the genetic of the pig breed (McLaren, Buchanan, &
Johnson, 1987). Intensive pig production and selection based on lean growth rate have led to a
significant decrease in the IMF content of commercial breeds (Karlsson, Enfält, Essén-Gustavsson,
Lundström, Rydhmer, & Stern, 1993). Important differences have been reported by Cilla et al. (2006)
in the IMF and BFT of crosses with different Duroc sire lines. Increased IMF levels reduce the force
for chewing and promote saliva secretion helping chewing and increasing juiciness and tenderness
perception (Wood et al., 2003). Moreover, an adequate level of IMF is a determinant factor for the
manufacture of dry-cured meat products (Gandemer, 2002; López-Bote, 1998). Therefore, the
highest IMF content of GEN2 could contribute to improve the sensory quality of the meat and meat
products.
In general, the fatty acid composition of LD was more affected by the genotype than BF, although
fatty acid composition of the latter showed a trend similar to the former.
In LD, IMF from GEN3 was more unsaturated than that from GEN2, with higher contents of C18:1n-
9, MUFA, C18:2n-6, C20:4n-6 and PUFA and lower contents of C16:0, C18:0 and SFA. These
differences between GEN2 and GEN3 were associated with the Duroc sire line (DU1 or DU2).
Concerning differences between reciprocal crosses (GEN1 vs. GEN2) in the IMF of this muscle, fatty
acid profile of GEN1 was more unsaturated as a result of the higher percentages of C18:2n-6,
C18:3n-6, C20:4n-6 and PUFA and the lower percentages of C16:0 and SFA. It agrees with the
lowest IMF content of this genotype, since PUFA, which are mostly located in the cell membranes
phospholipids, are relatively constant; therefore, a higher IMF level would give a higher level of
triglycerides and a relative decrease in the phospholipids content (Leseigneur-Meynier & Gandemer,
1991).
Similarly, NL of the LD muscle showed important differences depending on the genotype of the
Duroc paternal line, with highest levels of C16:0, C18:0 and SFA in GEN2 and highest levels of
C18:3n-6, C20:2n-6, C20:4n-6, C20:3n-3 and PUFA in GEN3. However, reciprocal crosses (GEN1
and GEN2) showed similar percentages of SFA, MUFA and PUFA. In addition, significant differences
in some fatty acid percentages were due to the sex of the animals. Females showed highest
percentages of C18:0 and SFA, while males showed highest percentages of some PUFA, such as
C20:4n-6 and C22:4n-6.
73
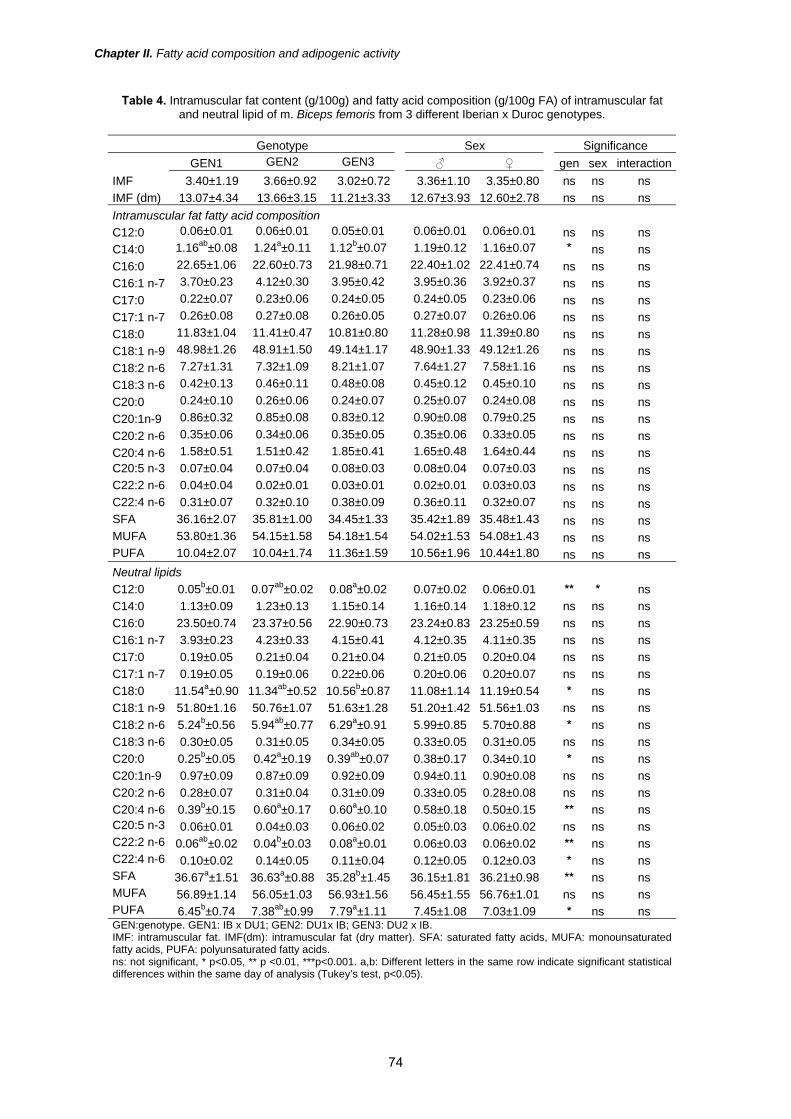
Chapter II. Fatty acid composition and adipogenic activity
Table 4. Intramuscular fat content (g/100g) and fatty acid composition (g/100g FA) of intramuscular fat and neutral lipid of m. Biceps femoris from 3 different Iberian x Duroc genotypes.
Genotype Sex Significance GEN1 GEN2 GEN3 ♂ ♀ gen sex interactionIMF 3.40±1.19 3.66±0.92 3.02±0.72 3.36±1.10 3.35±0.80 ns ns ns IMF (dm) 13.07±4.34 13.66±3.15 11.21±3.33 12.67±3.93 12.60±2.78 ns ns ns Intramuscular fat fatty acid composition C12:0 0.06±0.01 0.06±0.01 0.05±0.01 0.06±0.01 0.06±0.01 ns ns ns C14:0 1.16ab±0.08 1.24a±0.11 1.12b±0.07 1.19±0.12 1.16±0.07 * ns ns C16:0 22.65±1.06 22.60±0.73 21.98±0.71 22.40±1.02 22.41±0.74 ns ns ns C16:1 n-7 3.70±0.23 4.12±0.30 3.95±0.42 3.95±0.36 3.92±0.37 ns ns ns C17:0 0.22±0.07 0.23±0.06 0.24±0.05 0.24±0.05 0.23±0.06 ns ns ns C17:1 n-7 0.26±0.08 0.27±0.08 0.26±0.05 0.27±0.07 0.26±0.06 ns ns ns C18:0 11.83±1.04 11.41±0.47 10.81±0.80 11.28±0.98 11.39±0.80 ns ns ns C18:1 n-9 48.98±1.26 48.91±1.50 49.14±1.17 48.90±1.33 49.12±1.26 ns ns ns C18:2 n-6 7.27±1.31 7.32±1.09 8.21±1.07 7.64±1.27 7.58±1.16 ns ns ns C18:3 n-6 0.42±0.13 0.46±0.11 0.48±0.08 0.45±0.12 0.45±0.10 ns ns ns C20:0 0.24±0.10 0.26±0.06 0.24±0.07 0.25±0.07 0.24±0.08 ns ns ns C20:1n-9 0.86±0.32 0.85±0.08 0.83±0.12 0.90±0.08 0.79±0.25 ns ns ns C20:2 n-6 0.35±0.06 0.34±0.06 0.35±0.05 0.35±0.06 0.33±0.05 ns ns ns C20:4 n-6 1.58±0.51 1.51±0.42 1.85±0.41 1.65±0.48 1.64±0.44 ns ns ns C20:5 n-3 0.07±0.04 0.07±0.04 0.08±0.03 0.08±0.04 0.07±0.03 ns ns ns C22:2 n-6 0.04±0.04 0.02±0.01 0.03±0.01 0.02±0.01 0.03±0.03 ns ns ns C22:4 n-6 0.31±0.07 0.32±0.10 0.38±0.09 0.36±0.11 0.32±0.07 ns ns ns SFA 36.16±2.07 35.81±1.00 34.45±1.33 35.42±1.89 35.48±1.43 ns ns ns MUFA 53.80±1.36 54.15±1.58 54.18±1.54 54.02±1.53 54.08±1.43 ns ns ns PUFA 10.04±2.07 10.04±1.74 11.36±1.59 10.56±1.96 10.44±1.80 ns ns ns Neutral lipids C12:0 0.05b±0.01 0.07ab±0.02 0.08a±0.02 0.07±0.02 0.06±0.01 ** * ns C14:0 1.13±0.09 1.23±0.13 1.15±0.14 1.16±0.14 1.18±0.12 ns ns ns C16:0 23.50±0.74 23.37±0.56 22.90±0.73 23.24±0.83 23.25±0.59 ns ns ns C16:1 n-7 3.93±0.23 4.23±0.33 4.15±0.41 4.12±0.35 4.11±0.35 ns ns ns C17:0 0.19±0.05 0.21±0.04 0.21±0.04 0.21±0.05 0.20±0.04 ns ns ns C17:1 n-7 0.19±0.05 0.19±0.06 0.22±0.06 0.20±0.06 0.20±0.07 ns ns ns C18:0 11.54a±0.90 11.34ab±0.52 10.56b±0.87 11.08±1.14 11.19±0.54 * ns ns C18:1 n-9 51.80±1.16 50.76±1.07 51.63±1.28 51.20±1.42 51.56±1.03 ns ns ns C18:2 n-6 5.24b±0.56 5.94ab±0.77 6.29a±0.91 5.99±0.85 5.70±0.88 * ns ns C18:3 n-6 0.30±0.05 0.31±0.05 0.34±0.05 0.33±0.05 0.31±0.05 ns ns ns C20:0 0.25b±0.05 0.42a±0.19 0.39ab±0.07 0.38±0.17 0.34±0.10 * ns ns C20:1n-9 0.97±0.09 0.87±0.09 0.92±0.09 0.94±0.11 0.90±0.08 ns ns ns C20:2 n-6 0.28±0.07 0.31±0.04 0.31±0.09 0.33±0.05 0.28±0.08 ns ns ns C20:4 n-6 0.39b±0.15 0.60a±0.17 0.60a±0.10 0.58±0.18 0.50±0.15 ** ns ns C20:5 n-3 0.06±0.01 0.04±0.03 0.06±0.02 0.05±0.03 0.06±0.02 ns ns ns C22:2 n-6 0.06ab±0.02 0.04b±0.03 0.08a±0.01 0.06±0.03 0.06±0.02 ** ns ns C22:4 n-6 0.10±0.02 0.14±0.05 0.11±0.04 0.12±0.05 0.12±0.03 * ns ns SFA 36.67a±1.51 36.63a±0.88 35.28b±1.45 36.15±1.81 36.21±0.98 ** ns ns MUFA 56.89±1.14 56.05±1.03 56.93±1.56 56.45±1.55 56.76±1.01 ns ns ns PUFA 6.45b±0.74 7.38ab±0.99 7.79a±1.11 7.45±1.08 7.03±1.09 * ns ns GEN:genotype. GEN1: IB x DU1; GEN2: DU1x IB; GEN3: DU2 x IB. IMF: intramuscular fat. IMF(dm): intramuscular fat (dry matter). SFA: saturated fatty acids, MUFA: monounsaturated fatty acids, PUFA: polyunsaturated fatty acids. ns: not significant, * p<0.05, ** p <0.01, ***p<0.001. a,b: Different letters in the same row indicate significant statistical differences within the same day of analysis (Tukey’s test, p<0.05).
74

Chapter II. Fatty acid composition and adipogenic activity
In BF, neither the genotype nor the sex of the pigs affected the levels of any major fatty acids of the
IMF. Nevertheless, the fatty acid composition of BF showed similar a trend as LD, with the highest
percentages of unsaturated fatty acids in GEN3. Moreover, the fatty acid composition of NL of this
muscle was significantly affected by the genotype. So, the highest levels of unsaturated fatty acids,
such as C18:2n-6, C22:2n-6 and PUFA were found in GEN3 while GEN1 and GEN2 had significantly
highest percentages of SFA, being the highest level of C18:0 in GEN1 and C20:0 in GEN2.
The higher PUFA in BF could be due to the different metabolic pattern of LD (glycolytic) and BF
(intermediate oxidative) (Leseigneur-Meynier & Gandemer, 1991) and the higher PUFA content in
more oxidative muscles than in glycolytic ones as a consequence of their abundance of membranes,
rich in polyunsaturated phospholipids.
Fatty acid profiles high in oleic acid and low in linoleic acid have been associated with better flavour
in Iberian dry-cured meat products as an excess of oxidation development increases the appearance
of rancid flavours (Cava et al., 1999). However, meat with abundant PUFA levels can cause
undesirable technological and sensory consequences since PUFA are more sensitive to oxidation,
leading to meat texture, flavour and colour alterations (Morrissey, Sheehy, Galvin, Kerry, & Buckley,
1998). Although the meat from GEN3 had the highest MUFA levels, which is desirable in Iberian
products (Ruiz-Carrascal et al., 2000), it also had the highest percentages of PUFA, such as C18:2n-
6 and C18:3n-6 and the lowest IMF content. Therefore, the IMF content and the fatty acid profile of
GEN3, although has a better profile from a nutritional point of view (Simopoulos, 2003), it could also
reduce the oxidative stability of chilled fresh meat and dry-cured meat products.
3.3.- Lipogenic enzyme activity of subcutaneous fat and muscles. There were neither effect (p>0.05) of the sex nor significant interaction between the sex and the
genotype on lipogenic enzyme activity of SCF (Table 5). However, the genotype caused important
differences in the activity of both enzymes.
G6PDH and ME activities were higher in SCF than in muscles (Table 5), which is in accordance with
the literature consulted (Gondret et al., 2005; Kouba & Maurot 1999; Martínez-Puig et al., 2006,
Morales et al., 2002; Morcuende et al., in press). G6PDH activity was higher than ME activity in SCF,
whereas an opposite behaviour was found in muscles. The higher activity of ME than G6PDH in LD
and BF could be due to the fact that NADPH in the muscle is mostly provided by the ME activity and
not by the pentose phosphate pathway in which G6PDH is involved (Mourot & Kouba, 1998). Some
authors (Martínez-Puig et al., 2006) have suggested that this fact would make muscle less sensitive
than adipose tissue to variations of peripheral glucose, since the regulation of lipogenic enzymes is
very different in both tissues, as numerous regulating factors are involved in these processes (Azain,
2004).
In SCF, GEN3 had the lowest G6PDH activity and ME activity. Similar results were found in LD
muscle, as lower G6PDH activity and ME activity were found in GEN3 than in GEN1 and GEN2,
despite of the fact that these differences were not significant in the latter. BF muscle showed the
same trend, GEN1 and GEN2 showed the highest G6PDH activity and ME activity.
75

Chapter II. Fatty acid composition and adipogenic activity
Results revealed no differences in the lipogenic potential in SCF and LD and BF between reciprocal
crosses (GEN1 vs GEN2) agreeing with findings of Morcuende et al., (in press). These authors
reported no differences in G6PDH and ME activities in muscle and SCF of pigs from the reciprocal
cross Iberian x Duroc. However, the activities of both enzymes in the different tissues were strongly
influenced by the Duroc sire genotype (GEN2 vs GEN3). G6PDH and ME activities in SCF were 1.3-
fold and 1.5-fold higher in GEN2 than in GEN3, respectively; and G6PDH and ME activities in BF and
LD were 3-fold and 1.5-fold higher in GEN2 than in GEN3, respectively. The influence of genetic on
lipogenic activity has been reported by different authors (Morales et al., 2002; Mourot & Kouba 1998;
Mourot, Kouba, & Bonneau, 1996) who stated a higher enzyme lipogenic activity in rustic pig breeds
such as Iberian or Meishan than in industrial pig genotypes, such as Landrace or Large White.
However, as far as we know, no studies have previously reported differences in the lipogenic activity
due to the genotype of pigs within the same breed. Nonetheless, different authors (Cilla et al., 2006;
Lonergan et al., 2001) previously described important differences between lines of Duroc in the IMF
content, carcass composition and meat quality parameters, which can support the differences on the
adipogenic character and fatty acid composition found between the genotypes in the present study.
Table 5. Glucose-6-phosphate dehydrogenase (G6PDH) and malic enzyme (ME) activity in subcutaneous fat, L.
dorsi and B. femoris muscles (expressed as nmol of NADPH formed min -1 mg of protein-1) from 3 different Iberian x Duroc genotypes.
Genotype Sex Significance GEN1 GEN2 GEN3 ♂ ♀ gen sex interactionSubcutaneous fat G6PDH 1282.3a±132.9 1332.7a±269.4 1005.1b±164.6 1156.0±276.9 1249.0±206.2 *** ns ns
ME 837.6a±154.2 707.6ab±228.9 561.0b±199.5 632.5±215.3 757.9±218.2 * ns ns Longissimus dorsi G6PDH 1.7a±0.6 1.7a±0.6 0.5b±0.5 1.3±0.8 1.2±0.8 *** ns ns
ME 7.5±1.5 6.6±1.3 5.5±1.9 6.2±1.2 6.7±1.3 ns ns ns Biceps femoris G6PDH 2.1a±1.5 2.9a±0.8 0.8b±0.8 1.8±1.6 2.0±1.9 *** ns ns
ME 7.3a±1.5 7.7a±1.3 5.5b±1.0 6.5±1.7 7.2±1.4 *** ns ns GEN:genotype. GEN1: IB x DU1; GEN2: DU1x IB; GEN3: DU2 x IB. ME: malic enzyme, G6PDH: glucose 6 phosphate dehydrogenase. ns: not significant, * p<0.05, ** p <0.01, ***p<0.001. a,b: Different letters in the same row indicate significant statistical differences within the same day of analysis (Tukey’s test, p<0.05). The higher activity in both lipogenic enzymes (ME and G6PDH) is consistent with the higher BFT and
HFT and IMF content of the muscles. The highest fat depths and IMF of GEN1 and GEN2 agrees
with the highest G6PDH and ME activities, which indicates that the net production of NADPH, and as
a consequence, the lipid synthesis and storage in muscle and in subcutaneous fat were higher in
GEN1 and GEN2 than in GEN3. Different studies have related the lipogenic enzyme activity with the
number or volume of adipocytes from different adipose tissues in bovine (Eguinoa, Brocklehurst,
Aranal, Mendizabal, Vernon, & Purroy, 2003) and also in pigs (Mourot et al., 1996) as the increase in
adipocite size was associated with a higher lipogenic enzyme activity and backfat thickness.
76
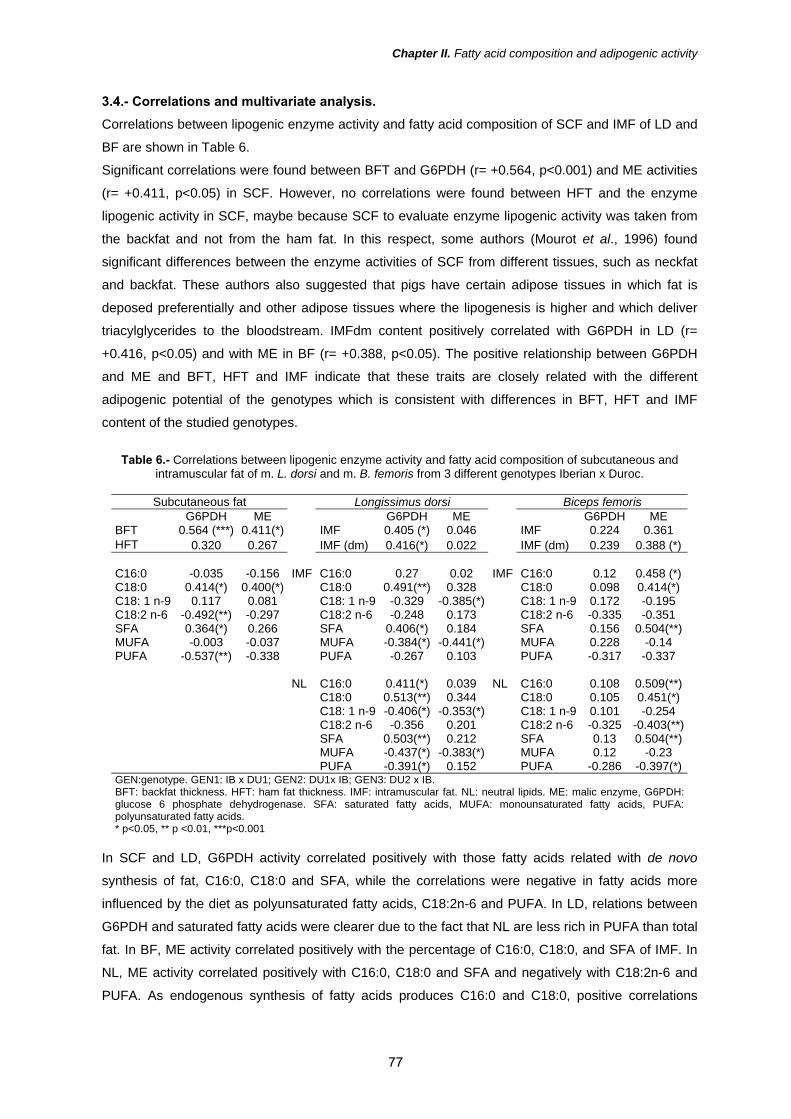
Chapter II. Fatty acid composition and adipogenic activity
3.4.- Correlations and multivariate analysis. Correlations between lipogenic enzyme activity and fatty acid composition of SCF and IMF of LD and
BF are shown in Table 6.
Significant correlations were found between BFT and G6PDH (r= +0.564, p<0.001) and ME activities
(r= +0.411, p<0.05) in SCF. However, no correlations were found between HFT and the enzyme
lipogenic activity in SCF, maybe because SCF to evaluate enzyme lipogenic activity was taken from
the backfat and not from the ham fat. In this respect, some authors (Mourot et al., 1996) found
significant differences between the enzyme activities of SCF from different tissues, such as neckfat
and backfat. These authors also suggested that pigs have certain adipose tissues in which fat is
deposed preferentially and other adipose tissues where the lipogenesis is higher and which deliver
triacylglycerides to the bloodstream. IMFdm content positively correlated with G6PDH in LD (r=
+0.416, p<0.05) and with ME in BF (r= +0.388, p<0.05). The positive relationship between G6PDH
and ME and BFT, HFT and IMF indicate that these traits are closely related with the different
adipogenic potential of the genotypes which is consistent with differences in BFT, HFT and IMF
content of the studied genotypes.
Table 6.- Correlations between lipogenic enzyme activity and fatty acid composition of subcutaneous and
intramuscular fat of m. L. dorsi and m. B. femoris from 3 different genotypes Iberian x Duroc.
Subcutaneous fat Longissimus dorsi Biceps femoris G6PDH ME G6PDH ME G6PDH ME BFT 0.564 (***) 0.411(*) IMF 0.405 (*) 0.046 IMF 0.224 0.361 HFT 0.320 0.267 IMF (dm) 0.416(*) 0.022 IMF (dm) 0.239 0.388 (*) C16:0 -0.035 -0.156 C16:0 0.27 0.02 C16:0 0.12 0.458 (*)C18:0 0.414(*) 0.400(*) C18:0 0.491(**) 0.328 C18:0 0.098 0.414(*) C18: 1 n-9 0.117 0.081 C18: 1 n-9 -0.329 -0.385(*) C18: 1 n-9 0.172 -0.195 C18:2 n-6 -0.492(**) -0.297 C18:2 n-6 -0.248 0.173 C18:2 n-6 -0.335 -0.351 SFA 0.364(*) 0.266 SFA 0.406(*) 0.184 SFA 0.156 0.504(**)MUFA -0.003 -0.037 MUFA -0.384(*) -0.441(*) MUFA 0.228 -0.14 PUFA -0.537(**) -0.338
IMF
PUFA -0.267 0.103
IMF
PUFA -0.317 -0.337 C16:0 0.411(*) 0.039 C16:0 0.108 0.509(**) C18:0 0.513(**) 0.344 C18:0 0.105 0.451(*) C18: 1 n-9 -0.406(*) -0.353(*) C18: 1 n-9 0.101 -0.254 C18:2 n-6 -0.356 0.201 C18:2 n-6 -0.325 -0.403(**) SFA 0.503(**) 0.212 SFA 0.13 0.504(**) MUFA -0.437(*) -0.383(*) MUFA 0.12 -0.23
NL
PUFA -0.391(*) 0.152
NL
PUFA -0.286 -0.397(*)GEN:genotype. GEN1: IB x DU1; GEN2: DU1x IB; GEN3: DU2 x IB. BFT: backfat thickness. HFT: ham fat thickness. IMF: intramuscular fat. NL: neutral lipids. ME: malic enzyme, G6PDH: glucose 6 phosphate dehydrogenase. SFA: saturated fatty acids, MUFA: monounsaturated fatty acids, PUFA: polyunsaturated fatty acids. * p<0.05, ** p <0.01, ***p<0.001
In SCF and LD, G6PDH activity correlated positively with those fatty acids related with de novo
synthesis of fat, C16:0, C18:0 and SFA, while the correlations were negative in fatty acids more
influenced by the diet as polyunsaturated fatty acids, C18:2n-6 and PUFA. In LD, relations between
G6PDH and saturated fatty acids were clearer due to the fact that NL are less rich in PUFA than total
fat. In BF, ME activity correlated positively with the percentage of C16:0, C18:0, and SFA of IMF. In
NL, ME activity correlated positively with C16:0, C18:0 and SFA and negatively with C18:2n-6 and
PUFA. As endogenous synthesis of fatty acids produces C16:0 and C18:0, positive correlations
77
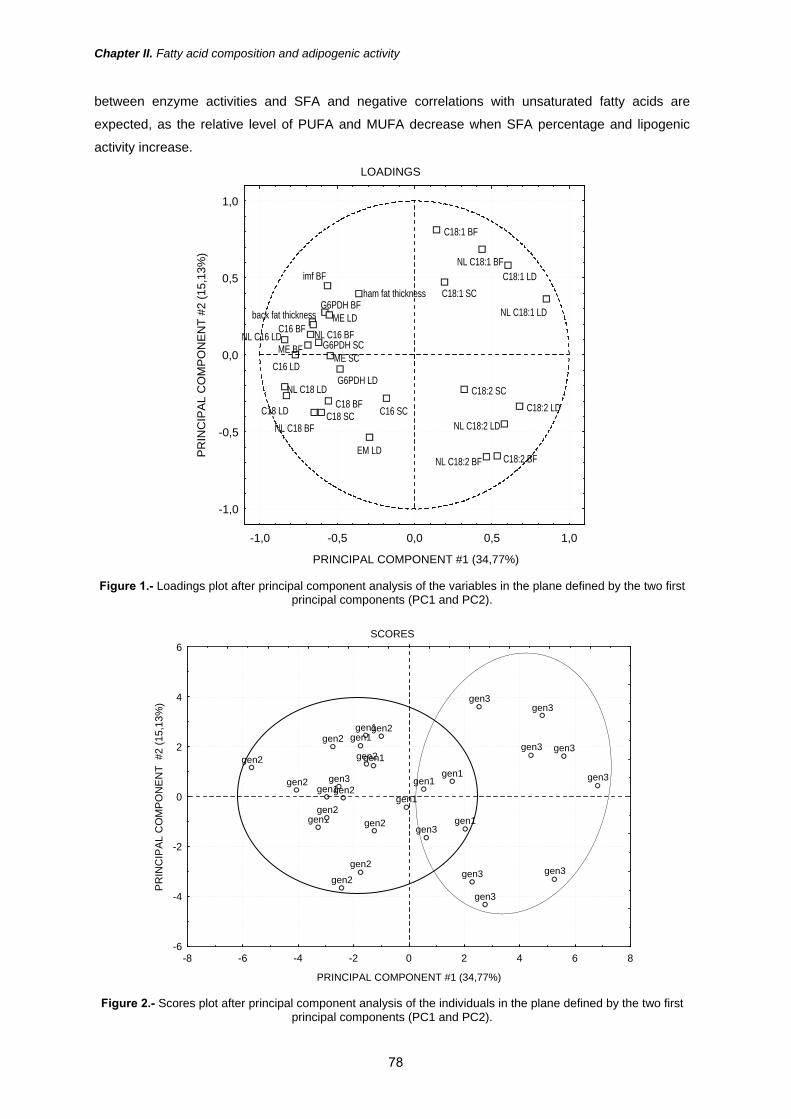
Chapter II. Fatty acid composition and adipogenic activity
between enzyme activities and SFA and negative correlations with unsaturated fatty acids are
expected, as the relative level of PUFA and MUFA decrease when SFA percentage and lipogenic
activity increase.
LOADINGS
-1,0 -0,5 0,0 0,5 1,0
PRINCIPAL COMPONENT #1 (34,77%)
-1,0
-0,5
0,0
0,5
1,0PR
INC
IPAL
CO
MPO
NEN
T #2
(15,
13%
)
C18:2 LD
NL C18:1 LD
C18:1 SC
C18:1 BF
ham fat thickness
back fat thickness
imf BF
EM LD
C18 BF
G6PDH LD
G6PDH BF
G6PDH SC
ME LD
ME BFME SC
C16 LD
NL C16 LD NL C16 BF
C18 LD
NL C18 LD
C18 SCNL C18 BF
C16 SC
C16 BF
NL C18:1 BFC18:1 LD
C18:2 SC
NL C18:2 BF C18:2 BF
NL C18:2 LD
Figure 1.- Loadings plot after principal component analysis of the variables in the plane defined by the two first
principal components (PC1 and PC2).
SCORES
gen1gen1
gen1
gen1
gen1gen1
gen1
gen1
gen1
gen2
gen2
gen2
gen2
gen2
gen2
gen2
gen2
gen2
gen2
gen3
gen3
gen3
gen3
gen3
gen3
gen3
gen3
gen3
gen3
-8 -6 -4 -2 0 2 4 6 8
PRINCIPAL COMPONENT #1 (34,77%)
-6
-4
-2
0
2
4
6
PR
INC
IPA
L C
OM
PO
NE
NT
#2
(15,
13%
)
Figure 2.- Scores plot after principal component analysis of the individuals in the plane defined by the two first
principal components (PC1 and PC2).
78
Chapter II. Fatty acid composition and adipogenic activity
PCA of the variables resulted in 5 significant factors that accounted for 75.95% of the variability.
Principal components, PC1 and PC2, explained the 34.77% and 15.13% of the variation of the data,
respectively. The loadings of this PCA are shown in Fig. 1. In this plot, it is possible to differentiate 2
groups of variables. In the positive x axis of the PC1 are located MUFA and PUFA from SCF, LD and
BF muscles (from total IMF and NL fraction); while in the negative x axis are placed SFA, fat depths,
IMF content and the activity of the lipogenic enzymes. The PC2 differentiates the group of MUFA,
located in the positive y axis, from the group of PUFA, located in the negative y axis. The distribution
of the data on the PC1 and PC2 (Fig. 2) shows 2 separate groups of points, corresponding one of
them to the reciprocal crosses (GEN1 and GEN2) and the other, to the GEN3. Results show a close
connection between high lipogenic enzyme activity, which generates SFA, and as a consequence
increase adipose tissues in SCF and IMF, and GEN1 and GEN2. The lowest lipogenic potential of
GEN3 decreased the fatness of the pigs, which increased the relative level of PUFA and MUFA, the
main variables associated to this genotype.
4.- CONCLUSION Iberian x Duroc reciprocal crosses had a similar lipogenic character. Nonetheless, the differences
between paternal lines of Duroc crossed with Iberian pigs had a marked influence on the adipogenic
potential. The use of Duroc sires with selected genotypes (DU2) reduces G6PDH and ME enzyme
activities and the IMF content, which has negative consequences for the manufacture of dry-cured
meat products. Moreover, it also modifies fatty acid profile increasing unsaturated fatty acids, which
has positive nutritional effects, although it can also decrease the shelf life of the meat and make it
more prone to suffer oxidation processes during refrigerated storage and during the manufacture of
dry-cured meat products.
ACKNOWLEDGEMENTS This study has been financed thanks to the II Plan Regional de Investigación y Desarrollo
Tecnológico de Extremadura (DOE 31 de 14 de Marzo de 2002), Consejería de Educación, Ciencia
y Tecnología de la Junta de Extremadura: Project 2PR02B018. M. Rosario Ramírez wants to thank
the University of Extremadura and to the Ministerio Educación y Ciencia the grants during the
development of this work. Authors thank Inmaculada Linares her excellent lab-work collaboration and
CENSYRA their participation in this project.
BIBLIOGRAPHY AOAC (2000). Official methods of analysis (15th ed).
Washington, DC: Association of Official Analytical Chemists.
Azain, M.J. (2004). Role of fatty acids in adypocite growth and development. Journal Animal Science. 82, 916-924.
Bautista, J.M., Garrido-Pertierra, A., & Soler., G. (1988). Glucose-6-phosphate dehidrogenase from Dicentrarchus labrax liver: kinetic mechanism and kinetics of NADPH inhibition. Biochimica et Biophysica Acta, 967, 3, 354-363.
B.O.E., 15 de Octubre del 2001. Real Decreto 1083/2001, de 5 de Octubre, Norma de Calidad para el jamón ibérico, paleta ibérica y caña de lomo ibérico elaborados en España.
Bligh, E. G., & Dyer, WJ. (1959). A rapid method of total lipid extraction and purification. Canadian Journal of Biochemical Physiology, 37, 911–917.
Bradford, M. (1976). A rapid and sensitive method for the quantification of microgram quantities of protein utilizing the principle of protein-dye binding. Analytical Biochemistry, 72: 248-254.
79

Chapter II. Fatty acid composition and adipogenic activity
Cava, R., Ruíz, J., Ventanas, J., & Antequera, T. (1999). Oxidative and lipolytic changes during ripening of Iberian hams as affected by feeding regime: extensive feeding and alpha-tocopheryl acetate supplementation. Meat Science, 52, 2, 165-172.
Cilla, I., Altarriba, J., Guerrero, L., Gispert, M., Martínez, L., Moreno, C., Beltrán, J.A., Guàrdia, M.D., Diestre, A., Arnau, J., & Roncalés, P. (2006). Effect of different Duroc line sires on carcass composition, meat quality and dry-cured ham acceptability. Meat Science, 72, 2, 252-260.
Dobao, M. T., Garcı́a, J. L., De Pedro, E., Rodrigáñez, J., & Silió, L. (1986). Efectos del ejercicio y tipos de cebo sobre las características de canal de cerdos Ibéricos. In Proceedings 9th Congress International Pig Veterinary Society (406–420), Barcelona, Spain.
Eguinoa, P., Brocklehurst, S., Aranal, A., Mendizabal, J. A., Vernon, R.G., & Purroy, A. (2003). Lipogenic enzyme activities in different adipose depots of Pirenaican and Holstein bulls and heifers taking into account adipocyte size. Journal of Animal Science, 81, 432–440.
Estévez, M., Morcuende, D., & Cava, R. (2003) Physico-chemical characteristics of M. Longissimus dorsi from three lines of free-range reared Iberian pigs slaughtered at 90 kg live-weight and commercial pigs: a comparative study. Meat Science, 64 (4) 499-506
Gandemer, G. (2002). Lipids in muscles and adipose tissues, changes during processing and sensory properties of meat products. Meat Science, 62, 309-321.
Girard, J.P., Bucharles, C., Berdague, J.L., Ramihone, M. (1989). Einfluss ungesattigter Fette auf Abtrocknungs un Fermentationsvorgange von Rohwursten. Fleischwirtsch. 69, 255-260.
Gondret, F., Lefaucheur, L., Louveau, I., Lebret, B., Pichodo, X. & Le Cozler, Y. (2005). Influence of piglet birth weight on postnatal growth performance, tissue lipogenic capacity and muscle histological traits at market weight. Livestock Production Science, 93, (2) 15, 137-146.
Karlsson, A., Enfält, A.C., Essén-Gustavsson, B., Lundström, K., Rydhmer, L., & Stern, S. (1993). Muscle histochemical and biochemical properties in relation to meat quality during selection for increased lean tissue growth rate in pigs, Journal of Animal Science, 71, 930–938.
Kouba, M., & Mourot, J. (1999). Effect of a high linoleic acid diet on lipogenic enzyme activities and on the composition of the lipid fraction of fat and lean tissues in the pig. Meat Science, 52, (1), 39-45.
Leseigneur-Meynier, A. & Gandemer, G. (1991) Lipid composition of pork muscle in relation to the metabolic type of the fibres. Meat Science, 29 (3) 229-241.
Lonergan, S. M., Huff-Lonergan, E., Rowe, L.J., Kuhlers, D. L., & Jungst, S.B. (2001). Selection for lean growth efficiency in Duroc pigs influences pork quality. Journal of Animal Science. 79, 2075-2085
López-Bote, C.J. (1998). Sustained utilisation of the iberian pig breed. In Proceedings of the 44th
ICOMST. Barcelona, August 30th-September 4th, L2, 14-21.
Martinez-Puig, D., Mourot, J., Ferchaud-Roucher, V., Anguita, M., Garcia, F., Krempf, M.& Pérez, J.F. (2006) Consumption of resistant starch decreases lipogenesis in adipose tissues but not in muscular tissues of growing pigs. Livestock Science, 99 (2-3), 237-247.
McLaren, D.G., Buchanan, D.S., & Johnson, R.K. (1987). Individual heterosis and breed effects for postweaning performance and carcass traits in four breeds of swine. Journal of Animal Science, 64, 83-98.
Monin, G., Hortós, M., Díaz, I., Rock, E., & Garcia-Regueiro, J. A. (2003). Lipolysis and lipid oxidation during chilled storage of meat from Large White and Pietrain pigs. Meat Science, 64, 7–12.
Morales, J., Pérez, J. F., Baucells, M. D., Mourot, J., & Gasa, J. (2002). Comparative digestibility and lipogenic activity in Landrace and Iberian finishing pigs fed ad libitum corn- and corn–sorghum–acorn-based diets. Livestock Production Science, 77 (2-3), 195-205.
Morcuende, D., Estévez, M., Ramírez, M.R., de Alba, C., & Cava, R. (2003). Efecto de la línea materna y paterna en el cruce ibérico x duroc sobre los parámetros productivos y calidad de carne del pernil fresco. II World Congress of Dry Cured Ham. Cáceres. España.
Morcuende, D., Estévez, M., Ramírez, R., & Cava, R. (in press). Effect of the Iberian x Duroc reciprocal cross on productive parameters, meat quality and lipogenic enzyme activities. Meat Science
Morrissey, P.A., Sheehy, P.J.A., Galvin, K., Kerry, J.P, & Buckley, D.J. (1998). Lipid stability in meat and meat products. Meat Science, 49, (1), S73-S86
Mourot, J., & Kouba, M. (1998). Lipogenic enzyme activities in muscles of growing Large White and Meishan pigs. Livestock Production Science, 55, 127–133
Mourot, J., Kouba, M, & Bonneau, M. (1996). Comparative study of in vitro lipogenesis in various adipose tissues in the growing Meishan pig: comparison with the Large White pig (Sus domesticus). Comp. Biochemical Physilogy. 115B, Nº3, 383-388.
O’Hea, E.K., & Leveille, G.A. (1969) Significance of adipose tissue and liver as sites of fatty acid synthesis in the pig and the efficiency of utilization of various substrates for lipogenesis. Journal Nutr, 99, 338-344.
Ramírez, R., & Cava, R. (2006). Carcass composition and meat quality of 3 different Iberian x Duroc genotype pigs. doi:10.1016/j.meatsci.2006.08.003
Ruíz-Carrascal, J., Ventanas, J., Cava, R., Andrés, A.I., & García, C. (2000). Texture and appearance of dry cured ham as affected by fat content and fatty acid composition. Food Research international, 33, 91-95.
Sierra Alfranca, I. (1992). Intensificación reproductiva en el cerdo ibérico. Sistemas genéticos y de manejo. Anaporc, 115, 46-50.
Simopoulos , A.P. (2003). Importance of the ratio of omega-6/omega-3 essential fatty acids:
80

Chapter II. Fatty acid composition and adipogenic activity
evolutionary aspects, Omega-6/omega-3 essential fatty acid ratio. The scientific evidence, A.P. Simopoulos and K.A. Cleland, Basel, Karger. Vol. 92, 1-22.
Spina, J., Bright, H.J., & Rosenbloom, J. (1970). Purification and properties of L-Malic Enzyme from Escherichia coli. Biochemistry, 9 (19), 3794-3801.
SPSS (2003) Inc. SPSS 12.0 for Windows SPSS Inc. Chicago.
Steffen, D.G., Brown, L.J., & Mersmann, H.J. (1978). Ontogenic development of swine (Sus domesticus) adipose tissue lipases. Comp. Biochem. Physil. 59B, 195-201.
Wise, E., & Ball, E.G. (1964). Malic enzyme and lipogenesis. Proceedings of the National Academic of the Science of the United State of America, 52, 1255-1263.
Wood, J.D., Richardson, R.I, Nute, G.R., Fisher, A.V., Campo, M.M., Kasapidou, E., Sheard, P.R., & Enser, M. (2003). Effects of fatty acids on meat quality: a review. Meat Science, 66 21–32
Young, J. W., Sharago, E., & Lardy, H.A. (1964). Metabolic control of enzymes involved in lipogenesis and gluconeogenesis. Biochemistry, 3, 1687-1692.
81


Chapter III


Chapter III. Colour changes and oxidative stability during storage
THE CROSSBREEDING OF DIFFERENT DUROC LINES WITH IBERIAN PIG AFFECTS COLOR AND OXIDATIVE STABILITY OF MEAT DURING STORAGE1
ABSTRACT
Colour and oxidative stability of Longissimus dorsi (LD) and Biceps femoris (BF) muscles from 3 different Iberian x Duroc genotypes (GEN1: ♂ Iberian x ♀ Duroc1, GEN2: ♂ Duroc1 x ♀ Iberian; GEN3: ♂ Duroc2 x ♀ Iberian) were analysed during 10 days of refrigerated storage. GEN1 and GEN2 are reciprocal crosses, while the difference between GEN2 and GEN3 is the Duroc sire line. The genotype Duroc1 was selected for the manufacture of dry-cured meat products while the genotype Duroc2 was selected for meat production. BF showed more intense colour and oxidative changes during storage than LD, which is in accordance with their different metabolic pattern, since BF is an intermediate oxidative muscle whereas LD is a glycolitic one. Important differences were found between crosses due to the genotype of the Duroc sire line; however, reciprocal crosses (GEN1 and GEN2) showed a similar pattern. The lowest post-mortem pH of GEN3 could be a deciding factor of the oxidative and colour stability during storage as GEN3 had higher drip and cook loss as well as higher susceptibility to iron ascorbate-induced oxidation. In addition, chops from GEN3 were paler (lower L*) and showed a higher discolouration (higher decrease of a*) besides higher lipid (TBA-RS) and protein oxidation (carbonyl content) after the storage.
Keywords: crossbreeding, Duroc, Iberian, colour, pH, TBA-RS, protein oxidation, storage.
1.- INTRODUCTION Meat colour is the main factor which affects the acceptability at the time of consumer purchase
(Faustman & Cassens 1989). Meat discolouration is closely connected with the development of
oxidation processes (Faustman & Cassens, 1990). Lipid oxidation reduces the shelf-life of meat,
decreasing nutritive and sensory quality of meat (Gray & Crackel, 1992). Changes associated with
lipid oxidation include the development of unpleasant tastes and odours, as well as changes in
colour, rheological properties, solubility and potential formation of toxic compounds (Baron &
Andersen, 2002). On the other hand, several authors have evaluated protein oxidation by carbonyl
measurements (Mercier, Gatellier, Viau, Remignon & Renerre, 1998; Mercier, Gatellier & Renerre,
2004; Ventanas, Estevez, Tejeda & Ruiz, 2006). Protein oxidation reduces the quality of meat and
meat products promoting protein fragmentation or aggregation and a decrease in protein solubility
(Decker, Xiong, Calvert, Crum & Blanchart, 1993). Moreover, some studies (Juncher et al., 2001)
have reported on final pH as one the most important parameters to explain the differences in colour,
lipid oxidation and drip loss during chill storage of pork. The meat industry has great interest in
optimizing the water holding capacity, limiting loss of fluids (drip loss) during slaughter and
subsequent manipulations as it implies a financial loss (Maribo, Olsen, Barton-Gade, Møller &
Karlsson, 1998). It is widely recognized that one of the major causes of the development of poor
quality meat in pigs is the susceptibility to stress which is associated with the pig genotype, i.e. pigs
carrying one or two copies of the Halothane gene although have increased lean content, they are
more likely to produce pale, soft, and exudative (PSE) meat which has poor sensory quality
characteristics and excessive drip loss.
1 Ramírez, M.R. & Cava, R. (2006). The crossbreeding of different Duroc lines with Iberian pig affects color and oxidative stability of meat during storage. Submitted for publication to Meat Science
85
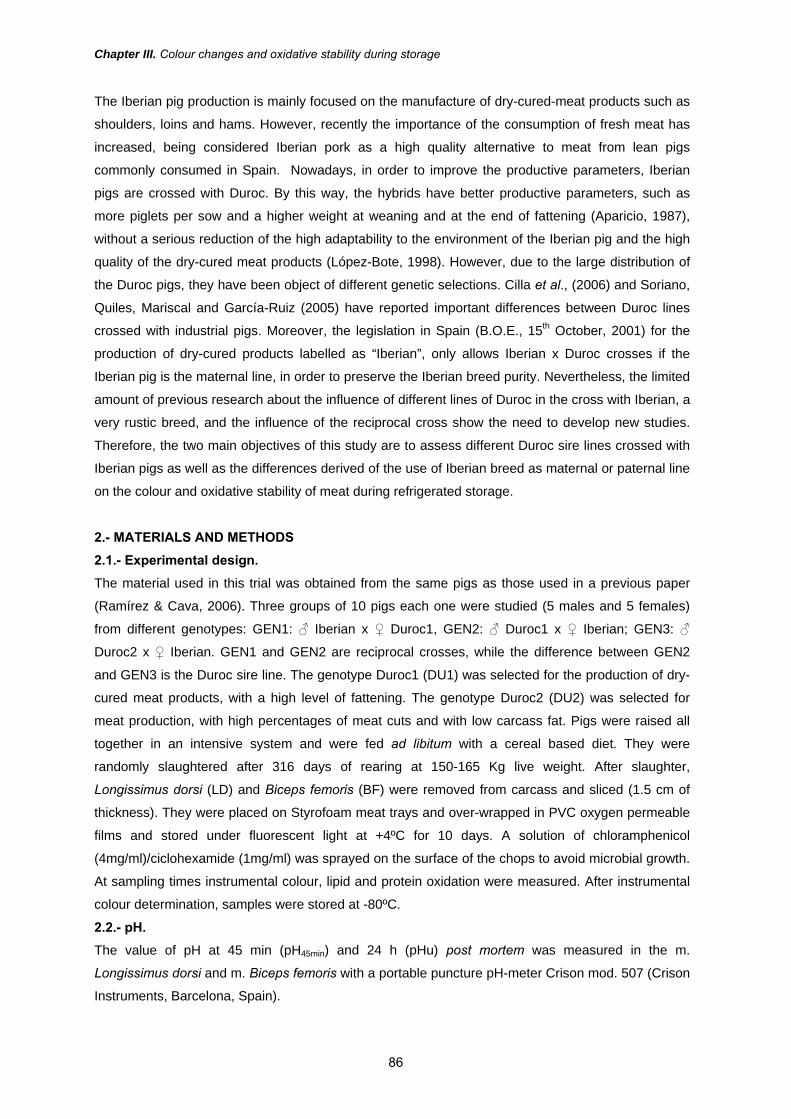
Chapter III. Colour changes and oxidative stability during storage
The Iberian pig production is mainly focused on the manufacture of dry-cured-meat products such as
shoulders, loins and hams. However, recently the importance of the consumption of fresh meat has
increased, being considered Iberian pork as a high quality alternative to meat from lean pigs
commonly consumed in Spain. Nowadays, in order to improve the productive parameters, Iberian
pigs are crossed with Duroc. By this way, the hybrids have better productive parameters, such as
more piglets per sow and a higher weight at weaning and at the end of fattening (Aparicio, 1987),
without a serious reduction of the high adaptability to the environment of the Iberian pig and the high
quality of the dry-cured meat products (López-Bote, 1998). However, due to the large distribution of
the Duroc pigs, they have been object of different genetic selections. Cilla et al., (2006) and Soriano,
Quiles, Mariscal and García-Ruiz (2005) have reported important differences between Duroc lines
crossed with industrial pigs. Moreover, the legislation in Spain (B.O.E., 15th October, 2001) for the
production of dry-cured products labelled as “Iberian”, only allows Iberian x Duroc crosses if the
Iberian pig is the maternal line, in order to preserve the Iberian breed purity. Nevertheless, the limited
amount of previous research about the influence of different lines of Duroc in the cross with Iberian, a
very rustic breed, and the influence of the reciprocal cross show the need to develop new studies.
Therefore, the two main objectives of this study are to assess different Duroc sire lines crossed with
Iberian pigs as well as the differences derived of the use of Iberian breed as maternal or paternal line
on the colour and oxidative stability of meat during refrigerated storage.
2.- MATERIALS AND METHODS
2.1.- Experimental design. The material used in this trial was obtained from the same pigs as those used in a previous paper
(Ramírez & Cava, 2006). Three groups of 10 pigs each one were studied (5 males and 5 females)
from different genotypes: GEN1: ♂ Iberian x ♀ Duroc1, GEN2: ♂ Duroc1 x ♀ Iberian; GEN3: ♂
Duroc2 x ♀ Iberian. GEN1 and GEN2 are reciprocal crosses, while the difference between GEN2
and GEN3 is the Duroc sire line. The genotype Duroc1 (DU1) was selected for the production of dry-
cured meat products, with a high level of fattening. The genotype Duroc2 (DU2) was selected for
meat production, with high percentages of meat cuts and with low carcass fat. Pigs were raised all
together in an intensive system and were fed ad libitum with a cereal based diet. They were
randomly slaughtered after 316 days of rearing at 150-165 Kg live weight. After slaughter,
Longissimus dorsi (LD) and Biceps femoris (BF) were removed from carcass and sliced (1.5 cm of
thickness). They were placed on Styrofoam meat trays and over-wrapped in PVC oxygen permeable
films and stored under fluorescent light at +4ºC for 10 days. A solution of chloramphenicol
(4mg/ml)/ciclohexamide (1mg/ml) was sprayed on the surface of the chops to avoid microbial growth.
At sampling times instrumental colour, lipid and protein oxidation were measured. After instrumental
colour determination, samples were stored at -80ºC.
2.2.- pH. The value of pH at 45 min (pH45min) and 24 h (pHu) post mortem was measured in the m.
Longissimus dorsi and m. Biceps femoris with a portable puncture pH-meter Crison mod. 507 (Crison
Instruments, Barcelona, Spain).
86

Chapter III. Colour changes and oxidative stability during storage
2.3.- Iron-ascorbate induced oxidation. The susceptibility of muscle tissue homogenates to iron ascorbate-induced lipid oxidation was
determined by the method of Kornbrust and Mavis (1980). Homogenates were incubated at 37ºC in
40nM tris-maleate buffer (pH 7.4) with 1mM FeSO4 and 2mM ascorbic acid in a total volume of 10 ml.
At fixed time intervals (0, 50, 100 and 200 min), aliquots were taken for the measurement of 2-
thiobarbituric acid-reactive substances (TBA-RS) by the method of Buege and Aust (1978). TBA-RS
were expressed as nmol malondialdehyde (MDA)/mg protein. Protein content was measured in
muscle homogenates following the Lowry method (Lowry, Rosebrough, Farr, & Randall, 1951).
2.4.- Drip and cook loss. Drip loss was measured following the method of Honikel (1998). The samples were weighed and
suspended in two plastic bags, the inner bag perforated, and the exudate was collected in the outer
bag. Meat was stored for 10 days at refrigerated storage (4ºC). Drip loss (%) was calculated by
difference in weight between day 0 and day 10 of storage. For cook loss (%), each chop was placed
in a plastic bag and cooked by immersion at 80ºC for 60 min. The difference of weight before and
after cooking was used to calculate cook loss percentage. 2.5.- Instrumental colour. Colour parameters were determined with a Minolta CR-300 colorimeter (Minolta Camera Co., Osaka,
Japan) with illuminant D65, a 0º viewing angle and a 2.5 cm port/viewing area. Before use, the
colorimeter was standardized with a white tile (mod CR-A43). The following colour coordinates were
determined: lightness (L*), redness (a*, red±green) and yellowness (b*, yellow±blue). In addition, hue
angle [hº = tan-1(b*/a*) (360/2π)] and saturation index or Chroma [C* = (a*2+b*2)0.5] were calculated.
The measurement was repeated at five randomly selected locations on each chop and averaged.
2.6.- Lipid oxidation. Lipid oxidation was assessed in duplicate by the 2-thiobarbituric acid (TBA) method of Salih, Smith,
Price and Dawson (1987) in 2g of meat. TBA-RS values were calculated from a standard curve of
TEP (1,1,3,3-tetraethoxypropane) and expressed as mg malondialdehyde/kg meat.
2.7.- Protein oxidation. Protein oxidation was measured by estimation of carbonyl groups formed during incubation with 2,4-
dinitrophenylhydrazine (DNPH) in 2N HCl following the method described by Oliver, Ahn, Moerman,
Goldstein and Stadtman (1987). Carbonyl concentration was measured on the treated sample by
measuring DNPH incorporated on the basis of absorption of 21.0 mM−1 cm−1 at 370 nm for protein
hydrazones. Results were expressed as nmol of DNPH fixed per milligram of protein. Protein
oxidation was expressed as nmol carbonyls/mg protein. Protein concentration was calculated by
spectrophotometry at 280 nm using bovine serum albumin (BSA) as standard.
2.8.- Statistical analysis. The effects of genotype and sex were analysed by the Analysis of Variance procedure of SPSS,
version 12.0 (SPSS, 2003). A two-way analysis of the variance (genotype and sex) with interaction
(genotype x sex) was carried out. Means were used to compare differences. HSD Tukey’s test was
used to compare the mean values of the genotypes. Mean values and standard errors of the means
(SEM) are reported. The relationships between traits were analysed using Pearson’s correlation.
87
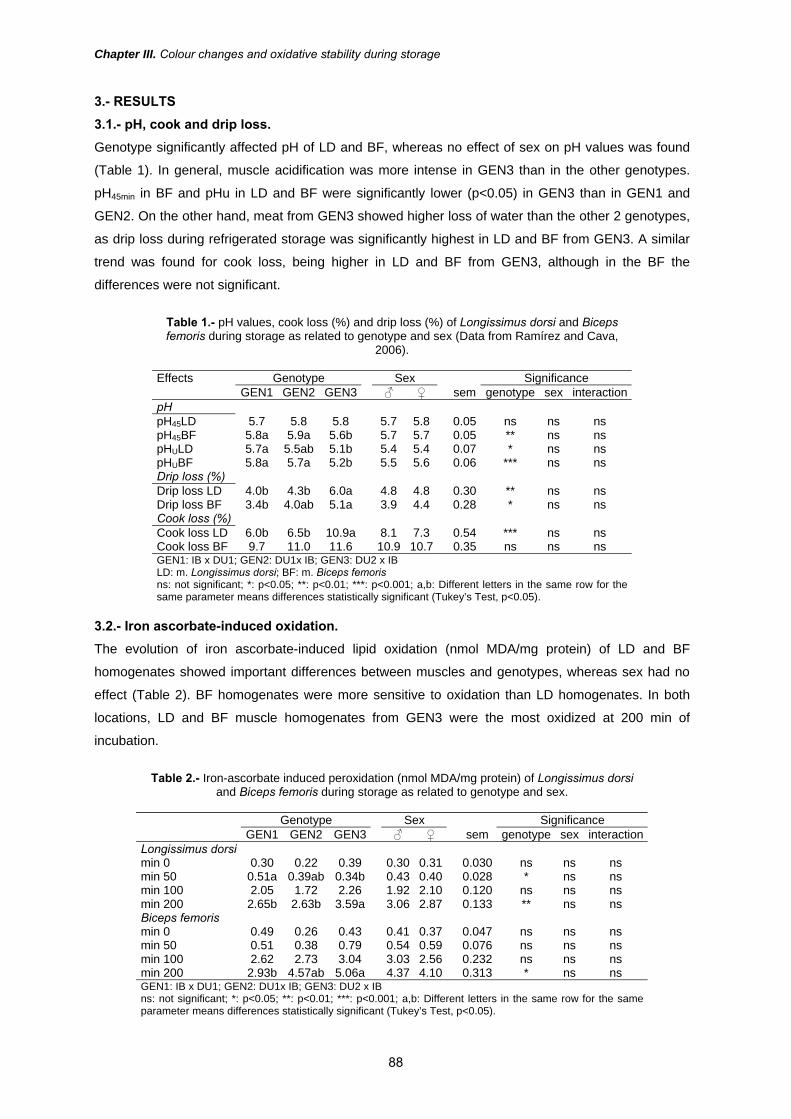
Chapter III. Colour changes and oxidative stability during storage
3.- RESULTS 3.1.- pH, cook and drip loss. Genotype significantly affected pH of LD and BF, whereas no effect of sex on pH values was found
(Table 1). In general, muscle acidification was more intense in GEN3 than in the other genotypes.
pH45min in BF and pHu in LD and BF were significantly lower (p<0.05) in GEN3 than in GEN1 and
GEN2. On the other hand, meat from GEN3 showed higher loss of water than the other 2 genotypes,
as drip loss during refrigerated storage was significantly highest in LD and BF from GEN3. A similar
trend was found for cook loss, being higher in LD and BF from GEN3, although in the BF the
differences were not significant.
Table 1.- pH values, cook loss (%) and drip loss (%) of Longissimus dorsi and Biceps femoris during storage as related to genotype and sex (Data from Ramírez and Cava,
2006).
Effects Genotype Sex Significance GEN1 GEN2 GEN3 ♂ ♀ sem genotype sex interaction pH pH45LD 5.7 5.8 5.8 5.7 5.8 0.05 ns ns ns pH45BF 5.8a 5.9a 5.6b 5.7 5.7 0.05 ** ns ns pHULD 5.7a 5.5ab 5.1b 5.4 5.4 0.07 * ns ns pHUBF 5.8a 5.7a 5.2b 5.5 5.6 0.06 *** ns ns Drip loss (%) Drip loss LD 4.0b 4.3b 6.0a 4.8 4.8 0.30 ** ns ns Drip loss BF 3.4b 4.0ab 5.1a 3.9 4.4 0.28 * ns ns Cook loss (%) Cook loss LD 6.0b 6.5b 10.9a 8.1 7.3 0.54 *** ns ns Cook loss BF 9.7 11.0 11.6 10.9 10.7 0.35 ns ns ns GEN1: IB x DU1; GEN2: DU1x IB; GEN3: DU2 x IB LD: m. Longissimus dorsi; BF: m. Biceps femoris ns: not significant; *: p<0.05; **: p<0.01; ***: p<0.001; a,b: Different letters in the same row for the same parameter means differences statistically significant (Tukey’s Test, p<0.05).
3.2.- Iron ascorbate-induced oxidation. The evolution of iron ascorbate-induced lipid oxidation (nmol MDA/mg protein) of LD and BF
homogenates showed important differences between muscles and genotypes, whereas sex had no
effect (Table 2). BF homogenates were more sensitive to oxidation than LD homogenates. In both
locations, LD and BF muscle homogenates from GEN3 were the most oxidized at 200 min of
incubation.
Table 2.- Iron-ascorbate induced peroxidation (nmol MDA/mg protein) of Longissimus dorsi
and Biceps femoris during storage as related to genotype and sex.
Genotype Sex Significance GEN1 GEN2 GEN3 ♂ ♀ sem genotype sex interaction Longissimus dorsi min 0 0.30 0.22 0.39 0.30 0.31 0.030 ns ns ns min 50 0.51a 0.39ab 0.34b 0.43 0.40 0.028 * ns ns min 100 2.05 1.72 2.26 1.92 2.10 0.120 ns ns ns min 200 2.65b 2.63b 3.59a 3.06 2.87 0.133 ** ns ns Biceps femoris min 0 0.49 0.26 0.43 0.41 0.37 0.047 ns ns ns min 50 0.51 0.38 0.79 0.54 0.59 0.076 ns ns ns min 100 2.62 2.73 3.04 3.03 2.56 0.232 ns ns ns min 200 2.93b 4.57ab 5.06a 4.37 4.10 0.313 * ns ns GEN1: IB x DU1; GEN2: DU1x IB; GEN3: DU2 x IB ns: not significant; *: p<0.05; **: p<0.01; ***: p<0.001; a,b: Different letters in the same row for the same parameter means differences statistically significant (Tukey’s Test, p<0.05).
88

Chapter III. Colour changes and oxidative stability during storage
3.3.- Evolution of colour during refrigerated storage. Marked differences in the evolution of the colour parameters were found between muscles during
refrigerated storage, being these changes more intense in BF chops than in those from LD (Tables 3
and 4, respectively). In general, CIE L*-value decreased during the refrigerated storage in LD chops,
increasing its darkness, while CIE L*-value increased in BF, being those chops paler at the end of
storage. Redness (CIE a*-value) tended to decrease with the storage while yellowness (CIE b*-
value) followed an opposite trend, increasing throughout the storage. Chroma (CIE C*-value) did not
change significantly, while hue (CIE hº-value) increased during the storage.
Table 3.- Evolution of instrumental colour parameters of Longissimus dorsi during storage as related
to genotype and sex.
Genotype Sex Significance GEN1 GEN2 GEN3 ♂ ♀ sem genotype sex interactionLightness (CIE L*-value) Day 0 48.9b 53.1a 52.7a 51.8 51.6 0.52 *** ns ns Day 1 49.8b 53.7a 53.8a 52.4 52.7 0.57 ** ns ns Day 3 48.2b 52.8a 53.6a 51.7 51.6 0.56 *** ns ns Day 5 48.1b 52.3a 52.3a 50.9 51.1 0.61 ** ns ns Day 7 47.6b 51.6a 50.5a 49.4 50.5 0.59 ** ns ns Day 10 46.5b 50.3a 49.3ab 48.0 49.6 0.59 ** ns ns Redness (CIE a*-value) Day 0 10.2 10.0 9.9 9.9 10.2 0.26 ns ns ns Day 1 10.3 10.4 10.1 10.2 10.4 0.20 ns ns ns Day 3 10.2 9.9 10.3 10.0 10.3 0.24 ns ns ns Day 5 10.2 9.6 9.7 10.1 9.7 0.26 ns ns ns Day 7 10.1 9.6 9.9 9.7 10.0 0.29 ns ns ns Day 10 10.1 8.9 9.7 9.9 9.8 0.49 ns ns ns Yellowness (CIE b*-value) Day 0 4.3 4.9 5.0 4.7 4.8 0.17 ns ns ns Day 1 6.2b 7.4a 7.3ab 6.9 7.1 0.19 * ns ns Day 3 6.6 7.3 7.6 6.9 7.4 0.19 ns ns ns Day 5 6.4 6.8 6.9 6.8 6.6 0.17 ns ns ns Day 7 7.0 7.1 7.3 7.1 7.1 0.18 ns ns ns Day 10 7.5 7.0 7.3 7.4 7.1 0.17 ns ns ns Chroma (CIE C*-value) Day 0 11.1 11.2 11.1 10.9 11.3 0.30 ns ns ns Day 1 12.0 12.8 12.5 12.3 12.6 0.26 ns ns ns Day 3 12.1 12.3 12.8 12.2 12.7 0.29 ns ns ns Day 5 12.0 11.8 11.9 11.9 11.9 0.27 ns ns ns Day 7 12.3 11.9 12.3 12.1 12.2 0.31 ns ns ns Day 10 12.6a 11.3b 12.1ab 12.1 12.2 0.29 * ns ns Hue (CIE hº-value) Day 0 22.7b 26.2a 26.8a 25.2 25.4 0.57 ** ns ns Day 1 31.1b 35.5a 35.6a 33.9 34.5 0.55 *** ns ns Day 3 32.6b 36.4a 36.5a 34.8 35.7 0.49 *** ns * Day 5 32.1b 35.3a 35.4a 34.0 34.4 0.35 *** ns ns Day 7 34.7b 36.5a 36.4a 35.4 36.1 0.46 *** ns ns Day 10 36.6b 38.2a 37.0a 37.7 37.9 0.49 *** ns ns GEN1: IB x DU1; GEN2: DU1x IB; GEN3: DU2 x IB ns: not significant; *: p<0.05; **: p<0.01; ***: p<0.001; a,b: Different letters in the same row for the same parameter means differences statistically significant (Tukey’s Test, p<0.05).
89

Chapter III. Colour changes and oxidative stability during storage
Sex had a significant effect on colour coordinates of BF chops. BF from females showed lower CIE
L* and hue values and higher CIE a* and Chroma values than those from males. As a result, at the
end of storage, BF chops from females were darker and redder and the colour was more intense
than those from males.
Table 4.- Evolution of instrumental colour parameters of Biceps femoris during storage as related to
genotype and sex.
Genotype Sex Significance GEN1 GEN2 GEN3 ♂ ♀ sem genotype sex interactionLightness (CIE L*-value) Day 0 41.9b 42.4b 46.8a 44.7 42.9 0.74 ** ns ns Day 1 43.9b 42.8b 47.1a 45.8 43.5 0.65 ** * ns Day 3 42.4b 42.7b 48.2a 45.6 43.5 0.73 *** ns ns Day 5 42.9b 42.6b 47.8a 46.0 43.1 0.87 * ns ns Day 7 46.0 44.5 49.1 48.0 45.2 0.80 * ns ns Day 10 46.5b 45.2b 51.7a 49.6 46.2 0.92 ** * ns Redness (CIE a*-value) Day 0 18.3 17.4 17.9 17.2 18.5 0.31 ns * ns Day 1 18.4 17.6 16.9 17.0 18.2 0.29 ns * * Day 3 17.3 17.4 15.9 16.0 17.6 0.34 ns * ns Day 5 16.0a 17.0a 13.6b 14.7 16.3 0.43 *** * ns Day 7 17.0a 17.4a 13.4b 14.7 17.0 0.55 *** ** ns Day 10 16.3a 16.2a 13.1b 14.2 16.1 0.51 ** * ns Yellowness (CIE b*-value) Day 0 6.2 6.1 7.2 6.7 6.4 0.23 ns ns ns Day 1 9.6 9.2 10.3 9.8 9.6 0.20 ns ns ns Day 3 9.4 9.5 10.6 9.9 9.8 0.21 * ns ns Day 5 8.8 9.3 9.5 9.2 9.1 0.17 ns ns ns Day 7 10.0 10.0 10.2 10.2 10.0 0.18 ns ns ns Day 10 9.8 9.7 10.8 10.4 9.9 0.26 ns ns ns Chroma (CIE C*-value) Day 0 19.3 18.5 19.3 18.5 19.6 0.34 ns ns ns Day 1 20.7 19.9 19.8 19.7 20.6 0.31 ns ns ns Day 3 19.7 19.8 19.1 18.9 20.1 0.31 ns * ns Day 5 18.2ab 19.3a 16.6b 17.4 18.7 0.38 ** * ns Day 7 19.7a 20.1a 17.0b 18.0 19.8 0.31 ** * ns Day 10 19.1a 19.0a 17.2b 17.7 19.0 0.37 * ns ns Hue (CIE hº-value) Day 0 18.9 19.4 21.8 21.1 19.1 0.56 ns ns ns Day 1 27.6b 27.6b 31.3a 30.1 27.8 0.49 *** ** ns Day 3 28.8b 28.8b 33.8a 31.8 29.3 0.72 *** * ns Day 5 29.0b 28.8b 35.1a 32.6 29.5 0.88 *** * ns Day 7 30.8b 30.1b 37.8a 35.2 30.9 0.66 ** * ns Day 10 31.4b 31.1b 39.9a 36.6 32.0 1.41 ** ns ns GEN1: IB x DU1; GEN2: DU1x IB; GEN3: DU2 x IB ns: not significant; *: p<0.05; **: p<0.01; ***: p<0.001; a,b: Different letters in the same row for the same parameter means differences statistically significant (Tukey’s Test, p<0.05).
Genotype had an important effect on colour changes of LD and BF during the storage, thus, meat
from GEN3 showed lower colour stability than meat from GEN1 and GEN2. In this respect, after 10
days of storage, LD from GEN2 and GEN3 and BF from GEN3 were paler than those from the other
genotypes, as reflected their higher CIE L*-values. Similarly, BF chops from GEN3 showed lower CIE
90

Chapter III. Colour changes and oxidative stability during storage
a*-values than GEN1 and GEN2 at day 5, 7 and 10 of storage, which indicate a greater
discolouration of GEN3 and a redder colour in muscles from GEN1 and GEN2. However, in LD
chops no differences in CIE a*-value were found between genotypes. Chroma and especially hue
were also affected by genotype. Chroma was significantly highest in LD chops from GEN1 at day 10
and in BF chops from GEN1and GEN2 at day 7 and day 10. In contrast, LD chops from GEN1 and
BF chops from GEN1 and GEN2 had the lowest hue values all the days of storage analysed.
3.4.- Evolution of protein and lipid oxidation during refrigerated storage. In general, BF was more affected by protein and lipid oxidation than LD (Table 5). Regarding protein
oxidation, the genotype significantly affected the accumulation of carbonyls in LD and BF during
storage. At days 0 and 10 of refrigerated storage, LD and BF from GEN3 showed higher protein
oxidation than those from GEN1 and GEN2, although these differences were only statistically
significant in BF at day 10.
Concerning lipid oxidation, both muscles increased TBA-RS values during storage. LD showed
significant differences due to the genotype at day 0, but not during the rest of the storage.
Nevertheless, BF was significantly affected by the genotype throughout the storage. BF from GEN3
showed significant higher TBA-RS values than those from GEN1 and GEN2, being the increase in
TBA-RS twice higher in GEN3 than in GEN1 and GEN2 at the end of storage (ΔTBA-RSd0-d10 GEN1:
0.22, GEN2: 0.17 and GEN3: 0.47 mg MDA/kg).
Table 5.- Lipid (mg MDA/kg sample) and protein oxidation (nmol carbonyls/mg protein) of
Longissimus dorsi and Biceps femoris during storage as related to genotype and sex.
Genotype Sex Significance GEN1 GEN2 GEN3 ♂ ♀ sem genotype sex interactionPROTEIN OXIDATION1 Longissimus dorsi Day 0 2.33 2.42 2.75 2.79 2.27 0.15 ns ns ns Day 10 2.59 2.76 2.86 2.65 2.84 0.22 ns ns ns Biceps femoris Day 0 2.12 3.14 3.02 2.48 3.06 0.18 ns ns ns Day 10 2.56b 4.57b 9.53a 6.17 5.18 0.88 ** ns ns LIPID OXIDATION2 Longissimus dorsi Day 0 0.05b 0.07ab 0.08a 0.07 0.07 0.004 * ns ns Day 3 0.09 0.09 0.08 0.09 0.09 0.003 ns ns ns Day 5 0.08 0.09 0.08 0.08 0.09 0.003 ns ns ns Day 7 0.11 0.10 0.11 0.11 0.10 0.004 ns ns ns Day 10 0.14 0.17 0.17 0.16 0.16 0.011 ns ns ns Biceps femoris Day 0 0.09ab 0.08b 0.10a 0.09 0.09 0.003 * ns ns Day 3 0.13b 0.10b 0.20a 0.16 0.13 0.012 *** ns ns Day 5 0.17b 0.13b 0.27a 0.20 0.18 0.019 ** ns ns Day 7 0.17b 0.15b 0.37a 0.25 0.22 0.033 ** ns ns Day 10 0.31ab 0.25b 0.57a 0.43 0.33 0.056 * ns ns GEN1: IB x DU1; GEN2: DU1 x IB; GEN3: DU2 x IB 1 nmol carbonyls/mg protein 2 mg MDA/kg sample. ns: not significant; *: p<0.05; **: p<0.01; ***: p<0.001; a,b: Different letters in the same row for the same parameter means differences statistically significant (Tukey’s Test, p<0.05).
91

Chapter III. Colour changes and oxidative stability during storage
4.- DISCUSSION The low values of pH45min and pHu in muscles from GEN3 could explain the higher release of water
during cooking or storage of meat from this genotype. The rate of post-mortem pH decline and the
ultimate pH (pHu) determine the paleness as well as the water holding capacity of meat, measured in
our study as drip and cook loss. This fact is supported by the negative correlations between pHu and
drip (r = -0.539; p<0.001) and cook loss (r = -0.480; p<0.001) (Table 6). Thus, a higher rate of pH
decline and low pHu favour a paler meat with a low water holding capacity (Juncher et al., 2001) as
has been found in GEN3, which could reduce the quality of the meat from this genotype.
Iron-induced lipid peroxidation (I-ILP) assays showed that muscle homogenates from GEN3 were
more sensitive to oxidative stress compared with those from GEN1 and GEN2, and therefore, an
enhanced lipid oxidation during storage would be expected. In this respect, a significant positive
correlation was found between I-ILPmin200 values and TBA-RS values (r = +0.454, p<0.001) at day 10
of storage (Table 6).
The evolution of colour during the refrigerated storage showed changes in colour coordinates of BF
and LD consistent with those reported by Juncher et al., (2001), Brewer, Shu, Bidner, Meisinger and
McKeith (2001), Lindahl, Lundström and Tornberg (2001), Rosenvold and Andersen (2003), and
Hansen, Juncher, Henckel, Karlsson, Bertelsen and Skibsted (2004) who found increases of
lightness (CIE L*-value) and yellowness (CIE b*-value) and decreases of redness (CIE a*-value)
during the storage of meat.
On the other hand, metabolic and compositional characteristics of muscles (lipid and PUFA content,
heme pigments, etc) related to the oxidative/glycolytic activity determine colour stability of meat
during storage (Brewer et al., 2001). The inside part of BF is a red muscle while the outside part is a
white muscle, whereas LD is a glycolytic muscle. This determines a higher myoglobin content in red
oxidative muscles than in white glycolytic ones, and consequently, a lower CIE L*-value and higher
CIE a*-value as well as a higher oxidative susceptibility. It has been widely reported (Cava, Estévez,
Ruiz & Morcuende, 2003; Morcuende, Estévez, Ruiz & Cava, 2003) that oxidative muscles are more
prone to oxidation reactions, as these muscles have more haem pigment and other prooxidants and
higher amounts of polyunsaturated fatty acids, which increase their susceptibility to lipid oxidation.
This agrees with the higher increases of lipid and protein oxidation values found in BF than in LD.
BF and LD from GEN3 were paler (higher CIE L*-value) than those from GEN1 and GEN2. Although
the evolution of CIE L*-values was opposite in LD and BF, the initial differences of CIE L*-value
remained unchanged at the end of the storage. Initial and ultimate differences of the lightness
between genotypes could be caused by the low post-mortem pH of muscles from GEN3 and its effect
on CIE L*-values and water release from raw muscle, measured as drip loss. Both factors may
contribute to increase the paleness of the muscles during storage, keeping the initial differences in
lightness and/or increasing reflectance due to an increase of the exudation of meat (Lindahl et al.,
2001; Juncher et al. 2001; Brewer et al., 2001). In addition, Lindahl, Heckel, Karlsson and Andersen
(2006) reported in pigs from different crossbreeds a significant increase of lightness in muscles as a
consequence of low pH values early post-mortem. In the last years, the intensive selection carried
out in some pig genotypes to improve the lean growth efficiency is associated with a decrease of
92

Chapter III. Colour changes and oxidative stability during storage
meat quality, increasing the problems of susceptibility to stress as well as the problems in the rigor
mortis, such as PSE meat.
Redness is related to myoglobin content and its chemical state in meat (reviewed by Mancini & Hunt,
2005). The oxidative state of muscle pigments has an important role on the colour of meat, so the
relative proportions of the three forms of myoglobin -Mb, MbO2, MetMb- determine a more red, brown
or grey colour of meat. The development of oxidation processes causes a discolouration of meat
during the storage. Therefore, a decrease of a* during the storage implies a reduction of
oxymyoglobin content, the main pigment responsible of the red colour of fresh meat. The higher
discolouration of BF from GEN3 and in a lesser extent in LD from GEN3 indicate a more intense
oxidation of myoglobin in this genotype, which is in agreement with the higher TBA-RS and carbonyls
accumulation in this genotype at the end of the storage. Several authors (Rosenvold & Andersen,
2003, Hansen et al., 2004) have found a close connection between lipid and pigment oxidation
(measured as the reduction of a*) due to the oxidation of myoglobin pigments of the meat (reviewed
by Baron & Andersen, 2002). Additionally, low ultimate pH values have been related not only to
higher paleness of meat, as was previously mentioned, but also to a more intense decrease of CIE
a*-value during the storage (Juncher et al., 2001; Huff-Lonergan & Lonergan, 2005) since the rate of
oxidation of oxymyoglobin to metmyoglobin is accelerated at low pH (Andersen, Bertelsen, &
Skibseted, 1988).
Changes in Chroma and hue are linked with changes in CIE a* and b*-values and those factors that
affect them. Consequently, after refrigerated storage LD and BF from GEN1 and GEN2 kept a redder
and a more intense colour (higher Chroma) that diverged less from the true red axis (lower hue) than
those from GEN3.
Genotype clearly affected the oxidative deterioration of proteins and the accumulation of carbonyls
during the storage. Very little is known about oxidative changes of proteins during storage and the
factors which regulate these processes in different types of meat and meat products (Mercier et al.,
1998; Mercier et al., 2004; Ventanas et al. 2006). However, it is well established that protein
carbonyls have their origin mainly in the reaction between aldehydes from lipid oxidation and protein
oxidation compounds. Consequences of protein oxidation on meat quality are not completely clear.
Several authors have measured protein oxidation in meat and meat products and have related this
parameter to lipid oxidation (i.e. Mercier et al., 1998, 2004; Ventanas et al, 2006). Although in the
present study a non-significant correlation was found between both parameters (r = +0.204; p>0.05)
it correlated significantly with I-ILP200 (r = +0.295; p<0.05) (Table 6). The marked increase of carbonyl
content in GEN3 muscles, especially in BF, could be caused by its low pHu, which agrees with the
negative correlation found between both parameters (r = -0.268, p<0.05).
The development of oxidation products reactive to TBA in pork during refrigerated storage is widely
referred in the bibliography since it is one of the primary mechanisms of quality deterioration in meat
products (reviewed by Gray, Gomaa, & Buckley, 1996). Similarly to protein oxidation, BF from GEN3
was the most susceptible to lipid oxidation during refrigerated storage and had the highest TBA-RS
values. As in protein oxidation, pHu negatively correlated with I-ILP200 (r = -0.616; p<0.001) as well
as with TBA-RSday10 (r = -0.275; p<0.05). The significant correlations found between pHu and most of
93
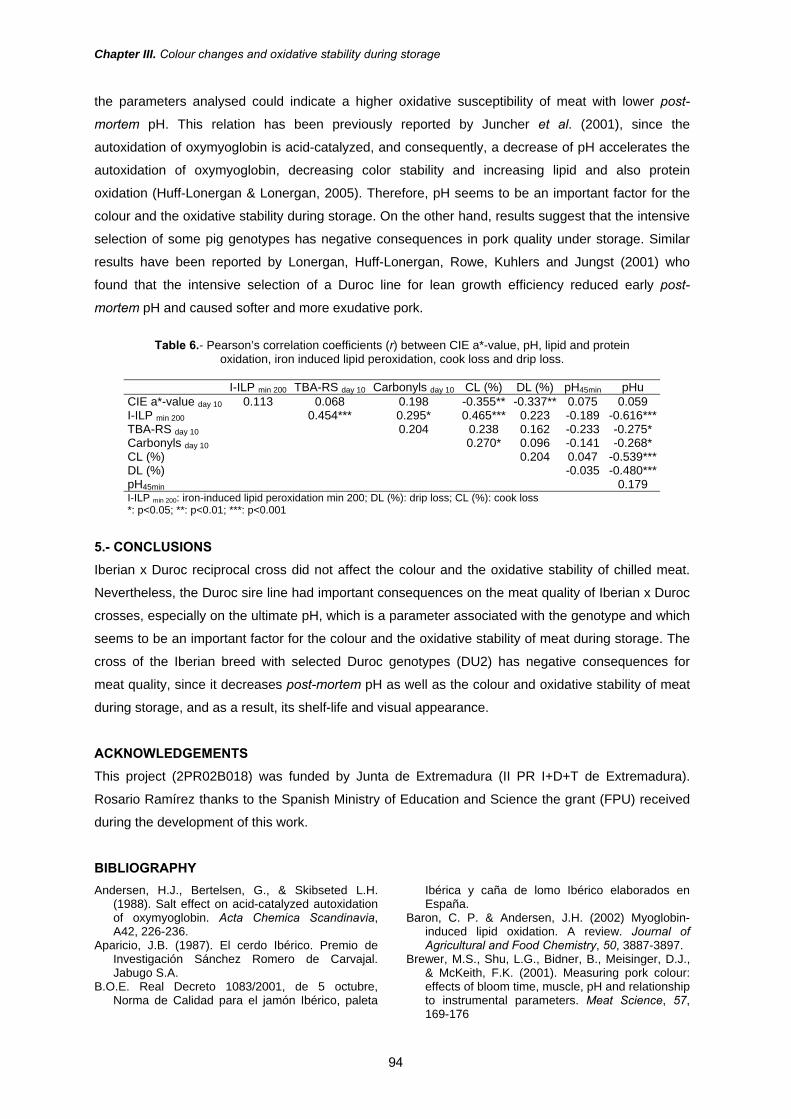
Chapter III. Colour changes and oxidative stability during storage
the parameters analysed could indicate a higher oxidative susceptibility of meat with lower post-
mortem pH. This relation has been previously reported by Juncher et al. (2001), since the
autoxidation of oxymyoglobin is acid-catalyzed, and consequently, a decrease of pH accelerates the
autoxidation of oxymyoglobin, decreasing color stability and increasing lipid and also protein
oxidation (Huff-Lonergan & Lonergan, 2005). Therefore, pH seems to be an important factor for the
colour and the oxidative stability during storage. On the other hand, results suggest that the intensive
selection of some pig genotypes has negative consequences in pork quality under storage. Similar
results have been reported by Lonergan, Huff-Lonergan, Rowe, Kuhlers and Jungst (2001) who
found that the intensive selection of a Duroc line for lean growth efficiency reduced early post-
mortem pH and caused softer and more exudative pork.
Table 6.- Pearson’s correlation coefficients (r) between CIE a*-value, pH, lipid and protein
oxidation, iron induced lipid peroxidation, cook loss and drip loss.
I-ILP min 200 TBA-RS day 10 Carbonyls day 10 CL (%) DL (%) pH45min pHu CIE a*-value day 10 0.113 0.068 0.198 -0.355** -0.337** 0.075 0.059 I-ILP min 200 0.454*** 0.295* 0.465*** 0.223 -0.189 -0.616***TBA-RS day 10 0.204 0.238 0.162 -0.233 -0.275* Carbonyls day 10 0.270* 0.096 -0.141 -0.268* CL (%) 0.204 0.047 -0.539***DL (%) -0.035 -0.480***pH45min 0.179 I-ILP min 200: iron-induced lipid peroxidation min 200; DL (%): drip loss; CL (%): cook loss *: p<0.05; **: p<0.01; ***: p<0.001
5.- CONCLUSIONS Iberian x Duroc reciprocal cross did not affect the colour and the oxidative stability of chilled meat.
Nevertheless, the Duroc sire line had important consequences on the meat quality of Iberian x Duroc
crosses, especially on the ultimate pH, which is a parameter associated with the genotype and which
seems to be an important factor for the colour and the oxidative stability of meat during storage. The
cross of the Iberian breed with selected Duroc genotypes (DU2) has negative consequences for
meat quality, since it decreases post-mortem pH as well as the colour and oxidative stability of meat
during storage, and as a result, its shelf-life and visual appearance.
ACKNOWLEDGEMENTS This project (2PR02B018) was funded by Junta de Extremadura (II PR I+D+T de Extremadura).
Rosario Ramírez thanks to the Spanish Ministry of Education and Science the grant (FPU) received
during the development of this work.
BIBLIOGRAPHY Andersen, H.J., Bertelsen, G., & Skibseted L.H.
(1988). Salt effect on acid-catalyzed autoxidation of oxymyoglobin. Acta Chemica Scandinavia, A42, 226-236.
Aparicio, J.B. (1987). El cerdo Ibérico. Premio de Investigación Sánchez Romero de Carvajal. Jabugo S.A.
B.O.E. Real Decreto 1083/2001, de 5 octubre, Norma de Calidad para el jamón Ibérico, paleta
Ibérica y caña de lomo Ibérico elaborados en España.
Baron, C. P. & Andersen, J.H. (2002) Myoglobin-induced lipid oxidation. A review. Journal of Agricultural and Food Chemistry, 50, 3887-3897.
Brewer, M.S., Shu, L.G., Bidner, B., Meisinger, D.J., & McKeith, F.K. (2001). Measuring pork colour: effects of bloom time, muscle, pH and relationship to instrumental parameters. Meat Science, 57, 169-176
94
Chapter III. Colour changes and oxidative stability during storage
Buege, J. A., & Aust, S. D. (1978). Microsomal lipid peroxidation. In S., Fleischer, & L., Packer. Methods in enzimology (Vol. 52, p. 302). NY: Academic Press
Cava, R., Estévez, M., Ruiz, J., & Morcuende, D. (2003). Physicochemical characteristics of three muscles from free-range reared Iberian pigs slaughtered at 90 kg live weight. Meat Science, 63, 533–541
Cilla, I., Altarriba, J., Guerrero, L., Gispert, M., Martínez, L., Moreno, C., Beltrán, J.A., Guàrdia, M.D., Diestre, A. Arnau, J., & Roncalés, P. (2006). Effect of different Duroc line sires on carcass composition, meat quality and dry-cured ham acceptability. Meat Science, 72, (2) 252-260.
Decker, E. A., Xiong, Y.L., Calvert, J.T., Crum, A.D. & Blanchart, S.P. (1993). Chemical, physical and functional properties of oxidized turkey white muscle myofibrillar proteins. Journal of Agricultural and Food Chemisty 41, 186–189.
Faustman, C. & Cassens, R.G. (1989). In Proc. 35th Int. Congress Meat Science Technology Copenhagen, Denmark, p. 446.
Faustman, C., & Cassens, R.G., 1990. The biochemical basis for discolouration in fresh meat: a review. Journal of Muscle Foods, 1, 217-243.
Gray, J.I., & Crackel, R.L. (1992). Oxidative flavor changes in meats: The origin and prevention. In The chemistry of muscle-based foods, eds. D.E. Jonhson M.K. Knight and D.A. Ledward. Royal Society of Chemistry, London 145-168.
Gray, J.I., Gomaa, E.A., & Buckley, D.J. (1996) Oxidative Quality and Shelf life of meats. Meat Science, 43, S, S111-123.
Hansen, E., Juncher, D., Henckel, P., Karlsson, A., Bertelsen, G., & Skibsted, L. H. (2004) Oxidative stability of chilled pork chops following long term freeze storage. Meat Science 68, 479–484.
Honikel, K.O. (1998) Reference methods for the assessment of physical characteristics of meat. Meat Science, 49 (4) 447-457
Huff-Lonergan, E., & Lonergan, S. M. (2005) Mechanisms of water-holding capacity of meat: The role of postmortem biochemical and structural changes. Meat Science, 71, (1), 194-204
Juncher, D., Ronn, B., Mortensen, E.T., Henckel, P., Karlsson A., Skibsted L.H.,& Bertelsen, G. (2001) Effect of pre-slaughter physiological conditions on the oxidative stability of colour and lipid during chill storage of pork. Meat Science 58, 347-357.
Kornbrust, D.J. & Mavis, R.D.(1980). Relative susceptibility of microsomes from lung, heart, liver, kidney, brain and testes to lipid peroxidation: correlation with vitamin E content. Lipids 15, pp. 315–322
Lindahl, G., Lundström, K. & Tornberg E. (2001) Contribution of pigment content, myoglobin forms and internal reflectance to the colour of pork loin and ham from pure breed pigs. Meat Science, 59 (2), 141-151
Lindahl, G., Heckel, P., Karlsson A.H. & Andersen, H.J. (2006). Significance of early postmortem temperature and pH decline on colour
characteristics of pork loin from different crossbreeds. Meat Science, 72, (4) 613-623
Lonergan, S. M., Huff-Lonergan, E., Rowe, L.J., Kuhlers, D. L., & Jungst, S.B. (2001) Selection for lean growth efficiency in Duroc pigs influences pork quality. Journal Animal Science.79, 2075-2085
López-Bote C.J. (1998). In Proceedings of the 44th ICOMST. Barcelona, August 30th-September 4th, L2, 14-21.
Lowry, O.H., Rosebrough, N.J., Farr, A.L. & Randall, R.J., 1951. Protein measurement with the Folin-phenol reagent. Journal of Biological Chemistry 193, 265–275L
Mancini, R.A. & Hunt M.C. (2005) Current research in meat color. Meat Science, 71, (1), 100-121
Maribo, H.; Olsen, E. V., Barton-Gade, P.; Møller, A. J.; Karlsson, A. (1998) Effect of Early Post-Mortem Cooling on Temperature, pH Fall and Meat Quality in Pigs. Meat Science, 59, 115-129.
Mercier, Y., Gatellier, P. & Renerre, M. (2004) Lipid and protein oxidation in vitro, and antioxidant potential in meat from Charolais cows finished on pasture or mixed diet Meat Science, 66, (2) 467-473
Mercier, Y., Gatellier, P., Viau, M., Remignon, H., & Renerre, M. (1998) Effect of dietary fat and vitamin E on colour stability and on lipid and protein oxidation in turkey meat during storage, Meat Science, 48, (3-4), 301-318
Morcuende, D., Estévez, M., Ruiz, J. & Cava, R. (2003) Oxidative and lipolytic deterioration of different muscles from free-range reared Iberian pigs under refrigerated storage. Meat Science, 65, (3), 1157-1164
Oliver, C.N., Ahn, B.W., Moerman, E.J., Goldstein, S., & Satadtman, E.R. (1987). Aged-related changes in oxidized proteins. Journal of Biological Chemistry, 262, 5488-5491.
Ramírez, R., & Cava, R. (2006). Carcass composition and meat quality of 3 different Iberian x Duroc genotype pigs. doi:10.1016/j.meatsci.2006.08.003
Rosenvold, K., & Andersen, H.J. (2003). The Significance of pre-slaughter stress and diet on colour and colour stability. Meat Science, 63, 199-209
Salih, A. M., Smith, D. M., Price, J. F., & Dawson, L. E. (1987). Modified extraction 2-thiobarbituric acid method for measuring lipid oxidation in poultry. Poultry Science, 66, 1483–1489.
Soriano A., Quiles R., Mariscal C., García-Ruiz, A. (2005). Pig sire type and sex effects on carcass traits, meat quality and physicochemical and sensory characteristics of Serrano dry-cured ham. Journal of the Science of Food and Agriculture, 85, 1914–1924.
SPSS (2003) Inc. SPSS 12.0 for Windows SPSS Inc. Chicago.
Ventanas, S., Estevez, M., Tejeda, J.F., & Ruiz, J. (2006) Protein and lipid oxidation in Longissimus dorsi and dry-cured loin from Iberian pigs as affected by crossbreeding and diet. Meat Science, 72, (4), 647-655.
95


Chapter IV


Chapter IV. Changes in fatty acids during storage
CHANGES IN FATTY ACID COMPOSITION OF 2 MUSCLES FROM 3 IBERIAN x DUROC GENOTYPES AFTER REFRIGERATED STORAGE1
ABSTRACT
The evolution of the fatty acid profile of 2 muscles Longissimus dorsi (LD) and Biceps femoris (BF) from 3 Iberian x Duroc genotypes was studied: GEN1: ♂ Iberian x ♀ Duroc1, GEN2: ♂ Duroc1 x ♀ Iberian; GEN3: ♂ Duroc2 x ♀ Iberian. GEN1 and GEN2 are reciprocal crosses while the difference between GEN2 and GEN3 is the Duroc sire line. The genotype Duroc1 (DU1) was selected for the production of dry-cured meat products while the genotype Duroc2 (DU2) was selected for meat production. LD and BF from the reciprocal cross showed similar fatty acids evolution after refrigerated storage. However, the Duroc sire line significantly affected the fatty acid profile of IMF and lipid fractions since important differences were found between GEN2 and GEN3. Meat from GEN3 had the highest level of PUFA in IMF and lipid fractions as well as the lowest rate of plasmalogens in PL fraction. After storage, meat from GEN3 showed a large increase of long chain PUFA in free fatty acids fraction (FFA) and the highest increase in the ratio DMA/FA ((dimethylacetals/fatty acid)x100) after the refrigerated storage, which is indicative of a higher deterioration of this genotype. Therefore, the crossbreeding of Iberian pigs with Duroc selected genotypes (DU2) reduced the fatty acids profile stability of meat during refrigerated storage.
Keywords: fatty acid, intramuscular fat, lipid fractions, genotype, storage, Duroc, Iberian.
1.- INTRODUCTION Iberian breed is an autochthonous breed traditionally reared in the south-west of the Iberian
Peninsula. The Iberian pig is mainly destined to the manufacture of dry cured-meat products such as
shoulders, loins and hams, and recently, to fresh meat consumption. Meat and dry-cured meat
products are highly appreciated by the consumers due to their sensory and nutritive quality. The high
demand of meat and dry-cured meat products from Iberian pigs has increased the number of Iberian
pigs in Spain. As Iberian pig has slow growth rate and low prolificacy (Dobao et al., 1986), it is very
common the use of the Duroc breed in cross with the Iberian breed to improve productive parameters
(Dobao et al., 1986); without a significant reduction of the quality of meat and meat products
(Antequera et al., 1994; López-Bote, 1998; Tejeda et al., 2002).
Because of the increase of the market of Iberian pigs in the last years in Spain, a specific law to
regulate this production was passed in 2001 (B.O.E., 15 October 2001). One of the most important
aspects that this law regulates is the genotype used for the manufacture of cured meat products
(hams, shoulders and loins) labelled as “Iberian”. The law allows using pure Iberian pigs as well as
Iberian x Duroc crosses, but it is necessary the use of Iberian females in the crossbreeding with
Duroc. Therefore, the differences between reciprocal crosses and the characteristics of the Duroc
sire lines for crossbreeding with Iberian pig are of prime importance for Iberian pig producers.
For the manufacture of high quality dry-cured Iberian meat products, the industry requires heavy pigs
with a high content of subcutaneous and intramuscular fat (IMF) (Ruiz-Carrascal et al., 2000). Cava
et al., (1999) reported a marked influence of the fatty acid composition of IMF on the volatile
aldehyde profile of Iberian dry-cured ham. Furthermore, the fatty acid composition of intramuscular
fat is determinant for the shelf life of refrigerated meat, because that could favour the development of
1 Ramírez, M.R. & Cava, R. (2006). Changes in fatty acid composition of 2 muscles from 3 Iberian x Duroc genotypes after refrigerated storage Submitted to Food Science and Technology International for publication.
99
Chapter IV. Changes in fatty acids during storage
oxidation, and as a result, the development of rancidity and the loss of nutritive value (Kanner 1994;
Gray et al., 1996; Morrissey et al., 1998).
Lipolytic enzymes remain active during refrigerated or frozen storage (Motilva et al., 1992) and
maturation of dry-cured products (Toldrá et al., 1997). Lipolysis is considered as a promoter of lipid
oxidation because released free fatty acids are very prone to lipid oxidation; particularly long chain
unsaturated fatty acids (Nawar, 1996). Lipid oxidation modifies sensory and nutritional characteristics
of meat, causing a yellow coloration of fat, loss of water, texture alteration and off-flavour generation
(Gray et al., 1996). This reaction mainly depends on lipid content, fatty acid composition and the
balance between prooxidants and antioxidants factors (Morrissey et al., 1998).
Significant differences have been previously reported in meat quality from different Duroc lines
(Lonergan et al., 2001; Soriano et al., 2005; Cilla et al., 2006). Moreover, there are important
differences in the lipolytic activities of lipase, phospholipase and cathepsin associated to the pig
genotype (Toldrá et al., 1996; Rosell and Toldrá 1998; Hernández et al., 2004; Cava et al., 2004).
Therefore, the evaluation of the changes during the refrigerated storage of the meat related to the pig
genotype is of prime importance to a further understanding of the degradation processes of meat.
The objective of this paper was to determine the effect of the crossbreeding of different Iberian x
Duroc genotypes on fatty acid profile changes from intramuscular lipid fractions during refrigerated
storage.
2.- MATERIAL AND METHODS 2.1.- Animals. 3 groups of 10 pigs each one were studied (5 males and 5 females) from different genotypes: GEN1:
♂ Iberian x ♀ Duroc1, GEN2: ♂ Duroc1 x ♀ Iberian; GEN3: ♂ Duroc2 x ♀ Iberian. The genotype
Duroc1 (DU1) corresponded to pigs selected for the production of dry-cured meat products (hams,
loins, shoulders), with a high level of fattening. The genotype Duroc2 (DU2) corresponded to animals
selected for meat production, with high percentages of meat cuts and low carcass fat. Pigs were
castrated, as is traditionally done and they were raised together in a semi-intensive system and were
fed ad libitum with the diet shown in Table 1. Pigs were randomly slaughtered after 316 days of
rearing at 150-165 Kg live weight.
2.2.- Refrigerated storage. Longissimus dorsi (LD) and Biceps femoris (BF) were sliced (1.5 cm of thickness). They were placed
on Styrofoam meat trays, over-wrapped in PVC oxygen permeable films, and stored under
fluorescent light at +4º C for 10 days. A solution of chloramphenicol (4mg/ml)/ciclohexamide
(1mg/ml) was sprayed on the surface of the chops to avoid microbial growth. Samples were stored at
-80ºC.
2.3.- Fat extraction, lipids extract fractionation and fatty acid analyses. Lipids were extracted from 5g of meat samples with chloroform/methanol (1:2) according to the
method described by Bligh and Dyer (1959). Total lipid extracts from intramuscular fat –IMF- were
fractionated by solid phase extraction on 100mg aminopropyl minicolumns (Varian, CA) into neutral
lipids (NL), free fatty acids (FFA) and polar lipids (PL), following the procedure described by Monin et
al., (2003). Fatty acid methyl esters (FAMEs) from fatty acids and dimethylacetals (DMA) from fatty
100
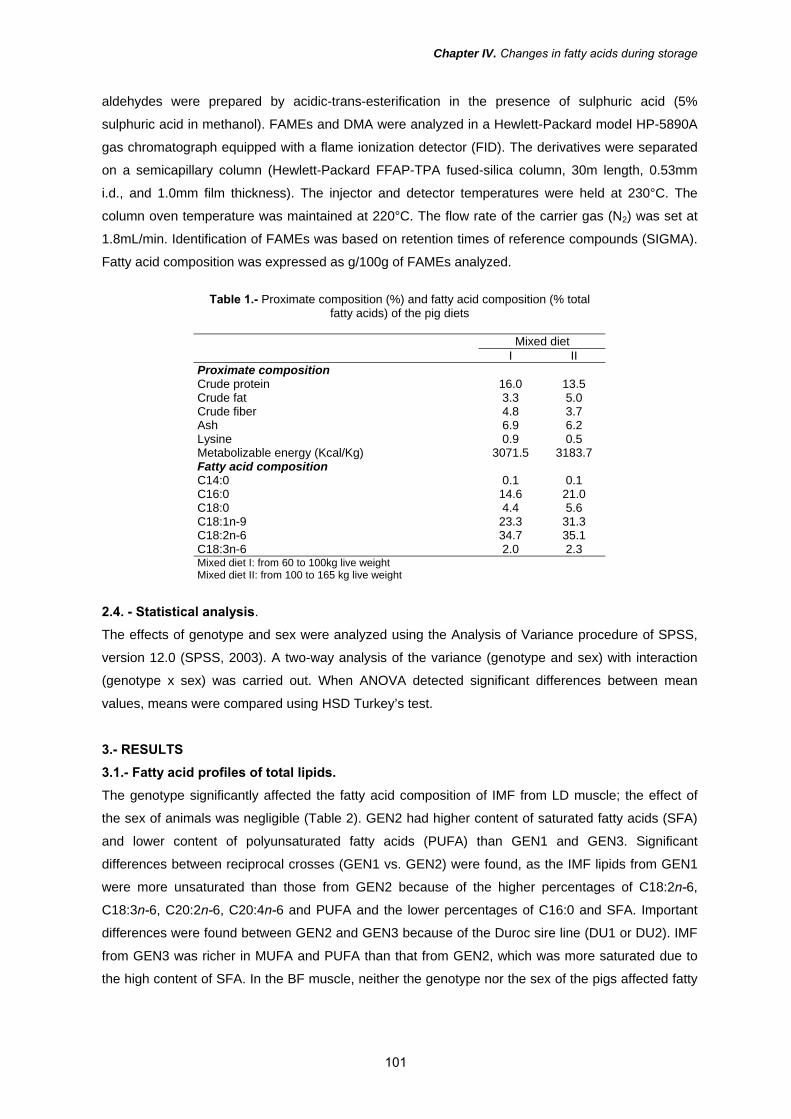
Chapter IV. Changes in fatty acids during storage
aldehydes were prepared by acidic-trans-esterification in the presence of sulphuric acid (5%
sulphuric acid in methanol). FAMEs and DMA were analyzed in a Hewlett-Packard model HP-5890A
gas chromatograph equipped with a flame ionization detector (FID). The derivatives were separated
on a semicapillary column (Hewlett-Packard FFAP-TPA fused-silica column, 30m length, 0.53mm
i.d., and 1.0mm film thickness). The injector and detector temperatures were held at 230°C. The
column oven temperature was maintained at 220°C. The flow rate of the carrier gas (N2) was set at
1.8mL/min. Identification of FAMEs was based on retention times of reference compounds (SIGMA).
Fatty acid composition was expressed as g/100g of FAMEs analyzed.
Table 1.- Proximate composition (%) and fatty acid composition (% total
fatty acids) of the pig diets
Mixed diet I II Proximate composition Crude protein 16.0 13.5 Crude fat 3.3 5.0 Crude fiber 4.8 3.7 Ash 6.9 6.2 Lysine 0.9 0.5 Metabolizable energy (Kcal/Kg) 3071.5 3183.7 Fatty acid composition C14:0 0.1 0.1 C16:0 14.6 21.0 C18:0 4.4 5.6 C18:1n-9 23.3 31.3 C18:2n-6 34.7 35.1 C18:3n-6 2.0 2.3 Mixed diet I: from 60 to 100kg live weight Mixed diet II: from 100 to 165 kg live weight
2.4. - Statistical analysis.
The effects of genotype and sex were analyzed using the Analysis of Variance procedure of SPSS,
version 12.0 (SPSS, 2003). A two-way analysis of the variance (genotype and sex) with interaction
(genotype x sex) was carried out. When ANOVA detected significant differences between mean
values, means were compared using HSD Turkey’s test.
3.- RESULTS 3.1.- Fatty acid profiles of total lipids. The genotype significantly affected the fatty acid composition of IMF from LD muscle; the effect of
the sex of animals was negligible (Table 2). GEN2 had higher content of saturated fatty acids (SFA)
and lower content of polyunsaturated fatty acids (PUFA) than GEN1 and GEN3. Significant
differences between reciprocal crosses (GEN1 vs. GEN2) were found, as the IMF lipids from GEN1
were more unsaturated than those from GEN2 because of the higher percentages of C18:2n-6,
C18:3n-6, C20:2n-6, C20:4n-6 and PUFA and the lower percentages of C16:0 and SFA. Important
differences were found between GEN2 and GEN3 because of the Duroc sire line (DU1 or DU2). IMF
from GEN3 was richer in MUFA and PUFA than that from GEN2, which was more saturated due to
the high content of SFA. In the BF muscle, neither the genotype nor the sex of the pigs affected fatty
101
Chapter IV. Changes in fatty acids during storage
acid profiles of the IMF. Nevertheless, the fatty acid composition of the BF followed a similar trend
than that previously described for LD.
After 10 days of refrigerated storage of LD, a decrease in PUFA was observed, especially in GEN3,
while remained unchanged in GEN2 and slightly decreased in GEN1. IMF lipids from GEN2 were
more saturated, with higher contents of C16:0 and C18:0, than those from GEN3, while GEN1 had
an intermediate content of SFA. In BF, little differences were found between genotypes. GEN2 had
higher contents of C16:0 and SFA than the other two genotypes, and lower C20:4n-6 and C20:5n-3
contents than GEN3.
3.2. - Fatty acid profiles in neutral lipids from intramuscular fat. FA profiles of NL showed a similar pattern than that described for total lipids of intramuscular fat.
Genotype significantly affected fatty acid composition of NL fraction in both muscles, whereas the
sex of the animals only affected FA profiles of LD (Table 3). In this sense, NL from females were
more saturated due to higher SFA and lower PUFA content than those from males. Reciprocal cross
(GEN1 vs. GEN2) did not affect the sum of SFA, MUFA and PUFA in both muscles, although in LD
GEN2 had lower contents of C18:1n-9, C20:1n-9 and higher C14:0 and C16:0 than GEN1. Duroc sire
line (GEN2 vs. GEN3) significantly affected FA profiles of NL from LD and BF. In LD, NL from GEN3
were more unsaturated than those from GEN2 which had higher contents of C16:0 and C18:0 and
lower contents of C18:1n-9, C18:3n-6, C20:2n-6, C20:4n-6, C20:5n-3. Similarly, NL of BF from GEN3
had more C18:2n-6, C20:4n-6, C22:2n-6 and less C18:0 than those from GEN2.
In general, storage did not produce great changes in FA profiles of NL, although diminished
differences found between genotypes at day 0. Thus, differences between reciprocal crosses (GEN1
vs. GEN2) were negligible and slight differences between genotypes with different Duroc sire line
(GEN2 vs. GEN3) were found. In LD, differences between genotypes in SFA and MUFA were
maintained and FA profiles showed a similar pattern than that described for day 0. However, no
differences were found in PUFA after storage between genotypes, mainly due the higher decrease of
long chain PUFA (C20:2n-6, C20:4n-6, C20:5n-3) in GEN3. In BF, after storage, NL from the 3
genotypes showed slight differences in their fatty acid profiles, and only SFA differed between them.
GEN2 had higher levels of C16:0 and C18:0 than GEN3 while GEN1 had intermediate levels.
3.3.- Fatty acid profile of polar lipids No significant differences were found in SFA, MUFA and PUFA before the storage in both muscles
(Table 4). In LD, GEN1 and GEN2 had highest levels of C18:3n-6, GEN2 and GEN3 had the highest
percentage of C18:0 and GEN3 had the highest percentages of C20:4n-6. In BF, some PUFA
(C18:2n-6, C18:3n-6 and C20:5n-3) were significantly highest in GEN1; the levels of C18:0, C18:2n-6
and C22:2n-6 were significantly highest in GEN2 while C18:0 and long chain PUFA (C20:4n-6,
C20:5n-3, C22:2n-6) were significantly highest in GEN3.
102
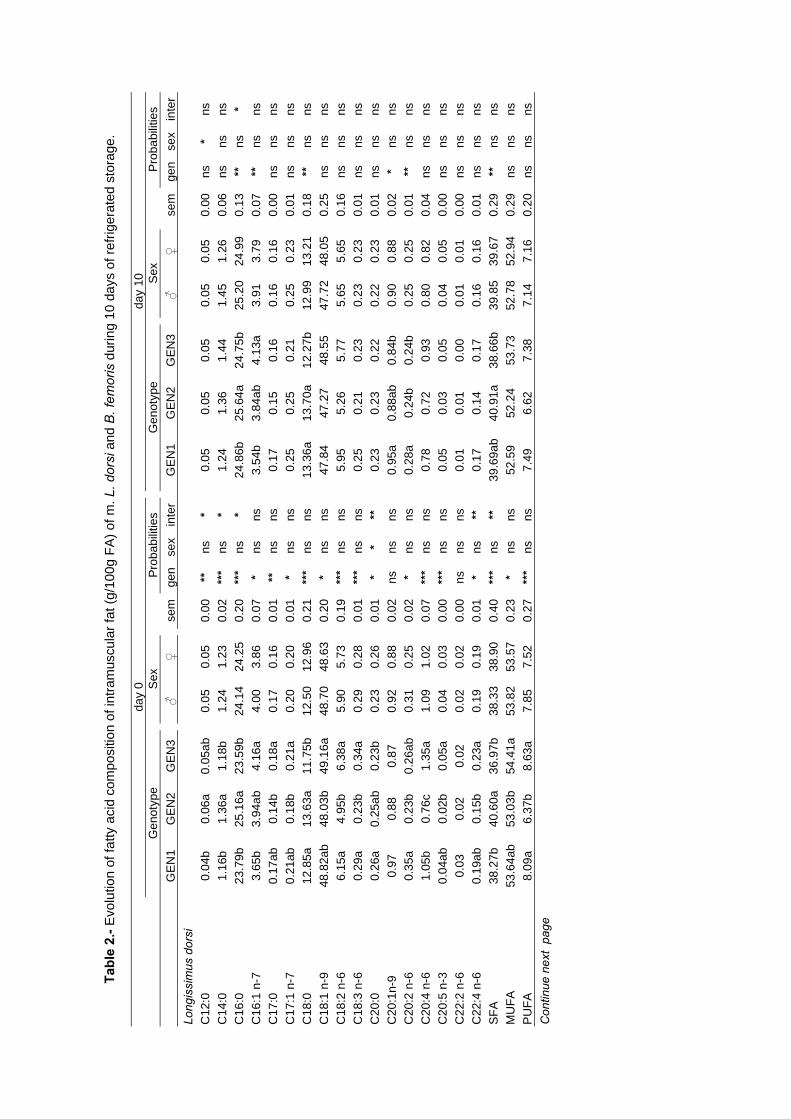
Tabl
e 2.
- Evo
lutio
n of
fatty
aci
d co
mpo
sitio
n of
intra
mus
cula
r fat
(g/1
00g
FA) o
f m. L
. dor
si a
nd B
. fem
oris
dur
ing
10 d
ays
of re
frige
rate
d st
orag
e.
day
0
day
10
G
enot
ype
Sex
Pr
obab
ilitie
s
Gen
otyp
e Se
x
Prob
abili
ties
G
EN
1 G
EN
2 G
EN
3 ♂
♀
se
mge
nse
xin
ter
G
EN
1 G
EN
2 G
EN
3 ♂
♀
se
mge
nse
x in
ter
Long
issi
mus
dor
si
C
12:0
0.
04b
0.06
a 0.
05ab
0.
05
0.05
0.
00**
ns
*
0.
05
0.05
0.
05
0.05
0.
05
0.00
ns
* ns
C
14:0
1.
16b
1.36
a 1.
18b
1.24
1.
23
0.02
***
ns
*
1.24
1.
36
1.44
1.
45
1.26
0.
06ns
ns
ns
C
16:0
23
.79b
25
.16a
23
.59b
24
.14
24.2
5 0.
20**
* ns
*
24
.86b
25
.64a
24
.75b
25
.20
24.9
9 0.
13**
ns
*
C16
:1 n
-7
3.65
b 3.
94ab
4.
16a
4.00
3.
86
0.07
* ns
ns
3.54
b 3.
84ab
4.
13a
3.91
3.
79
0.07
**
ns
ns
C17
:0
0.17
ab
0.14
b 0.
18a
0.17
0.
16
0.01
**
ns
ns
0.
17
0.15
0.
16
0.16
0.
16
0.00
ns
ns
ns
C17
:1 n
-7
0.21
ab
0.18
b 0.
21a
0.20
0.
20
0.01
* ns
ns
0.25
0.
25
0.21
0.
25
0.23
0.
01ns
ns
ns
C
18:0
12
.85a
13
.63a
11
.75b
12
.50
12.9
6 0.
21**
* ns
ns
13.3
6a
13.7
0a
12.2
7b
12.9
9 13
.21
0.18
**
ns
ns
C18
:1 n
-9
48.8
2ab
48.0
3b
49.1
6a
48.7
0 48
.63
0.20
* ns
ns
47.8
4 47
.27
48.5
5 47
.72
48.0
5 0.
25ns
ns
ns
C
18:2
n-6
6.
15a
4.95
b 6.
38a
5.90
5.
73
0.19
***
ns
ns
5.
95
5.26
5.
77
5.65
5.
65
0.16
ns
ns
ns
C18
:3 n
-6
0.29
a 0.
23b
0.34
a 0.
29
0.28
0.
01**
* ns
ns
0.25
0.
21
0.23
0.
23
0.23
0.
01ns
ns
ns
C
20:0
0.
26a
0.25
ab
0.23
b 0.
23
0.26
0.
01*
* **
0.23
0.
23
0.22
0.
22
0.23
0.
01ns
ns
ns
C
20:1
n-9
0.97
0.
88
0.87
0.
92
0.88
0.
02ns
ns
ns
0.95
a 0.
88ab
0.
84b
0.90
0.
88
0.02
* ns
ns
C
20:2
n-6
0.
35a
0.23
b 0.
26ab
0.
31
0.25
0.
02*
ns
ns
0.
28a
0.24
b 0.
24b
0.25
0.
25
0.01
**
ns
ns
C20
:4 n
-6
1.05
b 0.
76c
1.35
a 1.
09
1.02
0.
07**
* ns
ns
0.78
0.
72
0.93
0.
80
0.82
0.
04ns
ns
ns
C
20:5
n-3
0.
04ab
0.
02b
0.05
a 0.
04
0.03
0.
00**
* ns
ns
0.05
0.
03
0.05
0.
04
0.05
0.
00ns
ns
ns
C
22:2
n-6
0.
03
0.02
0.
02
0.02
0.
02
0.00
ns
ns
ns
0.
01
0.01
0.
00
0.01
0.
01
0.00
ns
ns
ns
C22
:4 n
-6
0.19
ab
0.15
b 0.
23a
0.19
0.
19
0.01
* ns
**
0.17
0.
14
0.17
0.
16
0.16
0.
01ns
ns
ns
SF
A 38
.27b
40
.60a
36
.97b
38
.33
38.9
0 0.
40**
* ns
**
39.6
9ab
40.9
1a
38.6
6b
39.8
5 39
.67
0.29
**
ns
ns
MU
FA
53.6
4ab
53.0
3b
54.4
1a
53.8
2 53
.57
0.23
* ns
ns
52.5
9 52
.24
53.7
3 52
.78
52.9
4 0.
29ns
ns
ns
PU
FA
8.09
a 6.
37b
8.63
a 7.
85
7.52
0.
27**
* ns
ns
7.49
6.
62
7.38
7.
14
7.16
0.
20ns
ns
ns
C
ontin
ue n
ext
page
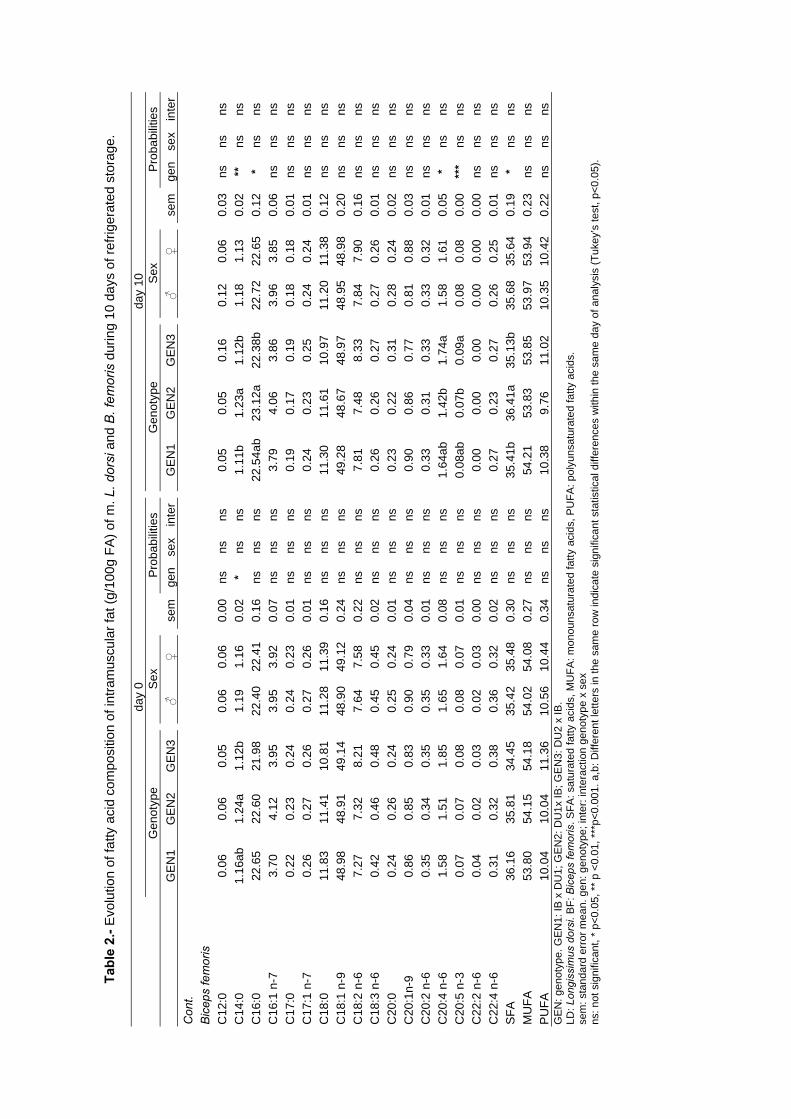
Tabl
e 2.
- Evo
lutio
n of
fatty
aci
d co
mpo
sitio
n of
intra
mus
cula
r fat
(g/1
00g
FA) o
f m. L
. dor
si a
nd B
. fem
oris
dur
ing
10 d
ays
of re
frige
rate
d st
orag
e.
day
0
day
10
G
enot
ype
Sex
Pr
obab
ilitie
s
Gen
otyp
e Se
x
Prob
abili
ties
G
EN
1 G
EN
2 G
EN
3 ♂
♀
se
mge
nse
xin
ter
G
EN
1 G
EN
2 G
EN
3 ♂
♀
se
mge
nse
x in
ter
Con
t.
Bic
eps
fem
oris
C12
:0
0.06
0.
06
0.05
0.
06
0.06
0.
00ns
ns
ns
0.05
0.
05
0.16
0.
12
0.06
0.
03ns
ns
ns
C
14:0
1.
16ab
1.
24a
1.12
b 1.
19
1.16
0.
02*
ns
ns
1.
11b
1.23
a 1.
12b
1.18
1.
13
0.02
**
ns
ns
C16
:0
22.6
5 22
.60
21.9
8 22
.40
22.4
1 0.
16ns
ns
ns
22.5
4ab
23.1
2a
22.3
8b
22.7
2 22
.65
0.12
* ns
ns
C
16:1
n-7
3.
70
4.12
3.
95
3.95
3.
92
0.07
ns
ns
ns
3.
79
4.06
3.
86
3.96
3.
85
0.06
ns
ns
ns
C17
:0
0.22
0.
23
0.24
0.
24
0.23
0.
01ns
ns
ns
0.19
0.
17
0.19
0.
18
0.18
0.
01ns
ns
ns
C
17:1
n-7
0.
26
0.27
0.
26
0.27
0.
26
0.01
ns
ns
ns
0.
24
0.23
0.
25
0.24
0.
24
0.01
ns
ns
ns
C18
:0
11.8
3 11
.41
10.8
1 11
.28
11.3
9 0.
16ns
ns
ns
11.3
0 11
.61
10.9
7 11
.20
11.3
8 0.
12ns
ns
ns
C
18:1
n-9
48
.98
48.9
1 49
.14
48.9
0 49
.12
0.24
ns
ns
ns
49
.28
48.6
7 48
.97
48.9
5 48
.98
0.20
ns
ns
ns
C18
:2 n
-6
7.27
7.
32
8.21
7.
64
7.58
0.
22ns
ns
ns
7.81
7.
48
8.33
7.
84
7.90
0.
16ns
ns
ns
C
18:3
n-6
0.
42
0.46
0.
48
0.45
0.
45
0.02
ns
ns
ns
0.
26
0.26
0.
27
0.27
0.
26
0.01
ns
ns
ns
C20
:0
0.24
0.
26
0.24
0.
25
0.24
0.
01ns
ns
ns
0.23
0.
22
0.31
0.
28
0.24
0.
02ns
ns
ns
C
20:1
n-9
0.86
0.
85
0.83
0.
90
0.79
0.
04ns
ns
ns
0.90
0.
86
0.77
0.
81
0.88
0.
03ns
ns
ns
C
20:2
n-6
0.
35
0.34
0.
35
0.35
0.
33
0.01
ns
ns
ns
0.
33
0.31
0.
33
0.33
0.
32
0.01
ns
ns
ns
C20
:4 n
-6
1.58
1.
51
1.85
1.
65
1.64
0.
08ns
ns
ns
1.64
ab
1.42
b 1.
74a
1.58
1.
61
0.05
* ns
ns
C
20:5
n-3
0.
07
0.07
0.
08
0.08
0.
07
0.01
ns
ns
ns
0.
08ab
0.
07b
0.09
a 0.
08
0.08
0.
00**
* ns
ns
C
22:2
n-6
0.
04
0.02
0.
03
0.02
0.
03
0.00
ns
ns
ns
0.
00
0.00
0.
00
0.00
0.
00
0.00
ns
ns
ns
C22
:4 n
-6
0.31
0.
32
0.38
0.
36
0.32
0.
02ns
ns
ns
0.27
0.
23
0.27
0.
26
0.25
0.
01ns
ns
ns
SF
A 36
.16
35.8
1 34
.45
35.4
2 35
.48
0.30
ns
ns
ns
35
.41b
36
.41a
35
.13b
35
.68
35.6
4 0.
19*
ns
ns
MU
FA
53.8
0 54
.15
54.1
8 54
.02
54.0
8 0.
27ns
ns
ns
54.2
1 53
.83
53.8
5 53
.97
53.9
4 0.
23ns
ns
ns
PU
FA
10.0
4 10
.04
11.3
6 10
.56
10.4
4 0.
34ns
ns
ns
10.3
8 9.
76
11.0
2 10
.35
10.4
2 0.
22ns
ns
ns
G
EN
: gen
otyp
e. G
EN
1: IB
x D
U1;
GE
N2:
DU
1x IB
; GE
N3:
DU
2 x
IB.
LD: L
ongi
ssim
us d
orsi
. BF:
Bic
eps
fem
oris
. SFA
: sat
urat
ed fa
tty a
cids
, MU
FA: m
onou
nsat
urat
ed fa
tty a
cids
, PU
FA: p
olyu
nsat
urat
ed fa
tty a
cids
. se
m: s
tand
ard
erro
r mea
n. g
en: g
enot
ype;
inte
r: in
tera
ctio
n ge
noty
pe x
sex
ns
: not
sig
nific
ant,
* p<
0.05
, **
p <0
.01,
***
p<0.
001.
a,b
: Diff
eren
t let
ters
in th
e sa
me
row
indi
cate
sig
nific
ant s
tatis
tical
diff
eren
ces
with
in th
e sa
me
day
of a
naly
sis
(Tuk
ey’s
test
, p<0
.05)
.
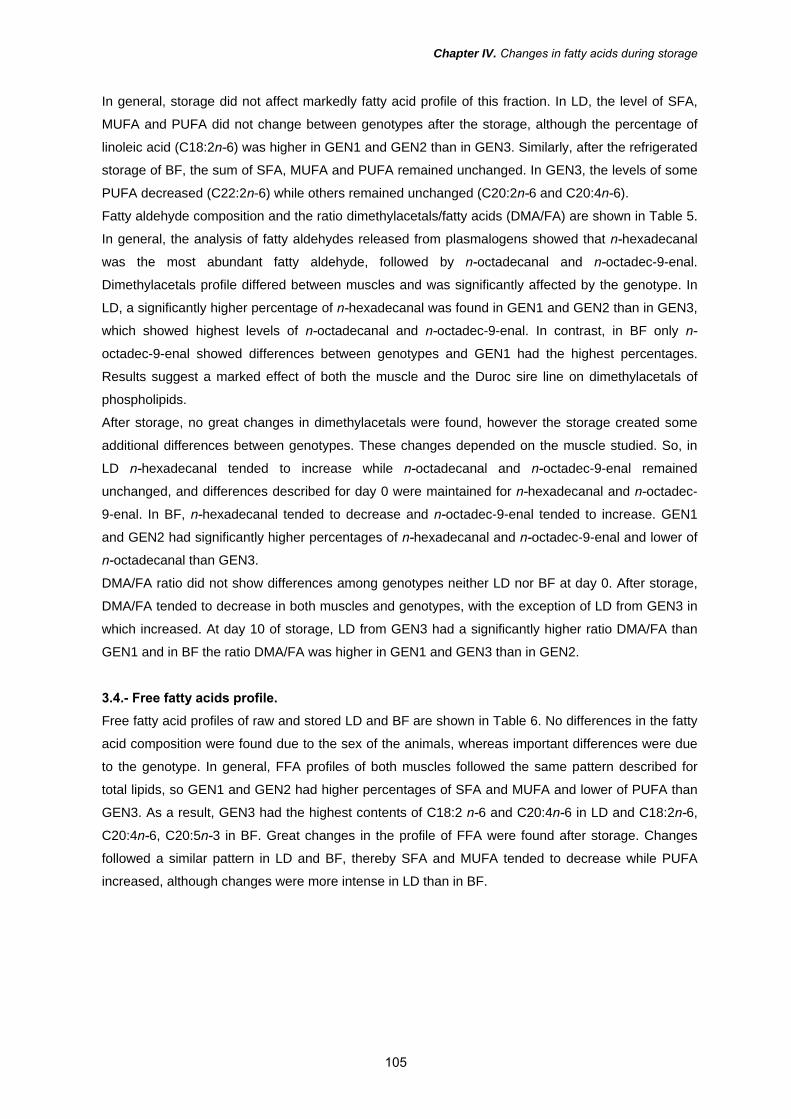
Chapter IV. Changes in fatty acids during storage
In general, storage did not affect markedly fatty acid profile of this fraction. In LD, the level of SFA,
MUFA and PUFA did not change between genotypes after the storage, although the percentage of
linoleic acid (C18:2n-6) was higher in GEN1 and GEN2 than in GEN3. Similarly, after the refrigerated
storage of BF, the sum of SFA, MUFA and PUFA remained unchanged. In GEN3, the levels of some
PUFA decreased (C22:2n-6) while others remained unchanged (C20:2n-6 and C20:4n-6).
Fatty aldehyde composition and the ratio dimethylacetals/fatty acids (DMA/FA) are shown in Table 5.
In general, the analysis of fatty aldehydes released from plasmalogens showed that n-hexadecanal
was the most abundant fatty aldehyde, followed by n-octadecanal and n-octadec-9-enal.
Dimethylacetals profile differed between muscles and was significantly affected by the genotype. In
LD, a significantly higher percentage of n-hexadecanal was found in GEN1 and GEN2 than in GEN3,
which showed highest levels of n-octadecanal and n-octadec-9-enal. In contrast, in BF only n-
octadec-9-enal showed differences between genotypes and GEN1 had the highest percentages.
Results suggest a marked effect of both the muscle and the Duroc sire line on dimethylacetals of
phospholipids.
After storage, no great changes in dimethylacetals were found, however the storage created some
additional differences between genotypes. These changes depended on the muscle studied. So, in
LD n-hexadecanal tended to increase while n-octadecanal and n-octadec-9-enal remained
unchanged, and differences described for day 0 were maintained for n-hexadecanal and n-octadec-
9-enal. In BF, n-hexadecanal tended to decrease and n-octadec-9-enal tended to increase. GEN1
and GEN2 had significantly higher percentages of n-hexadecanal and n-octadec-9-enal and lower of
n-octadecanal than GEN3.
DMA/FA ratio did not show differences among genotypes neither LD nor BF at day 0. After storage,
DMA/FA tended to decrease in both muscles and genotypes, with the exception of LD from GEN3 in
which increased. At day 10 of storage, LD from GEN3 had a significantly higher ratio DMA/FA than
GEN1 and in BF the ratio DMA/FA was higher in GEN1 and GEN3 than in GEN2.
3.4.- Free fatty acids profile. Free fatty acid profiles of raw and stored LD and BF are shown in Table 6. No differences in the fatty
acid composition were found due to the sex of the animals, whereas important differences were due
to the genotype. In general, FFA profiles of both muscles followed the same pattern described for
total lipids, so GEN1 and GEN2 had higher percentages of SFA and MUFA and lower of PUFA than
GEN3. As a result, GEN3 had the highest contents of C18:2 n-6 and C20:4n-6 in LD and C18:2n-6,
C20:4n-6, C20:5n-3 in BF. Great changes in the profile of FFA were found after storage. Changes
followed a similar pattern in LD and BF, thereby SFA and MUFA tended to decrease while PUFA
increased, although changes were more intense in LD than in BF.
105

Tabl
e 3.
- Evo
lutio
n of
fatty
aci
d co
mpo
sitio
n of
neu
tral l
ipid
s fro
m in
tram
uscu
lar f
at (g
/100
g FA
) of m
. L. d
orsi
and
B. f
emor
is d
urin
g 10
day
s of
refri
gera
ted
stor
age.
da
y 0
da
y 10
Gen
otyp
e Se
x
Prob
abili
ties
G
enot
ype
Sex
Pr
obab
ilitie
s
GE
N1
GE
N2
GE
N3
♂
♀
sem
gen
Sex
inte
r
GE
N1
GE
N2
GE
N3
♂
♀
sem
gen
sex
inte
r Lo
ngis
sim
us d
orsi
C12
:0
0.07
0.
07
0.08
0.
08
0.07
0.
00*
ns
ns
0.
06b
0.06
a 0.
06a
0.06
0.
06
0.00
**
ns
ns
C14
:0
1.35
b 1.
51a
1.30
b 1.
40
1.37
0.
03**
* ns
*
1.
32b
1.48
a 1.
39b
1.44
1.
36
0.02
***
* ns
C
16:0
25
.33a
b 26
.06a
24
.61b
25
.16
25.5
0 0.
19**
* ns
*
25
.24b
26
.02a
25
.30b
25
.62
25.4
5 0.
12**
ns
ns
C
16:1
n-7
3.
88b
4.08
ab
4.40
a 4.
22
4.04
0.
08*
ns
ns
3.
70b
4.01
ab
4.33
a 4.
08
3.97
0.
08**
ns
ns
C
17:0
0.
17
0.15
0.
18
0.17
0.
16
0.01
ns
ns
ns
0.
16
0.15
0.
15
0.15
0.
15
0.00
ns
ns
ns
C17
:1 n
-7
0.20
0.
17
0.23
0.
20
0.20
0.
01ns
ns
ns
0.21
0.
19
0.20
0.
20
0.20
0.
00ns
ns
ns
C
18:0
12
.98a
13
.46a
11
.64b
12
.32
13.0
2 0.
21**
* *
ns
13
.43a
13
.69a
12
.26b
13
.00
13.2
2 0.
20**
ns
ns
C
18:1
n-9
49
.55a
48
.45b
50
.46a
49
.64
49.3
4 0.
24**
* ns
*
49
.26a
b 48
.57b
50
.21a
49
.22
49.4
8 0.
26*
ns
ns
C18
:2 n
-6
4.33
3.
98
4.71
4.
48
4.21
0.
13ns
ns
ns
4.55
3.
90
4.26
4.
23
4.22
0.
13ns
ns
ns
C
18:3
n-6
0.
25ab
0.
22b
0.29
a 0.
26
0.25
0.
01**
* ns
ns
0.25
0.
25
0.25
0.
24
0.26
0.
01ns
ns
ns
C
20:0
0.
27
0.29
0.
28
0.28
0.
28
0.01
ns
ns
*
0.24
0.
26
0.21
0.
25
0.23
0.
01ns
ns
ns
C
20:1
n-9
0.95
a 0.
87b
0.89
ab
0.93
0.
88
0.02
* ns
ns
0.99
a 0.
92ab
0.
80b
0.94
0.
86
0.03
* ns
ns
C
20:2
n-6
0.
26ab
0.
24b
0.29
a 0.
27
0.25
0.
01*
ns
ns
0.
27a
0.23
b 0.
23b
0.24
0.
24
0.01
**
ns
ns
C20
:4 n
-6
0.23
b 0.
28ab
0.
42a
0.37
0.
26
0.03
**
* ns
0.19
0.
15
0.22
0.
20
0.17
0.
01ns
ns
ns
C
20:5
n-3
0.
05b
0.03
c 0.
07a
0.05
0.
05
0.00
***
ns
*
0.04
0.
04
0.04
0.
04
0.04
0.
00ns
ns
*
C22
:2 n
-6
0.04
0.
05
0.05
0.
05
0.05
0.
00ns
ns
ns
0.01
0.
01
0.00
0.
01
0.01
0.
00ns
ns
ns
C
22:4
n-6
0.
08
0.10
0.
10
0.11
0.
08
0.01
ns
* ns
0.10
0.
09
0.09
0.
10
0.09
0.
00ns
ns
ns
SF
A 40
.16a
41
.54a
38
.1b
39.4
0 40
.41
0.38
***
* *
40
.28a
b 41
.50a
39
.22b
40
.36
40.3
2 0.
28**
ns
ns
M
UFA
54
.58b
53
.57b
55
.98a
54
.99
54.4
5 0.
28**
* ns
*
54
.15a
b 53
.69b
55
.55a
54
.44
54.5
1 0.
31*
ns
ns
PUFA
5.
25ab
4.
89b
5.93
a 5.
60
5.13
0.
18*
ns
ns
5.
40
4.67
5.
09
5.06
5.
02
0.15
ns
ns
ns
Con
tinue
nex
t pa
ge
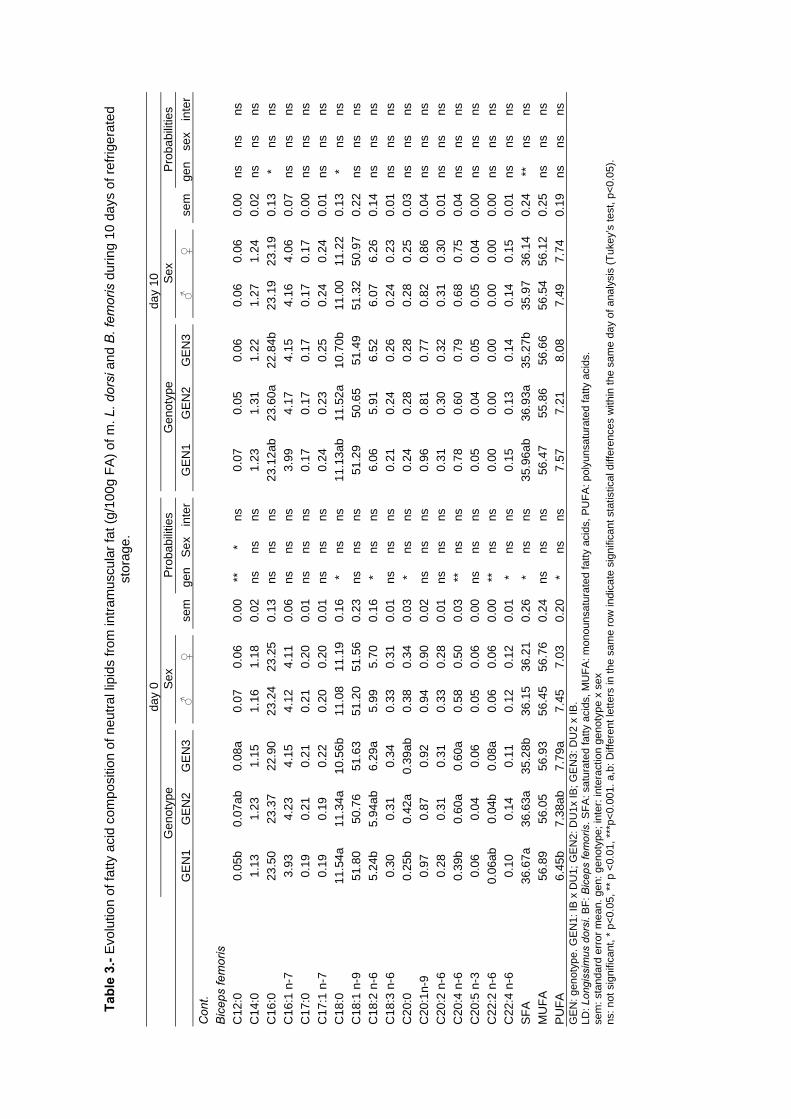
Tabl
e 3.
- Evo
lutio
n of
fatty
aci
d co
mpo
sitio
n of
neu
tral l
ipid
s fro
m in
tram
uscu
lar f
at (g
/100
g FA
) of m
. L. d
orsi
and
B. f
emor
is d
urin
g 10
day
s of
refri
gera
ted
stor
age.
da
y 0
da
y 10
Gen
otyp
e Se
x
Prob
abili
ties
G
enot
ype
Sex
Pr
obab
ilitie
s
GE
N1
GE
N2
GE
N3
♂
♀
sem
gen
Sex
inte
r
GE
N1
GE
N2
GE
N3
♂
♀
sem
gen
sex
inte
r C
ont.
B
icep
s fe
mor
is
C
12:0
0.
05b
0.07
ab
0.08
a 0.
07
0.06
0.
00**
*
ns
0.
07
0.05
0.
06
0.06
0.
06
0.00
ns
ns
ns
C14
:0
1.13
1.
23
1.15
1.
16
1.18
0.
02ns
ns
ns
1.23
1.
31
1.22
1.
27
1.24
0.
02ns
ns
ns
C
16:0
23
.50
23.3
7 22
.90
23.2
4 23
.25
0.13
ns
ns
ns
23
.12a
b 23
.60a
22
.84b
23
.19
23.1
9 0.
13*
ns
ns
C16
:1 n
-7
3.93
4.
23
4.15
4.
12
4.11
0.
06ns
ns
ns
3.99
4.
17
4.15
4.
16
4.06
0.
07ns
ns
ns
C
17:0
0.
19
0.21
0.
21
0.21
0.
20
0.01
ns
ns
ns
0.
17
0.17
0.
17
0.17
0.
17
0.00
ns
ns
ns
C17
:1 n
-7
0.19
0.
19
0.22
0.
20
0.20
0.
01ns
ns
ns
0.24
0.
23
0.25
0.
24
0.24
0.
01ns
ns
ns
C
18:0
11
.54a
11
.34a
10
.56b
11
.08
11.1
9 0.
16*
ns
ns
11
.13a
b 11
.52a
10
.70b
11
.00
11.2
2 0.
13*
ns
ns
C18
:1 n
-9
51.8
0 50
.76
51.6
3 51
.20
51.5
6 0.
23ns
ns
ns
51.2
9 50
.65
51.4
9 51
.32
50.9
7 0.
22ns
ns
ns
C
18:2
n-6
5.
24b
5.94
ab
6.29
a 5.
99
5.70
0.
16*
ns
ns
6.
06
5.91
6.
52
6.07
6.
26
0.14
ns
ns
ns
C18
:3 n
-6
0.30
0.
31
0.34
0.
33
0.31
0.
01ns
ns
ns
0.21
0.
24
0.26
0.
24
0.23
0.
01ns
ns
ns
C
20:0
0.
25b
0.42
a 0.
39ab
0.
38
0.34
0.
03*
ns
ns
0.
24
0.28
0.
28
0.28
0.
25
0.03
ns
ns
ns
C20
:1n-
9 0.
97
0.87
0.
92
0.94
0.
90
0.02
ns
ns
ns
0.
96
0.81
0.
77
0.82
0.
86
0.04
ns
ns
ns
C20
:2 n
-6
0.28
0.
31
0.31
0.
33
0.28
0.
01ns
ns
ns
0.31
0.
30
0.32
0.
31
0.30
0.
01ns
ns
ns
C
20:4
n-6
0.
39b
0.60
a 0.
60a
0.58
0.
50
0.03
**
ns
ns
0.
78
0.60
0.
79
0.68
0.
75
0.04
ns
ns
ns
C20
:5 n
-3
0.06
0.
04
0.06
0.
05
0.06
0.
00ns
ns
ns
0.05
0.
04
0.05
0.
05
0.04
0.
00ns
ns
ns
C
22:2
n-6
0.
06ab
0.
04b
0.08
a 0.
06
0.06
0.
00**
ns
ns
0.00
0.
00
0.00
0.
00
0.00
0.
00ns
ns
ns
C
22:4
n-6
0.
10
0.14
0.
11
0.12
0.
12
0.01
* ns
ns
0.15
0.
13
0.14
0.
14
0.15
0.
01ns
ns
ns
SF
A 36
.67a
36
.63a
35
.28b
36
.15
36.2
1 0.
26*
ns
ns
35
.96a
b 36
.93a
35
.27b
35
.97
36.1
4 0.
24**
ns
ns
M
UFA
56
.89
56.0
5 56
.93
56.4
5 56
.76
0.24
ns
ns
ns
56
.47
55.8
6 56
.66
56.5
4 56
.12
0.25
ns
ns
ns
PUFA
6.
45b
7.38
ab
7.79
a 7.
45
7.03
0.
20*
ns
ns
7.
57
7.21
8.
08
7.49
7.
74
0.19
ns
ns
ns
GE
N: g
enot
ype.
GE
N1:
IB x
DU
1; G
EN
2: D
U1x
IB; G
EN
3: D
U2
x IB
. LD
: Lon
giss
imus
dor
si. B
F: B
icep
s fe
mor
is. S
FA: s
atur
ated
fatty
aci
ds, M
UFA
: mon
ouns
atur
ated
fatty
aci
ds, P
UFA
: pol
yuns
atur
ated
fatty
aci
ds.
sem
: sta
ndar
d er
ror m
ean.
gen
: gen
otyp
e; in
ter:
inte
ract
ion
geno
type
x s
ex
ns: n
ot s
igni
fican
t, *
p<0.
05, *
* p
<0.0
1, *
**p<
0.00
1. a
,b: D
iffer
ent l
ette
rs in
the
sam
e ro
w in
dica
te s
igni
fican
t sta
tistic
al d
iffer
ence
s w
ithin
the
sam
e da
y of
ana
lysi
s (T
ukey
’s te
st, p
<0.0
5).

Chapter IV. Changes in fatty acids during storage
These changes increased the differences between genotypes previously described, and as a
consequence GEN1 and GEN2 had the highest percentages of SFA and MUFA, while GEN3 had the
highest of PUFA such as C18:2n-6, C20:4n-6, C20:5n-3 in LD and C18:2n-6, C20:4n-6, C22:4n-6 in
BF.
4.- DISCUSSION The fatty acid composition of the IMF from LD and BF as well as the changes after storage were
similar between reciprocal crosses (GEN1 vs. GEN2), although when the fatty acid level between
GEN2 and GEN3 was significantly different, GEN1 profile showed a content of fatty acids
intermediate to those genotypes. However, the differences found in the fatty acid composition of IMF
between reciprocal crosses (GEN1 vs. GEN2) decreased in NL fraction. The similar percentages of
SFA, MUFA and PUFA between these genotype found in this lipid fraction suggest that differences in
the IMF fatty acid composition between reciprocal crosses could be due to the different of IMF level,
since GEN1 had a lower IMF content in comparison with GEN2 (Ramírez et al., submitted). The
higher IMF content could give a higher content of triacylglycerides, and as a result, a relative
decrease in the phospholipids content (Leseigneur-Meynier and Gandemer, 1991) since PUFA,
which are mostly located in the membrane, are relatively constant in the cell membranes. On the other hand, the Duroc sire line (DU1 or DU2) significantly affected the fatty acid composition
of IMF and NL fraction since the meat from GEN3 had more PUFA and less SFA. These results
could indicate that the differences between genotypes in IMF and NL were due to a different
adipogenic potential, which could increase “de novo” fatty acids synthesis in GEN1 and GEN2 and as
a consequence their level in NL fraction. Endogenous synthesis of fatty acids comes from acetyl CoA
and malonil CoA molecules to produce palmitic acid (C16:0), from which can be synthesized stearic
acid (C18:0) by elongation, so a higher level of SFA is expected in genotypes with more adipogenic
nature. Higher lipogenic enzyme activity has been reported (Ramírez et al., submitted) in GEN1 and
GEN2 than in GEN3, which is accord with these results. On the other hand, one of the possible
consequences of a high PUFA percentage in meat is the reduction of the shelf life of meat, since
PUFA are extremely sensitive to oxidation, leading to meat texture, flavour and colour alterations
(Morrissey et al., 1998).
After storage, a marked reduction of PUFA of IMF and NL from GEN3 was found and no differences
between genotypes were found after storage in PUFA contents. These results could be caused by
initial differences in the fatty acid composition which could affect the oxidation of PUFA during
storage as well as by differences in the hydrolysis of triacylglycerides because of a different lipolytic
enzyme activity, which could be more intense in GEN3. In this sense, several authors have reported
important differences in muscle lipolytic activities due to the pig genotype (Toldrá et al., 1996; Rosell
and Toldrá 1998; Hernández et al., 2004; Cava et al., 2004).
108

Tabl
e 4.
- Evo
lutio
n of
fatty
aci
d co
mpo
sitio
n of
pol
ar li
pids
from
intra
mus
cula
r fat
(g/1
00g
FA) o
f m. L
. dor
si a
nd B
. fem
oris
dur
ing
10 d
ays
of re
frige
rate
d st
orag
e.
day
0
day
10
G
enot
ype
Sex
Pr
obab
ilitie
s
Gen
otyp
e Se
x
Prob
abili
ties
G
EN
1 G
EN
2 G
EN
3 ♂
♀
se
mge
nse
xin
ter
G
EN
1 G
EN
2 G
EN
3 ♂
♀
se
mge
nse
x in
ter
Long
issi
mus
dor
si
C
12:0
0.
11
0.10
0.
08
0.10
0.
10
0.01
ns
ns
*
0.09
0.
07
0.12
0.
09
0.10
0.
01ns
ns
ns
C
14:0
0.
11a
0.12
a 0.
06b
0.10
0.
09
0.01
**
ns
*
0.09
0.
15
0.13
0.
14
0.10
0.
02ns
ns
ns
C
16:0
12
.23
11.0
5 10
.87
11.3
5 11
.35
0.27
ns
ns
ns
12
.44
12.3
9 12
.89
12.4
4 12
.70
0.30
ns
ns
ns
C16
:1 n
-7
0.65
0.
68
0.55
0.
64
0.62
0.
03ns
ns
ns
0.60
0.
62
0.70
0.
67
0.62
0.
03ns
ns
ns
C
17:0
0.
81
0.81
0.
65
0.70
0.
80
0.04
ns
ns
ns
0.
34
0.28
0.
31
0.30
0.
32
0.01
ns
ns
ns
C18
:0
11.6
5b
13.6
4a
13.3
8a
13.2
8 12
.60
0.23
***
ns
ns
14
.32
14.1
6 15
.17
14.4
4 14
.68
0.21
ns
ns
ns
C18
:1 n
-9
14.8
5 14
.52
14.9
4 15
.02
14.5
3 0.
54ns
ns
ns
17.7
8 16
.12
16.7
3 17
.46
16.2
7 0.
38ns
ns
ns
C
18:2
n-6
36
.81
35.1
0 34
.23
35.1
0 35
.55
0.44
ns
ns
ns
34
.38a
34
.76a
32
.27b
34
.17
33.4
2 0.
39**
ns
ns
C
18:3
n-6
0.
55a
0.55
a 0.
45b
0.50
0.
53
0.02
* ns
ns
0.72
0.
98
0.97
0.
70
1.09
0.
09ns
*
ns
C20
:0
0.04
0.
10
0.13
0.
13
0.05
0.
02ns
ns
ns
0.10
0.
16
0.11
0.
07
0.18
0.
02ns
*
ns
C20
:1n-
9 0.
52
0.42
0.
47
0.57
0.
37
0.07
ns
ns
ns
0.
38a
0.31
ab
0.28
b 0.
32
0.33
0.
02*
ns
ns
C20
:2 n
-6
0.57
0.
53
0.48
0.
53
0.52
0.
03ns
ns
ns
0.55
0.
53
0.52
0.
52
0.54
0.
01ns
ns
ns
C
20:4
n-6
16
.40b
17
.84b
18
.98a
17
.49
18.0
6 0.
30**
* ns
ns
15.2
8 16
.38
16.7
9 15
.79
16.5
4 0.
30ns
ns
ns
C
20:5
n-3
0.
44
0.47
0.
40
0.40
0.
47
0.02
ns
ns
ns
0.
54
0.62
0.
49
0.52
0.
59
0.04
ns
ns
ns
C22
:2 n
-6
0.10
0.
08
0.26
0.
24
0.07
0.
08ns
ns
ns
nd
nd
nd
nd
nd
C22
:4 n
-6
2.39
2.
46
2.35
2.
36
2.44
0.
08ns
ns
ns
2.39
2.
44
2.52
2.
37
2.53
0.
04ns
ns
ns
SF
A 24
.94
25.8
1 25
.17
25.6
6 25
.00
0.24
ns
ns
ns
27
.37
27.2
3 28
.73
27.4
8 28
.08
0.44
ns
ns
ns
MU
FA
16.0
2 15
.63
15.9
6 16
.24
15.5
2 0.
56ns
ns
ns
18.7
7 17
.05
17.7
1 18
.45
17.2
2 0.
40ns
ns
ns
PU
FA
57.2
6 57
.03
57.1
6 56
.62
57.6
4 0.
51ns
ns
ns
53.8
6 55
.72
53.5
6 54
.07
54.7
1 0.
52ns
ns
ns
C
ontin
ue n
ext p
age

Tabl
e 4.
- Evo
lutio
n of
fatty
aci
d co
mpo
sitio
n of
pol
ar li
pids
from
intra
mus
cula
r fat
(g/1
00g
FA) o
f m. L
. dor
si a
nd B
. fem
oris
dur
ing
10 d
ays
of re
frige
rate
d st
orag
e.
day
0
day
10
G
enot
ype
Sex
Pr
obab
ilitie
s
Gen
otyp
e Se
x
Prob
abili
ties
G
EN
1 G
EN
2 G
EN
3 ♂
♀
se
mge
nse
xin
ter
G
EN
1 G
EN
2 G
EN
3 ♂
♀
se
mge
nse
x in
ter
Con
t.
Bic
eps
fem
oris
C12
:0
0.07
b 0.
09a
0.08
ab
0.08
0.
07
0.00
* ns
ns
0.13
0.
12
0.14
0.
13
0.14
0.
00ns
ns
*
C14
:0
0.05
0.
06
0.07
0.
05
0.07
0.
01ns
ns
ns
0.14
a 0.
11ab
0.
09b
0.12
0.
11
0.01
* ns
ns
C
16:0
11
.56
10.9
6 11
.01
11.3
8 10
.97
0.21
ns
ns
ns
12
.21a
11
.51a
b10
.85b
11
.59
11.4
1 0.
19*
ns
ns
C16
:1 n
-7
0.60
0.
57
0.66
0.
63
0.59
0.
03ns
ns
ns
0.63
ab
0.73
a 0.
60b
0.65
0.
65
0.02
* ns
ns
C
17:0
0.
57
0.49
0.
59
0.54
0.
56
0.02
ns
ns
ns
0.
35
0.33
0.
32
0.32
0.
35
0.01
ns
ns
ns
C18
:0
14.5
3b
15.9
8a
16.5
0a
15.5
8 15
.83
0.21
***
ns
ns
17
.08a
b 16
.58b
17
.55a
17
.19
16.9
5 0.
15*
ns
ns
C18
:1 n
-9
16.5
8 16
.61
15.6
9 16
.40
16.1
7 0.
29ns
ns
ns
18.5
2a
18.5
0a
16.7
9b
17.7
9 18
.03
0.30
* ns
ns
C
18:2
n-6
33
.66a
32
.05a
30
.97b
32
.17
32.1
8 0.
30**
* ns
ns
29.9
9 30
.62
29.8
1 29
.83
30.4
4 0.
17ns
ns
ns
C
18:3
n-6
0.
40a
0.36
ab
0.28
b 0.
33
0.37
0.
02**
ns
ns
0.42
b 0.
52a
0.38
b 0.
43
0.45
0.
02**
* ns
ns
C
20:0
0.
08
0.40
0.
38
0.27
0.
32
0.06
* ns
ns
0.03
0.
06
0.04
0.
05
0.04
0.
01ns
ns
ns
C
20:1
n-9
0.38
b 0.
43ab
0.
56a
0.45
0.
47
0.03
* ns
ns
0.37
0.
35
0.35
0.
36
0.36
0.
02ns
ns
ns
C
20:2
n-6
0.
67
0.58
0.
57
0.59
0.
62
0.02
ns
ns
ns
0.
61a
0.52
b 0.
57a
0.57
0.
55
0.01
***
ns
ns
C20
:4 n
-6
16.7
6b
17.2
6ab
18.5
9a
17.3
5 17
.76
0.25
**
ns
ns
17
.40b
17
.87b
19
.23a
18
.46
17.9
5 0.
22**
* ns
ns
C
20:5
n-3
0.
51a
0.43
b 0.
50a
0.48
0.
48
0.01
**
ns
ns
0.
46
0.52
0.
53
0.51
0.
50
0.01
ns
ns
ns
C22
:2 n
-6
0.00
b 0.
21a
0.26
a 0.
13
0.20
0.
03**
* ns
ns
0.00
0.
25
0.00
0.
16
0.02
0.
07ns
ns
ns
C
22:4
n-6
2.
15
2.10
1.
96
2.03
2.
10
0.07
ns
ns
ns
2.
23
1.80
2.
32
2.09
2.
13
0.10
ns
ns
ns
SFA
26.8
5 27
.99
28.6
3 27
.90
27.8
2 0.
29ns
ns
ns
29.9
4 28
.70
28.8
6 29
.30
28.9
9 0.
22ns
ns
ns
M
UFA
17
.55
17.6
1 16
.90
17.4
8 17
.22
0.29
ns
ns
ns
19
.53
19.5
8 18
.14
19.0
9 19
.05
0.26
ns
ns
ns
PUFA
54
.15
53.0
0 53
.12
53.0
7 53
.71
0.33
ns
ns
ns
51
.11
52.0
8 52
.62
51.8
8 52
.05
0.26
ns
ns
ns
GE
N: g
enot
ype.
GE
N1:
IB x
DU
1; G
EN
2: D
U1x
IB; G
EN
3: D
U2
x IB
. LD
: Lon
giss
imus
dor
si. B
F: B
icep
s fe
mor
is. S
FA: s
atur
ated
fatty
aci
ds, M
UFA
: mon
ouns
atur
ated
fatty
aci
ds, P
UFA
: pol
yuns
atur
ated
fatty
aci
ds.
sem
: sta
ndar
d er
ror m
ean.
gen
: gen
otyp
e; in
ter:
inte
ract
ion
geno
type
x s
ex
ns: n
ot s
igni
fican
t, *
p<0.
05, *
* p
<0.0
1, *
**p<
0.00
1. a
,b: D
iffer
ent l
ette
rs in
the
sam
e ro
w in
dica
te s
igni
fican
t sta
tistic
al d
iffer
ence
s w
ithin
the
sam
e da
y of
ana
lysi
s (T
ukey
’s te
st, p
<0.0
5).
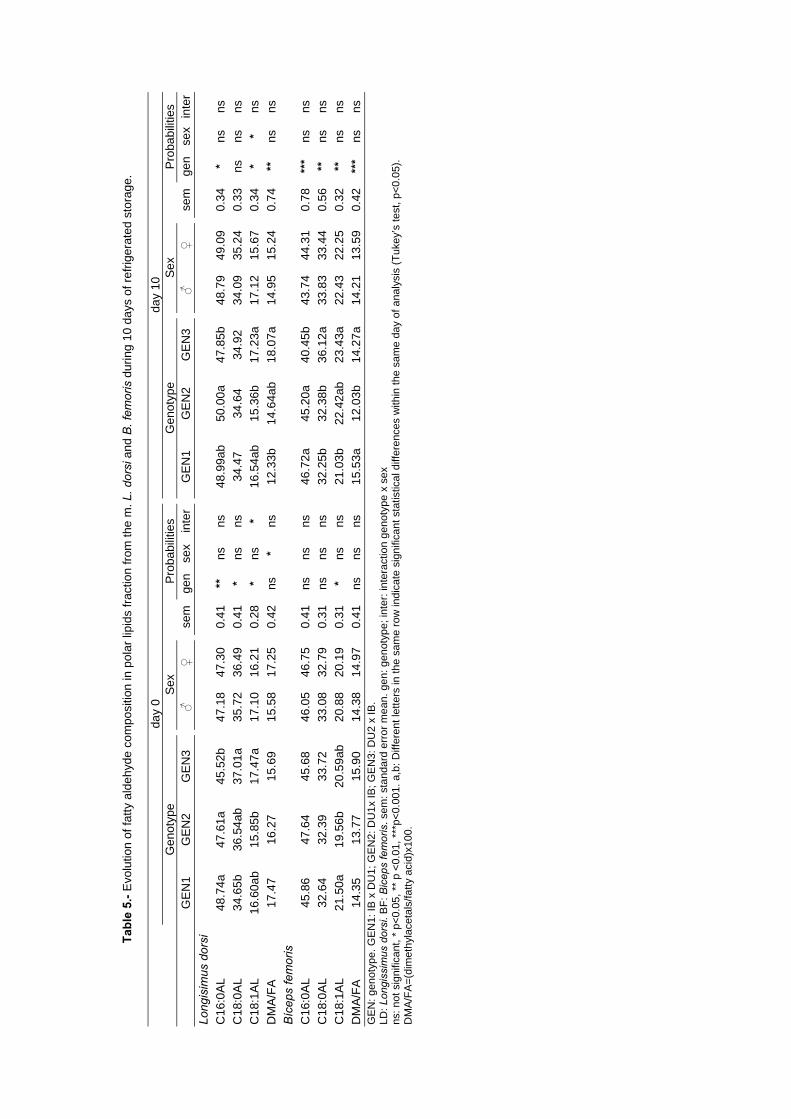
Ta
ble
5.- E
volu
tion
of fa
tty a
ldeh
yde
com
posi
tion
in p
olar
lipi
ds fr
actio
n fro
m th
e m
. L. d
orsi
and
B. f
emor
is d
urin
g 10
day
s of
refri
gera
ted
stor
age.
da
y 0
da
y 10
Gen
otyp
e Se
x
Prob
abili
ties
G
enot
ype
Sex
Pr
obab
ilitie
s
GE
N1
GE
N2
GE
N3
♂
♀
sem
gen
sex
inte
r
GE
N1
GE
N2
GE
N3
♂
♀
sem
gen
sex
inte
r Lo
ngis
imus
dor
si
C
16:0
AL
48.7
4a
47.6
1a
45.5
2b
47.1
8 47
.30
0.41
**
ns
ns
48
.99a
b 50
.00a
47
.85b
48
.79
49.0
9 0.
34*
ns
ns
C18
:0A
L 34
.65b
36
.54a
b 37
.01a
35
.72
36.4
9 0.
41*
ns
ns
34
.47
34.6
4 34
.92
34.0
9 35
.24
0.33
ns
ns
ns
C18
:1A
L 16
.60a
b 15
.85b
17
.47a
17
.10
16.2
1 0.
28*
ns
*
16.5
4ab
15.3
6b
17.2
3a
17.1
2 15
.67
0.34
* *
ns
DM
A/FA
17
.47
16.2
7 15
.69
15.5
8 17
.25
0.42
ns
* ns
12.3
3b
14.6
4ab
18.0
7a
14.9
5 15
.24
0.74
**
ns
ns
Bíc
eps
fem
oris
C16
:0A
L 45
.86
47.6
4 45
.68
46.0
5 46
.75
0.41
ns
ns
ns
46
.72a
45
.20a
40
.45b
43
.74
44.3
1 0.
78**
* ns
ns
C
18:0
AL
32.6
4 32
.39
33.7
2 33
.08
32.7
9 0.
31ns
ns
ns
32.2
5b
32.3
8b
36.1
2a
33.8
3 33
.44
0.56
**
ns
ns
C18
:1A
L 21
.50a
19
.56b
20
.59a
b 20
.88
20.1
9 0.
31*
ns
ns
21
.03b
22
.42a
b 23
.43a
22
.43
22.2
5 0.
32**
ns
ns
D
MA/
FA
14.3
5 13
.77
15.9
0 14
.38
14.9
7 0.
41ns
ns
ns
15.5
3a
12.0
3b
14.2
7a
14.2
1 13
.59
0.42
***
ns
ns
GE
N: g
enot
ype.
GE
N1:
IB x
DU
1; G
EN
2: D
U1x
IB; G
EN
3: D
U2
x IB
. LD
: Lon
giss
imus
dor
si. B
F: B
icep
s fe
mor
is. s
em: s
tand
ard
erro
r mea
n. g
en: g
enot
ype;
inte
r: in
tera
ctio
n ge
noty
pe x
sex
ns
: not
sig
nific
ant,
* p<
0.05
, **
p <0
.01,
***
p<0.
001.
a,b
: Diff
eren
t let
ters
in th
e sa
me
row
indi
cate
sig
nific
ant s
tatis
tical
diff
eren
ces
with
in th
e sa
me
day
of a
naly
sis
(Tuk
ey’s
test
, p<0
.05)
. D
MA
/FA
=(di
met
hyla
ceta
ls/fa
tty a
cid)
x100
.
Chapter IV. Changes in fatty acids during storage
Fatty acid composition of PL influences the oxidative stability of meat, since a high proportion of
PUFA increases the susceptibility to oxidation (Wood et al., 2004). However, no differences were
found in the sum of SFA, MUFA and PUFA either before or after storage. Changes in the specific
content of some fatty acids in PL may not have affected IMF FA evolution in comparison with
changes in NL fraction which has very high proportions in comparison with PL fraction due to the
high level of fatness of pigs (IMF content: 3.5-6 % in LD, 3-3.7% in BF).
DMA profile is in agreement with previous studies (Estévez and Cava, 2004; Morcuende et al.,
2003). Our results showed that the genotype affected the DMA profile in BF and LD. Estévez and
Cava (2004) reported important differences in the levels of the different fatty aldehydes, which could
be associated to differences in the plasmalogen synthesis because of genetic or breeding factors.
Singh et al., (1993) reported dihydroxyacetone phosphate acyltransferase is the enzyme involved in
the first step of plasmalogens biosynthesis, however, the regulation of the enzymes related to
plasmalogens synthesis or degradation is not well known. Reciprocal crosses (GEN1 and GEN2) had
similar profiles of plasmalogens, while important differences were found between GEN2 and GEN3
because of the differences in the Duroc sire line (DU1 vs. DU2). Estévez and Cava (2004) found
higher percentages of n-hexadecanal in Iberian pigs than in industrial ones, which agree with the
results found in the present study, in which GEN2 showed the highest level of hexadecanal while
GEN3, which come from a Duroc selected line (DU2), showed the highest percentages of
octadecanal and octadecenal. Plasmalogens are a special subclass of glycerophospholipids
distinguished by their vinyl–ether bonds at the sn-1 position of the glycerol backbone. These authors
(Estévez and Cava, 2004) have previously suggested that they could play an important role on the
oxidative stability of meat during the refrigerated storage. The ratio DMA/FA ranged from 15.69 to
17.47% in LD and from 13.77 to 15.90% in BF, which is lower than those reported by Morcuende et
al., (2003) and Estévez and Cava (2004). Differences could probably be due to the higher IMF
content of the pigs in the present study. The increases in the ratio DMA/FA from PL during storage
could be caused by the release of FA while the level of DMA remains constant because of their
resistance to lipolysis. As other authors have previously reported (Estévez and Cava, 2004;
Morcuende et al., 2003), the increase of this ratio can be explained by the resistance of the ether
links between glycerol and fatty aldehydes to lipases, which increases the relative proportion of fatty
aldehyde while the amount of fatty acids linked to glycerol molecule decreases. The lowest ratio
DMA/FA after storage in GEN2 could indicate a less intense lipolysis in PL from this genotype. In this
respect, Estévez and Cava (2004) found differences in the ratio DMA/FA between meat from
commercial pigs and Iberian pig during storage, being higher in the former than in the latter. On the
other hand, plasmalogens act in vivo protecting cells against oxidative stress (Engelmann, 2004),
since their vinyl–ether bond is preferentially oxidized, which protects PUFA at the sn-2 position from
oxidation. This antioxidant activity could continue postmortem according to Estévez and Cava (2004),
who reported lower oxidation levels in meat with higher fatty aldehyde proportions in its PLs.
112
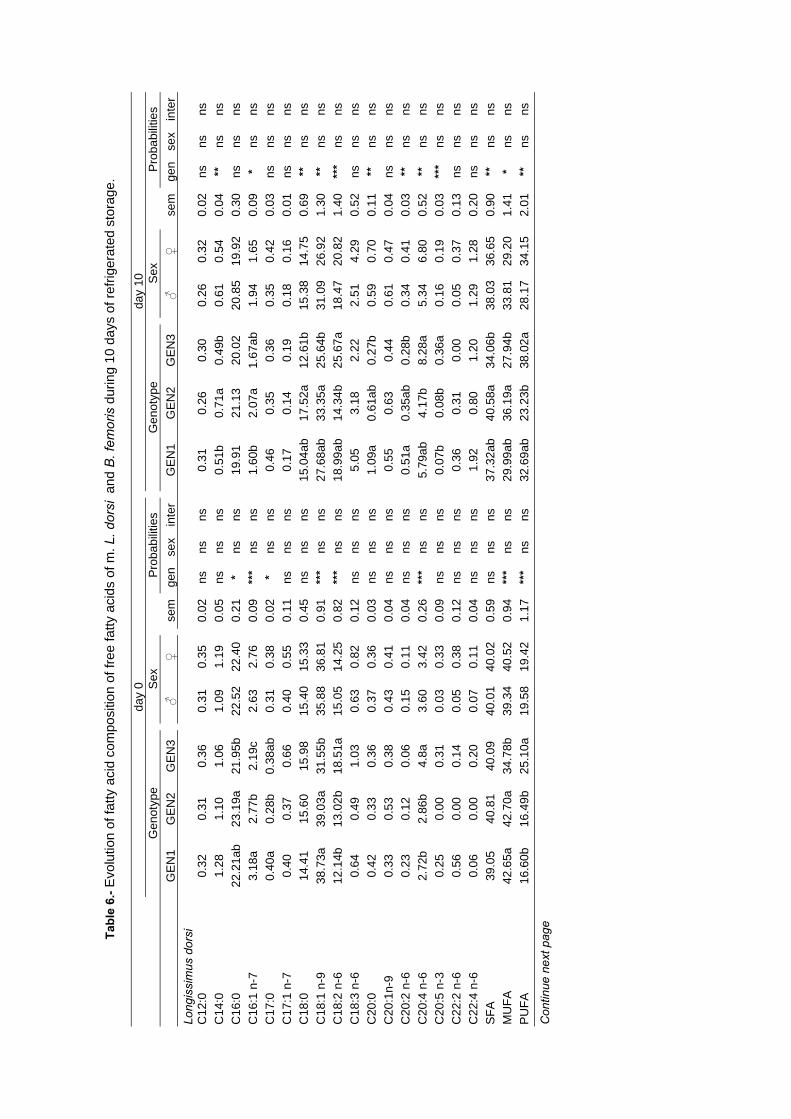
Tabl
e 6.
- Evo
lutio
n of
fatty
aci
d co
mpo
sitio
n of
free
fatty
aci
ds o
f m. L
. dor
si a
nd B
. fem
oris
dur
ing
10 d
ays
of re
frige
rate
d st
orag
e.
day
0
day
10
G
enot
ype
Sex
Pr
obab
ilitie
s
Gen
otyp
e Se
x
Prob
abili
ties
G
EN
1 G
EN
2 G
EN
3 ♂
♀
se
mge
nse
xin
ter
G
EN
1 G
EN
2 G
EN
3 ♂
♀
se
mge
nse
x in
ter
Long
issi
mus
dor
si
C
12:0
0.
32
0.31
0.
36
0.31
0.
35
0.02
ns
ns
ns
0.
31
0.26
0.
30
0.26
0.
32
0.02
ns
ns
ns
C14
:0
1.28
1.
10
1.06
1.
09
1.19
0.
05ns
ns
ns
0.51
b 0.
71a
0.49
b 0.
61
0.54
0.
04**
ns
ns
C
16:0
22
.21a
b 23
.19a
21
.95b
22
.52
22.4
0 0.
21*
ns
ns
19
.91
21.1
3 20
.02
20.8
5 19
.92
0.30
ns
ns
ns
C16
:1 n
-7
3.18
a 2.
77b
2.19
c 2.
63
2.76
0.
09**
* ns
ns
1.60
b 2.
07a
1.67
ab
1.94
1.
65
0.09
* ns
ns
C
17:0
0.
40a
0.28
b 0.
38ab
0.
31
0.38
0.
02*
ns
ns
0.
46
0.35
0.
36
0.35
0.
42
0.03
ns
ns
ns
C17
:1 n
-7
0.40
0.
37
0.66
0.
40
0.55
0.
11ns
ns
ns
0.17
0.
14
0.19
0.
18
0.16
0.
01ns
ns
ns
C
18:0
14
.41
15.6
0 15
.98
15.4
0 15
.33
0.45
ns
ns
ns
15
.04a
b 17
.52a
12
.61b
15
.38
14.7
5 0.
69**
ns
ns
C
18:1
n-9
38
.73a
39
.03a
31
.55b
35
.88
36.8
1 0.
91**
* ns
ns
27.6
8ab
33.3
5a
25.6
4b
31.0
9 26
.92
1.30
**
ns
ns
C18
:2 n
-6
12.1
4b
13.0
2b
18.5
1a
15.0
5 14
.25
0.82
***
ns
ns
18
.99a
b 14
.34b
25
.67a
18
.47
20.8
2 1.
40**
* ns
ns
C
18:3
n-6
0.
64
0.49
1.
03
0.63
0.
82
0.12
ns
ns
ns
5.
05
3.18
2.
22
2.51
4.
29
0.52
ns
ns
ns
C20
:0
0.42
0.
33
0.36
0.
37
0.36
0.
03ns
ns
ns
1.09
a 0.
61ab
0.
27b
0.59
0.
70
0.11
**
ns
ns
C20
:1n-
9 0.
33
0.53
0.
38
0.43
0.
41
0.04
ns
ns
ns
0.
55
0.63
0.
44
0.61
0.
47
0.04
ns
ns
ns
C20
:2 n
-6
0.23
0.
12
0.06
0.
15
0.11
0.
04ns
ns
ns
0.51
a 0.
35ab
0.
28b
0.34
0.
41
0.03
**
ns
ns
C20
:4 n
-6
2.72
b 2.
86b
4.8a
3.
60
3.42
0.
26**
* ns
ns
5.79
ab
4.17
b 8.
28a
5.34
6.
80
0.52
**
ns
ns
C20
:5 n
-3
0.25
0.
00
0.31
0.
03
0.33
0.
09ns
ns
ns
0.07
b 0.
08b
0.36
a 0.
16
0.19
0.
03**
* ns
ns
C
22:2
n-6
0.
56
0.00
0.
14
0.05
0.
38
0.12
ns
ns
ns
0.
36
0.31
0.
00
0.05
0.
37
0.13
ns
ns
ns
C22
:4 n
-6
0.06
0.
00
0.20
0.
07
0.11
0.
04ns
ns
ns
1.92
0.
80
1.20
1.
29
1.28
0.
20ns
ns
ns
SF
A 39
.05
40.8
1 40
.09
40.0
1 40
.02
0.59
ns
ns
ns
37
.32a
b 40
.58a
34
.06b
38
.03
36.6
5 0.
90**
ns
ns
M
UFA
42
.65a
42
.70a
34
.78b
39
.34
40.5
2 0.
94**
* ns
ns
29.9
9ab
36.1
9a
27.9
4b
33.8
1 29
.20
1.41
* ns
ns
PU
FA
16.6
0b
16.4
9b
25.1
0a
19.5
8 19
.42
1.17
***
ns
ns
32
.69a
b 23
.23b
38
.02a
28
.17
34.1
5 2.
01**
ns
ns
Con
tinue
nex
t pag
e
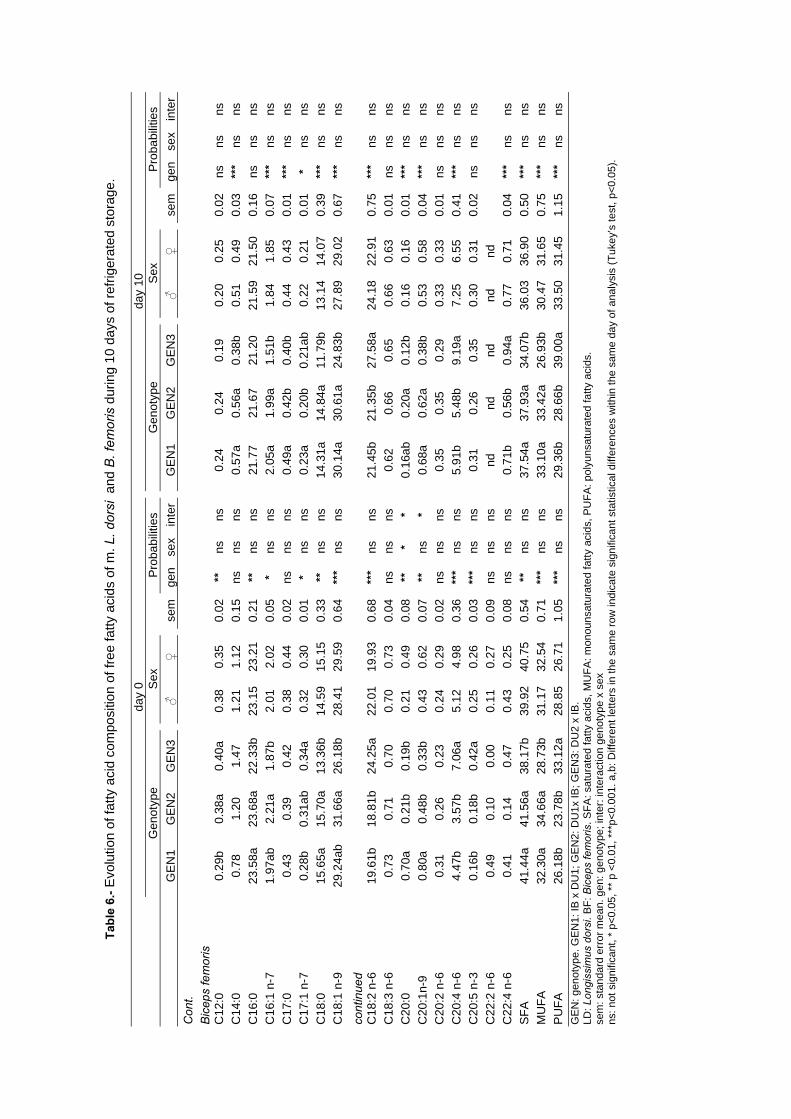
Tabl
e 6.
- Evo
lutio
n of
fatty
aci
d co
mpo
sitio
n of
free
fatty
aci
ds o
f m. L
. dor
si a
nd B
. fem
oris
dur
ing
10 d
ays
of re
frige
rate
d st
orag
e.
day
0
day
10
G
enot
ype
Sex
Pr
obab
ilitie
s
Gen
otyp
e Se
x
Prob
abili
ties
G
EN
1 G
EN
2 G
EN
3 ♂
♀
se
mge
nse
xin
ter
G
EN
1 G
EN
2 G
EN
3 ♂
♀
se
mge
nse
x in
ter
Con
t.
Bic
eps
fem
oris
C12
:0
0.29
b 0.
38a
0.40
a 0.
38
0.35
0.
02**
ns
ns
0.24
0.
24
0.19
0.
20
0.25
0.
02ns
ns
ns
C
14:0
0.
78
1.20
1.
47
1.21
1.
12
0.15
ns
ns
ns
0.
57a
0.56
a 0.
38b
0.51
0.
49
0.03
***
ns
ns
C16
:0
23.5
8a
23.6
8a
22.3
3b
23.1
5 23
.21
0.21
**
ns
ns
21
.77
21.6
7 21
.20
21.5
9 21
.50
0.16
ns
ns
ns
C16
:1 n
-7
1.97
ab
2.21
a 1.
87b
2.01
2.
02
0.05
* ns
ns
2.05
a 1.
99a
1.51
b 1.
84
1.85
0.
07**
* ns
ns
C
17:0
0.
43
0.39
0.
42
0.38
0.
44
0.02
ns
ns
ns
0.
49a
0.42
b 0.
40b
0.44
0.
43
0.01
***
ns
ns
C17
:1 n
-7
0.28
b 0.
31ab
0.
34a
0.32
0.
30
0.01
* ns
ns
0.23
a 0.
20b
0.21
ab
0.22
0.
21
0.01
* ns
ns
C
18:0
15
.65a
15
.70a
13
.36b
14
.59
15.1
5 0.
33**
ns
ns
14.3
1a
14.8
4a
11.7
9b
13.1
4 14
.07
0.39
***
ns
ns
C18
:1 n
-9
29.2
4ab
31.6
6a
26.1
8b
28.4
1 29
.59
0.64
***
ns
ns
30
.14a
30
.61a
24
.83b
27
.89
29.0
2 0.
67**
* ns
ns
cont
inue
d
C18
:2 n
-6
19.6
1b
18.8
1b
24.2
5a
22.0
1 19
.93
0.68
***
ns
ns
21
.45b
21
.35b
27
.58a
24
.18
22.9
1 0.
75**
* ns
ns
C
18:3
n-6
0.
73
0.71
0.
70
0.70
0.
73
0.04
ns
ns
ns
0.
62
0.66
0.
65
0.66
0.
63
0.01
ns
ns
ns
C20
:0
0.70
a 0.
21b
0.19
b 0.
21
0.49
0.
08**
*
*
0.16
ab
0.20
a 0.
12b
0.16
0.
16
0.01
***
ns
ns
C20
:1n-
9 0.
80a
0.48
b 0.
33b
0.43
0.
62
0.07
**
ns
*
0.68
a 0.
62a
0.38
b 0.
53
0.58
0.
04**
* ns
ns
C
20:2
n-6
0.
31
0.26
0.
23
0.24
0.
29
0.02
ns
ns
ns
0.
35
0.35
0.
29
0.33
0.
33
0.01
ns
ns
ns
C20
:4 n
-6
4.47
b 3.
57b
7.06
a 5.
12
4.98
0.
36**
* ns
ns
5.91
b 5.
48b
9.19
a 7.
25
6.55
0.
41**
* ns
ns
C
20:5
n-3
0.
16b
0.18
b 0.
42a
0.25
0.
26
0.03
***
ns
ns
0.
31
0.26
0.
35
0.30
0.
31
0.02
ns
ns
ns
C22
:2 n
-6
0.49
0.
10
0.00
0.
11
0.27
0.
09ns
ns
ns
nd
nd
nd
nd
nd
C22
:4 n
-6
0.41
0.
14
0.47
0.
43
0.25
0.
08ns
ns
ns
0.71
b 0.
56b
0.94
a 0.
77
0.71
0.
04**
* ns
ns
SF
A 41
.44a
41
.56a
38
.17b
39
.92
40.7
5 0.
54**
ns
ns
37.5
4a
37.9
3a
34.0
7b
36.0
3 36
.90
0.50
***
ns
ns
MU
FA
32.3
0a
34.6
6a
28.7
3b
31.1
7 32
.54
0.71
***
ns
ns
33
.10a
33
.42a
26
.93b
30
.47
31.6
5 0.
75**
* ns
ns
PU
FA
26.1
8b
23.7
8b
33.1
2a
28.8
5 26
.71
1.05
***
ns
ns
29
.36b
28
.66b
39
.00a
33
.50
31.4
5 1.
15**
* ns
ns
G
EN
: gen
otyp
e. G
EN
1: IB
x D
U1;
GE
N2:
DU
1x IB
; GE
N3:
DU
2 x
IB.
LD: L
ongi
ssim
us d
orsi
. BF:
Bic
eps
fem
oris
. SFA
: sat
urat
ed fa
tty a
cids
, MU
FA: m
onou
nsat
urat
ed fa
tty a
cids
, PU
FA: p
olyu
nsat
urat
ed fa
tty a
cids
. se
m: s
tand
ard
erro
r mea
n. g
en: g
enot
ype;
inte
r: in
tera
ctio
n ge
noty
pe x
sex
ns
: not
sig
nific
ant,
* p<
0.05
, **
p <0
.01,
***
p<0.
001.
a,b
: Diff
eren
t let
ters
in th
e sa
me
row
indi
cate
sig
nific
ant s
tatis
tical
diff
eren
ces
with
in th
e sa
me
day
of a
naly
sis
(Tuk
ey’s
test
, p<0
.05)
.

Chapter IV. Changes in fatty acids during storage
PUFA proportions in FFA increased at day 10 of storage; especially long chain PUFA, agreeing with
previous studies (Alasnier et al., 2000; Morcuende et al., 2003). Muscle lipolytic enzymes are
responsible for the hydrolysis of the lipids, releasing FFA during meat storage. Some authors (Rosell
and Toldrá, 1998) have reported higher phospholipase activity in selected than in no selected
genotypes. The highest increase of PUFA free fatty acids was found in GEN3, being most of them
long chain PUFA. Differences in the fatty acid composition of FFA fraction could result in a different
concentration of substrates for the oxidative reactions, which could decrease meat stability during
storage. In a previous study (Ramírez and Cava, submitted), we found lower oxidative and colour
stability in meat from GEN3, in comparison with GEN1 and GEN2.
Lipolysis was the cause of the changes in the fatty acid profiles of PL and NL and the release of FFA.
The lack of differences in SFA, MUFA and PUFA in PL of refrigerated muscles suggests that lipolysis
was similar in the 3 genotypes. However, the increase of the long chain PUFA in FFA and the
concomitant decrease in PL suggest a greater hydrolysis of some fatty acids of PL fraction, which
could not modify the sum of PUFA after the storage. It is also possible that NL fraction had
contributed importantly to the increase of PUFA in FFA fraction after storage, as PUFA in NL were
significantly higher in GEN3 than in the other genotypes and they were reduced after storage.
Therefore, small reductions of the relative proportion of some PUFA in this fraction could produce
consequently important increases in the FFA.
CONCLUSIONS The evolution of the fatty acid composition during the storage of the meat was affected by the pig
genotype. Reciprocal cross did not show important differences in the changes of fatty acids after
refrigerated storage of LD and BF. However, the Duroc sire line significantly affected the fatty acid
profile of IMF and lipid fractions since important differences were found between GEN2 and GEN3.
The use of Duroc selected genotypes (DU2) in the crossbreeding with Iberian pigs could reduce the
shelf life of meat during refrigerated storage, due to this meat showed some characteristics before
storage, which could make meat more prone to suffer oxidation processes, such as (1) the highest
level of PUFA in IMF and lipid fractions and (2) the lowest rate of plasmalogens in PL fraction. On the
other hand, GEN3 showed some signs of deterioration of the meat during the storage, such as (3)
the large increase of long chain PUFA in FFA and (4) the highest increase in the ratio DMA/FA after
the refrigerated storage. These factors could make the meat from GEN3 especially susceptible to
suffer oxidation processes during the storage, which could favour the appearance of rancid flavours
after cooking or during the manufacture process of dry cured meat products.
ACKNOWLEDGEMENTS This work has been financed thanks to the Consejería de Educación, Ciencia y Tecnología de la
Junta de Extremadura: Project 2PR02B018. M. Rosario Ramírez wants to thank the Ministerio
Educación Ciencia for her grant (FPU).
115
Chapter IV. Changes in fatty acids during storage
BIBLIOGRAPHY Alasnier C., David-Briand E., and Gandemer G.
(2000). Lipolysis in muscles during refrigerated storage as related to the metabolic type of the fibres in the rabbit. Meat Science, 54: 127-134.
Antequera, T., García, C., López, C., Ventanas, J., Asensio, M. A., and Cordoba, J. J. (1994). Evolution of different physical-chemical parameters during ripening Iberian ham from Iberian (100%) and Iberian x Duroc pigs (50%). Revista Española de Ciencia y Tecnología de Alimentos, 34: 178-190.
B.O.E., 15 de Octubre del 2001. Real Decreto 1083/2001, de 5 de Octubre, por el que se aprueba la Norma de Calidad para el jamón ibérico, paleta ibérica y caña de lomo ibérico elaborados en España.
Bligh E. G., and Dyer WJ. (1959). A rapid method of total lipid extraction and purification. Canadian Journal of Biochemical Physiology, 37: 911–917.
Cava R., Ruiz J., Ventanas J., and Antequera T. (1999). Effect of alpha-tocopheryl acetate supplementation and the extensive feeding of pigs on the volatile aldehydes during the maturation of Iberian ham. Food Science and Technology International, 5: 235-241.
Cava R., Ferrer J.M., Estévez M., Morcuende D., and Toldrá F. (2004). Composition and proteolytic and lipolytic enzyme activities in muscle Longissimus dorsi from Iberian pigs and industrial genotype pigs. Food Chemistry, 88: 25–33
Cilla I., Altarriba J., Guerrero L., Gispert M., Martínez L., Moreno C., Beltrán J.A., Guàrdia M.D., Diestre A., Arnau J., and Roncalés P. (2006). Effect of different Duroc line sires on carcass composition, meat quality and dry-cured ham acceptability. Meat Science, 72: 2, 252-260.
Dobao M. T., Garcı́a J. L., De Pedro E., Rodrigáñez J., and Silió L. (1986). Efectos del ejercicio y tipos de cebo sobre las características de canal de cerdos Ibéricos. In Proceedings 9th Congress International Pig Veterinary Society (406–420), Barcelona, Spain.
Engelmann B. (2004). Plasmalogens: targets for oxidants and major lipophilic antioxidants, Biochem. Soc. Trans. 32: 147–150.
Estévez M., and Cava R. (2004). Plasmalogens in pork: aldehyde composition and changes in aldehyde profile during refrigerated storage or raw and cooked meat. Food Chemistry 85: 1-6.
Gray J. I., Gomaa E. A., and Buckley D. J. (1996). Oxidative quality and Shelf life of meats. Meat Science, 43: S111–S123.
Hernández P., Zomeño L., Ariño B., Blasco A. (2004). Antioxidant, lipolytic and proteolytic enzyme activities in pork meat from different genotypes. Meat Science, 66: 3, 525-529
Kanner, J. (1994). Oxidative processes in meat and meat products: quality implications. Meat Science, 36: 169–189.
Lonergan, S. M., Huff-Lonergan, E., Rowe, L.J., Kuhlers, D. L., and Jungst, S.B. (2001). Selection for lean growth efficiency in Duroc pigs influences pork quality. Journal of Animal Science. 79: 2075-2085
Leseigneur-Meynier, A. and Gandemer, G. (1991) Lipid composition of pork muscle in relation to the metabolic type of the fibres. Meat Science, 29: (3), 229-241.
López-Bote C.J. (1998). Sustained utilisation of the Iberian pig breed. Meat Science, 49: Suppl. I, Sl7-S27.
Monin, G., Hortós, M., Díaz, I., Rock, E., and Garcia-Regueiro, J. A. (2003). Lipolysis and lipid oxidation during chilled storage of meat from Large White and Pietrain pigs. Meat Science, 64: 7–12.
Morcuende D., Estévez M., Ruiz J., Cava R. (2003). Oxidative and lipolytic deterioration of different muscles from free-range reared Iberian pigs under refrigerated storage. Meat Science, 65: 1157-1164.
Morrissey P.A., Sheehy P.J.A., Galvin,K., Kerry J.P, and Buckley D.J. (1998). Lipid stability in meat and meat products. Meat Science, 49: Supplement 1, S73-S86
Motilva M. J., Toldrá F. and Flores J. (1992). Assay of lipases and esterases activities in fresh pork meat and dry-cured ham. Zeitschrift für Lebensmittel Untersuchung und Forschung, 195: 446-450.
Nawar, WW. (1996). Lipids. In Food Chemistry, O.R. Fennema (ed.), Marcel Dekker, Inc., New York, 225-319
Ramírez R., and Cava R. The crossbreeding of different Duroc lines with Iberian pig affects color and oxidative stability of meat during storage. Submitted to Meat Science
Ramírez R., Morcuende D., and Cava R. Fatty acid composition and adipogenic enzyme activity of muscle and adipose tissue as affected by Iberian x Duroc pig genotype. Submitted to Food Chemistry.
Rosell C. M., and Toldrá F. (1998). Comparison of muscle proteolytic and lipolytic enzyme levels in raw hams from Iberian and white pigs. Journal of the Science of Food and Agriculture, 76: 117–122.
Ruiz-Carrascal J., Ventanas J., Cava R., Andrés A.I., and García C. (2000). Texture and appearance of dry cured ham as affected by fat content and fatty acid composition. Food Research international, 33: 91-95.
Singh H. Beckman K., Poulos A. (1993) Exclusive localization in peroxisomes of dihydroxyacetone phosphate acyltransferase and alkyldihydroxyacetone phosphate synthase in rat liver, J. Lipid Research 34: 467–477.
Soriano A., Quiles R., Mariscal C., García-Ruiz, A. (2005). Pig sire type and sex effects on carcass traits, meat quality and physicochemical and sensory characteristics of Serrano dry-cured ham. Journal of the Science of Food and Agriculture 85: 1914–1924.
SPSS (2003) Inc. SPSS 12.0 for Windows SPSS Inc. Chicago.
Tejeda J.F., Gandemer G., Antequera T., Viau M., García C. (2002) Lipid traits of muscles as related to genotype and fattening diet in Iberian pigs:
116

Chapter IV. Changes in fatty acids during storage
total intramuscular lipids and triacylglycerols. Meat Science, 60: 357–363.
Toldrá F., Flores M., Aristoy M.C., Virgili R., and Parolari G. (1996). Pattern of muscle proteolytic and lipolytic enzymes from light and heavy pigs. Journal Science of Food and Agriculture, 71: 124–128.
Toldrá F., Flores M., Sanz Y. (1997) Dry-cured ham flavour: enzymatic generation and process influence. Food Chemistry, 59: (4), 523-530.
Wood J. D., Richardson R. I., Nute G. R., Fisher A. V., Campo M. M., Kasapidou E., Sheard P. R. and Enser M. (2004). Effects of fatty acids on meat quality: a review. Meat Science, 66: (1), 21-32.
117


Chapter V


Chapter V. Dry-cured loin quality
EFFECT OF IBERIAN X DUROC GENOTYPE ON DRY-CURED LOIN QUALITY1
ABSTRACT Dry-cured loins from 3 different pig genotypes were studied: GEN1: ♂ Iberian x ♀ Duroc1, GEN2: ♂ Duroc1 x ♀ Iberian; GEN3: ♂ Duroc2 x ♀ Iberian. GEN1 and GEN2 are reciprocal crosses, while the difference between GEN2 and GEN3 is the Duroc sire line. The genotype Duroc1 were pigs selected for the manufacture of dry-cured meat products, while the genotype Duroc2 were pigs selected for meat production. Significant differences were found in chemical composition of dry-cured loins specially the intramuscular fat (IMF) content (p<0.05) which was highest in GEN2. Dry-cured loins from GEN3 showed less intense colour, with lower CIE a* and chroma values. IMF from GEN2 was more saturated whereas GEN3 had higher percentages of PUFA and MUFA. GEN1 had lower levels of SFA and higher PUFA than GEN2, although it had intermediate contents of MUFA and C18:1 n-9. Loins from GEN3, showed a more intense lipid oxidation with higher TBA-RS values (p>0.05) and hexanal content (p<0.05). Loins from GEN3 had higher Warner-Bratzler shear force (p>0.05) and instrumental hardness (p<0.05) than those from GEN2, being intermediate in GEN1. Panellists considered that loins from GEN2 were more marbled (p<0.05), more odorous (p<0.05), juicier (p<0.05) and sweeter (p<0.05) and less salty (p<0.05) than loins from GEN3. Dry-cured loins from GEN1 had scores intermediate between the other 2 genotypes.
Keywords: dry-cured loin, Iberian, reciprocal cross, Duroc line, crossbreeding.
1.- INTRODUCTION Iberian dry-cured loin is one of the Iberian meat products most appreciated by consumers. The
demand of Iberian dry-cured products has grown in the last years. For that reason, Iberian pig
census has increased in one million of pigs between 1998 and 2004 (MAPA, 2004). Iberian pig
production has advanced in the last years, since new feeding diets and crosses have been
developed. In this respect, Iberian breed has been frequently crossed with Duroc pigs. The Duroc
breed was introduced in Europe mainly due to its higher intramuscular fat content compared to other
breeds (Barton-Gade, 1987) and because the cross of industrial genotypes with the Duroc breed
results in higher intramuscular lipid content (Oliver et al., 1994), which is considered beneficial for
meat products sensory quality. However, in the Iberian breed, which is a rustic breed with an
elevated adipogenic potential, the introduction of the Duroc breed has specifically improved
productive parameters, such as more piglets per sow and a higher weight at weaning and at the end
of fattening (Aparicio, 1987), keeping the high adaptability to the environment characteristic of the
Iberian pig and without a significant decrease in the quality of cured meat products (López-Bote,
1998).
Duroc is a widespread breed object of different genetic selections which has lead to important
differences between lines. Some of them aimed to the meat production, which tends to animals with
more lean meat, less fat content and higher growth rates. Lonergan, Huff-Lonergan, Rowe, Kuhlers,
& Jungst (2001) reported that the intensive selection carried out in some Duroc lines to improve lean
growth efficiency had negative consequences on meat quality. Besides, Cilla et al., (2006) found
important differences in the quality of dry-cured hams from pigs finished with different lines of Duroc.
On the other hand, since 2001 the legislation (B.O.E. 15th October, 2001) only allows Iberian x Duroc
crosses, when the maternal line is pure Iberian to preserve the purity of the Iberian breed.
1 Ramírez, M.R. & Cava, R. (2006). Effect of Iberian x Duroc genotype on dry-cured loin quality. Accepted for publication in Meat Science.
121

Chapter V. Dry-cured loin quality
Many parameters have been assessed to characterize dry-cured meat products. Colour is the most
outstanding characteristic of appearance (Gandemer, 2002). It could influence consumers’ choice,
especially when the products are presented in the supermarket sliced and packaged. Another aspect
with great importance during the processing is the lipid oxidation, which is influenced by several
factors such as intramuscular fat content and fatty acid profile (Cava, Ruiz, Ventanas, & Antequera,
1999). On the other hand, texture characteristics constitute one of the main attributes perceived by
consumers. IMF content also has a positive influence on some texture and appearance traits of dry-
cured ham (Ruiz-Carrascal, Ventanas, Cava, Andrés & García, 2000). All these parameters are
influenced by the characteristics of the raw meat, which was significantly affected by the Iberian x
Duroc pig genotype (Ramírez & Cava, 2006).
The objectives of this paper are to evaluate in 3 Iberian x Duroc pig genotypes the consequences
derived of the use of different sire lines of Duroc as well as the differences between reciprocal
crosses in the quality of the dry-cured loins.
2.- MATERIALS AND METHODS 2.1.- Animals. 3 groups of 10 pigs each one were studied (5 males and 5 females) from different genotypes: GEN1:
♂ Iberian x ♀ Duroc1, GEN2: ♂ Duroc1 x ♀ Iberian; GEN3: ♂ Duroc2 x ♀ Iberian. The genotype
Duroc1 (DU1) were pigs selected for the production of dry-cured meat products (hams, loins,
shoulders), with a high level of fattening. The genotype Duroc2 (DU2) were animals selected for
meat production, with high percentages of meat cuts and low carcass fat. Pigs were castrated, as is
traditionally done and they were raised together in a semi-intensive system and were fed ad libitum
with commercial diet. Pigs were randomly slaughtered after 316 days of rearing at 150-165 Kg live
weight.
2.2.- Dry-curing process. The right Longissimus dorsi (LD) muscle of each carcass (10loins/genotype) was removed and
processed to obtain dry-cured loins. Loins were seasoned by rubbing a mixture of salt, nitrite, olive oil
and spices such as Spanish paprika (Capsicum annuum, L.), oregano (Origanum vulgare L.) and
garlic (Altium sativum, L.). Loins were kept at 4°C for 4 days to allow the seasoning mixture to
penetrate. Then, loins were stuffed into collagen casings and held at 4°C for 30 days at ~80%
relative humidity. Finally, loins were ripened at ~12°C and at ~70% relative humidity for 90 days.
Loins were processed for a total dry-curing time of 4 months.
2.3.- Chemical composition. Lipids were extracted from 5g of loin with chloroform/methanol (1:2), according to Bligh and Dyer
(1959). Protein content was determined by the Kjieldalh method (AOAC, 2000) and moisture was
determined by drying the samples (~5 g) at 102ºC (AOAC, 2000).
2.4.- Weight loss during refrigerated storage. To perform the assay, dry-cured loin chops were cut into 1 x 1 x 1 cm cubes. The dry-cured loin
cubes were supported with a needle on Styrofoam plates to allow a similar drying on each face of the
cube. Dry-cured loin cubes were refrigerated at 4ºC for 10 days. Sample cubes were weighed at day
122

Chapter V. Dry-cured loin quality
5 and day 10 of storage. The percentage of loss was calculated by difference in weight as follows:
((Wb-Wa)/Wb)x100; Wb: weight before storage, Wa: weight after storage.
2.5.- Instrumental colour. Colour measurements were made following the recommendations on colour determination of the
American Meat Science Association (Hunt et al., 1991). The following colour coordinates were
determined: lightness (L*), redness (a*, red±green) and yellowness (b*, yellow±blue). Colour
parameters were determined using a Minolta CR-300 colorimeter (Minolta Camera, Osaka, Japan)
with illuminant D65, a 0º standard observer and a 2.5 cm port/viewing area. The colorimeter was
standardized before use with a white tile. In addition, hue angle, which describes the hue or colour
was calculated (Hº=atan b*/ a* · 360/2π) as well as the saturation index or chroma (C*) (C=
(a*²+b*²)0.5), which describes the brightness or vividness of colour. The measurements were repeated
at 5 randomly selected places on each slice and averaged.
2.6.- Fatty acid profile determination. Fatty acid methyl esters (FAMEs) were prepared by esterification using methanol in the presence of
sulphuric acid (5% of sulphuric acid in methanol). FAMEs were analysed in a Hewlett-Packard model
HP-5890A gas chromatograph, equipped with a flame ionization detector (FID). They were separated
on a semicapillary column (Hewlett-Packard FFAP-TPA fused-silica column, 30m length, 0.53mm
i.d., and 1.0mm film thickness). The injector and detector temperatures were held at 230°C and the
oven temperature, at 220°C. The flow rate of the carrier gas (N2) was set at 1.8mL/min. Identification
of FAMEs was based on retention times of reference compounds (Sigma). Fatty acid composition
was expressed as percentage of major FAMEs.
2.7.- Lipid oxidation. Lipid oxidation was assessed in duplicate by the 2-thiobarbituric acid (TBA) method of Salih, Smith,
Price, & Dawson (1987) using 2 g of loin. TBA-RS values were calculated from a standard curve of
malondialdehyde and expressed as mg malondialdehyde kg-1 meat (mg MDA/Kg).
Hexanal content was assessed with a SPME fibre (Supelco Co. Canada) coated with divinilbenzene-
carboxen-poly (dimethylxilosane) (DVB/CAR/PDMS) 50/30 μm. The sampling technique to extract
volatile compounds from headspace was the following: 0.5g of sample were minced and placed in a
5mL vial with a silicone stopper which were previously deodorized by heating at 80ºC for 2 hours.
Each sample was analysed in duplicate. Headspace volatile compounds were extracted at 37°C for
30 min.
Analyses were performed in a gas chromatograph (Hewlett-Packard HP5890GC series II gas
chromatograph) coupled to a mass selective detector (Agilent 5973N MSD, mod. G2577A). Volatiles
were separated in a 5% phenyl-95% dimethyl polysiloxane column (30m x 0.25mm i.d., 1.0mm film
thickness; Restek). The carrier gas was helium at 18.5 psi, resulting in a flow of 1.6mL/ min at 40ºC.
Prior to analysis, the SPME fiber was preconditioned at 270ºC for 50min in the gas chromatograph
injection port. The injection port was in the splitless mode and the temperature program was
isothermal at 40ºC for 10 min and then raised at the rate of 7ºC seg-1 to 250ºC and held for 5min.
The GC-MS transfer line temperature was 270ºC. The MS operated in the electron impact mode with
electron impact energy of 70 eV; a multiplier voltage of 1650V and a collected data at a rate of 1scan
123
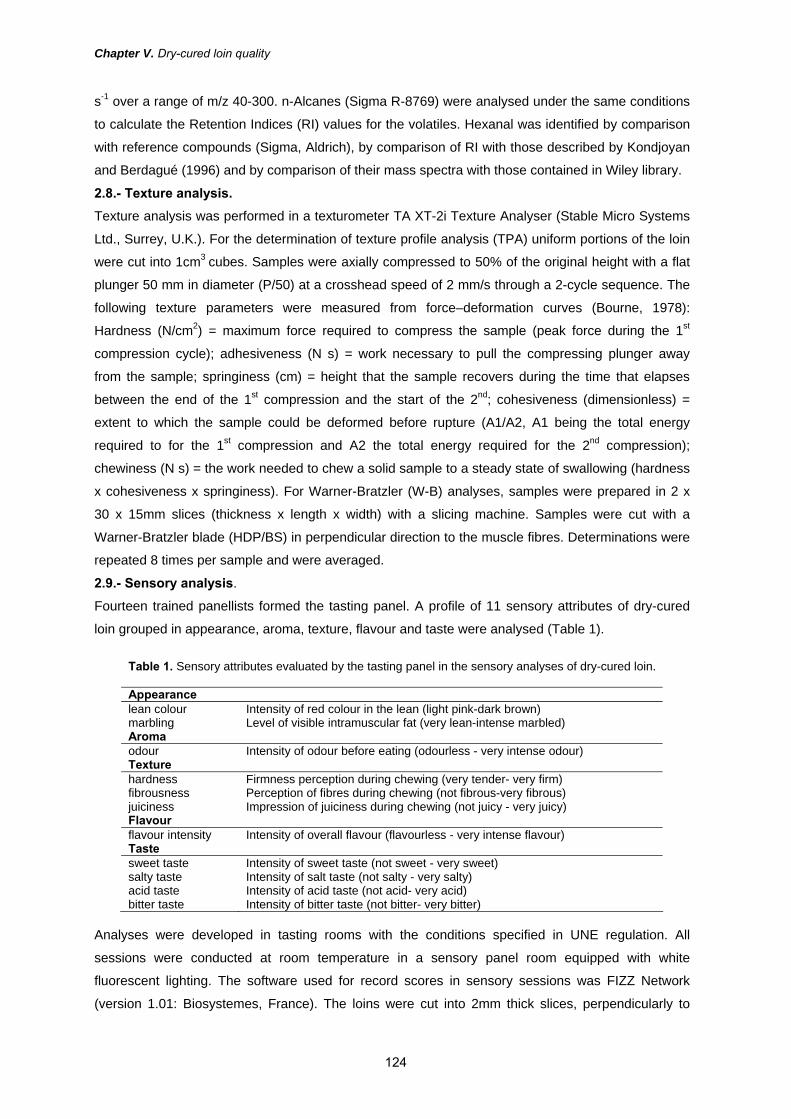
Chapter V. Dry-cured loin quality
s-1 over a range of m/z 40-300. n-Alcanes (Sigma R-8769) were analysed under the same conditions
to calculate the Retention Indices (RI) values for the volatiles. Hexanal was identified by comparison
with reference compounds (Sigma, Aldrich), by comparison of RI with those described by Kondjoyan
and Berdagué (1996) and by comparison of their mass spectra with those contained in Wiley library.
2.8.- Texture analysis. Texture analysis was performed in a texturometer TA XT-2i Texture Analyser (Stable Micro Systems
Ltd., Surrey, U.K.). For the determination of texture profile analysis (TPA) uniform portions of the loin
were cut into 1cm3 cubes. Samples were axially compressed to 50% of the original height with a flat
plunger 50 mm in diameter (P/50) at a crosshead speed of 2 mm/s through a 2-cycle sequence. The
following texture parameters were measured from force–deformation curves (Bourne, 1978):
Hardness (N/cm2) = maximum force required to compress the sample (peak force during the 1st
compression cycle); adhesiveness (N s) = work necessary to pull the compressing plunger away
from the sample; springiness (cm) = height that the sample recovers during the time that elapses
between the end of the 1st compression and the start of the 2nd; cohesiveness (dimensionless) =
extent to which the sample could be deformed before rupture (A1/A2, A1 being the total energy
required to for the 1st compression and A2 the total energy required for the 2nd compression);
chewiness (N s) = the work needed to chew a solid sample to a steady state of swallowing (hardness
x cohesiveness x springiness). For Warner-Bratzler (W-B) analyses, samples were prepared in 2 x
30 x 15mm slices (thickness x length x width) with a slicing machine. Samples were cut with a
Warner-Bratzler blade (HDP/BS) in perpendicular direction to the muscle fibres. Determinations were
repeated 8 times per sample and were averaged.
2.9.- Sensory analysis.
Fourteen trained panellists formed the tasting panel. A profile of 11 sensory attributes of dry-cured
loin grouped in appearance, aroma, texture, flavour and taste were analysed (Table 1).
Table 1. Sensory attributes evaluated by the tasting panel in the sensory analyses of dry-cured loin. Appearance lean colour Intensity of red colour in the lean (light pink-dark brown) marbling Level of visible intramuscular fat (very lean-intense marbled) Aroma odour Intensity of odour before eating (odourless - very intense odour) Texture hardness Firmness perception during chewing (very tender- very firm) fibrousness Perception of fibres during chewing (not fibrous-very fibrous) juiciness Impression of juiciness during chewing (not juicy - very juicy) Flavour flavour intensity Intensity of overall flavour (flavourless - very intense flavour) Taste sweet taste Intensity of sweet taste (not sweet - very sweet) salty taste Intensity of salt taste (not salty - very salty) acid taste Intensity of acid taste (not acid- very acid) bitter taste Intensity of bitter taste (not bitter- very bitter)
Analyses were developed in tasting rooms with the conditions specified in UNE regulation. All
sessions were conducted at room temperature in a sensory panel room equipped with white
fluorescent lighting. The software used for record scores in sensory sessions was FIZZ Network
(version 1.01: Biosystemes, France). The loins were cut into 2mm thick slices, perpendicularly to
124

Chapter V. Dry-cured loin quality
muscle fibre direction, with a slicing machine. Slices were served on plates to panellists. The panel
sessions were held mid-morning, about 3 h after breakfast. Panellists evaluated different parameters
by means of a quantitative-descriptive analysis in a non structured scale 0-10. Three samples
randomly presented to the panellist were analysed in each tasting session. About 100 ml of water at
room temperature was provided to the panellists. In each session the panel average for each sample
was recorded.
2.10.- Statistical analysis.
The effects of genotype and sex were analysed by the Analysis of Variance (ANOVA) procedure of
SPSS, version 12.0 (SPSS, 2003). A two-way analysis of the variance (genotype and sex) with
interaction (genotype x sex) was carried out. Means were used to compare differences. HSD Tukey’s
test was applied to compare the mean values of the genotypes. Mean values and standard errors of
the means (SEM) are reported. The relationships between traits were analysed by the calculation of
Pearson’s correlation coefficient. A principal component analysis (PCA) was performed to determine
relationships between variables and samples.
3.- RESULTS Proximate composition of dry-cured loins was significantly affected by genotype (Table 2). Moisture
content was significantly lower (p<0.05) in GEN1 and GEN2 than in GEN3. Protein content was
significantly higher (p<0.05) in dry-cured loins from GEN1 than in GEN2, and GEN3 had an
intermediate content. Concerning IMF, dry-cured loins from the three genotypes showed high
contents of IMF which ranged from 8,5 to 12.4g/100g. Dry-cured loins from GEN2 contained
significantly higher content of IMF than those form GEN1 and GEN3.
Table 2.- Chemical composition of dry-cured loins from 3 different Iberian x Duroc genotypes.
Genotype Sex P-value GEN1 GEN2 GEN3 ♂ ♀ sem genotype sex interactionMoisture (g/100g) 33.97b 36.14b 38.66a 37.12 35.72 0.69 0.001 0.197 0.126 IMF (g/100g) 9.75b 12.37a 8.49b 10.38 10.07 0.48 0.001 0.722 0.102 Protein (g/100g) 50.84a 46.01b 48.00ab 47.00 49.30 0.73 0.014 0.119 0.228 GEN1: IB x DU1; GEN2: DU1x IB; GEN3: DU2 x IB a,b: Different letters in the same row indicate significant statistical differences (Tukey’s Test, p<0.05).
Loins were stored in order to assess weight loss during 10 days (Table 3). Weight loss was higher in
the first 5 days of storage (∆day0-5) accounting ~20% of the initial weight of the samples, while
during the rest of the trial (∆day5-10) weight loss was lower, around 7% of the initial weight. Weight
loss was affected by sex, being significantly higher in males than in females in the first 5 days of
storage (∆day0-5) and total weight loss (∆day0-10).
No differences between genotypes were found in the weight loss in the period day0-5, while in the
second period of storage loins from GEN2 and GEN3 showed significantly higher loss than GEN1. At
the end of the storage, cumulative weight loss (∆day0-10) in GEN3 was significantly higher than in
GEN1, being intermediate in GEN2.
125
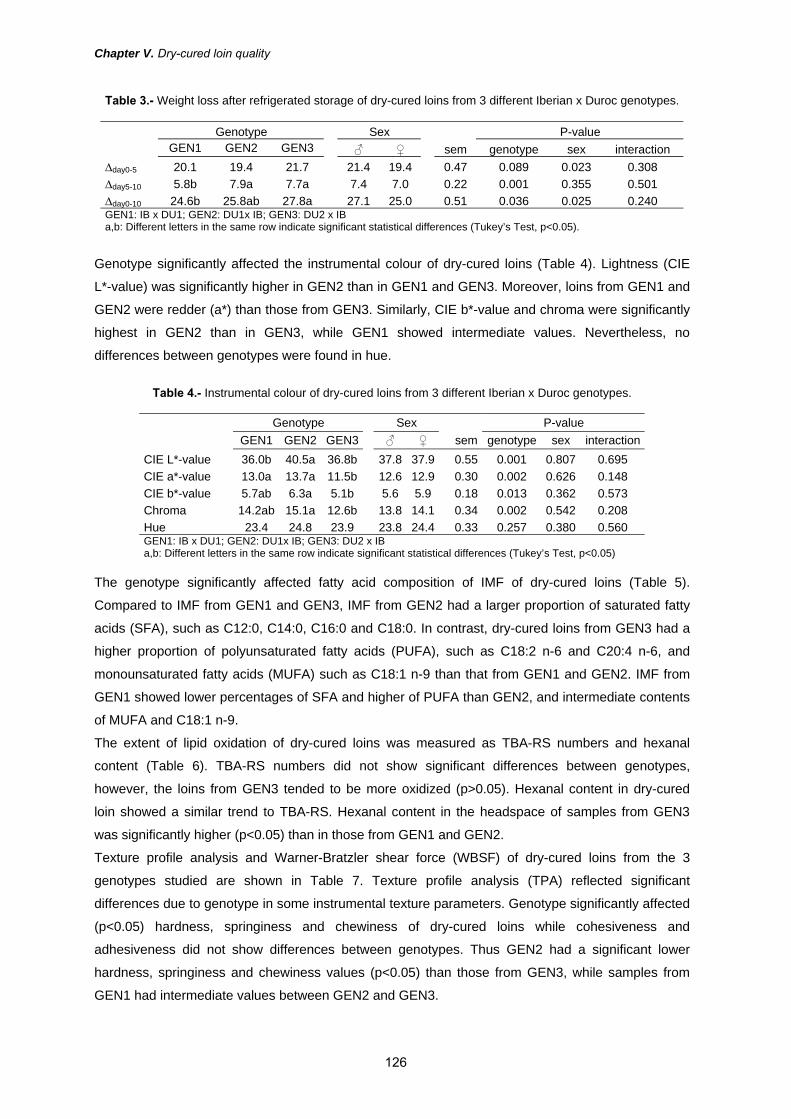
Chapter V. Dry-cured loin quality
Table 3.- Weight loss after refrigerated storage of dry-cured loins from 3 different Iberian x Duroc genotypes.
Genotype Sex P-value GEN1 GEN2 GEN3 ♂ ♀ sem genotype sex interaction ∆day0-5 20.1 19.4 21.7 21.4 19.4 0.47 0.089 0.023 0.308 ∆day5-10 5.8b 7.9a 7.7a 7.4 7.0 0.22 0.001 0.355 0.501 ∆day0-10 24.6b 25.8ab 27.8a 27.1 25.0 0.51 0.036 0.025 0.240 GEN1: IB x DU1; GEN2: DU1x IB; GEN3: DU2 x IB a,b: Different letters in the same row indicate significant statistical differences (Tukey’s Test, p<0.05).
Genotype significantly affected the instrumental colour of dry-cured loins (Table 4). Lightness (CIE
L*-value) was significantly higher in GEN2 than in GEN1 and GEN3. Moreover, loins from GEN1 and
GEN2 were redder (a*) than those from GEN3. Similarly, CIE b*-value and chroma were significantly
highest in GEN2 than in GEN3, while GEN1 showed intermediate values. Nevertheless, no
differences between genotypes were found in hue.
Table 4.- Instrumental colour of dry-cured loins from 3 different Iberian x Duroc genotypes.
Genotype Sex P-value GEN1 GEN2 GEN3 ♂ ♀ sem genotype sex interaction CIE L*-value 36.0b 40.5a 36.8b 37.8 37.9 0.55 0.001 0.807 0.695 CIE a*-value 13.0a 13.7a 11.5b 12.6 12.9 0.30 0.002 0.626 0.148 CIE b*-value 5.7ab 6.3a 5.1b 5.6 5.9 0.18 0.013 0.362 0.573 Chroma 14.2ab 15.1a 12.6b 13.8 14.1 0.34 0.002 0.542 0.208 Hue 23.4 24.8 23.9 23.8 24.4 0.33 0.257 0.380 0.560 GEN1: IB x DU1; GEN2: DU1x IB; GEN3: DU2 x IB a,b: Different letters in the same row indicate significant statistical differences (Tukey’s Test, p<0.05)
The genotype significantly affected fatty acid composition of IMF of dry-cured loins (Table 5).
Compared to IMF from GEN1 and GEN3, IMF from GEN2 had a larger proportion of saturated fatty
acids (SFA), such as C12:0, C14:0, C16:0 and C18:0. In contrast, dry-cured loins from GEN3 had a
higher proportion of polyunsaturated fatty acids (PUFA), such as C18:2 n-6 and C20:4 n-6, and
monounsaturated fatty acids (MUFA) such as C18:1 n-9 than that from GEN1 and GEN2. IMF from
GEN1 showed lower percentages of SFA and higher of PUFA than GEN2, and intermediate contents
of MUFA and C18:1 n-9.
The extent of lipid oxidation of dry-cured loins was measured as TBA-RS numbers and hexanal
content (Table 6). TBA-RS numbers did not show significant differences between genotypes,
however, the loins from GEN3 tended to be more oxidized (p>0.05). Hexanal content in dry-cured
loin showed a similar trend to TBA-RS. Hexanal content in the headspace of samples from GEN3
was significantly higher (p<0.05) than in those from GEN1 and GEN2.
Texture profile analysis and Warner-Bratzler shear force (WBSF) of dry-cured loins from the 3
genotypes studied are shown in Table 7. Texture profile analysis (TPA) reflected significant
differences due to genotype in some instrumental texture parameters. Genotype significantly affected
(p<0.05) hardness, springiness and chewiness of dry-cured loins while cohesiveness and
adhesiveness did not show differences between genotypes. Thus GEN2 had a significant lower
hardness, springiness and chewiness values (p<0.05) than those from GEN3, while samples from
GEN1 had intermediate values between GEN2 and GEN3.
126
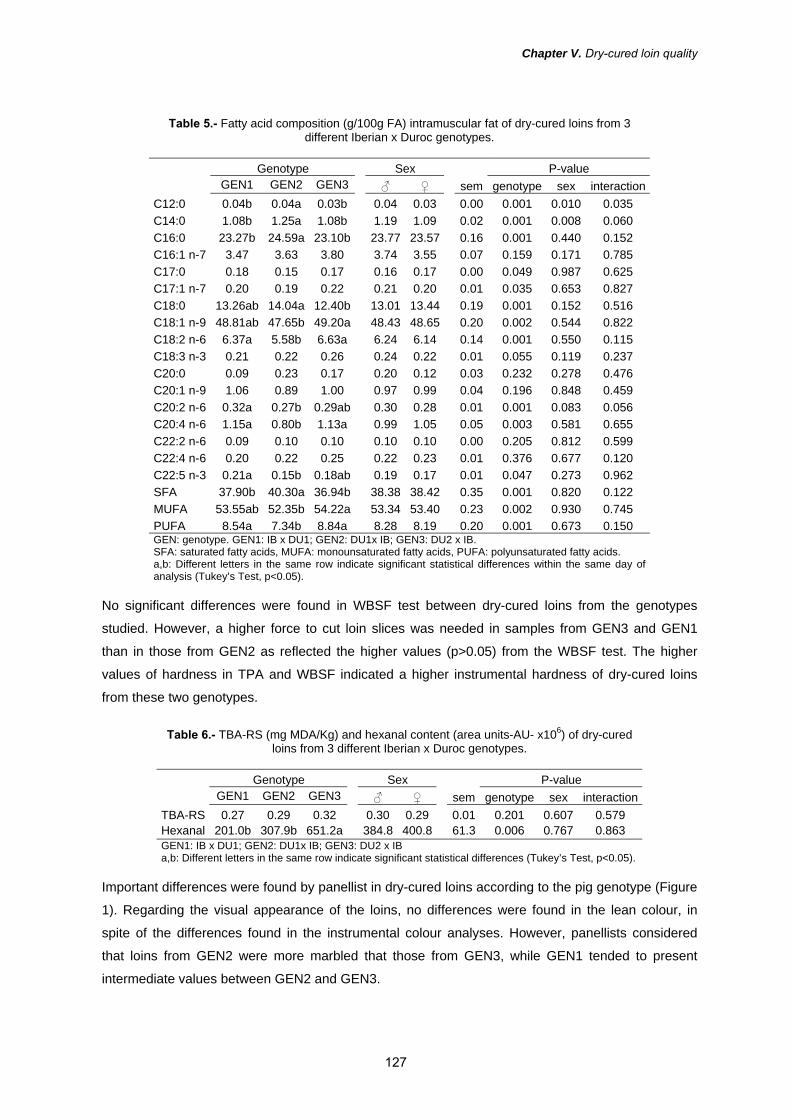
Chapter V. Dry-cured loin quality
Table 5.- Fatty acid composition (g/100g FA) intramuscular fat of dry-cured loins from 3
different Iberian x Duroc genotypes.
Genotype Sex P-value GEN1 GEN2 GEN3 ♂ ♀ sem genotype sex interaction C12:0 0.04b 0.04a 0.03b 0.04 0.03 0.00 0.001 0.010 0.035 C14:0 1.08b 1.25a 1.08b 1.19 1.09 0.02 0.001 0.008 0.060 C16:0 23.27b 24.59a 23.10b 23.77 23.57 0.16 0.001 0.440 0.152 C16:1 n-7 3.47 3.63 3.80 3.74 3.55 0.07 0.159 0.171 0.785 C17:0 0.18 0.15 0.17 0.16 0.17 0.00 0.049 0.987 0.625 C17:1 n-7 0.20 0.19 0.22 0.21 0.20 0.01 0.035 0.653 0.827 C18:0 13.26ab 14.04a 12.40b 13.01 13.44 0.19 0.001 0.152 0.516 C18:1 n-9 48.81ab 47.65b 49.20a 48.43 48.65 0.20 0.002 0.544 0.822 C18:2 n-6 6.37a 5.58b 6.63a 6.24 6.14 0.14 0.001 0.550 0.115 C18:3 n-3 0.21 0.22 0.26 0.24 0.22 0.01 0.055 0.119 0.237 C20:0 0.09 0.23 0.17 0.20 0.12 0.03 0.232 0.278 0.476 C20:1 n-9 1.06 0.89 1.00 0.97 0.99 0.04 0.196 0.848 0.459 C20:2 n-6 0.32a 0.27b 0.29ab 0.30 0.28 0.01 0.001 0.083 0.056 C20:4 n-6 1.15a 0.80b 1.13a 0.99 1.05 0.05 0.003 0.581 0.655 C22:2 n-6 0.09 0.10 0.10 0.10 0.10 0.00 0.205 0.812 0.599 C22:4 n-6 0.20 0.22 0.25 0.22 0.23 0.01 0.376 0.677 0.120 C22:5 n-3 0.21a 0.15b 0.18ab 0.19 0.17 0.01 0.047 0.273 0.962 SFA 37.90b 40.30a 36.94b 38.38 38.42 0.35 0.001 0.820 0.122 MUFA 53.55ab 52.35b 54.22a 53.34 53.40 0.23 0.002 0.930 0.745 PUFA 8.54a 7.34b 8.84a 8.28 8.19 0.20 0.001 0.673 0.150 GEN: genotype. GEN1: IB x DU1; GEN2: DU1x IB; GEN3: DU2 x IB. SFA: saturated fatty acids, MUFA: monounsaturated fatty acids, PUFA: polyunsaturated fatty acids. a,b: Different letters in the same row indicate significant statistical differences within the same day of analysis (Tukey’s Test, p<0.05).
No significant differences were found in WBSF test between dry-cured loins from the genotypes
studied. However, a higher force to cut loin slices was needed in samples from GEN3 and GEN1
than in those from GEN2 as reflected the higher values (p>0.05) from the WBSF test. The higher
values of hardness in TPA and WBSF indicated a higher instrumental hardness of dry-cured loins
from these two genotypes.
Table 6.- TBA-RS (mg MDA/Kg) and hexanal content (area units-AU- x106) of dry-cured
loins from 3 different Iberian x Duroc genotypes.
Genotype Sex P-value GEN1 GEN2 GEN3 ♂ ♀ sem genotype sex interaction TBA-RS 0.27 0.29 0.32 0.30 0.29 0.01 0.201 0.607 0.579 Hexanal 201.0b 307.9b 651.2a 384.8 400.8 61.3 0.006 0.767 0.863 GEN1: IB x DU1; GEN2: DU1x IB; GEN3: DU2 x IB a,b: Different letters in the same row indicate significant statistical differences (Tukey’s Test, p<0.05).
Important differences were found by panellist in dry-cured loins according to the pig genotype (Figure
1). Regarding the visual appearance of the loins, no differences were found in the lean colour, in
spite of the differences found in the instrumental colour analyses. However, panellists considered
that loins from GEN2 were more marbled that those from GEN3, while GEN1 tended to present
intermediate values between GEN2 and GEN3.
127

Chapter V. Dry-cured loin quality
No differences were found in some sensory texture parameters such as hardness (p>0.05) and
fibrousness (p>0.05) of the loins, contrasting with results from instrumental texture analysis, although
both traits followed a similar trend described for hardness and WBSF with higher scores in loins from
GEN1 and GEN3 than in GEN2. In contrast, panellists found that loins from GEN2 were juicier than
those from GEN3. Similar results were found in odour intensity trait, loins from GEN2 were more
odorous than loins from GEN1 and GEN3. Despite of the differences found in odour, no differences
were found in flavour intensity. Concerning taste descriptors, loins showed a similar intensity of acid
and bitter tastes between genotypes, however, loins from GEN1 and GEN2 were sweeter than those
from GEN3, and contrarily, loins from GEN3 were saltier than loins from GEN2.
Table 7.- Texture analyses of dry-cured loins from 3 different Iberian x Duroc genotypes.
Genotype Sex P-value GEN1 GEN2 GEN3 ♂ ♀ sem genotype sex interactionWBSF (N) 8.28 5.19 7.19 6.25 7.55 0.61 0.125 0.347 0.723 Texture profile analysis Hardness (N) 211.83ab 189.49b 219.91a 201.79 211.70 5.21 0.049 0.329 0.879 Adhesiveness (N*s) -0.87 -1.12 -0.92 -1.02 -1.08 0.06 0.238 0.802 0.952 Springiness (cm) 0.38b 0.38b 0.43a 0.43 0.47 0.01 0.011 0.455 0.143 Cohesiveness 0.39 0.37 0.40 0.45 0.45 0.01 0.207 0.921 0.364 Chewiness (N) 30.25ab 26.51b 37.56a 31.80 31.10 1.64 0.013 0.876 0.273 GEN1: IB x DU1; GEN2: DU1x IB; GEN3: DU2 x IB a,b: Different letters in the same row indicate significant statistical differences (Tukey’s Test, p<0.05)
4.- DISCUSSION Chemical composition of dry-cured loins was significantly affected by pig genotype. Loins from GEN2
had the highest IMF content, which is one of the determinant factors of the final quality of meat
products, especially in salting and drying processes as well as for their sensory quality (Ruiz et al.,
2002).
Weight loss has important economical consequences for industry, especially when the product is
sliced, packaged and stored. Large weight loss in dry-cured hams has been associated with high
lean meat content (Chizzolini et al., 1996) and low fatness (Candek-Potokar, Monin, & Zlender,
2002). The higher moisture content of loins from GEN3 could contribute to their higher weight loss,
as showed the positive correlation between both parameters (r = +0.686, p<0.001). However, other
factors could influence the water loss during storage, so Ramírez and Cava (2006) in a previous
study with the fresh L. dorsi from the same animals found a higher drip loss and cook loss in muscles
from GEN3 which coincides with the pattern showed in the dry-cured loin from this genotype.
Instrumental colour parameters of dry-cured loins showed a close relationship with chemical
composition. Thus, the higher lightness (CIE L*-value) in dry-cured loins from GEN2 than in those
from GEN1 and GEN3 could be related with their higher marbling in agreement with findings reported
by Carrapiso and García (2005), who found positive correlations between L* and marbling in dry-
cured Iberian ham. In the present study, positive correlations between CIE L*-value and IMF content
(r = +0.711, p<0.001) and marbling scores (r = +0.624, p<0.001) were found. In other type of dry-
cured product such as dry-cured ham, redness (CIE a*-value) has been associated with the
myoglobin concentration, the salt content and the formation of nitrosomyoglobin (Pérez-Álvarez,
128
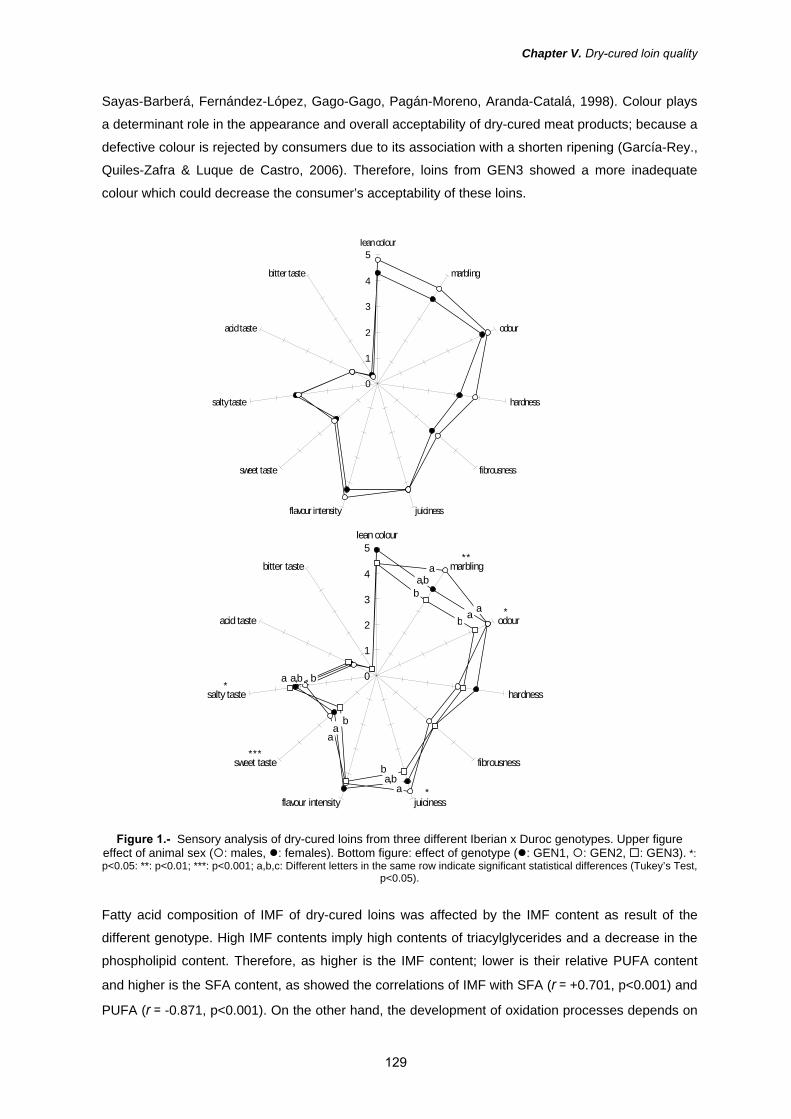
Chapter V. Dry-cured loin quality
Sayas-Barberá, Fernández-López, Gago-Gago, Pagán-Moreno, Aranda-Catalá, 1998). Colour plays
a determinant role in the appearance and overall acceptability of dry-cured meat products; because a
defective colour is rejected by consumers due to its association with a shorten ripening (García-Rey.,
Quiles-Zafra & Luque de Castro, 2006). Therefore, loins from GEN3 showed a more inadequate
colour which could decrease the consumer’s acceptability of these loins.
Figure 1.- Sensory analysis of dry-cured loins from three different Iberian x Duroc genotypes. Upper figure
effect of animal sex ( : males, : females). Bottom figure: effect of genotype ( : GEN1, : GEN2, : GEN3). *: p<0.05: **: p<0.01; ***: p<0.001; a,b,c: Different letters in the same row indicate significant statistical differences (Tukey’s Test,
p<0.05).
Fatty acid composition of IMF of dry-cured loins was affected by the IMF content as result of the
different genotype. High IMF contents imply high contents of triacylglycerides and a decrease in the
phospholipid content. Therefore, as higher is the IMF content; lower is their relative PUFA content
and higher is the SFA content, as showed the correlations of IMF with SFA (r = +0.701, p<0.001) and
PUFA (r = -0.871, p<0.001). On the other hand, the development of oxidation processes depends on
0
1
2
3
4
5lean colour
marbling
odour
hardness
fibrousness
juicinessflavour intensity
sweet taste
salty taste
acid taste
bitter taste**
a
*a ab
a,bb
*aa,b
b
baa
***
*a a,b b
0
1
2
3
4
5lean colour
marbling
odour
hardness
fibrousness
juicinessflavour intensity
sweet taste
salty taste
acid taste
bitter taste
129
Chapter V. Dry-cured loin quality
part of the content and composition of the IMF as high levels of PUFA increase the susceptibility of
meat to oxidative processes and rancidity (Cava et al., 1999). In this respect, loins from GEN3, which
were more unsaturated, showed a more intense extent of lipid oxidation as reflected the higher TBA-
RS and hexanal content of this genotype. Hexanal has been widely reported as a good indicator of
lipid deterioration in raw, cooked and stored meat and in dry-cured meat products (Shahidi & Pegg,
1993; Morales & Aparicio, 1997; Cava et al., 1999). In the later, hexanal contributes to their
characteristic flavour, although high concentrations favour the appearance of rancidity and the
flavour deterioration (Cava et al., 1999). Thus, in a study in dry-cured Iberian hams, Cava et al.,
(1999) found that in hams with less rancid flavour, the hexanal content and TBA-RS were lower.
Instrumental and sensory texture parameters followed the same pattern to that described for the
previous parameters, as dry-cured loins from GEN3 were less juicy and had a higher instrumental
hardness, springiness and chewiness. This is supported by the positive correlations between
instrumental hardness and WBSF (r = +0.449, p<0.05), the same as sensory hardness and
instrumental hardness (r = +0.373, p<0.05). This trend is in agreement with Szczesniak (2002) who
reported similar results between instrumental and sensory rates for hardness. An excessive
hardness is considered negative for the quality of dry-cured meat products (Guerrero, Gou, Arnau,
1999).
These trends could be caused by the different characteristics of the meat and particularly those
related to the moisture and specially the intramuscular fat content of the muscle. So, in other dry-
cured meat products such as dry-cured hams, some authors (Ruiz-Ramírez et al., 2005, Serra, Ruiz-
Ramírez, Arnau, & Gou, 2005) have related a lower moisture content with an increase in hardness,
which coincides with the negative correlations found between moisture content and WBSF (r = -
0.489, p<0.01) and with sensory hardness (r = -0.411, p<0.05). However, other authors (Ruiz-
Carrascal et al., 2000; Ruiz, García, Muriel, Andrés, & Ventanas, 2002) have reported a more
relevant influence of the IMF content in textural characteristics of Iberian dry-cured hams, as
increasing levels of IMF enhance the juiciness while reduce fibrousness perception which has a
positive influence on the overall acceptability of dry-cured ham. We have found similar results, since
IMF content significantly correlated with some instrumental texture parameters such as hardness (r =
-0.541, p<0.01), WBSF (r = -0.380, p<0.05) and with chewiness (r = -0.431, p<0.05), as well as with
sensory texture parameters such as fibrousness (r = -0.398, p<0.05) and juiciness perception (r =
+0.706, p<0.001). Therefore, due to their different IMF content, loins from GEN2 might show the
most adequate textural characteristics, followed by loins from GEN1 while the loins from GEN3 might
have the worst textural quality.
Different studies on dry-cured products have related sensory and instrumental texture with animal
genetic and with physico-chemical parameters influenced by the genetic such as i. the ultimate pH
and ii. the intramuscular fat content (Guerrero, Gou, Alonso, & Arnau, 1996; Ruiz-Ramírez, Arnau,
Serra & Gou, 2005; García-Rey et al., 2006). In this sense, García-Rey et al. (2006) reported the
influence of low postmortem pH and genotype in the appearance of defective texture in dry-cured
ham. Similarly, Ruiz-Ramírez et al., (2005) found a close relationship between low postmortem pH
and the increases in instrumental textural traits such as hardness, cohesiveness and springiness of
130

Chapter V. Dry-cured loin quality
hams. The differences between genotypes previously reported in instrumental and sensory texture
parameters concurs with the lowest postmortem pH values in the Longissimus dorsi muscle from
GEN3, as previously reported Ramírez and Cava, (2006).
Panellist perceived important differences in the appearance of the loins. Loins from GEN2 were
considered more marbled, which is in accordance with the highest IMF content of the loins from this
genotype. A previous study (Ruiz-Carrascal et al., 2000) related marbling to the IMF content in
Iberian ham, being in agreement with the results of the current paper (r = +0.837, p<0.001).
Sensory perceptions related to odour constitute one of the sensory attributes with a higher influence
on the acceptability of dry-cured products from Iberian pigs (Ruiz et al., 2002). IMF content was also
related to odour intensity, which is supported by the positive correlations found between odour and
IMF content (r = +0.489, p<0.01). Numerous papers have studied the influence of the lipids on the
formation of aroma compounds since lipid oxidation has great importance in the development of the
dry-cured meat products flavour (reviewed by Gandemer, 2002). On the other hand and despite the
differences found by panellists in the odour intensity, no differences were found in the flavour
intensity between genotypes. This fact could be due to the use of a rubbing mixture of curing agents
(salt and nitrite) and spices as ingredients which could have disguised the aroma compounds
produced in a different extent.
Taste of meat and meat products is mainly due to sodium chloride, amino acids, peptides and
nucleotides (MacLeod, 1986), so differences in the concentration of these compounds could be the
cause of different taste perceptions. In this sense, loins from GEN1 and GEN2 were perceived
sweeter than those from GEN3, while loins from GEN3 were scored saltier than loins from GEN2.
Results are in accordance with Ruiz, García, Díaz, Cava, Tejeda, & Ventanas (1999), who reported
an opposite relationship between sweetness and saltiness, as sweet notes were not easily perceived
in salty hams. Salt is the main responsible of salty taste in low moisture content meat products,
although others factors such as certain aminoacids could contribute to saltiness (Ruiz et al., 1999).
Loins with lower IMF content (GEN3) were perceived saltier than loins with high IMF content, so
positive correlations were found between IMF content and sweetness (r = +0.514, p<0.01) and
negative with saltiness (r = -0.467, p<0.05).
Principal component analysis (PCA) resulted in four significant factors (principal components –PC-)
that accounted for 72.45% of the variability. Principal components, PC1 and PC2, explained the
34.13% and 16.37% of the variation of the data, respectively. The loadings of this PCA (Fig. 2) can
be divided in two groups. In the positive x-axis of PC1 are located far from the origin those variables
related to the instrumental colour coordinates such as CIE a*-value, and b*-value and the fat
component such as IMF and SFA contents which are close to the sensory traits marbling, juiciness,
odour intensity and sweetness; while in the negative x-axis are placed PUFA percentage, hexanal
content and saltiness and some sensory texture parameters such as hardness and fibrousness and
instrumental texture traits such as WBSF and hardness and chewiness.
The distribution of the data on the two first PC variables is shown in Figure 3. The score-plots
showed clusters of samples related to the different instrumental and sensory parameters analysed.
Dry-cured loins from GEN2 were located in the positive x-axis of PC1; in the area corresponding to
131

Chapter V. Dry-cured loin quality
high values of IMF, marbling, juiciness, odour intensity and sweetness, whereas dry-cured loins from
GEN3 were in the negative x-axis of PC1 with high values of hexanal content, saltiness and sensory
and instrumental hardness.
CIE L*
CIE a*
CIE b*
w-b
hardness TPAadhes TPA
spring TPA
cohes TPAchew TPA
COLOUR
MARBLING
ODOUR
HARDNESS
FIBROUSNESS
JUICINESS
FLAVOR
S WEET NES S
SALTINESS
moisture
tba
weight-loss
hexanal
muf apufa
-1,0 -0,5 0,0 0,5 1,0
Principal component 1 : 34,13%
-1,0
-0,5
0,0
0,5
1,0Pr
inci
pal c
ompo
net
2 : 1
6,37
%
imfsfa
Figure 2.- Loadings plot after principal component analysis of the variables in the plane defined by the two first
principal components (PC1 and PC2).
1
1
1
1
1
11
1
1
2
2
2
2
22
2
2
2
2
3
3
3
3
3
3
3
3
3
3
-6 -4 -2 0 2 4 6 8
Principal component 1: 34.13%
-5
-4
-3
-2
-1
0
1
2
3
4
5
Prin
cipa
l com
pone
nt 2
: 16,
37%
Figure 3.- Scores plot after principal component analysis of the individuals in the plane defined by the two first
principal components (PC1 and PC2). (1:GEN1; 2: GEN2; 3: GEN3)
132
Chapter V. Dry-cured loin quality
5.- CONCLUSION Iberian x Duroc reciprocal cross scarcely affected dry-cured loin quality, although loins from Iberian
mother presented a better quality. However, the cross of selected Duroc genotypes with Iberian pigs
significantly reduced the quality of dry-cured loins, as they had lower marbling and IMF content, less
intensity of colour and odour, worse textural characteristics, higher PUFA content and more
susceptibility to oxidation and rancidity as well as a saltier taste. Therefore, the characterization of
the Duroc lines crossed with Iberian could be necessary to avoid damages in the quality of dry-cured
loins.
ACKNOWLEDGEMENTS This study has been financed thanks to the II Plan Regional de Investigación y Desarrollo
Tecnológico de Extremadura, Consejería de Educación, Ciencia y Tecnología de la Junta de
Extremadura: Project 2PR02B018. Rosario Ramírez wants to thank the Ministerio Educación y
Ciencia the grant (FPU) for the development of this work. We thank the panellists for their
participation in the sensory analysis.
BIBLIOGRAPHY AOAC (2000). Official methods of analysis (15th ed).
Washington, DC: Association of Official Analytical Chemists.
Aparicio, J.B. (1987). El cerdo Ibérico. Premio de Investigación Sánchez Romero de Carvajal. Jabugo S.A.
B.O.E., 15 de Octubre del 2001. Real Decreto 1083/2001, de 5 de Octubre, Norma de Calidad para el jamón ibérico, paleta ibérica y caña de lomo ibérico elaborados en España.
Barton-Gade P.A., (1987) Meat and fat quality in boars, castrates and gilts, Livestock Production Science 16, 187–196.
Bligh, E. G., & Dyer, WJ. (1959). A rapid method of total lipid extraction and purification. Canadian Journal of Biochemical Physiology, 37, 911–917.
Bourne, M. C. (1978). Texture profile analysis. Food Technology, 32, 62–66, 72.
Candek-Potokar M., Monin, G. & Zlender B. (2002) Pork quality, processing, and sensory characteristics of dry-cured hams as influenced by Duroc crossing and sex. Journal of Animal Science. 80, 988–996
Carrapiso, A. I., & García, C. (2005) Instrumental colour of Iberian ham subcutaneous fat and lean (biceps femoris): Influence of crossbreeding and rearing system. Meat Science, 71, 284-290
Cava, R., Ruiz, J., Ventanas, J., & Antequera, T. (1999). Oxidative and lipolytic changes during ripening of Iberian hams as affected by feeding regime: extensive feeding and alpha-tocopheryl acetate supplementation. Meat Science, 52, 165-172.
Chizzolini R., Novelli E., Campanini G., Dazzi G., Madarena G., Zanardi E., Pacchioli M. T. & Rossi A. (1996). Lean colour of green and matured Parma hams: Comparative evaluation and technological relevance of sensory and objective data. Meat Science, 44, 159-172
Cilla, I., Altarriba, J., Guerrero, L., Gispert, M., Martínez, L., Moreno, C., Beltrán, J.A., Guàrdia, M.D., Diestre, A., Arnau, J., & Roncalés, P. (2006). Effect of different Duroc line sires on carcass composition, meat quality and dry-cured ham acceptability. Meat Science, 72, 252-260.
Fizz (1995) Fizz for Window version. Byosystemes. Gandemer, G. (2002). Lipids in muscles and adipose
tissues, changes during processing and sensory properties of meat products. Meat Science, 62, 309-321.
García-Rey R.M., Quiles-Zafra R., & Luque de Castro M.D. (2006). Relationships of genotype and slaughter time with the appearance and texture of dry-cured hams. Food Chemistry, 94, 271–277.
Guerrero L., Gou P., Alonso P. and Arnau J. (1996). Study of the physicochemical and sensorial characteristics of dry-cured ham in 3 pig genetic lines. Journal of Science of Food and Agriculture, 70, 4, 526-530
Guerrero, L., Gou, P., & Arnau, J. (1999). The influence of meat pH on mechanical and sensory texture properties of dry–cured ham. Meat Science, 52, 267–273.
Hunt, M.C., Acton, J.C., Benedict, R.C., Calkins, C.R., Cornforth, D.P., Jeremiah, L.E., Olson, D.G., Salm, C.P., Savell, J.W., Shivas, S.D. (1991). AMSA guidelines for meat colour evaluation. In Proceedings 44th annual reciprocal meat conference, 9–12 July 1991.
Kondjoyan, N.; Berdagué, J. L. (1996). A Compilation of RelativeRetention Indices of the Analysis of Aromatic Compounds; Laboratoire flaveur, station de recherches sur la viande, INRA:Theix, France.
Lonergan, S. M., Huff-Lonergan, E., Rowe, L.J., Kuhlers, D. L., & Jungst, S.B. (2001) Selection for lean growth efficiency in Duroc pigs influences
133
Chapter V. Dry-cured loin quality
pork quality. Journal Animal Science, 79, 2075-2085
López-Bote, C.J. (1998). Sustained utilisation of the Iberian pig breed. In Proceedings of the 44th ICOMST. Barcelona, August 30th-September 4th, L2, 14-21.
MacLeod, G. (1986). The scientific and technological basis of meat flavours. In G. G. Birch, & M. G. Lindley, Developments in food flavours (pp. 191-223). London: Elsevier.
MAPA (2004). www.mapa.es Morales, M. T., & Aparicio, R. (1997). Changes in the
volatile composition of virgin olive oil during oxidation: flavor and off- flavors. Journal of Agriculture and Food Chemistry, 45, 2666–2673.
Oliver, M. A., P.Gou, M. Gispert, A. Diestre, J. Arnau, J. L. Nouguera,and A. Blasco. 1994. Comparison of five types of pig crosses. 2. Fresh meat quality and sensory characteristics of dry cured ham. Livestosck Production Science, 40, 179–185.
Pérez-Álvarez J.A., Sayas-Barberá M.E., Fernández-López J., Gago-Gago, M.A. Pagán-Moreno M.J., Aranda-Catalá V. (1998).Spanish dry-cured ham aging process: colour characteristics. Proceedings 44th ICOMST. Barcelona.pp 984-985.
Ramírez, R., & Cava, R. (2006). Carcass composition and meat quality of 3 different Iberian x Duroc genotype pigs. doi:10.1016/j.meatsci.2006.08.003
Ruiz, J., García, C., Díaz, M. C., Cava, R., Tejeda, J.F., & Ventanas, J. (1999). Dry-cured Iberian ham non-volatile components as affected by the length of the curing process. Food Research International, 32, 643-651
Ruiz, J., García, C., Muriel, E., Andrés, A. I. & Ventanas J. (2002). Influence of sensory characteristics on the acceptability of dry-cured ham. Meat Science, 61, 347-354
Ruiz-Carrascal, J. Ventanas, J. Cava, R. Andrés A. I. & García C. (2000) Texture and appearance of dry cured ham as affected by fat content and fatty acid composition. Food Research International, 33, 91-95.
Ruiz-Ramírez J., Arnau J., Serra X. & Gou P. (2005) Relationship between water content, NaCl content, pH and texture parameters in dry-cured muscles. Meat Science, 70 (4) 579-587
Salih, A. M., Smith, D. M., Price, J. F., & Dawson, L. E. (1987). Modified extraction 2-thiobarbituric acid method for measuring lipid oxidation in poultry. Poultry Science, 66, 1483–1489.
Serra, X., Ruiz-Ramírez, J., Arnau, J., & Gou, P. (2005) Texture parameters of dry-cured ham m. biceps femoris samples dried at different levels as a function of water activity and water content. Meat Science, 69, 249–254
Shahidi, F.; & Pegg, R. B. (1993). Hexanal as an indicator of meat flavor deterioration. Journal Food Lipids, 1, 177-186.
SPSS (2003) Inc. SPSS 12.0 for Windows SPSS Inc. Chicago.
Szczesniak, A. (2002). Texture is a sensory property. Food Quality and Preference, 13, 215–222.
134

Chapter VI


Chapter VI. Chemical, instrumental and sensory characteristics of dry-cured ham
COMPOSITION, INSTRUMENTAL AND SENSORY ANALYSIS OF DRY-CURED HAMS AS AFFECTED BY THE IBERIAN X DUROC GENOTYPE1
ABSTRACT
Dry-cured ham quality from 3 different Iberian x Duroc genotypes was studied: GEN1: ♂ Iberian x ♀ Duroc1, GEN2: ♂ Duroc1 x ♀ Iberian; GEN3: ♂ Duroc2 x ♀ Iberian. GEN1 and GEN2 are reciprocal crosses, while the difference between GEN2 and GEN3 is the Duroc sire line. The line Duroc1 (DU1) was selected for the manufacture of dry-cured meat products, whereas the line Duroc2 (DU2) was selected for meat production with low carcass fat. Dry-cured hams from all genotypes had similar chemical composition. However, intramuscular fat from dry-cured hams from GEN3 was more unsaturated than GEN2, while GEN1 was intermediate. Lipid oxidation degree, measured as TBARS number and hexanal content, was similar between genotypes, although it tended to be higher in GEN3. Colour of hams was affected by the genotype, hams from GEN2 showed higher lightness (CIE L*) while hams from GEN3 had a less intense colour (lower a* and C). Instrumental texture did not differ between genotypes, however, in the sensorial analysis panellists considered the hams from GEN3 more fibrous, while those from GEN2 were considered juicier. Hams from GEN3 also were perceived saltier and more acid. Therefore, hams from GEN3 had lower quality, and this genotype was considered less suitable for the manufacture of Iberian dry-cured hams.
Key words: dry-cured ham, Iberian, Duroc, crossbreeding, proximate composition, sensory.
1.- INTRODUCTION Iberian dry-cured ham market has spectacularly increased in the last years, with around 2.700.000
Iberian hams produced in Spain in 20031. Iberian dry-cured ham is a traditional product which has
excellent sensory quality that makes it very appreciated by consumers. Sensory quality of dry-cured
Iberian ham is mainly due to the high percentage of intramuscular fat rich in monounsaturated fatty
acids (MUFA) that provide juiciness and contribute to its particular and intense flavour. An adequate
intramuscular fat level is one of the factors that mainly contributes to the sensory quality of Iberian
dry-cured ham2,3. Beside this, the degree of unsaturation of fatty acids (FA) influences lipolytic and
oxidative processes that occur during the curing process. Lipolysis and oxidation can get undesirable
high if the meat contains a high proportion of polyunsaturated fatty acids (PUFA)4. On the other hand,
dry-cured ham quality is strongly affected by its textural and mechanical properties, which are mainly
determined by the characteristics of the raw material and the genotype5.
The market for dry-cured products from Iberian pig has been recently regulated6. One of the aspects
that this law regulates is the pig genotype for the manufacture of Iberian meat products. It obliges to
use pure Iberian pigs or crosses with Duroc breed when the maternal line is pure Iberian.
Traditionally, in crossbreeding the Duroc line was used as maternal since it was generally believed
that this was leading to some production improvements. However, the consequences of this change
in the traditional production pattern on the quality of meat and meat products have not been
sufficiently assessed. Moreover, although in the Iberian breed, the inclusion of Duroc breed
increases production parameters7 without a significant decrease of the quality of meat products8,9,
the Duroc breed can not be considered to be a homogeneous breed due to its widespread
distribution. In this respect, different studies have shown important differences between different
1 Ramírez, M.R. & Cava, R. (2006). Composition, instrumental and sensory analysis of dry-cured hams as affected by the Iberian x Duroc genotype. Submitted to Journal of the Science of Food and Agriculture for publication.
137
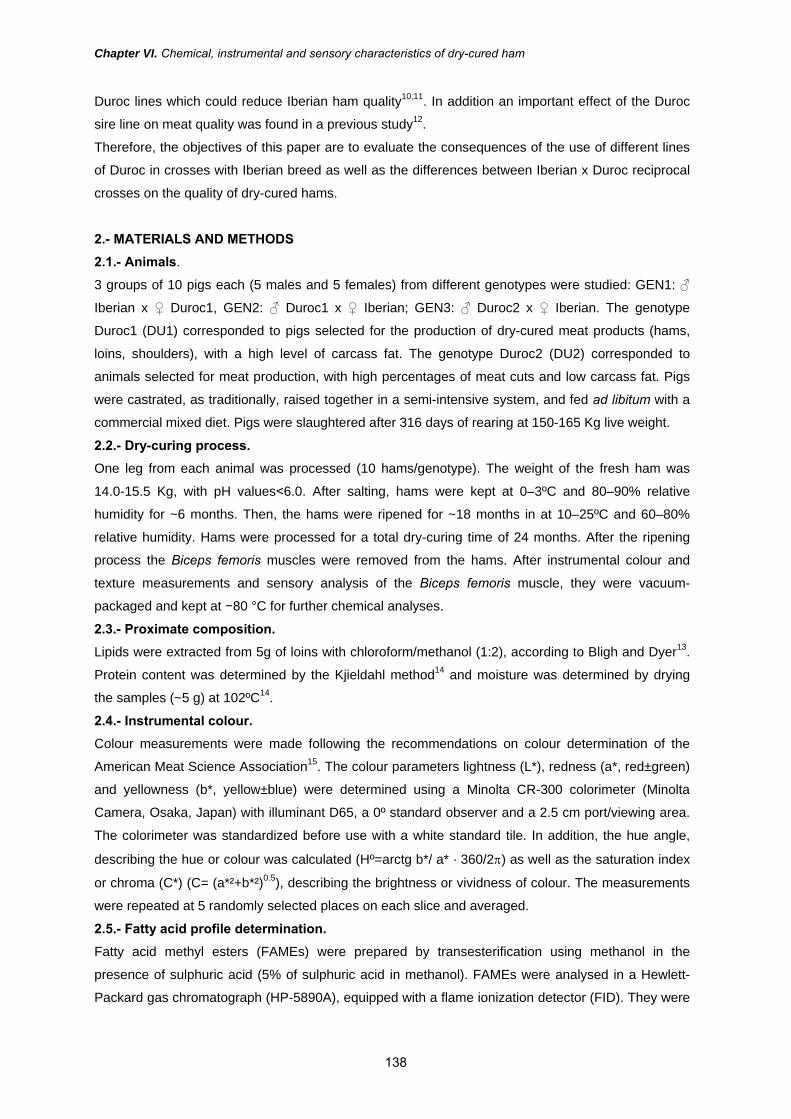
Chapter VI. Chemical, instrumental and sensory characteristics of dry-cured ham
Duroc lines which could reduce Iberian ham quality10,11. In addition an important effect of the Duroc
sire line on meat quality was found in a previous study12.
Therefore, the objectives of this paper are to evaluate the consequences of the use of different lines
of Duroc in crosses with Iberian breed as well as the differences between Iberian x Duroc reciprocal
crosses on the quality of dry-cured hams.
2.- MATERIALS AND METHODS 2.1.- Animals.
3 groups of 10 pigs each (5 males and 5 females) from different genotypes were studied: GEN1: ♂
Iberian x ♀ Duroc1, GEN2: ♂ Duroc1 x ♀ Iberian; GEN3: ♂ Duroc2 x ♀ Iberian. The genotype
Duroc1 (DU1) corresponded to pigs selected for the production of dry-cured meat products (hams,
loins, shoulders), with a high level of carcass fat. The genotype Duroc2 (DU2) corresponded to
animals selected for meat production, with high percentages of meat cuts and low carcass fat. Pigs
were castrated, as traditionally, raised together in a semi-intensive system, and fed ad libitum with a
commercial mixed diet. Pigs were slaughtered after 316 days of rearing at 150-165 Kg live weight.
2.2.- Dry-curing process. One leg from each animal was processed (10 hams/genotype). The weight of the fresh ham was
14.0-15.5 Kg, with pH values<6.0. After salting, hams were kept at 0–3ºC and 80–90% relative
humidity for ~6 months. Then, the hams were ripened for ~18 months in at 10–25ºC and 60–80%
relative humidity. Hams were processed for a total dry-curing time of 24 months. After the ripening
process the Biceps femoris muscles were removed from the hams. After instrumental colour and
texture measurements and sensory analysis of the Biceps femoris muscle, they were vacuum-
packaged and kept at −80 °C for further chemical analyses.
2.3.- Proximate composition. Lipids were extracted from 5g of loins with chloroform/methanol (1:2), according to Bligh and Dyer13.
Protein content was determined by the Kjieldahl method14 and moisture was determined by drying
the samples (~5 g) at 102ºC14.
2.4.- Instrumental colour. Colour measurements were made following the recommendations on colour determination of the
American Meat Science Association15. The colour parameters lightness (L*), redness (a*, red±green)
and yellowness (b*, yellow±blue) were determined using a Minolta CR-300 colorimeter (Minolta
Camera, Osaka, Japan) with illuminant D65, a 0º standard observer and a 2.5 cm port/viewing area.
The colorimeter was standardized before use with a white standard tile. In addition, the hue angle,
describing the hue or colour was calculated (Hº=arctg b*/ a* · 360/2π) as well as the saturation index
or chroma (C*) (C= (a*²+b*²)0.5), describing the brightness or vividness of colour. The measurements
were repeated at 5 randomly selected places on each slice and averaged.
2.5.- Fatty acid profile determination. Fatty acid methyl esters (FAMEs) were prepared by transesterification using methanol in the
presence of sulphuric acid (5% of sulphuric acid in methanol). FAMEs were analysed in a Hewlett-
Packard gas chromatograph (HP-5890A), equipped with a flame ionization detector (FID). They were
138

Chapter VI. Chemical, instrumental and sensory characteristics of dry-cured ham
separated on a semicapillary column (Hewlett-Packard FFAP-TPA fused-silica column, 30m length,
0.53mm i.d., and 1.0mm film thickness). Injector and detector temperatures were held at 230°C and
oven temperature, at 220°C. Flow rate of the carrier gas (N2) was set at 1.8mL/min. Identification of
FAMEs was based on retention times of reference compounds (Sigma). Fatty acid composition was
expressed as percent of major FAMEs.
2.6.- Lipid oxidation. Lipid oxidation was analyzed following a 2-thiobarbituric acid (TBA) method by Salih et al.16 using 2g
of ham. TBA-RS values were calculated from a standard curve of malondialdehyde and expressed
as mg malondialdehyde kg-1 meat (mg MDA/kg).
Hexanal content was assessed by headspace GCMS. For extraction, 0.5g of sample were minced
and placed in a 5mL vial with a silicone stopper which were previously deodorized by heating at 80ºC
for 2 hours. The volatile compounds from headspace were extracted at 37°C for 30 min with a SPME
fiber (Supelco Co. Canada) coated with divinylbenzene-carboxen-poly (dimethylxilosane)
(DVB/CAR/PDMS) 50/30 μm. Analyses were performed with a gas chromatograph (Hewlett-Packard
HP5890GC series II gas chromatograph) coupled to a mass selective detector (Agilent 5973N MSD,
mod. G2577A). Prior to analysis, the SPME fiber was preconditioned at 270ºC for 50min in the gas
chromatograph injection port. Volatiles were separated on a 5% phenyl-95% dimethyl polysiloxane
GC-column (30m x 0.25mm i.d., 1.0mm film thickness; Restek) with helium as carrier gas at 18.5 psi,
resulting in a flow of 1.6mL/ min at 40ºC. The injection port was in the splitless mode and the
temperature program was isothermal at 40ºC for 10 min and then raised at the rate of 7ºC sec-1 to
250ºC and held for 5min. The GC-MS transfer line temperature was 270ºC. The MS operated in the
electron impact mode with electron impact energy of 70 eV; a multiplier voltage of 1650V and a
collected data at a rate of 1scan s-1 over a range of m/z 40-300. n-Alcanes (Sigma R-8769) were
analysed under the same conditions to calculate the Retention Indices (RI) values for the volatiles.
Hexanal was identified by comparison with reference compounds (Sigma, Aldrich), by comparison of
RI with those described by Kondjoyan and Berdagué17 and by comparison of their mass spectra with
those contained in Wiley library.
2.7.- Texture analysis. Texture analysis was performed in a texturometer Stable Microsystem TA XT-2i. For Warner-Bratzler
shear force (WBSF) determinations, samples were prepared in slices of dimensions 2mm x 30mm x
15mm (thickness x length x width). In the analyses samples were cut with a Warner-Bratzler blade in
perpendicular direction to the muscle fibres. For the development of the textural profile analyses
(TPA) samples were cut in cubes of 1cm3 (1cm x 1cm x 1cm). In each analysis the cube was axially
compressed twice until reach at 50% of the initial height. The following texture parameters were
measured from force–deformation curves: hardness, adhesiveness, springiness, cohesiveness and
chewiness. Hardness (N) was defined by the maximum peak force during first compression cycle.
The adhesiveness (N*s) was the negative area under the curve obtained between following cycles.
Cohesiveness was calculated as the ratio of the area under the second curve to the area under the
first curve. Springiness was defined as ‘‘the height that the food recovers during the time that elapses
between the end of the first bite and the start of the second bite’’18 or the time recorded between the
139

Chapter VI. Chemical, instrumental and sensory characteristics of dry-cured ham
start of the second area and the second probe reversal to the time recorded between the start of the
first area and the first probe reversal. Chewiness (N) was calculated by multiplying hardness,
cohesiveness and springiness. Determinations were repeated 8 times per sample and averaged to
their statistical analysis.
2.8.- Sensory analysis.
Fourteen trained panellists formed the tasting panel. Analyses were developed in tasting rooms with
the conditions specified in UNE regulation. FIZZ Network (version 1.01: Biosystemes, France)
software was used for the sessions and the recording data obtained. M. Biceps femoris were
dissected from the dry-cured hams and sliced (2mm thick) parallel to muscle fibre direction with a
slicing machine. Three thin slices of each dry-cured ham were given to panellists who evaluated
different parameters (Table 1) in a quantitative-descriptive analysis with a non structured scale 0-10.
Three hams, which were randomly presented to the panellists were analysed in each tasting session.
In addition, about 100 ml of mineral water at room temperature was provided to panellists. All
sessions were conducted at ~20ºC in a 6-booth sensory panel room equipped with white fluorescent
lighting. In each session, the panel average for each sample was recorded.
Table 1.- Descriptors of the sensory analysis of the dry-cured ham.
Descriptors Definition Appearance lean lightness Luminosity of the lean (dark-light) lean redness Intensity of red colour in the lean (pink-red) marbling Level of visible intramuscular fat (very lean-intense marbled) Aroma odour Level of overall odour before eat the sample (odourless - very intense odour) Texture hardness Firmness perception during chewing (very tender- very firm) fibrousness Perception of fibres during chewing (not fibrous-very fibrous) juiciness Impression of juiciness during chewing (not juicy - very juicy) Flavour flavour intensity Intensity of overall flavour (flavourless - very intense flavour) Taste sweet taste Intensity of sweet taste (not sweet - very sweet) salty taste Intensity of salt taste (not salty - very salty) acid taste Intensity of acid taste (not acid- very acid) bitter taste Intensity of bitter taste (not bitter- very bitter)
2.9. - Statistical analysis.
The effects of genotype and sex were analysed with the Analysis of Variance (ANOVA) procedure of
SPSS, version 12.019. A two-way analysis of the variance (genotype and sex) with interaction
(genotype x sex) was carried out. Means were used to compare differences. HSD Tukey’s test was
applied to compare the mean values of the genotypes. In addition Pearson’s correlation coefficient
for the correlation between treatments and a principal component analysis (PCA) to determine
relationships between variables and samples was performed.
3.- RESULTS AND DISCUSSION The chemical composition of dry-cured hams is shown in Table 2. No differences in moisture,
intramuscular fat or protein contents were detected. The values obtained for the proximate
composition are within the range considered as acceptable in Biceps femoris (BF) from dry-cured
140

Chapter VI. Chemical, instrumental and sensory characteristics of dry-cured ham
Iberian ham2. No differences in composition were found between genotypes; agreeing with the
results for raw m. Biceps femoris12. IMF content is one of the main factors for the quality of dry-cured
meat products and their technological aptitude for drying and maturation processes, since an
adequate level of fat is determinant for the regulation of salt/water diffusion and drying processes20,
21.
Table 2.- Proximate composition (g/Kg) of dry-cured hams from 3 different Iberian x Duroc genotypes.
Genotype Sex Significance GEN1 GEN2 GEN3 ♂ ♀ sem genotype sex interaction Moisture 548.8 567.1 546.8 554.2 554.2 5.5 ns ns ns IMF 70.7 78.2 70.7 73.5 73.5 5.5 ns ns ns Protein 298.5 299.6 306.1 297.7 304.7 3.4 ns ns ns GEN1: IB x DU1; GEN2: DU1x IB; GEN3: DU2 x IB ns: non significant (p>0.05).
Intramuscular FA profile of dry-cured hams was significantly affected by the genotype (Table 3).
Compared to IMF from GEN3, GEN2 had a larger proportion of saturated fatty acids (SFA), such as
palmitic and stearic acids. IMF from GEN3 had a higher content of unsaturated FA such as linoleic
acid (C18:2 n-6) and oleic acid (C18:1 n-9) than that from GEN2. Intramuscular fat from GEN1 had
intermediate levels of SFA, stearic and oleic acid between GEN2 and GEN3.
Table 3.- Fatty acid composition (g/Kg FA) of IMF of dry-cured hams from 3 different
Iberian x Duroc genotypes.
Genotype Sex Significance GEN1 GEN2 GEN3 ♂ ♀ sem genotype sex interaction C12:0 0.2 0.2 0.2 0.2 0.2 0.0 ns ns ns C14:0 7.4b 8.5a 7.8ab 8.2 7.7 0.2 * ns ns C16:0 204.7 210 205.4 207.0 206.5 1.2 ns ns ns C16:1 n-7 28.8 31.8 32.9 31.3 30.9 0.7 ns ns ns C17:0 2.1 2 2 2.0 2.0 0.0 ns ns ns C17:1 n-7 2.3 2.1 2.4 2.2 2.3 0.1 ns ns ns C18:0 129.8ab 135.1a 123.9b 128.1 131.2 2.2 * ns ns C18:1 n-9 514.0ab 499.8b 509.1a 505.3 509.5 2.2 * ns ns C18:2 n-6 71.6b 70.2b 76.7a 74.5 71.2 1.3 * ns ns C18:3 n-3 2.4 2.4 2.5 2.4 2.4 0.0 ns ns ns C20:0 2 2.7 2 2.1 2.3 0.2 ns ns ns C20:1 n-9 13.6a 12.7ab 11.8b 12.9 12.6 0.3 * ns ns C20:2 n-6 2.8 4 4 3.8 3.4 0.3 ns ns ns C20:4 n-6 12.9 12.8 14 14.0 12.5 0.4 ns ns ns C22:2 n-6 1.4ab 1.6a 1.0b 1.3 1.3 0.1 * ns ns C22:4 n-6 2.5 2.4 2.4 2.6 2.3 0.1 ns ns ns C22:5 n-3 1.7 1.6 1.8 1.8 1.6 0.1 ns * ns SFA 346.1ab 358.5a 341.4b 347.8 350.0 2.8 * ns ns MUFA 558.6 546.5 556.1 551.8 555.2 2.4 ns ns ns PUFA 95.3 95.1 102.4 100.5 94.8 1.9 ns ns ns GEN1: IB x DU1; GEN2: DU1x IB; GEN3: DU2 x IB SFA: saturated fatty acids, MUFA: monounsaturated fatty acids, PUFA: polyunsaturated fatty acids. ns: non significant (p>0.05), *: p<0.05. a,b: Different letters in the same row indicate significant statistical differences (Tukey’s Test, p<0.05).
141

Chapter VI. Chemical, instrumental and sensory characteristics of dry-cured ham
Differences in the FA composition of IMF of dry-cured hams could be caused by i) differences
between genotypes for FA profile of fresh muscles12 and/or ii) changes in FA during ham processing.
However it can be assumed, that processing affected all hams similarly, as differences found in fresh
were maintained in dry-cured hams12. Both, a low proportion of PUFA and a high content of IMF, like
in dry-cured hams from GEN1 and GEN2, influence sensory attributes of Iberian dry-cured ham
positively, increasing marbling and juiciness and decreasing rancidity, resulting in a increased
consumer preference 3,22.
TBA-RS numbers and hexanal content (Table 4) showed no differences in the extent of oxidative
processes in BF of dry-cured hams from the 3 genotypes, although both parameters tended to be
higher (p>0.05) in GEN3. This indicates that oxidative processes at the end of the ripening were
similar in the 3 genotypes. However, the increased (p>0.05) TBA-RS and hexanal content in samples
from GEN3 could indicate a higher susceptibility to oxidative stress during slicing, packaging and
storage of the product, due to the higher contents of linoleic acid (C18:2 n-6) in IMF in these
samples. Malondialdehyde and hexanal, which arise from the oxidation of n-6 FA, mainly from
linoleic and arachidonic acid23, are widely used to monitor oxidative changes of lipids in dry-cured
hams24, 25, 26. The relatively high amount of hexanal found in dry-cured Iberian ham leads to the faintly
rancid aroma, which is part of the typical flavour of this product, in which other volatile compounds
counteract the negative effect of hexanal. However, an excess in such aromatic notes leads to an
overall unpleasant flavour and a loss of quality2,3. In agreement with the previous studies24,25 TBA-RS
and hexanal content in BF of Iberian dry-cured hams showed a similar pattern and had a positive
correlation (r = +0.397; p<0.05).
Table 4.- TBA-RS (mg MDA/Kg) and hexanal content (area units-AU- x 106) of dry-cured
loins from 3 different Iberian x Duroc genotypes.
Genotype Sex Significance GEN1 GEN2 GEN3 ♂ ♀ sem genotype sex interaction TBA-RS 1.76 1.79 1.85 1.77 1.82 0.10 ns ns ns Hexanal 646.60 563.29 809.43 641.47 694.26 48.65 ns ns ns GEN1: IB x DU1; GEN2: DU1x IB; GEN3: DU2 x IB ns: non significant (p>0.05)
Instrumental colour parameters were significantly affected by the Iberian x Duroc genotype (Table 5).
BF from GEN2 had different colour characteristics to GEN3. BF from GEN2 had a more intense
(higher Chroma), redder (higher CIE a*-value) and lighter colour (higher CIE L*-value) compared to
those from GEN3, while GEN1 had intermediate values. Yellowness (CIE b*) and Hue angle (CIE Hº)
showed similar values between genotypes. In dry-cured ham, colour is one of the most outstanding
characteristics of appearance3, and it is accepted that it could influence consumers’ choice of sliced
and packaged ham in the supermarket. Thus, the darker and less intense red colour of the BF of dry-
cured hams from GEN3 is expected to affect its acceptability among consumers that prefer dry-cured
hams with an intense red colour5. The colour of the dry-cured ham is influenced by several factors
related to muscle composition and oxidation intensity such as moisture, fat and heme pigment
contents, oxidative status and nitrite content20. Since no significant differences in CIE a* values were
found in the BF from the same pigs before processing12 and the chemical composition of dry-cured
142
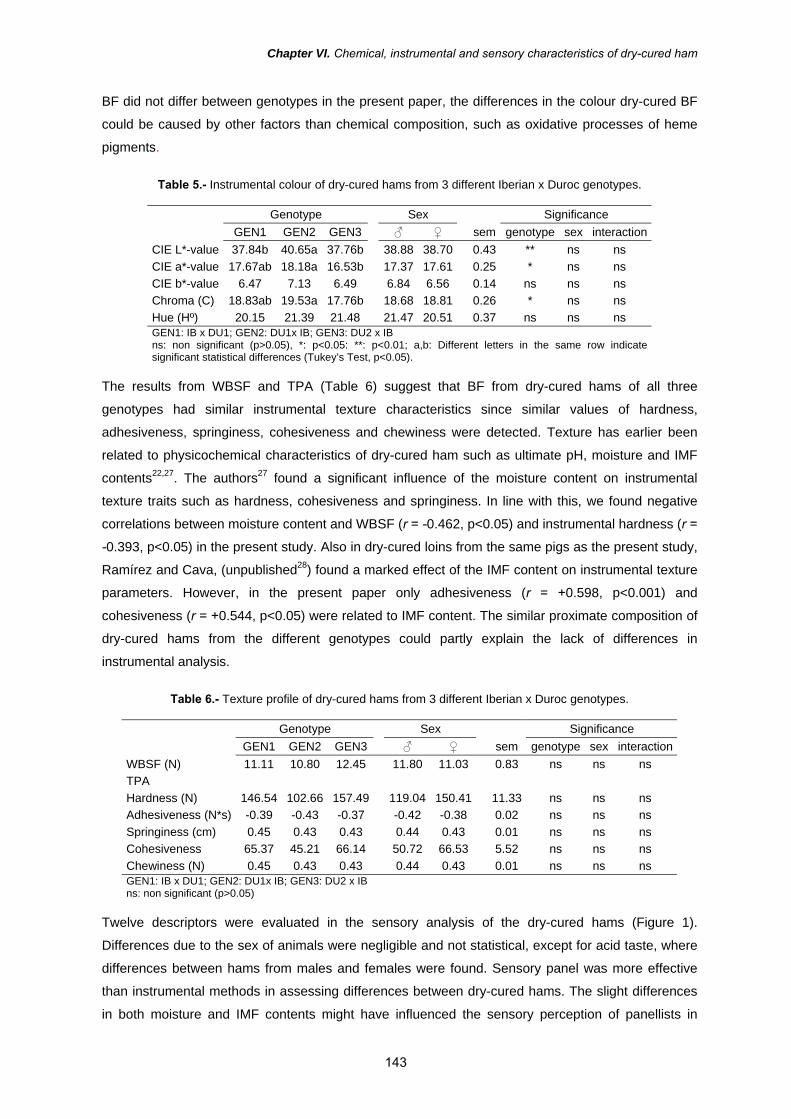
Chapter VI. Chemical, instrumental and sensory characteristics of dry-cured ham
BF did not differ between genotypes in the present paper, the differences in the colour dry-cured BF
could be caused by other factors than chemical composition, such as oxidative processes of heme
pigments.
Table 5.- Instrumental colour of dry-cured hams from 3 different Iberian x Duroc genotypes.
Genotype Sex Significance GEN1 GEN2 GEN3 ♂ ♀ sem genotype sex interaction CIE L*-value 37.84b 40.65a 37.76b 38.88 38.70 0.43 ** ns ns CIE a*-value 17.67ab 18.18a 16.53b 17.37 17.61 0.25 * ns ns CIE b*-value 6.47 7.13 6.49 6.84 6.56 0.14 ns ns ns Chroma (C) 18.83ab 19.53a 17.76b 18.68 18.81 0.26 * ns ns Hue (Hº) 20.15 21.39 21.48 21.47 20.51 0.37 ns ns ns GEN1: IB x DU1; GEN2: DU1x IB; GEN3: DU2 x IB ns: non significant (p>0.05), *: p<0.05: **: p<0.01; a,b: Different letters in the same row indicate significant statistical differences (Tukey’s Test, p<0.05).
The results from WBSF and TPA (Table 6) suggest that BF from dry-cured hams of all three
genotypes had similar instrumental texture characteristics since similar values of hardness,
adhesiveness, springiness, cohesiveness and chewiness were detected. Texture has earlier been
related to physicochemical characteristics of dry-cured ham such as ultimate pH, moisture and IMF
contents22,27. The authors27 found a significant influence of the moisture content on instrumental
texture traits such as hardness, cohesiveness and springiness. In line with this, we found negative
correlations between moisture content and WBSF (r = -0.462, p<0.05) and instrumental hardness (r =
-0.393, p<0.05) in the present study. Also in dry-cured loins from the same pigs as the present study,
Ramírez and Cava, (unpublished28) found a marked effect of the IMF content on instrumental texture
parameters. However, in the present paper only adhesiveness (r = +0.598, p<0.001) and
cohesiveness (r = +0.544, p<0.05) were related to IMF content. The similar proximate composition of
dry-cured hams from the different genotypes could partly explain the lack of differences in
instrumental analysis.
Table 6.- Texture profile of dry-cured hams from 3 different Iberian x Duroc genotypes.
Genotype Sex Significance
GEN1 GEN2 GEN3 ♂ ♀ sem genotype sex interactionWBSF (N) 11.11 10.80 12.45 11.80 11.03 0.83 ns ns ns TPA Hardness (N) 146.54 102.66 157.49 119.04 150.41 11.33 ns ns ns Adhesiveness (N*s) -0.39 -0.43 -0.37 -0.42 -0.38 0.02 ns ns ns Springiness (cm) 0.45 0.43 0.43 0.44 0.43 0.01 ns ns ns Cohesiveness 65.37 45.21 66.14 50.72 66.53 5.52 ns ns ns Chewiness (N) 0.45 0.43 0.43 0.44 0.43 0.01 ns ns ns GEN1: IB x DU1; GEN2: DU1x IB; GEN3: DU2 x IB ns: non significant (p>0.05)
Twelve descriptors were evaluated in the sensory analysis of the dry-cured hams (Figure 1).
Differences due to the sex of animals were negligible and not statistical, except for acid taste, where
differences between hams from males and females were found. Sensory panel was more effective
than instrumental methods in assessing differences between dry-cured hams. The slight differences
in both moisture and IMF contents might have influenced the sensory perception of panellists in
143

Chapter VI. Chemical, instrumental and sensory characteristics of dry-cured ham
certain traits such as lightness, juiciness, fibrousnesses and saltiness, while the technical
measurements were unaffected.
Lean redness and marbling scores were similar in dry-cured hams from the 3 genotypes while scores
for lightness were higher in GEN2. These results are consistent with data reported for instrumental
colour determination and IMF and moisture chemical contents. In line with this, also positive
correlations between lightness of the lean and CIE L*-value (r = +0.541, p<0.05) and moisture
content (r = +0.455, p<0.05) were found. Similarly, marbling and CIE L*-value showed significant
positive correlations (r = +0.367, p<0.05). These results agree with Carrapiso and García29 who also
obtained a significant correlation between L*and marbling and suggested that colour of Iberian ham
is more influenced by fat distribution than by chemical IMF content of the muscle.
Figure 1.- Sensory analysis of dry-cured hams from 3 different Iberian x Duroc genotypes. Left figure: effect of
animal sex ( : males, : females). Right figure: effect of genotype ( : GEN1, : GEN2, : GEN3). *: p<0.05: **: p<0.01; ***: p<0.001; a,b: Different letters in the same row indicate significant statistical differences (Tukey’s Test, p<0.05).
As mentioned above, panellists found differences between genotypes in certain texture traits, not
detected by instrumental techniques. However, results from the sensory analysis are consistent with
results from TPA and WBSF as positive correlations were found between hardness scores and TPA
hardness (r =0.429, p<0.05) and WBSF (r = +0.613, p<0.001). Panellist scored hams from GEN3
more fibrous (p<0.05), harder (p>0.05) and less juicy (p<0.05) than those from GEN2, while GEN1
showed intermediate values. Some authors found that instrumentally determined tenderness only
resembles bite resistance to shearing, whereas human textural perception in general is more
complex30. Sensory tenderness is affected by different factors such as the different deformations, the
deformation rates, and the intrinsic heterogeneity of the biological material 31. Increasing IMF levels
reduce the force for chewing, ease the separation of muscle fibres and cause an enhanced
perception of meat tenderness32. Differences in sensory texture attributes could be caused by
several factors: i.) ultimate pH in fresh BF, ii.) IMF content, and iii.) moisture content in the dry-cured
product. Better sensory texture parameters have been reported in Iberian hams with higher IMF
0
1
2
3
4
5
6
7lightness
lean colour
marbling
odour
hardness
fibrousness
juiciness
flavour intensity
sweet taste
salty taste
acid taste
bitter taste
*
0
1
2
3
4
5
6
7lightness
lean colour
marbling
odour
hardness
fibrousness
juiciness
flavour intensity
sweet taste
salty taste
acid taste
bitter taste a
*
a,bb
aa,b
b
***
*
a a,b b
*
*a
a,bb
aa
b
144

Chapter VI. Chemical, instrumental and sensory characteristics of dry-cured ham
content and significant positive correlations between marbling and juiciness 2,22. García-Rey et al.5,33
showed that low postmortem pH and some pig genotypes resulted in defective texture in dry-cured
hams. In a previous paper12 significant lowest postmortem pH values were reached in B. femoris
from GEN3, which corresponds with the higher fibrousness and lower juiciness in hams from GEN3
in the present paper. According to this, significant positive correlations between marbling and
juiciness (r = +0.634, p<0.001) and negative between moisture content and hardness (r = -0.565,
p<0.01) were found. Ruiz et al.3 suggested the negative influence of some textural traits like high
fibrousness could reduce the acceptability of the dry-cured hams.
Among descriptors associated with the taste, only salty and acid taste differed between genotypes.
Hams from GEN3 were scored saltier than those from GEN2 while those from GEN1 were
intermediate. As also a negative correlation between moisture and saltiness was found (r = -0.641,
p<0.001), this suggests a different salt content in the former and a differences in sodium chloride
uptake during salting. The final salt content might be influenced by the lower subcutaneous fat
thickness in green hams12 and/or to the less moisture content in the matured ham. Hams from GEN3
were scored more acid than those from GEN2 which could be related to the lower ultimate pH in
fresh BF from the former12.
Dry-cured hams from the 3 genotypes had similar odour and flavour characteristics. In line with this
no differences in TBA-RS and hexanal contents were found. However, hexanal content and aroma
intensity were positively correlated (r = +0.396, p<0.05). In spite of this, hexanal, is in a high extent
related to the development of rancid flavours in Iberian ham and it could not alone be considered as
an indicator for aroma intensity25. We suggest a close relationship between IMF/marbling, aroma and
odour intensity scores as positive correlation between marbling, the intensity of the odour and aroma
(r =+0.596, p<0.001 and +0.649, p<0.001 respectively) and between odour intensity and IMF (r =
+0.501, p<0.01) were found.
A principal component analysis (PCA) was performed to examine the relationships between some
selected traits in the samples. PCA showed 5 significant factors that accounted for 66.92% of the
variability. Principal components, PC1 and PC2, explained 26.50% and 14.55% of the variation,
respectively. Figure 2 shows the score plot of the different variables (coefficients of the eigenvectors)
for PC1 and PC2, presenting the quality parameters measured in the dry-cured ham. The distribution
of the data on PC1 and PC2 (Figure 3) showed 2 separate groups of points. On the positive x axis of
the PC1 we can find hams from GEN1 and GEN3 associated with fibrousness, acid and salty tastes,
lightness, hardness and PUFA percentage, while hams from GEN2 were located in the negative x
axis near to visual, texture and odour features such as marbling, juiciness, sweetness and odour
intensity, all of them related to IMF content.
4.- CONCLUSIONS Iberian x Duroc reciprocal crosses scarcely affected the physicochemical and instrumental
characteristics quality of dry-cured hams whereas the Duroc genotype had a significant effect. The
use of Duroc sire lines with non adequate characteristics will negatively contribute to the quality of
dry-cured Iberian hams, especially on their texture and colour.
145

Chapter VI. Chemical, instrumental and sensory characteristics of dry-cured ham
CIE L*CIE a* CIE b*
moisture
imf
tbaLIGHTNESS
COLOUR
MARBLING
ODOURHAR DNESS
FIBROUSNESSJUICINESS
FLAVOUR
SWEET
SALTYACID
BITTER
hardness TPA
adhes TPA
spring TPA
cohes TPA
chew TPA
w-b
hexanal
sf a muf a
puf a
-1,0 -0,5 0,0 0,5 1,0
Principal component 1 : 26,50%
-1,0
-0,5
0,0
0,5
1,0
Prin
cipa
l com
pone
nt 2
: 14
,55%
Figure 2.- Loadings plot after principal component analysis of the variables in the plane defined by the two first
principal components (PC1 and PC2).
1
11
11
1
1
11
2
2
2
22
2
2
2
2
3
3
3
3
3 3
3
3
-8 -6 -4 -2 0 2 4 6 8 10
Principal component 1: 26,50%
-5
-4
-3
-2
-1
0
1
2
3
4
5
Prin
cipa
l com
pone
nt 2
: 14,
55%
Figure 3.- Loadings plot after principal component analysis of the variables in the plane defined by the two first
principal components (PC1 and PC2).
146

Ta
ble
7.- P
ears
on c
orre
latio
n co
effic
ient
s (r)
bet
wee
n ch
emic
al c
ompo
sitio
n, in
stru
men
tal c
olou
r and
text
ure
and
sens
ory
traits
.
Che
mic
al c
omp.
Inst
rum
enta
l tex
ture
Se
nsor
y an
alys
is
Lipi
d ox
idat
ion
m
oist
IM
F w
bsf
hard
ad
he
sprin
gco
hesi
chew
i lig
htne
ssre
dnes
sm
arbl
ing
odou
r ha
rdne
ssfib
rous
.ju
icin
ess
arom
asw
eetn
ess
salti
ness
acid
TB
A he
xana
l L
0.45
5*
0.33
0 -0
.498
** -
0.09
0 0.
552*
*0.
163
0.15
40.
006
0.54
1*
-0.5
51**
0.36
7*
0.16
5 -0
.375
-0
.305
0.48
1*
0.20
2 0.
412*
-0
.302
-0
.563
** 0
.061
-0
.137
a*
0.
235
0.10
3 -0
.211
-0
.281
0.
169
-0.2
930.
131
-0.2
10-0
.085
0.
161
0.45
1*
0.42
5*
-0.2
59
-0.4
64*
0.65
2***
0.34
6 0.
300
-0.4
01*
-0.2
97
0.27
7 0.
071
b*
0.01
8 0.
098
-0.0
53
0.03
3 0.
107
0.21
40.
229
0.03
8 0.
423*
-0
.336
0.08
4 -0
.055
-0
.126
-0
.426
*0.
252
0.19
6 0.
172
-0.0
91
-0.1
65
0.15
7 -0
.055
m
oist
ure
-0
.152
-0.4
62*
-0.3
93*
0.19
4 -0
.11
-0.4
41*
-0.3
750.
186
-0.3
88-0
.024
0.
069
-0.5
65**
-0.1
920.
212
-0.2
760.
176
-0.6
41**
*-0.
539*
* 0.
078
-0.3
49
IMF
-0.0
80
0.17
8 0.
598*
**0.
129
0.54
4*0.
269
0.17
8 -0
.037
0.31
7 0.
501*
* -0
.217
-0
.292
0.35
6 0.
270
0.41
4*
-0.1
29
-0.0
83
0.06
6 -0
.048
w
bsf
0.
151
-0.5
66**
-0.0
10-0
.090
0.09
0 0.
394*
0.
476*
-0.2
96
-0.2
98
0.61
3***
0.23
4 -0
.466
*-0
.271
-0.2
75
0.35
1 0.
434*
-0.
231
0.10
6 ha
rdne
ss
0.02
1 0.
453*
0.51
5**0
.955
***
-0.1
29
0.03
3 -0
.146
-0
.237
0.
429*
0.
407*
-0.3
39
-0.0
67-0
.268
0.
329
0.32
6 0.
121
0.15
7 ch
ewin
ess
0.04
7 -0
.013
-0.0
47
-0.1
56
0.38
6 0.
395*
-0.2
73
0.02
6 -0
.248
0.
280
0.21
1 0.
015
0.19
8 m
arbl
ing
0.
596*
**
-0.0
21
-0.1
520.
634*
**0.
649*
**0.
345
-0.1
71
-0.2
5 -0
.039
0.
074
odou
r
-0
.459
*-0
.402
*0.
685*
**0.
526*
*0.
666*
**
-0.4
52*
-0.3
23
0.23
5 0.
134
hard
ness
0.67
8***
-0.5
47**
-0.0
66-0
.508
**
0.59
3***
0.52
1**
-0.2
79
0.13
7 fib
rous
ness
-0
.562
**-0
.132
-0.4
29*
0.36
0 0.
410*
-0.
183
0.22
6 ju
icin
ess
0.
477*
0.58
7**
-0.5
62**
-0.4
70*
0.28
2 0.
038
arom
a
0.
521*
* 0.
120
-0.2
42
0.10
4 0.
396*
sw
eetn
ess
-0
.321
-0
.420
* 0.
226
0.15
8 sa
ltine
ss
0.42
9* -
0.06
4 0.
141
acid
0.21
4 0.
306
TBA
-RS
0.
397*
*:
p<0
.05:
**:
p<0
.01;
***
: p<0
.001

Chapter VI. Chemical, instrumental and sensory characteristics of dry-cured ham
ACKNOWLEDGEMENTS This work has been financed by the II Plan Regional de Investigación y Desarrollo Tecnológico de
Extremadura (DOE 31 de 14 de Marzo de 2002, Project 2PR02B018). Rosario Ramírez thanks the
Ministerio Educación Ciencia the grant (FPU) for the development of this work. We thank the
panellists for their participation in the sensory analysis and Dr. Sabine Sampels for her useful
corrections of this paper.
BIBLIOGRAPHY 1Cruz J, El sector ibérico: análisis de la producción
de carnes frescas y elaboración de productos curados. Eurocarne, 141: 19-26 (2005).
2Cava R, Ventanas J, Ruiz J, Andres A I, and Antequera T. Sensory characteristics of Iberian ham: influence of rearing system and muscle location. Food Sci and Techn International, 6: 3, 235–242 (2000)
3Ruiz J, García C, Muriel E, Andrés A I, and Ventanas J, Influence of sensory characteristics on the acceptability of dry-cured ham. Meat Sci, 61: 4, 347-354 (2002)
4López-Bote CJ, Sustained utilisation of the Iberian pig breed. In Proceedings of the 44th ICOMST. Barcelona, August 30th-September 4th, L2, pp.14-21 (1998).
5García-Rey RM, Quiles-Zafra R, and Luque de Castro MD, Relationships of genotype and slaughter time with the appearance and texture of dry-cured hams. Food Chem , 94: 271–277(2006).
6B.O.E., 15 de Octubre del 2001. Real Decreto 1083/2001, de 5 de Octubre, Norma de Calidad para el jamón ibérico, paleta ibérica y caña de lomo ibérico elaborados en España.
7Aparicio JB, El cerdo Ibérico. Premio de Investigación Sánchez Romero de Carvajal. Jabugo S.A. (1987).
8Carrapiso A I, Bonilla F, and García C, Effect of crossbreeding and rearing system on sensory characteristics of Iberian ham. Meat Sci , 65: 623–629 (2003)
9Andrés A I, Cava R, Mayoral A I, Tejeda J F, Morcuende D, and Ruiz J, Oxidative stability and fatty acid composition of pig muscles as affected by rearing system, crossbreeding and metabolic type of muscle fibre. Meat Sci, 59: 1, 39-47 (2001)
10Cilla I, Altarriba J, Guerrero L, Gispert M, Martínez L, Moreno C, Beltrán JA, Guàrdia MD, Diestre A, Arnau J, and Roncalés P, Effect of different Duroc line sires on carcass composition, meat quality and dry-cured ham acceptability Meat Sci, 72: 2, 252-260 (2006)
11Lonergan SM, Huff-Lonergan E, Rowe LJ, Kuhlers D L, and Jungst SB. Selection for lean growth efficiency in Duroc pigs influences pork quality. J Anim Sci, 79: 2075-2085(2001)
12 Ramírez, R., & Cava, R. (2006). Carcass composition and meat quality of 3 different Iberian x Duroc genotype pigs. doi:10.1016/j.meatsci.2006.08.003.
13Bligh EG, and Dyer WJ, A rapid method of total lipid extraction and purification. Canadian J of Bioch Physiol, 37: 911–917 (1959).
14AOAC. Official methods of analysis (15th ed). Washington, DC: Association of Official Analytical Chemists (2000).
15Hunt MC, Acton JC, Benedict RC, Calkins CR, Cornforth DP, Jeremiah LE, Olson DG, Salm CP, Savell JW, and Shivas, SD (1991). AMSA guidelines for meatcolour evaluation. In Proceedings 44th annual reciprocal meat conference (1991).
16Salih AM, Smith DM, Price JF, and Dawson LE. Modified extraction 2-thiobarbituric acid method for measuring lipid oxidation in poultry. Poultry Sci, 66: 1483–1489 (1987).
17Kondjoyan N, and Berdagué JL, A Compilation of RelativeRetention Indices of the Analysis of Aromatic Compounds; Laboratoire flaveur, station de recherches sur la viande, INRA:Theix, France, (1996).
18Bourne M C, Texture profile analysis. Food Techn, 32: 7, 62–66, 72 (1978).
19SPSS Inc. SPSS 12.0 for Windows SPSS Inc. Chicago. (2003)
20Arnau J, Principales problemas tecnológicos en la elaboración de jamón curado. In Special Symposium-44th ICOMST Barcelona, Spain, pp.72–86, (1998)
21Gandemer G, Lipids in muscles and adipose tissues, changes during processing and sensory properties of meat products. Meat Sci, 62: 309-321(2002).
22Ruiz-Carrascal J, Ventanas J, Cava R, Andrés AI, and García C. Texture and appearance of dry cured ham as affected by fat content and fatty acid composition . Food Research International, 33: 2, 91-95 (2000)
23Tamura H, Kitta K, and Shibamoto T, Formation of reactive aldehydes from fatty acids in a Fe2+/H2O2 oxidation system. Journal of Agricultural and Food Chem 39: pp. 439–442 (1991).
24Andrés AI, Cava R, Ventanas J, Thovar V, and Ruiz J. Sensory characteristics of Iberian ham: Influence of salt content and processing conditions Meat Sci, 68: 1, 45-51(2004)
25Cava R, Ruiz J, Ventanas J, and Antequera T. Oxidative and lipolytic changes during ripening of Iberian hams as affected by feeding regime: extensive feeding and alpha-tocopheryl acetate supplementation . Meat Sci, 52: 2, 165-172 (1999).
26Isabel B, Lopez-Bote CJ, de la Hoz L, Timón M, García C, and Ruiz J, Effects of feeding elevated
148
Chapter VI. Chemical, instrumental and sensory characteristics of dry-cured ham
concentrations of monounsaturated fatty acids and vitamin E to swine on characteristics of dry cured hams. Meat Sci, 64: 475-482 (2003).
27Ruiz-Ramírez J, Serra X, Arnau J, and Gou P, Relationship between water content, NaCl content, pH and texture parameters in dry-cured muscles. Meat Sci 70: 579–587 (2005)
28Ramírez R., and Cava R, (submitted to meat science). Effect of 3 Iberian x Duroc genotypes on dry-cured loin quality.
29Carrapiso A I, and García C, Instrumental colour of Iberian ham subcutaneous fat and lean (biceps femoris): Influence of crossbreeding and rearing system. Meat Sci, 71: 2, 284-290 (2005)
30 Rosenvold K, van den Berg F, Andersen H J, Johansson L, and Lundström K, Beef Warner–Bratzler shear force measurements in relation to sensory-determined tenderness. Does measurement temperature influence the
interpretation? In Proceedings of the 48th International Congress of Meat Science and Technology (48th ICoMST) (pp. 234–235, Vol. 1). Rome, Italy (2002).
31 Spadaro V, Allen D H, Keeton J T, Moreira R, and Boleman R M, Biomechanical properties of meat and their correlation to tenderness. Journal of Texture Studies, 33: 59–87(2002).
32Essén-Gustavson B, Karlsson A, Lundström, K, and Enfalt AC, Intramuscular fat and muscle fibre lipid content in halotane-gene-free fed high or low protein diets and its relation to meat quality. Meat Sci, 38: 269-277(1994).
33García-Rey, R. M., García-Garrido, J. A., Quiles-Zafra, R., Tapiador, J. and Luque de Castro, M. D. Relationship between pH before salting and dry-cured ham quality. Meat Sci, 67: 4, 625-632 (2004).
149


Chapter VII

Chapter VII. Volatile compounds in dry-cured meat products
VOLATILE PROFILES OF DRY-CURED MEAT PRODUCTS FROM 3 DIFFERENT IBERIAN X DUROC GENOTYPES1
ABSTRACT
Volatile profile of 2 Iberian dry-cured products, dry-cured loin and ham, from 3 different Iberian x Duroc genotypes was assessed. 3 groups of 10 pigs each one (5 males and 5 females) from different genotypes were studied: GEN1: ♂ Iberian x ♀ Duroc1, GEN2: ♂ Duroc1 x ♀ Iberian; GEN3: ♂ Duroc2 x ♀ Iberian. The genotype Duroc1 (DU1) corresponded to pigs selected for the production of dry-cured meat products (hams, loins, shoulders), with a high level of fattening, while the genotype Duroc2 (DU2) corresponded to animals selected for meat production. Genotype slightly affected volatile profile of both dry-cured meat products, although dry-cured loin from GEN3 showed higher hexanal content. Dry-cured loin showed a volatile profile very different to that found in dry-cured ham. Volatile compounds of dry-cured meat products were mainly originated by lipid and protein degradation. Most of the volatile detected in both meat products came from lipid oxidation such as acids, aldehydes, ketones, alcohols and hydrocarbons. In addition, high proportion of volatile compounds from Maillard reaction was found. Branched aldehydes and some sulfur and nitrogen compounds have their origin in the aminoacids degradation by Strecker reaction, while branched alcohols and acids come from the lipid oxidation of branched aldehydes. Dry-cured ham showed higher number and a higher level of compounds with origin in protein and lipid degradation than dry-cured loin, which agrees with the longer ripening of the hams (24 months) respect to the loins (4months). In dry-cured loins, apart from these compounds, seasoning mixture provides high amount of volatiles, such as terpenes (from paprika and oregano) and sulfur compounds (from garlic), which have great importance in the overall aroma of this product.
Keywords: volatile, SPME, Duroc, Iberian, dry-cured loin, dry-cured ham.
1.- INTRODUCTION Iberian dry-cured loin and ham are the most valuable dry-cured meat products, with an extraordinary
consumer acceptance because of their sensory quality, specially their unique and characteristic
flavour. The main factors that conduct to the characteristic and intense flavour of these products are
the meat quality as well as the special features of the ripening process such as its length (14-36
months for dry-cured hams and 3-6 months for dry-cured loins).
The quality of the dry-cured meat products is closely related to the characteristics of the raw material,
especially those related to the degree of marbling and the fatty acid composition of fat such as
feeding characteristics, age of animals and pig breed (1). One of the alternatives more often applied
to improve productive parameters of Iberian pig is by the cross with Duroc breed (2). However,
different studies have demonstrated differences between Duroc lines that affect productive
characteristics and meat and meat products quality (3). Therefore, the Duroc line could affect the
aroma of Iberian dry-cured meat products.
The manufacture process and ripening of loins and hams influence their flavour. Iberian dry-cured
loin is manufactured by rubbing a mixture of curing agents (salt and nitrite) and spices (i.e. Spanish
paprika, oregano and garlic) on the surface of the loin pieces. Then, they are stuffed into casings and
subsequently ripened. Previous researchers have established that the spices rubbed onto the
surface play an important role on the flavour of dry-cured loin (4,5). Moreover, the antioxidant effect
of the spices and nitrites added to dry-cured sausages has been probed by Aguirrezábal et al., (6),
1 Ramírez, M.R. & Cava, R. (2006). Volatile profile of dry-cured meat products from 3 different Iberian x Duroc genotypes. Submitted to Journal of Agriculture and Food Chemistry for publication.
153

Chapter VII. Volatile compounds in dry-cured meat products
which could affect the development of lipid oxidation reactions. Nonetheless, dry-cured hams are
only covered with salt and nitrites, and undergo to a much longer ripening process; therefore, greater
development of lipid and protein degradation reactions would be expectable.
A considerable amount of studies have been devoted to describe the volatile flavour compounds of
Iberian hams (i.e. 7, 8), while there a few previous studies about Iberian loin flavour (4, 5). In
addition, there are several researches about reactions that provide volatile compounds such as
lipolysis, lipid oxidation, Maillard reaction and protein and aminoacids degradation and the
contribution of microorganisms to the flavour development in Iberian products. However, the
comparison between the volatile profile of Iberian dry-cured loin and dry-cured ham has never been
carried out.
Lipid derived compounds are the most abundant compounds in dry-cured meat products (9,10). The
extent of lipolysis and lipid oxidation determines the final flavour of dry-cured meat products (11). On
the other hand, Maillard reaction, which occurs between amino compounds and reducing sugars, is
one of the most important routes of flavour compounds in dry-cured products (12). Besides,
compounds from Maillard reaction can also react with other components of meat such as aldehydes
and other carbonyls formed during lipid oxidation, which react readily with Maillard intermediates.
Such interactions contribute to the achievement of the optimum and characteristic flavour of meat
products (13).
Therefore, the main objectives of this paper are the characterization of volatile compounds of dry-
cured loin and ham and to determine the effect of the genotype on the volatile compounds profile
extracted from dry-cured meat products from different Iberian x Duroc genotypes.
2.- MATERIAL AND METHODS 2.1.- Animals.
3 groups of 10 pigs each one (5 males and 5 females) from different genotypes were studied: GEN1:
♂ Iberian x ♀ Duroc1, GEN2: ♂ Duroc1 x ♀ Iberian; GEN3: ♂ Duroc2 x ♀ Iberian. The genotype
Duroc1 (DU1) corresponded to pigs selected for the production of dry-cured meat products (hams,
loins, shoulders), with a high level of fattening. The genotype Duroc2 (DU2) corresponded to animals
selected for meat production, with high percentages of meat cuts and with low carcass fattening. Pigs
were intensively raised all together and fed ad libitum with a cereal-based commercial fodder. Pigs
were randomly slaughtered after 316 days of rearing with 150-165 Kg live weight.
2.2.- Dry-curing process. For the manufacture of the dry-cured loins, the Longissimus dorsi muscle (10loins/genotype) was
removed from the carcass and processed into dry-cured loin. The weight of the fresh muscle was
2.5-3.2 Kg, and pH values were lower than 6.0. Loins were seasoned by rubbing a mixture of salt,
nitrite, olive oil and spices such as Spanish paprika (Capsicum annuum, L.), oregano (Origanum
vulgare L.) and garlic (Altium sativum, L.). Loins were kept for 4 days at 4°C to allow the seasoning
mixture to penetrate. Then, loins were stuffed into collagen casings and held for 30 days at 4°C at a
relative humidity of ~80%. Finally, loins were ripened for 90 days at ~12°C and at ~70% relative
154

Chapter VII. Volatile compounds in dry-cured meat products
humidity. Loins were processed for a total dry-curing time of 4 months. For the analysis of volatile
compounds in this product, the surface (3mm) with the pickling mixture was removed.
For the manufacture of dry-cured hams, one ham from each animal was processed
(10ham/genotype). The weight of the fresh ham was 14.0-15.5 Kg and pH values were lower than
6.0. After salting, hams were kept at 0–3ºC and 80–90% relative humidity for ~6 months. Then, the
hams were ripened for ~18 months at 10–25ºC and 60–80% relative humidity. Hams were processed
for a total dry-curing time of 24 months. After the ripening process, the Biceps femoris muscles were
removed from the hams for the analysis.
2.3.- Volatile analyses. A SPME fiber (Supelco Co. Canada) coated with divinilbenzene-carboxen-poly (dimethylxilosane)
(DVB/CAR/PDMS) 50/30 μm was used. The sampling technique to extract volatile compounds from
headspace was the following: 0.5g of meat were minced and placed in 5mL vials with a silicone
stopper which were previously deodorized heating them in an electric stove at 80ºC for at least 2
hours. Each sample was analyzed in duplicate. The vial was maintained in temperature controlled
water bath at 37ºC. The fiber was exposed to the headspace of the sample for 30 min. The analyses
were performed on a HP5890GC series II gas chromatograph (Hewlett-Packard) coupled to a mass
selective detector Agilent model 5973. Volatiles were separated using a 5% phenyl-95% dimethyl
polysiloxane column (30m x 0.25mm i.d., 1.0 mm film thickness; Restek). The carrier gas was helium
at 18.5 psi, resulting in a flow of 1.6mL/ min a 40ºC. Prior to analysis, the SPME fiber was
preconditioned at 270ºC for 50min in the gas chromatography injection port. The injection port was in
splitless mode and the temperature program was isothermal at 40ºC for 10 min and then raised at
the rate of 7ºC seg-1 to 250ºC and held for 5min. The GC-MS transfer line temperature was 270ºC.
The MS operated in the electron impact mode with electron impact energy of 70 eV; a multiplier
voltage of 1650V and a collected data at a rate of 1scan s-1 over a range of m/z 40-300. n-Alcanes
(Sigma R-8769) were analyzed under the same conditions to calculate the Retention Indices (RI)
values for the volatiles. The compounds were identified by comparison with reference compounds
(Sigma, Aldrich), by comparison of RI with those described by Kondjoyan and Berdagué (14) and by
comparison of their mass spectra with those contained in Wiley library.
2.4.- Statistical analysis.
The effects of genotype and sex were analyzed using the Analysis of Variance (ANOVA) procedure
of SPSS, version 12.0. A two-way analysis of the variance (genotype and sex) with interaction
(genotype x sex) was carried out. HSD Tukey’s test was applied to compare the mean values of the
genotypes. Mean values and standard errors of the means (SEM) are reported. The relationship
between parameters was assessed by the principal component analysis (PCA).
3.- RESULTS AND DISCUSSION 3.1.- Origin of the volatile compounds of Iberian dry-cured meat products. 41 compounds were isolated in dry-cured loin (Table 1): 5 acids, 4 ketones, 3 alcohols, 11
aldehydes, 3 esters, 2 nitrogen compounds, 3 sulfur compounds, 3 terpenes, 4 lineal hydrocarbons
and 3 aromatic hydrocarbons. In dry-cured ham (Table 2) a higher number of volatiles than in dry-
155
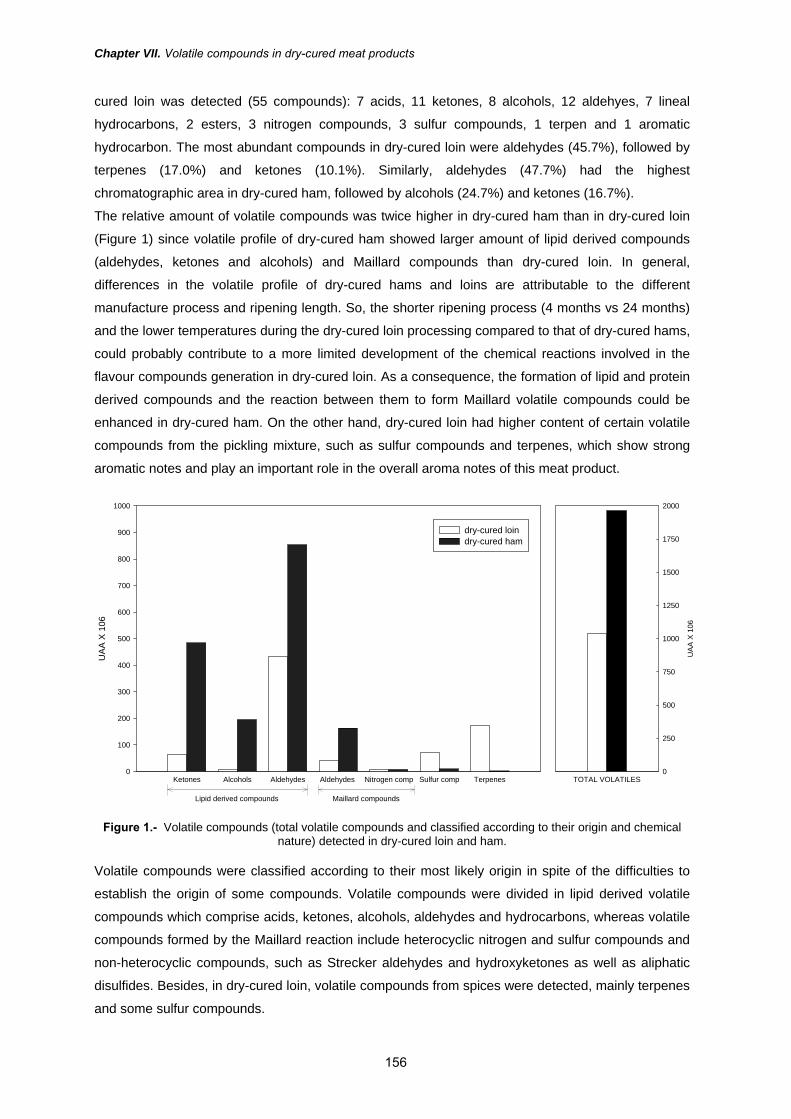
Chapter VII. Volatile compounds in dry-cured meat products
cured loin was detected (55 compounds): 7 acids, 11 ketones, 8 alcohols, 12 aldehyes, 7 lineal
hydrocarbons, 2 esters, 3 nitrogen compounds, 3 sulfur compounds, 1 terpen and 1 aromatic
hydrocarbon. The most abundant compounds in dry-cured loin were aldehydes (45.7%), followed by
terpenes (17.0%) and ketones (10.1%). Similarly, aldehydes (47.7%) had the highest
chromatographic area in dry-cured ham, followed by alcohols (24.7%) and ketones (16.7%).
The relative amount of volatile compounds was twice higher in dry-cured ham than in dry-cured loin
(Figure 1) since volatile profile of dry-cured ham showed larger amount of lipid derived compounds
(aldehydes, ketones and alcohols) and Maillard compounds than dry-cured loin. In general,
differences in the volatile profile of dry-cured hams and loins are attributable to the different
manufacture process and ripening length. So, the shorter ripening process (4 months vs 24 months)
and the lower temperatures during the dry-cured loin processing compared to that of dry-cured hams,
could probably contribute to a more limited development of the chemical reactions involved in the
flavour compounds generation in dry-cured loin. As a consequence, the formation of lipid and protein
derived compounds and the reaction between them to form Maillard volatile compounds could be
enhanced in dry-cured ham. On the other hand, dry-cured loin had higher content of certain volatile
compounds from the pickling mixture, such as sulfur compounds and terpenes, which show strong
aromatic notes and play an important role in the overall aroma notes of this meat product.
Ketones Alcohols Aldehydes Aldehydes Nitrogen comp Sulfur comp Terpenes
UA
A X
106
0
100
200
300
400
500
600
700
800
900
1000
dry-cured loindry-cured ham
TOTAL VOLATILES
UA
A X
106
0
250
500
750
1000
1250
1500
1750
2000
Lipid derived compounds Maillard compounds
Figure 1.- Volatile compounds (total volatile compounds and classified according to their origin and chemical
nature) detected in dry-cured loin and ham. Volatile compounds were classified according to their most likely origin in spite of the difficulties to
establish the origin of some compounds. Volatile compounds were divided in lipid derived volatile
compounds which comprise acids, ketones, alcohols, aldehydes and hydrocarbons, whereas volatile
compounds formed by the Maillard reaction include heterocyclic nitrogen and sulfur compounds and
non-heterocyclic compounds, such as Strecker aldehydes and hydroxyketones as well as aliphatic
disulfides. Besides, in dry-cured loin, volatile compounds from spices were detected, mainly terpenes
and some sulfur compounds.
156
Chapter VII. Volatile compounds in dry-cured meat products
Some of these compounds detected have been previously described by Carrapiso et al., (8) as odour
active compounds in Iberian dry-cured ham such as 2-methyl propanal, 3-methyl-butanal, 2-methyl-
butanal, 2-pentanone, pentanal, hexanal, 2-heptanone, heptanal, 2-heptenal, oct-1-en-3-ol and
octanal.
Lipid-derived compounds were the main group of compounds in dry-cured loins and hams. In dry-
cured loins, lipid derived compounds accounted for more than 55% of the total volatiles and more
than 80% in dry-cured ham.
In general, acids are generated by lipid oxidation reactions. The origin of acetic acid, which was the
most abundant acid compound detected in dry-cured ham, is not clear. Some authors have reported
that it is originated by the fermentation of sugars by microorganisms (15) and others by Maillard
reaction (16). However, the importance of acetic acid in dry-cured ham may be limited as this
compound was not described as odour active compound of Iberian ham (8). In dry-cured loin, the
importance of acetic acid could be higher than in dry-cured ham since it could participate in its spiced
characteristic aroma. Mateo et al., (17) have detected a wide variety of acids in Spanish paprika (an
ingredient of the rubbing mixture) and especially acetic acid, which was also one the most abundant
compound detected in dry-cured loin.
The most abundant ketone detected in both products was propan-2-one. 2- Ketones have been
abundantly isolated in dry-cured products including dry-cured loin (4) and dry-cured ham (9). They
have also been associated with the aroma of moulded-surface cheeses (18), so their contribution to
the overall cured flavour could be important. 2-ketones may arise from fatty acids by chemical
(autooxidation) or enzymatic (β-oxidation) oxidation of free-fatty acids by moulds.
Aliphatic linear alcohols generally result from the degradation of lipid hydroperoxides (19). Dry-cured
ham showed a wide variety of these compounds, being detected in higher number and content than
in dry-cured loin. Muriel et al., (4) reported that alcohols were the most important chemical group in
dry-cured loin; in contrast to the present study in which 2 alcohols from lipid oxidation were detected.
Straight chain aliphatic aldehydes are typical products of lipid oxidation. They have low odour
threshold values and play an important role in the flavour of dry-cured ham and loin (4, 11, 20).
Hexanal was the most abundant compound detected in both products. It is considered the main
volatile derived from oxidation of n-6 fatty acids such as linoleic and arachidonic acids. The large
amount of hexanal found in matured hams is considered a distinctive trait of these products, but in a
high extent this compound has been related to the development of rancid flavours in Iberian ham
(11). The level of hexanal in dry-cured ham was approximately twice higher than in dry- cured loins
(673x106 UA vs. 380 x106 UA), which is in accordance with the longer ripening time and the
development in a higher extent of the lipid oxidation reactions in the former. Conversely, heptanal
and octanal which arise from oleic acid add pleasant notes to the aroma of dry-cured products (8).
Aliphatic and aromatic hydrocarbons with origin in lipid oxidation reactions (21) were isolated in both
dry-cured products. The contribution of these compounds to the aroma of dry-cured products is
different. Aliphatic hydrocarbons, due to their high threshold value, are not important contributors to
the aroma of these products, while aromatic hydrocarbons because of their abundance could play an
important role in the aroma of dry-cured loin and ham (22). Several authors have reported the
157

Chapter VII. Volatile compounds in dry-cured meat products
presence of aromatic hydrocarbons compounds in dry-cured loin (4) and ham (23). They may play an
important role in the overall flavour of meat products as some of them such as ethyl benzene and
methyl benzene have been reported to be important to distinguish volatile profile from different types
of dry-cured hams (23).
Volatiles arising from Maillard reaction accounted for ~18% (dry-cured loin) and ~13% (dry-cured
ham) of the total volatiles. Most of them were branched short-chain aldehydes and their
corresponding alcohols. The origin of branched aldehydes in dry-cured products is in Strecker
degradation reactions of amino acids (12), which is an important pathway associated to Maillard
reaction. In Strecker reaction, amino acids are decarboxylated and deaminated forming aldehydes,
while dicarbonyls formed in Maillard reaction are converted to aminoketones or aminoalcohols, which
can also react with themselves or with other compounds providing a wide variety of aromatic
compounds (13).
Although many studies have been carried out about Iberian products flavour, volatile compounds with
origin in Maillard reaction have never been quantified. The high proportion of volatiles from Maillard
reaction could be related with the high acceptability of these products, since Maillard compounds,
which had very low threshold values, add pleasant aroma notes (13). Previous authors (10) have
reported the importance of these compounds in the reduction of the lipid oxidation compounds in dry-
cured hams throughout ripening, due to the reaction of lipid oxidation products with other compounds
increasing the complexity of the aroma profile. This could be related with the intricacy of overall
aroma and with the different aroma notes of the flavour of these products (8). On the other hand, the
higher amounts and number of compounds with origin in protein degradation in dry-cured ham
respect to the loin show the more implication of Maillard compounds in the aroma formation of the
latter respect to the former.
2- and 3-methylbutanal are products of the Strecker degradation of the amino acids isoleucine and
leucine while benzeacetaldehyde come from the amino acid phenylalanine (24) and acetaldehyde
from the aminoacid cysteine (13). 2- and 3-methylbutanal, which were abundantly isolated in dry-
cured ham, are linked to long ripening processes, and because of their low threshold values and
pleasant “cured” flavours, contribute positively to the dry-cured ham flavour (10).
Some branched chain acids detected in both meat products, such as 2-ethylpropanoic acid, 3-
methylbutanoic acid and 2-methylbutanoic acid, have been identified as products of the microbial
metabolism of valine, leucine and isoleucine, respectively (25). Some authors have attributed the
origin of these compounds to the action of moulds, such as in dry-fermented meat products (26). The
contribution of moulds to the flavour of dry-cured ham has been previously reported (27) since
different moulds strive on the surface of dry-cured loin and ham. Proteolysis and lipolysis by the
endogenous and microbial enzymes seem to play a decisive role in the generation of flavor
precursors in dry-cured meat products (27). However, these compounds could be also originated by
oxidation from their respective Strecker aldehydes (i.e. 2-methyl-butanal would come from the
degradation of the aminoacid isoleucine, and by oxidation, 2-methyl-butanoic acid would be formed).
Ventanas et al., (28) reported that, under ripening conditions of dry-cured products, the formation of
Strecker compounds is possible without the participation of microorganisms.
158

Chapter VII. Volatile compounds in dry-cured meat products
Alcohols such as propan-2-ol have their origin in amino acids by means of Strecker degradation
reactions (29). 3-methyl-1-butanol seems to play an important role in the overall and characteristic
flavour of dry- cured hams (23). Its origin is controversial; some authors (30) have reported that this
compound comes from 3-methylbutanal, a Strecker aldehyde, or from the microbial metabolism of
leucine. However, Sánchez Peña et al., (23) postulated that its origin was from lipid oxidation since
they detected high levels of 3-methyl-1-butanol in muscle and also in subcutaneous fat where
proteins are not abundant. Alcohols and aldehydes derived from Maillard reactions are relatively
abundant and characteristic compounds of Iberian hams (23). In this sense, some of the most
remarkable volatiles for the characterization of Iberian hams against hams from other breeds were 3-
methyl-1-butanol and 3-methyl-butanal (23), which are Strecker aldehydes.
Nitrogen and sulfur compounds have great importance in the overall flavour of meat products
because of their very low threshold values. Except those from spices, nitrogen compounds come
from the breakdown of proteins, free amino acids and nucleic acids, while sulfur volatile compounds
are derived from sulfur-containing amino acids. Some nitrogen compounds like pyrazines, have been
abundantly isolated from dry-cured Iberian products (4, 8). In addition, some furans were detected in
dry-cured ham. Furans, due to their very low threshold value and their pleasant aroma, should
contribute importantly to the desirable aroma of the dry-cured products.
Esters accounted for a small proportion of volatiles in dry-cured loin (0.8%) and in dry-cured ham
(0.3%). Most of them were ethyl esters, formed from ethanol and carboxilic acids by the action of
microorganisms. Esters add fruity aroma notes (31). They have been isolated in Iberian dry-cured
loin (4), in Iberian dry-cured ham (9, 10) and in other dry-cured meat products such as in dry-
fermented sausages (26, 31, 32, 33).
In dry-cured loin, compounds derived from added spices lessen the volatiles derived from lipid
oxidation, microbial metabolism and Maillard reactions. Consequently, the flavour of the dry-cured
loin is the result of a complex equilibrium between volatile compounds derived from both origins. In
dry-cured loin, ~25% of the volatiles had origin in spices (Spanish paprika, oregano and garlic), which
were mainly terpenes and to a lesser extent, aliphatic sulfur compounds. 3 sulfur-derived compounds
were detected, being dipropenyl -disulfide (diallyl disulfide) the most abundant. A wide variety of
sulfur compounds derived from allicin, are characteristic of garlic aroma (34), so it is likely that those
have an important contribution to the overall aroma of dry-cured loin, since garlic is a potent aromatic
ingredient. In addition, sulfur derivatives of propene have also been abundantly detected in dry-cured
loin (4) and in other dry-fermented products manufactured with garlic (32, 33).
Terpenes were abundant in dry-cured loin, while they were scarcely detected in dry-cured ham. They
have well-defined odours in the literature, so alpha pinene has been described to add a pine odour,
while limonene and carene add lemon notes. In dry-cured ham, the presence of limonene has been
associated with the pig diet (9,23). However, in dry-cured loin, the high content of terpenes suggests
the origin in the spices added during the manufacture process (4). Taking into account the
compounds of the seasoning mixture of dry-cured loin, neither have terpenes been detected in dried
Spanish paprika (17) nor in garlic (32); whereas they have been abundantly detected in oregano
(35).
159
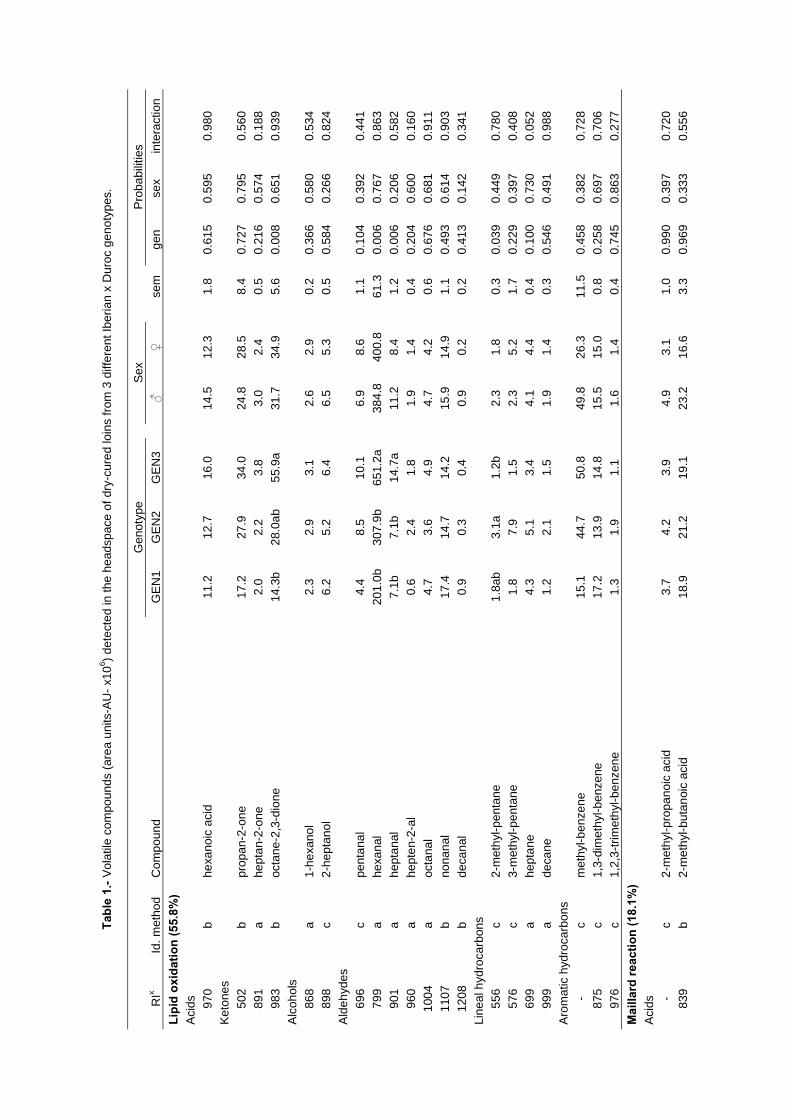
Tabl
e 1.
- Vol
atile
com
poun
ds (a
rea
units
-AU
- x10
6 ) det
ecte
d in
the
head
spac
e of
dry
-cur
ed lo
ins
from
3 d
iffer
ent I
beria
n x
Dur
oc g
enot
ypes
.
G
enot
ype
Se
x
Pr
obab
ilitie
s R
Ix Id
. met
hod
Com
poun
d G
EN
1 G
EN
2 G
EN
3
♂
♀
se
m
gen
sex
inte
ract
ion
Lipi
d ox
idat
ion
(55.
8%)
A
cids
97
0 b
hexa
noic
aci
d 11
.2
12.7
16
.0
14
.5
12.3
1.8
0.61
5 0.
595
0.98
0 K
eton
es
502
b pr
opan
-2-o
ne
17.2
27
.9
34.0
24.8
28
.5
8.
4 0.
727
0.79
5 0.
560
891
a he
ptan
-2-o
ne
2.0
2.2
3.8
3.
0 2.
4
0.5
0.21
6 0.
574
0.18
8 98
3 b
octa
ne-2
,3-d
ione
14
.3b
28.0
ab
55.9
a
31.7
34
.9
5.
6 0.
008
0.65
1 0.
939
Alc
ohol
s
86
8 a
1-he
xano
l 2.
3 2.
9 3.
1
2.6
2.9
0.
2 0.
366
0.58
0 0.
534
898
c 2-
hept
anol
6.
2 5.
2 6.
4
6.5
5.3
0.
5 0.
584
0.26
6 0.
824
Alde
hyde
s
69
6 c
pent
anal
4.
4 8.
5 10
.1
6.
9 8.
6
1.1
0.10
4 0.
392
0.44
1 79
9 a
hexa
nal
201.
0b
307.
9b
651.
2a
38
4.8
400.
8
61.3
0.
006
0.76
7 0.
863
901
a he
ptan
al
7.1b
7.
1b
14.7
a
11.2
8.
4
1.2
0.00
6 0.
206
0.58
2 96
0 a
hept
en-2
-al
0.6
2.4
1.8
1.
9 1.
4
0.4
0.20
4 0.
600
0.16
0 10
04
a oc
tana
l 4.
7 3.
6 4.
9
4.7
4.2
0.
6 0.
676
0.68
1 0.
911
1107
b
nona
nal
17.4
14
.7
14.2
15.9
14
.9
1.
1 0.
493
0.61
4 0.
903
1208
b
deca
nal
0.9
0.3
0.4
0.
9 0.
2
0.2
0.41
3 0.
142
0.34
1 Li
neal
hyd
roca
rbon
s
556
c 2-
met
hyl-p
enta
ne
1.8a
b 3.
1a
1.2b
2.3
1.8
0.
3 0.
039
0.44
9 0.
780
576
c 3-
met
hyl-p
enta
ne
1.8
7.9
1.5
2.
3 5.
2
1.7
0.22
9 0.
397
0.40
8 69
9 a
hept
ane
4.3
5.1
3.4
4.
1 4.
4
0.4
0.10
0 0.
730
0.05
2 99
9 a
deca
ne
1.2
2.1
1.5
1.
9 1.
4
0.3
0.54
6 0.
491
0.98
8 A
rom
atic
hyd
roca
rbon
s
- c
met
hyl-b
enze
ne
15.1
44
.7
50.8
49.8
26
.3
11
.5
0.45
8 0.
382
0.72
8 87
5 c
1,3-
dim
ethy
l-ben
zene
17
.2
13.9
14
.8
15
.5
15.0
0.8
0.25
8 0.
697
0.70
6 97
6 c
1,2,
3-tri
met
hyl-b
enze
ne
1.3
1.9
1.1
1.
6 1.
4
0.4
0.74
5 0.
863
0.27
7 M
ailla
rd re
actio
n (1
8.1%
)
Aci
ds
-
c 2-
met
hyl-p
ropa
noic
aci
d 3.
7 4.
2 3.
9
4.9
3.1
1.
0 0.
990
0.39
7 0.
720
839
b 2-
met
hyl-b
utan
oic
acid
18
.9
21.2
19
.1
23
.2
16.6
3.3
0.96
9 0.
333
0.55
6

Tabl
e 1.
- Vol
atile
com
poun
ds (a
rea
units
-AU
- x10
6 ) det
ecte
d in
the
head
spac
e of
dry
-cur
ed lo
ins
from
3 d
iffer
ent I
beria
n x
Dur
oc g
enot
ypes
.
G
enot
ype
Se
x
Pr
obab
ilitie
s R
Ix Id
. met
hod
Com
poun
d G
EN
1 G
EN
2 G
EN
3
♂
♀
se
m
gen
sex
inte
ract
ion
Con
t.
843
b 3-
met
hyl-b
utan
oic
acid
6.
2 3.
8 4.
3
5.7
3.9
0.
9 0.
455
0.27
9 0.
331
Alc
ohol
s
- c
prop
an-2
-ol
46.8
98
.2
43.1
69.3
57
.6
14
.3
0.22
2 0.
714
0.33
8 Al
dehy
des
-
c ac
etal
dehy
de
40.2
6.
9 11
.3
6.
5 30
.2
10
.8
0.51
1 0.
276
0.34
7 64
7 a
3-m
ethy
l-but
anal
21
.7
23.1
15
.8
15
.3
24.7
2.7
0.48
8 0.
098
0.31
0 65
7 a
2-m
ethy
l-but
anal
3.
2 1.
0 2.
5
1.0
3.3
1.
0 0.
736
0.28
2 0.
478
1055
c
benz
ene
acet
alde
hyde
3.
5 3.
1 1.
7
2.3
3.1
0.
6 0.
434
0.61
4 0.
390
Ket
ones
712
b 3-
hydr
oxy-
buta
n-2-
one
78.6
27
.5
20.2
67.7
15
.8
23
.8
0.46
9 0.
229
0.27
0 N
itrog
en c
ompo
unds
915
b 2,
6-di
met
hyl-p
yraz
ine
5.0
4.1
4.5
4.
5 4.
5
0.4
0.70
1 0.
911
0.19
6 -
c et
ham
ine-
NN
-die
thyl
5.
0 3.
1 3.
7
5.0
2.9
0.
9 0.
682
0.25
3 0.
735
Mic
roor
gani
sms
este
rific
atio
n (0
.8%
)
856
c bu
tano
ic a
cid
3-m
ethy
l-eth
yl e
ster
3.
2 4.
2 3.
2
4.1
3.1
0.
4 0.
424
0.21
0 0.
423
1034
c
hexa
noic
aci
d-1-
met
hyle
thyl
est
er
4.0
4.4
4.3
4.
4 4.
1
0.4
0.94
8 0.
761
0.99
3 11
95
c oc
tano
ic a
cid
met
hyl e
ster
0.
2 1.
3 0.
5
0.8
0.6
0.
2 0.
083
0.76
2 0.
466
Spic
es (2
5.2%
)
Aci
ds
581
c ac
etic
aci
d 19
.7
10.7
11
.1
15
.8
11.6
3.9
0.54
6 0.
533
0.25
9 S
ulfu
r com
poun
ds
86
4 c
prop
-1-e
ne-3
, 3´th
iobi
s 17
.0
15.4
12
.3
14
.9
14.8
1.6
0.52
0 0.
921
0.73
3 92
3 b
2- p
rope
nyl-
met
hyl-d
isul
fide
3.5
3.9
4.0
4.
1 3.
5
0.3
0.85
0 0.
316
0.53
7 10
85
c di
prop
enyl
-dis
ulfid
e (d
ially
l dis
ulfid
e)
51.8
57
.9
44.1
48.3
54
.0
3.
2 0.
182
0.41
8 0.
135
Terp
enes
93
5 b
alph
a pi
nene
10
6.3
98.6
76
.2
93
.7
92.9
7.6
0.29
3 0.
913
0.91
4 10
14
b de
lta 3
car
ene
79.8
76
.6
68.2
78.2
71
.5
7.
6 0.
823
0.65
8 0.
911
1039
b
1-lim
onen
e 7.
8 6.
8 6.
2
7.7
6.1
0.
7 0.
528
0.19
8 0.
361
x RI:
rete
ntio
n in
dex
in a
gree
men
t with
lite
ratu
re v
alue
s. y
SE
M: s
tand
ard
erro
r of
the
mea
n. z : M
etho
d of
iden
tific
atio
n: a
, mas
s sp
ectru
m a
nd r
eten
tion
time
iden
tical
with
a r
efer
ence
com
poun
d; b
, m
ass
spec
trum
and
rete
ntio
n in
dex
from
lite
ratu
re in
acc
orda
nce;
c, t
enta
tive
iden
tific
atio
n by
mas
s sp
ectru
m. G
EN
1: IB
x D
U1;
GE
N2:
DU
1x IB
; GE
N3:
DU
2 x
IB a
,b: D
iffer
ent l
ette
rs in
the
sam
e ro
w in
dica
te s
igni
fican
t sta
tistic
al d
iffer
ence
s (T
ukey
’s te
st, p
<0.0
5)

Tabl
e 2.
- Vol
atile
com
poun
ds (a
rea
units
-AU
- x10
6 ) det
ecte
d in
the
head
spac
e of
dry
-cur
ed h
ams
from
3 d
iffer
ent I
beria
n x
Dur
oc g
enot
ypes
.
G
enot
ype
Se
x
Pr
obab
ilitie
s R
Ix Id
. met
hod
Com
poun
d G
EN
1 G
EN
2 G
EN
3
♂
♀
se
m
gen
sex
inte
ract
ion
Lipi
d ox
idat
ion
(81.
6%)
A
cids
779
b bu
tano
ic a
cid
13.7
6 9.
35
11.3
8
11.8
0 11
.20
1.
59
0.50
3 0.
813
0.38
7 97
0 b
hexa
noic
aci
d 36
.89
24.5
6 26
.12
27
.40
31.2
2
3.39
0.
333
0.69
5 0.
901
1179
b
octa
noic
aci
d 0.
53
1.03
1.
95
1.
42
0.86
0.66
0.
686
0.64
7 0.
272
Ket
ones
502
c pr
opan
-2-o
ne
385.
50
388.
00
345.
92
38
0.75
36
7.63
33.4
7 0.
903
0.78
5 0.
022
600
a bu
tan-
2-on
e 11
.18
8.60
33
.92
11
.86
22.7
0
5.89
0.
194
0.35
7 0.
749
685
a pe
ntan
-2-o
ne
39.1
5 32
.74
31.5
4
36.1
4 33
.04
4.
11
0.77
2 0.
624
0.31
4 79
2 b
hexa
n-2-
one
8.83
7.
26
3.70
6.25
7.
16
1.
15
0.22
8 0.
762
0.77
2 89
3 a
hept
an-2
-one
37
.44
22.7
5 22
.12
24
.81
30.4
7
3.40
0.
155
0.51
1 0.
916
985
b oc
tane
-2,3
-dio
ne
19.6
2 14
.77
17.1
8
16.5
4 17
.84
3.
53
0.84
6 0.
872
0.37
5 99
1 b
octa
n-2-
one
1.80
0.
00
0.00
0.33
0.
92
0.
42
0.17
2 0.
605
0.75
8 10
68
c 1-
etox
i-hep
tan-
2-on
e 2.
20a
0.00
b 0.
00b
0.
66
0.86
0.34
0.
008
0.95
9 0.
997
1088
c
non-
8-en
-2-o
ne
1.80
0.
00
0.00
0.38
0.
87
0.
45
0.22
8 0.
717
0.87
2 10
93
b no
nan-
2-on
e 10
.40
0.00
3.
15
2.
50
6.64
2.53
0.
291
0.53
2 0.
788
Alc
ohol
s
482
c et
hano
l 70
.32
174.
53
83.7
7
117.
13
103.
93
24
.75
0.22
0 0.
920
0.96
3 68
0 b
pent
-1-e
n-3-
ol
3.90
3.
26
4.47
4.05
3.
65
0.
43
0.49
6 0.
622
0.30
7 77
2 a
pent
an-1
-ol
32.2
9 19
.34
27.8
2
26.9
8 25
.88
2.
43
0.09
3 0.
680
0.94
0 86
5 a
hexa
n-1-
ol
70.4
4a
24.8
4b
34.7
2b
43
.92
43.4
0
7.78
0.
044
0.77
9 0.
781
900
c he
ptan
-2-o
l 1.
64
2.31
1.
51
1.
95
1.72
0.33
0.
552
0.74
3 0.
331
982
c oc
t-1-e
n-3-
ol
10.9
0 6.
31
10.7
7
9.11
9.
44
1.
14
0.20
6 0.
997
0.82
1 Al
dehy
des
69
6 b
pent
anal
51
.00
46.2
0 54
.89
47
.39
53.6
8
5.71
0.
871
0.63
5 0.
952
800
a he
xana
l 64
6.60
56
3.29
80
9.43
641.
47
694.
26
48
.65
0.16
0 0.
635
0.77
1 90
3 a
hept
anal
56
.05
41.7
4 49
.26
49
.48
48.5
3
5.03
0.
519
0.87
1 0.
614
956
a he
pten
-(E)-2
-al
4.92
a 1.
65b
2.65
ab
3.
24
2.94
0.49
0.
012
0.56
0 0.
632
1004
a
octa
nal
46.2
6a
23.4
0b
31.2
4ab
36
.56
30.9
0
3.85
0.
039
0.32
5 0.
898
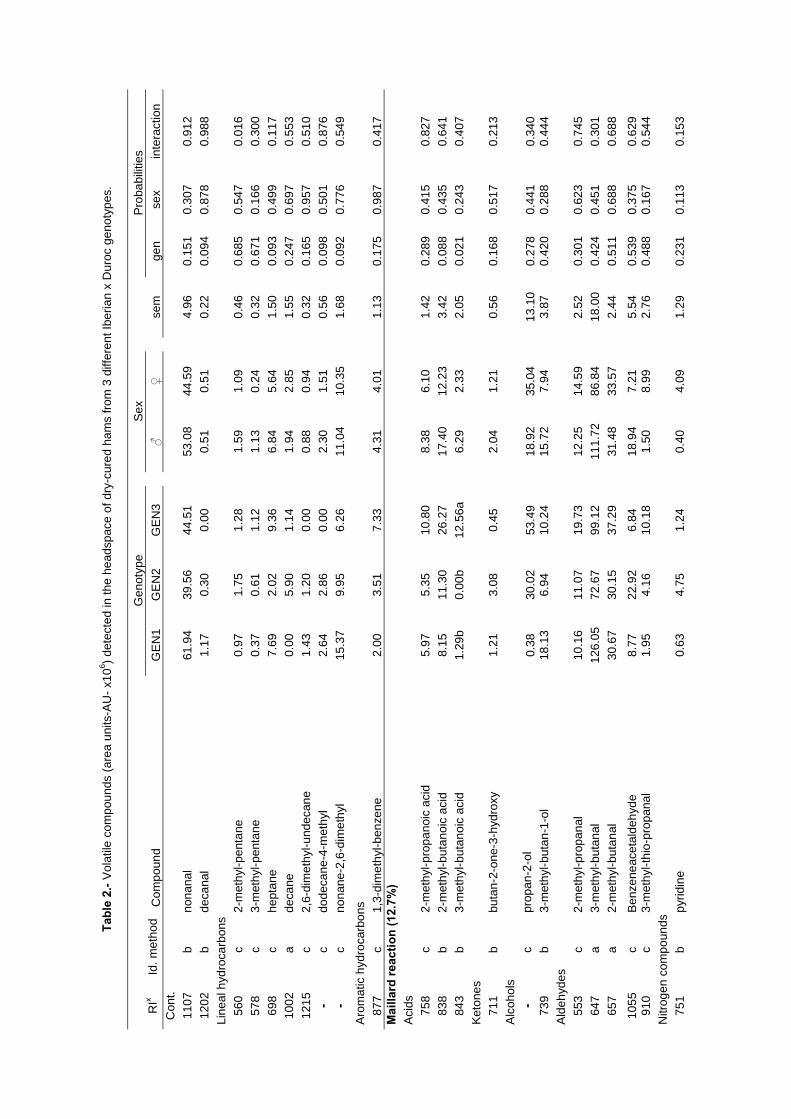
Tabl
e 2.
- Vol
atile
com
poun
ds (a
rea
units
-AU
- x10
6 ) det
ecte
d in
the
head
spac
e of
dry
-cur
ed h
ams
from
3 d
iffer
ent I
beria
n x
Dur
oc g
enot
ypes
.
G
enot
ype
Se
x
Pr
obab
ilitie
s R
Ix Id
. met
hod
Com
poun
d G
EN
1 G
EN
2 G
EN
3
♂
♀
se
m
gen
sex
inte
ract
ion
Con
t.
1107
b
nona
nal
61.9
4 39
.56
44.5
1
53.0
8 44
.59
4.
96
0.15
1 0.
307
0.91
2 12
02
b de
cana
l 1.
17
0.30
0.
00
0.
51
0.51
0.22
0.
094
0.87
8 0.
988
Line
al h
ydro
carb
ons
56
0 c
2-m
ethy
l-pen
tane
0.
97
1.75
1.
28
1.
59
1.09
0.46
0.
685
0.54
7 0.
016
578
c 3-
met
hyl-p
enta
ne
0.37
0.
61
1.12
1.13
0.
24
0.
32
0.67
1 0.
166
0.30
0 69
8 c
hept
ane
7.69
2.
02
9.36
6.84
5.
64
1.
50
0.09
3 0.
499
0.11
7 10
02
a de
cane
0.
00
5.90
1.
14
1.
94
2.85
1.55
0.
247
0.69
7 0.
553
1215
c
2,6-
dim
ethy
l-und
ecan
e
1.43
1.
20
0.00
0.88
0.
94
0.
32
0.16
5 0.
957
0.51
0 -
c do
deca
ne-4
-met
hyl
2.64
2.
86
0.00
2.30
1.
51
0.
56
0.09
8 0.
501
0.87
6 -
c no
nane
-2,6
-dim
ethy
l 15
.37
9.95
6.
26
11
.04
10.3
5
1.68
0.
092
0.77
6 0.
549
Aro
mat
ic h
ydro
carb
ons
87
7 c
1,3-
dim
ethy
l-ben
zene
2.
00
3.51
7.
33
4.
31
4.01
1.13
0.
175
0.98
7 0.
417
Mai
llard
reac
tion
(12.
7%)
A
cids
758
c 2-
met
hyl-p
ropa
noic
aci
d
5.97
5.
35
10.8
0
8.38
6.
10
1.
42
0.28
9 0.
415
0.82
7 83
8 b
2-m
ethy
l-but
anoi
c ac
id
8.15
11
.30
26.2
7
17.4
0 12
.23
3.
42
0.08
8 0.
435
0.64
1 84
3 b
3-m
ethy
l-but
anoi
c ac
id
1.29
b 0.
00b
12.5
6a
6.
29
2.33
2.05
0.
021
0.24
3 0.
407
Ket
ones
711
b bu
tan-
2-on
e-3-
hydr
oxy
1.21
3.
08
0.45
2.04
1.
21
0.
56
0.16
8 0.
517
0.21
3 A
lcoh
ols
-
c pr
opan
-2-o
l 0.
38
30.0
2 53
.49
18
.92
35.0
4
13.1
0 0.
278
0.44
1 0.
340
739
b 3-
met
hyl-b
utan
-1-o
l 18
.13
6.94
10
.24
15
.72
7.94
3.87
0.
420
0.28
8 0.
444
Alde
hyde
s
553
c 2-
met
hyl-p
ropa
nal
10.1
6 11
.07
19.7
3
12.2
5 14
.59
2.
52
0.30
1 0.
623
0.74
5 64
7 a
3-m
ethy
l-but
anal
12
6.05
72
.67
99.1
2
111.
72
86.8
4
18.0
0 0.
424
0.45
1 0.
301
657
a 2-
met
hyl-b
utan
al
30.6
7 30
.15
37.2
9
31.4
8 33
.57
2.
44
0.51
1 0.
688
0.68
8
1055
c
Benz
enea
ceta
ldeh
yde
8.77
22
.92
6.84
18.9
4 7.
21
5.
54
0.53
9 0.
375
0.62
9 91
0 c
3-m
ethy
l-thi
o-pr
opan
al
1.95
4.
16
10.1
8
1.50
8.
99
2.
76
0.48
8 0.
167
0.54
4 N
itrog
en c
ompo
unds
751
b py
ridin
e 0.
63
4.75
1.
24
0.
40
4.09
1.29
0.
231
0.11
3 0.
153
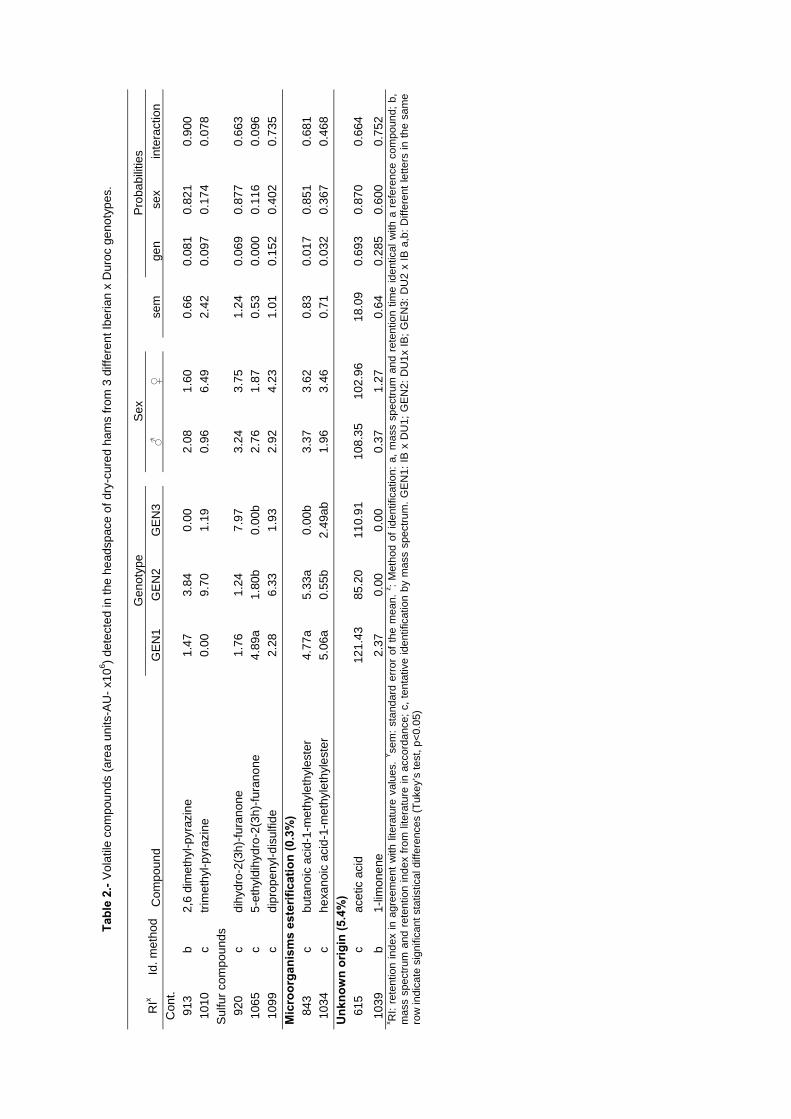
Tabl
e 2.
- Vol
atile
com
poun
ds (a
rea
units
-AU
- x10
6 ) det
ecte
d in
the
head
spac
e of
dry
-cur
ed h
ams
from
3 d
iffer
ent I
beria
n x
Dur
oc g
enot
ypes
.
G
enot
ype
Se
x
Pr
obab
ilitie
s R
Ix Id
. met
hod
Com
poun
d G
EN
1 G
EN
2 G
EN
3
♂
♀
se
m
gen
sex
inte
ract
ion
Con
t.
913
b 2,
6 di
met
hyl-p
yraz
ine
1.
47
3.84
0.
00
2.
08
1.60
0.66
0.
081
0.82
1 0.
900
1010
c
trim
ethy
l-pyr
azin
e
0.00
9.
70
1.19
0.96
6.
49
2.
42
0.09
7 0.
174
0.07
8 S
ulfu
r com
poun
ds
92
0 c
dihy
dro-
2(3h
)-fur
anon
e
1.76
1.
24
7.97
3.24
3.
75
1.
24
0.06
9 0.
877
0.66
3 10
65
c 5-
ethy
ldih
ydro
-2(3
h)-fu
rano
ne
4.89
a 1.
80b
0.00
b
2.76
1.
87
0.
53
0.00
0 0.
116
0.09
6 10
99
c di
prop
enyl
-dis
ulfid
e 2.
28
6.33
1.
93
2.
92
4.23
1.01
0.
152
0.40
2 0.
735
Mic
roor
gani
sms
este
rific
atio
n (0
.3%
)
843
c bu
tano
ic a
cid-
1-m
ethy
leth
yles
ter
4.77
a 5.
33a
0.00
b
3.37
3.
62
0.
83
0.01
7 0.
851
0.68
1 10
34
c he
xano
ic a
cid-
1-m
ethy
leth
yles
ter
5.06
a 0.
55b
2.49
ab
1.
96
3.46
0.71
0.
032
0.36
7 0.
468
Unk
now
n or
igin
(5.4
%)
61
5 c
acet
ic a
cid
121.
43
85.2
0 11
0.91
108.
35
102.
96
18
.09
0.69
3 0.
870
0.66
4
1039
b
1-lim
onen
e 2.
37
0.00
0.
00
0.
37
1.27
0.64
0.
285
0.60
0 0.
752
x RI:
rete
ntio
n in
dex
in a
gree
men
t with
lite
ratu
re v
alue
s. Y se
m: s
tand
ard
erro
r of
the
mea
n. z : M
etho
d of
iden
tific
atio
n: a
, mas
s sp
ectru
m a
nd r
eten
tion
time
iden
tical
with
a r
efer
ence
com
poun
d; b
, m
ass
spec
trum
and
rete
ntio
n in
dex
from
lite
ratu
re in
acc
orda
nce;
c, t
enta
tive
iden
tific
atio
n by
mas
s sp
ectru
m. G
EN
1: IB
x D
U1;
GE
N2:
DU
1x IB
; GE
N3:
DU
2 x
IB a
,b: D
iffer
ent l
ette
rs in
the
sam
e ro
w in
dica
te s
igni
fican
t sta
tistic
al d
iffer
ence
s (T
ukey
’s te
st, p
<0.0
5)

Chapter VII. Volatile compounds in dry-cured meat products
Several pyrazines, methyl branched aldehydes and their corresponding acids, with origin in Maillard
reaction, have been isolated from manufactured hot Spanish paprika by Mateo et al., (17). These
compounds could also contribute together with those formed from raw material to the pleasant
flavour of Iberian dry-cured loin.
3.2.- Volatile profile of Iberian dry-cured products as affected by pig genotype A few compounds showed differences between genotypes in both dry-cured products. In dry-cured
loin, no differences were found in the amount of compounds derived from the pickling mixture, as all
meat products followed the same manufacture process. Consequently, no significant differences
were found due to genotypes in the amount of terpenes and sulfur compounds. Some lipid-derived
compounds such as ketones (octane-2,3-dione), aldehydes (hexanal, heptanal), and hydrocarbons
(2-methyl-pentane) showed significant differences between genotypes. It is outstanding the
significant (p<0.01) differences in hexanal content between genotypes, being higher in GEN3 than in
GEN1 and GEN2. Hexanal has been considered a good indicator of the oxidative state of meat lipids
(24) and flavour deterioration since it is responsible for the rancid aroma in meat products when it is
present at high concentrations (11). Thus, those authors found lower hexanal and TBA-RS numbers
in Iberian dry-cured hams with less rancid flavours. However, heptanal, which adds pleasant
flavours, was higher in GEN3 than in GEN1 and GEN2. The low number of compounds which
showed differences between genotypes in dry-cured loin is in accordance with the results of Muriel et
al., (4), who did not find differences in the volatile profiles of dry-cured loins from different Iberian
genotypes. The compounds from the seasoning mixture in dry-cured loin have great importance on
the overall flavour of this meat product since sulfur and terpenes compounds were a forth of the
aroma compounds detected. The spices added in the seasoning could have contributed to disguise
the quality differences previously reported in the other parameters analyzed in fresh meat and in dry-
cured loins (36, 37) as the high level of the compounds from the seasoning may have reduced the
differences in the volatile profile among genotypes.
In dry-cured ham, only 8 compounds showed differences between batches. Hams from GEN1
showed significantly highest contents of 1-etoxi-heptan-2-one, hexan-1-ol, hepten-(E)-2-al, octanal,
hexanoic acid-1-methylethylester, butanoic acid-1-methylethylester and 5-ethyldihydro-2(3H)-
furanone, while hams from GEN2 showed significantly highest content of butanoic acid-1-
methylethylester and hams from GEN3 showed significantly highest content of 3-methyl-butanoic
acid. The scarce differences between genotypes could be due to the similar fatty acid composition of
intramuscular fat of Biceps femoris (36) as the changes in the lipids during processing are the main
contributors to volatile flavour compounds formation (8,11).
Changes in fatty acid composition of IMF affect volatile compounds, especially aldehydes formed
during the maturing of the piece (7, 11). Cava et al., (11) reported that hams manufactured from raw
meat with lower PUFA contents had lower hexanal content and were perceived as less rancid.
Consequently, the differences found in hexanal content in dry-cured loin and the lack of differences
in dry-cured ham would agree with the more marked differences of the fatty acids composition in the
raw material for the manufacture of these meat products analyzed in fresh (36).
165

Chapter VII. Volatile compounds in dry-cured meat products
3.3. Multivariate analysis. A principal component analysis (PCA) was carried out to determine the relationship between the
volatile compounds detected. PCA of these variables resulted in 5 significant factors that accounted
for 56.9% of the variability. The 30.48% and 9.81% of the variability is explained by principal
components (PC) #1 and #2, respectively.
-1,0 -0,5 0,0 0,5 1,0
Principal component 1 : 30,48%
-1,0
-0,5
0,0
0,5
1,0
Prin
cipa
l com
pone
nt 2
: 9
,81%
1-limonene
hex anal
delta-3-c arene
alpha-pinene
propenyl-2-methyl-disulfide
heptan-2-ol
dipropenyl-disulfide
prop-1-ene-3,3´thiobis
benzene-1,3-dimethyl2-(3H)-furanone 5-ethyldihydro
propanal-2-methyl
butanal-2-methyl
1-penten-3-ol
hex an-1-ol
heptan-2-one
nonanal
propan-2-one
(E)-hept-2-enal
2,6-dimethyl-nonane
acetic acidhex anoic acid
butan-1-ol-3-methyl
butanal-3-methyletanol
hex an-2-oneoctanalpentan-2-one
pentanalpentan-1-ol butanoic acidheptanal
1-octen-3-ol octana l
Figure 2.- Loadings plot after principal component analysis of the volatile compounds from dry-cured loin and
dry-cured ham in the plane defined by the two first principal components (PC1 and PC2).(○ volatile compounds non identified in the figure, ● volatile compounds with origin in Maillard reaction, ■ volatile compounds with origin
in species, □ volatile compounds with origin in lipid oxidation)
Figure 2 shows the score plot of the different variables (coefficients of the eigenvectors) for the two
first principal components (PC#1 and PC#2). Although all volatiles were included in the analysis, only
volatile compounds which explained more variation of the data have been identified in the figure. In
this plot, 2 groups of variables are clearly separated. In the positive axis on the PC#1, far from the
origin and explaining an important part of the variation are located volatile compounds isolated in dry-
cured loin, mainly those compounds with origin in species such as 1-limonene, alpha-pinene, delta-3-
carene, dipropenyl-disulfide, propenyl-2-methyl-disulfide while lipid derived compounds such as
aldehydes, ketones and alcohols and Maillard reactions compounds, such as branched aldehydes
166
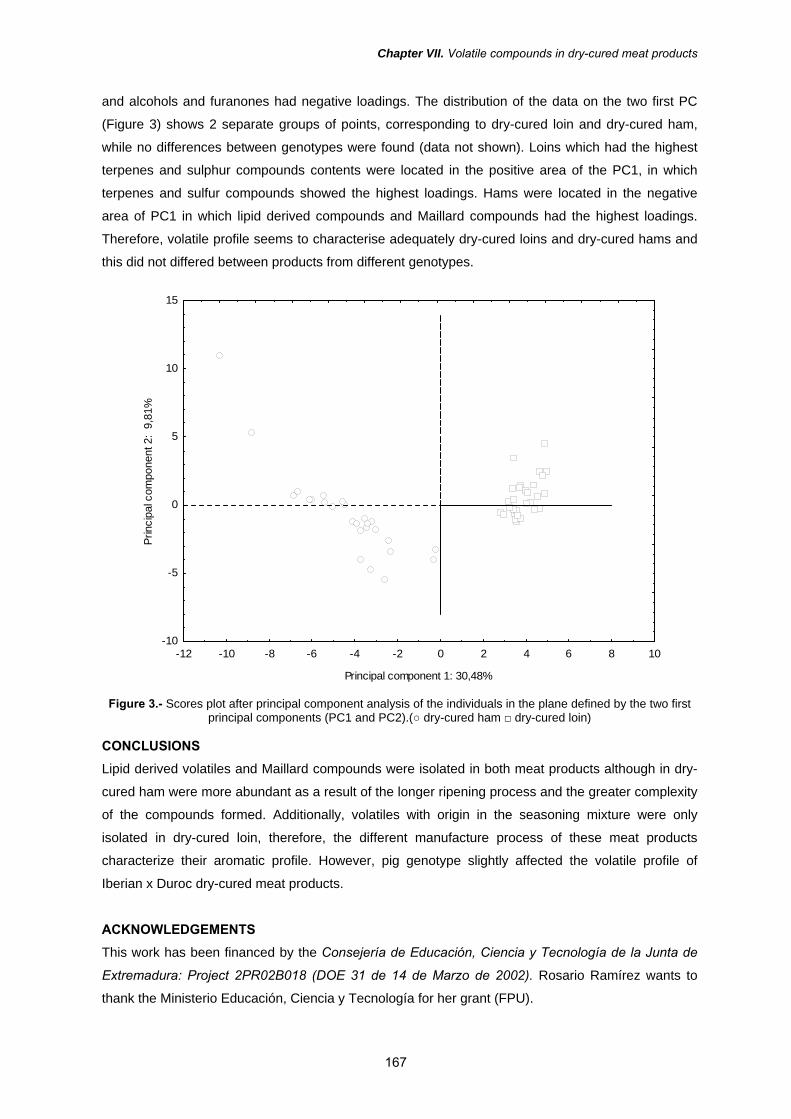
Chapter VII. Volatile compounds in dry-cured meat products
and alcohols and furanones had negative loadings. The distribution of the data on the two first PC
(Figure 3) shows 2 separate groups of points, corresponding to dry-cured loin and dry-cured ham,
while no differences between genotypes were found (data not shown). Loins which had the highest
terpenes and sulphur compounds contents were located in the positive area of the PC1, in which
terpenes and sulfur compounds showed the highest loadings. Hams were located in the negative
area of PC1 in which lipid derived compounds and Maillard compounds had the highest loadings.
Therefore, volatile profile seems to characterise adequately dry-cured loins and dry-cured hams and
this did not differed between products from different genotypes.
-12 -10 -8 -6 -4 -2 0 2 4 6 8 10
Principal component 1: 30,48%
-10
-5
0
5
10
15
Prin
cipa
l com
pone
nt 2
: 9,
81%
Figure 3.- Scores plot after principal component analysis of the individuals in the plane defined by the two first
principal components (PC1 and PC2).(○ dry-cured ham □ dry-cured loin)
CONCLUSIONS Lipid derived volatiles and Maillard compounds were isolated in both meat products although in dry-
cured ham were more abundant as a result of the longer ripening process and the greater complexity
of the compounds formed. Additionally, volatiles with origin in the seasoning mixture were only
isolated in dry-cured loin, therefore, the different manufacture process of these meat products
characterize their aromatic profile. However, pig genotype slightly affected the volatile profile of
Iberian x Duroc dry-cured meat products.
ACKNOWLEDGEMENTS This work has been financed by the Consejería de Educación, Ciencia y Tecnología de la Junta de
Extremadura: Project 2PR02B018 (DOE 31 de 14 de Marzo de 2002). Rosario Ramírez wants to
thank the Ministerio Educación, Ciencia y Tecnología for her grant (FPU).
167
Chapter VII. Volatile compounds in dry-cured meat products
LITERATURE CITED (1) López Bote, C. Sustained Utilization of the Iberian
Pig Breed. Meat Sci. 1998, 49 (I) Sl7-S27, (2 )Aparicio, J.B. El cerdo ibérico. Premio de
Investigación Sánchez Romero de Carvajal. Jabugo S.A. 1987.
(3) Cilla, I.; Altarriba, J.; Guerrero, L.; Gispert, M.; Martínez, L., Moreno, C.; Beltrán, J.A.; Guàrdia, M.D.; Diestre, A.; Arnau, J.; Roncalés, P. Effect of different Duroc line sires on carcass composition, meat quality and dry-cured ham acceptability. Meat Sci. 2006, 72 (2), 252-260.
(4) Muriel, E. ; Antequera, T. ; Petrón, M.J. ; Andrés, A.I. ; Ruiz, J. Volatile compounds in Iberian dry-cured loin. Meat Sci. 2004, 68, 391–400.
(5) Muriel, E.; Antequera, T.; Petrón, M.J.; Martín, D.; Ruiz, J. Volatile compounds on the surface and within Iberian dry-cured loin. Eur. Food Res. Technol. 2004, 219, 445-451.
(6) Aguirrezábal, M. M; Mateo, J.; Domínguez, M. C.; Zumalacárregui, J. M. The effect of paprika, garlic and salt on rancidity in dry sausages. Meat Sci. 2000, 54 (1) 77-81.
(7) García, C.; Berdagué, J.J.; Antequera, T.; López-Bote ,C.; Córdoba, J.J.; Ventanas, J. Volatile components of dry-cured Iberian ham. Food Chem. 1991, 41, 23-32.
(8) Carrapiso, A.I.; Ventanas, J.; García, C. Characterization of the Most Odor-Active Compounds of Iberian Ham Headspace. J. Agric. Food Chem., 2002, 50, 1996-2000
(9) Sabio, E.; Vidal-Aragón, M.C.; Bernalte, M.J.; Gata, J.L. Volatile compounds present in six types of dry-cured ham from south European countries. Food Chem. 1998, 61 (4) 493-503
(10) Ruiz, J.; Ventanas, J.; Cava, R.; Andrés, A.; García, C. Volatile compounds of dry-cured Iberian ham as affected by the length of the curing process. Meat Sci. 1999, 52, 19- 27
(11) Cava, R.; Ruiz, J.; Ventanas, J.; Antequera, T. Oxidative and lipolytic changes during ripening of Iberian hams as affected by feeding regime: extensive feeding and alpha-tocopheryl acetate supplementation. Meat Sci. 1999, 52 (2) 165-172
(12) Ventanas, J.; Córdoba, J.J.; Antequera, T.; García, C.; López-Bote, C.; Asensio, M.A. Hydrolysis and Maillard reaction during ripening of Iberian ham, J. Food Sci. 1992, 54(4) 813-815
(13) Mottram, D. S. Flavour formation in meat and meat products: a review. Food Chem. 1998, 62 (4), 415-424.
(14) Kondjoyan, N.; Berdagué, J. L. A Compilation of Relative Retention Indices of the Analysis of Aromatic Compounds; Laboratoire flaveur, station de recherches sur la viande, INRA: Theix, France. 1996.
(15) Kandler, O. Carbohydrate metabolism in lactic acid bacteria. Antonie van Leeuwenhoek. 1983, 49, 209–224.
(16) Martins, S.; Jongen, W.; Van Boekel, M. A review of Maillard reaction in food and implications to kinetic modelling. Trends in Food Science and Technology. 2001, 11, 364-373.
(17) Mateo, J.; Aguirrezábal, M.; Domínguez, C.; Zumalacárregui, J. M. Volatile compounds in
Spanish paprika. J. of Food Composition and Analysis. 1997, 10, 225–232.
(18) Curioni, P.M.G.; Bosset J.O., Key odorants in various cheese types as determined by gas chromatography-olfactometry. Review. International Dairy J. 2002, 12 ,959–984
(19) Frankel, E.N., Lipid oxidation. Progress in Lipid Research. 1980, 19,1-22.
(20) Martín, L.; Timón, M.L.;. Petrón, M.J.; Ventanas, J.; Antequera, T. Evolution of volatile aldehydes in Iberian ham matured under different processing conditions. Meat Sci. 2000, 54, 333-337
(21) Ansorena, D.; Gimeno, O.; Astiasarán, I.; Bello, J. Analysis of volatile compounds by GC–MS of a dry fermented sausage: chorizo de Pamplona. Food Research International. 2001, 34, 67–75.
(22) García, C.; Timón, M. L. Los compuestos responsables del ‘‘flavor’’ del jamón Ibérico. Variaciones en los distintos tipos de jamones. In J. Ventanas (Ed.), Tecnología del jamón Ibérico: de los sistemas tradicionales a la explotación racional del sabor y el aroma. Madrid: Ediciones Mundi-Prensa. 2001, 391–418.
(23) Sánchez-Peña, C.M.; Luna, G.; García-González, D.L.; Aparicio, R. Characterization of French and Spanish dry-cured hams: influence of the volatiles from the muscles and the subcutaneous fat quantified by SPME-GC. Meat Science, 2005, 69, 635–645
(24) Shahidi, F. Flavor of meat and meat products-an overview. In Flavor of Meat and Meat Products; Shahidi, F., Ed.; Chapman and Hall: Cornwall, U.K., 1994.
(25) Stahnke, L. H. Dried sausages fermented with Staphylococcus xylosus at different temperatures and with different ingredient levels. Part II. Volatile components. Meat Sci. 1995, 41(2), 193–209.
(26) Bruna, J. M.; Hierro, E. M.; De la Hoz, L.; Mottram, D. S.; Fernández, M.; Ordóñez, J. A. The contribution of Penicillium aurantiogriseum to the volatile composition and sensory quality of dry fermented sausages. Meat Sci. 2001, 59, 97–107.
(27) Martín, A.; Córdoba, J. J.; Aranda E.; Córdoba, M.; Asensio, M. A. Contribution of a selected fungal population to the volatile compounds on dry-cured ham. International Journal of Food Microbiology. 2006,110 (1) 8-18
(28) Ventanas, S., Estévez, M., Delgado, C.L. and Ruiz, J. (2006). Phospholipid oxidation, non-enzymatic browning development and volatile compounds generation in model systems containing liposomes from porcine Longissimus dorsi and selected amino acids. European Food Research and Technology. (In Press)
(29) Flores, M., Spanier, A. M., Toldrá , F.. Flavour analysis of dry-cured ham. In F. Shahidi, Flavor of meat, meat products and sea- foods. London: Blackie Academic and Professional. 1998, 320-341
(30) Ruiz, J.; Muriel, E.; Ventanas, J. The flavour of Iberian ham. In F. Toldrá (Ed.), Research advances in the quality of meat and meat
168
Chapter VII. Volatile compounds in dry-cured meat products
products. Trivandrum, India: Research Signpost. 2002.
(31) Meynier, A.; Novelli, E.; Chizzolini, R.; Zanardi, E.; Gandemer, G. Volatile compounds of commercial Milano salami . Meat Sci. 1999, 51(2) 175-183
(32) Mateo, J.; Zumalacárregui, J.M. Volatile compounds in chorizo and their changes during ripening. Meat Sci. 1996, 44 (4) 255-273
(33) Edwards, R. A.; Ordóñez, J.A.; Dainty, R.H.; Hierro, E.M.; de la Hoz L. Characterization of the headspace volatile compounds of selected Spanish dry fermented sausages. Food Chemistry, 1999, 64, 461-465.
(34) Lanzotti, V. The analysis of onion and garlic. Review. J. of Chromatography A. 2006, 1112 , 3–22
(35) Baranauskiené, R.; Venskutonis, P. R.; Dewettinck K.; Verhé, R. Properties of oregano (Origanum vulgare L.), citronella (Cymbopogon nardus G.) and marjoram (Majorana hortensis L.) flavors encapsulated into milk protein-based matrices. Food Research International. 2006, 39, 413–425
(36) Ramírez, R. ; Cava R. Carcass composition and meat quality of three different 3 Iberian x Duroc genotype pigs. Meat Sci. doi:10.1016/j.meatsci.2006.08.003
(37) Ramírez R., Cava R. (Submitted to Meat Science) Effect of Iberian X Duroc genotype on dry-cured loin quality.
169


Chapter VIII

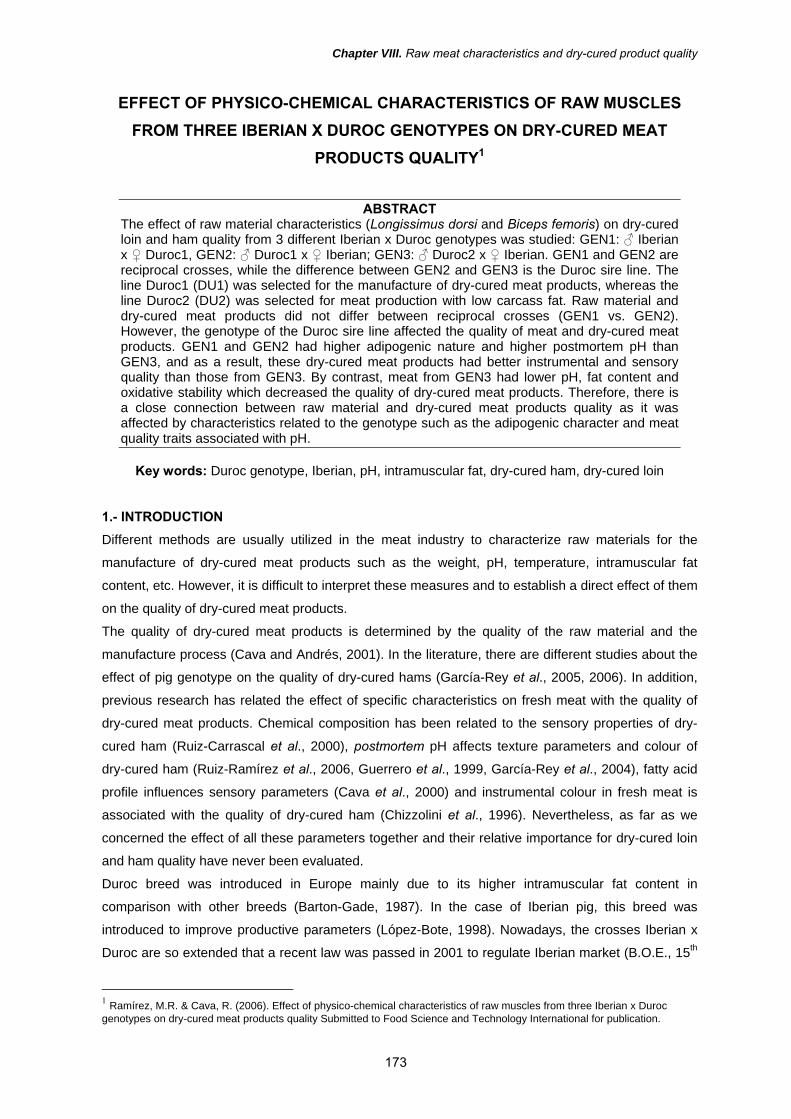
Chapter VIII. Raw meat characteristics and dry-cured product quality
EFFECT OF PHYSICO-CHEMICAL CHARACTERISTICS OF RAW MUSCLES FROM THREE IBERIAN X DUROC GENOTYPES ON DRY-CURED MEAT
PRODUCTS QUALITY1
ABSTRACT The effect of raw material characteristics (Longissimus dorsi and Biceps femoris) on dry-cured loin and ham quality from 3 different Iberian x Duroc genotypes was studied: GEN1: ♂ Iberian x ♀ Duroc1, GEN2: ♂ Duroc1 x ♀ Iberian; GEN3: ♂ Duroc2 x ♀ Iberian. GEN1 and GEN2 are reciprocal crosses, while the difference between GEN2 and GEN3 is the Duroc sire line. The line Duroc1 (DU1) was selected for the manufacture of dry-cured meat products, whereas the line Duroc2 (DU2) was selected for meat production with low carcass fat. Raw material and dry-cured meat products did not differ between reciprocal crosses (GEN1 vs. GEN2). However, the genotype of the Duroc sire line affected the quality of meat and dry-cured meat products. GEN1 and GEN2 had higher adipogenic nature and higher postmortem pH than GEN3, and as a result, these dry-cured meat products had better instrumental and sensory quality than those from GEN3. By contrast, meat from GEN3 had lower pH, fat content and oxidative stability which decreased the quality of dry-cured meat products. Therefore, there is a close connection between raw material and dry-cured meat products quality as it was affected by characteristics related to the genotype such as the adipogenic character and meat quality traits associated with pH.
Key words: Duroc genotype, Iberian, pH, intramuscular fat, dry-cured ham, dry-cured loin
1.- INTRODUCTION Different methods are usually utilized in the meat industry to characterize raw materials for the
manufacture of dry-cured meat products such as the weight, pH, temperature, intramuscular fat
content, etc. However, it is difficult to interpret these measures and to establish a direct effect of them
on the quality of dry-cured meat products.
The quality of dry-cured meat products is determined by the quality of the raw material and the
manufacture process (Cava and Andrés, 2001). In the literature, there are different studies about the
effect of pig genotype on the quality of dry-cured hams (García-Rey et al., 2005, 2006). In addition,
previous research has related the effect of specific characteristics on fresh meat with the quality of
dry-cured meat products. Chemical composition has been related to the sensory properties of dry-
cured ham (Ruiz-Carrascal et al., 2000), postmortem pH affects texture parameters and colour of
dry-cured ham (Ruiz-Ramírez et al., 2006, Guerrero et al., 1999, García-Rey et al., 2004), fatty acid
profile influences sensory parameters (Cava et al., 2000) and instrumental colour in fresh meat is
associated with the quality of dry-cured ham (Chizzolini et al., 1996). Nevertheless, as far as we
concerned the effect of all these parameters together and their relative importance for dry-cured loin
and ham quality have never been evaluated.
Duroc breed was introduced in Europe mainly due to its higher intramuscular fat content in
comparison with other breeds (Barton-Gade, 1987). In the case of Iberian pig, this breed was
introduced to improve productive parameters (López-Bote, 1998). Nowadays, the crosses Iberian x
Duroc are so extended that a recent law was passed in 2001 to regulate Iberian market (B.O.E., 15th
1 Ramírez, M.R. & Cava, R. (2006). Effect of physico-chemical characteristics of raw muscles from three Iberian x Duroc genotypes on dry-cured meat products quality Submitted to Food Science and Technology International for publication.
173
Chapter VIII. Raw meat characteristics and dry-cured product quality
October 2001). For the manufacture of dry-cured meat products labelled as ‘‘Iberian’’, ham and loins
must derive from Iberian pure pigs or from Iberian x Duroc crossed pigs (50% or 75%). In the case of
crossbreeding, the maternal line must be pure Iberian sows in order to preserve Iberian breed purity.
However, Duroc breed is not homogeneous, as due to its widespread distribution, it has been object
of different selections. Recently, most pig producers have included genetic selection in their
production programmes to improve meat quality (Visscher et al., 2000). Nonetheless, different
studies have reported the dissimilarities between Duroc lines and the different quality of dry-cured
meat products manufactured from them (Soriano et al., 2005; Cilla et al., 2006). These authors
reported that most of the parameters which affected the overall impression of dry-cured ham such as
odour, flavour and juiciness were affected by the Duroc sire line in crossbreeding with industrial
genotypes. However, this effect would be more marked in the crosses with rustic breeds like Iberian.
Therefore, the objectives of this study are characterizing the main quality descriptors in fresh meat
which affect dry-cured loin and ham quality and the effect of the genotype in 3 Iberian x Duroc pig
genotypes.
2.- MATERIAL AND METHODS
2.1.- Materials. Animals. 3 groups of 10 pigs each one were studied (5 males and 5 females) from different
genotypes: GEN1: ♂ Iberian x ♀ Duroc1, GEN2: ♂ Duroc1 x ♀ Iberian; GEN3: ♂ Duroc2 x ♀ Iberian.
The genotype Duroc1 (DU1) corresponded to pigs selected for the production of dry-cured meat
products (hams, loins, shoulders), with a high level of fattening. The genotype Duroc2 (DU2)
corresponded to animals selected for meat production, with high percentages of meat cuts and low
carcass fat. Pigs were castrated, as is traditionally done and they were raised together in a semi-
intensive system and were fed ad libitum.
2.2.- Methods. Dry-curing process. For the manufacture of the dry-cured loins, Longissimus dorsi (LD) muscle
(10loins/genotype) was removed from the carcass and processed into dry-cured loin following a
conventional process. The weight of the fresh muscle was 2.5-3.2 Kg, and pH values were lower
than 6.0. Loins were processed for a total dry-curing time of 4 months. For the manufacture of dry-
cured hams, one ham from each animal was processed (10ham/genotype). The weight of the fresh
ham was 14.0-15.5 Kg and pH values were lower than 6.0. Hams were processed for a total dry-
curing time of 24 months. After the ripening process, the Biceps femoris (BF) muscles were removed
from the hams for the analysis.
pH determination. pH values 45 min (pH45) and 24h (pHU) after slaughter in the BF and LD muscles
were measured with a puncture pHmeter Crison mod. 507.
Fat depths. Backfat thickness (BFT) and ham fat thickness (HFT) were measured in the 5th rib and in
the m. Gluteo-biceps in the carcass and ham, respectively.
Proximate composition. Lipids were extracted, according to Bligh and Dyer (1959). Protein content
was determined by the Kjieldahl method (AOAC, 2000) and moisture content was determined by
drying the samples (~5 g) at 102ºC (AOAC, 2000).
174
Chapter VIII. Raw meat characteristics and dry-cured product quality
Instrumental colour. The following colour coordinates were determined: lightness (L*), redness (a*,
red±green) and yellowness (b*, yellow±blue). Colour parameters were determined using a Minolta
CR-300 colorimeter (Minolta Camera, Osaka, Japan) with illuminant D65, a 10º standard observer
and a 2.5 cm port/viewing area. In addition, hue angle was calculated (Hº=arctg b*/ a* · 360/2π) as
well as the saturation index or chroma (C*) (C= (a*²+b*²)0.5).
Fatty Acid Profiles. Fatty acid methyl esters (FAMEs) were prepared by transesterification using
methanol in the presence of sulphuric acid (5% of sulphuric acid in methanol). FAMEs were analyzed
in a Hewlett-Packard model HP-5890A gas chromatograph, equipped with a flame ionization detector
(FID) in the conditions described in Cava et al., (1997). For the determination of fatty acid profiles of
neutral lipid fraction, total lipid extracts from intramuscular fat were fractionated by solid phase
extraction on aminopropyl minicolumns (Varian, CA) following the procedure described by Monin et
al. (2003). Drip and cook losses. Drip loss was measured following the method of Honikel (1998). Drip loss
(%) was calculated by difference in weight between day 0 and day 10 of storage. For cook loss (%),
each chop was cooked by immersion at 80ºC for 60 min. The difference of weight before and after
cooking was used to calculate cook loss percentage.
Iron-ascorbate induced lipid peroxidation. The susceptibility of muscle tissue homogenates to iron
ascorbate-induced lipid oxidation was determined by the method of Kornbrust and Mavis (1980).
TBA-RS were expressed as nmol malondialdehyde (MDA)/mg protein. Protein content was
measured in muscle homogenates following Lowry method (Lowry et al., 1951).
Lipid oxidation. Lipid oxidation was assessed in duplicate by the 2-thiobarbituric acid (TBA) method
of Salih et al., (1987). TBA-RS values were expressed as mg malondialdehyde/kg meat. Hexanal
content was assessed by SPME-GC-MS following the method described by Ramírez and Cava
(submitted).
Protein oxidation. Protein oxidation was measured following the method described by Oliver et al.,
(1987). Protein oxidation was expressed as nmol carbonyls/mg protein. Protein concentration was
calculated by spectrophotometry at 280 nm using bovine serum albumin (BSA) as standard.
Tissue enzyme activity of lipogenic enzymes. Glucose-6-phosphate dehydrogenase (G6PDH)
and malic enzyme (ME) activities were measured in SCF and muscle homogenates at 340 nm at
30 °C for 3 min with a thermospectrophotometer (Thermo Electron Corp. Helios α. Waltham, MA) and
expressed on the basis of nmol NADP+ reduced to NADPH per min per mg protein. Glucose-6-
phosphate dehydrogenase (G6PDH) was determined by the method of Bautista et al., (1988). Malic
enzyme (ME) determination was measured according to the method of Spina et al., (1970). Protein
determination was measured spectrophotometrically at 595nm according to the method of Bradford
(1976).
Weight loss during refrigerated storage. To perform the assay, dry-cured loin chops were cut into
1 x 1 x 1 cm cubes. The dry-cured loin cubes were supported with a needle on Styrofoam plates and
refrigerated at 4ºC for 10 days. Sample cubes were weighed at day 5 and day 10 of storage. The
percentage of loss was calculated by difference of weight.
175
Chapter VIII. Raw meat characteristics and dry-cured product quality
Texture analysis. Texture analysis was performed in a texturometer TA XT-2i Texture Analyser
(STable Micro Systems Ltd., Surrey, U.K.). For the determination of texture profile analysis (TPA)
uniform portions of the samples were cut into 1cm3 cubes. They were axially compressed to 50% of
the original height with a flat plunger 50 mm in diameter (P/50) at a crosshead speed of 2 mm/s
through a 2-cycle sequence. The following texture parameters were measured from force–
deformation curves: Hardness (N/cm2), adhesiveness (N s), springiness (cm), cohesiveness
(dimensionless) and chewiness (N s). For Warner-Bratzler (W-B) analyses, samples were prepared
in 2 x 30 x 15mm slices (thickness x length x width) using a slicing machine. Samples were cut with a
Warner-Bratzler blade (HDP/BS) in perpendicular direction to the muscle fibres. Determinations were
repeated 8 times per sample and were averaged.
Sensory analysis. Fourteen trained panellists formed the tasting panel. A profile of 11 sensory
attributes of dry-cured loin and ham grouped in appearance, aroma, texture, flavour and taste were
analysed (Table 1). Analyses were developed in tasting rooms with the conditions specified in UNE
regulation. The software used was FIZZ Network (version 1.01: Biosystemes, France). Slices of meat
products were served on plates to panellists. Panellists evaluated different parameters by means of a
quantitative-descriptive analysis in a non structured scale 0-10. Three samples randomly presented
to the panellist were analysed in each tasting session.
Table 1. Descriptors of the sensory analysis of the dry-cured meat products.
Descriptors Definition Appearance
colour Intensity of red colour in the lean (pink-red) marbling Level of visible intramuscular fat (very lean-intense marbled) Aroma odour Level of overall odour before eatingthe sample (odourless - very intense odour)
Texture hardness Firmness perception during chewing (very tender- very firm)
fibrousness Perception of fibres during chewing (not fibrous-very fibrous) juiciness Impression of juiciness during chewing (not juicy - very juicy) Flavour
flavour intensity Intensity of overall flavour (flavourless - very intense flavour) Taste
sweet taste Intensity of sweet taste (not sweet - very sweet) salty taste Intensity of salt taste (not salty - very salty) acid taste Intensity of acid taste (not acid- very acid) bitter taste Intensity of bitter taste (not bitter- very bitter)
Statistical analysis. Pearson correlations coefficients were calculated with the programme SPSS,
version 12.0 (SPSS, 2003). Only the parameters with a significant effect are shown in the tables.
Parameters which provided more information were selected for the analysis of the principal
components (PCA).
3.- RESULTS 3.1.- Effect of fresh Longissimus dorsi traits on dry-cured loin quality. Table 2 shows the correlations between composition, instrumental and sensory parameters from raw
Longissimus dorsi (LD) and dry-cured loin. Proximate composition of dry-cured loin was closely
related to that from LD. IMF contents in raw LD and dry-cured loins were highly positively correlated.
176
Chapter VIII. Raw meat characteristics and dry-cured product quality
IMF content in fresh LD affected in a great extent the quality of the dry-cured loin. IMF content of LD
significantly affected instrumental texture parameters of dry-cured loins as it negatively correlated
with hardness and chewiness. In addition, this parameter was related to the sensory characteristics
of the dry-cured loin, as suggested the positive correlations found for marbling, juiciness and sweet
taste, and the negative ones with fibrousness, acid and salty tastes. The IMF content of the LD
positively correlated with instrumental colour coordinates (CIE L*, a*, b) of dry-cured loin, which could
indicate that LD with higher IMF content provided also a more intense colour in the dry-cured
product.
Significant positive correlations were found between back fat thickness (BFT) and dry-cured loin
colour (a* and b*) and sensory parameters (marbling, odour, juiciness and sweetness), while BFT
and instrumental hardness were negatively correlated. On the other hand, the activity of the lipogenic
enzyme G6PDH in the LD muscle correlated negatively with instrumental hardness, springiness and
chewiness, with salty and acid tastes and with hexanal content, and positively, with sweet taste of
dry-cured loin. In contrast, ME activity correlated positively with odour intensity of dry-cured loin.
A close relationship between ultimate pH values of raw LD and some traits of dry-cured loins were
found. pHu negatively correlated with weight loss during storage, with certain instrumental texture
parameters, such as springiness and chewiness, and with hexanal.
Instrumental colour in raw LD showed close relationships with some parameters in dry-cured loin. In
LD, CIE L* correlated positively with springiness and hexanal content of dry-cured loin, while CIE a*
correlated positively with IMF content, with CIE a* and CIE b*, with marbling and with sweetness of
the final product.
Drip-loss (%) correlated negatively with IMF content and positively with hexanal content in dry-cured
loin. Cook loss (%) correlated negatively with instrumental colour (a* and b*), with some sensory
characteristics (marbling, colour intensity, juiciness and sweet taste) and positively with instrumental
texture parameters (springiness and chewiness), with salty and acid tastes and with hexanal content.
PUFA content of IMF in the raw LD and IMF content of loins were negatively correlated. Furthermore,
negative correlations were found between PUFA and instrumental colour parameters (CIE L*, a* and
b*), and sensory parameters such as marbling, juiciness and sweet taste; however it was positively
correlated with instrumental hardness and chewiness and with salty taste in dry-cured loin.
Parameters related to the oxidative susceptibility of the muscle in fresh such as iron-induced lipid
peroxidation values (IILP) were associated with the colour of the dry-cured loin, as show the negative
correlations between IILP values and dry-cured loin instrumental colour coordinates (CIE L*, a*, b*).
Texture of the final product was affected by parameters linked to the oxidative susceptibility, since
IILP was positively correlated with instrumental springiness and chewiness and with sensory
fibrousness. IILP values showed a positive correlation with hexanal content in dry-cured loin. TBA-
RSday 10 correlated positively with weight loss during storage and springiness of dry-cured loin.
177

Ta
ble
2.- P
ears
on c
oeffi
cien
t cor
rela
tions
bet
wee
n se
lect
ed p
aram
eter
s fro
m ra
w m
. Lon
giss
imus
dor
si a
nd d
ry-c
ured
loin
.
dry-
cure
d lo
in
Pro
x.C
omp.
Tech
nol.
Qua
l. In
stru
men
tal c
olor
In
stru
men
tal t
exut
ure
Sen
sory
ana
lysi
s Li
pid
oxid
atio
n
IM
F W
l L
a*
b W
BS
Fha
rd
adhe
siv.
sprin
gine
ss
chew
in.
mar
blin
god
our
fibro
us.
juic
in.
swee
tn.
salti
n.
acid
TB
A
hexa
nal
IMF
0.88
6***
-0
.146
0.
840*
**
0.73
9***
0.72
4***
-0.3
48-0
.574
***
-0.2
51
-0.3
51
-0.4
71**
0.
774*
**0.
354
-0.4
38*
0.61
4***
0.51
0**
-0.4
44*
-0.4
21**
-0.0
49
-0.4
31*
BFT
0.
356
-0.1
69
0.19
5 0.
533*
*0.
453*
-0
.118
-0.4
13*
-0.1
94
-0.2
25
-0.3
41
0.51
3**
0.50
8**
0.00
0 0.
493*
*0.
625*
**-0
.321
-0.3
32
0.16
1 -0
.301
G
6PD
H
0.30
3 -0
.287
0.
244
0.34
4 0.
364
-0.0
15-0
.483
**
-0.0
70
-0.5
07**
-0
.599
***
0.33
1 0.
224
-0.2
820.
199
0.37
2*
-0.4
58*
-0.3
80*
-0.0
95 -
0.58
4***
M
E
0.03
6 -0
.201
-0
.020
0.
233
0.15
9 -0
.044
-0.1
83
-0.0
42
-0.0
53
-0.1
60
0.28
2 0.
485*
*-0
.009
0.23
3 0.
333
-0.0
29-0
.047
0.
332
-0.1
43
pH45
min
0.19
8 -0
.033
0.
285
0.21
6 0.
288
-0.1
68-0
.073
0.
027
-0.1
48
-0.1
09
0.06
1 0.
193
-0.1
820.
170
-0.0
54
0.05
3 -0
.018
0.
153
0.14
4 pH
U
0.04
7 -0
.369
* 0.
034
0.21
3 0.
223
0.09
6-0
.291
0.
078
-0.4
73**
-0
.472
* 0.
157
0.28
9 -0
.143
0.12
8 0.
214
-0.1
33-0
.184
0.
206
-0.5
13**
C
IE L
* 0.
214
0.32
6 0.
246
0.03
7 0.
030
-0.0
630.
039
-0.0
64
0.44
3*
0.33
1 0.
161
-0.1
110.
068
0.13
9 0.
066
-0.0
200.
179
0.03
2 0.
542*
* C
IE a
* 0.
391*
-0
.047
0.
243
0.42
6*
0.41
0*
-0.2
90-0
.257
-0
.179
0.
100
-0.0
62
0.42
1*
0.26
6 -0
.143
0.30
7 0.
460*
-0
.200
-0.2
39
-0.0
88
-0.0
42
DL
-0.4
10*
0.14
4 -0
.288
-0
.263
-0
.238
0.
099
0.32
7 0.
178
0.33
1 0.
317
-0.3
48
-0.0
790.
340
-0.2
73
-0.2
73
0.36
0 0.
345
0.02
7 0.
680*
**
CL
-0.3
53
0.34
1 -0
.252
-0
.430
* -0
.480
**-0
.062
0.36
3 0.
141
0.47
3**
0.48
4*
-0.4
24**
-0.3
90*
0.19
3 -0
.383
*-0
.505
**0.
455*
0.40
9*
0.14
6 0.
673*
**
PU
FA IM
F -0
.824
***
0.21
1 -0
.571
***
-0.6
61**
*-0
.612
***
0.28
00.
476*
* 0.
154
0.29
2 0.
375*
-0
.793
***
-0.3
430.
242
-0.5
22**
-0.5
40**
0.53
1**
0.34
0 0.
073
0.25
6 P
UFA
NL
-0.5
61**
0.
287
-0.3
51
-0.4
02*
-0.3
97*
0.09
50.
398*
-0
.052
0.
285
0.34
4 -0
.618
***
-0.1
550.
199
-0.3
63
-0.4
11*
0.42
3*0.
297
0.16
0 0.
341
IILP
-0
.388
* 0.
147
-0.4
34*
-0.4
51*
-0.5
74**
-0.1
100.
374
0.04
7 0.
388*
0.
385*
-0
.418
* -0
.234
0.41
0*-0
.344
-0
.339
0.
354
0.34
3 0.
059
0.65
3***
TB
A d
0 -0
.036
0.
258
0.08
3 -0
.033
-0
.099
-0
.419
-0.1
01
-0.3
92*
0.40
6*
0.21
0 0.
047
0.01
2 -0
.078
0.17
0 0.
107
0.04
1 -0
.066
-0
.006
0.
276
TBA
d 10
0.12
6 0.
533*
* 0.
301
0.01
0 0.
026
-0.3
07-0
.096
0.
036
0.45
9*
0.28
6 0.
176
0.00
4 -0
.171
0.18
7 0.
001
0.25
7 0.
261
0.35
5 0.
361
m. Longissimus dorsi
Car
b d10
-0
.148
0.
179
0.00
7 -0
.219
-0
.158
-0
.200
-0.0
83
0.01
0 -0
.031
-0
.098
-0
.239
-0
.381
*-0
.114
-0.1
09
-0.1
66
-0.1
02-0
.191
-0
.055
-0
.028
IM
F: in
tram
uscu
lar
fat;
BFT
: bac
kfat
thic
knes
s, G
6PD
H: g
luco
se 6
pho
spha
te d
ehyd
roge
nase
; ME
: mal
ic e
nzym
e; p
Hu:
pH
ulti
mat
e; D
L: d
rip lo
ss; C
L: c
ook
loss
, PU
FA IM
F: p
olyu
nsat
urat
ed fa
tty
acid
s fro
m in
tram
uscu
lar
fat;
PU
FAN
L: P
olyu
nsat
urat
ed fa
tty a
cids
from
neu
tral l
ipid
frac
tion;
IILP
: iro
n-in
duce
d lip
id p
erox
idat
ion
min
200
; TB
Ad0
: TB
A-R
S d
ay 0
; TB
Ad1
0: TB
A-R
S d
ay 1
0; C
arb d
10:
carb
onyl
s da
y 10
; pro
x. C
omp:
pro
xim
ate
com
posi
tion;
WB
SF:
War
ner-
Bra
tzle
r she
ar fo
rce,
Har
d: h
ardn
ess
TPA
, wl.
wei
ght l
oss.
*
Bila
tera
l sig
nific
ant P
ears
on’s
cor
rela
tion
at le
vel p
<0.0
5 **
Bila
tera
l sig
nific
ant P
ears
on’s
cor
rela
tion
at le
vel p
<0.0
1; *
** B
ilate
ral s
igni
fican
t Pea
rson
’s c
orre
latio
n at
leve
l p<0
.001

Tabl
e 3.
- Pea
rson
coe
ffici
ent c
orre
latio
ns b
etw
een
sele
cted
par
amet
ers
from
raw
m. B
icep
s fe
mor
is a
nd d
ry-c
ured
ham
.
dr
y-cu
red
ham
P
rox.
Com
p.
Inst
rum
enta
l col
or
Inst
rum
enta
l tex
ture
S
enso
ry a
naly
sis
Lipi
d ox
idat
ion
IM
F L
a*
b*
WB
ha
rd
colo
ur
mar
blin
g ha
rdne
ss
fibro
us.
juic
ines
s ar
oma
swee
tnes
s ac
id
TBA
he
xana
l IM
F -0
.124
0.
136
0.37
6 0.
685*
**0.
252
-0.0
12
-0.0
40
-0.0
14
0.26
7 -0
.022
-0
.034
-0
.009
-0
.218
0.
016
0.03
0 -0
.067
B
FT
0.15
9 0.
191
0.43
4*
0.24
5 0.
035
-0.1
89
0.22
6 0.
536*
**
0.13
7 -0
.255
0.
266
0.23
0 0.
122
-0.2
55
0.12
6 -0
.141
H
FT
-0.2
43
0.24
3 0.
469
0.27
3 -0
.113
-0
.398
* 0.
038
0.19
7 0.
029
-0.0
66
0.29
8 0.
161
-0.0
42
-0.3
44*
-0.1
15
-0.0
32
G6P
DH
0.
003
0.38
3 0.
364*
* 0.
210
-0.1
88
-0.1
81
0.01
9 0.
411*
0.
026
-0.1
32
0.24
9 0.
291
-0.0
73
-0.5
39
-0.1
98
-0.3
66
ME
-0
.019
0.
130
0.60
2***
0.56
9***
-0.0
72
-0.1
65
0.12
8 0.
147
-0.2
58
-0.5
69**
*0.
333
0.15
7 0.
114
-0.3
93**
0.
005
-0.2
43
pH45
min
-0.0
26
0.18
5 0.
263
0.08
4 -0
.301
-0
.174
-0
.031
0.
047
-0.2
25
-0.1
27
0.15
5 0.
149
-0.0
08
-0.3
93*
-0.3
34
0.05
1 pH
U
0.09
8 0.
038
0.24
4 -0
.105
-0
.082
-0
.078
0.
259
0.29
2 0.
096
-0.1
05
0.02
9 0.
128
-0.1
10
-0.3
61
-0.6
19**
*-0
.337
C
IEL*
d0
-0.0
83
-0.1
13
0.02
6 0.
313
0.14
5 -0
.005
-0
.188
-0
.211
0.
002
0.07
1 -0
.065
0.
007
0.25
9 0.
332
0.53
6**
0.30
9 C
IEa*
d0
0.10
9 -0
.026
-0
.309
-0
.309
0.
012
0.33
2 -0
.019
0.
192
0.15
7 0.
284
0.08
5 -0
.045
0.
109
0.03
3 0.
092
-0.0
75
CIE
b*d0
0.
012
-0.1
40
-0.2
01
0.13
1 0.
087
0.07
0 -0
.098
-0
.135
0.
019
0.20
9 -0
.052
-0
.087
0.
224
0.27
3 0.
442*
0.
104
CIE
a*d1
0 0.
261
0.27
3 0.
137
-0.0
84
-0.1
57
0.15
3 0.
070
0.54
9**
0.05
3 -0
.125
0.
220
0.27
8 -0
.074
-0
.412
* -0
.433
* -0
.209
D
L -0
.045
-0
.260
-0
.165
-0
.067
0.
310
0.14
8 0.
016
-0.5
87**
0.
001
0.10
8 -0
.200
-0
.463
*-0
.198
0.
317
0.31
2 -0
.090
C
L -0
.024
0.
043
-0.2
45
0.19
4 0.
249
0.06
0 0.
077
-0.0
80
0.24
3 0.
107
-0.1
19
0.09
2 0.
123
0.19
7 0.
226
0.15
3 P
UFA
IMF
0.11
6 -0
.110
-0
.285
-0
.579
**
-0.1
21
-0.2
32
-0.0
99
-0.0
33
-0.3
71
-0.0
97
0.22
1 -0
.058
0.
327
-0.1
30
0.01
9 -0
.065
P
UFA
NL
0.26
7 0.
237
-0.2
26
-0.2
81
-0.1
80
-0.3
73
-0.3
51
-0.1
31
-0.4
77*
-0.1
71
0.21
2 -0
.166
0.
306
-0.3
08
0.03
7 -0
.206
IIL
P
-0.0
58
-0.0
08
0.26
4 0.
345
0.16
5 -0
.132
-0
.179
-0
.159
-0
.142
-0
.304
0.
184
-0.0
39
0.20
9 0.
127
0.65
1***
0.
296
TBA
d0
-0.2
56
-0.3
71
-0.0
80
-0.1
18
0.06
8 0.
034
-0.0
54
-0.3
78
-0.0
23
0.09
3 -0
.223
-0
.404
*-0
.099
0.
344
0.35
1 -0
.015
TB
A d1
0 -0
.025
-0
.356
-0
.113
-0
.282
0.
143
-0.0
25
0.18
8 -0
.266
-0
.040
0.
357
-0.0
21
-0.0
66
0.15
8 0.
263
0.41
3*
0.28
6
m. Bíceps femoris
Car
b d10
-0
.137
-0
.065
-0
.056
-0
.281
0.
395*
-0
.109
-0
.429
* -0
.273
0.
275
-0.0
22
-0.2
04
-0.1
79
0.07
3 -0
.002
0.
011
-0.1
10
IMF:
intra
mus
cula
r fat
; BFT
: bac
kfat
thic
knes
s, G
6PD
H: g
luco
se 6
pho
spha
te d
ehyd
roge
nase
; ME
: mal
ic e
nzym
e; p
Hu:
pH
ulti
mat
e; D
L: d
rip lo
ss; C
L: c
ook
loss
, PU
FA IM
F: po
lyun
satu
rate
d fa
tty
acid
s fro
m in
tram
uscu
lar f
at; P
UFA
NL:
Pol
yuns
atur
ated
fatty
aci
ds fr
om n
eutra
l lip
id fr
actio
n; II
LP: i
ron-
indu
ced
lipid
per
oxid
atio
n m
in 2
00; T
BA
d0: T
BA
-RS
day
0; T
BA
d10:
TBA
-RS
day
10;
C
arb d
10: c
arbo
nyls
day
10;
pro
x. C
omp:
pro
xim
ate
com
posi
tion;
WB
SF:
War
ner-
Bra
tzle
r she
ar fo
rce,
Har
d: h
ardn
ess
TPA
. col
our:
colo
ur in
tens
ity.
* B
ilate
ral s
igni
fican
t Pea
rson
’s c
orre
latio
n at
leve
l p<0
.05
** B
ilate
ral s
igni
fican
t Pea
rson
’s c
orre
latio
n at
leve
l p<0
.01;
***
Bila
tera
l sig
nific
ant P
ears
on’s
cor
rela
tion
at le
vel p
<0.0
01
Chapter VIII. Raw meat characteristics and dry-cured product quality
3.2.- Effect of fresh Biceps femoris traits on dry-cured ham quality. Correlations between parameters of BF and dry-cured ham followed similar pattern than in dry-cured
loin (Table 3), however, they showed a lower number of significant correlations than those previously
described.
Surprisingly, no significant correlation was found between IMF content in raw BF and dry-cured BF,
although significant positive correlations were found between fat thickness measurements and
marbling in ham. HFT correlated negatively with instrumental hardness and with acid taste of dry-
cured ham. Among others, the activity of G6PDH lipogenic enzyme correlated positively with
marbling.
Negative correlations were found between postmortem pH45min and acid taste and between pHU and
TBA-RS in dry-cured ham. Lightness (CIE L*) and yellowness (CIE b*) of BF correlated positively
with TBA-RS of dry-cured ham while CIE a* did not correlated with any parameter of dry-cured ham.
However, values of CIE a* after storage correlated positively with marbling, and negatively with acid
taste and with TBA-RS numbers.
Drip loss showed negative correlations with marbling and aroma, whereas cook loss did not correlate
with other parameters.
PUFAs of NL were negatively correlated with sensory hardness. Lipid oxidation values such as TBA-
RSday 0 were negatively correlated with aroma intensity of dry-cured ham. Besides, TBA-RSday 10 and
IILP in raw material were associated with TBA-RS of dry-cured ham. On the other hand, carbonyl
concentration from protein oxidation (day 10) showed positive correlations with instrumental texture
parameters such as with WB shear force and negative with the colour intensity perceived by
panellists.
3.3.- Multivariate analysis A principal component analysis (PCA) was carried out to determine the relationship between the
selected studied traits of Longissimus dorsi and dry-cured loin parameters. The PCA of these
variables resulted in 5 significant factors that accounted for 62.74% of the variability. Principal
components, PC1 and PC2, explained the 27.27% and 15.42% of the data variation, respectively.
Figure 1 shows the score plot of the different variables (eigenvectors coefficients) for the two first
principal components (PC1 and PC2). The distribution of individuals on the two first PC (Figure 2)
shows 2 separate groups of points GEN1 and GEN2 located in the positive x axis, while the GEN3 is
located in the negative x axis. In dry-cured loin, the most important parameters associated with
GEN1 and GEN2 and which differentiate those meat and meat products from GEN3 were those
parameters related to the adipogenic character of the pigs such as fat thickness, lipogenic enzyme
activity, IMF content of the LD as well as marbling and IMF content of LD and dry-cured loin. In
addition, GEN1 and GEN2 were associated with postmortem pH, instrumental colour parameters of
LD and dry-cured loin and some sensory characteristics of loins such as odour, juiciness and
sweetness. In contrast, the parameters associated with GEN3 were cook and drip losses, PUFA
content, IILP of LD as well as hexanal content, instrumental texture (hardness, springiness and
adhesiveness) and salty and acid tastes of dry-cured loin.
180

Chapter VIII. Raw meat characteristics and dry-cured product quality
Similarly, another PCA was carried out to determine the relationship between the selected studied
traits in Biceps femoris and in dry-cured ham parameters. The PCA of these variables resulted in 5
significant factors that accounted for 61.61% of the variability. Principal components, PC1 and PC2,
explained the 20.28% and 15.61% of the variation of the data, respectively. Figure 3 shows the score
plot of the variables for the two first principal components (PC1 and PC2). The distribution of
genotypes on the two first PC (Figure 4) shows 2 separate groups of points GEN1 and GEN2 located
in the positive x axis, while the GEN3 is located in the negative x axis. Parameters associated with
GEN1 and GEN2 in raw material were postmortem pH and those related to the adipogenic character
of the pigs such as BFT, HFT and lipogenic enzyme activity, while those related to dry-cured ham
were instrumental colour values and sensory parameters (marbling, juiciness and aroma intensity).
However, the parameters associated with GEN3 were lightness (L*), lipid and protein oxidation, drip
and cook losses and PUFA content of BF as well as texture parameters such as hardness,
fibrousness and adhesiveness of dry-cured ham.
Therefore, the higher adipogenic characteristics of the pigs from GEN1 and GEN2 and their higher
pH value and low cook and drip losses together with higher oxidative stability are the main factors
that differentiate raw meat and dry-cured meat products from these genotypes to those from GEN3,
which had a poorer quality.
4.- DISCUSSION Parameters related to the fat content of meat such as fat thickness, IMF content, lypogenic enzymes
activity were some of the most determinant parameters of the differences between genotypes in
fresh and on dry-cured meat products. The level of fattening of the pieces such as the subcutaneous
fat thickness (BFT and HFT) as well as the IMF content affects the drying process, as it is necessary
a thick fat covering the ham to avoid an excess of dehydration of the pieces. The positive effect of
high IMF content in dry-cured meat products has been previously reported by other authors (Cava et
al., 2000; Ruiz-Carrascal et al., 2000). These reported an improvement of the juiciness in those
pieces with higher IMF content. In addition, IMF content had a positive effect on texture and
appearance of hams, such as in oiliness, brightness, juiciness and marbling while it was negatively
related to dryness, fibrousness and hardness (Ruiz-Carrascal et al., 2000). We have found similar
results as IMF content enhanced texture and appearance of dry-cured meat products. On the other
hand, although IMF did not correlate with odour and flavour intensity, it could affect the formation of
volatile compounds with sweet taste, as indicated the positive correlations between both parameters.
An adequate IMF content affects the formation of aroma compounds such as lipid derived
compounds and Maillard compounds in dry-cured meat products (Shahidi, et al., 1986; Mottram,
1998) which could provide sweet taste. In addition, the higher the IMF content, the lower the diffusion
rate of sodium chloride through the piece, due to the lower diffusion coefficient of salt in the fat than
in the lean tissue, which could favour as a result sweet taste perception (Arnau, et al., 1997).
Genotypes with higher IMF content (GEN1 and GEN2) had better colour in both muscles in fresh
than GEN3, which had an intense paleness (high CIE L*). This could explain the positive relationship
between IMF and instrumental colour values of dry-cured meat products. Previous studies about the
181

Chapter VIII. Raw meat characteristics and dry-cured product quality
effect of meat quality on dry-cured ham quality (Chizzolini et al., 1996) have found a link between low
postmortem pH and colour before curing with the colour of dry-cured hams. Although, they also
reported that processing had a positive effect on the colour of pale meat.
The raw material from Iberian pigs does not present usually problems associated with low
postmortem pH, in contrast with other selected genotypes such as Pietrain, Landrace, Large White,
etc. However, the inclusion of selected genotypes in the crosses with Iberian pig could increase the
incidence of problems associated to a low muscle pH.
Low postmortem pH favours the appearance of defectives colour and textures in dry-cured hams
(García-Rey et al., 2004; 2006), which affect negatively consumer acceptability (Cilla et al., 2005).
On the other hand, proteolytic activity of the cathepsin enzymes is maintained throughout the dry-
curing process (Sárraga et al., 1993; Toldrá and Etherington, 1988) and is favoured at low pH. Hams
with increased peptide and free aminoacids concentrations are bitter (Virgili et al., 1998, Ruiz et al.,
1999), saltier and more acids (Careri et al., 1993). That could be related to the more intense
perception of salt and acid tastes in dry-cured products from GEN3.
The relationship between low postmortem pH and the colour stability of meat products has been
broadly studied as oxidation of myoglobin is pH dependent (reviewed by Baron and Andersen, 2002).
Low postmortem pH favour the oxidation of myoglobin avoiding their linkage with nitrite compounds
which decrease colour intensity in dry-cured meat products. On the other hand, Juncher et al., (2003)
reported a significant effect of postmortem pH in the oxidative and colour stability during the storage
of nitrite-cured cooked meat products. These results are in accordance with those previously
reported by Sárraga and García-Regueiro (1998) who studied in-vitro the microsomal fraction in the
processing conditions of dry-cured ham and found higher lipid oxidation development in PSE pigs.
Similarly, Cilla et al., (2006) reported that modified-atmosphere-packaged ham slices had intense
changes affecting sensory quality, particularly in visual appearance, flavour loss, off-flavour
formation, saltiness and rancidity due to oxidation development caused by low pH. This could explain
the greater oxidative susceptibility of dry-cured products from pigs with lowest postmortem pH.
The measurement of weight loss of dry-cured meat products is important because the excessive
drying of the surface affects negatively their appearance and acceptability when they are sliced and
packaged (Ventanas and Córdoba, 1992). The relationship between weight loss with PUFA content
and TBA-RSday10 values in dry-cured loin could be due to the lower water holding capacity of meat
with low postmortem pH (reviewed by Huff-Lonergan and Lonergan, 2005), which could have
favoured the exudation of water in the dry-cured meat product. Similar results were found by Isabel
et al. (1999) who related weight loss of dry-cured meat products with the extent of lipid oxidation
reactions. Some authors (Monahan et al., 1994) have suggested that there is a relationship between
the oxidation of membrane phospholipids during storage and weight loss since the integrity of the
membrane could inhibit the passage of sarcoplasmic fluid through the muscle and cell membrane.
182

imf L
D
moist
LD
prot
LD
BFT
G6PD
H LD
ME L
D
L*-L
D
a*-L
D
b*-L
D
a*-L
D d1
0
IILP
TBA
d0 L
D
TBA d
10 LD
POX
d10
LD
CL
DLpH
45
pHu
PUFA
IMF PU
FA N
L
WL
Loin
L* lo
ina* lo
inb*
loin
WBS
F loi
n
Hard
loin
Adh
loin
Sprin
g loi
n
Coh
loin
Chew
loin
MARB
loin
ODO
loin
HARD
loin
FIB
loin
JUIC
loin
AROM
loin
SWE
loin
SALT
loin
ACID
loin
BITT
loin
moist
loin
prot
loin
imf lo
in
TBA
loin
hexa
nal
-1,0
-0,5
0,0
0,5
1,0
Prin
cipa
l com
pone
nt 1
: 27,
27%
-1,0
-0,50,0
0,5
1,0
Principal component 2 : 15,42%
1
11
1
11
1
1
1
22
22
22
22
23
3
3
3
3
3
3
3
3 3
-8-6
-4-2
02
46
8
Prin
cipa
l com
pone
nt 1
: 27,
27%
-8-6-4-202468
Principal component 2: 15,42%
Fi
gure
1.-
Load
ings
plo
t afte
r prin
cipa
l com
pone
nt a
naly
sis
of th
e va
riabl
es o
f L. d
orsi
an
d dr
y-cu
red
loin
in th
e pl
ane
defin
ed b
y th
e tw
o fir
st p
rinci
pal c
ompo
nent
s (P
C1
and
PC
2). ●
raw
LD
, ○ d
ry-c
ured
loin
.
Fi
gure
2.-
Sco
res
plot
afte
r prin
cipa
l com
pone
nt a
naly
sis
of th
e in
divi
dual
s in
the
plan
e de
fined
by
the
two
first
prin
cipa
l com
pone
nts
(PC
1 an
d P
C2)
of t
he v
aria
bles
of L
. dor
si
and
dry
-cur
ed lo
in. (□
GE
N1,
○ G
EN
2, ■
GEN
3.)
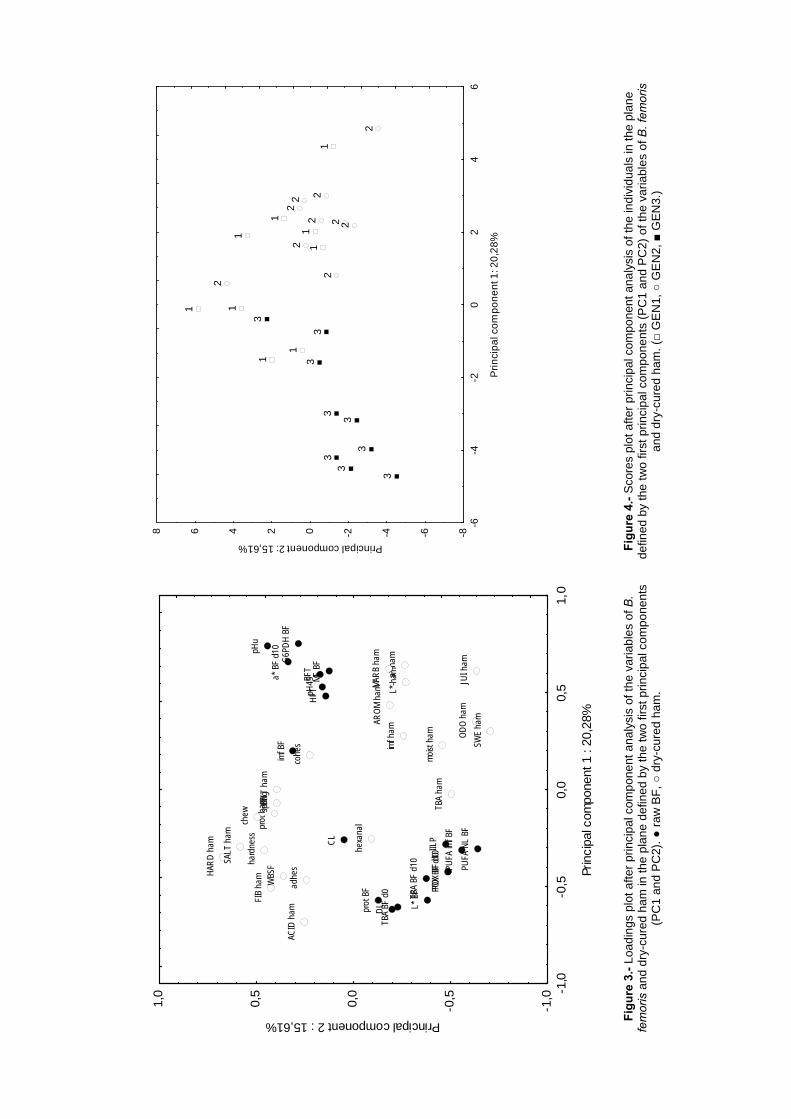
imf B
F
prot
BF
L* B
F
a* B
F d1
0
BFT
HFT
G6PD
H BF
ME B
F
IILP
TBA
BF d
0 TBA
BF d
10
POX
BF d
0PO
X BF
d10
CL
DL
pHu
pH45
PUFA
imf B
F
PUFA
NL
BF
L*-h
ama*-h
am
moist
ham
imf h
am
prot
ham TB
A ha
m
MARB
ham
ODO
ham
HARD
ham
FIB
ham
JUI h
am
AROM
ham
SWE
ham
SALT
ham
ACID
ham
BITT
ham
har
dnes
s
adh
es
sprin
g
cohe
s
chew
WBS
F
hexa
nal
-1,0
-0,5
0,0
0,5
1,0
Prin
cipa
l com
pone
nt 1
: 20
,28%
-1,0
-0,50,0
0,5
1,0
Principal component 2 : 15,61%
1
1
1
11
1
1
11
2
2
22
2
2
2
22
2
3
3
3
3
33
33
3
-6-4
-20
24
6
Prin
cipa
l com
pone
nt 1
: 20,
28%
-8-6-4-202468
Principal component 2: 15,61%
Fi
gure
3.-
Load
ings
plo
t afte
r prin
cipa
l com
pone
nt a
naly
sis
of th
e va
riabl
es o
f B.
fem
oris
and
dry
-cur
ed h
am in
the
plan
e de
fined
by
the
two
first
prin
cipa
l com
pone
nts
(PC
1 an
d PC
2). ●
raw
BF,
○ d
ry-c
ured
ham
.
Fi
gure
4.-
Sco
res
plot
afte
r prin
cipa
l com
pone
nt a
naly
sis
of th
e in
divi
dual
s in
the
plan
e de
fined
by
the
two
first
prin
cipa
l com
pone
nts
(PC
1 an
d P
C2)
of t
he v
aria
bles
of B
. fem
oris
an
d dr
y-cu
red
ham
. (□
GE
N1,
○ G
EN
2, ■
GEN
3.)

Chapter VIII. Raw meat characteristics and dry-cured product quality
Fatty acid composition of IMF plays an important role in the hardness, aroma and appearance of dry-
cured ham (Ruiz-Carrascal et al., 2000; Cava et al., 2000). High PUFA content favour the
development of oxidation reactions as those fatty acids are which mostly suffer lipolytic reactions
during ripening (Martin et al., 1999) and they are more susceptible to be peroxidized. Lipid oxidation
reactions increase during the maturation of dry-cured meat products. This increase has been
monitored by TBA-RS method and by hexanal content (Cava et al., 1999). Hams from raw meat with
lower linoleic acid, linolenic acid and arachidonic acid had lower hexanal content and were perceived
as less rancid by panellists (Cava et al., 2000). On the other hand, it is widely recognized the relation
between lipid oxidation and myoglobin oxidation (Baron and Andersen, 2002), as high PUFA levels
favour the oxidation of myoglobin in the muscle; as the heme group is exposed to the environment
favouring peroxidation mechanism (Baron and Andersen, 2002).
Correlations between protein oxidation and colour in dry-cured ham could due to the close
relationship between lipid and protein oxidation and oximyoglobin stability (Baron and Andersen,
2002). Ventanas et al. (2006) reported a parallel development of lipid and protein oxidation reactions
after the ripening of dry-cured loin. They also reported the relation between PUFA content in
phospholipids of LD and the extent of lipid and protein oxidation reactions in dry-cured loin. Other
authors have reported similar results to ours, as they found that protein oxidation can negatively
affect the sensory quality of fresh meat and meat products in terms of texture, tenderness and colour
(Rowe, et al., 2004). Rowe et al., (2004) have reported that increased oxidation of muscle proteins
early postmortem could have negative effects on fresh meat colour and tenderness, as protein
carbonyl content was positively related with Warner-Bratzler shear force values (Rowe et al., 2004).
Genotype clearly affected the quality of the raw material and the dry-cured meat products
manufactured from them. Meat and dry-cured meat products quality was not affected by reciprocal
cross, however, the Duroc sire line (DU1, DU2) did. Dry-cured meat products from GEN3, due to
their lower level of IMF content and their lower pH, intense paleness and drip loss of the raw material
from this genotype, had worse quality than those from the other 2 genotypes (GEN1, GEN2).
Therefore, parameters closely related to the genotype, such as postmortem pH and IMF content,
could be deciding factors for the quality of dry-cured meat products. As a consequence, the
measurement of these parameters in the raw material for the manufacture of dry-cured meat
products may provide determinant information to assure the quality of the meat products.
CONCLUSIONS Parameters related to the adipogenic character of the pigs (fat depths, IMF, lipogenic enzyme
activity) affected characteristics of dry-cured products such as those related to texture and taste.
However, raw material with poor meat quality characteristics such as low postmortem pH values,
high CIE L*-value and drip and cook losses and with a low oxidative stability could favour the
appearance of negative texture traits and the development of pale colours and acid tastes in dry-
cured meat products. Those quality traits are strongly associated with the pig genotype. Differences
in those parameters in the raw material were closely linked with important quality differences of dry-
185
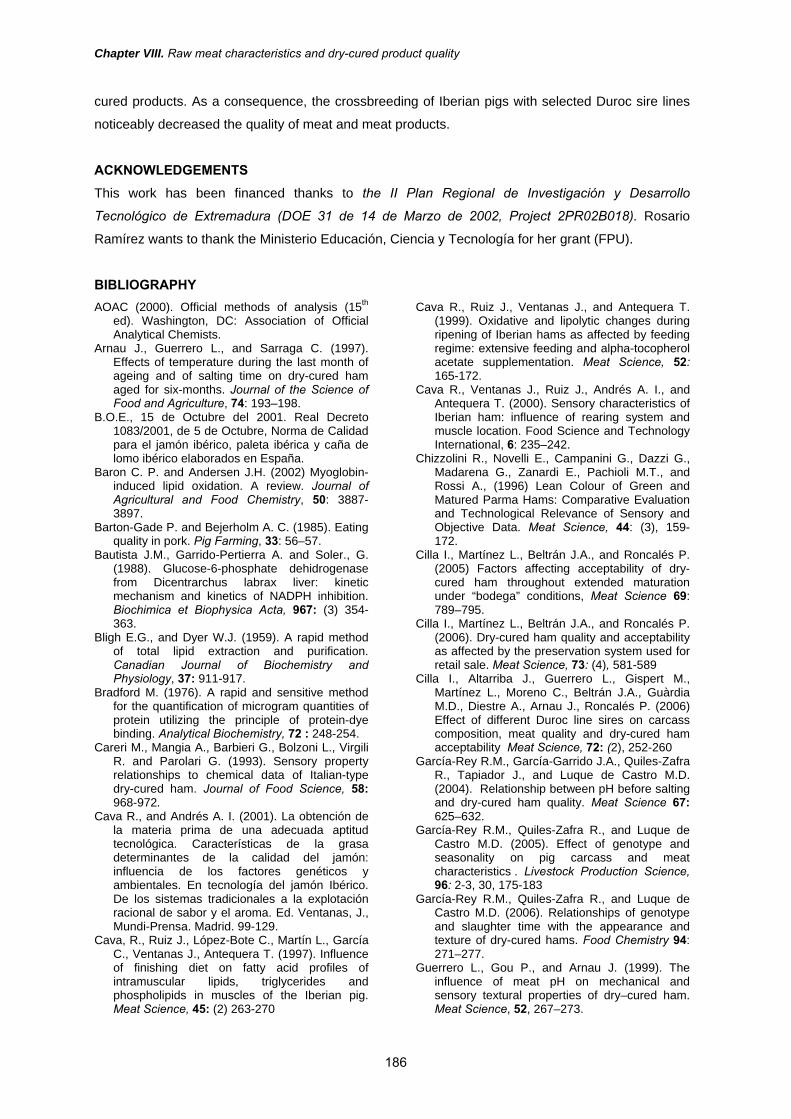
Chapter VIII. Raw meat characteristics and dry-cured product quality
cured products. As a consequence, the crossbreeding of Iberian pigs with selected Duroc sire lines
noticeably decreased the quality of meat and meat products.
ACKNOWLEDGEMENTS This work has been financed thanks to the II Plan Regional de Investigación y Desarrollo
Tecnológico de Extremadura (DOE 31 de 14 de Marzo de 2002, Project 2PR02B018). Rosario
Ramírez wants to thank the Ministerio Educación, Ciencia y Tecnología for her grant (FPU).
BIBLIOGRAPHY AOAC (2000). Official methods of analysis (15th
ed). Washington, DC: Association of Official Analytical Chemists.
Arnau J., Guerrero L., and Sarraga C. (1997). Effects of temperature during the last month of ageing and of salting time on dry-cured ham aged for six-months. Journal of the Science of Food and Agriculture, 74: 193–198.
B.O.E., 15 de Octubre del 2001. Real Decreto 1083/2001, de 5 de Octubre, Norma de Calidad para el jamón ibérico, paleta ibérica y caña de lomo ibérico elaborados en España.
Baron C. P. and Andersen J.H. (2002) Myoglobin-induced lipid oxidation. A review. Journal of Agricultural and Food Chemistry, 50: 3887-3897.
Barton-Gade P. and Bejerholm A. C. (1985). Eating quality in pork. Pig Farming, 33: 56–57.
Bautista J.M., Garrido-Pertierra A. and Soler., G. (1988). Glucose-6-phosphate dehidrogenase from Dicentrarchus labrax liver: kinetic mechanism and kinetics of NADPH inhibition. Biochimica et Biophysica Acta, 967: (3) 354-363.
Bligh E.G., and Dyer W.J. (1959). A rapid method of total lipid extraction and purification. Canadian Journal of Biochemistry and Physiology, 37: 911-917.
Bradford M. (1976). A rapid and sensitive method for the quantification of microgram quantities of protein utilizing the principle of protein-dye binding. Analytical Biochemistry, 72 : 248-254.
Careri M., Mangia A., Barbieri G., Bolzoni L., Virgili R. and Parolari G. (1993). Sensory property relationships to chemical data of Italian-type dry-cured ham. Journal of Food Science, 58: 968-972.
Cava R., and Andrés A. I. (2001). La obtención de la materia prima de una adecuada aptitud tecnológica. Características de la grasa determinantes de la calidad del jamón: influencia de los factores genéticos y ambientales. En tecnología del jamón Ibérico. De los sistemas tradicionales a la explotación racional de sabor y el aroma. Ed. Ventanas, J., Mundi-Prensa. Madrid. 99-129.
Cava, R., Ruiz J., López-Bote C., Martín L., García C., Ventanas J., Antequera T. (1997). Influence of finishing diet on fatty acid profiles of intramuscular lipids, triglycerides and phospholipids in muscles of the Iberian pig. Meat Science, 45: (2) 263-270
Cava R., Ruiz J., Ventanas J., and Antequera T. (1999). Oxidative and lipolytic changes during ripening of Iberian hams as affected by feeding regime: extensive feeding and alpha-tocopherol acetate supplementation. Meat Science, 52: 165-172.
Cava R., Ventanas J., Ruiz J., Andrés A. I., and Antequera T. (2000). Sensory characteristics of Iberian ham: influence of rearing system and muscle location. Food Science and Technology International, 6: 235–242.
Chizzolini R., Novelli E., Campanini G., Dazzi G., Madarena G., Zanardi E., Pachioli M.T., and Rossi A., (1996) Lean Colour of Green and Matured Parma Hams: Comparative Evaluation and Technological Relevance of Sensory and Objective Data. Meat Science, 44: (3), 159- 172.
Cilla I., Martínez L., Beltrán J.A., and Roncalés P. (2005) Factors affecting acceptability of dry-cured ham throughout extended maturation under “bodega” conditions, Meat Science 69: 789–795.
Cilla I., Martínez L., Beltrán J.A., and Roncalés P. (2006). Dry-cured ham quality and acceptability as affected by the preservation system used for retail sale. Meat Science, 73: (4), 581-589
Cilla I., Altarriba J., Guerrero L., Gispert M., Martínez L., Moreno C., Beltrán J.A., Guàrdia M.D., Diestre A., Arnau J., Roncalés P. (2006) Effect of different Duroc line sires on carcass composition, meat quality and dry-cured ham acceptability Meat Science, 72: (2), 252-260
García-Rey R.M., García-Garrido J.A., Quiles-Zafra R., Tapiador J., and Luque de Castro M.D. (2004). Relationship between pH before salting and dry-cured ham quality. Meat Science 67: 625–632.
García-Rey R.M., Quiles-Zafra R., and Luque de Castro M.D. (2005). Effect of genotype and seasonality on pig carcass and meat characteristics . Livestock Production Science, 96: 2-3, 30, 175-183
García-Rey R.M., Quiles-Zafra R., and Luque de Castro M.D. (2006). Relationships of genotype and slaughter time with the appearance and texture of dry-cured hams. Food Chemistry 94: 271–277.
Guerrero L., Gou P., and Arnau J. (1999). The influence of meat pH on mechanical and sensory textural properties of dry–cured ham. Meat Science, 52, 267–273.
186
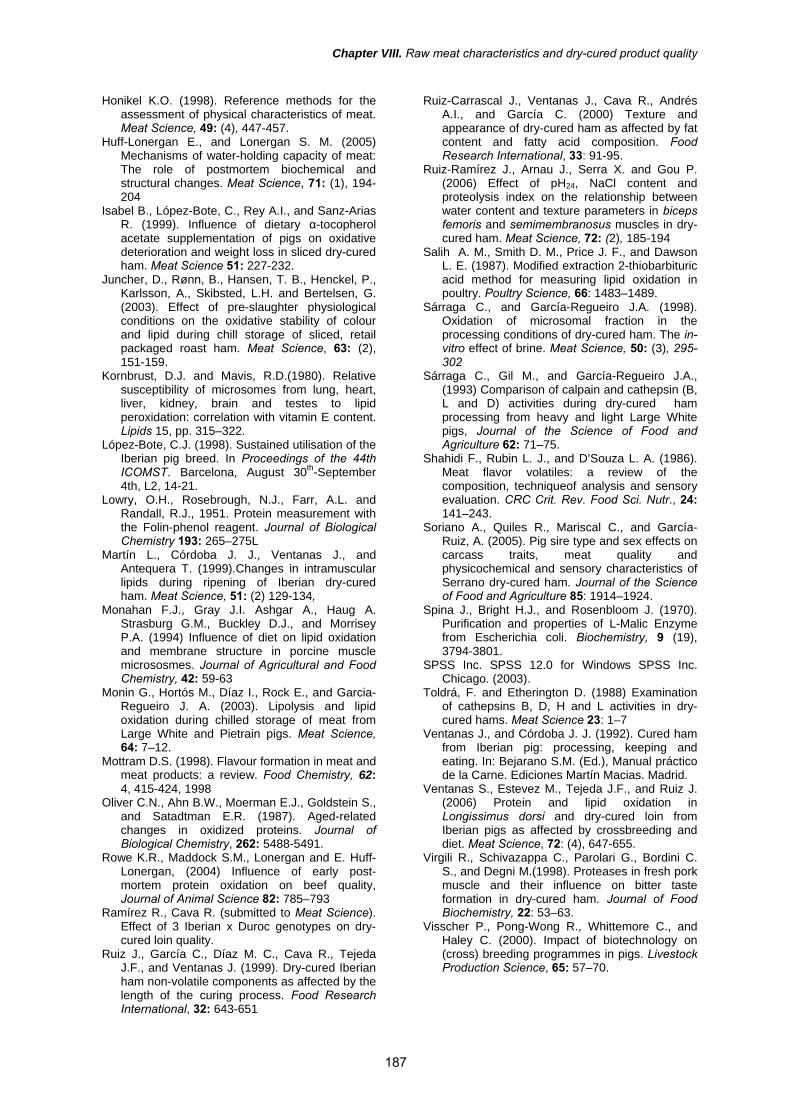
Chapter VIII. Raw meat characteristics and dry-cured product quality
Honikel K.O. (1998). Reference methods for the assessment of physical characteristics of meat. Meat Science, 49: (4), 447-457.
Huff-Lonergan E., and Lonergan S. M. (2005) Mechanisms of water-holding capacity of meat: The role of postmortem biochemical and structural changes. Meat Science, 71: (1), 194-204
Isabel B., López-Bote, C., Rey A.I., and Sanz-Arias R. (1999). Influence of dietary α-tocopherol acetate supplementation of pigs on oxidative deterioration and weight loss in sliced dry-cured ham. Meat Science 51: 227-232.
Juncher, D., Rønn, B., Hansen, T. B., Henckel, P., Karlsson, A., Skibsted, L.H. and Bertelsen, G. (2003). Effect of pre-slaughter physiological conditions on the oxidative stability of colour and lipid during chill storage of sliced, retail packaged roast ham. Meat Science, 63: (2), 151-159.
Kornbrust, D.J. and Mavis, R.D.(1980). Relative susceptibility of microsomes from lung, heart, liver, kidney, brain and testes to lipid peroxidation: correlation with vitamin E content. Lipids 15, pp. 315–322.
López-Bote, C.J. (1998). Sustained utilisation of the Iberian pig breed. In Proceedings of the 44th ICOMST. Barcelona, August 30th-September 4th, L2, 14-21.
Lowry, O.H., Rosebrough, N.J., Farr, A.L. and Randall, R.J., 1951. Protein measurement with the Folin-phenol reagent. Journal of Biological Chemistry 193: 265–275L
Martín L., Córdoba J. J., Ventanas J., and Antequera T. (1999).Changes in intramuscular lipids during ripening of Iberian dry-cured ham. Meat Science, 51: (2) 129-134,
Monahan F.J., Gray J.I. Ashgar A., Haug A. Strasburg G.M., Buckley D.J., and Morrisey P.A. (1994) Influence of diet on lipid oxidation and membrane structure in porcine muscle micrososmes. Journal of Agricultural and Food Chemistry, 42: 59-63
Monin G., Hortós M., Díaz I., Rock E., and Garcia-Regueiro J. A. (2003). Lipolysis and lipid oxidation during chilled storage of meat from Large White and Pietrain pigs. Meat Science, 64: 7–12.
Mottram D.S. (1998). Flavour formation in meat and meat products: a review. Food Chemistry, 62: 4, 415-424, 1998
Oliver C.N., Ahn B.W., Moerman E.J., Goldstein S., and Satadtman E.R. (1987). Aged-related changes in oxidized proteins. Journal of Biological Chemistry, 262: 5488-5491.
Rowe K.R., Maddock S.M., Lonergan and E. Huff-Lonergan, (2004) Influence of early post-mortem protein oxidation on beef quality, Journal of Animal Science 82: 785–793
Ramírez R., Cava R. (submitted to Meat Science). Effect of 3 Iberian x Duroc genotypes on dry-cured loin quality.
Ruiz J., García C., Díaz M. C., Cava R., Tejeda J.F., and Ventanas J. (1999). Dry-cured Iberian ham non-volatile components as affected by the length of the curing process. Food Research International, 32: 643-651
Ruiz-Carrascal J., Ventanas J., Cava R., Andrés A.I., and García C. (2000) Texture and appearance of dry-cured ham as affected by fat content and fatty acid composition. Food Research International, 33: 91-95.
Ruiz-Ramírez J., Arnau J., Serra X. and Gou P. (2006) Effect of pH24, NaCl content and proteolysis index on the relationship between water content and texture parameters in biceps femoris and semimembranosus muscles in dry-cured ham. Meat Science, 72: (2), 185-194
Salih A. M., Smith D. M., Price J. F., and Dawson L. E. (1987). Modified extraction 2-thiobarbituric acid method for measuring lipid oxidation in poultry. Poultry Science, 66: 1483–1489.
Sárraga C., and García-Regueiro J.A. (1998). Oxidation of microsomal fraction in the processing conditions of dry-cured ham. The in-vitro effect of brine. Meat Science, 50: (3), 295-302
Sárraga C., Gil M., and García-Regueiro J.A., (1993) Comparison of calpain and cathepsin (B, L and D) activities during dry-cured ham processing from heavy and light Large White pigs, Journal of the Science of Food and Agriculture 62: 71–75.
Shahidi F., Rubin L. J., and D’Souza L. A. (1986). Meat flavor volatiles: a review of the composition, techniqueof analysis and sensory evaluation. CRC Crit. Rev. Food Sci. Nutr., 24: 141–243.
Soriano A., Quiles R., Mariscal C., and García-Ruiz, A. (2005). Pig sire type and sex effects on carcass traits, meat quality and physicochemical and sensory characteristics of Serrano dry-cured ham. Journal of the Science of Food and Agriculture 85: 1914–1924.
Spina J., Bright H.J., and Rosenbloom J. (1970). Purification and properties of L-Malic Enzyme from Escherichia coli. Biochemistry, 9 (19), 3794-3801.
SPSS Inc. SPSS 12.0 for Windows SPSS Inc. Chicago. (2003).
Toldrá, F. and Etherington D. (1988) Examination of cathepsins B, D, H and L activities in dry-cured hams. Meat Science 23: 1–7
Ventanas J., and Córdoba J. J. (1992). Cured ham from Iberian pig: processing, keeping and eating. In: Bejarano S.M. (Ed.), Manual práctico de la Carne. Ediciones Martín Macias. Madrid.
Ventanas S., Estevez M., Tejeda J.F., and Ruiz J. (2006) Protein and lipid oxidation in Longissimus dorsi and dry-cured loin from Iberian pigs as affected by crossbreeding and diet. Meat Science, 72: (4), 647-655.
Virgili R., Schivazappa C., Parolari G., Bordini C. S., and Degni M.(1998). Proteases in fresh pork muscle and their influence on bitter taste formation in dry-cured ham. Journal of Food Biochemistry, 22: 53–63.
Visscher P., Pong-Wong R., Whittemore C., and Haley C. (2000). Impact of biotechnology on (cross) breeding programmes in pigs. Livestock Production Science, 65: 57–70.
187


Discussion

General discussion
GENERAL DISCUSSION 1. – GROWTH PERFORMANCE, PRODUCTION TRAITS AND CARCASS COMPOSITION. Pig genotype had a significant effect on production traits and carcass composition while sex did not.
Reciprocal crosses (GEN1 vs. GEN2) showed small differences in production traits. Pigs from GEN2
were heavier and had a higher carcass and ham weight than GEN1. However, killing-out percentage,
main cuts yields and carcass fat were similar in both genotypes, which indicate a similar carcass
composition in both genotypes. Results are in contrast with those reported by Morcuende et al.
(submitted) in a study with Iberian x Duroc reciprocal crosses, who found a substantial advantage of
using Iberian pig as the sire breed in production traits of Iberian x Duroc reciprocal cross.
On the other hand, the Duroc sire line importantly affected growth performance and carcass
composition. Duroc lines selected on the basis of productive parameters (DU2) gave genotypes
(GEN3) with high weights and percentages of the main cuts and low levels of carcass fat (measured
as fat thickness at 5th-6th rib and ham). Although this would be desirable in most pig production, it is
not desirable in the case of Iberian pig production because of the positive relationship between fat
depths thickness and intramuscular fat content (Hovenier et al., 1993; Suzuki et al., 2003). A high
level of subcutaneous and intramuscular fat are required for the manufacture of high quality dry-
cured meat products (hams, shoulders, loins...) because fat provides to the meat product an
adequate protection against an excessive dehydration during maturation which favour a
technological aptitude for long times of ripening, necessary for the development of their sensory
characteristics (Gandemer, 2002). Therefore, the use of genotypes from Duroc sire lines selected for
the production of dry-cured meat products (DU1) provides heavier carcasses, though it reduces the
meat cuts, with a high carcass fat which is more desirable for meat products production.
2. - MEAT QUALITY Over the past decade, productive systems have been developed to increase the profitability of
Iberian pig production. These changes have been oriented towards the use of Duroc breed in the
cross with Iberian to increase reproductive and productive traits and less focused on meat quality
traits. Although many factors affect meat quality, genetic plays a substantial role in the production of
acceptable pork.
In the current study, in terms of meat quality, meat from GEN3 had lower quality than those from the
other 2 genotypes (GEN1 and GEN2). However, meat from the reciprocal cross slightly differed in
terms of meat quality, indicating that reciprocal crossing had a slight effect on meat quality. Similarly,
Morcuende et al., (submitted) and Ventanas et al., (2006a), did not find significant differences in
meat quality traits of both Longissmus doris and Biceps femoris muscles from Iberian x Duroc
reciprocal crosses.
In contrast, the Duroc sire genotype significantly affected meat quality traits. Post-mortem pH values
(pH45min and pHU) were lower in GEN3 than in GEN1 and GEN2 in both Biceps femoris and
Longissimus dorsi muscles. Additionally, muscles from this genotype were paler (lower CIE L*-value)
and had higher drip and cook losses in comparison with muscles from the other two genotypes.
191
General discussion
Lindahl et al., (2006) found a significant increase of lightness in muscles as a consequence of low pH
values early post-mortem, and Offer (1991) described that low pH values are related to the
denaturation of muscle proteins, particularly myosin. These changes are associated with functional
properties, such as textural strength and cook loss of meat and meat products (Offer et al., 1988). In
line with this, in the current study the relationship between low pH values and cook and drip loss was
supported by the significant negative correlations between ultimate pH values and drip loss (r = -
0.539, p<0.001) and cook loss (r = -0.480, p<0.001). Although meat from GEN3 can not be
considered PSE, physico-chemical characteristics were close to the traits that define PSE condition
(Briskey, 1964), and that lead to a poor meat quality of this genotype. The Iberian pig is characterized for its elevated lipogenic metabolism which produces high
subcutaneous and intramuscular fat (López-Bote, 1998). Duroc breed has a higher proportion of
intramuscular fat than other industrial pig breeds and for this reason the Iberian pig is usually
crossbred with Duroc. Fat content o both subcutaneous and intramuscular, plays an important role in
the quality of the meat and meat products from Iberian pig. For that reason, it is crucial that Iberian x
Duroc hybrid pigs maintain meat quality traits that characterize Iberian pig breed, such as the high
intramuscular fat content. Therefore, a reduction in the adipogenic potential of the hybrids is not
desirable, although a reduction in backfat thickness could be desirable.
IMF content is a variable parameter that depends on the genetic of the pig breed. Important
differences have been reported by Soriano et al., (2005) and by Cilla et al. (2006) in the IMF and BFT
of crosses with different Duroc sire lines. However, an adequate level of IMF is determinant for the
quality of dry-cured meat products (López-Bote, 1998; Gandemer, 2002). In general, muscles from
GEN3 had lower fat content than GEN2 while GEN1 had an intermediate content. Results indicate a
noticeable effect of both reciprocal cross and Duroc sire line on the deposition of intramuscular fat in
muscles. Proximate composition of meat from reciprocal crosses (GEN1 and GEN2) differed
between genotypes although these differences depended upon muscle, being more marked in LD
than in BF. In general, GEN2 muscles had higher IMF content than those from GEN1; although
differences between them could be caused in part by differences in slaughter weights between these
2 groups (149.6 vs. 165.8Kg.). In the case of meat from GEN2 and GEN3, findings suggest a clear
effect of the genotype of the Duroc sire line on intramuscular fat content, since average slaughter
weights were similar. Intramuscular fat plays an important role on meat and meat products quality
because enhances juiciness and thus, their acceptability (Ruiz-Carrascal et al., 2000). Therefore, the
highest IMF content of GEN2 makes cuts (loins and hams) more suitable for the manufacture of dry-
cured meat products compared to GEN3.
Some authors have described a positive relationship between fat depths thickness and intramuscular
fat content (Hovenier et al., 1993; Suzuki et al., 2003) which is line with the positive correlation
between backfat thickness and IMF content in muscle Longissimus dorsi (r = +0.416, p<0.05) and
Biceps femoris (r = +0.457, p<0.05) in the present study.
Enzyme activities of lipogenic enzymes glucose-6-phosphate dehydrogenase (G6PDH) and malic
enzyme (ME) in subcutaneous fat and in both muscles (Longissimus dorsi and Biceps femoris) were
significantly affected by genotype. Both enzymatic activities were lower in GEN3 than in GEN1 and
192
General discussion
GEN2, which did not show differences in their enzyme activities agreeing with results of Morcuende
et al., (submitted). On the other hand, results are consistent with the higher fat depths and IMF
content in those genotypes in comparison with GEN3. Results suggest a higher lipogenic character
in these genotypes, and as a consequence, a higher synthesis and depot of lipids in pig tissues.
Previous studies (Mourot et al., 1996; Mourot and Kouba 1998; Morales et al., 2002) have shown
important differences in the adipogenic pattern due to the genotype. These authors found higher
lipogenic enzyme activities in non-selected breeds (Iberian or Meishan) than in industrial pig
genotypes (Landrace or Large White).
All traits related to fat depot (back fat depths, intramuscular fat content) and lipogenic metabolism (fat
and muscle activities of G6PDH and ME) were affected by the Duroc sire line. Some authors
(Lonergan et al., 2001; Soriano et al., 2005; Cilla et al., 2006) have previously found important
differences between lines of Duroc in the IMF content and carcass fat, which support the differences
on the adipogenic character among genotypes of the present study.
Fatty acids are involved in various technological aspects of meat quality such as on firmness or
softness of the fat in meat, especially the subcutaneous and intermuscular (carcass fats) but also the
intramuscular (marbling) fat (Wood et al., 2003). Fatty acid profiles of the three locations (SCF, LD
and BF) showed clear differences due to genotype, although these were more pronounced in SCF
and LD. In general, lipids from GEN3 were more unsaturated than those from the other genotypes.
GEN3 had the highest content of unsaturated fatty acids in SCF and total lipids of IMF and neutral
lipid (NL) and free fatty acids (FFA) fractions in both muscles while GEN1 and GEN2 had a higher
content of saturated fatty acids. However, small differences were found between genotypes in the
fatty acid profile of polar lipids (PL) which had a similar content of SFA, MUFA and PUFA. These
differences in the fatty acid profiles among genotypes could be caused by i. the different content of
IMF, and the dilution effect of phospholipids and/or PUFA due to a high content of IMF and a different
fat deposition in muscles as well as by ii. the different potential for endogenous synthesis of fatty
acids. Both hypotheses are supported by the higher lipogenic enzyme activity and the higher SFA
content in those genotypes with higher lipogenic activity. As more developed is the backfat in the
carcass and the intramuscular fat depots in muscle, higher is the proportion of fatty acids stored in
the tissues arising from “de novo” synthesis, specifically SFA and less is the content of PUFA.
High PUFA levels can cause undesirable technological and sensory consequences because PUFA
enhances lipid oxidation, leading to meat texture, flavour and colour alterations limiting the quality
and acceptability of meat and meat products (Morrissey et al., 1998). The effect of fatty acids on
shelf life is explained by the tendency of unsaturated fatty acids to oxidation, leading to the
development of rancidity (Wood et al., 2003). Although the fatty acid profile of GEN3 has a better
profile from a nutritional point of view (Simopoulos, 2003), it is more susceptible to lipid oxidation due
to the higher PUFA and lower SFA, and therefore, to the development of rancidity, so this genotype
is the least suitable for the manufacture of meat products.
Therefore, the cross of Duroc selected sires (DU2) with Iberian pigs affected meat quality, since low
post-mortem pH, intense paleness and high cook and drip losses were found in the meat from this
cross (GEN3). Besides, it reduces the adipogenic activity, the IMF content and modifies fatty acid
193

General discussion
profile increasing unsaturated fatty acids. Although it has positive nutritional effects, it could also
decrease the shelf life of the meat and make it more prone to suffer oxidation processes under
storage and during the manufacture of dry-cured meat products. On the other hand, the cross of
Iberian females with Duroc males selected for the production of meat products (GEN2) and its
reciprocal cross (GEN1) produces high percentages of intramuscular fat and better quality
characteristics in the meat, making it suitable for both cured meat production and fresh consumption.
3. – CHANGES ON MEAT QUALITY DURING REFRIGERATED STORAGE. In terms of metabolic pattern, the internal part of BF is considered an oxidative muscle while external
portion is considered glycolytic, whereas LD is considered a glycolytic muscle. The metabolic pattern
of the studied muscles and their characteristics associated (lipid and PUFA content, heme pigments,
etc) determined the oxidative susceptibility of muscles under in vitro conditions, the lipid and protein
oxidation and the colour changes under retail display. Brewer et al., (2001) reported that the
metabolic pattern of muscles and the characteristics associated to it affects colour stability of meat
during storage. In this sense, red oxidative muscles have higher myoglobin content than white
glycolytic ones, and as a result, a lower CIE L*-value and higher CIE a*-value as well as higher
oxidative susceptibility. Consequently, muscles with an oxidative metabolism have a lower shelf-life
than muscles with a glycolytic or intermediate metabolism (Cava et al., 2003; Morcuende et al.,
2003).
Reciprocal crosses (GEN1 vs GEN2) showed similar changes after the storage, as they had similar
oxidative susceptibility, drip loss and colour and fatty acid profile stability during storage. However,
the genotype of the Duroc sire line (DU1 or DU2) influenced significantly changes during storage,
which were more intense in meat from GEN3.
The low pH45min and pHu values in muscles from GEN3 muscles could explain the higher release of
water during cooking or storage of meat from this genotype as a higher rate of pH decline and low
pHu favour a paler meat with low water holding capacity (Juncher et al., 2001).
According to Andersen (2000), appearance remains the consumer’s only criterion to evaluate the
product in the purchase situation. Therefore, colour stability is an important quality factor in chilled
meat. BF and LD from GEN3 were paler (higher CIE L*-value), which could be caused by their lower
post-mortem pH and higher drip loss. Both factors may contribute to increase the paleness of the
muscles during storage due to an increase of the exudation of meat (Lindahl et al., 2001; Brewer et
al., 2001). In the last years, the intensive selection carried out in some pig genotypes to improve the
lean growth efficiency is associated with the decrease of meat quality and the increase of the
appearance of PSE meat (Lonergan et al., 2001), which also has lower colour and oxidative stability
during storage (Juncher et al. 2001).
Oxymyoglobin is the main pigment responsible of the red colour of meat. During the storage, the
oxidation of oxymyoglobin to metmyoglobin, causes a decrease of redness (CIE a*-value) as well as
increases in meat discoloration (reviewed by Baron and Andersen, 2002). The colour stability or the
trend to accumulate greyish-brownish metmyoglobin on the meat surface is related to many factors
such as animal, age, breed, sex, muscle type, diet, pH, etc. (Renerre, 1990). The higher
194
General discussion
discolouration of BF and in a lesser extent of LD from GEN3 suggest a more intense oxidation of
myoglobin in this genotype, which is consistent with their higher TBA-RS values and carbonyls
accumulation at the end of the storage. Several authors have found that low ultimate pH values in
meat increases its paleness and also favour the decrease of CIE a*-value during the storage
(Juncher et al., 2001; Huff-Lonergan and Lonergan, 2005) which support results found in GEN3.
Lipid oxidation is one of the primary mechanisms of quality deterioration of meat during refrigerated
storage (Gray et al., 1996). The extent of oxidation of muscle lipids is usually monitored by TBA-RS
measurements. On the other hand, protein carbonyls have their origin mainly in the reaction between
aldehydes produced by lipid and protein oxidation reactions. In this respect, several authors reported
a parallel development of protein oxidation and lipid oxidation in meat and meat products (i.e. Mercier
et al., 1998, 2004; Ventanas et al, 2006b).
Genotype affected both oxidative deterioration of lipids and accumulation of carbonyls during
refrigerated storage; although these changes were only significant in Biceps femoris muscle. Muscles
from GEN3 had the lowest oxidative stability, with higher TBA-RS and carbonyls contents after
refrigerated storage. These higher oxidation could be associated to low post-mortem pH values
which is supported by the significant negative correlations found between ultimate pH value and
induced lipid peroxidation (r = -0.616, p<0.001), TBA-RS (r = -0.275, p<0.05) and carbonyls content
(r = -0.268, p<0.05). This relation has been previously reported by Juncher et al. (2001), since the
autoxidation of oxymyoglobin is acid-catalyzed, and consequently, a decrease of pH accelerates the
autoxidation of oxymyoglobin, decreasing color stability and increasing lipid and also protein
oxidation (Huff-Lonergan and Lonergan, 2005). Therefore, pH seems to be an important factor for the
deterioration of meat during storage. Lonergan et al., (2001) found that the intensive selection of a
Duroc line for lean growth efficiency reduced early post-mortem pH and caused softer and more
exudative pork. Consequently and according to our results, low postmortem pH could also decrease
pork quality under storage.
Meat stored under low temperatures has a limited shelf-life due to biochemical changes developed
after slaughter in which lipolysis and lipid oxidation of muscle lipids play an important role (Gray et
al., 1996; Morrissey et al., 1998). Those changes, which affect fatty acid composition, were more
intense in GEN3. After storage, PUFA content decreased in IMF and NL fraction, especially in GEN3,
probably caused by the higher C18:2n-6 and C20:4n-6 contents and/or a higher lipolytic enzymes
activities in this genotype, which could have favoured a more intense hydrolysis and/or oxidation in
muscles from GEN3. However, although PL fraction is considered prime targets for lipid oxidation
because of their high degree of unsaturation, small differences were found in the fatty acid
composition of this fraction either before or after storage.
An increasing ratio DMA/FA in PL fraction during the storage has been previously associated with a
more intense hydrolysis of FA, since the level of DMA remains constant because of the resistance of
the ether links, between glycerol and aldehyde fatty acids to lipolysis. That increases the relative
proportion of fatty aldehydes while the amount of fatty acids linked to glycerol molecule decreases
(Morcuende et al., 2003; Estévez and Cava, 2004). In addition, Estévez and Cava (2004) found a
195

General discussion
ratio DMA/FA significantly higher in industrial than in rustic pig genotypes after storage of meat,
which could be related to the higher DMA/FA ratio in GEN3 than in the other genotypes.
Plasmalogens act in vivo protecting cells against oxidative stress (Engelmann, 2004), since their
vinyl–ether bond is preferentially oxidized, which protects PUFA at the sn-2 position from oxidation.
This antioxidant activity could continue postmortem according to Estévez and Cava (2004), who
reported lower oxidation levels in pigs with higher fatty aldehydes proportion. Results are consistent
with iron-induce lipid peroxidation and TBA-RS values after refrigerated storage in LD, although not
with results in BF.
In FFA fraction, the level of PUFA increased after the storage; especially long chain PUFA, agreeing
with the reduction in PUFA of other lipid fractions and changes in FA profile in previous studies
(Alasnier et al., 2000; Morcuende et al., 2003). Several enzymes (lipases and phospholipases) are
involved in the hydrolytic processes of meat lipids during storage which release FFA from both
triacylglycerols and phospholipids (Alasnier et al., 2000a; Alasnier et al., 2000b). Important variations
have been reported in the lipolytic activity associated with the pig genotype (Toldrá et al., 1996;
Rosell and Toldrá 1998; Cava et al., 2004), which could be related to the differences in the hydrolisis
of fatty acids between genotypes. In this sense, the highest increase of PUFA in FFA fraction was
found in GEN3. It is well know that long chain PUFA are very prone to lipid oxidation (Nawar, 1996).
The higher PUFA in FFA could increase the amount of substrates for the oxidative reactions and
decrease meat stability during storage, which agrees with the lower lipid and protein oxidation and
colour stability in meat from GEN3.
4. - DRY-CURED LOIN AND HAM QUALITY AND VOLATILE PROFILE 4.1.- Dry-cured meat products quality. Chemical composition of dry-cured loins was significantly affected by pig genotype whereas dry-
cured ham composition was similar between genotypes, although followed a similar trend as dry-
cured loin. Thus, dry-cured loins from GEN2 had the highest content of intramuscular fat while in dry-
cured ham no differences were found. Proximate composition of dry-cured hams and loins reflected
proximate composition of Longissimus dorsi and Biceps femoris muscle in fresh, which did not show
differences between genotypes in the latter but they did in the former. An adequate level of fat
(intramuscular and subcutaneous) is determinant for the sensory quality of meat products (Ruiz et
al., 2002) as well as for an adequate drying and salt diffusion mechanisms during maturation (Arnau,
1998).
Colour plays an important role in the appearance and overall acceptability of dry-cured meat
products; because a non-intense colour is rejected by consumers due to its association with a
shorten ripening (García-Rey et al., 2006). Both dry-cured loins and hams from GEN3 had a less
intense red colour than those from the other genotypes. The redness (CIE a*-value) of dry-cured
products has been associated with i. the heme pigments concentration, ii. the sodium chloride
content and iii. the formation of nitrosomyoglobin (Pérez-Álvarez et al., 1998). Thus, the lower CIE
a*-value and chroma in dry-cured meat products from GEN3 could be related to the less intense
colour of raw material from this genotype than those from GEN1 and GEN2. However, the higher
196
General discussion
lightness (CIE L*-value) in both dry-cured products from GEN2 could be related to the higher
marbling in agreement with findings reported by Carrapiso and García (2005), who found positive
correlations between L* and marbling in dry-cured Iberian ham.
Fatty acid composition of IMF of dry-cured loins and hams reflected fatty acid profiles of raw
Longissimus dorsi and Biceps femoris. Differences in the fatty acid profile were caused by the
genotype as initial differences in the FA profile were maintained after maturation. Thus, GEN3 had
higher MUFA and PUFA contents while intramuscular lipids from GEN2 were more saturated. Raw
material rich in PUFA had a higher oxidative susceptibility leading to rancidity in dry-cured ham
(Cava et al., 1999) and in dry-cured loin (Hoz et al., in press). As a result, dry-cured meat products
from GEN3, which were more unsaturated in fresh, showed a higher lipid oxidation as reflected the
higher TBA-RS and hexanal content, although differences were statistically significant in dry-cured
loin and not in dry-cured ham. Similarly, a high PUFA content in the final product could favour the
development of oxidation reactions, especially in sliced and packaged products during storage. In
addition, hexanal has been widely reported as a good indicator of lipid deterioration. In dry-cured
meat products, hexanal contributes to their characteristic flavour, although high concentrations favour
the appearance of rancidity and the flavour deterioration (Cava et al., 1999). Thus, in Iberian dry-
cured hams, Cava et al., (1999) found that hams with less rancid flavour had less hexanal and TBA-
RS.
Previous studies in Iberian dry-cured products have reported a close relationship between marbling
degree and overall quality (Ruiz-Carrascal et al., 2000). Dry-cured products from GEN2 were more
marbled according to panellist perceptions, which agree with the higher IMF content in dry-cured loin
(p<0.05) and dry-cured ham (p>0.05).
Panellists detected more texture differences than those detected by instrumental analysis in dry-
cured ham; although both methods followed a similar pattern in both dry-cured meat products. Dry-
cured loins from GEN3 were considered less juicy and had a higher instrumental hardness,
springiness and chewiness, and similarly, dry-cured hams from GEN3 were more fibrous and less
juicy. Texture has been related to chemical composition of dry-cured ham. Some authors (Ruiz-
Ramírez et al., 2005; Serra et al., 2005) have found that the decrease of moisture content increases
hardness. However, others (Ruiz-Carrascal et al., 2000) have reported a more relevant influence of
the IMF content on textural characteristics of Iberian dry-cured hams. Increasing levels of IMF
enhance the juiciness while reduce fibrousness perception (Ruiz-Carrascal et al., 2000) which has a
positive influence on the overall acceptability of dry-cured ham (Ruiz et al., 2002). The effect of IMF
was more marked in dry-cured loin as they had higher differences in the IMF content in comparison
with dry-cured ham. Therefore, texture of dry-cured products from GEN3 could be related to the
lower IMF content and marbling of meat products from this genotype. According to Ruiz et al., (2002)
the negative influence of some textural traits like fibrousness or juiciness could reduce the
acceptability of the dry-cured hams from GEN3.
On the other hand, García-Rey et al. (2006) reported the influence of low post-mortem pH and
genotype in the appearance of defective textures in dry-cured ham. Besides, Ruiz-Ramírez et al.,
(2005) found a close relationship between low post-mortem pH and the increases in instrumental
197

General discussion
textural traits such as hardness, cohesiveness and springiness of hams. The lowest post-mortem pH
values in L. dorsi and B. femoris from GEN3 are in accordance with the pattern of dry-cured meat
products in instrumental and sensory texture. Therefore, those parameters previously mentioned,
such as the ultimate pH and the intramuscular fat content, which are closely linked to the genotype,
have an important effect on dry-cured meat products texture.
Numerous papers have studied the influence of lipids on the formation of aroma compounds since
lipid oxidation has great importance in the development of the dry-cured meat products flavour
(reviewed by Gandemer, 2002). The lowest IMF content of loins from GEN3 could be related to their
lowest odour intensity.
Differences in the concentration of taste compounds could be the main reason of the different taste
perceptions. In general, dry-cured meat products from GEN1 and GEN2 were perceived sweeter
than those from GEN3 which were saltier and more acids (only in dry-cured ham). This could be
caused by a different salt concentration and by a different proteolysis of specific aminoacids or to the
biochemical reactions in which they are involved (Ruiz et al., 1999a; Andrés et al., 2004). In addition,
there is an opposite relationship between salt perception and IMF content (Ruiz et al., 1999a). Loins
and hams with lower IMF content, those from GEN3, were perceived as saltier than those with high
IMF content, those from GEN2.
Iberian x Duroc reciprocal crosses produced dry-cured products with similar quality, which agrees
with previous studies in Iberian dry-cured loin (Ventanas et al., in press). However, the use of Duroc
genotypes with non adequate characteristics for the cross with Iberian pig has important
consequences on the quality of Iberian dry-cured products. Similar results were found by Soriano et
al., (2005) and by Cilla et al., (2006) who reported an important influence of the Duroc line on the
quality of dry-cured hams from different crossbreeding.
4.2.- Volatile profile of dry-cured meat products. Chemical and biochemical changes that take place during ripening of dry-cured meat products from
Iberian pig provide a large number of volatile compounds which contribute to their characteristic
flavour (Cava et al., 1999; Ruiz et al., 1999b; Muriel et al., 2004).
A great number of volatile compounds were isolated in dry-cured loins (41 compounds) and dry-
cured hams (55 compounds) from different chemical families (acids, ketones, alcohols, aldehydes,
esters, nitrogen and sulphur compounds, terpenes, hydrocarbons). The number and the relative
proportion of each families and compounds differed significantly between dry-cured loins and hams.
Most volatile compounds detected in both meat products had their origin in lipid oxidation and in a
less extent in Maillard reactions or in the metabolism of microorganisms. The relative amount of
volatile compounds was twice higher in dry-cured ham than in dry-cured loin since headspace of dry-
cured ham had a higher amount of lipid derived volatiles (aldehydes, ketones and alcohols) and
Maillard compounds than dry-cured loin, while dry-cured loins had some exclusive compounds not
detected in dry-cured ham such as certain compounds with origin in the pickling mixture (paprika,
garlic, oregano …).
198
General discussion
In general, differences in the volatile profile of dry-cured hams and loins could be caused by the
different manufacture process and ripening conditions (length of ripening, temperatures…). So, the
shorter ripening (4 months vs 24 months) and the lower temperatures reached during the dry-cured
loin processing compared to that of dry-cured hams, could have contributed to a more limited
development of the chemical reactions involved in flavour compounds generation in dry-cured loin.
As a consequence, the formation of lipid and protein derived compounds and the reaction between
them to form Maillard volatile compounds could be enhanced in dry-cured ham. On the other hand,
dry-cured loin had a higher content of certain volatile compounds from the pickling mixture, such as
sulfur compounds and terpenes, which have strong aromatic notes and could play an important role
in the overall aroma notes of this meat product. Results are in agreement with literature since flavour
compounds of dry-cured products have their origin in the oxidation of unsaturated fatty acids and
from amino acids degradation as well as in the reactions between compounds from both origins
(Ventanas et al., 1992; Ruiz et al., 1999b; Carrapiso et al., 2002a). However, in dry-cured loin, the
importance of these compounds is lessened due to both the addition of spices in the manufacture
process and the shorter ripening (Muriel et al., 2004).
Volatiles from lipid oxidation were higher in dry-cured ham than in dry-cured loin, which agrees with
the longer ripening of dry-cured hams respect to loins. Among lipid-derived compounds straight-chain
aliphatic acids, aldehydes, alcohols, ketones and some hydrocarbons are most likely derived from
the oxidative degradation of unsaturated fatty acids (Shahidi, 1986). Straight chain aliphatic
aldehydes have low odour threshold values, and consequently, play an important role especially in
dry-cured ham flavour (Martín et al., 2000). Hexanal content in dry-cured ham was approximately
twice higher than in dry-cured loins, which is in accordance with the longer ripening time in hams and
the development in a higher extent of the lipid oxidation reactions.
Most of the volatiles from Maillard reaction were short-chain branched aldehydes and their
corresponding alcohols with origin in Strecker degradation reactions of amino acids (Ventanas et al.,
1992), which is an important pathway associated with Maillard reaction. 2- and 3-methylbutanal,
which were abundantly isolated in dry-cured ham, have low threshold values and provide pleasant
“cured” flavours to dry-cured ham (Ruiz et al., 1999b). The high proportion of volatiles from Maillard
reaction could be related to the high acceptability of these products, since Maillard compounds,
which had very low threshold values, add pleasant aroma notes (Mottram et al., 1998). The higher
amounts and number of compounds with origin in protein degradation in dry-cured ham respect to
dry-cured loin show the more implication of Maillard compounds in the aroma of the dry-cured ham.
In contrast, esters, which were originated by microorganism’s esterification, had low percentages in
both dry-cured products.
In dry-cured loin, nearly a quarter of the volatiles came from spices (Spanish paprika, oregano and
garlic), which were mainly terpenes and to a lesser extent, aliphatic sulfur compounds. Sulfur
compounds derived from allicin are characteristic of garlic aroma (reviewed by Lanzotti, 2006), while
terpenes could come from the oregano in the pickling mixture.
A few compounds showed differences between genotypes in both dry-cured products while sex did
not affect volatile compound profiles.
199

General discussion
In dry-cured loin, volatile compounds with origin in the pickling mixture (terpenes and sulfur
compounds) showed similar contents as all loins underwent the same manufacture process.
However, some lipid derived volatile compounds showed differences between genotypes. Hexanal
content was highest in GEN3, which is in line with the higher n-6 fatty acids content in IMF since
hexanal mainly derives from oxidation of n-6 fatty acids (Tamura et al. 1991). Hexanal has been
considered an indicator of flavour deterioration in Iberian dry-cured ham (Cava et al., 1999).
However, the spices added in the seasoning could have contributed to lessen the differences
between genotypes in L. dorsi and dry-cured loin quality, which agree with results of Muriel et al.
(2004).
On the other hand, the scarce differences between genotypes in dry-cured ham could be due to the
similar intramuscular fat content and fatty acid composition of Biceps femoris between genotypes as
the changes in the lipids during processing are the main contributors to volatile flavour compounds
formation (Ruiz et al., 1999; Carrapiso et al., 2002a).
Different authors described that the main cause of variation in volatile profiles in Iberian dry-cured
products are those related with the feeding regime features (free-range rearing vs. intensive, length
of feeding regime, presence and level of compounds with antioxidant activity and type of dietary fat),
being the pig genotype (pure Iberian vs. Iberian x Duroc cross, reciprocal cross ..) less determinant in
volatile profile of such products (Cava et al., 1999; Muriel et al., 2004; Carrapiso et al., 2002b).
In relation with volatile profiles findings, panellists did not found significant differences in the flavour
and odour intensity of dry-cured hams from the three genotypes while detected lower odour intensity
in dry-cured loins from GEN3 than in their counterparts.
5.- RELATIONSHIP BETWEEN RAW MATERIAL AND DRY-CURED MEAT PRODUCTS QUALITY Meat and dry-cured meat products quality was not affected by reciprocal cross, since no differences
were found neither in raw material quality traits nor dry-cured meat products. However, Duroc sire
line clearly affected the quality of the raw material and dry-cured meat products. The two main
factors of the raw material that affected dry-cured meat quality were those related to the adipogenic
potential and the IMF content, and the ultimate pH and those traits affected by its value, such as
paleness, cook and drip loss; both, closely linked with the genotype.
Parameters related to the fat content of meat such as fat thickness, IMF content or lypogenic
enzymes activity were some of the most determinant parameters of the differences between
genotypes in fresh and in dry-cured meat products. These parameters mainly affected characteristics
of dry-cured products such as those related to texture and flavour. High IMF content in dry-cured
meat products increases the juiciness (Cava et al., 2000; Ruiz-Carrascal et al., 2000), reduces
dryness, fibrousness and hardness (Ruiz-Carrascal et al., 2000) and favours the formation of lipid
derived aroma compounds (Shahidi et al., 1986), which is consistent with characteristics found in
dry-cured meat products from GEN2 and GEN1.
The less intensity of colour in dry-cured meat products from GEN3 could be due to their less intense
colour in raw material. Additionally, the higher PUFA levels of meat from GEN3 could have favoured
200
General discussion
the oxidation of myoglobin in the muscle and as a result of the exposition of heme group to the
environment enhancing peroxidation mechanism (Baron and Andersen, 2002).
García-Rey et al. (2005, 2006) reported the influence of low post-mortem pH and genotype in the
appearance of defective textures in dry-cured hams. In addition, an excess of proteolysis due to low
pH could enhance bitterness (Virgili et al., 1995), saltiness, aged or acid tastes (Careri et al., 1993)
which could be related to the more intense perception of salt and acid tastes in dry-cured products
from GEN3. Low post-mortem pH could also affect the colour of dry-cured meat products, as the
oxidation of myoglobin is pH dependent (reviewed by Baron and Andersen, 2002). So, low post-
mortem pH favours the oxidation of myoglobin avoiding their linkage with nitrite compounds which
decrease colour intensity in dry-cured meat products. Previous studies (Chizzolini et al., 1996) have
reported the connection between post-mortem pH and the colour before curing with the colour of dry-
cured hams. In addition, Juncher et al., (2003) reported a significant effect of post-mortem pH in the
oxidative and colour stability during the storage of nitrite-cured cooked meat products.
Lipid oxidation reactions increase during the maturation of dry-cured meat products. Hams
manufactured with raw meat rich in PUFA had higher hexanal content and were perceived as more
rancid by panellists (Cava et al., 1997) which agrees with the higher content of PUFA in raw LD in
GEN3 and the higher oxidation development in dry-cured loin. Dry-cured ham followed a similar trend
although differences were not statistically significant. Ventanas et al. (2006b) reported a parallel
development of lipid and protein oxidation reactions in the ripening of dry-cured loin. Other authors
(Rowe et al., 2004) have reported that protein oxidation modifications can affect negatively the
sensory quality of fresh meat and meat products in terms of texture, tenderness and colour which
could be related to the higher protein oxidation levels in raw material from GEN3 and the texture and
colour of dry-cured meat products from this genotype.
Raw material from GEN3 had low post-mortem pH values, high drip and cook loss and low oxidative
stability which could favour the appearance of negative texture traits like fibrousness and the
development of paler colours and acid tastes in dry-cured meat products. Therefore, dry-cured meat
products from GEN3, due to their lower level of IMF content and the low ultimate pH showed worse
quality traits. Parameters closely related to the genotype, such as post-mortem pH and IMF content,
could be predictors for the quality of dry-cured meat products. As a consequence, the measurement
of these parameters in the raw material for the manufacture of dry-cured meat products may provide
determinant information to assure the quality of the dry-cured products.
BIBLIOGRAPHY Alasnier, C., and Gandemer, G. (2000). Activities of
phospholipases A and lysophospholipases in glycolytic and oxidative skeletal muscles in the rabbit. Journal of the Science of Food and Agriculture, 80, 698–704.
Alasnier, C., David-Briand, E., and Gandemer, G. (2000a). Lipolysis in muscles during refrigerated storage as related to the metabolic type of the fibres in the rabbit. Meat Science, 54, 127-134.
Alasnier, C., Meynier, A., Viau, M., and Gandemer, G. (2000b). Hydrolytic and oxidative changes in the lipids of chicken breast and thigh muscles
during refrigerated storage. Journal of Food Science, 65, 9–14.
Andersen, H. J. (2000). What is pork quality? In Quality of meat and fat in pigs as affected by genetics and nutrition. EAAP Publication No. 100, (pp. 15–26). Zurich, Switzerland.
Andrés, A. I., Cava, R. Ventanas, J. Thovar, V., and Ruiz, J. (2004) Sensory characteristics of Iberian ham: Influence of salt content and processing conditions. Meat Science, 68 (1), 45-51
Arnau, J. (1998). Principales problemas tecnológicos en la elaboración de jamón curado. In Special
201

General discussion
Symposium-44th ICOMST (pp.72–86), Barcelona, Spain
Baron, C. P., and Andersen, J.H. (2002) Myoglobin-induced lipid oxidation. A review. Journal of Agricultural and Food Chemistry, 50, 3887-3897.
Brewer, M.S., Shu, L.G., Bidner, B., Meisinger, D.J., and McKeith, F.K. (2001). Measuring pork colour: effects of bloom time, muscle, pH and relationship to instrumental parameters. Meat Science, 57, 169-176
Brisckey, E.J. (1964). Etiological status and associated studies of pale, soft, exudative porcine musculature. In C.O. Chichester, E.M. Mrak and G.F. Stewart, Advances in food research (vol. 13) (pp. 89-178). New York: Academic Press.
Careri, M., Mangia, A., Barbieri, G., Bolzoni, L., Virgili, R. and Parolari, G. (1993). Sensory property relationships to chemical data of Italian-type dry-cured ham. Journal of Food Science, 58, 968-972.
Carrapiso, A. I., and García, C. (2005). Instrumental colour of Iberian ham subcutaneous fat and lean (Biceps femoris): Influence of crossbreeding and rearing system. Meat Science, 71, 284-290
Carrapiso, A.I., Jurado, A., and García, C. (2003). Effect of crossbreeding and rearing system on Iberian ham volatile compounds. Food Science Technology International. 9 (6), 421-426
Carrapiso, A.I., Ventanas, J., and García, C. (2002a). Characterization of the Most Odor-Active Compounds of Iberian Ham Headspace. J. Agricultural Food Chemistry, 50, 1996-2000
Carrapiso, A.I., Jurado, A., Timón, M.L., García, C. (2002b). Odor-Active Compounds of Iberian Hams with Different Aroma Characteristics. J. Agricultural Food Chemistry, 50, 6453-6458
Cava, R., Ferrer, J.M., Estévez, M., Morcuende, D., and Toldrá, F. (2004). Composition and proteolytic and lipolytic enzyme activities in muscle Longissimus dorsi from Iberian pigs and industrial genotype pigs. Food Chemistry, 88, 25–33
Cava, R., Estévez, M., Ruiz, J., and Morcuende, D. (2003). Physicochemical characteristics of three muscles from free-range reared Iberian pigs slaughtered at 90 kg live weight. Meat Science, 63, 533–541
Cava, R., Ruiz J., López-Bote C., Martín L., García C., Ventanas J., Antequera T. (1997). Influence of finishing diet on fatty acid profiles of intramuscular lipids, triglycerides and phospholipids in muscles of the Iberian pig. Meat Science, 45, 2, 263-270
Cava, R., Ruiz, J., Ventanas, J., and Antequera, T. (1999). Oxidative and lipolytic changes during ripening of Iberian hams as affected by feeding regime: extensive feeding and alpha-tocopheryl acetate supplementation. Meat Science, 52, 165-172.
Cava, R., Ventanas, J., Ruiz, J., Andres, A. I., and Antequera, T. (2000). Sensory characteristics of Iberian ham: influence of rearing system and muscle location. Food Science and Technology International, 6(3), 235–242.
Chizzolini, R., Novelli, E., Campanini, G., Dazzi, G., Madarena, G., Zanard,i E., Pachioli, M.T., and Rossi, A., (1996) Lean Colour of Green and Matured Parma Hams: Comparative Evaluation
and Technological Relevance of Sensory and Objective Data. Meat Science, 44, (3), 159- 172.
Cilla, I., Altarriba, J., Guerrero, L., Gispert, M., Martínez, L., Moreno, C., Beltrán, J.A., Guàrdia, M.D., Diestre, A., Arnau, J., and Roncalés, P. (2006) Effect of different Duroc line sires on carcass composition, meat quality and dry-cured ham acceptability Meat Science, 72 (2), 252-260
Engelmann, B. (2004). Plasmalogens: targets for oxidants and major lipophilic antioxidants, Biochem. Soc. Trans. 32147–150.
Estévez, M.,and Cava, R. (2004). Plasmalogens in pork: aldehyde composition and changes in aldehyde profile during refrigerated storage or raw and cooked meat. Food Chemistry 85, 1-6.
Gandemer, G. (2002). Lipids in muscles and adipose tissues, changes during processing and sensory properties of meat products. Meat Science, 62, 309-321.
García-Rey R.M., Quiles-Zafra R., and Luque de Castro, M.D. (2006). Relationships of genotype and slaughter time with the appearance and texture of dry-cured hams. Food Chemistry 94, 271–277.
García-Rey, R.M., García-Olmo, J., De Pedro, E., Quiles-Zafra R., and Luque de Castro M.D. (2005) Prediction of texture and colour of dry-cured ham by visible and near infrared spectroscopy using a fiber optic probe. Meat Science, 70, 2, 357-363
Gray, J.I., Gomaa, E.A., and Buckley, D.J. (1996) Oxidative Quality and Shelf life of meats. Meat Science, 43, S, S111-123.
Hovenier, R., Brascamp E.W., Kanis, E., Van Der Werf J.H.J. and Wassenber. A. (1993). Economic values for optimal traits: the example of meat quality in pigs. Journal of Animal Science. 71, 1429-1433.
Hoz, L., Cambero, I. Santos, C., Herranz, B.,and Ordóñez, J.A. Fatty acids and sensory characteristics of Spanish dry-cured loin enriched in acid α-linolenic and α-tocopherol (in press). Food Chemistry.
Huff-Lonergan, E., and Lonergan, S. M. (2005) Mechanisms of water-holding capacity of meat: The role of post-mortem biochemical and structural changes. Meat Science, 71, (1), 194-204
Juncher, D., Rønn, B., Hansen, T. B., Henckel, P., Karlsson, A., Skibsted, L.H. and Bertelsen, G. (2003). Effect of pre-slaughter physiological conditions on the oxidative stability of colour and lipid during chill storage of sliced, retail packaged roast ham. Meat Science, 63, (2), 151-159
Juncher, D., Ronn, B., Mortensen, E.T., Henckel, P., Karlsson A., Skibsted L.H.,and Bertelsen, G. (2001) Effect of pre-slaughter physiological conditions on the oxidative stability of colour and lipid during chill storage of pork. Meat Science 58, 347-357.
Lanzotti, V. (2006) The analysis of onion and garlic. Review. Journal of Chromatography A, 1112, 3–22
Lindahl, G., Heckel, P., Karlsson, A.H. and Andersen, H.J. (2006). Significance of early post-mortem temperature and pH decline on colour
202
General discussion
characteristics of pork loin from different crossbreeds. Meat Science, 72, (4) 613-623
Lindahl, G., Lundström, K., and Tornberg E. (2001) Contribution of pigment content, myoglobin forms and internal reflectance to the colour of pork loin and ham from pure breed pigs. Meat Science, 59 (2), 141-151
Lonergan, S. M., Huff-Lonergan, E., Rowe, L.J., Kuhlers, D. L., and Jungst, S.B. (2001) Selection for lean growth efficiency in Duroc pigs influences pork quality. Journal Animal Science.79, 2075-2085
López-Bote, C.J. (1998). Sustained utilisation of the Iberian pig breed. Meat Science, 49, Suppl. I, Sl7-S27.
Mancini, R.A. and Hunt, M.C. (2005) Current research in meat color. Meat Science, 71, (1), 100-121
Martín, L., Timón, M.L. Petrón, M.J., Ventanas, J., and Antequera, T. (2000). Evolution of volatile aldehydes in Iberian ham matured under different processing conditions. Meat Science, 54, 333-337
Mercier, Y., Gatellier, P. and Renerre, M. (2004) Lipid and protein oxidation in vitro, and antioxidant potential in meat from Charolais cows finished on pasture or mixed diet Meat Science, 66, (2) 467-473
Mercier, Y., Gatellier, P., Viau, M., Remignon, H., and Renerre, M. (1998) Effect of dietary fat and vitamin E on colour stability and on lipid and protein oxidation in turkey meat during storage, Meat Science, 48, (3-4), 301-318
Monin, G., Hortós, M., Díaz, I., Rock, E., & Garcia-Regueiro, J. A. (2003). Lipolysis and lipid oxidation during chilled storage of meat from Large White and Pietrain pigs. Meat Science, 64, 7–12.
Morales, J., Pérez, J. F., Baucells, M. D., Mourot, J., and Gasa, J. (2002). Comparative digestibility and lipogenic activity in Landrace and Iberian finishing pigs fed ad libitum corn- and corn–sorghum–acorn-based diets. Livestock Production Science, 77 (2-3), 195-205.
Morcuende, D., Estévez, M., Ruiz, J., and Cava, R. (2003). Oxidative and lipolytic deterioration of different muscles from free-range reared Iberian pigs under refrigerated storage. Meat Science, 65, 1157-1164.
Morcuende, D., Estévez, M., Ramírez, R., and Cava, R. (submitted). Effect of the Iberian x Duroc reciprocal cross on production parameters, meat quality and lipogenic enzyme activities. Meat Science
Morcuende, D., Estévez, M., Ruiz, J. and Cava, R. (2003) Oxidative and lipolytic deterioration of different muscles from free-range reared Iberian pigs under refrigerated storage. Meat Science, 65, (3), 1157-1164
Morrissey, P.A., Sheehy, P.J.A., Galvin, K., Kerry, J.P, and Buckley, D.J. (1998). Lipid stability in meat and meat products. Meat Science, 49, (1), S73-S86
Mottram, D.S. (1998). Flavour formation in meat and meat products: a review. Food Chemistry, 62, (4), 415-424.
Mourot, J., and Kouba, M. (1998). Lipogenic enzyme activities in muscles of growing Large White and Meishan pigs. Livestock Production Science, 55, 127–133
Mourot, J., Kouba, M, and Bonneau, M. (1996). Comparative study of in vitro lipogenesis in various adipose tissues in the growing Meishan pig: comparison with the Large White pig (Sus domesticus). Comp. Biochemical Physilogy. 115B, Nº3, 383-388.
Muriel, E., Antequera, T., Petrón, M.J., Andrés, A.I., and Ruiz, J. (2004). Volatile compounds in Iberian dry-cured loin. Meat Science 68, 391-400
Nawar, WW. (1996). Lipids. In Food Chemistry, O.R. Fennema (ed.), Marcel Dekker, Inc., New York, 225-319
Offer, G. (1991). Modelling of the formation of pale, soft and exudative meat: Effects of chilling regime and rate and extent of glycolysis. Meat Science, 30, 157-184.
Offer, G., and Knight, P. (1988). The structural basis of water-holding in meat. Part 2: drip losses. In R. Lawrie (Ed.), Development in meat science 4 (pp. 172–243). London: Elsevier Applied Science.
Pérez-Álvarez, J.A., Sayas-Barberá, M.E., Fernández-López, J., Gago-Gago, M.A. Pagán-Moreno, M.J., and Aranda-Catalá V. (1998).Spanish dry-cured ham aging process: colour characteristics. Proceedings 44th ICOMST. Barcelona.pp 984-985.
Renerre, M. (1990). Review: factors involved in the discoloration of beef meat. International Journal of Food Science and Technology, 25, 613–630.
Rosell, C. M., and Toldrá, F. (1998). Comparison of muscle proteolytic and lipolytic enzyme levels in raw hams from Iberian and white pigs. Journal of the Science of Food and Agriculture, 76, 117–122.
Rowe, L.J., Maddock, K.R., Lonergan, S.M., and Huff-Lonergan, E. (2004). Influence of early post-mortem protein oxidation on beef quality, Journal of Animal Science 82, 785–793
Ruiz, J., Ventanas, J., Cava, R., Andrés, A. and García, C. (1999b). Volatile compounds of dry-cured Iberian ham as affected by the length of the curing process. Meat Science, 52, 19- 27
Ruiz, J., García, C., Díaz, M. C., Cava, R., Tejeda, J.F., and Ventanas, J. (1999a). Dry-cured Iberian ham non-volatile components as affected by the length of the curing process. Food Research International, 32, 643-651
Ruiz, J., García, C., Muriel, E., Andrés, A. I. and Ventanas J. (2002). Influence of sensory characteristics on the acceptability of dry-cured ham. Meat Science, 61,(4), 347-354
Ruiz-Carrascal, J., Ventanas, J., Cava, R. Andrés, A. I. and García, C. (2000). Texture and appearance of dry cured ham as affected by fat content and fatty acid composition. Food Research International, 33, (2), 91-95.
Ruiz-Ramírez, J., Arnau, J., Serra X. and Gou, P. (2005) Relationship between water content, NaCl content, pH and texture parameters in dry-cured muscles. Meat Science, 70 (4) 579-587
Serra, X., Ruiz-Ramírez, J., Arnau, J., and Gou, P. (2005) Texture parameters of dry-cured ham m. Biceps femoris samples dried at different levels
203
General discussion
as a function of water activity and water content. Meat Science, 69, 249–254
Shahidi, F., Rubin, L. J., and D’Souza, L. A. (1986). Meat flavor volatiles: a review of the composition, techniques of analysis and sensory evaluation. CRC Crit. Rev. Food Science. Nutrition, 24, 141–243.
Simopoulos, A.P. (2003). Importance of the ratio of omega-6/omega-3 essential fatty acids: evolutionary aspects, Omega-6/omega-3 essential fatty acid ratio. The scientific evidence, A.P. Simopoulos and K.A. Cleland, Basel, Karger. Vol. 92, 1-22.
Soriano A., Quiles R., Mariscal C., and García-Ruiz, A. (2005). Pig sire type and sex effects on carcass traits, meat quality and physicochemical and sensory characteristics of Serrano dry-cured ham. Journal of the Science of Food and Agriculture 85, 1914–1924.
Suzuki, K., Shibata, T., Kadowaki, H., Abe, H., and Toyoshima (2003). Meat quality comparision of Berkshire, duroc and crossbred pigs sired by Berkshire and duroc. Meat Science, 64, 35-42.
Tamura, H., Kitta, K. and Shibamoto, T., (1991). Formation of reactive aldehydes from fatty acids in a Fe2+/H2O2 oxidation system. Journal of Agricultural and Food Chemistry 39, pp. 439–442.
Toldrá, F., Flores, M., Aristoy, M.C., Virgili, R., and Parolari, G. (1996). Pattern of muscle proteolytic and lipolytic enzymes from light and heavy pigs. Journal Science of Food and Agriculture, 71, 124–128.
Ventanas, S., Ventanas, J., and Ruiz, J. (in press). Sensory characteristics of Iberian dry-cured loins: Influence of crossbreeding and rearing system. Meat Science. doi:10.1016/j.meatsci.2006.07.003
Ventanas, S., Ventanas, J., Jurado, A., and Estévez, M. (2006a). Quality traits in muscle Biceps femoris and back-fat from purebred Iberian and reciprocal Iberian x Duroc crossbred pigs. Meat Science 73, 651–659
Ventanas, J., Córdoba, J.J., Antequera, T., García, C., López-Bote, C., and Asensio, M.A. (1992) Hydrolysis and Maillard reaction during ripening of Iberian ham, Journal Food Science, 54 (4), 813-815
Ventanas, S., Estevez, M., Tejeda, J.F., and Ruiz, J. (2006b) Protein and lipid oxidation in Longissimus dorsi and dry-cured loin from Iberian pigs as affected by crossbreeding and diet. Meat Science, 72, (4), 647-655.
Virgili, R., Parolari, G., Schivazzappa, C., Bordini, C. and Volta, R. (1995). Effects of raw material on proteolysis and texture of typical Parma ham. Ind. Conserve, 70, 21-31.
Wood, J.D., Richardson, R.I., Nute, G.R., Fisher, A.V., Campo, M.M., Kasapidou, E., Sheard, P.R.,and Enser, M. (2003). Effects of fatty acids on meat quality: a review. Meat Science, 66, 21–32.
204

Conclusions


Conclusions
CONCLUSIONS
1. Iberian x Duroc reciprocal cross scarcely affects meat quality; however, pigs from Iberian sows
(GEN2) have better production parameters and dry-cured meat products quality, mainly due to
their higher intramuscular fat content.
2. Production parameters are significantly affected by the Duroc sire genotype; Duroc genotypes
selected for meat production produce leaner hybrids (GEN3) with higher cut yields than those
from Duroc sire genotypes selected for the manufacture dry-cured meat products (GEN2), with
more carcass fat and lower cuts yields.
3. Post-mortem pH and intramuscular fat content, factors closely linked with pig genotype, are
determinant factors for the quality and oxidative stability of the meat. Meat from crossbred pigs
with Duroc sires selected for meat products manufacture (GEN2) has better quality because of
the higher intramuscular fat content, better ultimate pH and colour.
4. Fat depths, intramuscular fat content and lipogenic enzyme activities are positively correlated.
These traits were higher in those crossbred pig genotypes (GEN1 and GEN2) from Duroc
sire/sow selected for dry-cured meat products manufacture. The measurement of the activity of
these enzymes could be used as pig selection criteria in terms of adipogenic character.
5. Meat deterioration during refrigerated storage is significantly affected by the Duroc sire line
genotype. Meat from crossbred pigs with Duroc sire lines selected for meat production (GEN3)
is more prone to lipid and protein oxidation and discoloration processes.
6. The Duroc sire line significantly affects the quality of dry-cured products. Dry-cured loins and
hams from crossbred pigs with Duroc selected for meat production (GEN3) showed a lower
quality than those from crossbred pigs with Duroc selected for dry-cured products manufacture
(GEN2).
7. Volatile profile of dry-cured loins and hams is scarcely affected by the pig genotype; it is more
affected by the characteristics of the manufacture process. Dry-cured ham has highest lipid
derived and Maillard compounds, which is in line with its longer ripening and more intense
development of lipid oxidation; while dry-cured loin has large amount of compounds from the
pickling mixture added in the manufacture process.
8. Raw material characteristics have an important effect on the quality of dry-cured meat products.
Intramuscular fat content and postmortem pH of raw material are the main factors responsible of
the quality of Iberian dry-cured meat products, being both parameters closely related to the pig
genotype.

Conclusions
CONCLUSIONES
1. El cruce recíproco ibérico x duroc afecta mínimamente a la calidad de la carne, aunque los
híbridos procedentes de hembras ibéricas (GEN2) presentan mejores parámetros
productivos así como una mejor calidad en los productos cárnicos, probablemente por su
mayor contenido en grasa intramuscular.
2. El genotipo de la línea paterna duroc tiene un gran efecto en los parámetros productivos; las
líneas duroc de genotipo carnicero dan lugar a híbridos (GEN3) más magros y con mayores
rendimientos cárnicos que los genotipos duroc seleccionados para la producción de
productos cárnicos (GEN2), que muestran un mayor contenido de grasa en la canal y
menores rendimientos de piezas nobles.
3. Dos parámetros muy relacionados con el genotipo, como el valor del pH postmortem y el
contenido en grasa intramuscular, son factores determinantes para la calidad y la estabilidad
oxidativa de la carne. La carne de cerdos cruzados con líneas de machos duroc
seleccionados para la producción de productos cárnicos (GEN2) es de mejor calidad por su
mayor contenido en grasa intramuscular, mejor pH postmortem y color.
4. Los depósitos grasos en la canal, el contenido en grasa intramuscular y la actividad de las
enzimas lipogénicas son factores estrechamente relacionados. Estos parámetros son más
elevados en cerdos procedentes de líneas duroc paternas o maternas (GEN1 y GEN2)
seleccionados para la elaboración de productos cárnicos curados. La medida de la actividad
de estas enzimas podría ser un criterio útil para la selección de cerdos en función de su
carácter adipogénico.
5. El genotipo de la línea paterna duroc afecta a la estabilidad oxidativa de la carne durante su
almacenamiento a refrigeración. La carne de cerdos cruzados con líneas duroc de genotipo
carnicero es más propensa la sufrir reacciones de oxidación de lípidos y de proteínas así
como procesos de decoloración.
6. El genotipo de la línea paterna duroc afecta a la calidad de los productos cárnicos curados
ya que los lomos y jamones curados procedentes de líneas duroc de genotipo carnicero
mostraron peor calidad que los otros genotipos estudiados.
7. El perfil de compuestos volátiles de los lomos y jamones curados apenas se vio afectado por
el genotipo del cerdo mientras que las características propias del procesado mostraron un
gran efecto. Los jamones curados mostraron un mayor contenido en compuestos derivados
de la oxidación de lípidos y de la reacción de Maillard, coincidiendo con el mayor tiempo
procesado y el mayor desarrollo de las reacciones de oxidación lipídica, mientras que el
lomo curado tiene mayor contenido de compuestos procedentes del adobo.
8. Las características de la carne fresca tienen gran importancia en la calidad de los productos
curados. El contenido en grasa intramuscular y el pH postmortem, parámetros muy ligados
al genotipo, son los principales factores que influyen en la calidad de los productos curados.