Embed Size (px)
Citation preview
1
2
Electricity Distribution Interface Toolkit Developed for
Electricity Governance Initiative By
Prayas Energy Group Applied for Tajikistan’s electricity sector by Consumers Union of Tajikistan
About the Electricity Governance Initiative (EGI)
http://electricitygovernance.wri.org The Electricity Governance Initiative (EGI) is a unique network of civil society organizations dedicated to promoting transparent, inclusive and accountable decision-making in the electricity sector. We facilitate collaboration of civil society, policymakers, regulators, and other electricity sector actors using a common framework to define “good governance.” Since 2005, we have worked with civil society organizations around the world to complete assessments of electricity governance in their respective countries, and to advocate for improvements in governance. More than 30 organizations around the world are now partners in the Initiative. World Resources Institute (WRI) serves as the global secretariat for EGI, with Prayas Energy Group (PEG) acting as the Initiative’s special knowledge partner.
About World Resources Institute (WRI)
http://www.wri.org The World Resources Institute is a global environmental think tank that goes beyond research to put ideas into action. We work with governments, companies, and civil society to build practical solutions to urgent environmental challenges. WRI’s transformative ideas protect the Earth and promote development because sustainability is essential to meeting human needs and fulfilling human aspirations for the future.
About Prayas Energy Group, Pune, India
http://www.prayaspune.org/ Prayas is a non-governmental, non-profit organisation based in Pune, India. Members of Prayas are professionals working to protect and promote the public interest in general, and interests of the disadvantaged sections of the society, in particular. Prayas Energy Group (PEG) has been active since 1990 in the area of electricity sector policy analysis and advocacy. We believe that effective control and influence on governance by people and civil society organisations is the key to efficient governance that would protect and promote public interest. Public interest issues include consumer issues as well broad social issues. In consumer issues, PEG gives more attention to the issues affecting the poor and the disadvantaged. Social issues include environmental sustainability and equity.
About Consumers Union of Tajikistan, Dushanbe, Tajikistan www.barknest.tj
The Consumers Union of Tajikistan (CU) is national a non-profit, non-governmental organization, created in July 2002, the mission organization is assistance in consumers' rights and interests’ protection, building a fair and competitive market of goods and services in Tajikistan. CU is affiliated member of Consumers International (http://www.consumersinternational.org/) since 2005 and full member of International confederation of consumer societies KonfOP (www.konfop.ru) since 2003. Nowadays the Consumers Union successfully carries out several programmatic activities, such as 1) Creation of effective legislative base in the field of consumer protection in Tajikistan 2) Promoting transparent, inclusive and accountable decision-making in the sector of residential services: electricity, drinking water and sanitation, housing maintenance and natural gas 3) Raising consumer awareness through information campaigns 4) Providing free of charge pre-trial and court protection for consumers.
3
Objective: The Electricity Distribution Interface Toolkit (EDIT) is envisioned as a tool to empower civil society and consumer groups to understand problems and issues relating to electricity service delivery and enable informed engagement with utilities, government and other related agencies, thereby contributing to improved service quality to electricity consumers. The process of conducting an EDIT assessment is also aimed at facilitating the building of coalitions and local level consumer advocates so as to sustain local level leadership and capacity to work on improving electricity service delivery beyond the EDIT assessment. EDIT assessments will also enable partner organizations to improve understanding about the electricity sector and provide opportunities to interact with utilities, government and other related agencies. This would provide more space for further interventions in the sector. Methodology: EDIT consists of two phases. Phase 1, in the form of a ‘Checklist Survey’, focuses on developing baseline data / evidence and understanding of what are the key problem areas or issues affecting consumers. Phase 2 focuses on identifying causes of and potential solutions to key problem areas or issues identified in Phase 1. The actual checklist/survey questionnaire should be applied at the individual consumer level. It covers issues by which consumers are most likely to be affected, such as metering and billing problems or supply interruptions. This component also provides guidance for sampling and conducting the survey. Given report is result of applying of EDIT survey (Phase 1) to Tajikistan. Within framework of current survey, EDIT questionnaire was adapted and additional questions specifying certain aspects of energy use in winter period were included. In general, the questionnaire is composed of the following basic blocks of questions defining interrelationship of consumers and providers, which arise upon:
§ Initial connection to electricity network § Electricity accounting/ metering § Billing and payment for electricity § Quality of services on electricity supply § Awareness of consumers § At last, final block that generalizes suggestions and comments of consumers
The Electricity Governance Initiative (EGI) in Tajikistan is made possible by the support of the Open Society Institute Assistance
Foundation–Tajikistan
4
Methodology of EDIT apply in Tajikistan The EDIT application in Tajikistan was initiated by Consumers Union of Tajikistan (CU) and was implemented by research agency M-Vector. The sampling was based on the general proportion of population in age of 18 and older, living in survey area, with the following proportional division: on urban 19%, and rural - 81%. The EDIT survey was applied on whole territory of Tajikistan, except for Badakhshan region's territory, because the focus of EDIT this year was the main national electricity utility - Barki Tojik's area of supply.
The final sampling:
Region Sample Dushanbe 123
Sugd
Khujand city 49 Isfara 56 B. Gafurov 93 Istaravshan 52 Gonchi 40 Kanibadam 43 J. Rasulov 35
DRS
Tursunzoda city 15 Vakhdat 72 Tursunzoda district 112 Gissar 66 Shahrinav 29 Faizabad 23 Rasht 29
Khatlon
Kulyab city 29 J.Rumi 43 Bokhtar 57 Hamadoni 38 Dangara 38 Jomi 40 Vakhsh 44
Total: 1126
Finally there were 1126 people interviewed on their residential places. Each selected settlement was divided into conditional, disjoint sections. In each section for interviewers was appointed starting point (school, hospital, or house of local community leader), from this point interviewer had to start own specified road. More on sampling and survey process will be on final version of report.
5
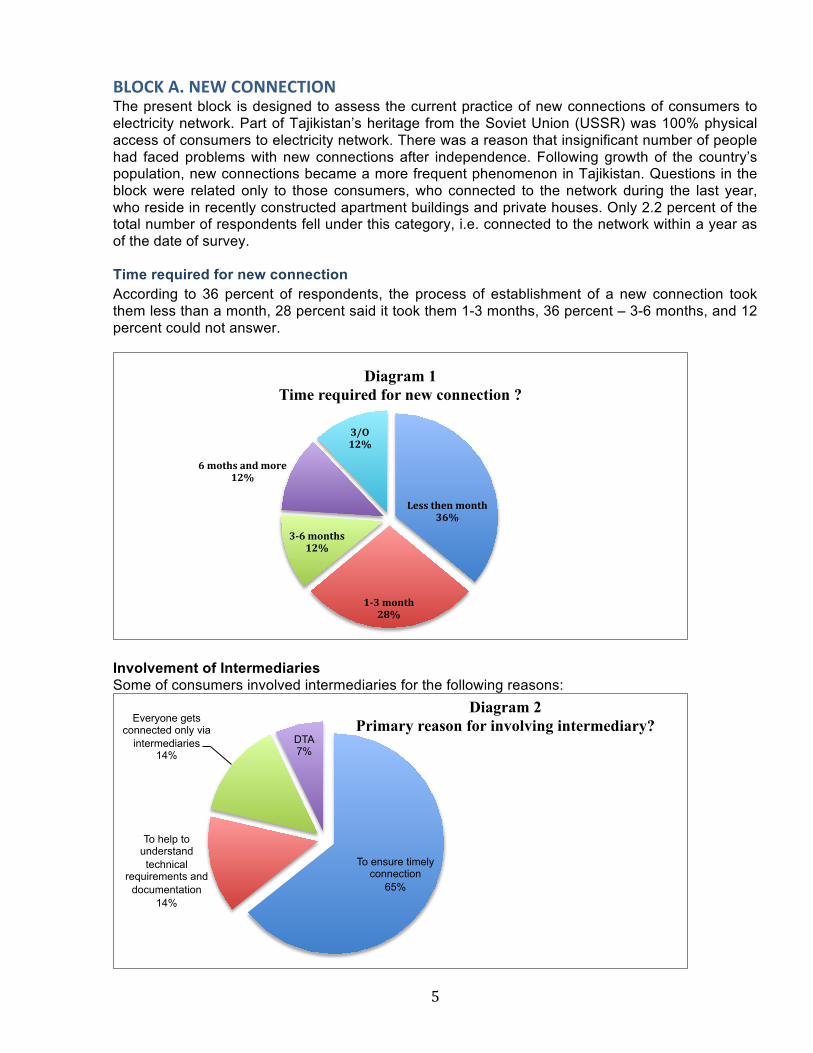
BLOCK А. NEW CONNECTION The present block is designed to assess the current practice of new connections of consumers to electricity network. Part of Tajikistan’s heritage from the Soviet Union (USSR) was 100% physical access of consumers to electricity network. There was a reason that insignificant number of people had faced problems with new connections after independence. Following growth of the country’s population, new connections became a more frequent phenomenon in Tajikistan. Questions in the block were related only to those consumers, who connected to the network during the last year, who reside in recently constructed apartment buildings and private houses. Only 2.2 percent of the total number of respondents fell under this category, i.e. connected to the network within a year as of the date of survey. Time required for new connection According to 36 percent of respondents, the process of establishment of a new connection took them less than a month, 28 percent said it took them 1-3 months, 36 percent – 3-6 months, and 12 percent could not answer.
Involvement of Intermediaries Some of consumers involved intermediaries for the following reasons:
Less then month 36%
1-‐3 month 28%
3-‐6 months 12%
6 moths and more 12%
З/О 12%
Diagram 1 Time required for new connection ?
To ensure timely connection
65%
To help to understand technical
requirements and documentation
14%
Everyone gets connected only via
intermediaries 14%
DTA 7%
Diagram 2 Primary reason for involving intermediary?
6
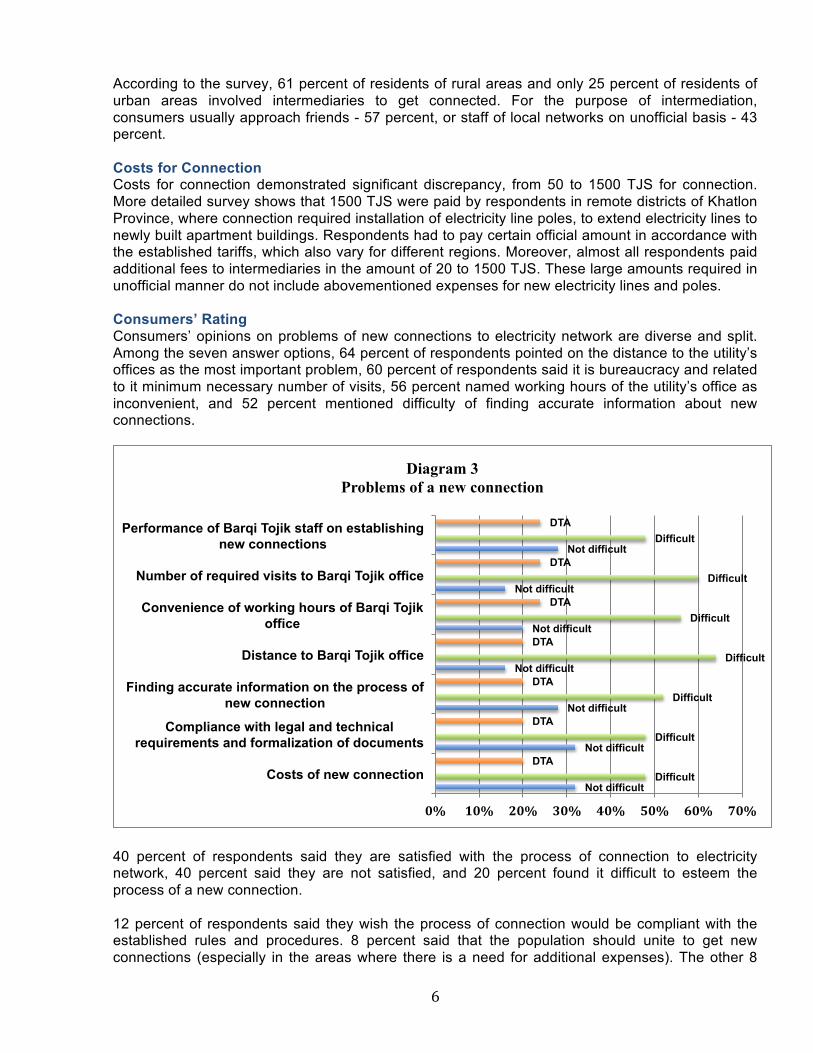
According to the survey, 61 percent of residents of rural areas and only 25 percent of residents of urban areas involved intermediaries to get connected. For the purpose of intermediation, consumers usually approach friends - 57 percent, or staff of local networks on unofficial basis - 43 percent. Costs for Connection Costs for connection demonstrated significant discrepancy, from 50 to 1500 TJS for connection. More detailed survey shows that 1500 TJS were paid by respondents in remote districts of Khatlon Province, where connection required installation of electricity line poles, to extend electricity lines to newly built apartment buildings. Respondents had to pay certain official amount in accordance with the established tariffs, which also vary for different regions. Moreover, almost all respondents paid additional fees to intermediaries in the amount of 20 to 1500 TJS. These large amounts required in unofficial manner do not include abovementioned expenses for new electricity lines and poles. Consumers’ Rating Consumers’ opinions on problems of new connections to electricity network are diverse and split. Among the seven answer options, 64 percent of respondents pointed on the distance to the utility’s offices as the most important problem, 60 percent of respondents said it is bureaucracy and related to it minimum necessary number of visits, 56 percent named working hours of the utility’s office as inconvenient, and 52 percent mentioned difficulty of finding accurate information about new connections.
40 percent of respondents said they are satisfied with the process of connection to electricity network, 40 percent said they are not satisfied, and 20 percent found it difficult to esteem the process of a new connection. 12 percent of respondents said they wish the process of connection would be compliant with the established rules and procedures. 8 percent said that the population should unite to get new connections (especially in the areas where there is a need for additional expenses). The other 8
Not difficult
Not difficult
Not difficult
Not difficult
Not difficult
Not difficult
Not difficult
Difficult
Difficult
Difficult
Difficult
Difficult
Difficult
Difficult
DTA
DTA
DTA
DTA
DTA
DTA
DTA
0% 10% 20% 30% 40% 50% 60% 70%
Costs of new connection
Compliance with legal and technical requirements and formalization of documents
Finding accurate information on the process of new connection
Distance to Barqi Tojik office
Convenience of working hours of Barqi Tojik office
Number of required visits to Barqi Tojik office
Performance of Barqi Tojik staff on establishing new connections
Diagram 3 Problems of a new connection
7
percent of respondents consider it necessary to locate utility’s offices in closer and more convenient places. The rest of respondents did not express any suggestions or provided no answer.
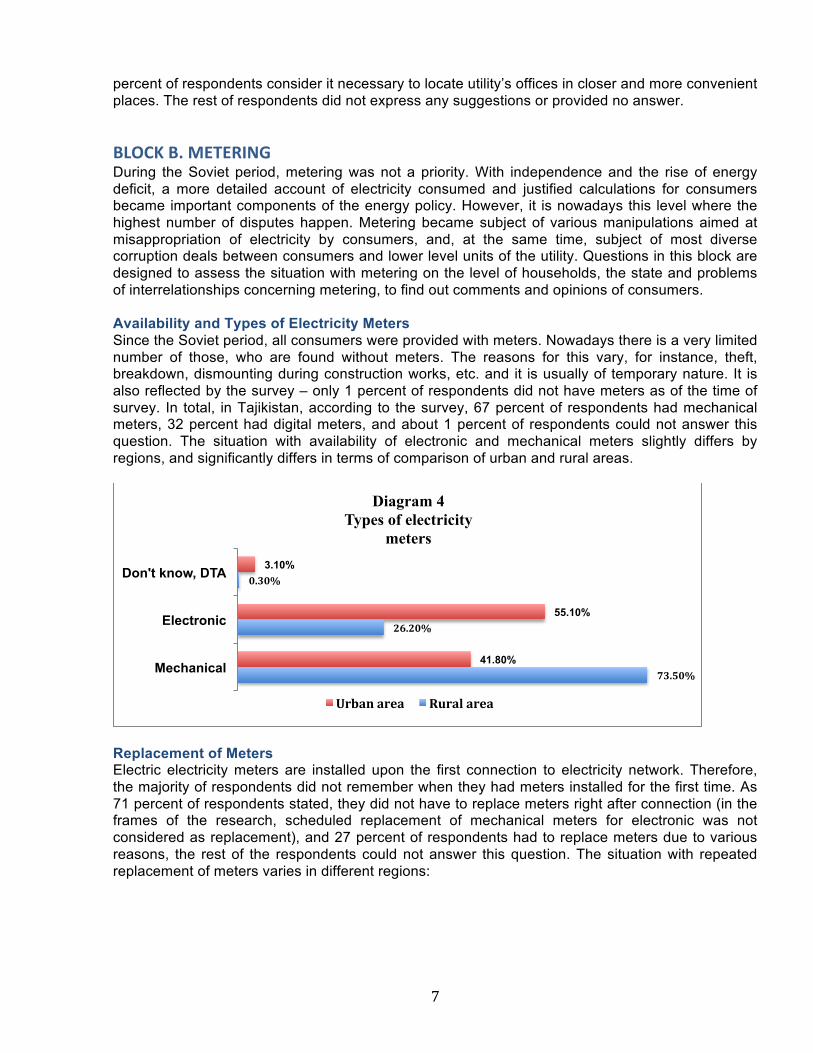
BLOCK B. METERING During the Soviet period, metering was not a priority. With independence and the rise of energy deficit, a more detailed account of electricity consumed and justified calculations for consumers became important components of the energy policy. However, it is nowadays this level where the highest number of disputes happen. Metering became subject of various manipulations aimed at misappropriation of electricity by consumers, and, at the same time, subject of most diverse corruption deals between consumers and lower level units of the utility. Questions in this block are designed to assess the situation with metering on the level of households, the state and problems of interrelationships concerning metering, to find out comments and opinions of consumers. Availability and Types of Electricity Meters Since the Soviet period, all consumers were provided with meters. Nowadays there is a very limited number of those, who are found without meters. The reasons for this vary, for instance, theft, breakdown, dismounting during construction works, etc. and it is usually of temporary nature. It is also reflected by the survey – only 1 percent of respondents did not have meters as of the time of survey. In total, in Tajikistan, according to the survey, 67 percent of respondents had mechanical meters, 32 percent had digital meters, and about 1 percent of respondents could not answer this question. The situation with availability of electronic and mechanical meters slightly differs by regions, and significantly differs in terms of comparison of urban and rural areas.
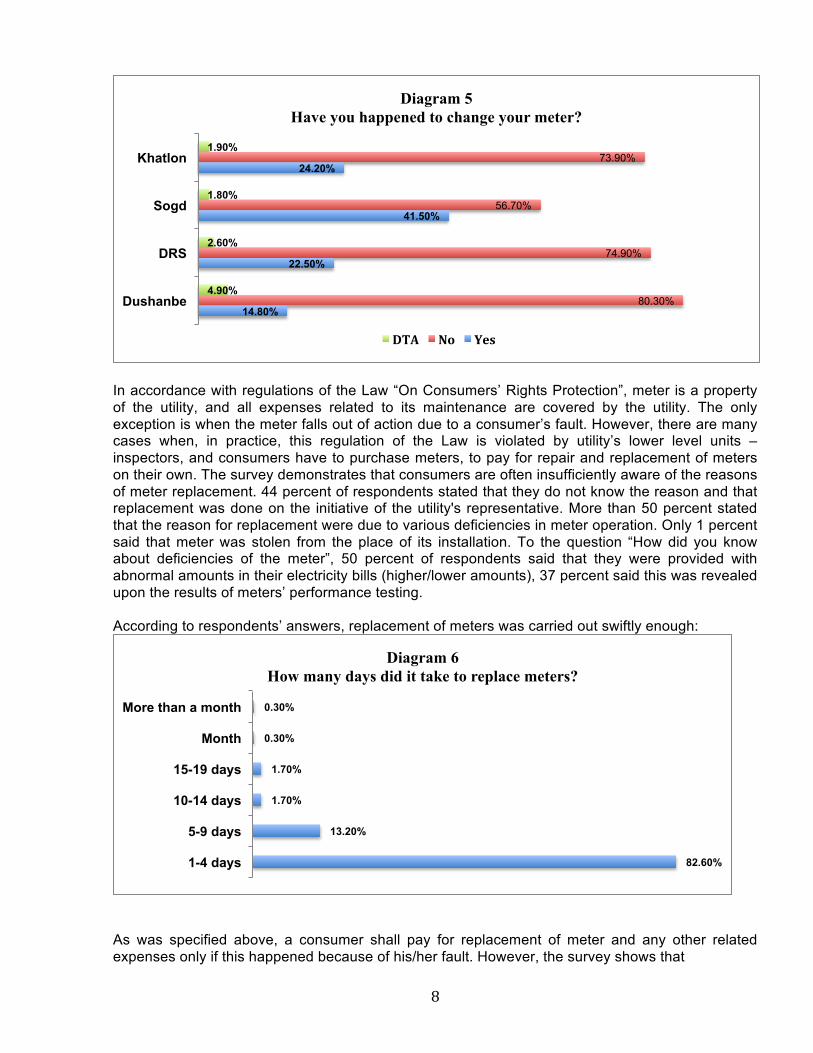
Replacement of Meters Electric electricity meters are installed upon the first connection to electricity network. Therefore, the majority of respondents did not remember when they had meters installed for the first time. As 71 percent of respondents stated, they did not have to replace meters right after connection (in the frames of the research, scheduled replacement of mechanical meters for electronic was not considered as replacement), and 27 percent of respondents had to replace meters due to various reasons, the rest of the respondents could not answer this question. The situation with repeated replacement of meters varies in different regions:
73.50%
26.20%
0.30%
41.80%
55.10%
3.10%
Mechanical
Electronic
Don't know, DTA
Diagram 4 Types of electricity
meters
Urban area Rural area
8
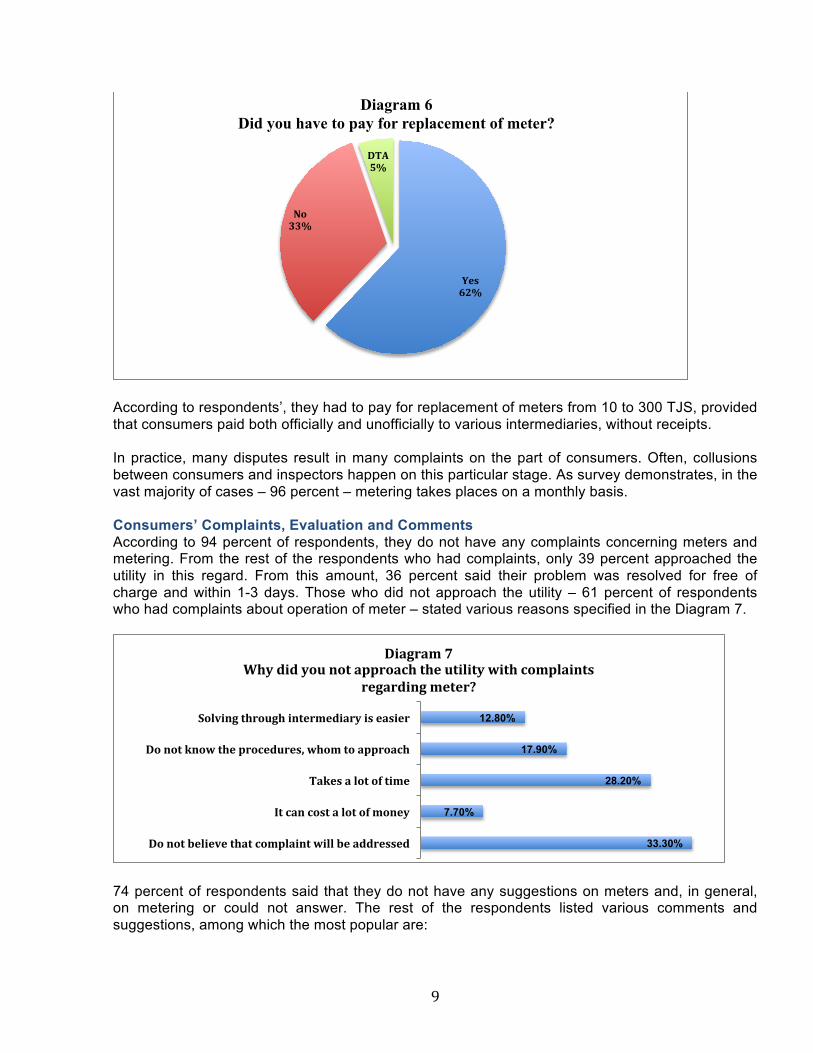
In accordance with regulations of the Law “On Consumers’ Rights Protection”, meter is a property of the utility, and all expenses related to its maintenance are covered by the utility. The only exception is when the meter falls out of action due to a consumer’s fault. However, there are many cases when, in practice, this regulation of the Law is violated by utility’s lower level units – inspectors, and consumers have to purchase meters, to pay for repair and replacement of meters on their own. The survey demonstrates that consumers are often insufficiently aware of the reasons of meter replacement. 44 percent of respondents stated that they do not know the reason and that replacement was done on the initiative of the utility's representative. More than 50 percent stated that the reason for replacement were due to various deficiencies in meter operation. Only 1 percent said that meter was stolen from the place of its installation. To the question “How did you know about deficiencies of the meter”, 50 percent of respondents said that they were provided with abnormal amounts in their electricity bills (higher/lower amounts), 37 percent said this was revealed upon the results of meters’ performance testing. According to respondents’ answers, replacement of meters was carried out swiftly enough:
As was specified above, a consumer shall pay for replacement of meter and any other related expenses only if this happened because of his/her fault. However, the survey shows that
14.80%
22.50%
41.50%
24.20%
80.30%
74.90%
56.70%
73.90%
4.90%
2.60%
1.80%
1.90%
Dushanbe
DRS
Sogd
Khatlon
Diagram 5 Have you happened to change your meter?
DTA No Yes
82.60%
13.20%
1.70%
1.70%
0.30%
0.30%
1-4 days
5-9 days
10-14 days
15-19 days
Month
More than a month
Diagram 6 How many days did it take to replace meters?
9
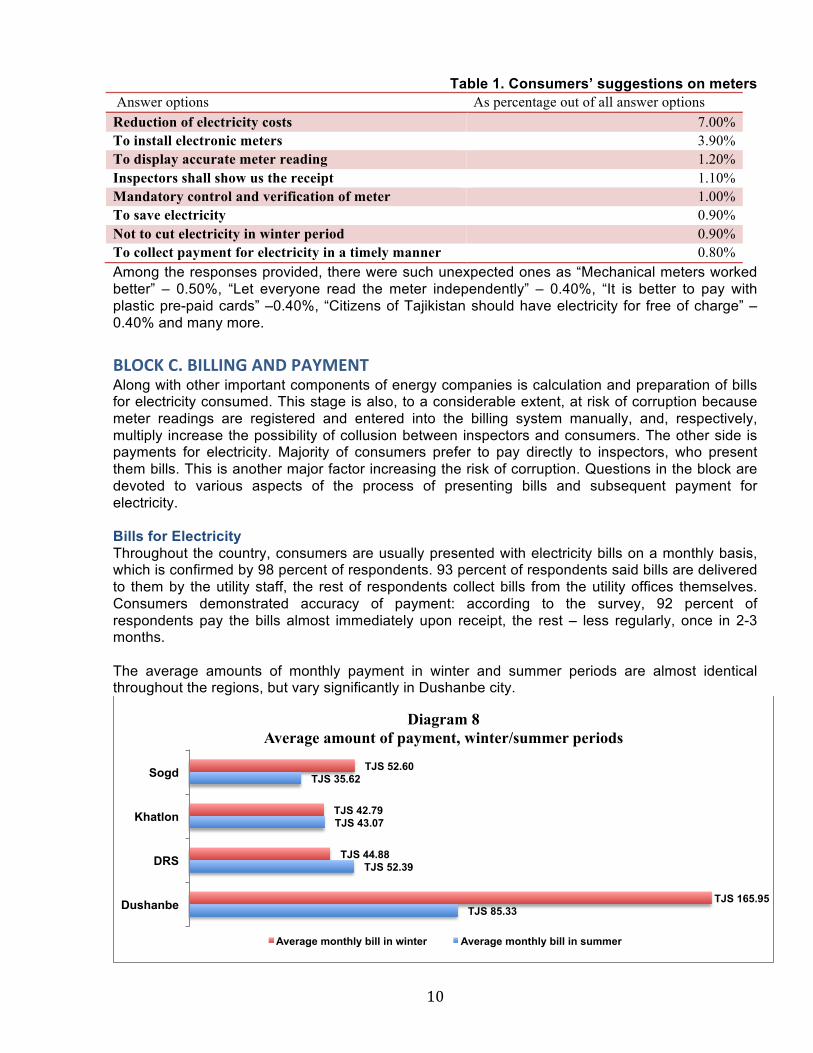
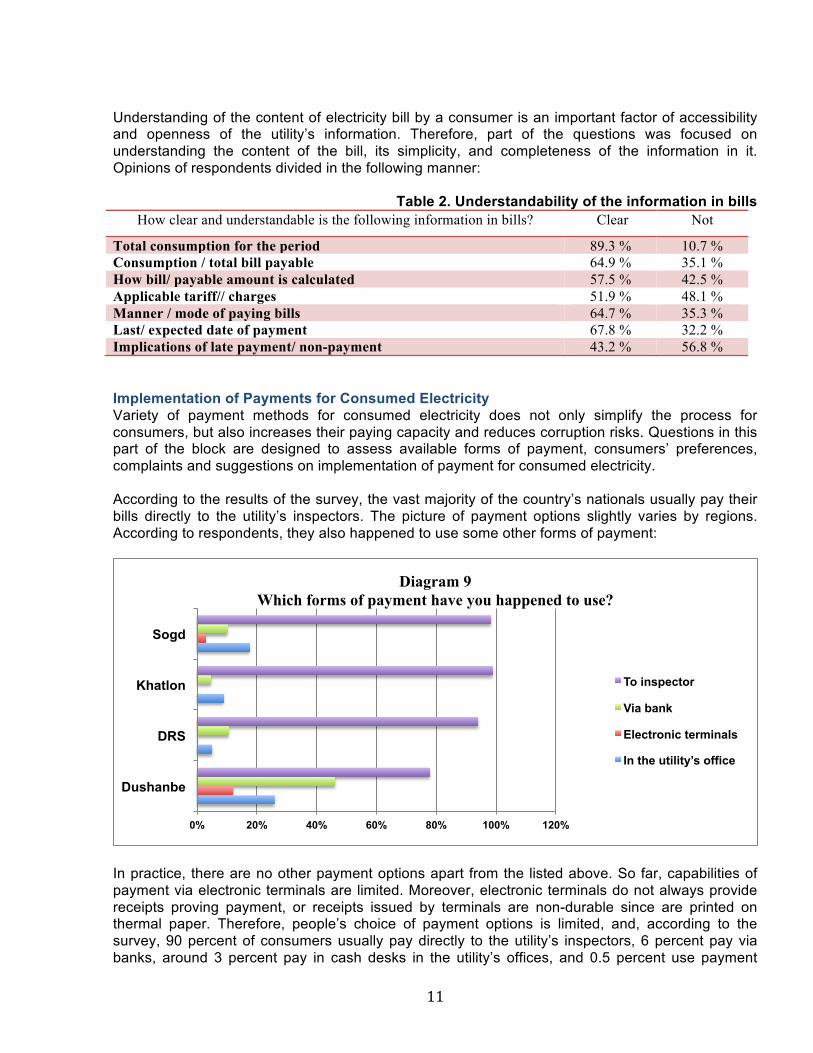
According to respondents’, they had to pay for replacement of meters from 10 to 300 TJS, provided that consumers paid both officially and unofficially to various intermediaries, without receipts. In practice, many disputes result in many complaints on the part of consumers. Often, collusions between consumers and inspectors happen on this particular stage. As survey demonstrates, in the vast majority of cases – 96 percent – metering takes places on a monthly basis. Consumers’ Complaints, Evaluation and Comments According to 94 percent of respondents, they do not have any complaints concerning meters and metering. From the rest of the respondents who had complaints, only 39 percent approached the utility in this regard. From this amount, 36 percent said their problem was resolved for free of charge and within 1-3 days. Those who did not approach the utility – 61 percent of respondents who had complaints about operation of meter – stated various reasons specified in the Diagram 7.
74 percent of respondents said that they do not have any suggestions on meters and, in general, on metering or could not answer. The rest of the respondents listed various comments and suggestions, among which the most popular are:
Yes 62%
No 33%
DTA 5%
Diagram 6 Did you have to pay for replacement of meter?
33.30%
7.70%
28.20%
17.90%
12.80%
Do not believe that complaint will be addressed
It can cost a lot of money
Takes a lot of time
Do not know the procedures, whom to approach
Solving through intermediary is easier
Diagram 7 Why did you not approach the utility with complaints
regarding meter?
10
Table 1. Consumers’ suggestions on meters Answer options As percentage out of all answer options Reduction of electricity costs 7.00% To install electronic meters 3.90% To display accurate meter reading 1.20% Inspectors shall show us the receipt 1.10% Mandatory control and verification of meter 1.00% To save electricity 0.90% Not to cut electricity in winter period 0.90% To collect payment for electricity in a timely manner 0.80% Among the responses provided, there were such unexpected ones as “Mechanical meters worked better” – 0.50%, “Let everyone read the meter independently” – 0.40%, “It is better to pay with plastic pre-paid cards” –0.40%, “Citizens of Tajikistan should have electricity for free of charge” – 0.40% and many more. BLOCK С. BILLING AND PAYMENT Along with other important components of energy companies is calculation and preparation of bills for electricity consumed. This stage is also, to a considerable extent, at risk of corruption because meter readings are registered and entered into the billing system manually, and, respectively, multiply increase the possibility of collusion between inspectors and consumers. The other side is payments for electricity. Majority of consumers prefer to pay directly to inspectors, who present them bills. This is another major factor increasing the risk of corruption. Questions in the block are devoted to various aspects of the process of presenting bills and subsequent payment for electricity. Bills for Electricity Throughout the country, consumers are usually presented with electricity bills on a monthly basis, which is confirmed by 98 percent of respondents. 93 percent of respondents said bills are delivered to them by the utility staff, the rest of respondents collect bills from the utility offices themselves. Consumers demonstrated accuracy of payment: according to the survey, 92 percent of respondents pay the bills almost immediately upon receipt, the rest – less regularly, once in 2-3 months. The average amounts of monthly payment in winter and summer periods are almost identical throughout the regions, but vary significantly in Dushanbe city.
TJS 85.33
TJS 52.39
TJS 43.07
TJS 35.62
TJS 165.95
TJS 44.88
TJS 42.79
TJS 52.60
Dushanbe
DRS
Khatlon
Sogd
Diagram 8 Average amount of payment, winter/summer periods
Average monthly bill in winter Average monthly bill in summer
11
Understanding of the content of electricity bill by a consumer is an important factor of accessibility and openness of the utility’s information. Therefore, part of the questions was focused on understanding the content of the bill, its simplicity, and completeness of the information in it. Opinions of respondents divided in the following manner:
Table 2. Understandability of the information in bills How clear and understandable is the following information in bills? Clear Not
Total consumption for the period 89.3 % 10.7 % Consumption / total bill payable 64.9 % 35.1 % How bill/ payable amount is calculated 57.5 % 42.5 % Applicable tariff// charges 51.9 % 48.1 % Manner / mode of paying bills 64.7 % 35.3 % Last/ expected date of payment 67.8 % 32.2 % Implications of late payment/ non-payment 43.2 % 56.8 % Implementation of Payments for Consumed Electricity Variety of payment methods for consumed electricity does not only simplify the process for consumers, but also increases their paying capacity and reduces corruption risks. Questions in this part of the block are designed to assess available forms of payment, consumers’ preferences, complaints and suggestions on implementation of payment for consumed electricity. According to the results of the survey, the vast majority of the country’s nationals usually pay their bills directly to the utility’s inspectors. The picture of payment options slightly varies by regions. According to respondents, they also happened to use some other forms of payment:
In practice, there are no other payment options apart from the listed above. So far, capabilities of payment via electronic terminals are limited. Moreover, electronic terminals do not always provide receipts proving payment, or receipts issued by terminals are non-durable since are printed on thermal paper. Therefore, people’s choice of payment options is limited, and, according to the survey, 90 percent of consumers usually pay directly to the utility’s inspectors, 6 percent pay via banks, around 3 percent pay in cash desks in the utility’s offices, and 0.5 percent use payment
0% 20% 40% 60% 80% 100% 120%
Dushanbe
DRS
Khatlon
Sogd
Diagram 9 Which forms of payment have you happened to use?
To inspector
Via bank
Electronic terminals
In the utility’s office
12
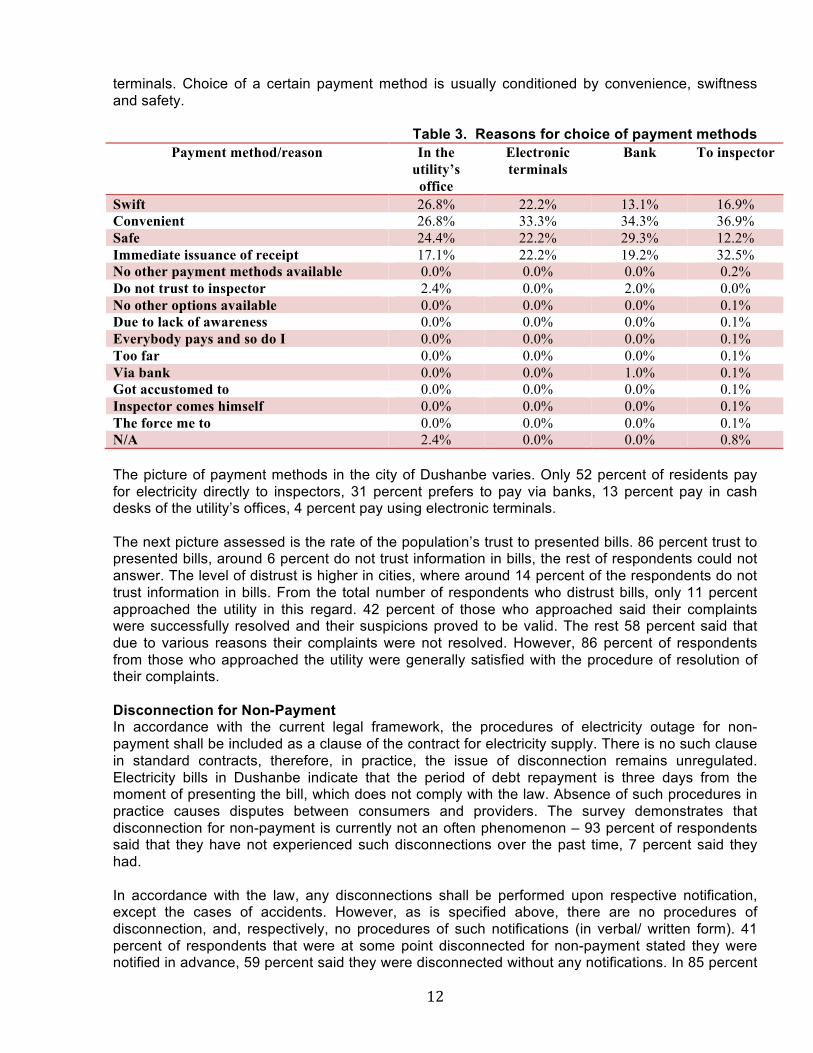
terminals. Choice of a certain payment method is usually conditioned by convenience, swiftness and safety.
Table 3. Reasons for choice of payment methods Payment method/reason In the
utility’s office
Electronic terminals
Bank To inspector
Swift 26.8% 22.2% 13.1% 16.9% Convenient 26.8% 33.3% 34.3% 36.9% Safe 24.4% 22.2% 29.3% 12.2% Immediate issuance of receipt 17.1% 22.2% 19.2% 32.5% No other payment methods available 0.0% 0.0% 0.0% 0.2% Do not trust to inspector 2.4% 0.0% 2.0% 0.0% No other options available 0.0% 0.0% 0.0% 0.1% Due to lack of awareness 0.0% 0.0% 0.0% 0.1% Everybody pays and so do I 0.0% 0.0% 0.0% 0.1% Too far 0.0% 0.0% 0.0% 0.1% Via bank 0.0% 0.0% 1.0% 0.1% Got accustomed to 0.0% 0.0% 0.0% 0.1% Inspector comes himself 0.0% 0.0% 0.0% 0.1% The force me to 0.0% 0.0% 0.0% 0.1% N/A 2.4% 0.0% 0.0% 0.8% The picture of payment methods in the city of Dushanbe varies. Only 52 percent of residents pay for electricity directly to inspectors, 31 percent prefers to pay via banks, 13 percent pay in cash desks of the utility’s offices, 4 percent pay using electronic terminals. The next picture assessed is the rate of the population’s trust to presented bills. 86 percent trust to presented bills, around 6 percent do not trust information in bills, the rest of respondents could not answer. The level of distrust is higher in cities, where around 14 percent of the respondents do not trust information in bills. From the total number of respondents who distrust bills, only 11 percent approached the utility in this regard. 42 percent of those who approached said their complaints were successfully resolved and their suspicions proved to be valid. The rest 58 percent said that due to various reasons their complaints were not resolved. However, 86 percent of respondents from those who approached the utility were generally satisfied with the procedure of resolution of their complaints. Disconnection for Non-Payment In accordance with the current legal framework, the procedures of electricity outage for non-payment shall be included as a clause of the contract for electricity supply. There is no such clause in standard contracts, therefore, in practice, the issue of disconnection remains unregulated. Electricity bills in Dushanbe indicate that the period of debt repayment is three days from the moment of presenting the bill, which does not comply with the law. Absence of such procedures in practice causes disputes between consumers and providers. The survey demonstrates that disconnection for non-payment is currently not an often phenomenon – 93 percent of respondents said that they have not experienced such disconnections over the past time, 7 percent said they had. In accordance with the law, any disconnections shall be performed upon respective notification, except the cases of accidents. However, as is specified above, there are no procedures of disconnection, and, respectively, no procedures of such notifications (in verbal/ written form). 41 percent of respondents that were at some point disconnected for non-payment stated they were notified in advance, 59 percent said they were disconnected without any notifications. In 85 percent
13
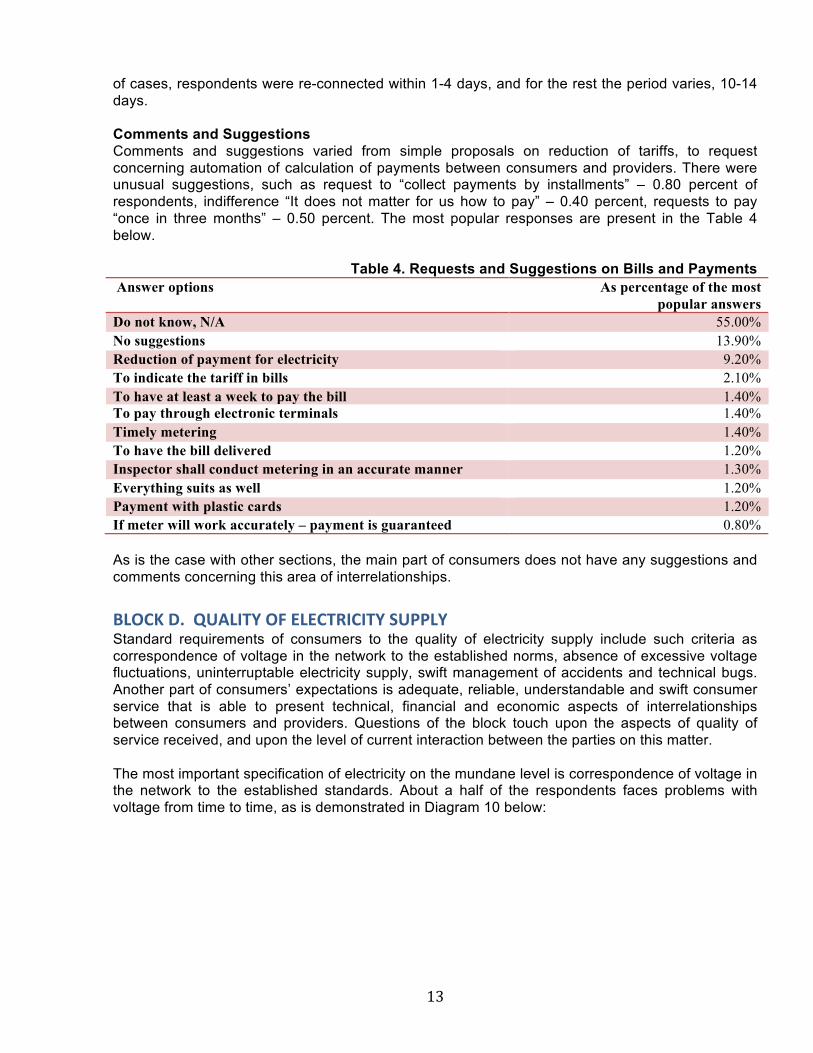
of cases, respondents were re-connected within 1-4 days, and for the rest the period varies, 10-14 days. Comments and Suggestions Comments and suggestions varied from simple proposals on reduction of tariffs, to request concerning automation of calculation of payments between consumers and providers. There were unusual suggestions, such as request to “collect payments by installments” – 0.80 percent of respondents, indifference “It does not matter for us how to pay” – 0.40 percent, requests to pay “once in three months” – 0.50 percent. The most popular responses are present in the Table 4 below.
Table 4. Requests and Suggestions on Bills and Payments Answer options As percentage of the most
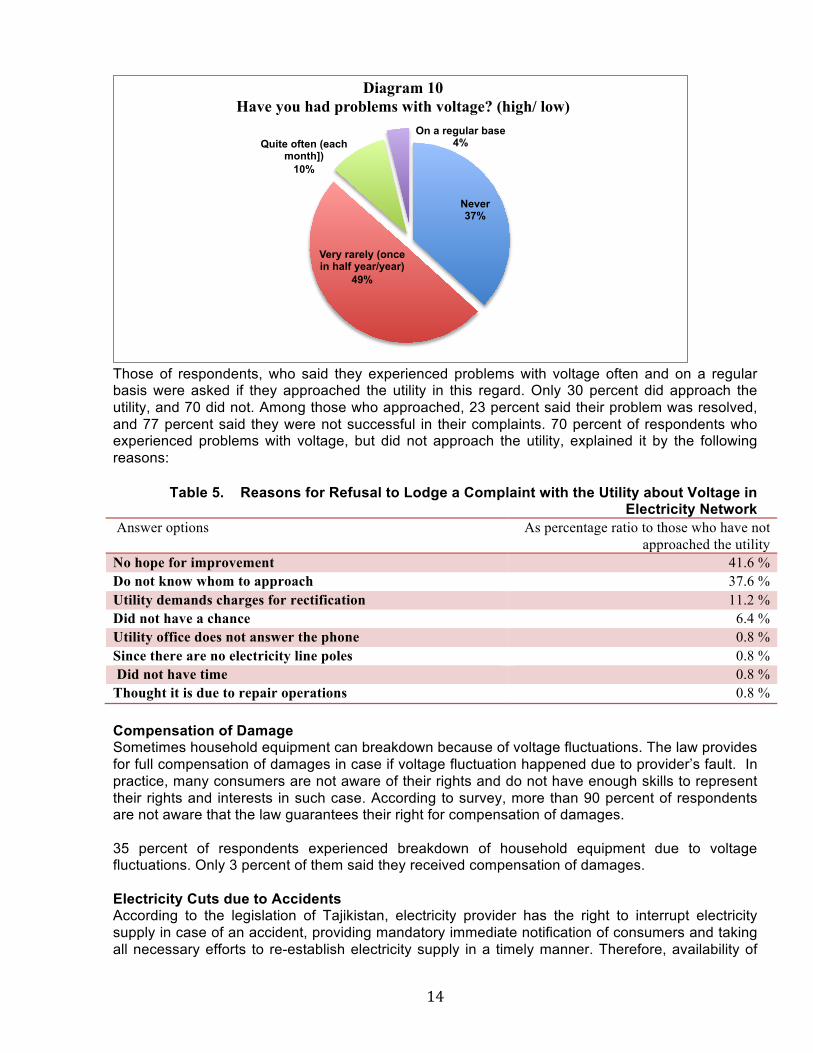
popular answers Do not know, N/A 55.00% No suggestions 13.90% Reduction of payment for electricity 9.20% To indicate the tariff in bills 2.10% To have at least a week to pay the bill 1.40% To pay through electronic terminals 1.40% Timely metering 1.40% To have the bill delivered 1.20% Inspector shall conduct metering in an accurate manner 1.30% Everything suits as well 1.20% Payment with plastic cards 1.20% If meter will work accurately – payment is guaranteed 0.80% As is the case with other sections, the main part of consumers does not have any suggestions and comments concerning this area of interrelationships. BLOCK D. QUALITY OF ELECTRICITY SUPPLY Standard requirements of consumers to the quality of electricity supply include such criteria as correspondence of voltage in the network to the established norms, absence of excessive voltage fluctuations, uninterruptable electricity supply, swift management of accidents and technical bugs. Another part of consumers’ expectations is adequate, reliable, understandable and swift consumer service that is able to present technical, financial and economic aspects of interrelationships between consumers and providers. Questions of the block touch upon the aspects of quality of service received, and upon the level of current interaction between the parties on this matter. The most important specification of electricity on the mundane level is correspondence of voltage in the network to the established standards. About a half of the respondents faces problems with voltage from time to time, as is demonstrated in Diagram 10 below:
14
Those of respondents, who said they experienced problems with voltage often and on a regular basis were asked if they approached the utility in this regard. Only 30 percent did approach the utility, and 70 did not. Among those who approached, 23 percent said their problem was resolved, and 77 percent said they were not successful in their complaints. 70 percent of respondents who experienced problems with voltage, but did not approach the utility, explained it by the following reasons:
Table 5. Reasons for Refusal to Lodge a Complaint with the Utility about Voltage in Electricity Network
Answer options As percentage ratio to those who have not approached the utility
No hope for improvement 41.6 % Do not know whom to approach 37.6 % Utility demands charges for rectification 11.2 % Did not have a chance 6.4 % Utility office does not answer the phone 0.8 % Since there are no electricity line poles 0.8 % Did not have time 0.8 % Thought it is due to repair operations 0.8 % Compensation of Damage Sometimes household equipment can breakdown because of voltage fluctuations. The law provides for full compensation of damages in case if voltage fluctuation happened due to provider’s fault. In practice, many consumers are not aware of their rights and do not have enough skills to represent their rights and interests in such case. According to survey, more than 90 percent of respondents are not aware that the law guarantees their right for compensation of damages. 35 percent of respondents experienced breakdown of household equipment due to voltage fluctuations. Only 3 percent of them said they received compensation of damages. Electricity Cuts due to Accidents According to the legislation of Tajikistan, electricity provider has the right to interrupt electricity supply in case of an accident, providing mandatory immediate notification of consumers and taking all necessary efforts to re-establish electricity supply in a timely manner. Therefore, availability of
Never 37%
Very rarely (once in half year/year)
49%
Quite often (each month])
10%
On a regular base 4%
Diagram 10 Have you had problems with voltage? (high/ low)
15
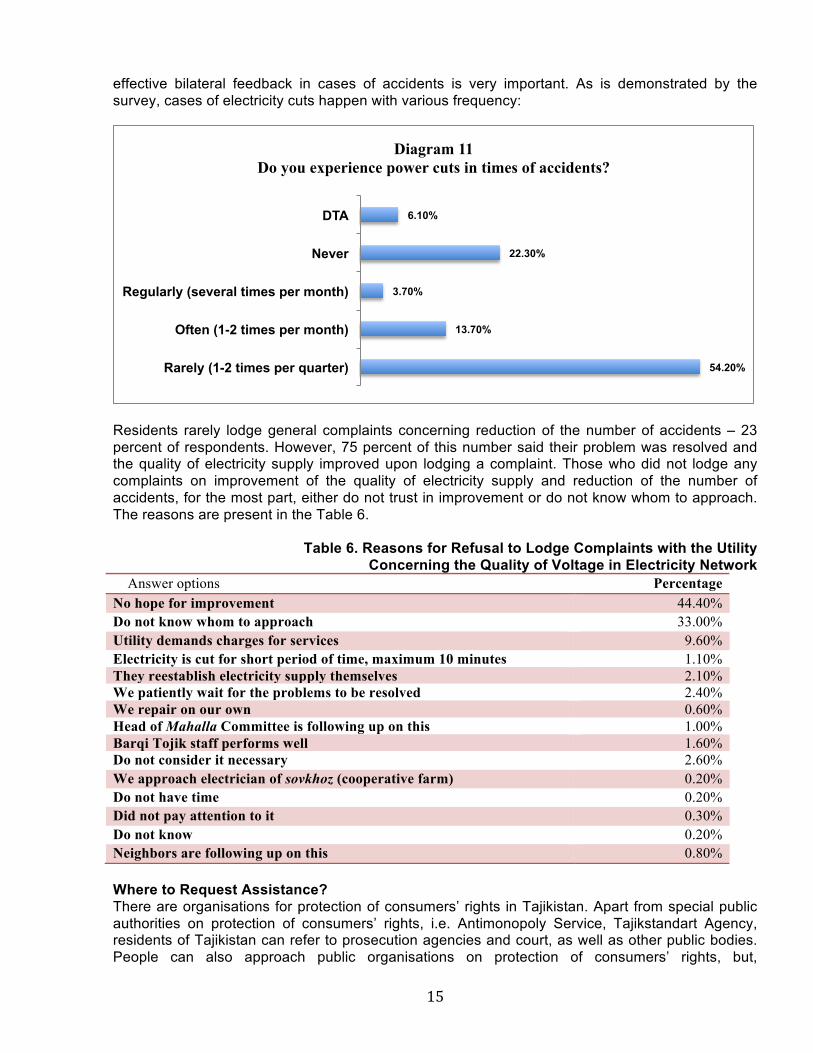
effective bilateral feedback in cases of accidents is very important. As is demonstrated by the survey, cases of electricity cuts happen with various frequency:
Residents rarely lodge general complaints concerning reduction of the number of accidents – 23 percent of respondents. However, 75 percent of this number said their problem was resolved and the quality of electricity supply improved upon lodging a complaint. Those who did not lodge any complaints on improvement of the quality of electricity supply and reduction of the number of accidents, for the most part, either do not trust in improvement or do not know whom to approach. The reasons are present in the Table 6.
Table 6. Reasons for Refusal to Lodge Complaints with the Utility Concerning the Quality of Voltage in Electricity Network
Answer options Percentage No hope for improvement 44.40% Do not know whom to approach 33.00% Utility demands charges for services 9.60% Electricity is cut for short period of time, maximum 10 minutes 1.10% They reestablish electricity supply themselves 2.10% We patiently wait for the problems to be resolved 2.40% We repair on our own 0.60% Head of Mahalla Committee is following up on this 1.00% Barqi Tojik staff performs well 1.60% Do not consider it necessary 2.60% We approach electrician of sovkhoz (cooperative farm) 0.20% Do not have time 0.20% Did not pay attention to it 0.30% Do not know 0.20% Neighbors are following up on this 0.80% Where to Request Assistance? There are organisations for protection of consumers’ rights in Tajikistan. Apart from special public authorities on protection of consumers’ rights, i.e. Antimonopoly Service, Tajikstandart Agency, residents of Tajikistan can refer to prosecution agencies and court, as well as other public bodies. People can also approach public organisations on protection of consumers’ rights, but,
54.20%
13.70%
3.70%
22.30%
6.10%
Rarely (1-2 times per quarter)
Often (1-2 times per month)
Regularly (several times per month)
Never
DTA
Diagram 11 Do you experience power cuts in times of accidents?
16
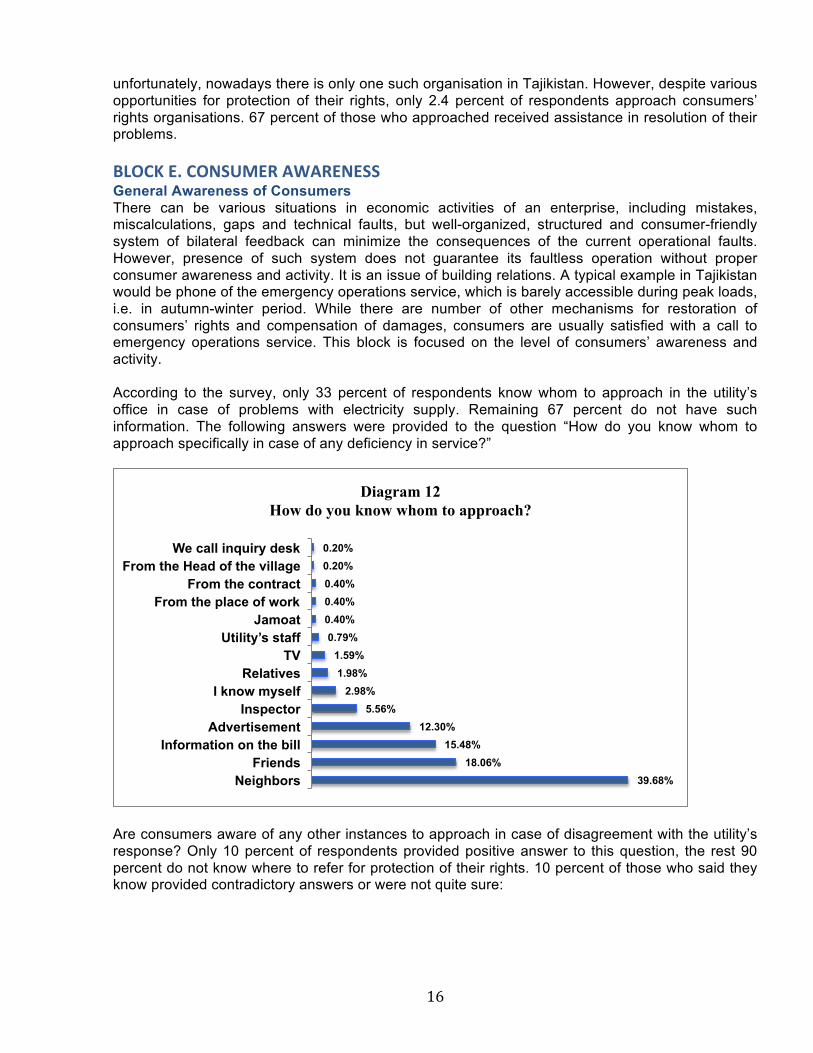
unfortunately, nowadays there is only one such organisation in Tajikistan. However, despite various opportunities for protection of their rights, only 2.4 percent of respondents approach consumers’ rights organisations. 67 percent of those who approached received assistance in resolution of their problems. BLOCK E. CONSUMER AWARENESS General Awareness of Consumers There can be various situations in economic activities of an enterprise, including mistakes, miscalculations, gaps and technical faults, but well-organized, structured and consumer-friendly system of bilateral feedback can minimize the consequences of the current operational faults. However, presence of such system does not guarantee its faultless operation without proper consumer awareness and activity. It is an issue of building relations. A typical example in Tajikistan would be phone of the emergency operations service, which is barely accessible during peak loads, i.e. in autumn-winter period. While there are number of other mechanisms for restoration of consumers’ rights and compensation of damages, consumers are usually satisfied with a call to emergency operations service. This block is focused on the level of consumers’ awareness and activity. According to the survey, only 33 percent of respondents know whom to approach in the utility’s office in case of problems with electricity supply. Remaining 67 percent do not have such information. The following answers were provided to the question “How do you know whom to approach specifically in case of any deficiency in service?”
Are consumers aware of any other instances to approach in case of disagreement with the utility’s response? Only 10 percent of respondents provided positive answer to this question, the rest 90 percent do not know where to refer for protection of their rights. 10 percent of those who said they know provided contradictory answers or were not quite sure:
39.68% 18.06%
15.48% 12.30%
5.56% 2.98%
1.98% 1.59%
0.79% 0.40% 0.40% 0.40% 0.20% 0.20%
Neighbors Friends
Information on the bill Advertisement
Inspector I know myself
Relatives TV
Utility’s staff Jamoat
From the place of work From the contract
From the Head of the village We call inquiry desk
Diagram 12 How do you know whom to approach?
17
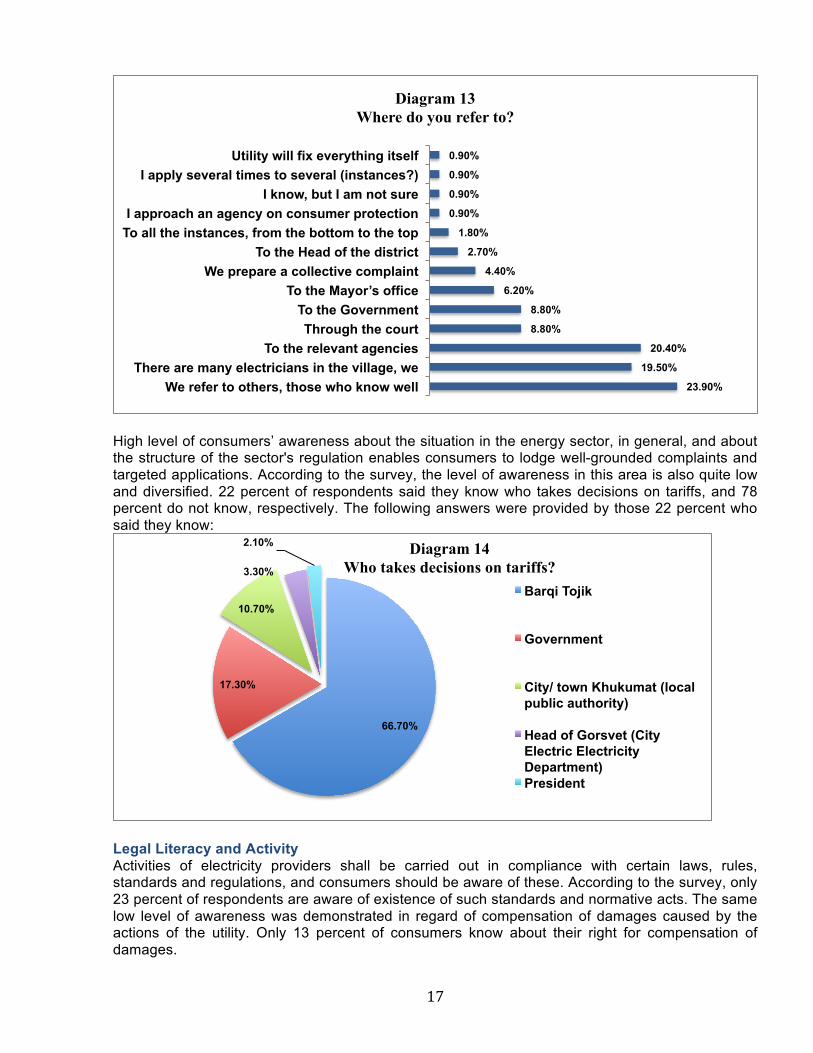
High level of consumers’ awareness about the situation in the energy sector, in general, and about the structure of the sector's regulation enables consumers to lodge well-grounded complaints and targeted applications. According to the survey, the level of awareness in this area is also quite low and diversified. 22 percent of respondents said they know who takes decisions on tariffs, and 78 percent do not know, respectively. The following answers were provided by those 22 percent who said they know:
Legal Literacy and Activity Activities of electricity providers shall be carried out in compliance with certain laws, rules, standards and regulations, and consumers should be aware of these. According to the survey, only 23 percent of respondents are aware of existence of such standards and normative acts. The same low level of awareness was demonstrated in regard of compensation of damages caused by the actions of the utility. Only 13 percent of consumers know about their right for compensation of damages.
23.90%
19.50%
20.40%
8.80%
8.80%
6.20%
4.40%
2.70%
1.80%
0.90%
0.90%
0.90%
0.90%
We refer to others, those who know well There are many electricians in the village, we
To the relevant agencies Through the court
To the Government To the Mayor’s office
We prepare a collective complaint To the Head of the district
To all the instances, from the bottom to the top I approach an agency on consumer protection
I know, but I am not sure I apply several times to several (instances?)
Utility will fix everything itself
Diagram 13 Where do you refer to?
66.70%
17.30%
10.70%
3.30%
2.10% Diagram 14 Who takes decisions on tariffs?
Barqi Tojik
Government
City/ town Khukumat (local public authority)
Head of Gorsvet (City Electric Electricity Department) President
18
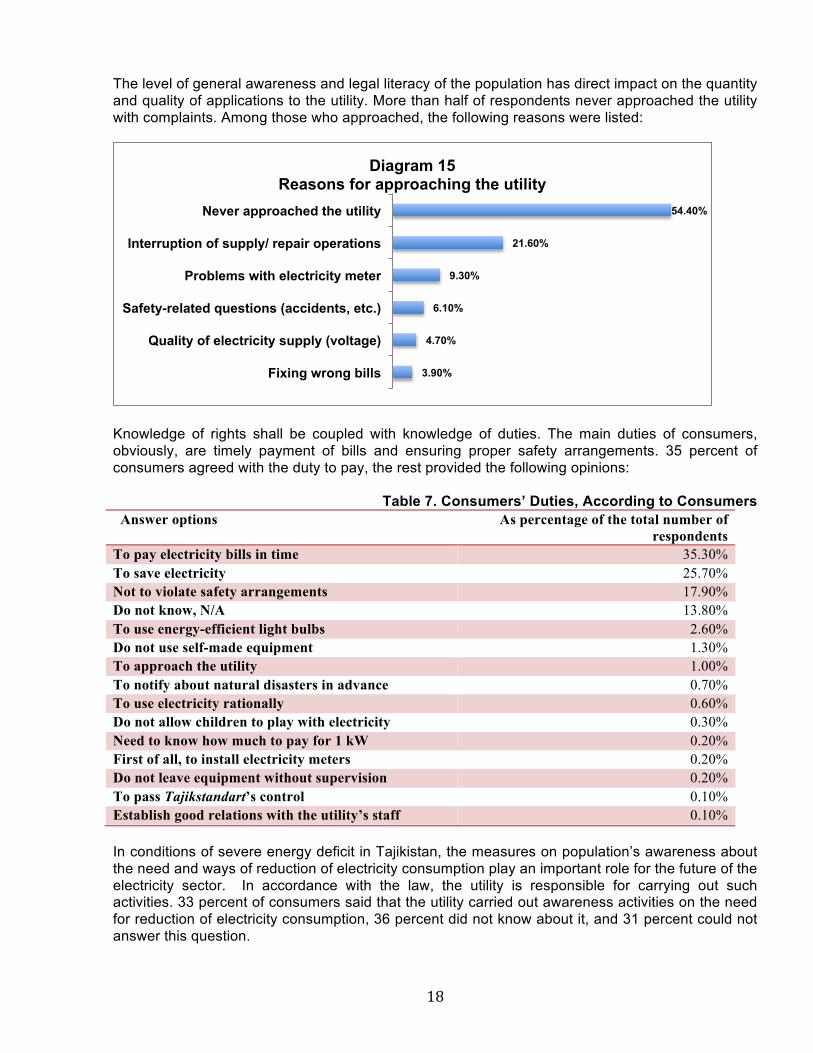
The level of general awareness and legal literacy of the population has direct impact on the quantity and quality of applications to the utility. More than half of respondents never approached the utility with complaints. Among those who approached, the following reasons were listed:
Knowledge of rights shall be coupled with knowledge of duties. The main duties of consumers, obviously, are timely payment of bills and ensuring proper safety arrangements. 35 percent of consumers agreed with the duty to pay, the rest provided the following opinions:
Table 7. Consumers’ Duties, According to Consumers
Answer options As percentage of the total number of respondents
To pay electricity bills in time 35.30% To save electricity 25.70% Not to violate safety arrangements 17.90% Do not know, N/A 13.80% To use energy-efficient light bulbs 2.60% Do not use self-made equipment 1.30% To approach the utility 1.00% To notify about natural disasters in advance 0.70% To use electricity rationally 0.60% Do not allow children to play with electricity 0.30% Need to know how much to pay for 1 kW 0.20% First of all, to install electricity meters 0.20% Do not leave equipment without supervision 0.20% To pass Tajikstandart’s control 0.10% Establish good relations with the utility’s staff 0.10% In conditions of severe energy deficit in Tajikistan, the measures on population’s awareness about the need and ways of reduction of electricity consumption play an important role for the future of the electricity sector. In accordance with the law, the utility is responsible for carrying out such activities. 33 percent of consumers said that the utility carried out awareness activities on the need for reduction of electricity consumption, 36 percent did not know about it, and 31 percent could not answer this question.
3.90%
4.70%
6.10%
9.30%
21.60%
54.40%
Fixing wrong bills
Quality of electricity supply (voltage)
Safety-related questions (accidents, etc.)
Problems with electricity meter
Interruption of supply/ repair operations
Never approached the utility
Diagram 15 Reasons for approaching the utility
19
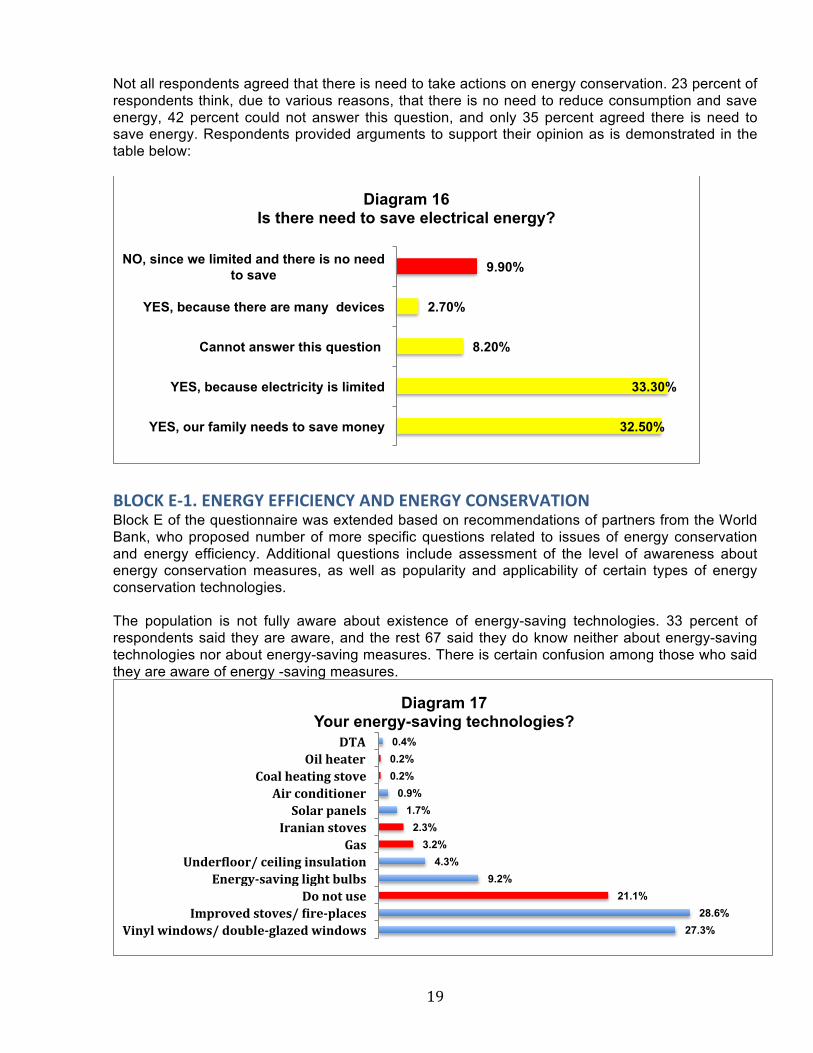
Not all respondents agreed that there is need to take actions on energy conservation. 23 percent of respondents think, due to various reasons, that there is no need to reduce consumption and save energy, 42 percent could not answer this question, and only 35 percent agreed there is need to save energy. Respondents provided arguments to support their opinion as is demonstrated in the table below:
BLOCK Е-‐1. ENERGY EFFICIENCY AND ENERGY CONSERVATION Block Е of the questionnaire was extended based on recommendations of partners from the World Bank, who proposed number of more specific questions related to issues of energy conservation and energy efficiency. Additional questions include assessment of the level of awareness about energy conservation measures, as well as popularity and applicability of certain types of energy conservation technologies. The population is not fully aware about existence of energy-saving technologies. 33 percent of respondents said they are aware, and the rest 67 said they do know neither about energy-saving technologies nor about energy-saving measures. There is certain confusion among those who said they are aware of energy -saving measures.
32.50%
33.30%
8.20%
2.70%
9.90%
YES, our family needs to save money
YES, because electricity is limited
Cannot answer this question
YES, because there are many devices
NO, since we limited and there is no need to save
Diagram 16 Is there need to save electrical energy?
27.3% 28.6%
21.1% 9.2%
4.3% 3.2%
2.3% 1.7%
0.9% 0.2% 0.2% 0.4%
Vinyl windows/ double-‐glazed windows Improved stoves/ Yire-‐places
Do not use Energy-‐saving light bulbs
UnderYloor/ ceiling insulation Gas
Iranian stoves Solar panels
Air conditioner Coal heating stove
Oil heater DTA
Diagram 17 Your energy-saving technologies?
20
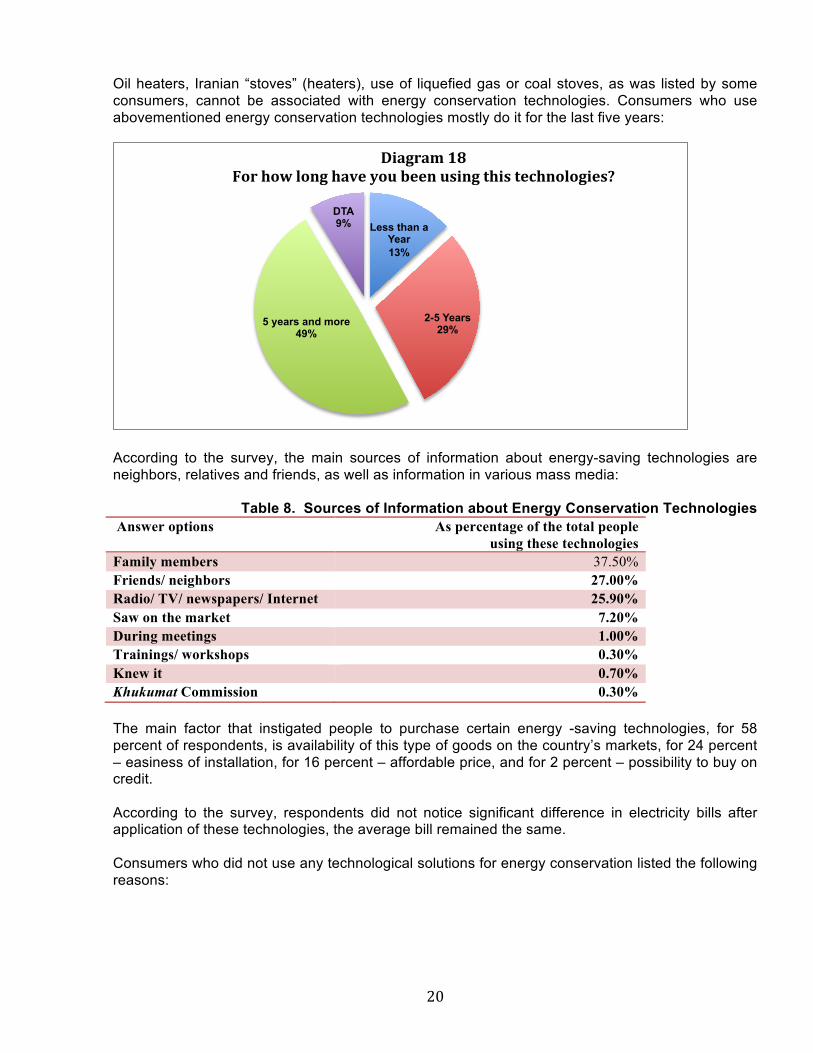
Oil heaters, Iranian “stoves” (heaters), use of liquefied gas or coal stoves, as was listed by some consumers, cannot be associated with energy conservation technologies. Consumers who use abovementioned energy conservation technologies mostly do it for the last five years:
According to the survey, the main sources of information about energy-saving technologies are neighbors, relatives and friends, as well as information in various mass media:
Table 8. Sources of Information about Energy Conservation Technologies Answer options As percentage of the total people
using these technologies Family members 37.50% Friends/ neighbors 27.00% Radio/ TV/ newspapers/ Internet 25.90% Saw on the market 7.20% During meetings 1.00% Trainings/ workshops 0.30% Knew it 0.70% Khukumat Commission 0.30% The main factor that instigated people to purchase certain energy -saving technologies, for 58 percent of respondents, is availability of this type of goods on the country’s markets, for 24 percent – easiness of installation, for 16 percent – affordable price, and for 2 percent – possibility to buy on credit. According to the survey, respondents did not notice significant difference in electricity bills after application of these technologies, the average bill remained the same. Consumers who did not use any technological solutions for energy conservation listed the following reasons:
Less than a Year 13%
2-5 Years 29%
5 years and more 49%
DTA 9%
Diagram 18 For how long have you been using this technologies?
21
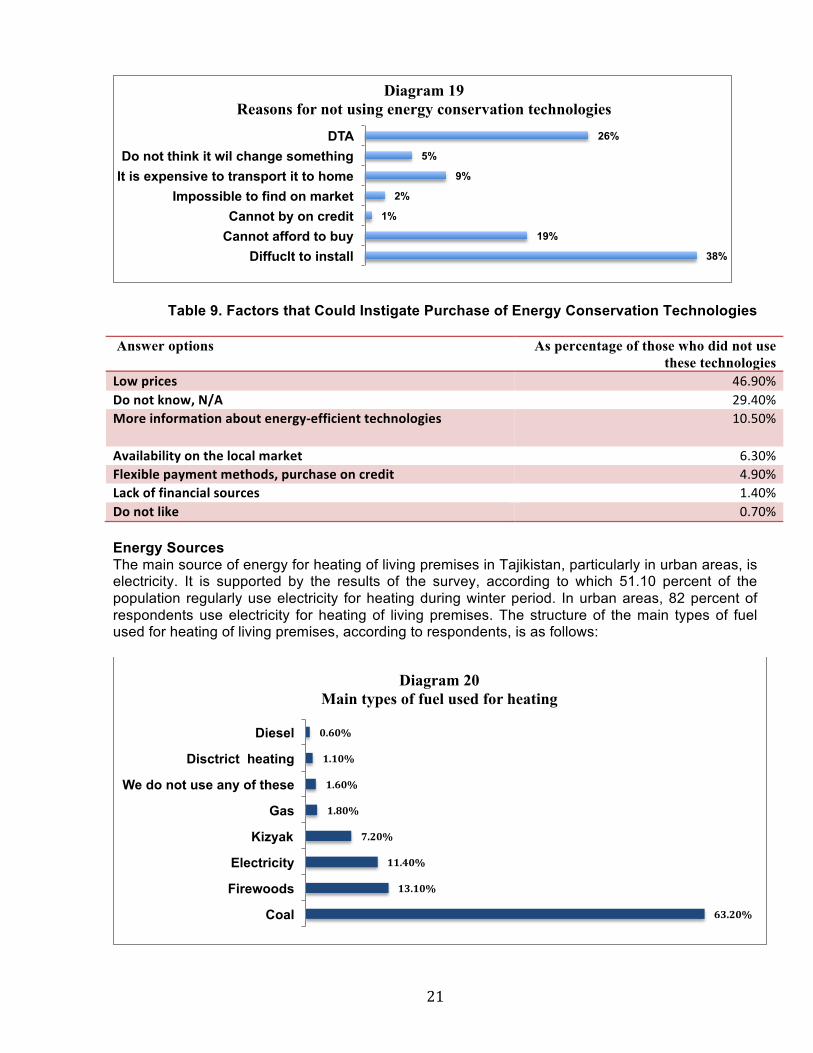
Table 9. Factors that Could Instigate Purchase of Energy Conservation Technologies
Answer options As percentage of those who did not use these technologies
Low prices 46.90% Do not know, N/A 29.40% More information about energy-‐efficient technologies 10.50%
Availability on the local market 6.30% Flexible payment methods, purchase on credit 4.90% Lack of financial sources 1.40% Do not like 0.70% Energy Sources The main source of energy for heating of living premises in Tajikistan, particularly in urban areas, is electricity. It is supported by the results of the survey, according to which 51.10 percent of the population regularly use electricity for heating during winter period. In urban areas, 82 percent of respondents use electricity for heating of living premises. The structure of the main types of fuel used for heating of living premises, according to respondents, is as follows:
38%
19%
1%
2%
9%
5%
26%
Diffuclt to install Cannot afford to buy Cannot by on credit
Impossible to find on market It is expensive to transport it to home Do not think it wil change something
DTA
Diagram 19 Reasons for not using energy conservation technologies
63.20%
13.10%
11.40%
7.20%
1.80%
1.60%
1.10%
0.60%
Coal
Firewoods
Electricity
Kizyak
Gas
We do not use any of these
Disctrict heating
Diesel
Diagram 20 Main types of fuel used for heating
22
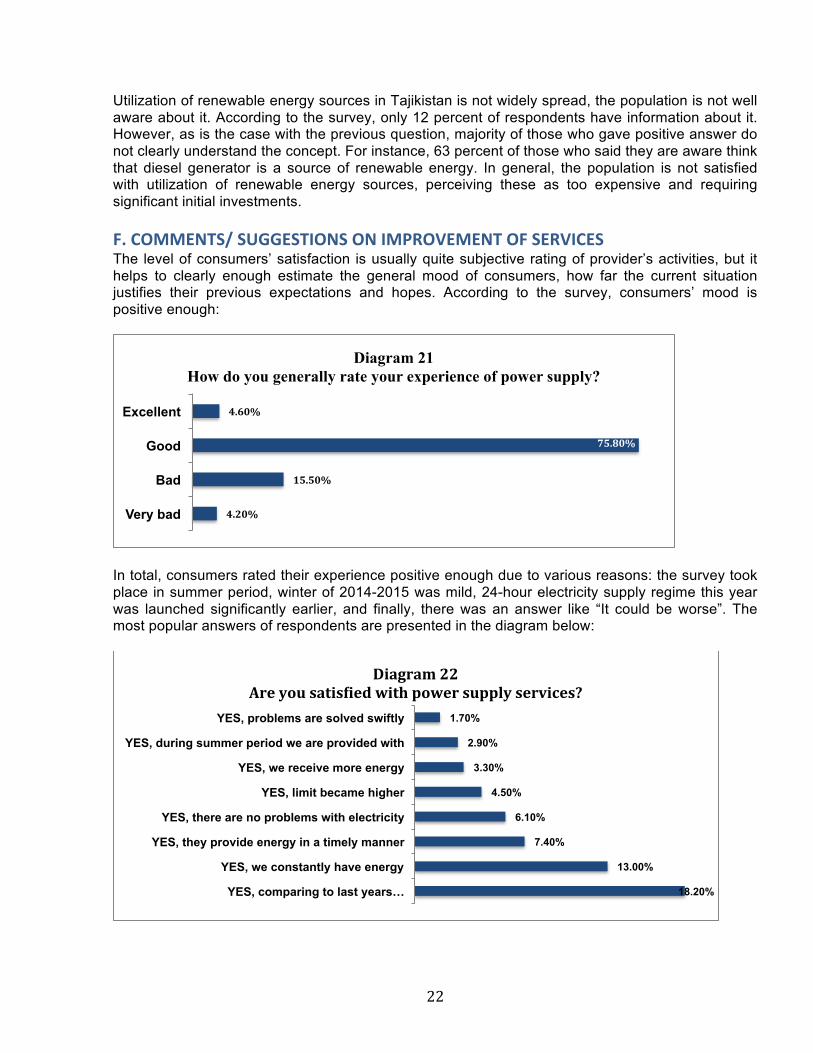
Utilization of renewable energy sources in Tajikistan is not widely spread, the population is not well aware about it. According to the survey, only 12 percent of respondents have information about it. However, as is the case with the previous question, majority of those who gave positive answer do not clearly understand the concept. For instance, 63 percent of those who said they are aware think that diesel generator is a source of renewable energy. In general, the population is not satisfied with utilization of renewable energy sources, perceiving these as too expensive and requiring significant initial investments. F. COMMENTS/ SUGGESTIONS ON IMPROVEMENT OF SERVICES The level of consumers’ satisfaction is usually quite subjective rating of provider’s activities, but it helps to clearly enough estimate the general mood of consumers, how far the current situation justifies their previous expectations and hopes. According to the survey, consumers’ mood is positive enough:
In total, consumers rated their experience positive enough due to various reasons: the survey took place in summer period, winter of 2014-2015 was mild, 24-hour electricity supply regime this year was launched significantly earlier, and finally, there was an answer like “It could be worse”. The most popular answers of respondents are presented in the diagram below:
4.20%
15.50%
75.80%
4.60%
Very bad
Bad
Good
Excellent
Diagram 21 How do you generally rate your experience of power supply?
18.20%
13.00%
7.40%
6.10%
4.50%
3.30%
2.90%
1.70%
YES, comparing to last years…
YES, we constantly have energy
YES, they provide energy in a timely manner
YES, there are no problems with electricity
YES, limit became higher
YES, we receive more energy
YES, during summer period we are provided with
YES, problems are solved swiftly
Diagram 22 Are you satisYied with power supply services?
23
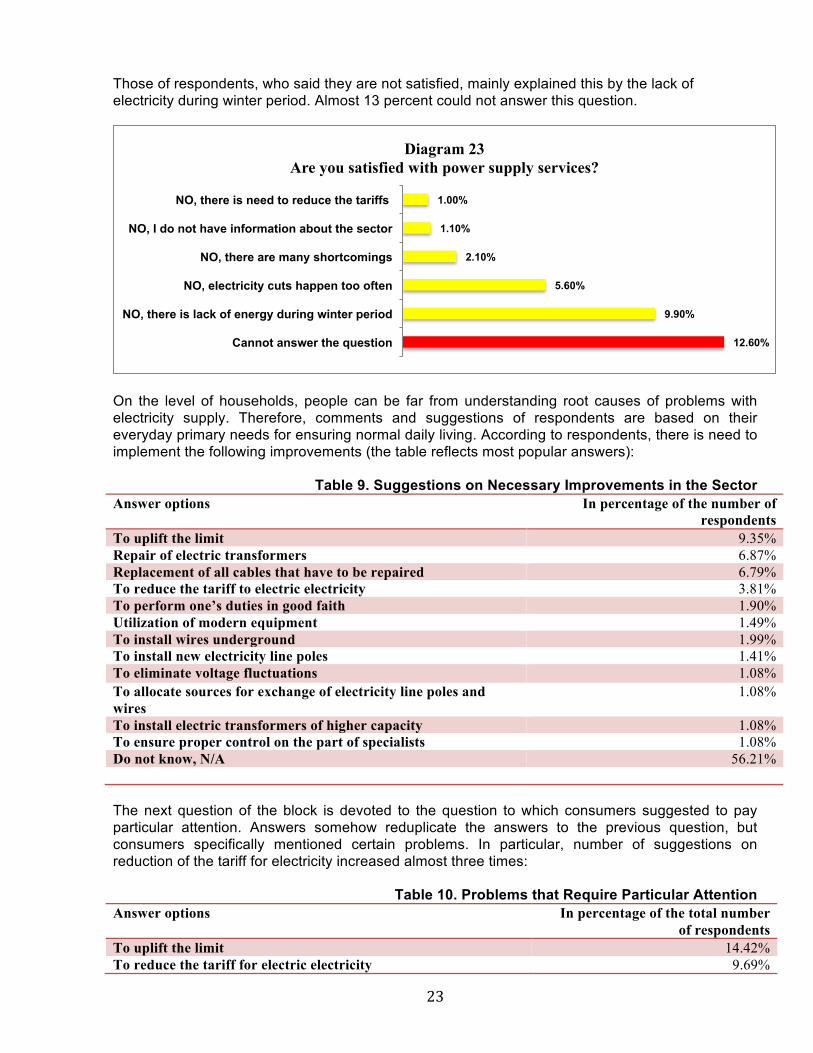
Those of respondents, who said they are not satisfied, mainly explained this by the lack of electricity during winter period. Almost 13 percent could not answer this question.
On the level of households, people can be far from understanding root causes of problems with electricity supply. Therefore, comments and suggestions of respondents are based on their everyday primary needs for ensuring normal daily living. According to respondents, there is need to implement the following improvements (the table reflects most popular answers):
Table 9. Suggestions on Necessary Improvements in the Sector Answer options In percentage of the number of
respondents To uplift the limit 9.35% Repair of electric transformers 6.87% Replacement of all cables that have to be repaired 6.79% To reduce the tariff to electric electricity 3.81% To perform one’s duties in good faith 1.90% Utilization of modern equipment 1.49% To install wires underground 1.99% To install new electricity line poles 1.41% To eliminate voltage fluctuations 1.08% To allocate sources for exchange of electricity line poles and wires
1.08%
To install electric transformers of higher capacity 1.08% To ensure proper control on the part of specialists 1.08% Do not know, N/A 56.21% The next question of the block is devoted to the question to which consumers suggested to pay particular attention. Answers somehow reduplicate the answers to the previous question, but consumers specifically mentioned certain problems. In particular, number of suggestions on reduction of the tariff for electricity increased almost three times:
Table 10. Problems that Require Particular Attention Answer options In percentage of the total number
of respondents To uplift the limit 14.42% To reduce the tariff for electric electricity 9.69%
12.60%
9.90%
5.60%
2.10%
1.10%
1.00%
Cannot answer the question
NO, there is lack of energy during winter period
NO, electricity cuts happen too often
NO, there are many shortcomings
NO, I do not have information about the sector
NO, there is need to reduce the tariffs
Diagram 23 Are you satisfied with power supply services?
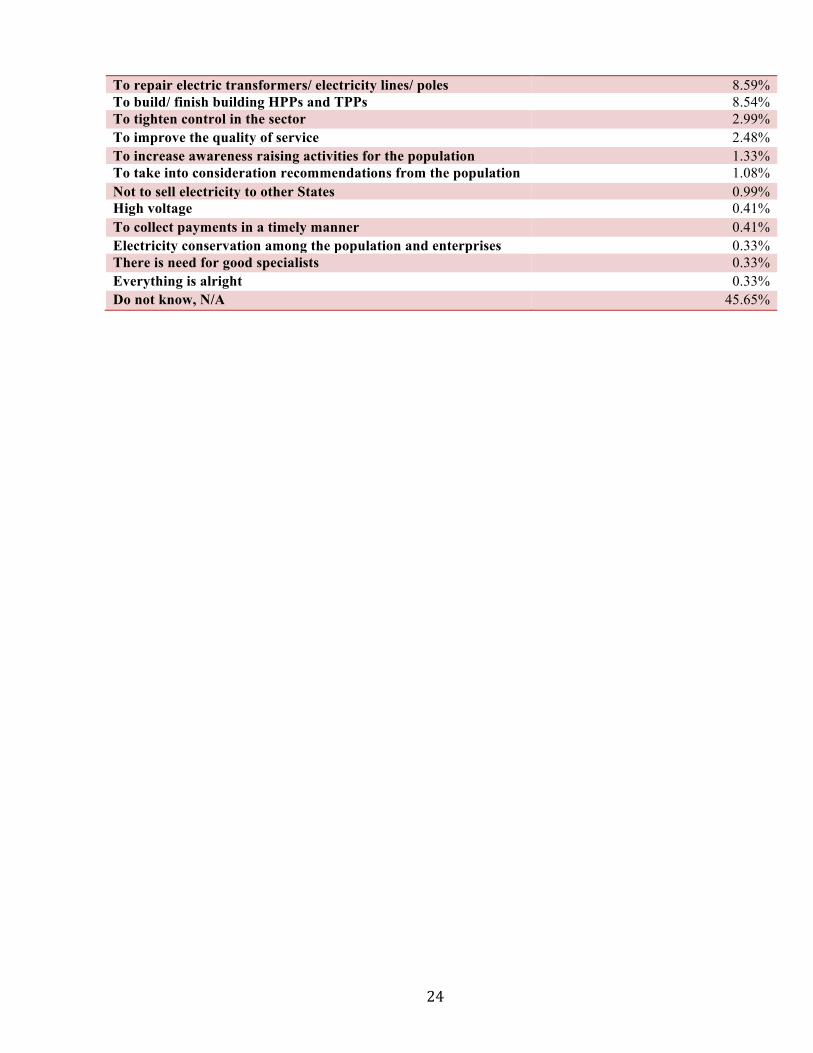
24
To repair electric transformers/ electricity lines/ poles 8.59% To build/ finish building HPPs and TPPs 8.54% To tighten control in the sector 2.99% To improve the quality of service 2.48% To increase awareness raising activities for the population 1.33% To take into consideration recommendations from the population 1.08% Not to sell electricity to other States 0.99% High voltage 0.41% To collect payments in a timely manner 0.41% Electricity conservation among the population and enterprises 0.33% There is need for good specialists 0.33% Everything is alright 0.33% Do not know, N/A 45.65%